the Creative Commons Attribution 4.0 License.
the Creative Commons Attribution 4.0 License.
 | 11 Nov 2020
Rapid evolution of aerosol particles and their optical properties downwind of wildfires in the western US
Arthur J. Sedlacek III
Kouji Adachi
Peter R. Buseck
Sonya Collier
Manvendra K. Dubey
Anna L. Hodshire
Ernie Lewis
Timothy B. Onasch
Jeffery R. Pierce
John Shilling
Stephen R. Springston
Jian Wang
Shan Zhou
Robert J. Yokelson
During the first phase of the Biomass Burn Operational Project (BBOP) field campaign, conducted in the Pacific Northwest, the DOE G-1 aircraft was used to follow the time evolution of wildfire smoke from near the point of emission to locations 2–3.5 h downwind. In nine flights we made repeated transects of wildfire plumes at varying downwind distances and could thereby follow the plume's time evolution. On average there was little change in dilution-normalized aerosol mass concentration as a function of downwind distance. This consistency hides a dynamic system in which primary aerosol particles are evaporating and secondary ones condensing. Organic aerosol is oxidized as a result. On all transects more than 90 % of aerosol is organic. In freshly emitted smoke aerosol, is approximately equivalent to NO3. After 2 h of daytime aging, increased and is approximately equivalent to the sum of Cl, , and NO3. Particle size increased with downwind distance, causing particles to be more efficient scatters. Averaged over nine flights, mass scattering efficiency (MSE) increased in ∼ 2 h by 56 % and doubled in one flight. Mechanisms for redistributing mass from small to large particles are discussed. Coagulation is effective at moving aerosol from the Aitken to accumulation modes but yields only a minor increase in MSE. As absorption remained nearly constant with age, the time evolution of single scatter albedo was controlled by age-dependent scattering. Near-fire aerosol had a single scatter albedo (SSA) of 0.8–0.9. After 1 to 2 h of aging SSAs were typically 0.9 and greater. Assuming global-average surface and atmospheric conditions, the observed age dependence in SSA would change the direct radiative effect of a wildfire plume from near zero near the fire to a cooling effect downwind.
- Article
(20275 KB) - Full-text XML
-
Supplement
(1498 KB) - BibTeX
- EndNote


Aerosols from wildfires alter Earth's radiation balance by their direct interaction with sunlight and by indirect effects mediated through perturbations on clouds and precipitation. In the direct effect, heating is the result of light absorption by black carbon (BC), brown carbon (BrC) – including tar balls –, and dust. Cooling occurs when aerosol particles scatter light upwards so that sunlight that would otherwise be absorbed by Earth or within the atmosphere escapes to space. The transition between heating and cooling depends on intrinsic aerosol properties such as aerosol single scatter albedo (SSA is light scattering/light extinction) and extrinsic factors, including surface albedo, solar zenith angle, and cloud cover (Chylek and Wong, 1995; Nemesure et al., 1995; McComiskey et al., 2008).
On a global basis, wildfire aerosols are estimated to have a net direct radiative effect of 0.17 W m−2, 1-σ uncertainty W m−2 (Bond et al., 2013). The rapid evolution of aerosol optical properties of fresh smoke contributes to the radiative effect uncertainty (Yokelson et al., 2009; Akagi et al., 2012; May et al., 2015; Vakkari et al., 2014; Selimovic et al., 2019). In this study we are concerned with changes in wildfire optical properties that occur in the near field, extending from the time it takes a smoke plume to rise to aircraft-sampling altitude to circa 3 h downwind. These first hours are a dynamic period as the plume's initial store of reactive VOCs and NOx is largely intact and can generate secondary low-volatility species or species with light-absorbing functional groups. Aerosol particles respond to dilution and to gas- and condensed-phase chemical reactions. Particle size and composition change, altering optical properties. Radiative effects are generally expected to follow trends in optical parameters, though there is no simple one-to-one correspondence.
Fuel type and burn conditions vary from region to region, causing wildfire aerosol to have varied properties (Akagi et al., 2011; Andreae, 2019). Tropical regions have received attention because of the amount of burning and for the practical reason that there is often large-scale burning during a predictable dry season. Temperate regions, in particular within the United States, have until recently received less attention because locations and times of wildfires are less predictable. One focus of biomass burning (BB) studies has been the evolution of organic aerosol downwind of wildfires and prescribed burns, summaries of which are given by Garofalo et al. (2019) and Hodshire et al. (2019a). A comparison of smoke plumes near fires with those several hours downwind indicates that organic aerosol (normalized by CO to account for plume dispersion) varies from fire to fire, but on average there is little change in normalized aerosol mass during the first several hours of transport. Increases, when observed, have had maximum values near a factor of 2 (Yokelson et al., 2009), much smaller than seen in urban areas (e.g., Weber et al., 2007; Kleinman et al., 2008). More typical were fires observed in the WE-CAN campaign in which normalized aerosol concentrations were near constant (Garofalo et al., 2019). Laboratory and field measurements of organic aerosol species indicative of oxidation state and volatility show that composition changes with time and that the net change in organic aerosol is affected by loss due to evaporation and gain due to condensation of secondary organic species (May et al., 2013, 2015; Morgan et al., 2020). Although no fundamental reasons are known why evaporation and condensation have comparable magnitude, the aircraft measurements from WE-CAN and other studies, including the Biomass Burning Operational Project (BBOP) field campaign presented here, find that such cancellation can indeed occur.
Changes in aerosol size distribution with age occur downwind of wildfires and prescribed burns (e.g., Janhäll et al., 2010; Laing et al., 2016). Ultrafine particles (Dp = 3 to 10 nm diameter) are prevalent near fires and rapidly removed by coagulation (Carrico et al., 2016; Sakamoto et al., 2016). Evaporation of volatile species reduces particle size, whilst coagulation and condensation of lower-volatility species results in particle growth. Coincident with this mass transfer are chemical reactions in the gas and aerosol phases which, at least initially, proceed in the direction of creating less volatile, more oxidized species. Even though normalized aerosol mass concentrations may not change significantly with age, mass can be transferred between different size particles through coagulation and particle-vapor mass transfer. Our interest in evolving size distributions is motivated by the dependence of light scattering on aerosol size. Optically relevant BB aerosol typically have diameters between 100 nm and several hundred nm, a size range over which light scattering per unit mass of aerosol (MSE: mass scattering efficiency) varies several fold.
The first phase of the BBOP (Kleinman and Sedlacek, 2016) field campaign was conducted in the temperate Pacific Northwest. Twenty-one research flights were conducted between July and September 2013. Primary targets were (i) wildfires in which the time evolution of aerosols and trace gases could be determined from measurements at multiple distances between the fire and locations several hours (smoke physical age) downwind and (ii) overflights of a ground site at Mount Bachelor Observatory (MBO) in Oregon and areas upwind at times when MBO was impacted by wildfire smoke (Collier et al., 2016; Zhou et al., 2017; Zhang et al., 2018). One MBO flight coincided with a SEAC4RS flight (Liu et al., 2017). In the second phase of BBOP, during October 2013, agricultural burns in the lower Mississippi Valley were sampled. In both phases of BBOP, TEM samples were analyzed for tar balls (TBs) as reported by Sedlacek et al. (2018a) and Adachi et al. (2018, 2019).
In this study we use data from five wildfires that were collected during nine flights. Pseudo-Lagrangian sampling allows us to determine the rate of change in aerosol, gaseous, and optical quantities as a function of transport time or photochemical age. Extensive variables are normalized to CO to account for dilution. We use the negative logarithm of the ratio of NOx to NOy (−Log10 (NOx∕NOy)) as a metric for photochemical processing. Of primary interest are time-dependent changes in the concentration of sub-micrometer diameter aerosol, mass scattering efficiency (MSE), and mass absorption coefficient (MAC). The latter two quantities yield a local determination of SSA. Though there was only a small effect of aging upon total aerosol mass concentration, within a couple of hours there were (i) changes in the concentrations of inorganic species and in organic speciation as judged by atomic ratios and mass peaks at m∕z = 43, 44, and 60 and (ii) a significant increase in scattering and MSE causing plumes to transition from a near-neutral radiative forcing to one that is cooling. Because observed size distributions were limited to Dp < 210 or 260 nm and most scattering is from larger particles, we cannot (without extrapolating the size data) calculate MSE for comparison with the observed ratio of scattering to aerosol mass. Instead, we have determined the diameter within the accumulation mode where the number size distribution has a peak and, using that diameter as a metric for particle size, we show that MSE is positively correlated with particle size and negatively correlated with backscatter ratio (total scattering/scattering into the rear hemisphere) and scattering Ångström exponent. These correlations between MSE and particle size and between MSE and scattering properties give support to the hypothesis that MSE increases with age because of processes that shift particle mass from small diameters to the large diameters where scattering is more efficient.
In the first phase of BBOP the DOE G-1 aircraft sampled wildfire plumes in the temperate forests and range lands of the western US, focusing on time evolution from near a fire to a few hours transport time downwind. An enhanced suite of instruments at MBO, Oregon, provided a continuous record of BB plume properties. In coordinated flights the G-1 sampled plumes that later impacted MBO (Collier et al., 2016; Zhou et al., 2017) and one flight in southern Oregon coordinated with the SEAC4RS DC8 (Liu et al., 2017).
An extended deployment, 7 June 2013–13 September 2013, was made possible by basing the G-1 at the home of the ARM Aerial Facility (Schmid et al., 2014) in Pasco, WA. The choice of Pasco as a center of operations was justified by examining alternate sites covering most of the US western forest fire region. For each location, the frequency of fires was determined based on daily emissions of CO2, CO, NMHC, and PM2.5 from MODIS fire products and the FINNv1 (FIre INventory from NCAR) emission inventory (Wiedinmyer et al., 2011). Annual variability was estimated from 10 years of data. Fire counts and emissions were summed over the G-1's 500 km operational range from the candidate sites.
2.1 Instruments
Schmid et al. (2014) review the G-1 aircraft and the instrument suite provided and maintained by the ARM Aircraft Facility. The following discussion and the list in Table 1 are restricted to instruments used in the present study. The G-1 instruments used in BBOP are also summarized by Liu et al. (2016).
Table 1Aerosol and trace-gas instruments on G-1 used in this study.
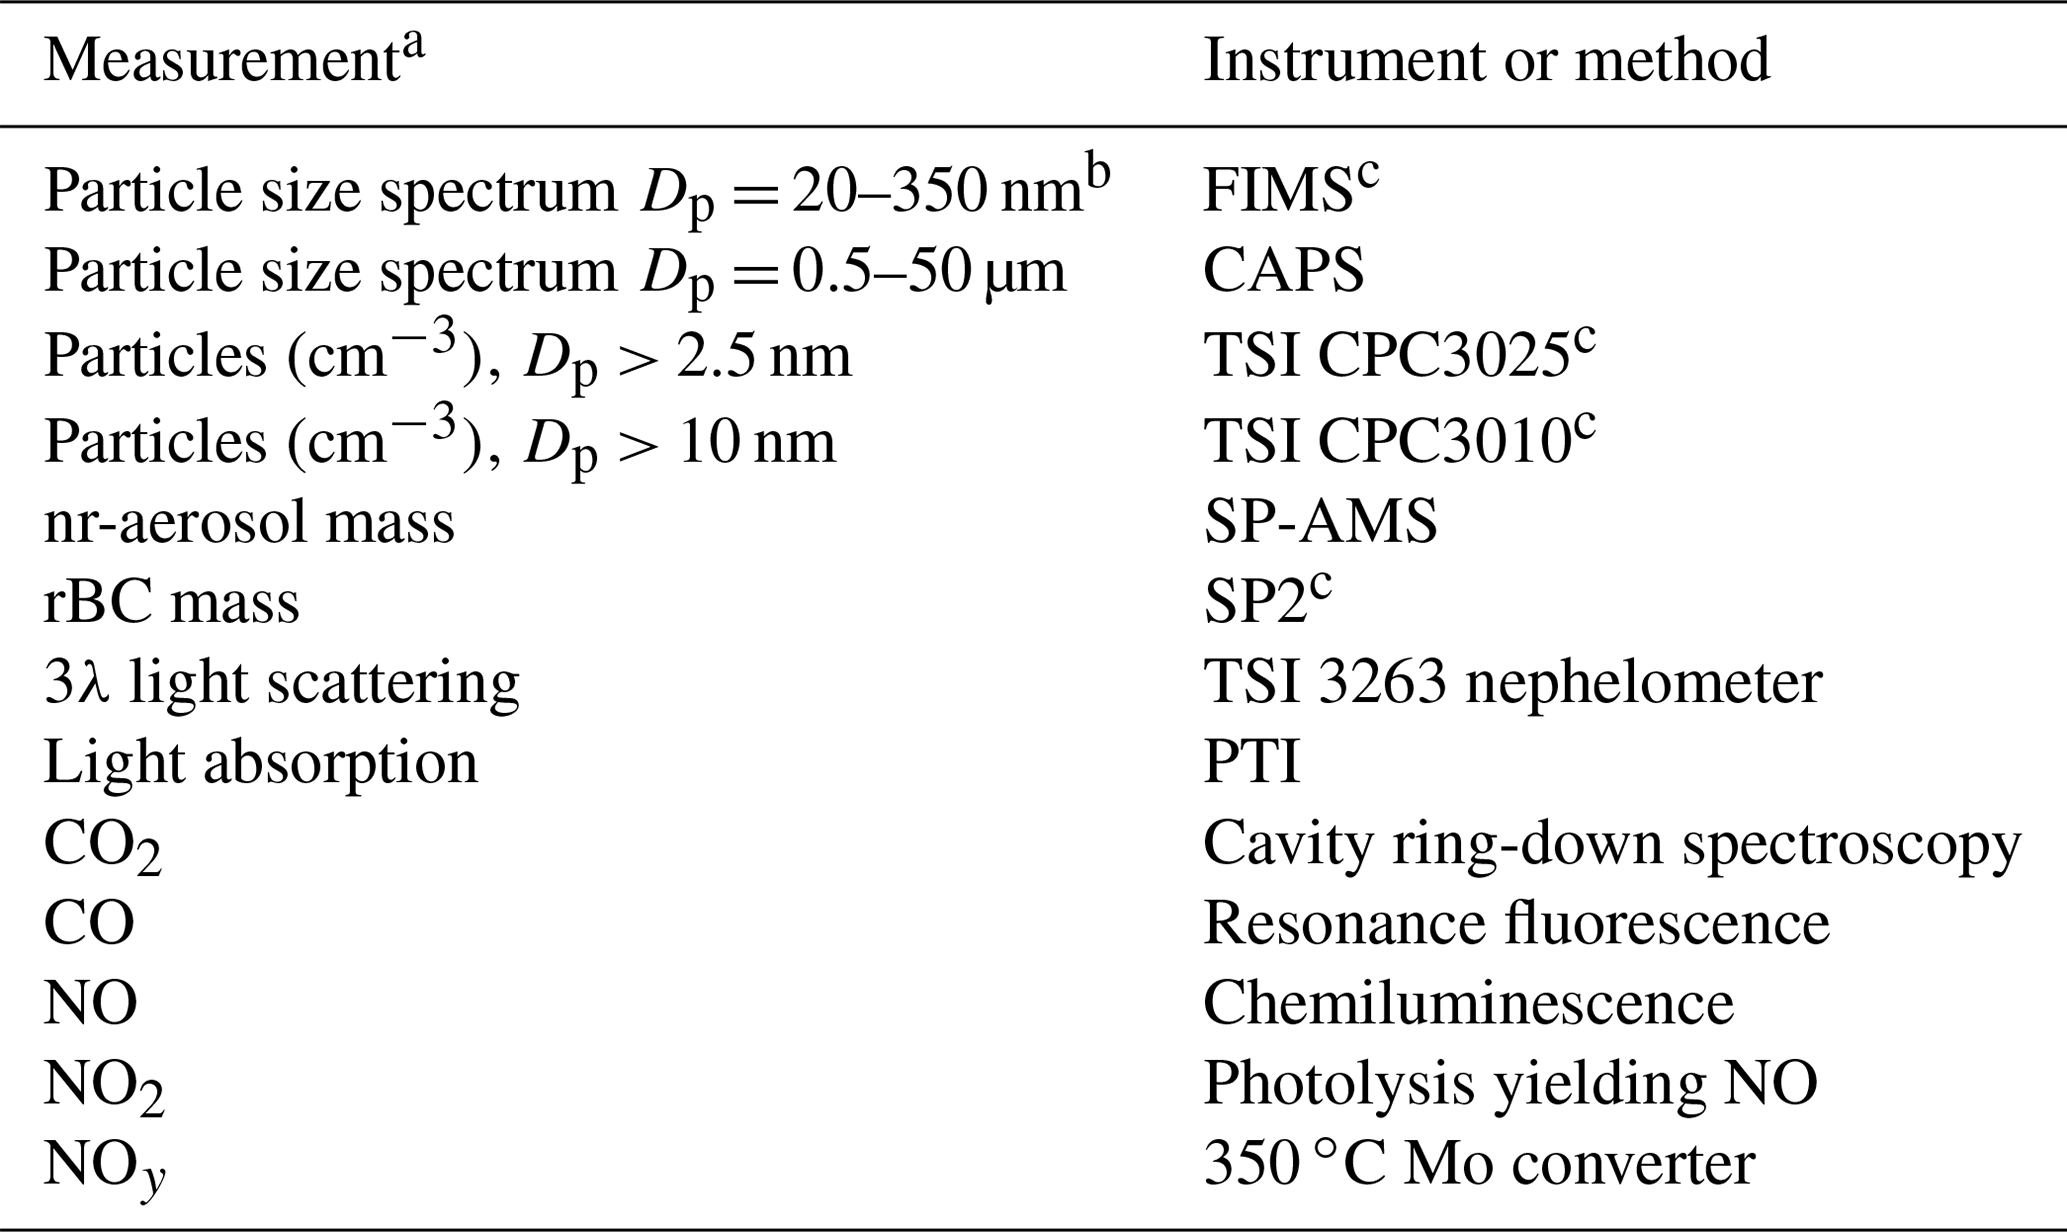
a Particle size spectra were also measured by UHSAS and PCASP particle probes mounted on wing pylons. Data from these probes were not used because of severe coincidence problems. b Upper size limit during plume sampling is 210 nm for flights 809a and 822a and 260 nm for flights 25a, 726a, 730a, 730b, 814a, and 822b. c Instrument sampled from dilution line.
2.1.1 SP-AMS
The BBOP field campaign was among the first aerial deployments of the Soot Particle Aerosol Mass Spectrometer (SP-AMS). For an overview of the SP-AMS, see Onasch et al. (2012). In brief, the SP-AMS is a high-resolution time-of-flight aerosol mass spectrometer (HR-tof-AMS) to which a high-power continuous-wave (CW) YAG laser is added for vaporizing light-absorbing refractory aerosol such as BC. The SP-AMS can be operated in laser-off or laser-on modes. With the YAG laser off, non-refractory (nr) particles are vaporized by impacting a heated target, typically at 600 ∘C; performance characteristics such as collection efficiency (CE) and fragmentation patterns are identical to an HR-tof-AMS. In laser-on mode, strongly absorbing aerosol components such as BC are vaporized before encountering the heated target. Non-absorbing species that coat BC particles are vaporized by heat transfer, as happens in an SP2 (Schwarz et al., 2006). Brown carbon (BrC), so-called because of its short-wavelength absorption, does not absorb the 1064 nm YAG laser unless there is a long-wavelength absorption tail. The thermal vaporizer was left on when operating in laser-on mode, thereby allowing nr-aerosol to be quantified but at the expense of not being able to selectively detect the coating on BC particles.
The SP-AMS and constant pressure inlet were operated as described by Collier et al. (2016). One Hz data were acquired in “Fast-MS” V-mode. Instrument backgrounds were determined by alternating between 52 s of signal collection and 8 s with the aerosol beam blocked. Most SP-AMS data were acquired in laser-on mode. In order to investigate sampling strategies, we sometimes alternated between laser-on and laser-off operation, either minute by minute or for repeated plume crossings. The collection efficiency of the SP-AMS during laser-off operation was determined to be 0.5 via comparisons between aerosol mass concentrations measured on the G-1 with similar measurements at MBO during overflights (see Fig. S2 of Collier et al., 2016). In each case we normalized non-refractory aerosol concentration to CO to account for changes in plume dilution between transects. The average ratio for 16 transects, laser-on to laser-off, was 1.52. This procedure yielded a laser-on CE of 0.76 with a standard deviation of 0.07.
We assume, as done implicitly in other studies, that TBs contribute towards total non-refractory organics with the same detection efficiency as other organic aerosols. This assumption needs to be tested for ambient aerosol of the types observed in BBOP, especially since TBs were observed to have a mass fraction of 25 %–40 % of PM1 in aged smoke (Sedlacek et al., 2018a). As a first step, the thermal stability of TBs was investigated by electron microscopy of BBOP samples affixed to a heating stage in which the temperature was ramped up over 10 min to the 600 ∘C temperature of the SP-AMS thermal vaporizer (Adachi et al., 2018). At 600 ∘C, 30 % of the TB mass collected on TEM grids was not vaporized. If the results of these slow-heating experiments are applicable to the thermal flash vaporization occurring in an AMS, a fraction of nominal nr-organic mass is not vaporized and therefore not detected. We estimate this fraction as being of order 10 % (25 %–40 % mass fraction TB ×30 % not evaporated in TEM experiments). Evidence to the contrary, namely, that TBs are detected with the same efficiency as other organic aerosol by an AMS, is that TBs have the correct magnitude and volatility (up to 200 ∘C) to coincide with BBOA-3, a low-volatility PMF factor of BB smoke sampled at MBO by Zhou et al. (2017).
Sedlacek et al. (2018b) and Corbin and Gysel-Beer (2019) showed that, depending on laser power, TBs can be charred by an SP2 YAG laser identical to that used in the SP-AMS. The charred residue has the potential to be detected as BC in a SP-AMS. BC mass concentrations in aged, temperate wildfire plumes were observed to be an order of magnitude less than TBs (Sedlacek et al., 2018a), and therefore BC concentrations are susceptible to large errors if even a small fraction of TB mass is misidentified as BC. In this study we use BC concentrations as observed by an SP2. In keeping with the nomenclature of the SP2 community, the light-absorbing, incandescing species measured by the SP2 will be referred to as rBC.
In recent measurements at the USDA Fire Sciences Laboratory, Lim et al. (2019) used an AMS to analyze BB-generated aerosols soon after emission and then again after exposure to oxidants in a chamber simulating up to several days of photochemical aging. The AMS CE was determined by comparison with SMPS measurements of aerosol size distribution, integrated to give a total volume. The AMS CE was 0.54 for fresh emissions, decreasing to 0.40 for multi-day aged aerosol. This decrease correlated with a decrease in aerosol volatility as measured by a thermodenuder. Aged particles were interpreted as being more viscous and more likely to bounce off the AMS oven and thereby escape detection. If we assume the change in CE found by Lim et al. (2019), our assumption of a constant CE result is a 35 % underestimate for the change in aerosol mass concentrations in aged air relative to fresh emissions.
Plume observations in BBOP covered a maximum aging time of 3.5 h. During aging we find, as have others (e.g., DeCarlo et al., 2010; Heald et al., 2010; Ng et al., 2011), an increase in the aerosol O-to-C ratio (O:C), a compositional change that has been observed to be correlated with increased viscosity. This change in viscosity in aged smoke is consistent with the conclusion of Sedlacek et al. (2018a) that high-viscosity tar balls, found only after aging, are processed primary particles. The dependence of CE on O:C has been determined for laboratory biomass burns by Timothy B. Onasch (personal communication, 24 April 2019). Combined with the O:C changes found in BBOP (presented below), we obtain an estimate that aged BBOP plumes can contain up to 15 % less aerosol mass than measured based on a fixed CE. We have not incorporated an age-dependent CE into our calculations. It is likely to be small for the range of aging that we cover, and to the best of our knowledge AMS observations of ambient biomass burn plumes have not shown systematic changes in CE.
2.1.2 SP2
A Single Particle Soot Photometer (SP2; Revision D, Droplet Measurement Technology) was used to measure the number concentration and size distribution of refractory particles. Aerosol particles are subjected to high-intensity CW 1064 nm light from a YAG laser, heating particles that absorb at this wavelength to the point of incandescence. Color temperature of the incandescence is used to discriminate between BC and other absorbers such as mineral dust. The size distribution of rBC particles with volume-equivalent diameters between ∼80 and 500 nm was determined based on a rBC density of 1.8 g cm−3. Fullerene soot (Alfa Aesar; stock no. 40971: lot no. L18U002) was used for calibration.
2.1.3 FIMS
Aerosol size data used in this study are from the FIMS (Fast Integrated Mobility Spectrometer) (Olfert et al., 2008; Wang et al., 2017), designed to provide information similar to an SMPS. Because the FIMS measures particles of different sizes simultaneously instead of sequentially as in a traditional SMPS, it provides aerosol size spectra with high time resolution (i.e., a size spectrum is acquired in 1 s vs. 60 s for the SMPS). The minimum size particle classified had a diameter of 20 nm. The classifying voltage in the FIMS is reduced at high altitude to prevent arcing. At the altitudes where plumes were sampled (typically 2500–3000 m above mean sea level (m.s.l.), the upper size limit of the FIMS deployed during BBOP was limited to 210 or 260 nm as a result of the reduced classifying voltage. The FIMS size range usually encompassed the peak of the particle number size distribution, dN/dLogDp. FIMS data near the peak in dN/dLogDp (restricted to the accumulation mode, between 100 and 260 nm) were used to estimate the diameter (between bin boundaries) at which the peak occurs. We use this derived diameter as a surrogate for the geometric mean diameter, DGEO, of the accumulation mode.
2.1.4 Scattering
Aerosol scattering and backscatter ratio were determined from a three-wavelength (450, 550, 700 nm) TSI 3563 nephelometer. Unless otherwise noted, scattering will refer to measurements at 550 nm. Flow rate and internal volume limited response time to 2 s. In the G-1 data set, corrections for the deviation of the instrument from a cosine response and the smaller correction for not detecting photons scattered into a 7 ∘ forward and 10 ∘ backward cone were applied using the sub-micrometer formulas from Anderson and Ogren (1998). Size spectra up to 50 µm were determined from a Cloud, Aerosol, and Precipitation Spectrometer (CAPS) probe mounted outside the fuselage. The default CAPS diameter bins for liquid water were mapped onto bins corresponding to a refractive index of 1.55, as appropriate for an organic-dominated aerosol. According to Mie calculations, supra-micrometer particles (1 µm < Dp < 5 µm) contributed only a couple of percent to total scattering. Nephelometer measurements were therefore interpreted as being due to sub-micrometer particles. Given the measured aerosol composition, we assume that particles are spherical and that changes in scattering with respect to plume transport time were not due to a change in particle shape.
2.1.5 Light absorption
Aerosol light absorption at 532 nm was measured with a Photothermal Interferometer (PTI; Sedlacek and Lee, 2007). This instrument relies on an interferometer to detect a change in optical path length caused by aerosol light absorption and subsequent degradation of absorbed energy into heat. As such the PTI is not susceptible to filter-based artifacts affecting the PSAP and similar devices (Lack et al., 2008). For the calculation of SSA we assume that absorption varies as 1∕λ, as is approximately correct for BC. PTI measurements are thereby decreased by 3 % in order to adjust absorption measurements to 550 nm, the wavelength at which scattering data are available. Based on the 3−λ PSAP, it is likely that there is some BrC absorption at this wavelength, but in view of the smallness of the adjustment, it is neglected.
2.1.6 Trace gases
NO, NO2, and NOy were measured in a three-channel chemiluminescence instrument (Air Quality Design, Golden, CO). Ambient NO was measured in the first channel with a small delay volume to give simultaneity with the NO2 channel. NO2 conversion occurs in a low-pressure cell with LED irradiation at 390 nm. Conversion efficiency for NO2 was measured to be 0.50±0.03. NOy (defined as odd-nitrogen species including aerosol nitrate) was measured via a Mo converter heated to 350 ∘C located externally on a pylon affixed to a window blank. Conversion efficiency for NO2 was 0.98±0.02, and earlier tests have shown similar efficiencies for HNO3 and organic nitrates (Williams et al., 1998).
CO, N2O, and H2O were measured with a commercial analyzer (Los Gatos Research, San Jose, CA) based on off-axis integrated cavity output spectroscopy (OA-ICOS). Standard additions were performed in flight and confirmed an accuracy of 1 %–2 %. Precision at ambient backgrounds of 90 ppb CO was ∼0.5 ppbv RMS at 1 s averaging (the internal volume of the instrument limited actual resolution to ∼ 7–10 s). CO2 was measured with a Picarro G1301-m cavity ring-down spectrometer. Standard additions were performed in flight. Measurements of excess CO2 in plumes were typically limited by the natural variability in background CO2.
2.1.7 Coincidence, flow control, and dilution system
It was anticipated that aerosol number concentrations close to wildfires would exceed the coincidence thresholds of several particle-resolved instruments (Table 1). At threshold, a specified small percentage (e.g., 10 %) of aerosol particles cannot be distinguished one from the next, resulting in missed counts or particles sorted into incorrect size bins. To mitigate coincidence errors, zero air from a cylinder was used to dilute ambient air in a ratio that was as high as 10 to 1. Dilution rates were changed in-flight to maintain a high instrument sensitivity in clean air. CPC data were corrected for coincidence.
2.2 Data
Concentrations and optical measurements are reported at STP, 0 ∘C, and 1 atm pressure. Particle sizes are diameters. For each instrument and each flight, 1 Hz data were time shifted to maximize the correlation with light scattering, a time standard selected because of its availability on all flights and because it exhibits high correlations with most other quantities. Time shifts account for instruments sampling the same air parcel at different times. At a sampling speed of 100 m s−1, kilometer-scale plumes appear in the data record as rapidly changing signals. Time shifts of 1–2 s are readily apparent as a degradation in correlation when comparing instruments. Maximizing correlations, however, does not accurately compensate for varying response times. Insofar as possible, we rely on average values across a plume, which are relatively insensitive to time response.
Except as noted, aerosol concentrations are the mass of non-refractory components as measured by the SP-AMS and are referred to as nr-PM1. Units are µg/m3 at STP. By presenting nr-PM1, we do not limit the aerosol concentration measurements by the requirement that the SP2 was also acquiring data at the same time. Mass differences between non-refractory and total aerosol are ∼0.5 %–2.5 %. References to aerosol number concentration (particles/cm3 at STP) will be explicit to distinguish it from aerosol mass.
Flights are identified by month (m), day (d), and an “a” or “b” for the first or second flight of a day; e.g., 821b was the second flight on 21 August 2013. All times are UTC. Local time was Pacific daylight savings and is given by UTC – 08:00. Local noon over our sampling region on 1 August ranged from 19:43 UTC in the east to 20:15 UTC in the west. Data from the BBOP field campaign have been archived at https://www.arm.gov/research/campaigns/aaf2013bbop (last access: 19 March 2019).
2.3 Flights and wildfires
Figure 1 is a composite ground track for the 21 BBOP research flights conducted in the Pacific Northwest. A synopsis of these flights is given in Table 2. Smoke from nearby biomass burns (BBs) was observed on 18 flights: 17 from wildfires and 1 from a prescribed agricultural burn. On three BB flights, measurements were made upwind and over a surface site at MBO (Collier et al., 2016; Zhou, 2017; Zhang et al., 2018). Four flights were devoted to observing urban plumes from Portland, Seattle, and Spokane. Tar ball studies based on BBOP data make use of all Pacific Northwest flights as well as 11 flights from the second phase of BBOP in which agricultural burns in the lower Mississippi River Valley were sampled. In situ observations of the Government Flats fire complex were compared to nearly coincident MISR retrievals (Noyes et al., 2020).
Table 2Synopsis of BBOP research flights in the Pacific Northwest.
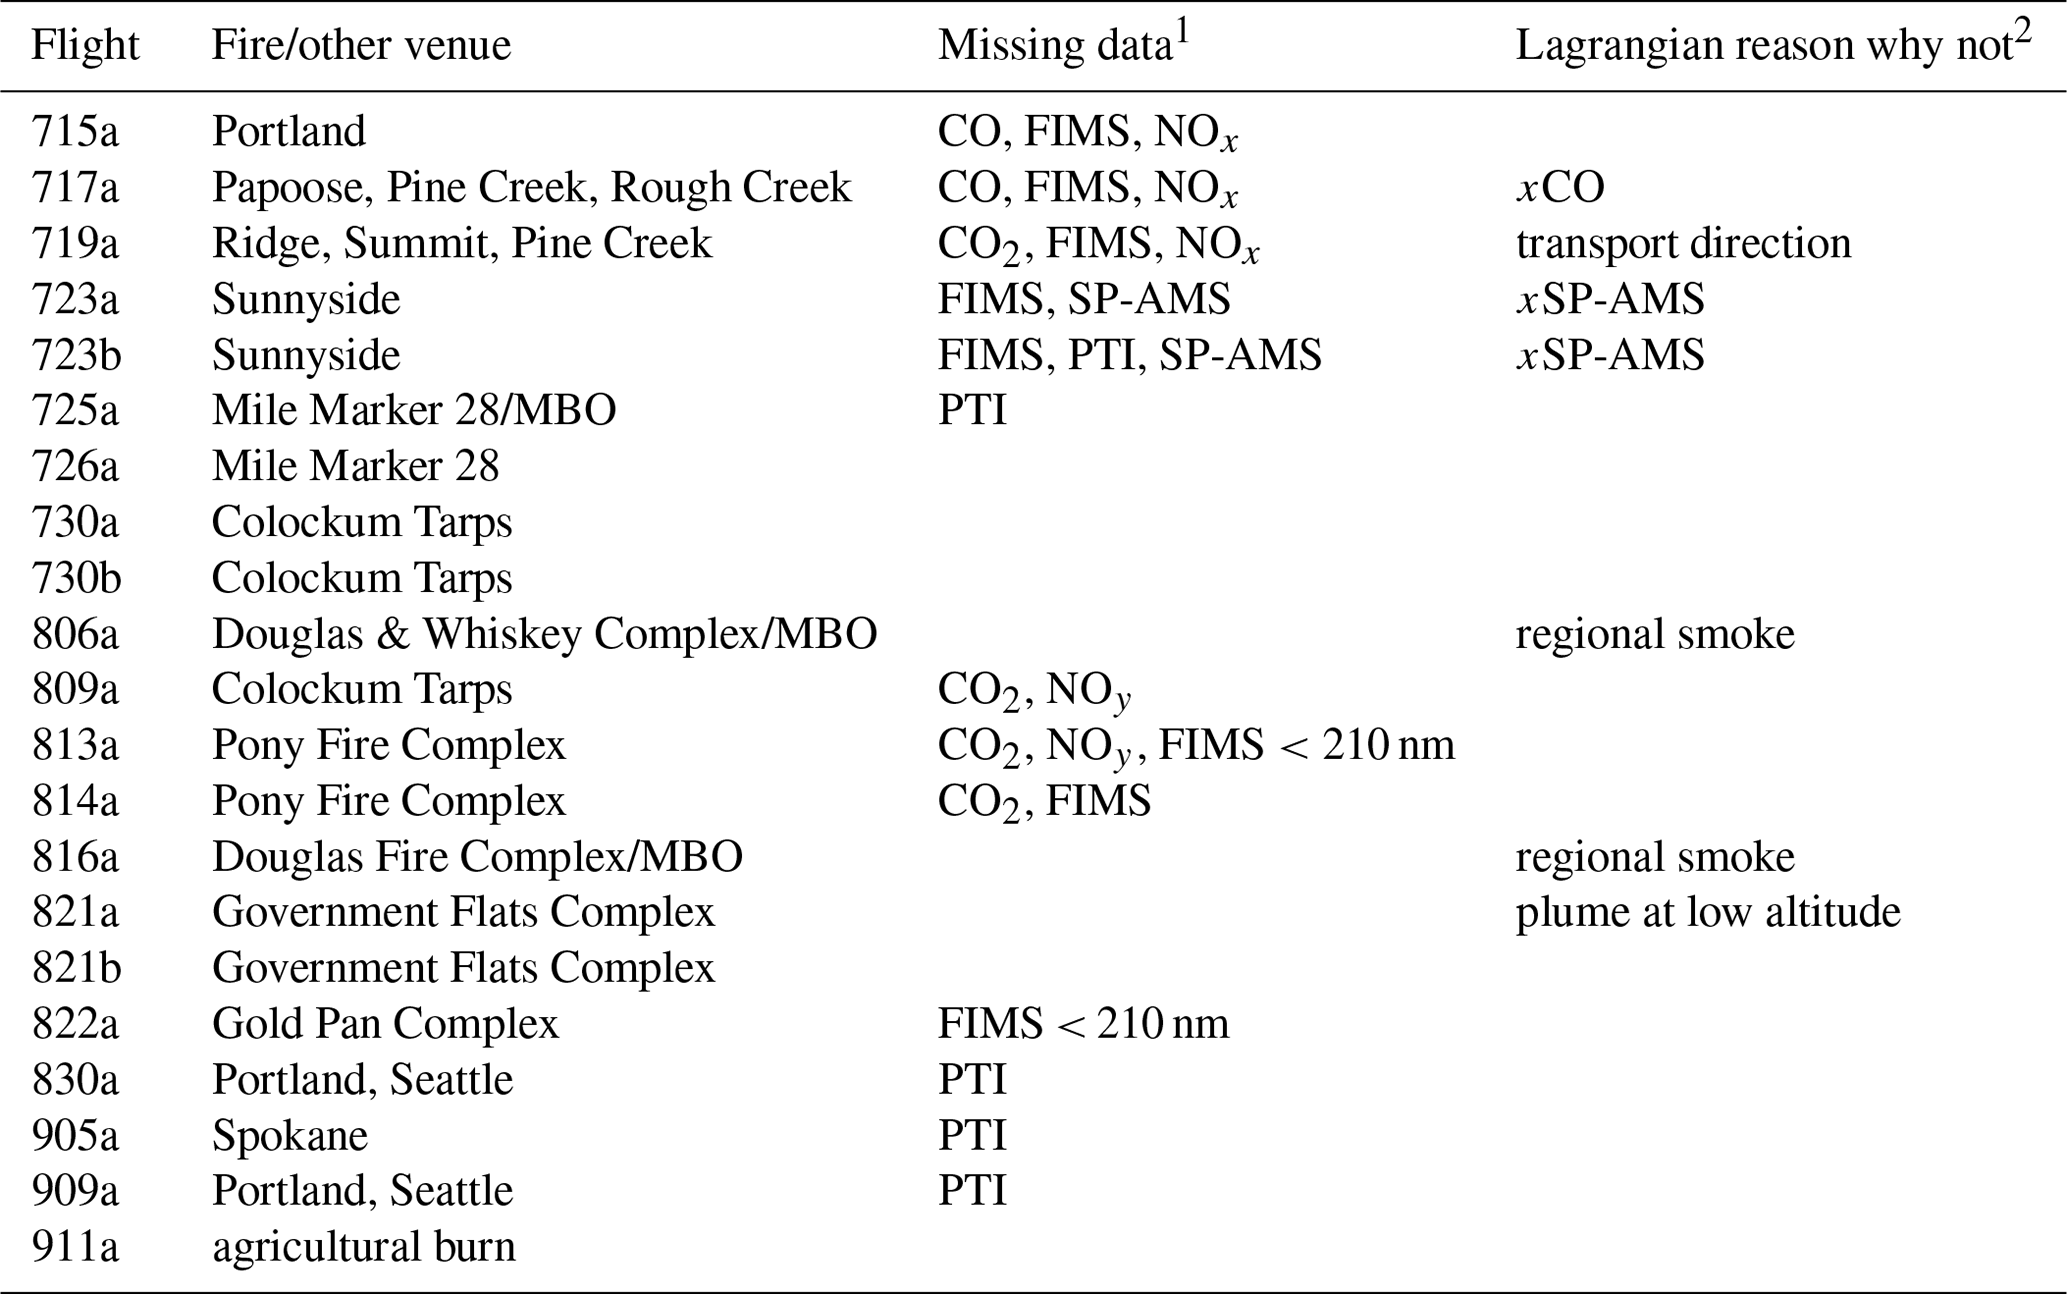
FIMS size range for plume sampling was 20–210 nm for flights 813a and 822a: 20–260 nm for flights 725a, 726a, 730a, 730b, 809a, and 821b. 1 Only refers to instruments used in this study. 2 Excludes urban plumes and agricultural burn. x indicates a key measurement is missing
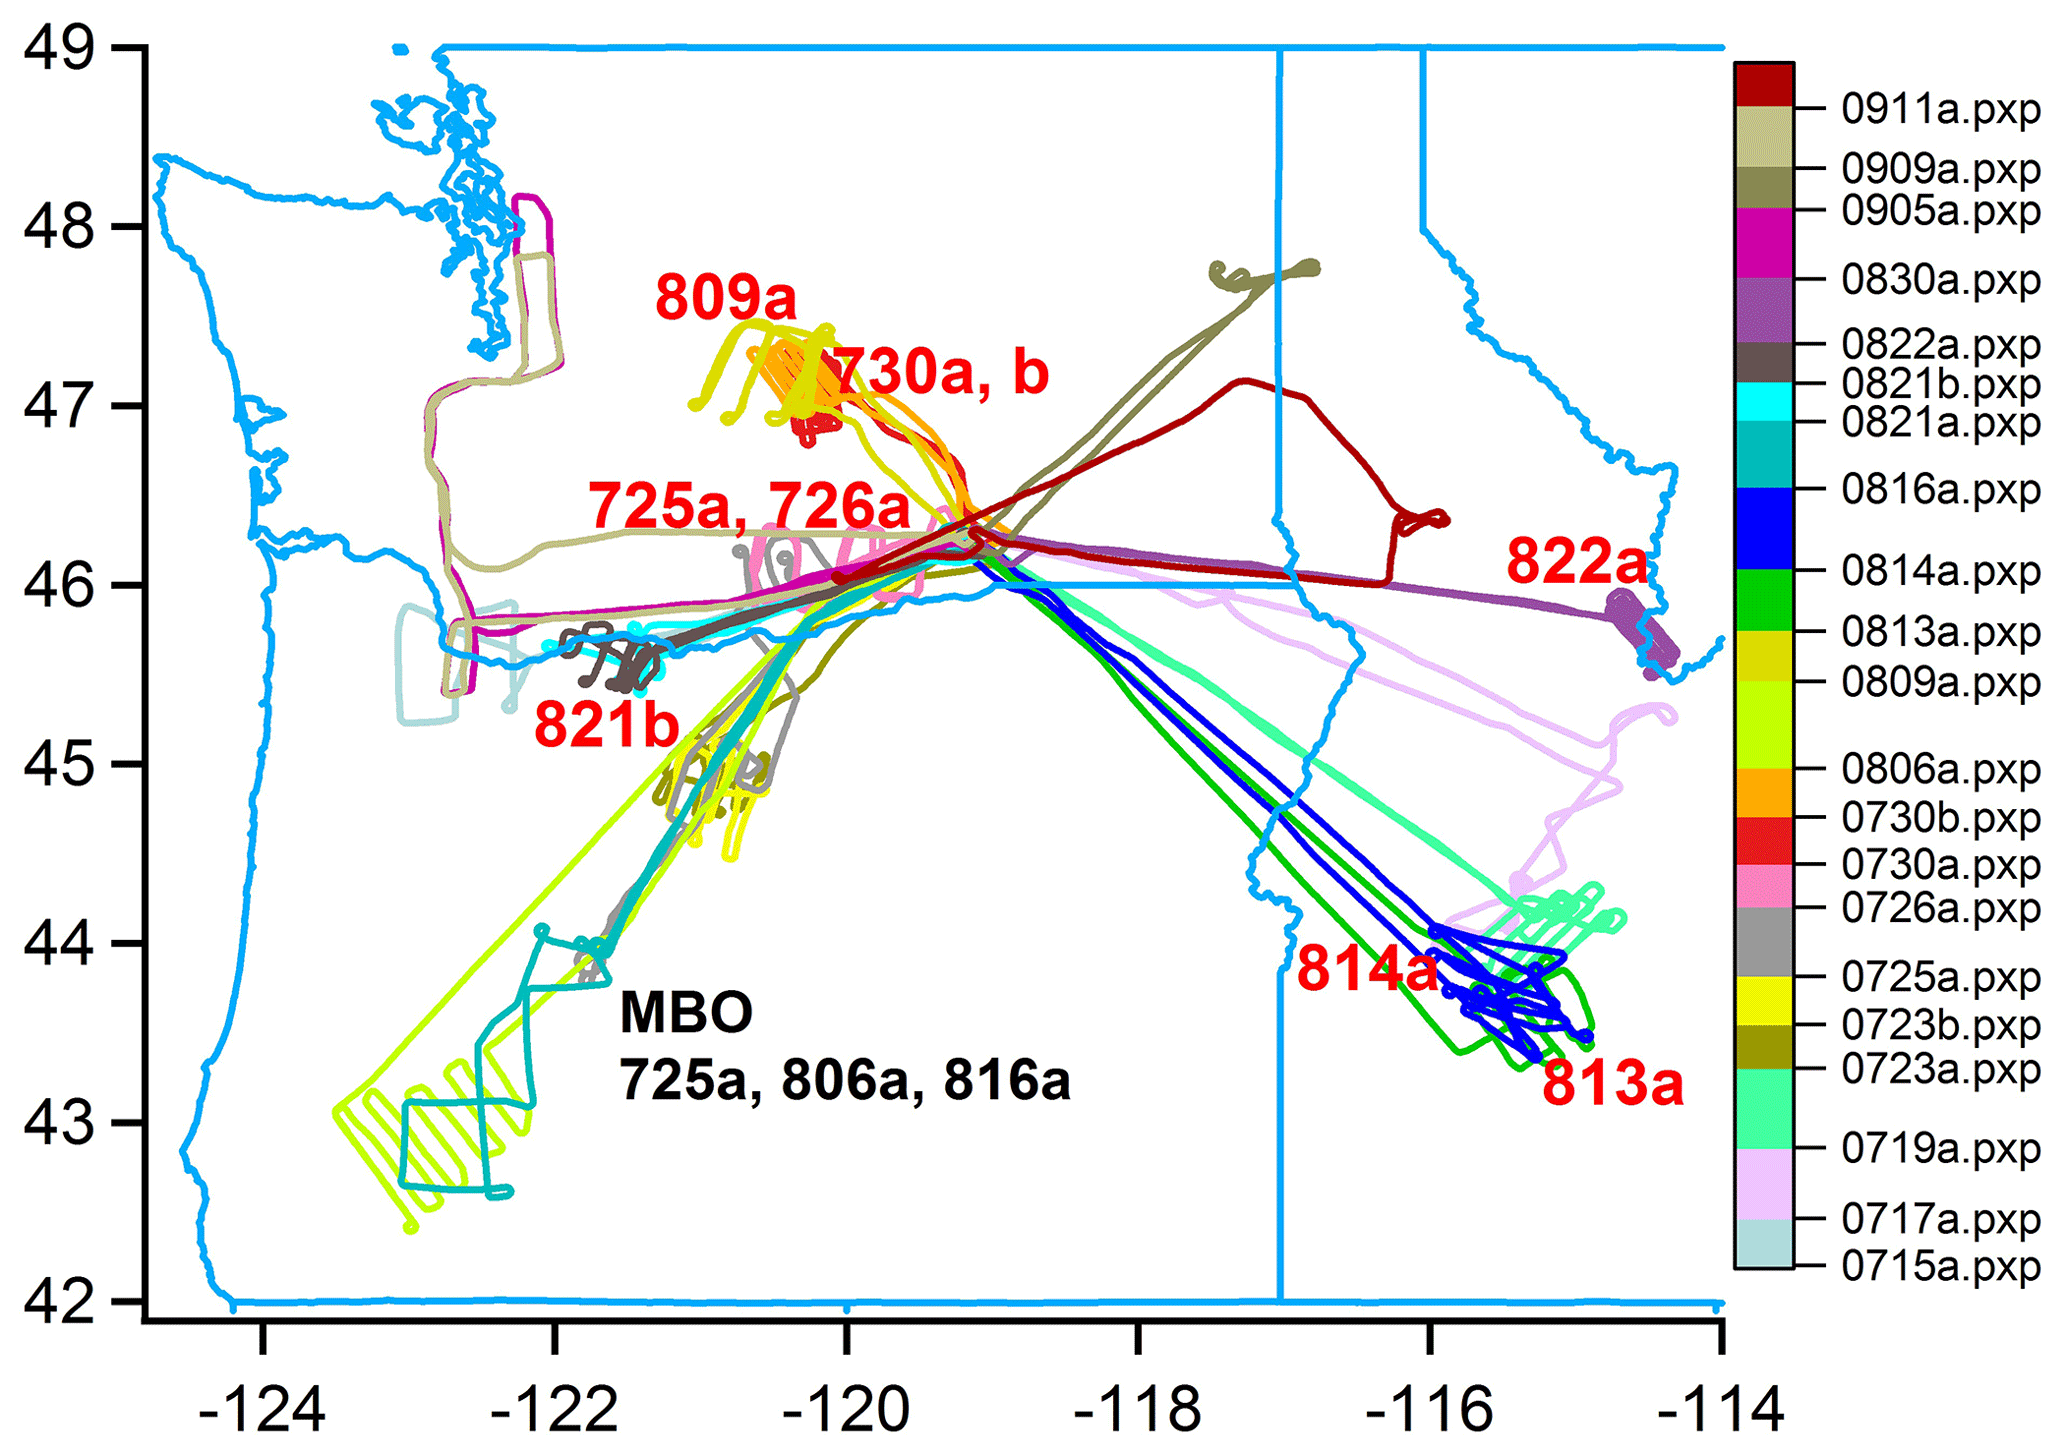
Figure 1Ground track of G-1 aircraft for 21 BBOP flights in the Pacific Northwest. Nine flights that were used in time evolution analysis are identified on the map with red text.
Wildfire flights analyzed for aging in this study had to meet three criteria. (1) Sampling included fresh emissions, estimated as having an atmospheric residence time less than 30 min. That emissions were fresh was determined by the observation of a high-concentration, compact plume with a high NOx-to-NOy ratio. (2) Measurements were made at downwind distances where significant aging was expected. Transport between regions with fresh and aged pollutants had to be consistent with in-plume wind measurements. (3) Measurements of aerosol mass, light scattering, and CO were required.
Nine pseudo-Lagrangian flights sampled smoke from five wildfires (Tables 3 and 4) for which the time evolution of smoke could be followed from near its source to locations several hours downwind. Evidence that fire characteristics were reasonably steady – an implicit assumption upon which Lagrangian analysis depends - comes from flights in which two sets of transects were repeated with about a 1 h delay between samples at nearly the same location. True Lagrangian sampling was not possible. Leaving aside the difficulty of identifying and following a particular air parcel, the time over which this could be done is restricted by the G-1's limited sampling time of 1 to 2 h on station. Ground tracks for flights 730b and 821b are shown in Figs. 3 and 7, respectively. The other seven flights satisfying our pseudo-Lagrangian criteria are shown in Figs. S1–S7. For the nine-flight ensemble, plumes were sampled at downwind distances between a few kilometers and 90 km, at which point up to 3.5 h of aging occurred. The minimum downwind distance is dictated by the distance needed for the plume to reach aircraft altitude or, in some cases, by flight restrictions. Seven of the nine flights had NOx and NOy measurements that were used to calculate photochemical age. Fire radiant energy (FRE) obtained from Terra and Aqua MODIS satellite retrievals has been added to the flight track plots. Cloud cover limited FRE retrievals for flight 809a and for the afternoon of 22 August. Satellite overpasses were within 2 h of sampling times on flights 726a, 730b, 813a, 814a, and 821b. Noyes et al. (2020) discuss MISR retrievals of plume optical properties and plume depth, focusing on flight 821b and, to a lesser extent, the Colokum Tarps fires.
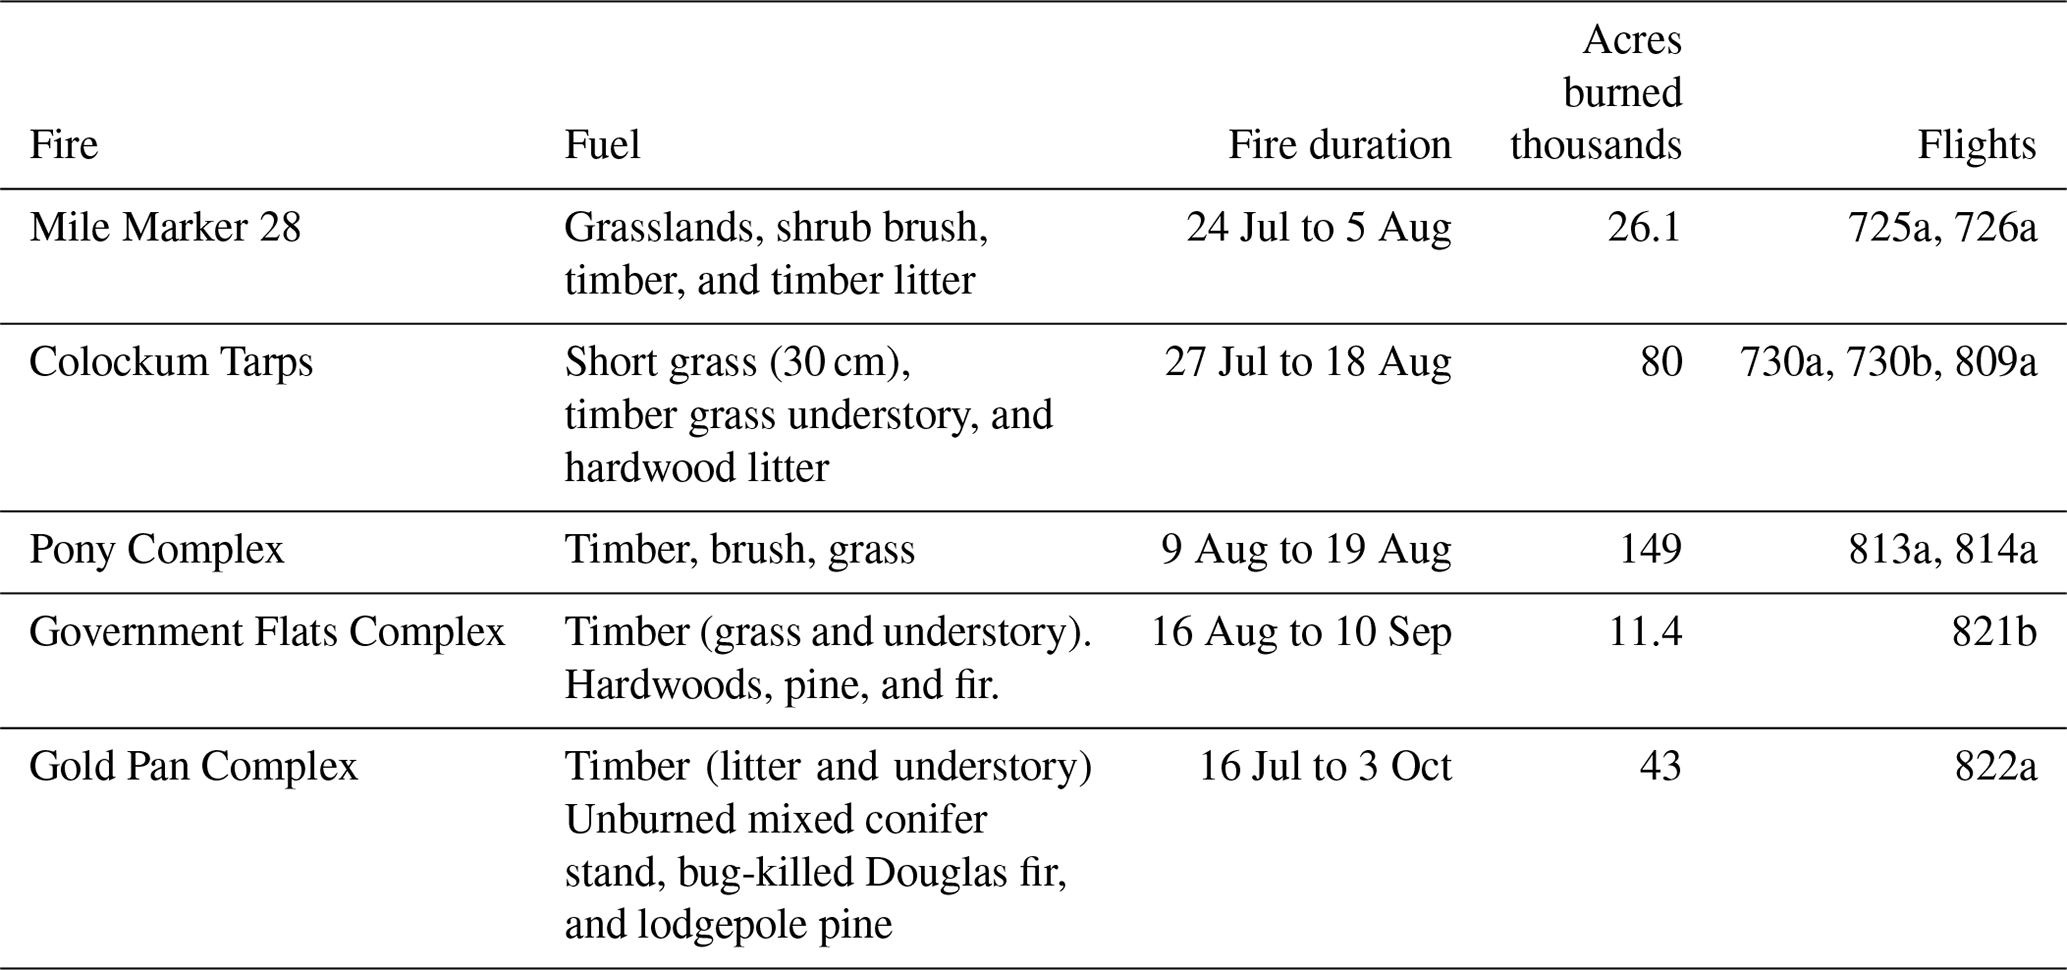
Table 4Lagrangian flights used for analyzing time evolution of wildfire emissions.
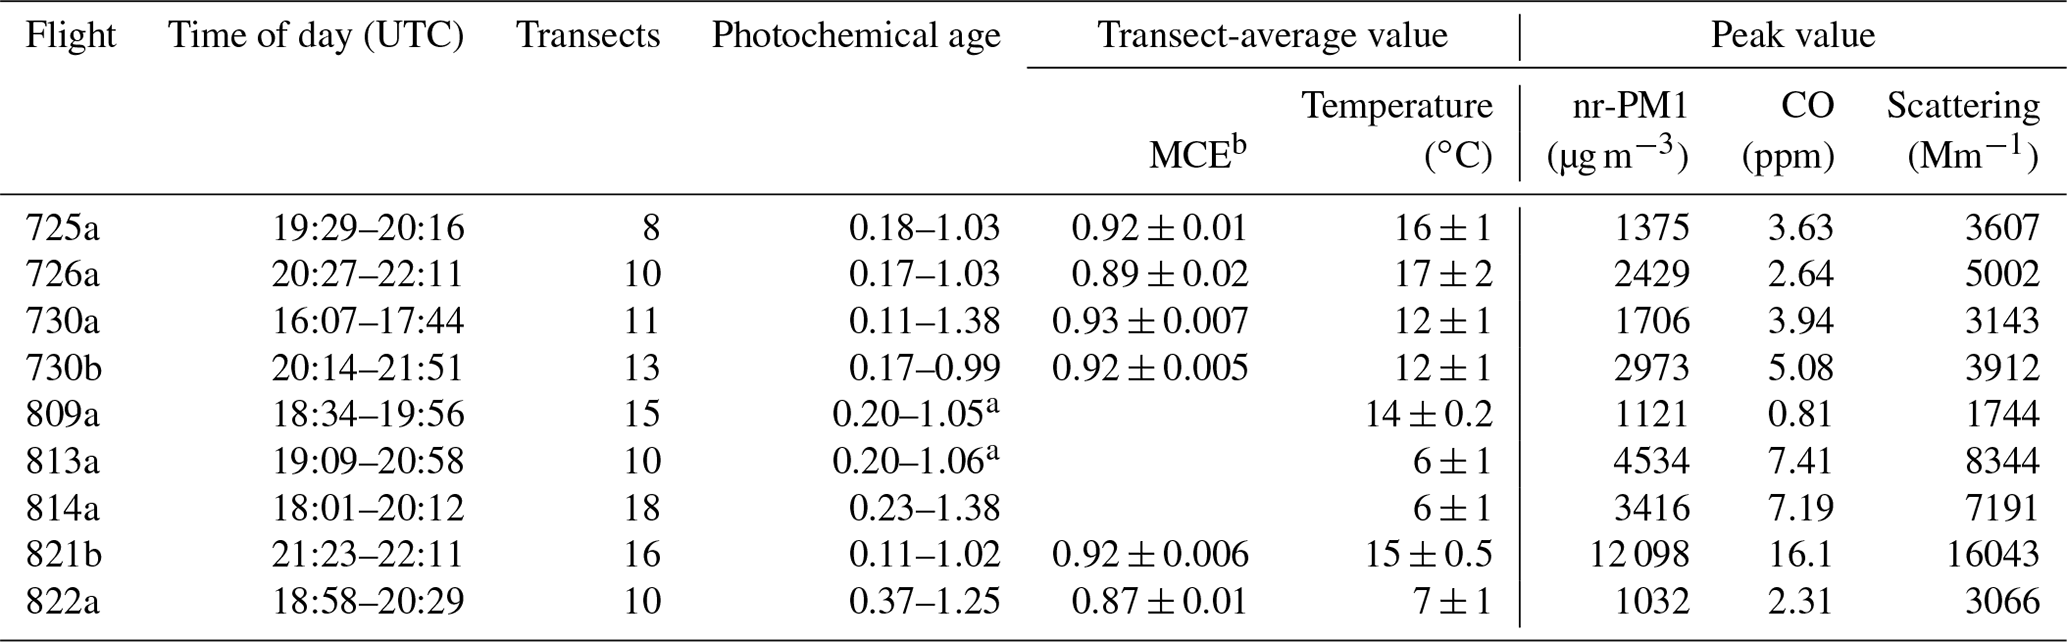
a Photochemical age determined from downwind distance and seven-flight fitting function shown in Fig. 2. b ΔCO2 > 2 ppm, (±1σ for variation between transects).
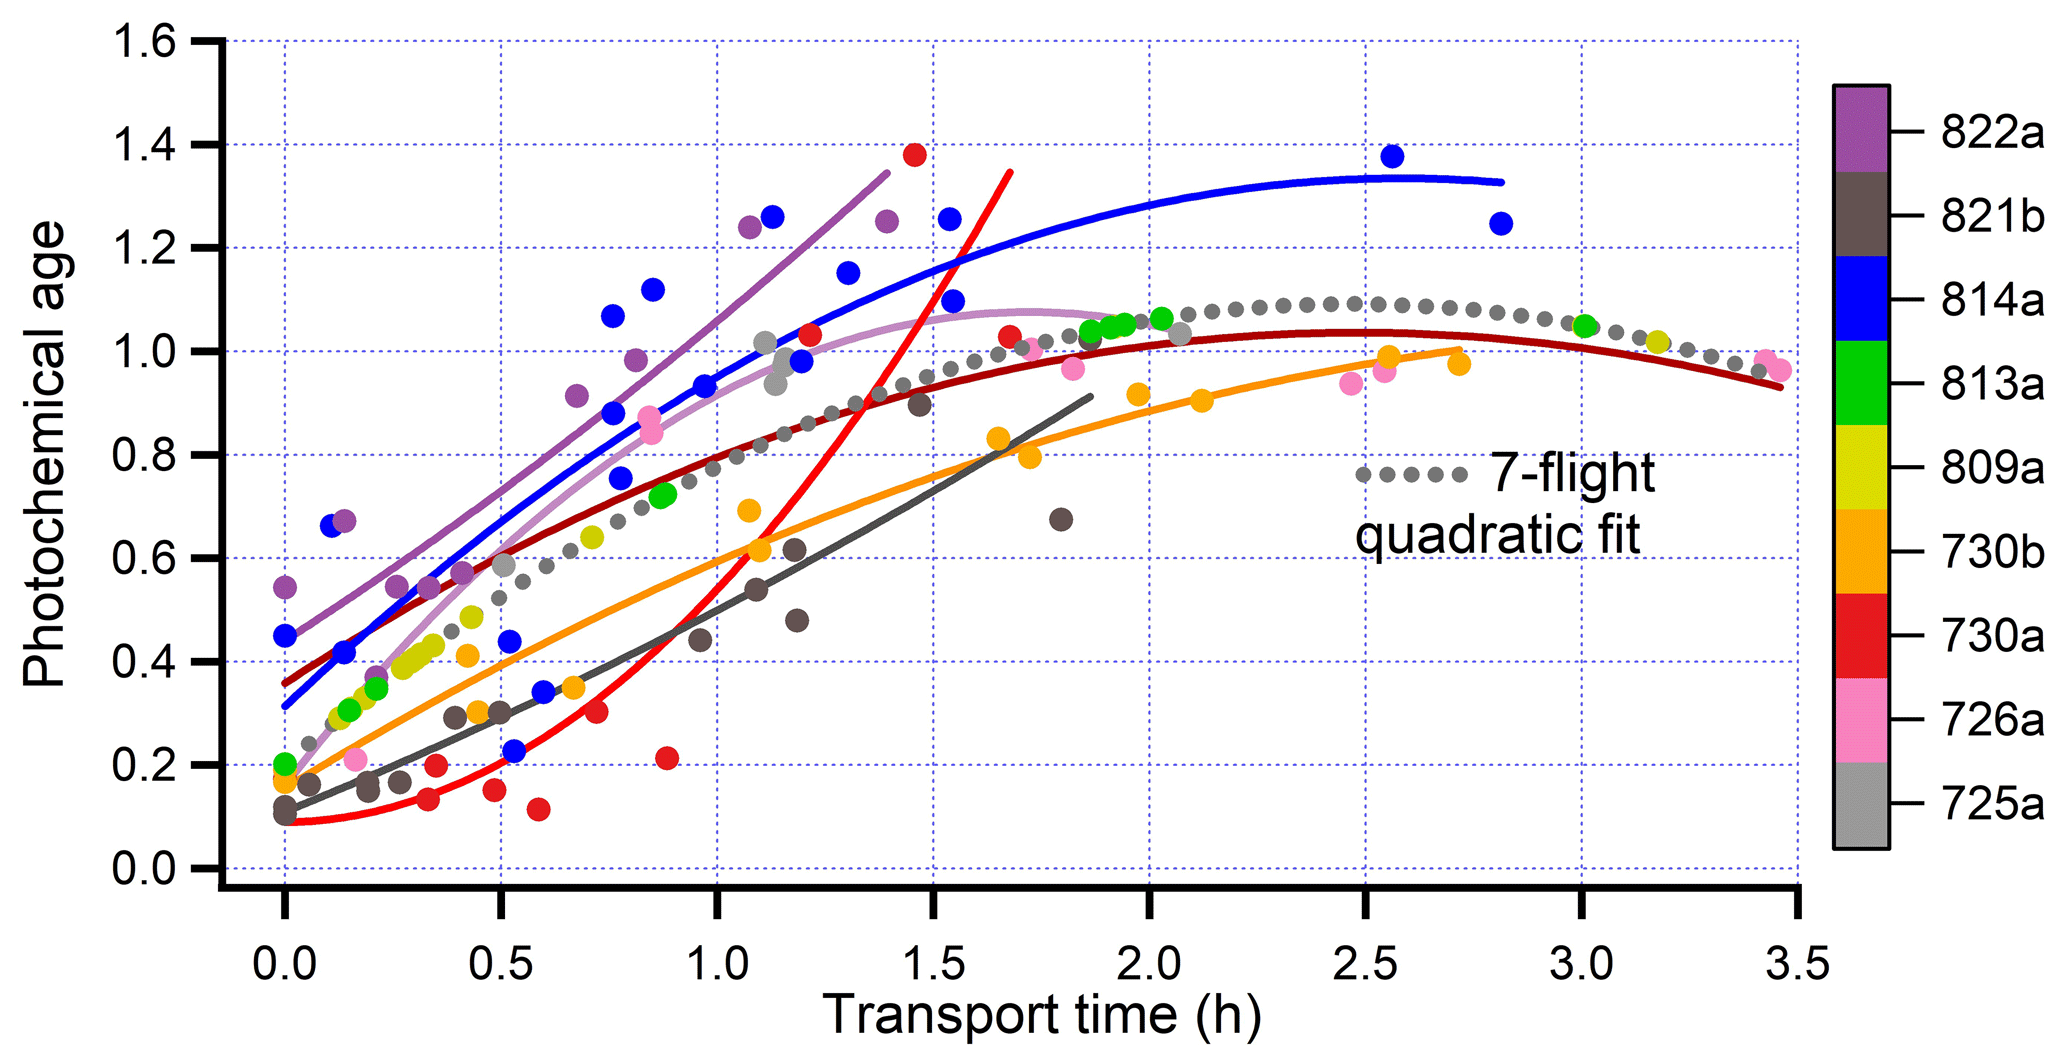
Figure 2Comparison of photochemical age, −Log10 (NOx∕NOy), with downwind transport time calculated from distance and aircraft wind measurements. Each colored point is a transect of a flight identified in the legend. Solid lines are quadratic fits to each of seven flights. A quadratic fit for the combined seven-flight data set is used to estimate photochemical age for flights 809a and 813a, which are missing NOy measurements.
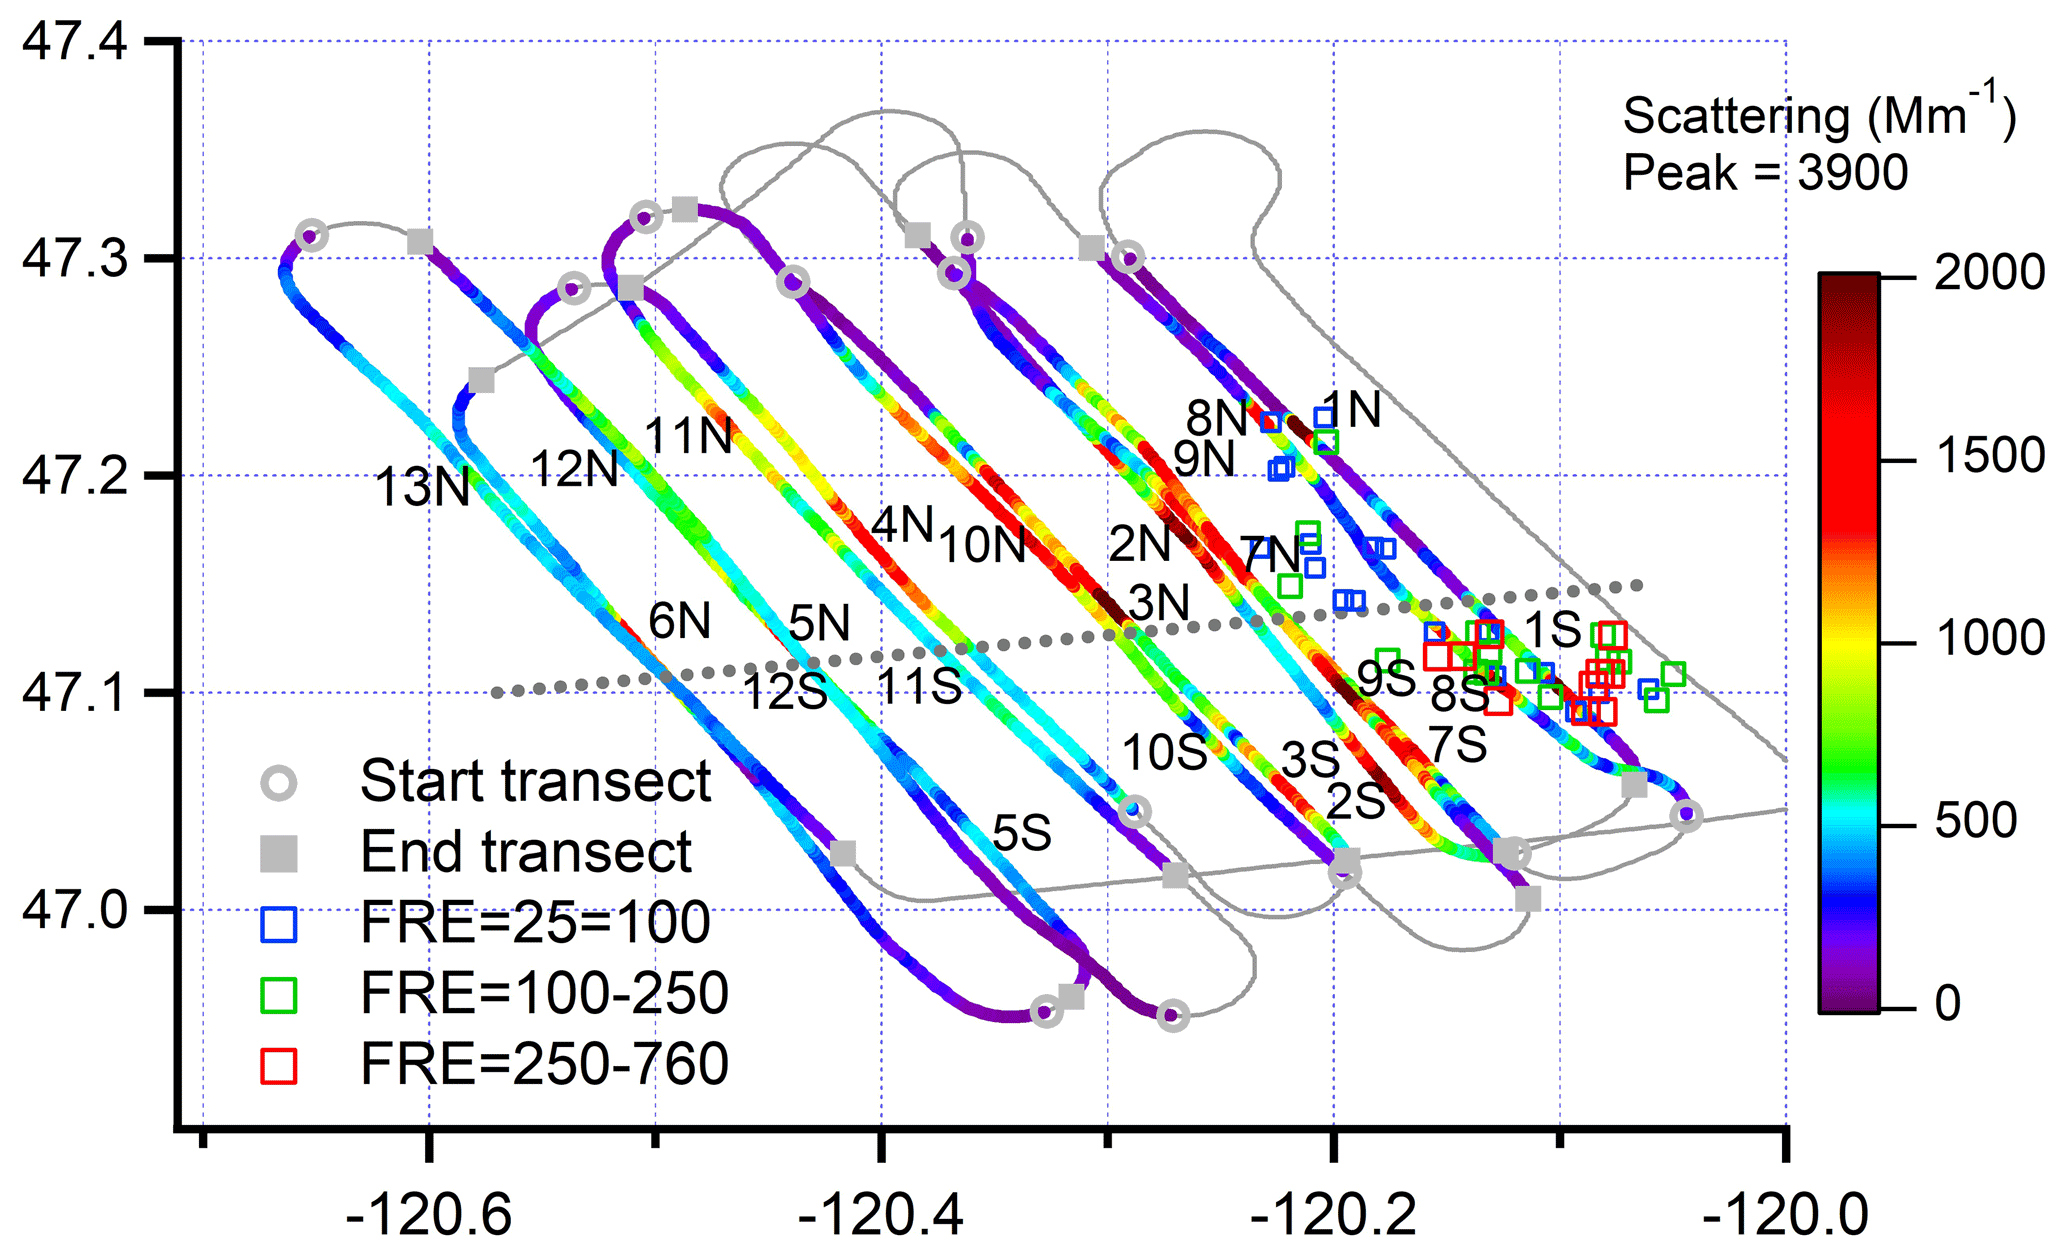
Figure 3Ground track for flight 730b, colored by light scattering. The Colockum Tarps fire contained two plumes that have different ratios of chloride to total nr-PM1 (see Fig. 5a, following). Transects are labelled 1–13 in consecutive order and, where possible, the northern (low chloride) and southern (high chloride) regions are indicated by a N or S at the point of peak concentration (see Fig. 6, following). A dotted line approximately separates the two regions. MODIS retrievals between 18:00 and 22:00 used for fire radiative energy (FRE). Latitude and longitude not to scale.
Several flights resemble regular grids containing two sets of up to six cross-plume segments. The spacings between segments represent 20–60 min of plume aging. Other flights are more free form, and in one case (821b) there is an extended along-plume segment that has been split into pieces with different ages. The ground track figures indicate the portions of each flight, 106 in total, over which averages are taken. We will refer to these cross-plume and along-plume flight segments as “transects”. Transects were defined as being in the wildfire plume at a relatively narrow range of distances from the parent wildfire. Vertical plume structure was not explored because to do so would have been at the expense of horizontal spatial coverage. Wildfire sampling was mostly at constant altitude, at least 1000 m above terrain, and insofar as possible near the altitude with maximum concentrations. Unlike small prescribed burns or observations from a far-downwind vantage point, the wildfires sampled in BBOP have a significant spatial extent in comparison to our measurement domain. Some flights had MODIS FRE pixels in nominally downwind locations. Thus, scatter in our measurements as a function of downwind aging is expected.
Data for the nine pseudo-Lagrangian flights come from the five wildfires listed in Table 3. Descriptions of these fires are available in National Fire Service Incident reports (https://fam.nwcg.gov/fam-web/hist_209/hist_2013_r_209_gacc_sprd?v_gaid=NW, last access: December 2019). Emission factors for the Colokum Tarps flights (730a and 730b) are compared with SEAC4RS and other data sets by Liu et al. (2016).
3.1 Time evolution
The time evolution of fire emissions is calculated from plume measurements at varying downwind distances. We use transect-averaged quantities from which backgrounds have been subtracted. In the example of species X, an excess concentration is
Xi is an average of X over transect i and XB an average over a relatively unpolluted background region near the smoke plume. If Xi is an intensive variable, such as an AMS mass ratio (f43, f44, f60, O-to-C ratio, or H-to-C ratio), a scattering Ångström exponent, or a backscatter ratio, transect averages are constructed using nr-PM1 as a weighting function. Problems and alternate ways of determining background are discussed by Yokelson et al. (2013), Briggs et al. (2016), and Garofalo et al. (2019). To account for plume dilution or conversely sampling a more concentrated plume region downwind, we divide measured concentrations by a conservative tracer, CO. A normalized excess concentration is given by
A ratio of Xi to another quantity, Yi, is calculated as
In any ratio, such as in Eqs. (2) and (3), a common set of data points is used for numerator and denominator. Except as noted, ratios involving aerosol mass are based on non-refractory aerosol measured with the SP-AMS, i.e., nr-PM1. Equations (1) to (3) apply to variables that are expressed as concentrations, mixing ratios, or inverse lengths. The meaning should be clear from the units used.
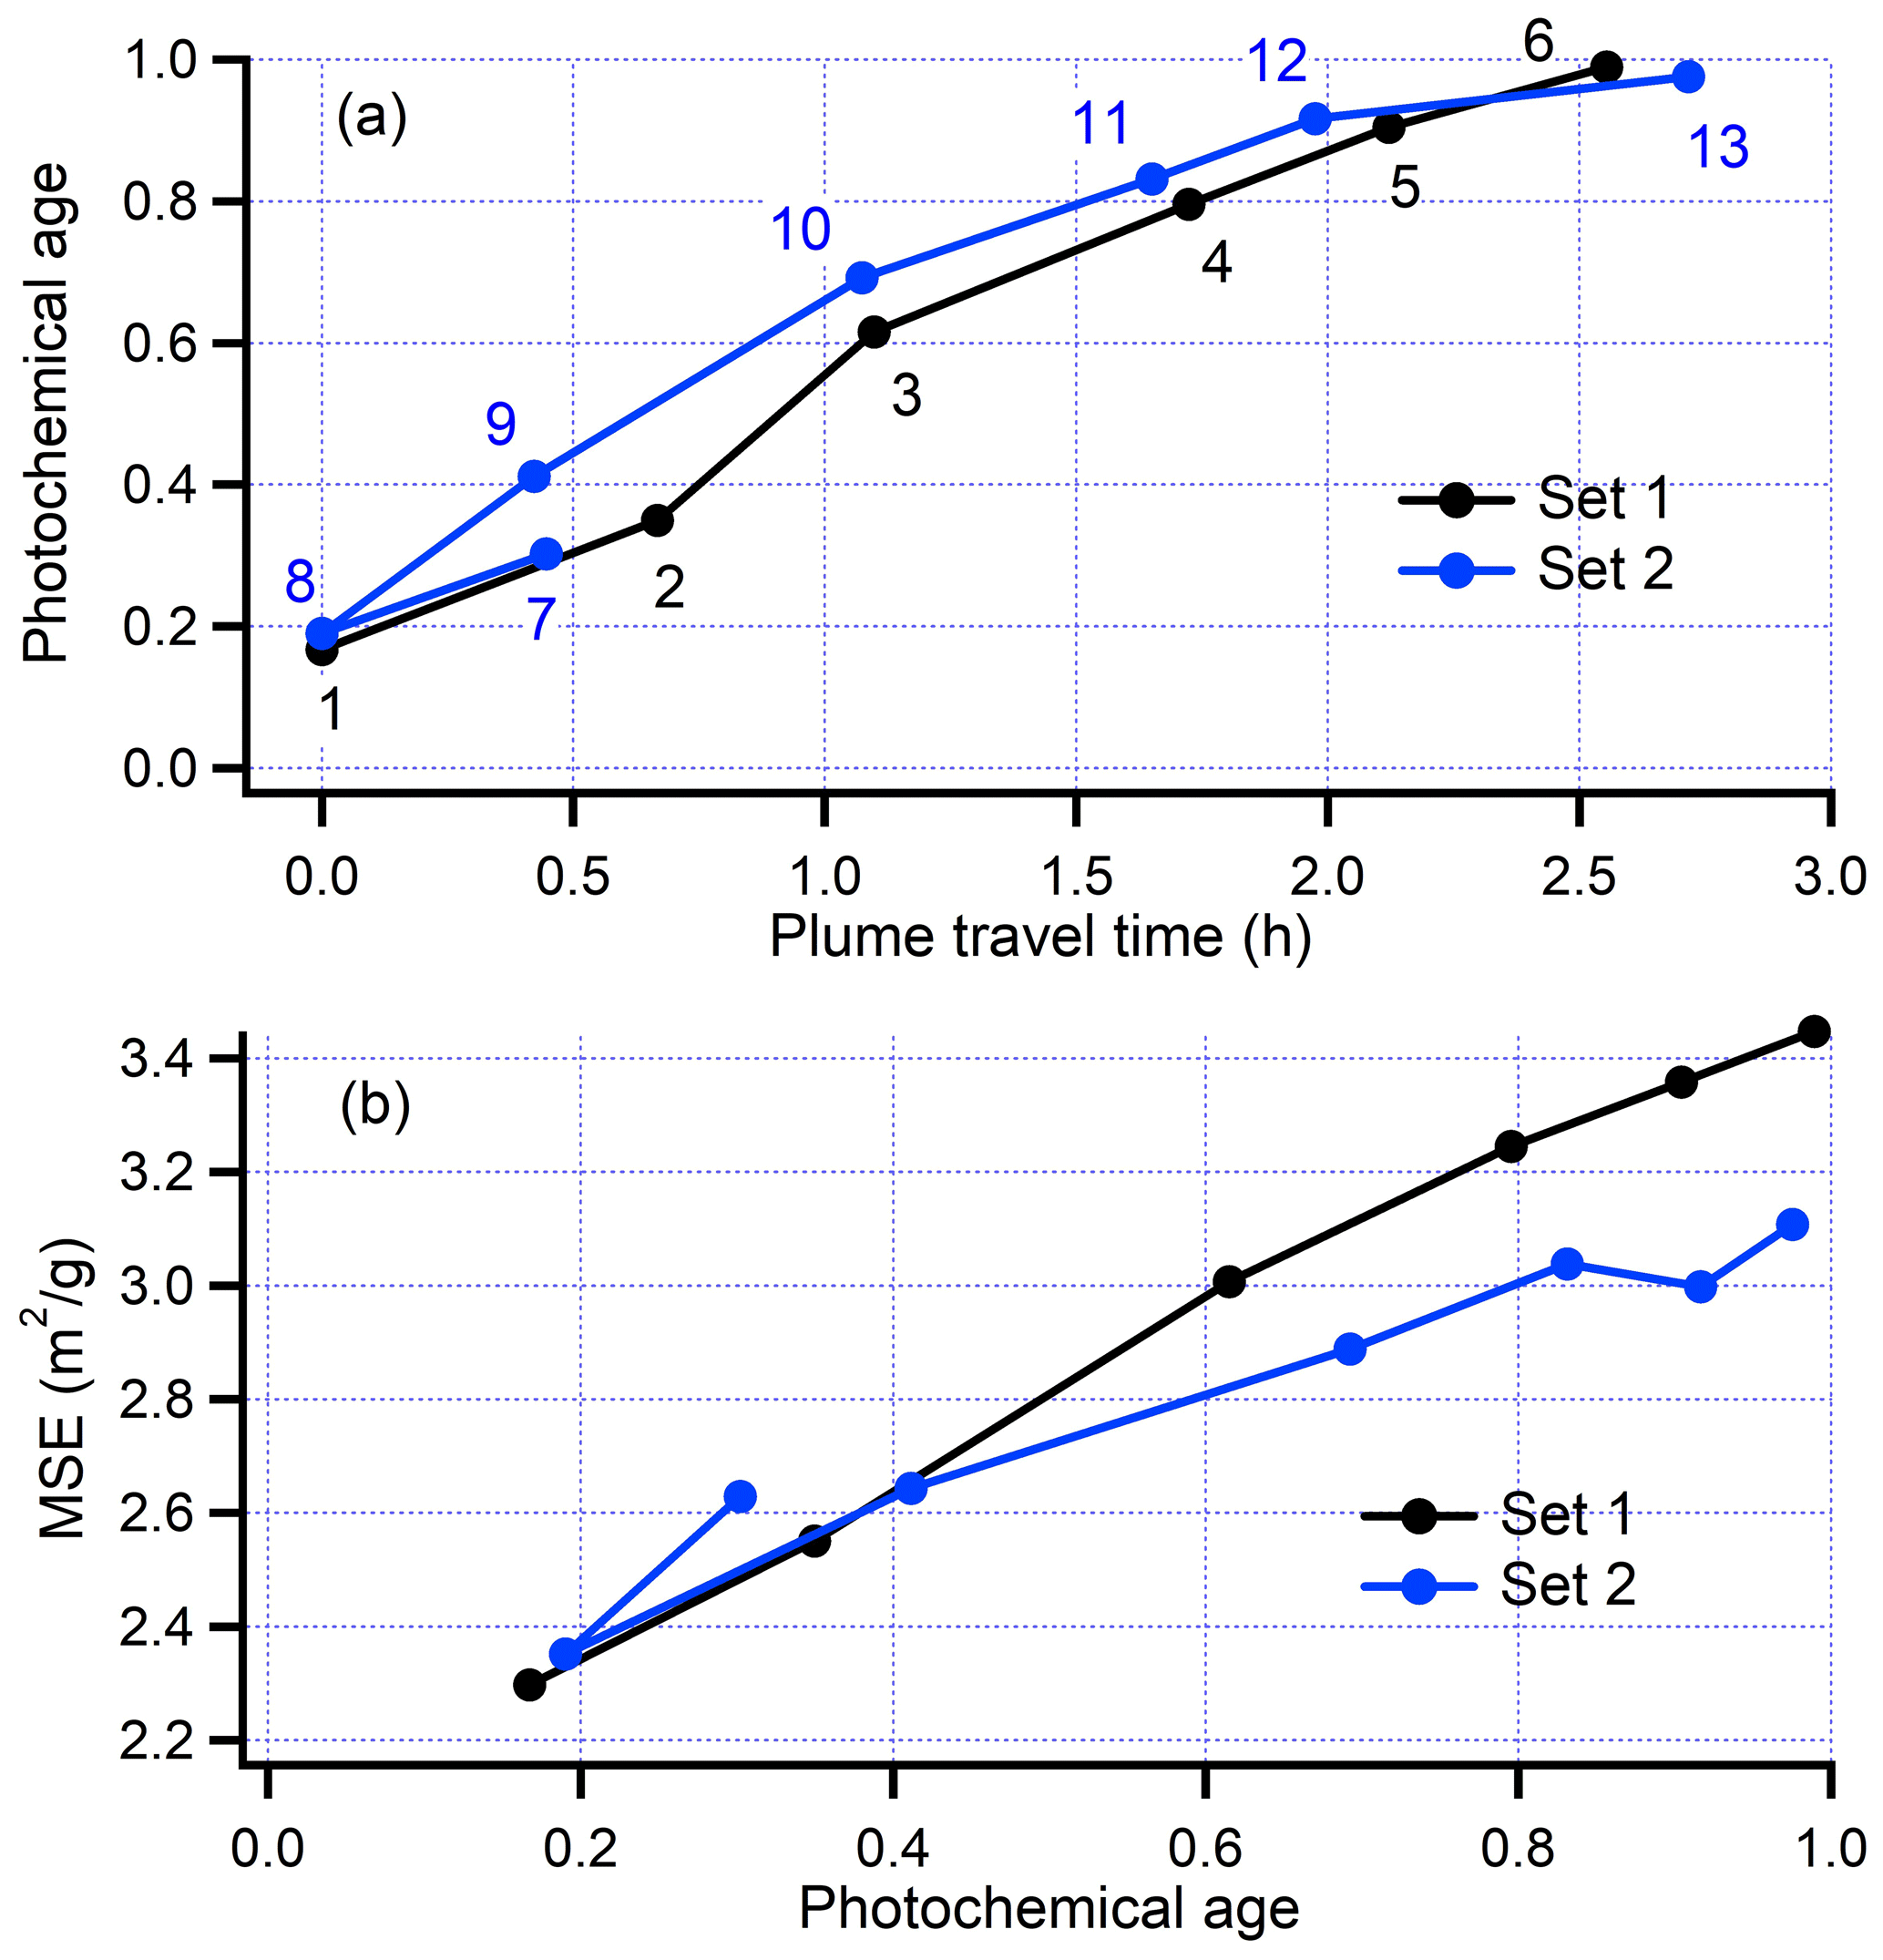
Figure 4Transect-average data from flight 730b. Lines join transects in order of increasing time. Transects correspond to plume crossings shown in Fig. 3. Set 1 consisted of transects 1–6 at increasing photochemical age. The seven transects (7–13) of Set 2 start at a photochemical age =0.3 and proceed to 0.2, 0.4 0.7, 0.8, 0.9 and 1.0. The transition between Set 1 and Set 2 was outside the smoke plume.
Effects of aging are determined from changes in normalized excess ratios as a function of photochemical age or transport time. We define photochemical age by the conversion of NOx to oxidation products, expressed as −Log10 (ΔNOx/ΔNOy) (Olszyna et al., 1994; Kleinman et al., 2008; DeCarlo et al., 2010). In the case that NOy is conserved and NOx is lost primarily by OH + NO2→ HNO3, photochemical age, so defined, would yield [OH]*time and, given a trajectory-based time, would yield an average OH concentration. We, however, refrain from inferring an OH concentration from NOx and NOy measurements. We observe an apparent loss of NOy in fresh plumes (e.g., Neuman et al., 2004). Oxidation of NOx is more rapid than expected from OH + NO2 (Mebust et al., 2011), which can be due to the known high yields of PAN (Alvarado et al., 2010; Briggs et al., 2016; Liu et al., 2016). As will be shown, −Log10 (ΔNOx/ΔNOy) is a useful metric for chemical processing as it is strongly correlated with known age-related changes in aerosol composition due to atmospheric processing (see, e.g., Fig. S10).
Brief summaries of the nine pseudo-Lagrangian flights are given in Table 4. Transect-average modified combustion efficiency (MCE) observations for the six pseudo-Lagrangian flights with CO2 observations are tightly grouped between 0.86 and 0.92, close to MCE = 0.9, traditionally taken as a transition point between mostly burning and mostly smoldering fires (Akagi et al., 2011). The relation between MCE and aerosol composition for two regional BBOP flights has been discussed in conjunction with measurements at MBO by Collier et al. (2016). Amongst the nine flights, emission intensity as determined by peak values of nr-PM1, CO, and light scattering varied by about an order of magnitude. Three fires were sampled on multiple flights, the Mile Marker 28 fire (725a and 726a), Colockum Tarps fire (730a, 730b, and 809a), and the Pony Fire Complex (813a and 814a). Plumes from the two Pony Fire Complex flights tended to resemble each other and have a similar age dependence (see figures below), more so than the Mile Marker 28 and Colockum Tarps flights. In the most aged transects, background was an appreciable fraction of plume values for nr-PM1, CO, and scattering. For several flights background subtraction was problematic for CO2 and inorganic aerosol components.
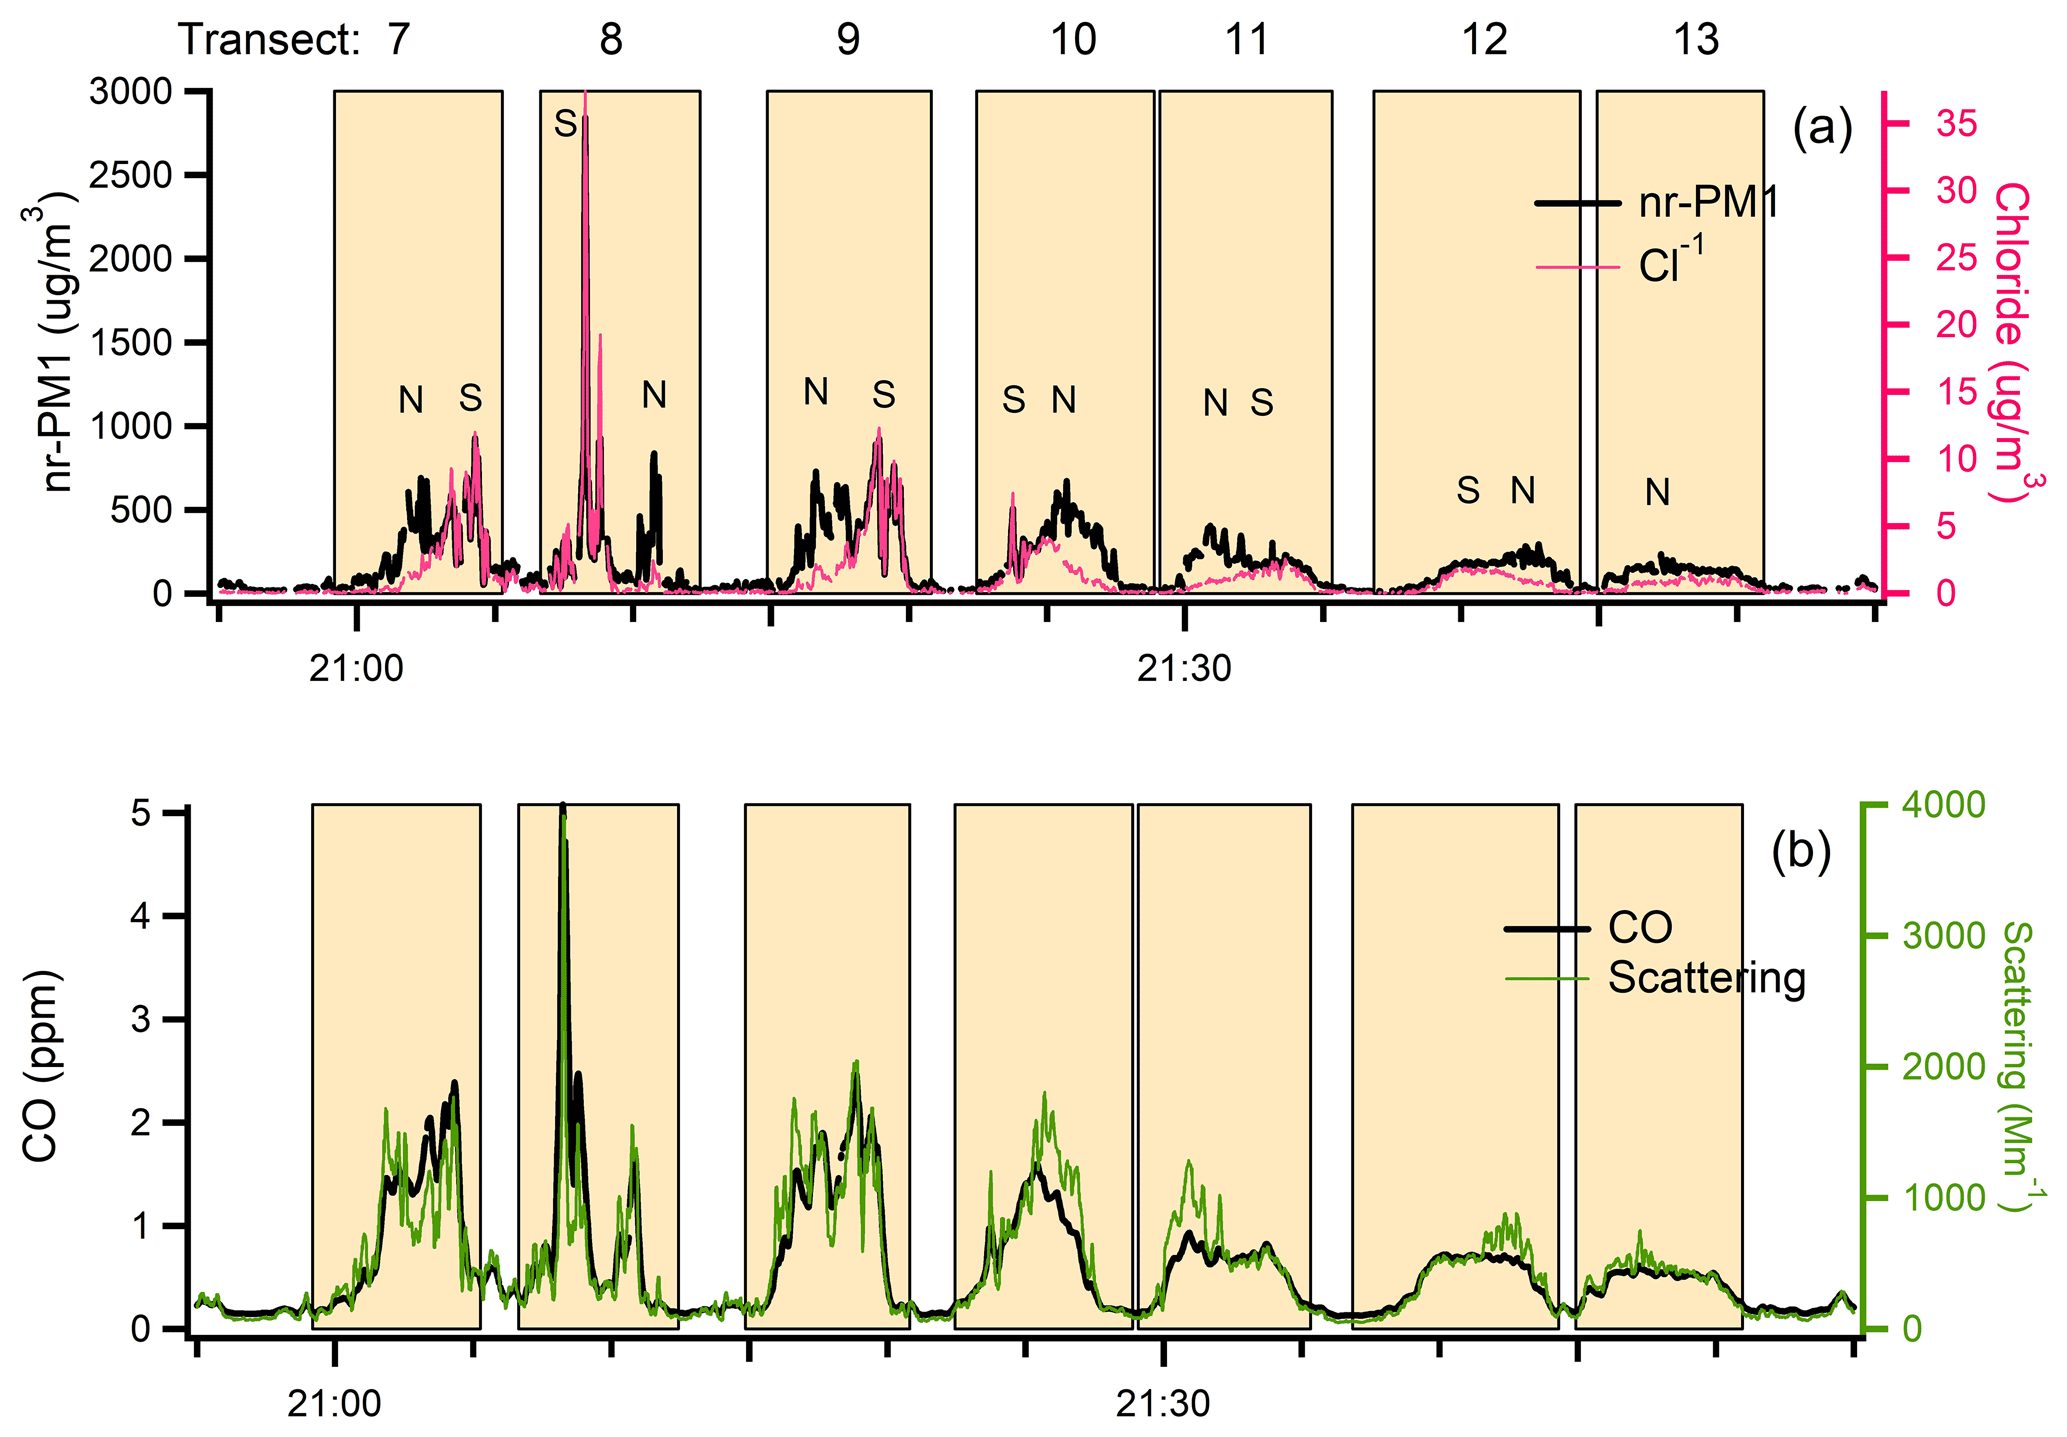
Figure 5Time series data from flight 730b for (a) nr-PM1 and Cl− (b) CO and light scattering. Data contributing to transect averages are identified by shaded rectangles. Transect numbers and North, South designation correspond to those in Fig. 3. Transects are limited to 1–6 from Set 1 for visibility. The increase in the ratio of scattering to CO is particularly pronounced in the low Cl parts of downwind transects.
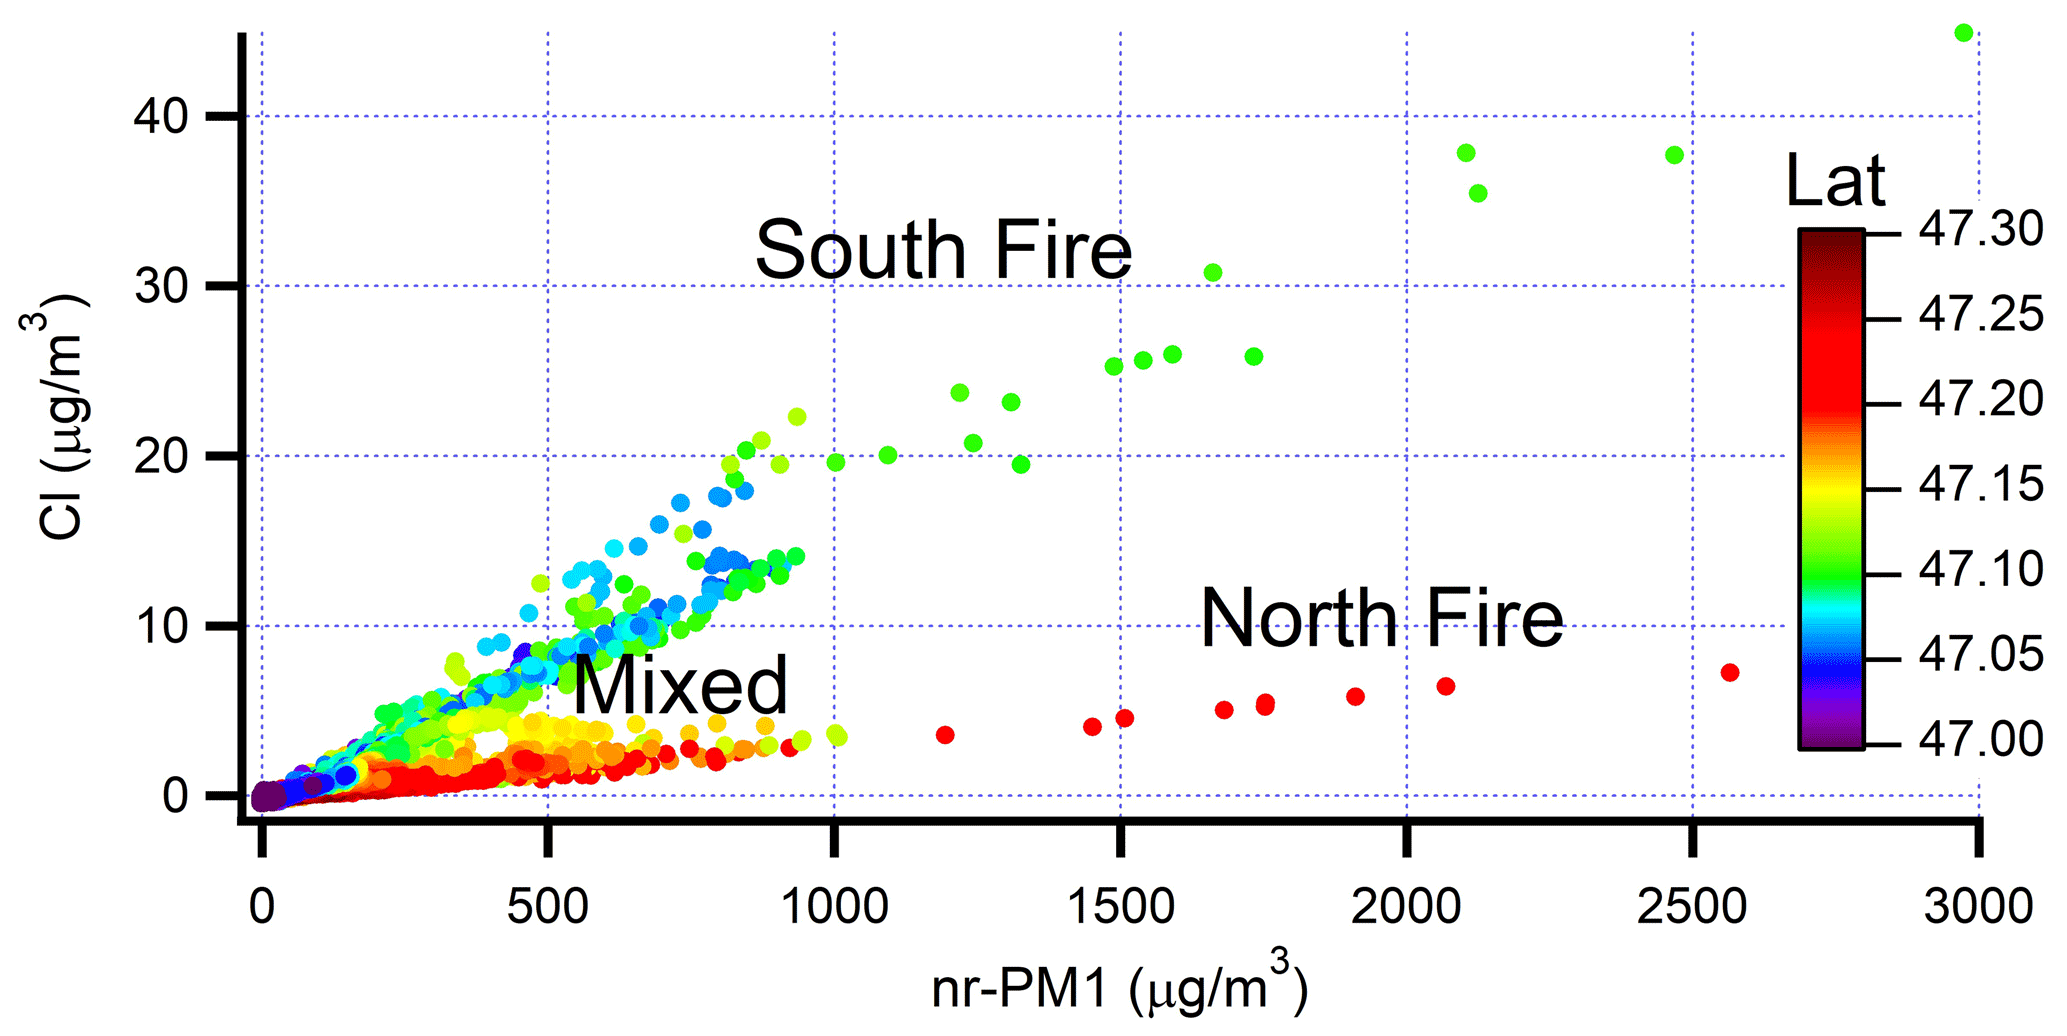
Figure 6Cl concentration as a function of nr-PM1 for flight 730b. Data points are at 1 Hz. Spatial locations of North and South fires shown in Fig. 3.
4.1 Plume age, concentration, and dilution
Figure 2 shows a comparison between NOx/NOy-based photochemical age and atmospheric transport times. Photochemical age increases with downwind distance, but these two metrics of atmospheric processing are not directly proportional, nor should they be. In older plumes, NOx is depleted, and photochemical age tends to level off, whilst distance is not bounded. Close to the fire transects have an age ranging from 0.1 to above 0.5. The higher age values are generally from smaller, perhaps more rapidly evolving, fires located near the main source of smoke. In the absence of other information, these transects are assigned a downwind distance equal to that of nearby less aged transects. NOy data are missing from the 809a and 813a flights. Photochemical ages for transects on these flights have been generated from downwind travel times and the seven-flight fit shown in Fig. 2.
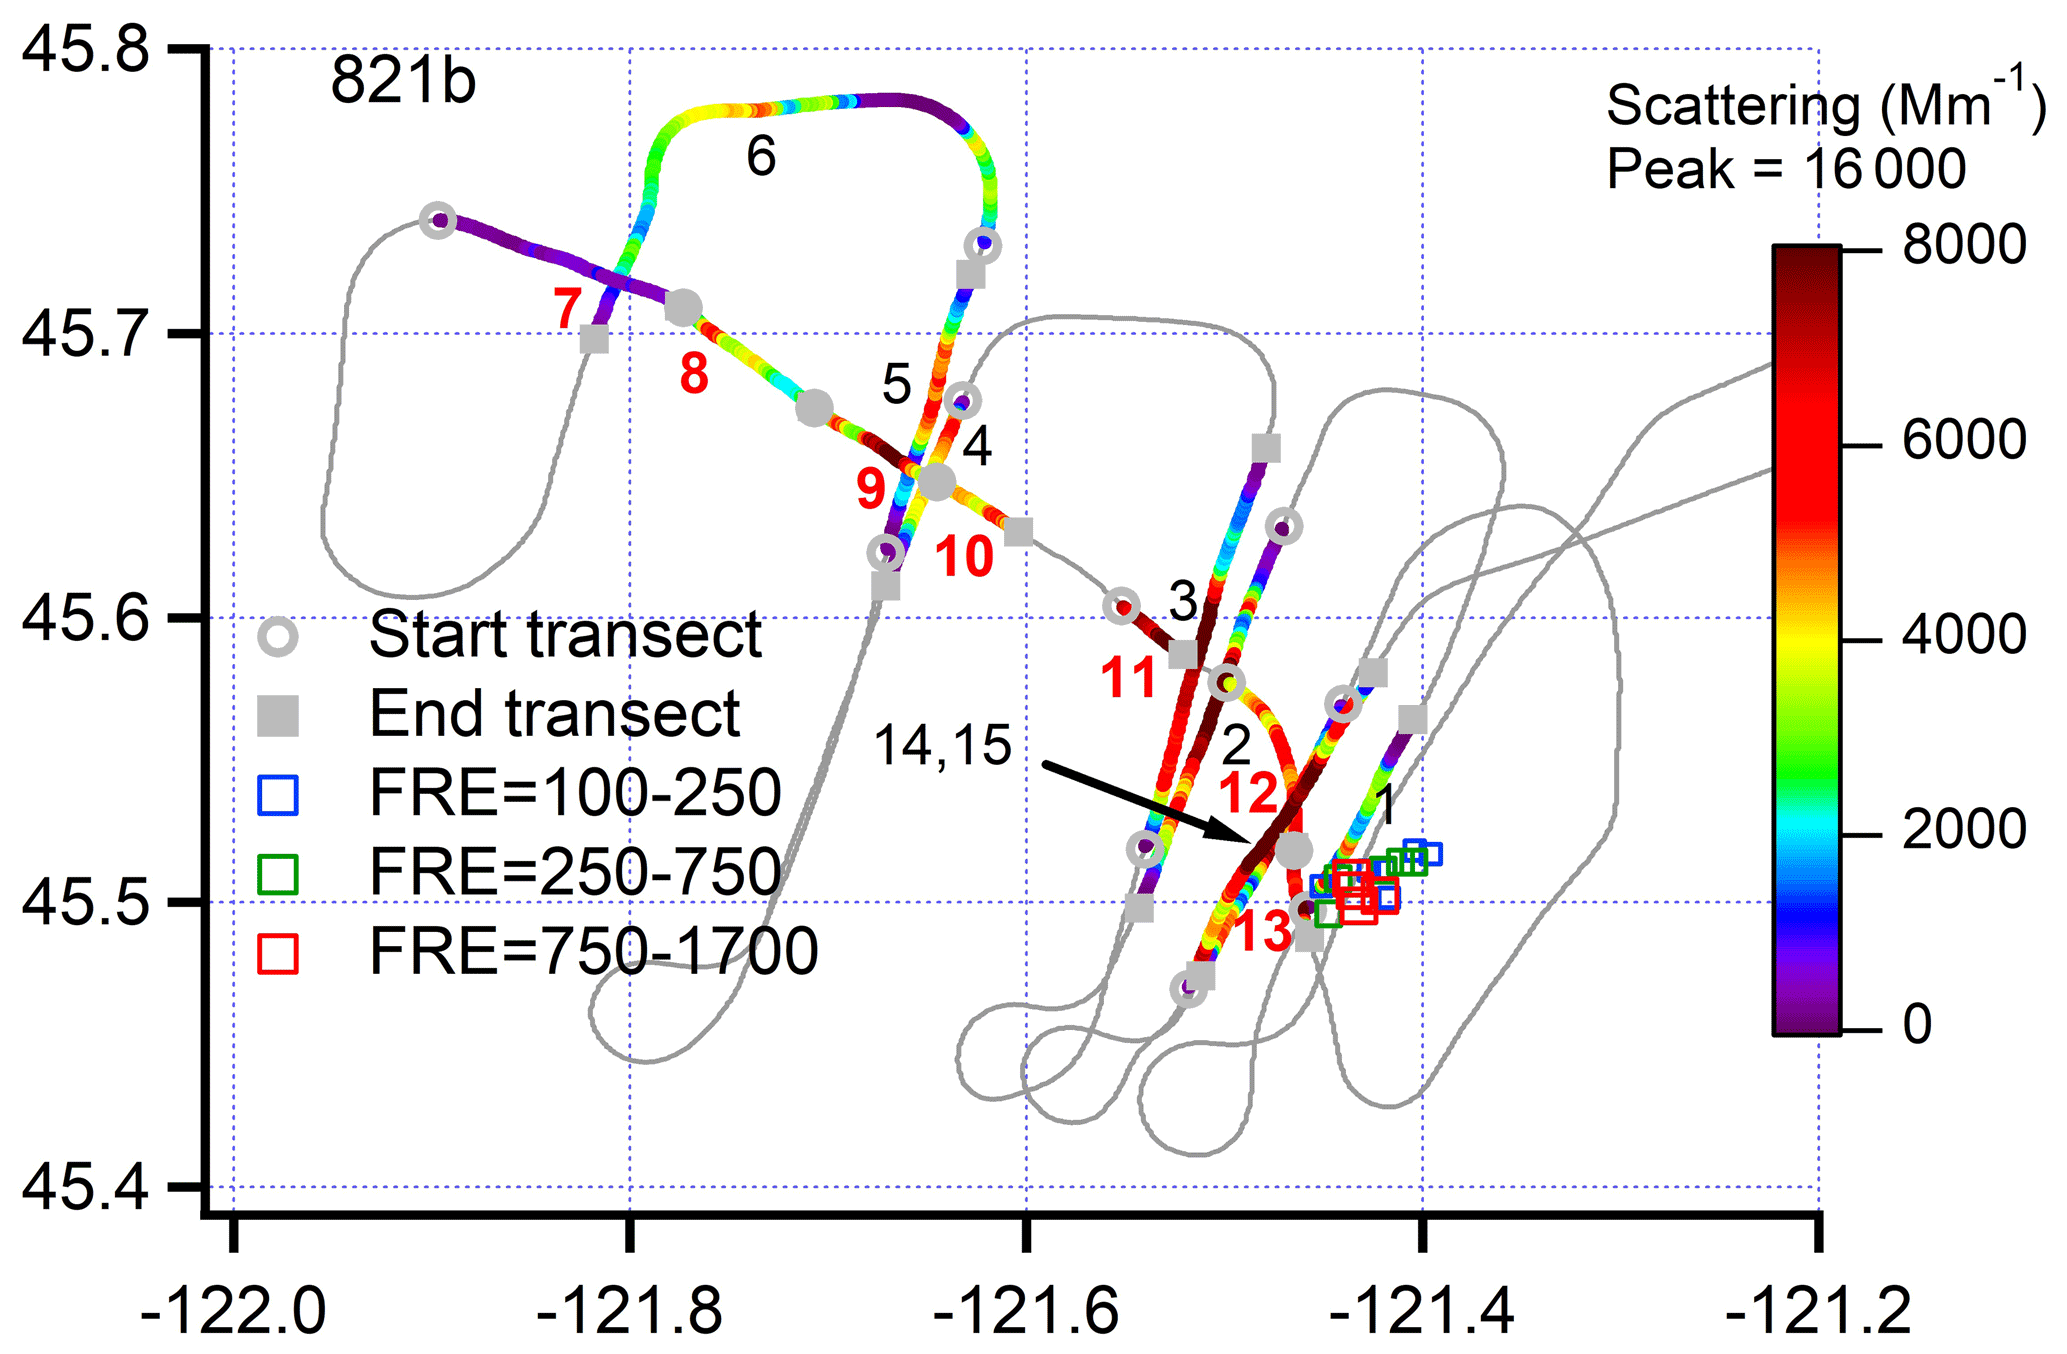
Figure 7Ground track for flight 821b with transects colored according to light scattering. Transects are labelled 1–15 in order of increasing flight time. Fire is near transect 1. Transects 6 and 7 are furthest downwind. Along-plume transects, 7–13, labelled in red. Transect 11 had limited NOx data and is not included in graphs in which photochemical age is the independent variable. After the along-plume segment, the plume was crossed twice (in opposite directions) on transects 14 and 15. MODIS retrievals between 18:00 and 22:00 used for FRE. Latitude and longitude not to scale.
The time evolution of BB plume constituents is affected by plume dilution because processes such as gas-phase oxidation and the partitioning of POA and SOA between phases are concentration dependent (Hodshire et al., 2019b; 2020). In examining a subset of the BBOP fires considered here, Hodshire et al. (2020) find that chemical oxidation of aerosols and loss of volatile species occur more rapidly in a low-concentration environment, hence in plume edges as compared with plume centers and small fires as compared with large ones. A similar dependence on position within a plume was found by Garofalo et al. (2019). In order to provide context for the BBOP data set and to facilitate comparison with other studies, we present in Table 4 ambient temperatures, MCE, and peak near-fire values for scattering, mixing ratio of CO, and concentration of nr-PM1. A dilution rate for each flight was determined from a fit to the peak mixing ratio of CO on each transect, plotted as a function of photochemical age in Fig. S8. Our measures of dilution are only qualitative as no attempt was made to sample an entire plume cross section. Within the time taken for photochemical age to change from 0.2 to 1.0, peak plume mixing ratios of CO decreased on average by a factor of 4.3. If measurements had been made at lower altitude, starting closer to the fire, dilution rates would have been much higher (Hodshire et al., 2019b).
4.2 Case studies
4.2.1 Flight 730b
The ground track for flight 730b, shown in Fig. 3, consists of two nearly identical sets of transects at six downwind distances. The time sequence of transects is shown in Fig. 4. Observation times for the second set follow the first set by about 1 h. Transect-averaged quantities were used to compare Sets 1 and 2. As examples we present in Fig. 4 photochemical age vs. downwind travel time and the ratio of scattering to nr-PM1 as a function of photochemical age. Differences between Sets 1 and 2 are due to the precision of our measurements and natural time changes in the fire. Variations between observations in Set 1 and Set 2 can also be seen in the spatial displacement of plumes between repeated transects (Fig. 3), though allowance should be made for repeated transects not being exactly coincident.
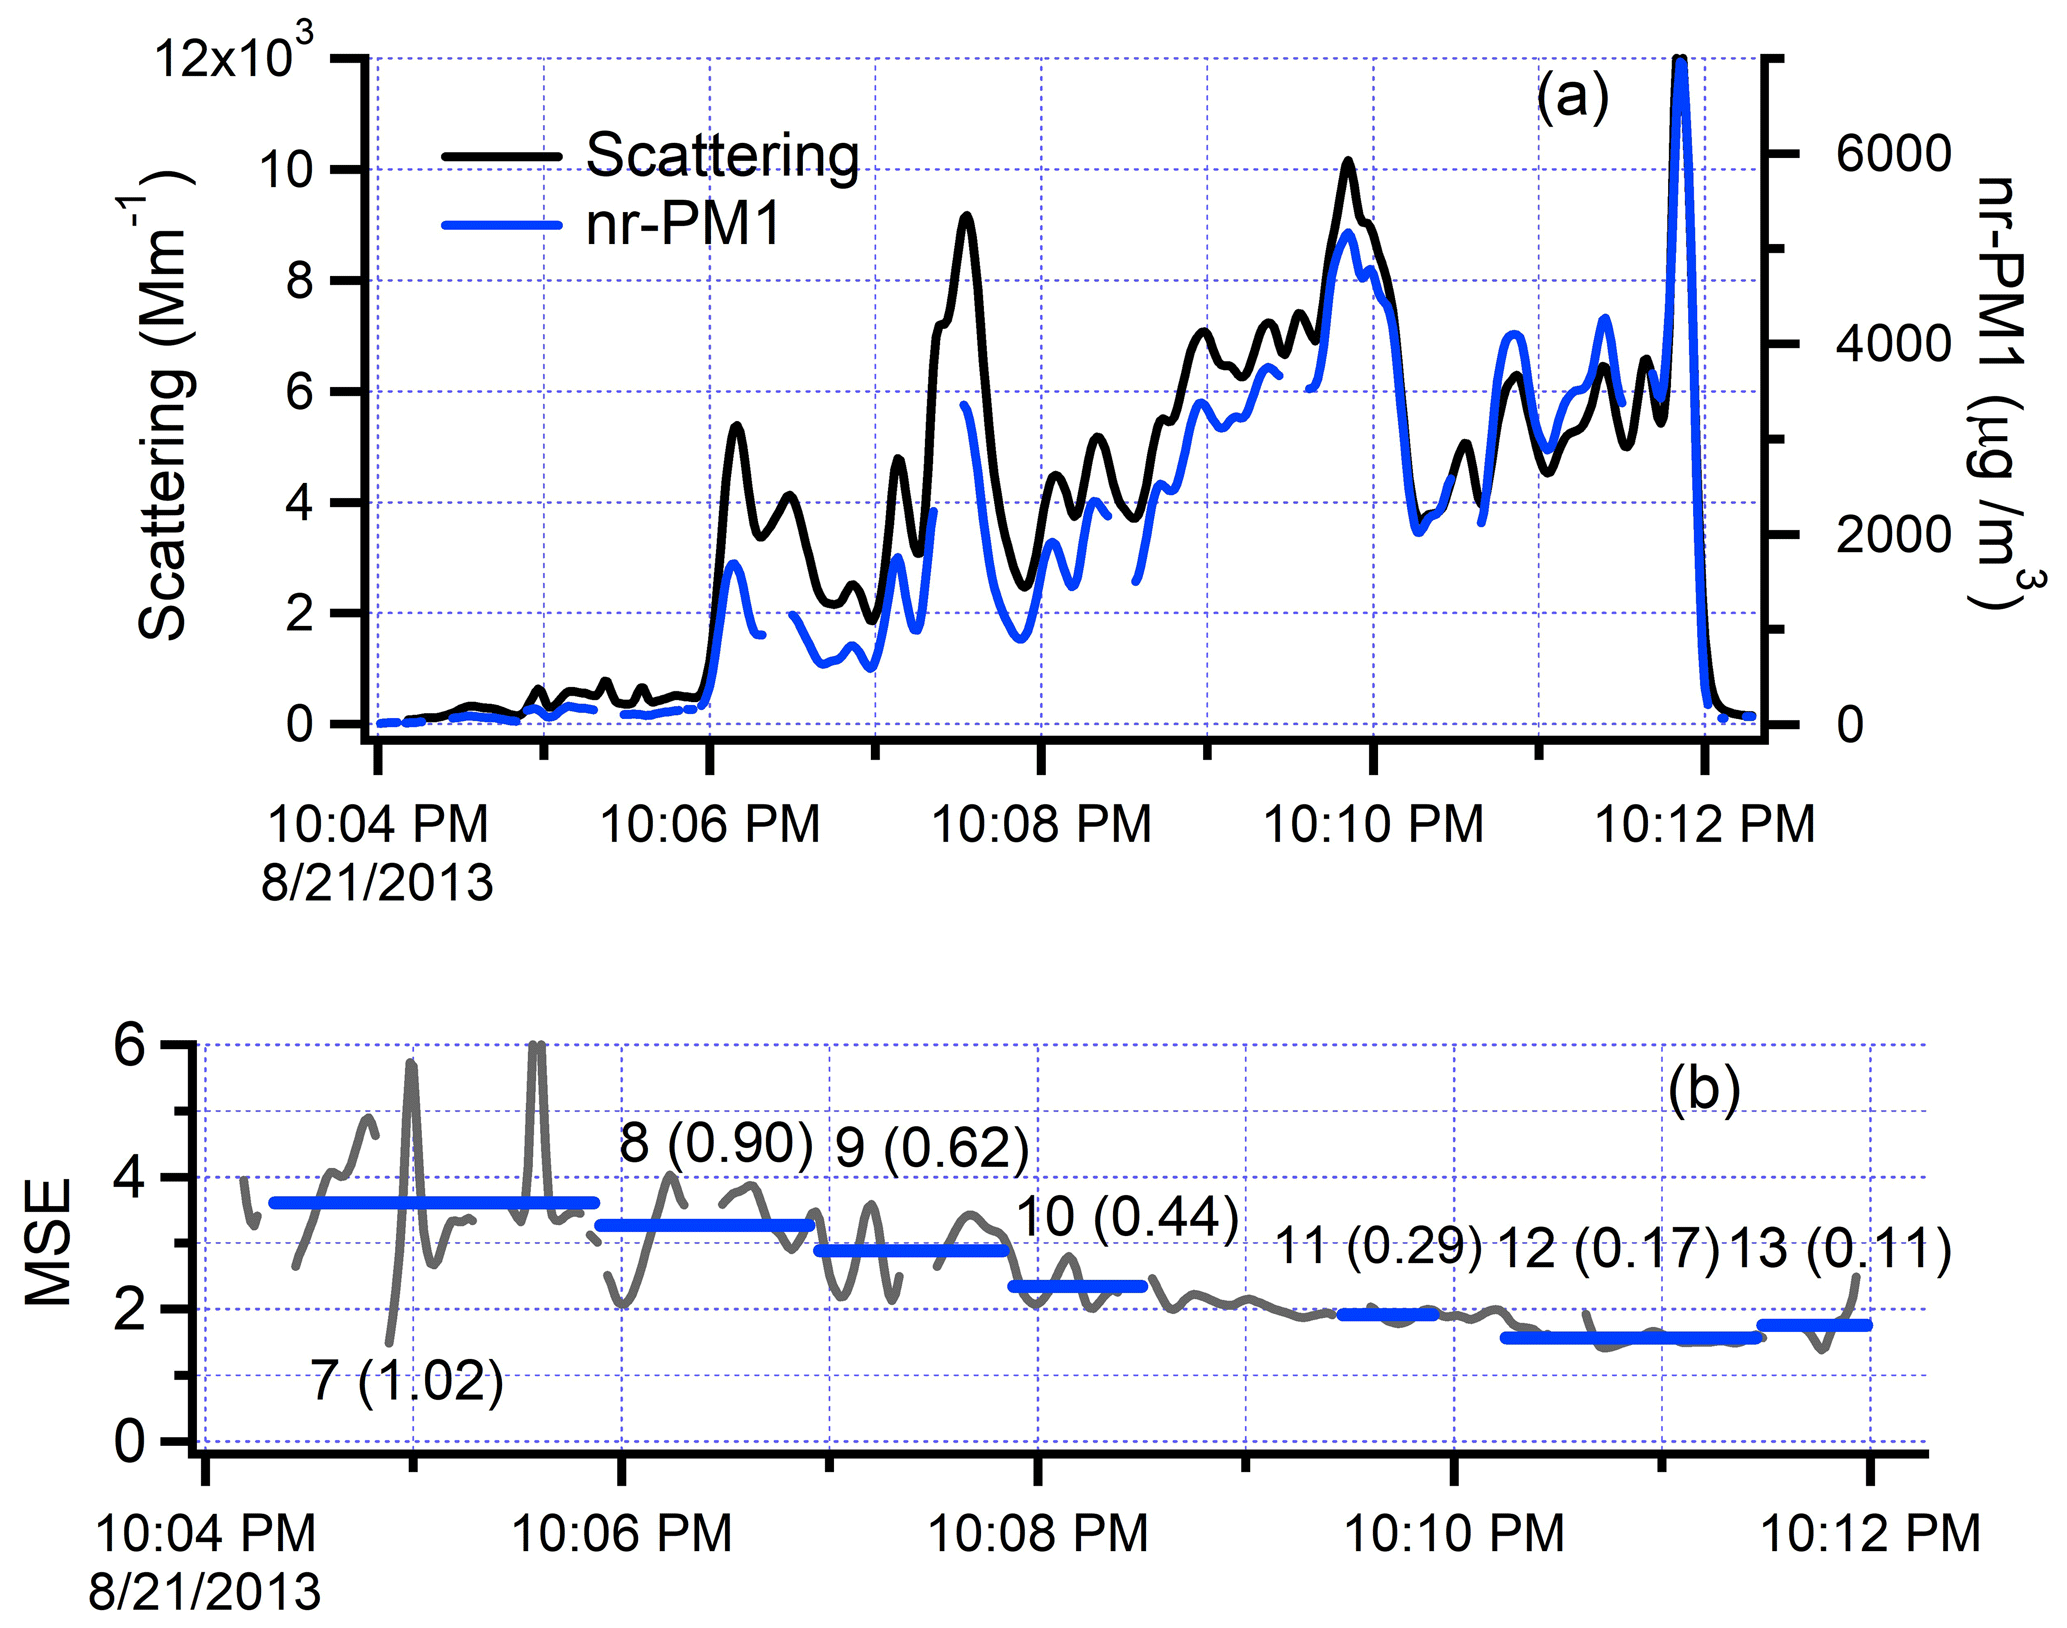
Figure 8Time series from the along-plume segment of flight 821b. The smoke plume is entered 45 km downwind of the fire at 20:04:30 UTC. Time increases to the right as the G-1 approaches the fire front, which is crossed at approximately 20:12 UTC. (a) Scattering and nr-PM1. Data from the nephelometer and SP-AMS have been smoothed with a 6 and 4 s binomial filter, respectively. (b) Continuous MSE (black trace) constructed from data in Fig. 8a. Blue lines are transect-average values. Labels refer to transect numbers shown in Fig. 7 with corresponding photochemical age in parentheses.
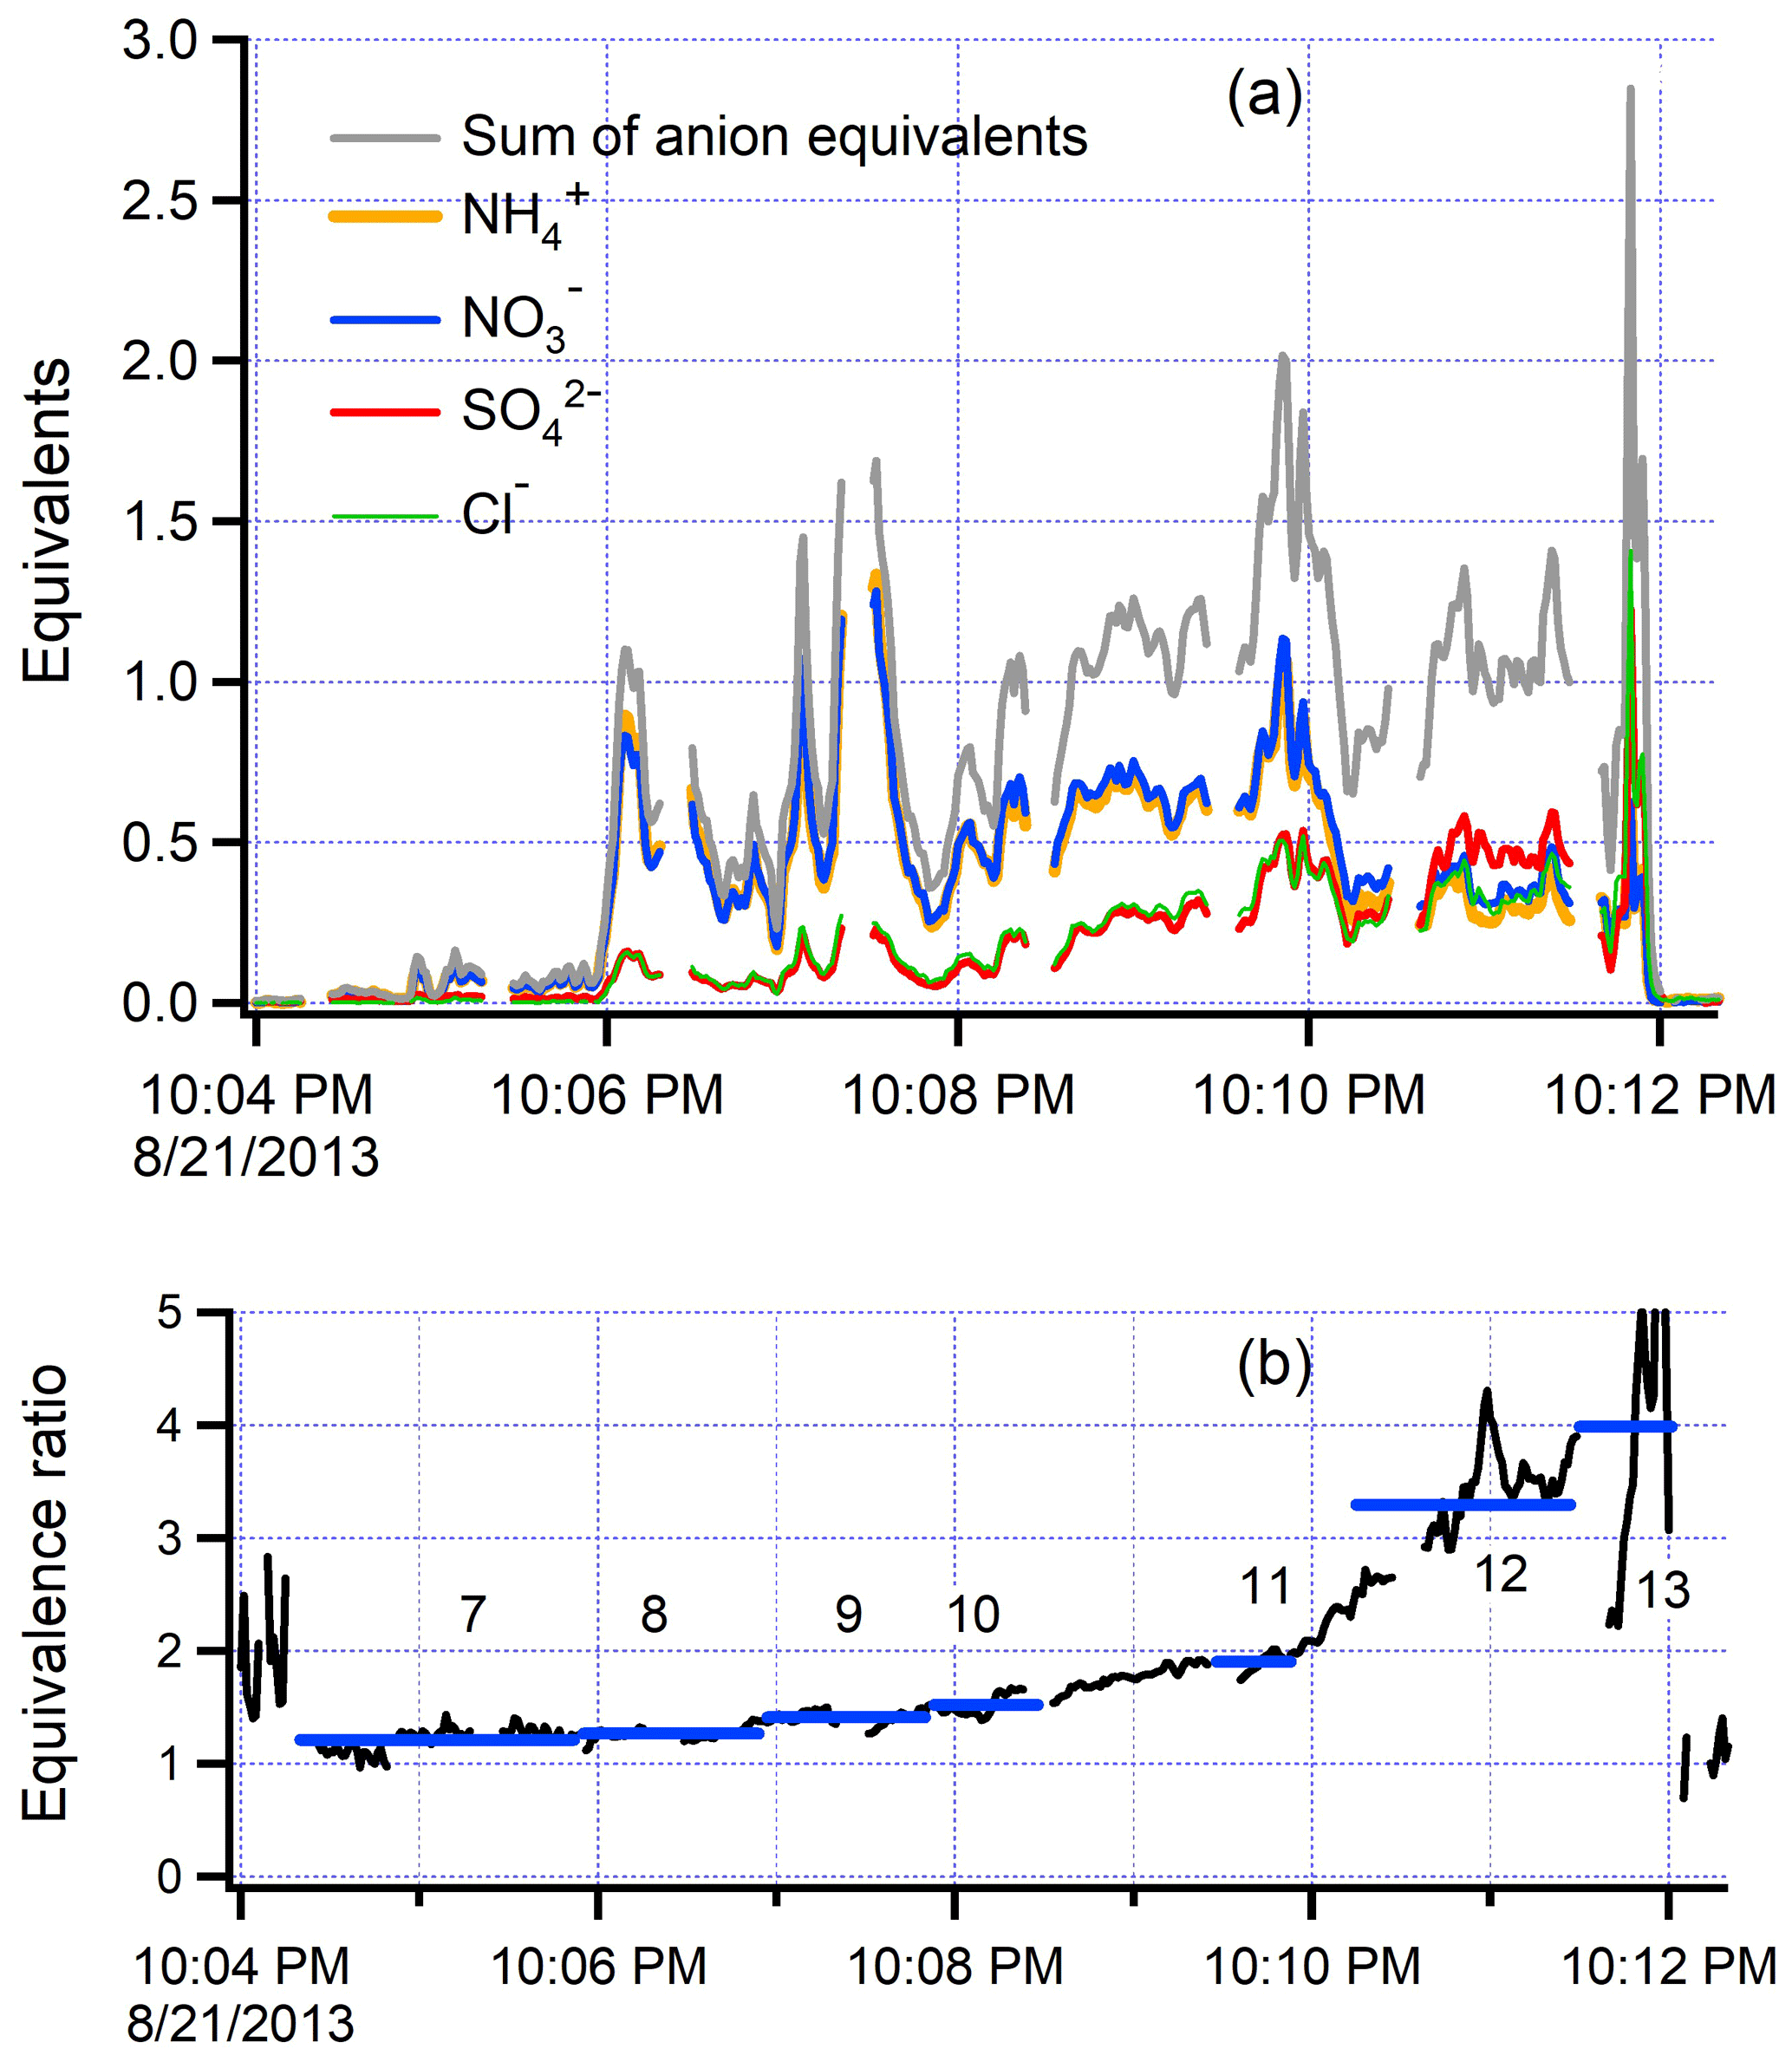
Figure 9(a) Time series for inorganic species from the along-plume segment of flight 821b. Similar format to Fig. 8. Equivalents are equal to species molecular weight divided by charge. Sum of anion equivalents consists of , , and Cl. (b) Equivalence ratio = (NO3 + Cl)/. In the frame of the moving plume, the newly emitted smoke (transect 13) has an equivalence ratio of 4. The equivalence ratio steadily decreases, nearly reaching a value of 1.0 at the end of the along-plume flight segment (transect 7). Values outside of the plume are at much lower concentration and susceptible to error from background subtraction.
Table 5Flight averages for fresh and aged transects∗.
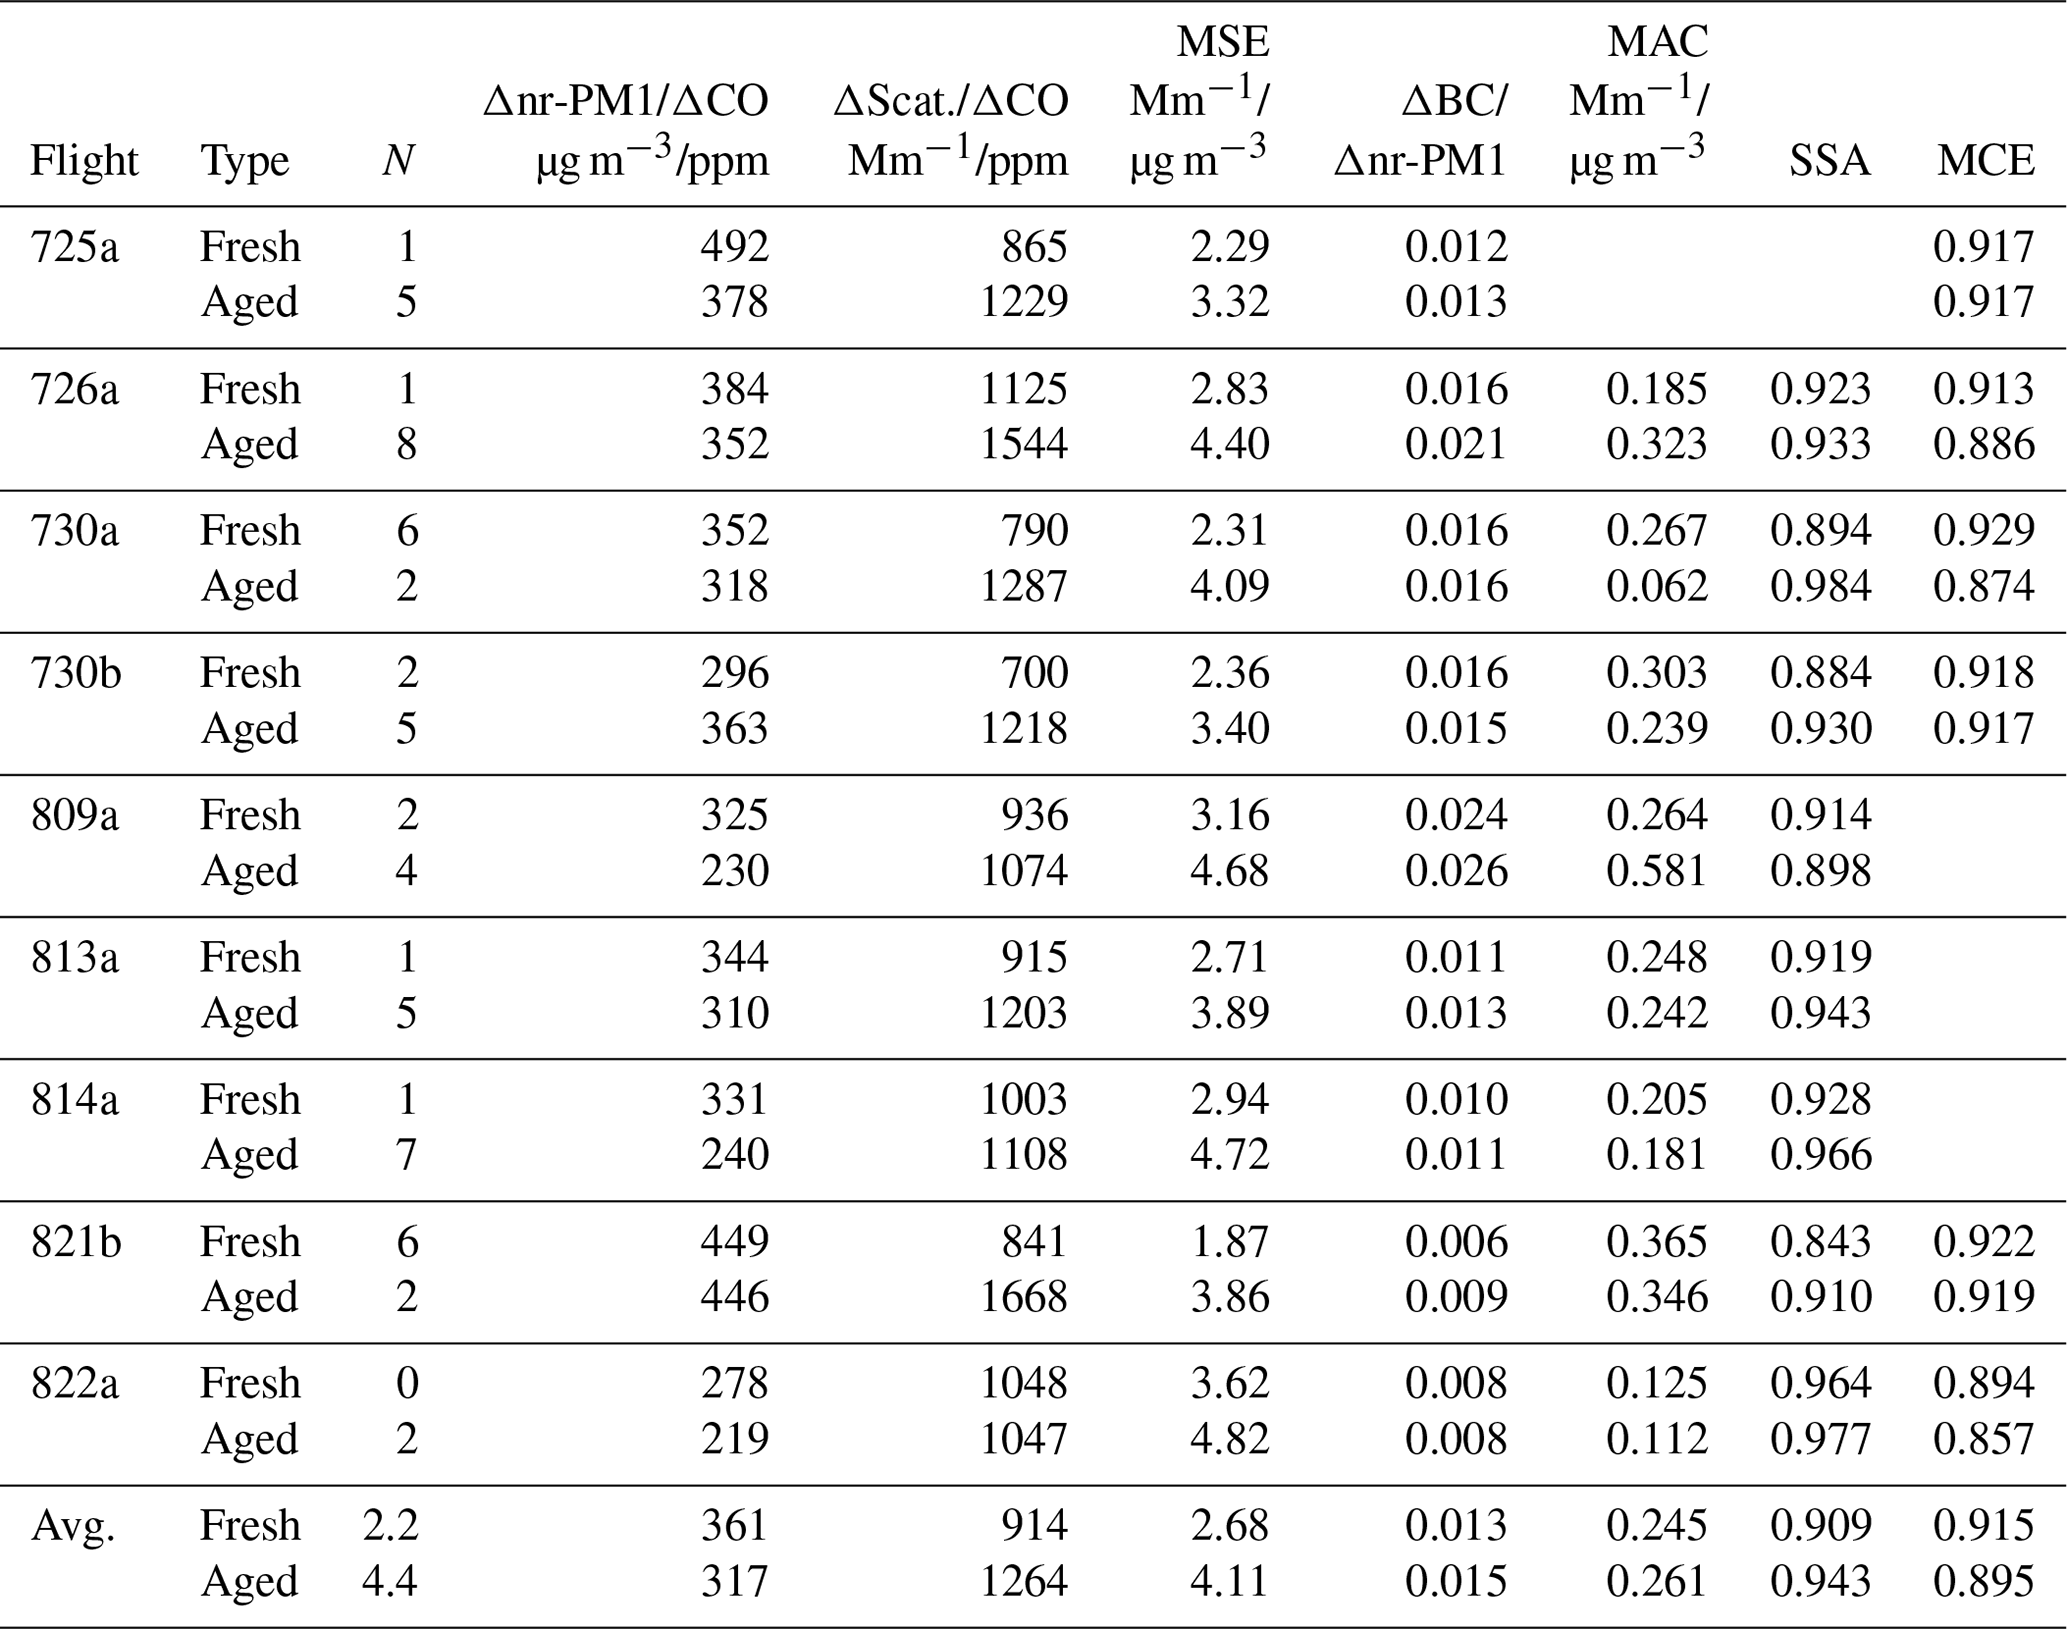
∗ Properties of fresh and aged smoke are determined from linear least squares fit of transect data as a function of age, evaluated at age = 0.2 and 1.0, respectively. For the purpose of categorizing the number of transects in fresh and aged smoke, fresh smoke has a photochemical age lower than 0.3 and aged smoke has a photochemical age = 0.8–1.2. Each flight has equal weight on average.
Highest aerosol and trace gas concentrations are observed on transects 1 and 8. There are short-duration spikes in which ultra-fine particle concentrations (determined from the difference between CPC3025 and CPC3010 measurements) are nearly 106 cm−3 and aerosol mass changes by more than 50 % in 1 s. Transects 2, 7, and 9 are 30 min downwind of transects 1 and 8. The extra 30 min of aging allows coagulation to reduce the fraction of particles in the ultra-fine mode by more than a factor of 5, eliminates sharp gradients in concentration, and causes an increase in photochemical age from 0.2 to 0.35. On that basis, it appears that transects 2, 7, and 8 are downwind of the main fire region. However, MODIS indicates thermal anomalies downwind of transects 1 and 8 (see Fig. 3). We cannot dismiss the possibility that the leading edge of the active burning region extends to nominal downwind transects, a consideration pertinent to other flights.
Time series data for nr-PM1, Cl, CO, and scattering are displayed in Fig. 5. Peak heights of the conservative tracer CO (and the non-conservative quantities, nr-PM1, Cl, and scattering) decrease with distance as the plume becomes wider. As downwind distance and photochemical age increase, the traces in Fig. 5b diverge, indicating that the ratio of scattering to CO increases. An increase in scattering/CO and MSE with age is a general feature of the wildfires studied.
In basing our analysis of plume evolution on wide cross-plume averages, we are ignoring smaller-scale structure, some of which corresponds to non-contiguous pixels of FRE seen in ground-track figures. For flight 730b most transects encompass two fire regions separated by tens of kilometers. One fire region is to the north and one to the south of the dashed line in Fig. 3. A plot of Cl vs. nr-PM1 in Fig. 6 (or a comparison of plots in Fig. 5a) shows that aerosol from the South fire has a Cl/nr-PM1 fraction of ∼ 2.5 %, compared with 0.3 % in the north. At the more downwind transects these two plumes overlap, giving intermediate ratios. Differences in Cl fraction are due to fuel type, with the higher Cl fraction characteristic of grassland fires (Stockwell et al., 2014). Other fire properties vary between north and south. Onasch et al. (2018) have shown that the low Cl plume has a higher O-to-C ratio (0.37 vs. 0.31). The caption to Fig. 5 points out a higher scattering efficiency relative to CO in the low Cl plume. The Colockum Tarps fire on flights 730a and 809a and the Mile Marker 28 fire on flights 725a and 726a also had a bimodal Cl to total nr-aerosol ratio.
4.2.2 Flight 821b
Concentrations of gases and aerosols sampled from the Government Flats fire on the flight 821b were a factor of 2 higher than observed in other wildfires. The ground track shown in Fig. 7 was a combination of cross-plume traverses and an along-plume segment in which the G-1 travelled against the wind, 45 km toward the fire line.
Time sequences of scattering and nr-PM1 measured on the along-plume flight segment are shown in Fig. 8a. MSE, which is the ratio of these quantities, is given in Fig. 8b as a continuous function and averaged over each of seven transects. The along-plume flight segment starts at 10:04:00 in dilute smoke. Though not readily apparent given the scale of the figure, a plume signature is seen in CO, scattering, and nr-PM1, which are 360 ppb, 403 Mm−1, and 114 µg m−3, respectively, averaged over transect 7. At 10:06 there is a transition to a higher-concentration plume region which encompasses transects 8–13. Between 10:11:50 and 10:11:51, a plume boundary is crossed into much cleaner air. Scattering and nr-PM1 increase between 10:04:00 and 10:11:50, but not monotonically, as the path of the G-1 is not consistently oriented along the path of a hypothetical, non-meandering point source plume. The along-plume flight segment is crossed by transects 1–6, 14, and 15; variability in the cross-plume direction is discussed extensively by Hodshire et al. (2020); two-dimensional maps of optical properties from MISR retrievals are given by Noyes et al. (2020).
From Fig. 8a, one can see that the ratio of scattering to nr-PM1 increases with downwind distance (decreasing clock time). For the purpose of illustration, Fig. 8b presents continuous values for MSE generated from the smoothed data in Fig. 8a (see figure caption). Without smoothing, 1 Hz MSE is too noisy to be useful. In order to bypass such difficulties, we determine transect averages as in Eqs. (2) and (3). According to the transect-average values in Fig. 8b, MSE increases from 1.9 to 3.6 as plume age changes from 0.12 to 1.0.
The along-plume flight segment of flight 821b provides an illustration of the time dependence of aerosol neutralization, which we describe in terms of a ratio of equivalents: (Cl+ SO NO3)/. This expression is a simplification as there are other basic anions and acidic cations besides these four measured ions. Also, these anions are not necessarily associated with H+. Figure 9 shows that near-source aerosol has primary sulfate, nitrate, and chloride that are not matched by the uptake of NH3, resulting in an acidic ion balance over most of the plume. There is a steady trend towards neutralization with downwind distance, with an equivalence ratio of 1 nearly reached at the furthermost downwind point of the along-plume transect. For almost all of the along-plume segment, the number of equivalents of is very nearly the same as the number of equivalents of NO3, despite the abundance of and Cl, suggesting that much of the sulfate and chloride is in a non-acidic form (Akagi et al., 2012).
4.3 Aging in wildfire plumes
Transect-average quantities in excess of background, normalized for dilution, are used to determine the evolution of aerosol concentration and optical properties as functions of photochemical age. Quantities considered in this section are Δnr-PM1/ΔCO, Δlight scattering/ΔCO, MSE (Δscattering/Δnr-PM1 mass), BC mass ratio (ΔBC/Δnr-PM1), MAC (Δlight absorption/Δnr-PM1 mass), and SSA (Δscattering/(Δscattering+Δabsorption). The age dependences of these variables for each flight are shown in Figs. 10 and 11. In order to compare flights, we have defined fresh emissions as having an age of 0.2 and aged emissions as having an age of 1.0. This range is spanned (or very nearly so) on eight of nine flights, the exception being 822a with the lowest age of 0.38. Linear least squares fits provide values at the fresh and aged limits. Comparisons between individual data points and the least squares fits in Figs. 10–11 show, in general, that the fresh and aged points give a good representation of trends. Properties of fresh and aged emissions are collected in Table 5. Changes due to aging are given by (XAged–XFresh)∕XFresh in Table 6.
Table 6Percent change, 100 (XAged-XFresh)∕XFresh, between aged and fresh emissions.

∗ Percent changes in SSA are small because values of SSA are close to one. Averaged over the eight flights with data, aging causes the difference between the SSA of fresh smoke and unity to decrease by more than a factor of 2.
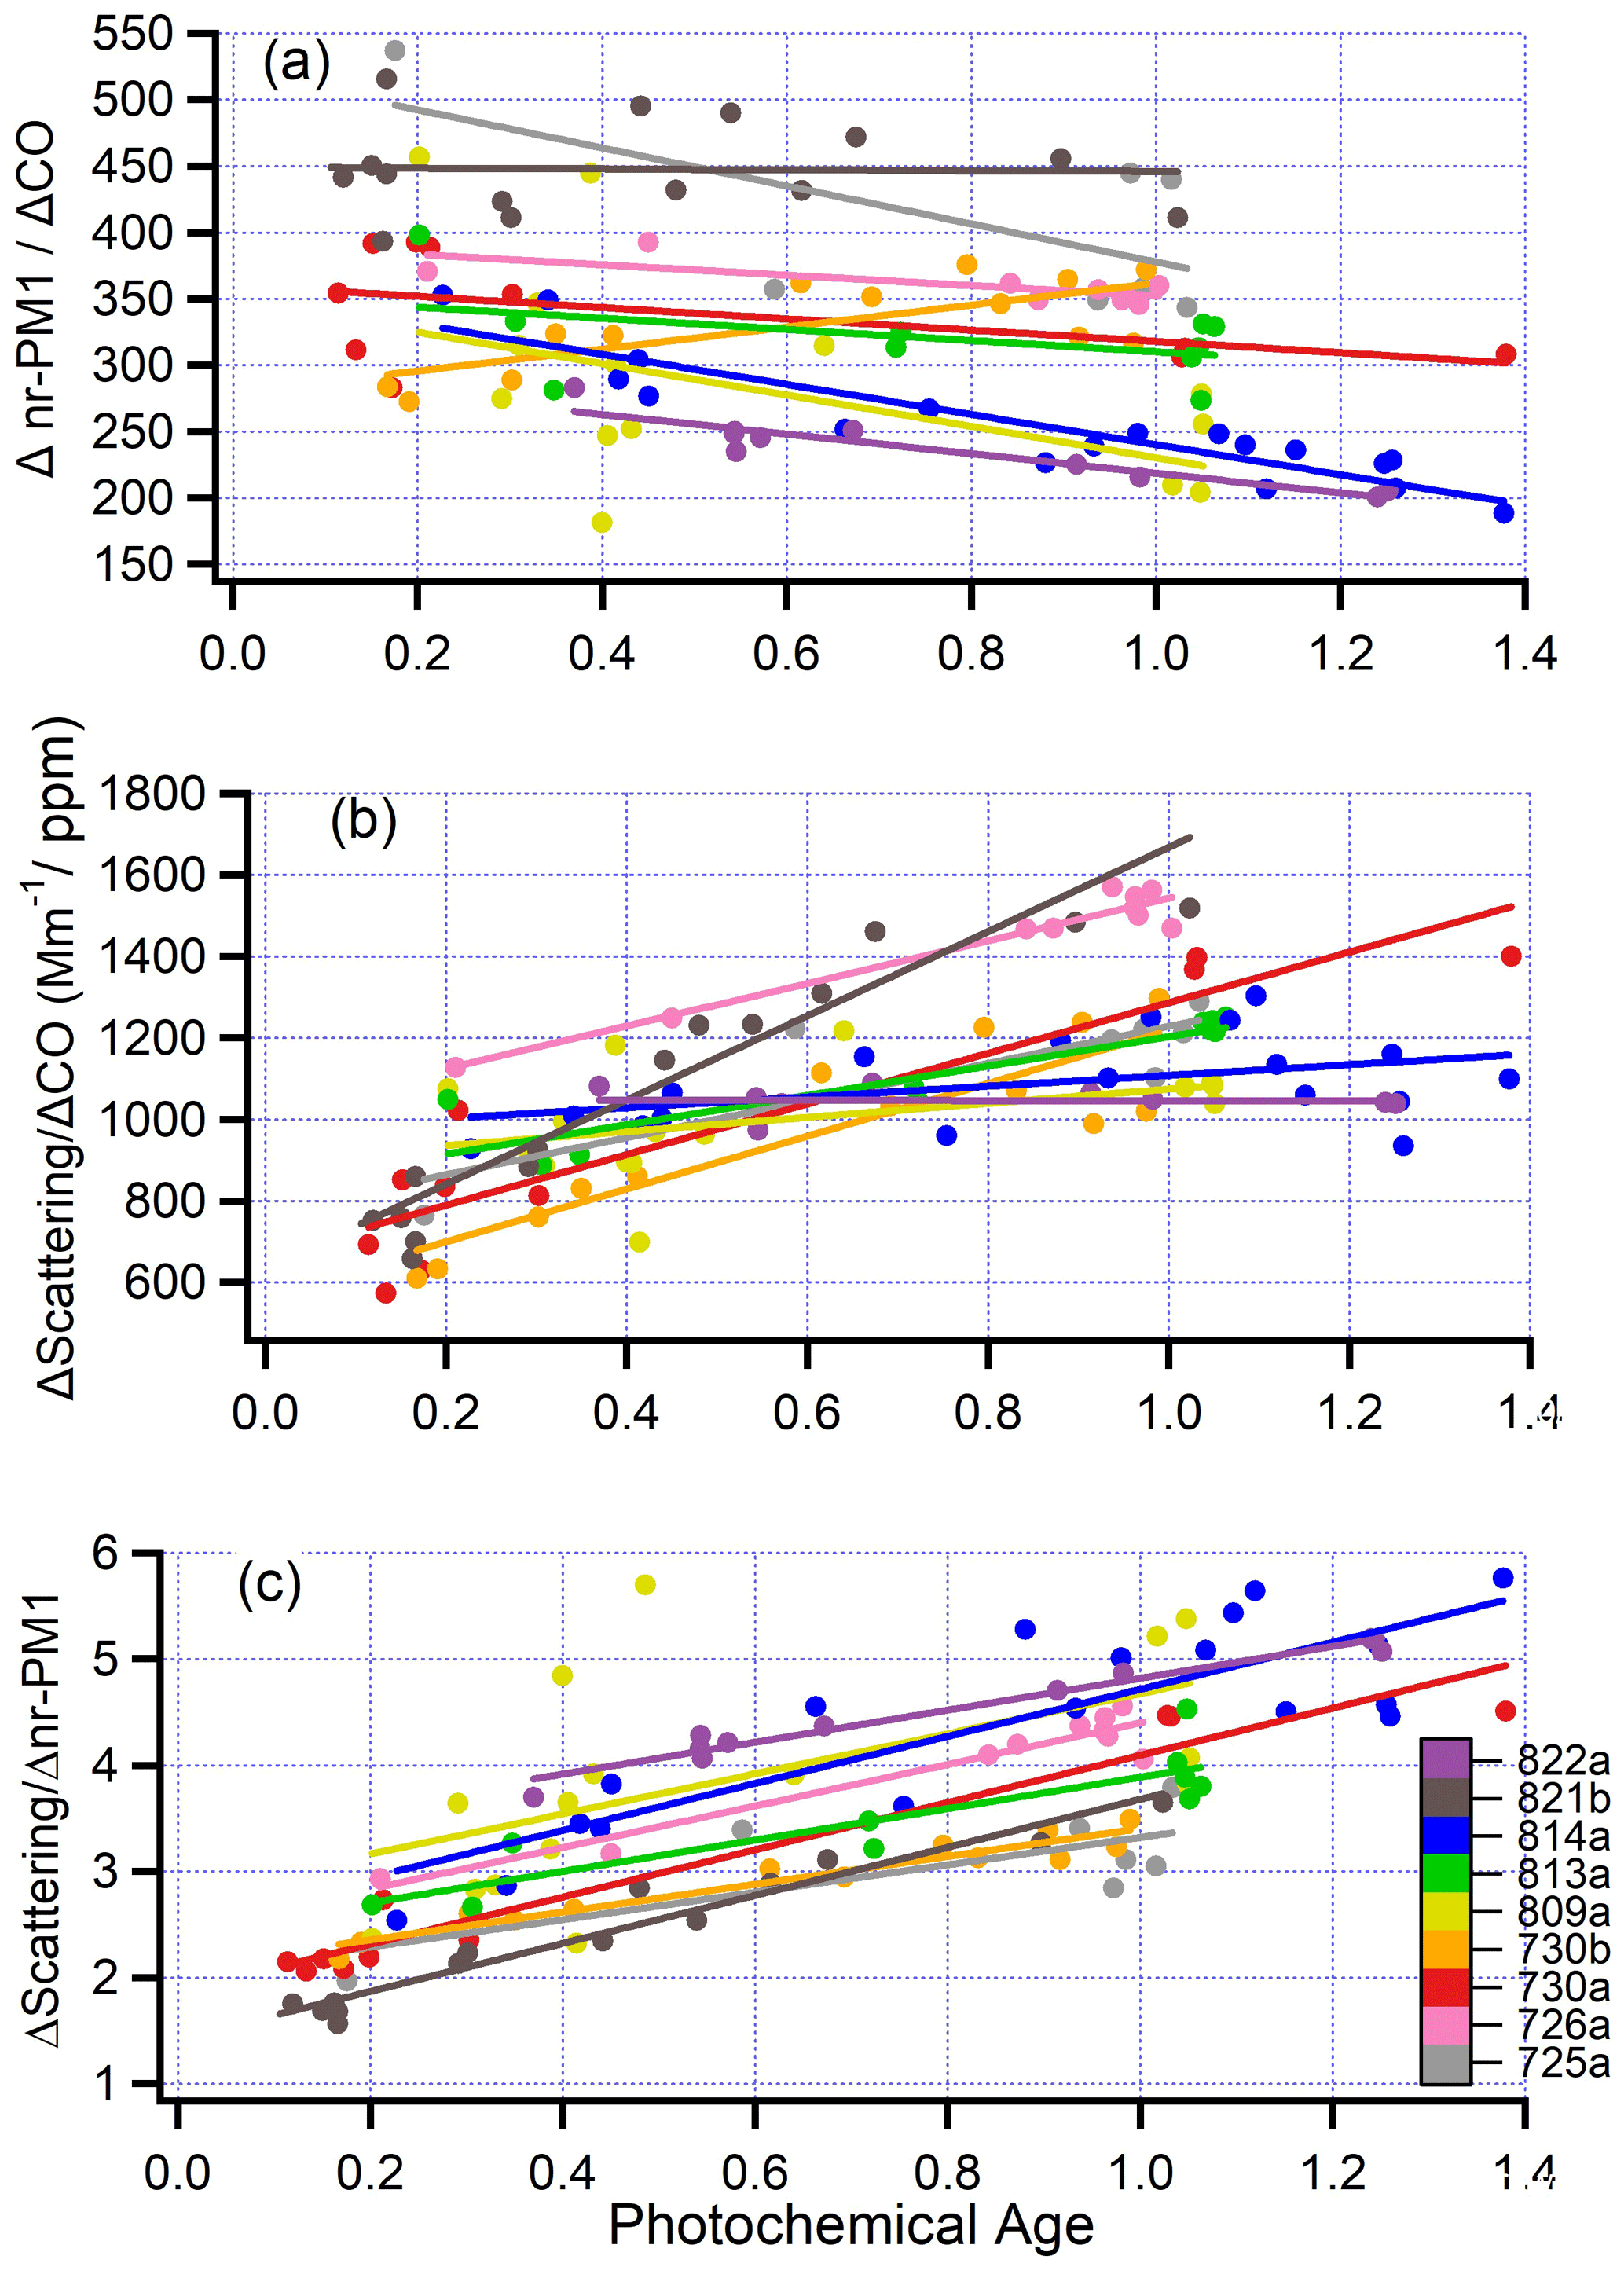
Figure 10(a) nr-PM1, normalized by CO (µg/m3 aerosol per ppm CO) as a function of photochemical age for nine pseudo-Lagrangian flights. Photochemical age for flights 809a and 813a has been determined from the relation between distance and age shown in Fig. 2. All variables are excess values with background subtracted. Each data point is a plume transect. Straight lines are ordinary least squares linear fits for each flight. (b) Scattering at 550 nm normalized by CO as a function of photochemical age for nine flights. (c) Mass scattering efficiency (m2 g−1) at 550 nm as a function of photochemical age for nine flights.
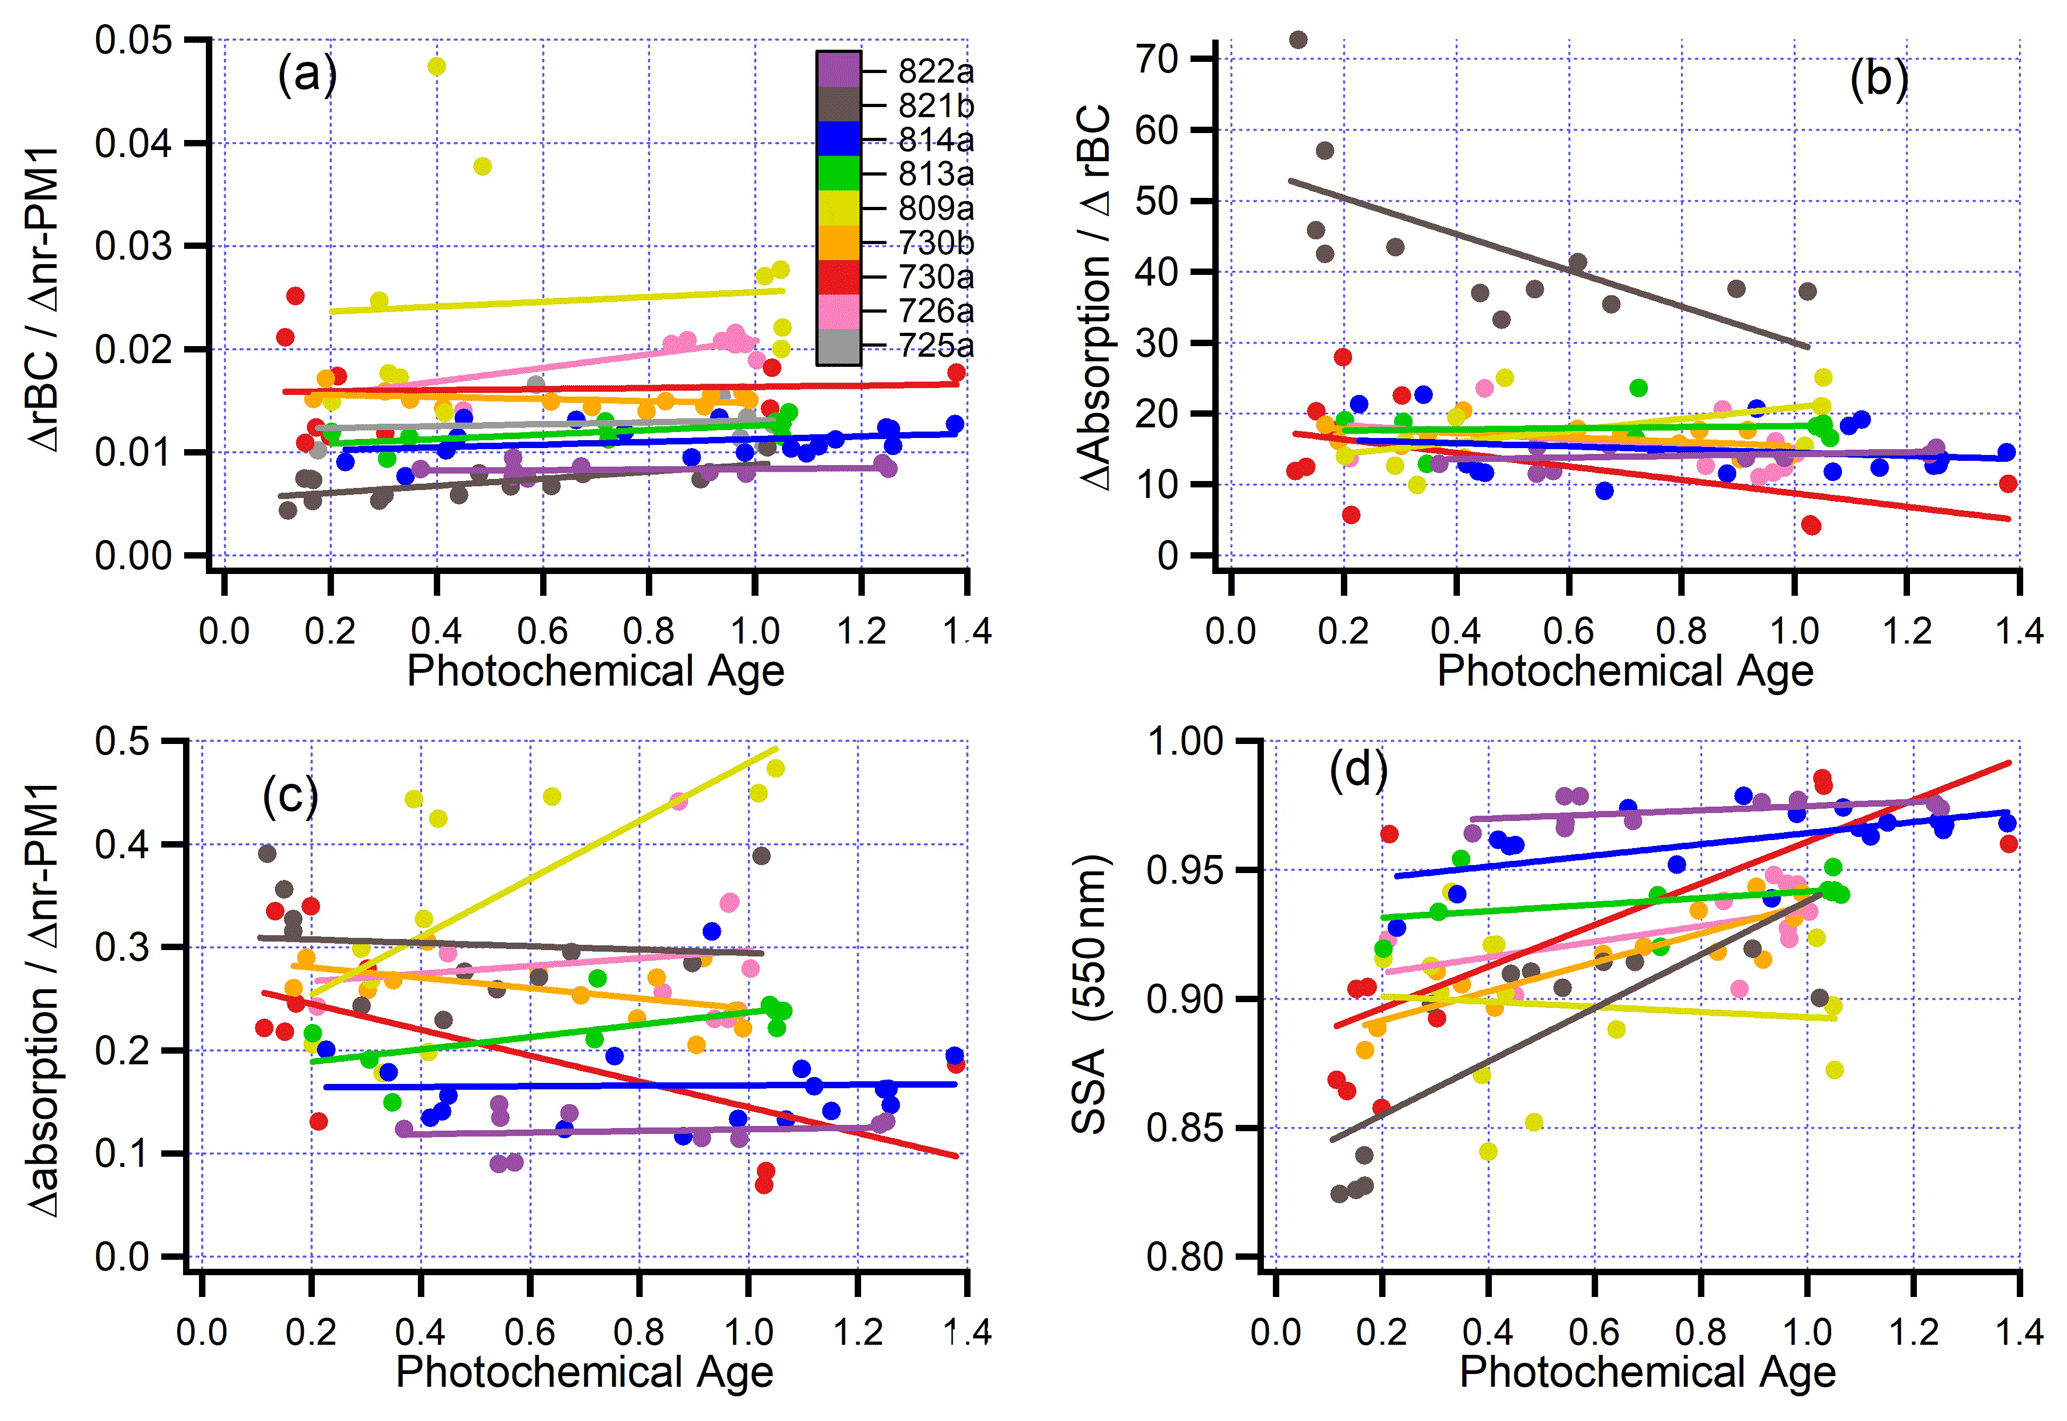
Figure 11Ratios of excess plume variables as a function of photochemical age. (a) rBC/nr-PM1; (b) absorption/rBC (m2 g−1); (c) absorption/nr-PM1 (m2 g−1); (d) single scatter albedo at 550 nm. Panels b, c, and d do not include flight 725a because of missing PTI-absorption measurements. Format same as Fig. 10.
On the nine pseudo-Lagrangian flights, aerosol mass normalized by CO, Δnr-PM1∕ΔCO, varies between a 22 % increase and a 29 % decrease. The average change is a 12 % decrease with a 1-σ standard deviation (16 %) that encompasses no net aerosol production. Figure 10b shows scattering normalized to CO as a function of photochemical age. According to the summary in Table 6, the aging change in normalized scattering ranges from constant to nearly doubling, with a nine-flight average equal to a 41 % increase. As, on average, there is no increase in nr-aerosol mass with age, the normalized scattering increase is not due to more aerosol; rather, it is due to a time evolution in aerosol microphysics. Figure 10c shows the time evolution of scattering per unit of nr-aerosol mass. MSE increases with photochemical age for all nine flights; the average increase is 56 % with a standard deviation of 20 % and range 33 % to 97 %.
Figure 11c indicates that on seven of nine flights, absorption per unit mass of aerosol is either independent of or decreases slightly with age. A nearly constant absorption is consistent with results presented by Sedlacek et al. (2018a) and much like the observations of Forrister et al. (2015), which extend to longer time periods. Changes in SSA with atmospheric processing (Fig. 11d) are therefore controlled by the increase in scattering as the plume ages (Fig. 10c). The lowest SSAs observed were 0.8 to 0.85 in fresh smoke. As the plume ages for 2–3 h, SSAs are 0.9 to 0.98. SSAs retrieved from MISR satellite measurements show similar age trends for the Colockum Tarps and Government Flats fires (Noyes et al., 2020). In the latter case, a MISR overpass, 2 h before our aircraft sampling, showed that SSA increases from < 0.84 near the source to 0.92 at our most downwind transects, further increasing to 0.98 with additional distance, in excellent agreement with Fig. 11d.
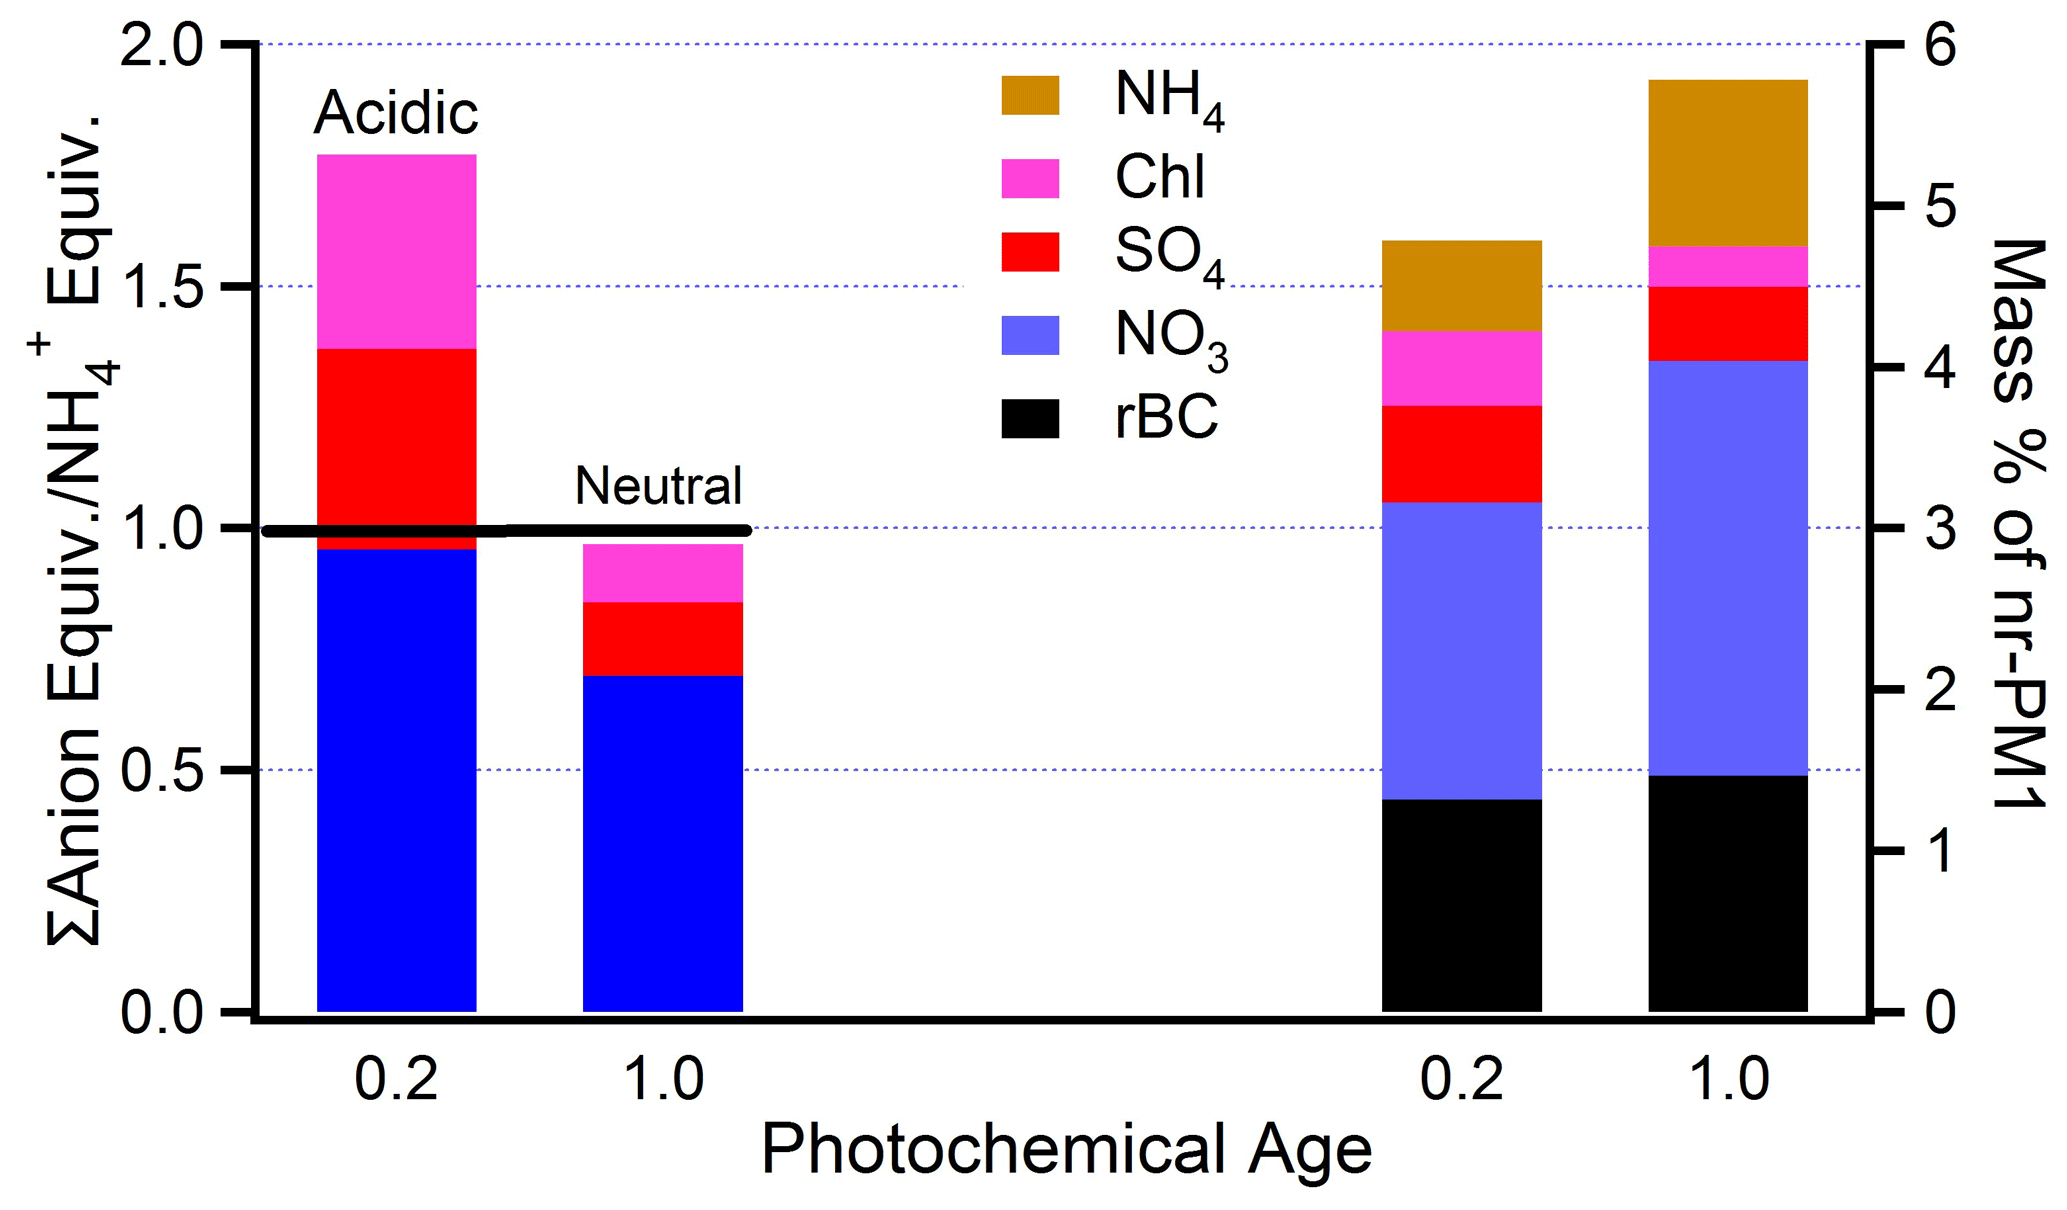
Figure 12Inorganic composition of fresh and aged BB aerosol (photochemical age = 0.2 and 1.0, respectively) averaged over nine flights. On the left equivalence ratios of cations relative to . On the right mass ratios relative to nr-PM1. The difference between the stacked bars on the right and 100 % is organic aerosol.
4.4 Aerosol composition
Age-related changes in the chemical composition of BB aerosol are presented here in terms of the fractional contribution of black carbon, organic compounds, and inorganic ions (Δ, ΔCl−, ΔNO, and ΔSO to transect-averaged Δnr-PM1. Organic compounds are characterized by the fraction of organic mass at , 44, and 60, (f43, f44, and f60 respectively) and by the elemental ratios O to C and H to C (O:C and H:C, respectively). Figures S9–S10 of the Supplement show these quantities as a function of photochemical age. In describing the organic aerosol, we make use of a body of work that shows that aerosol properties depend on values of f44 vs. f43 (e.g., triangle plots of Ng et al., 2011) and values of O:C vs. H:C (e.g., Van Krevelen diagrams used by Heald et al., 2010, and Ng et al., 2011).
4.4.1 rBC and inorganics
Aerosol composition measurements for fresh and aged BB aerosol are summarized in Fig. 12. In every transect, more than 90 % of aerosol mass is OA. Flight-averaged rBC is between 0.5 and 2.5 % of nr-PM1. On average, the mass fraction of rBC in aged smoke is 11 % higher than in fresh emissions (Fig. 12). This increase is consistent with a constant amount of rBC as the concentration of nr-PM1 decreases by very nearly the same amount (12 %, Table 6) relative to CO. Aging yields a change in ΔrBC/ΔCO of 0.5 %. There is a 1-σ standard deviation of 21 %, which is due to uncertainty of our methodology (i.e., fire inhomogeneities, uncertain backgrounds) and measurement uncertainties in CO and rBC. Inorganic species constitute less than 10 % of nr-PM1. Differences between fires are comparable to the differences between fresh and aged emissions. In the 730b case study Cl differed by about an order of magnitude according to fuel type. It is likely that primary Cl is in the form of non-volatile KCl, and the decrease in Cl reflects the formation and volatility of HCl (Akagi et al., 2012). On most flights SO decreases with age, but the correlations are poor. An increase is expected from oxidation of SO2 (Yokelson et al., 2009; Akagi et al., 2012). SO2 emission factors measured on flights 730a and 730b are given by Liu et al. (2016). NO3 and increase with age (Fig. S9). Increases in NO3 would occur from the formation and partitioning of HNO3 to the aerosol phase.
Figure 12 shows that the nine-flight average acidity follows the aging pattern seen on flight 821b (Fig. 9b). Fresh emissions are acidic, with NO3 equivalent to , despite the presence of and Cl. The same caveats apply regarding a description of acidity in terms of the four ions readily quantified by the AMS.
4.4.2 Organic aerosol
The speciation of organic compounds is expected to vary with age as primary compounds are lost by evaporation or transformed by aerosol-phase chemistry. The later pathway includes the transformations that convert primary organics to TBs (Adachi et al., 2019). As a plume ages, gas-phase oxidation of VOCs creates less-volatile products which partition to the aerosol phase as SOA. Though organic mass is on average constant in BBOP, the constituent species become more oxidized and viscous with age. Transect-average H-to-C and O-to-C ratios (H:C and O:C, respectively) observed in nine wildfire flights are depicted by a Van Krevelen plot in Fig. 13. Isolines of OSc, the average carbon oxidation state, defined to good approximation as OSc = 2 O:C − H:C (Kroll et al., 2011), indicate, in each flight, an increase in carbon oxidation state with photochemical age. For the nine BBOP flights, slopes in the Van Krevelen plots vary from near zero to −1 (average value ), implying flight-to-flight variability in the predominant oxidation mechanism and products. For example, aerosol would age with a slope of zero if oxidation proceeded by adding OH or OOH moieties, a slope of by formation of a carboxylic acid with fragmentation and a slope of −1 by the addition of a carboxylic acid without fragmentation. Adachi et al. (2019) used scanning transmission X-ray spectroscopy and electron energy loss spectrometry analysis to show that the formation of TBs is accompanied by an increase in carboxylic acids.
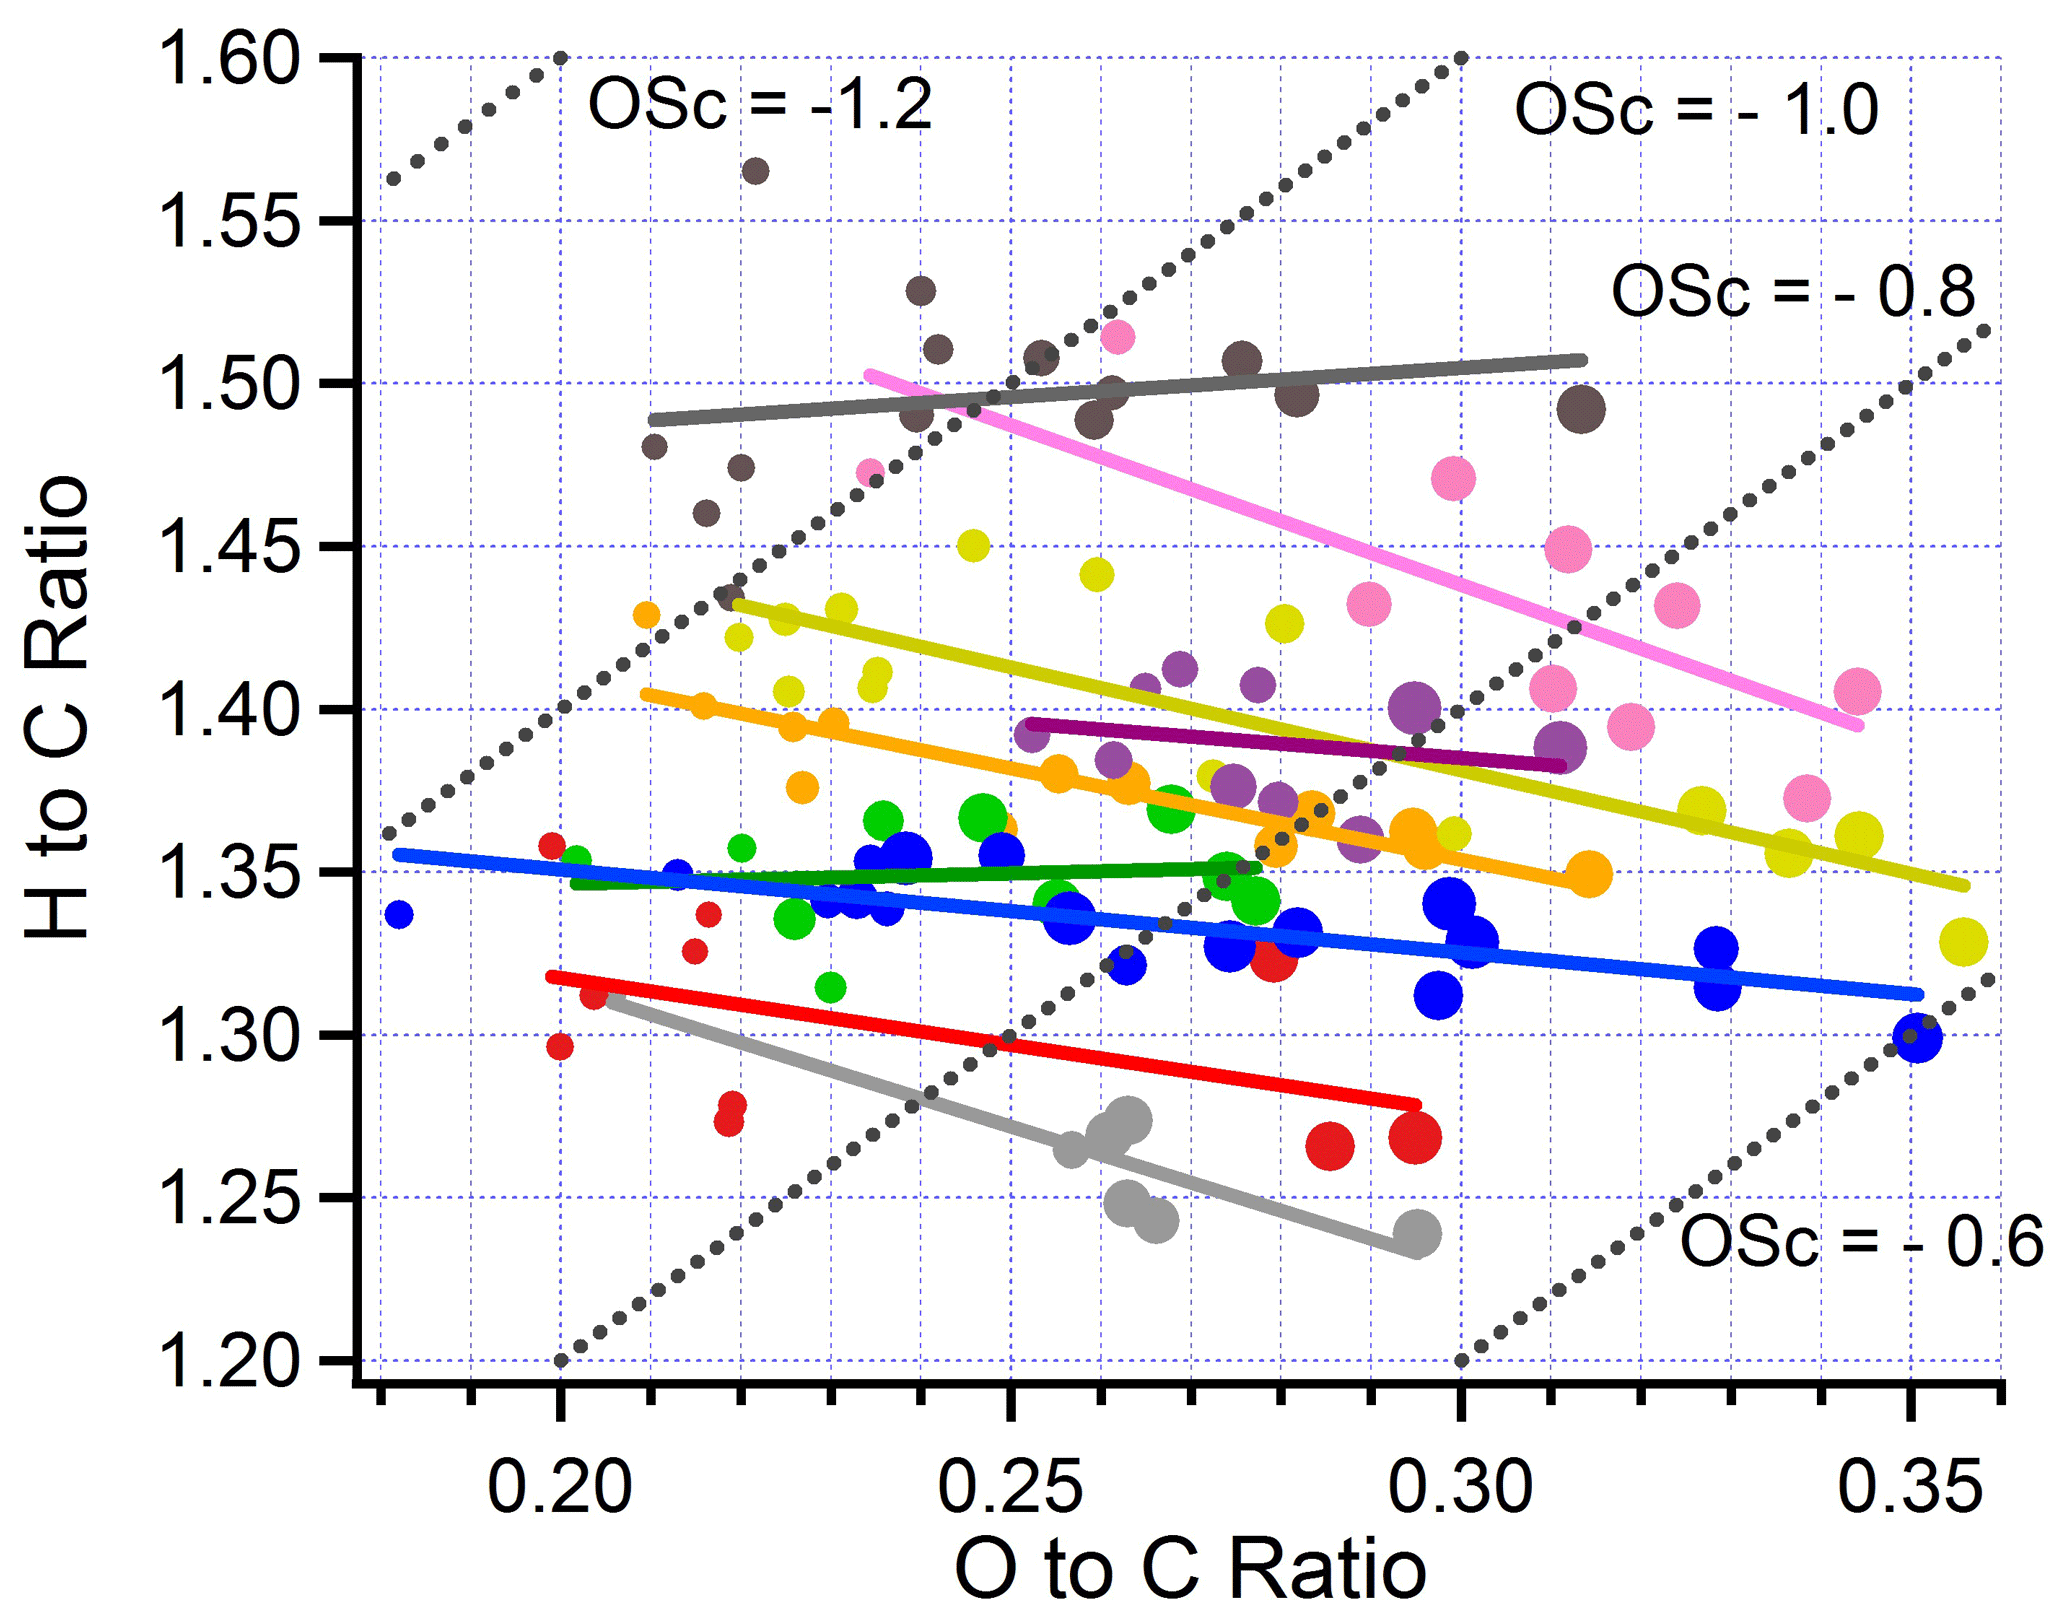
Figure 13Van Krevelen diagram. Size of symbol linearly proportional to photochemical age. Dotted lines show H:C and O:C corresponding to labelled values of carbon oxidation state (OSc). Color code for flights same as in Fig. 11. Solid lines are linear least squares fit to data points in corresponding color.
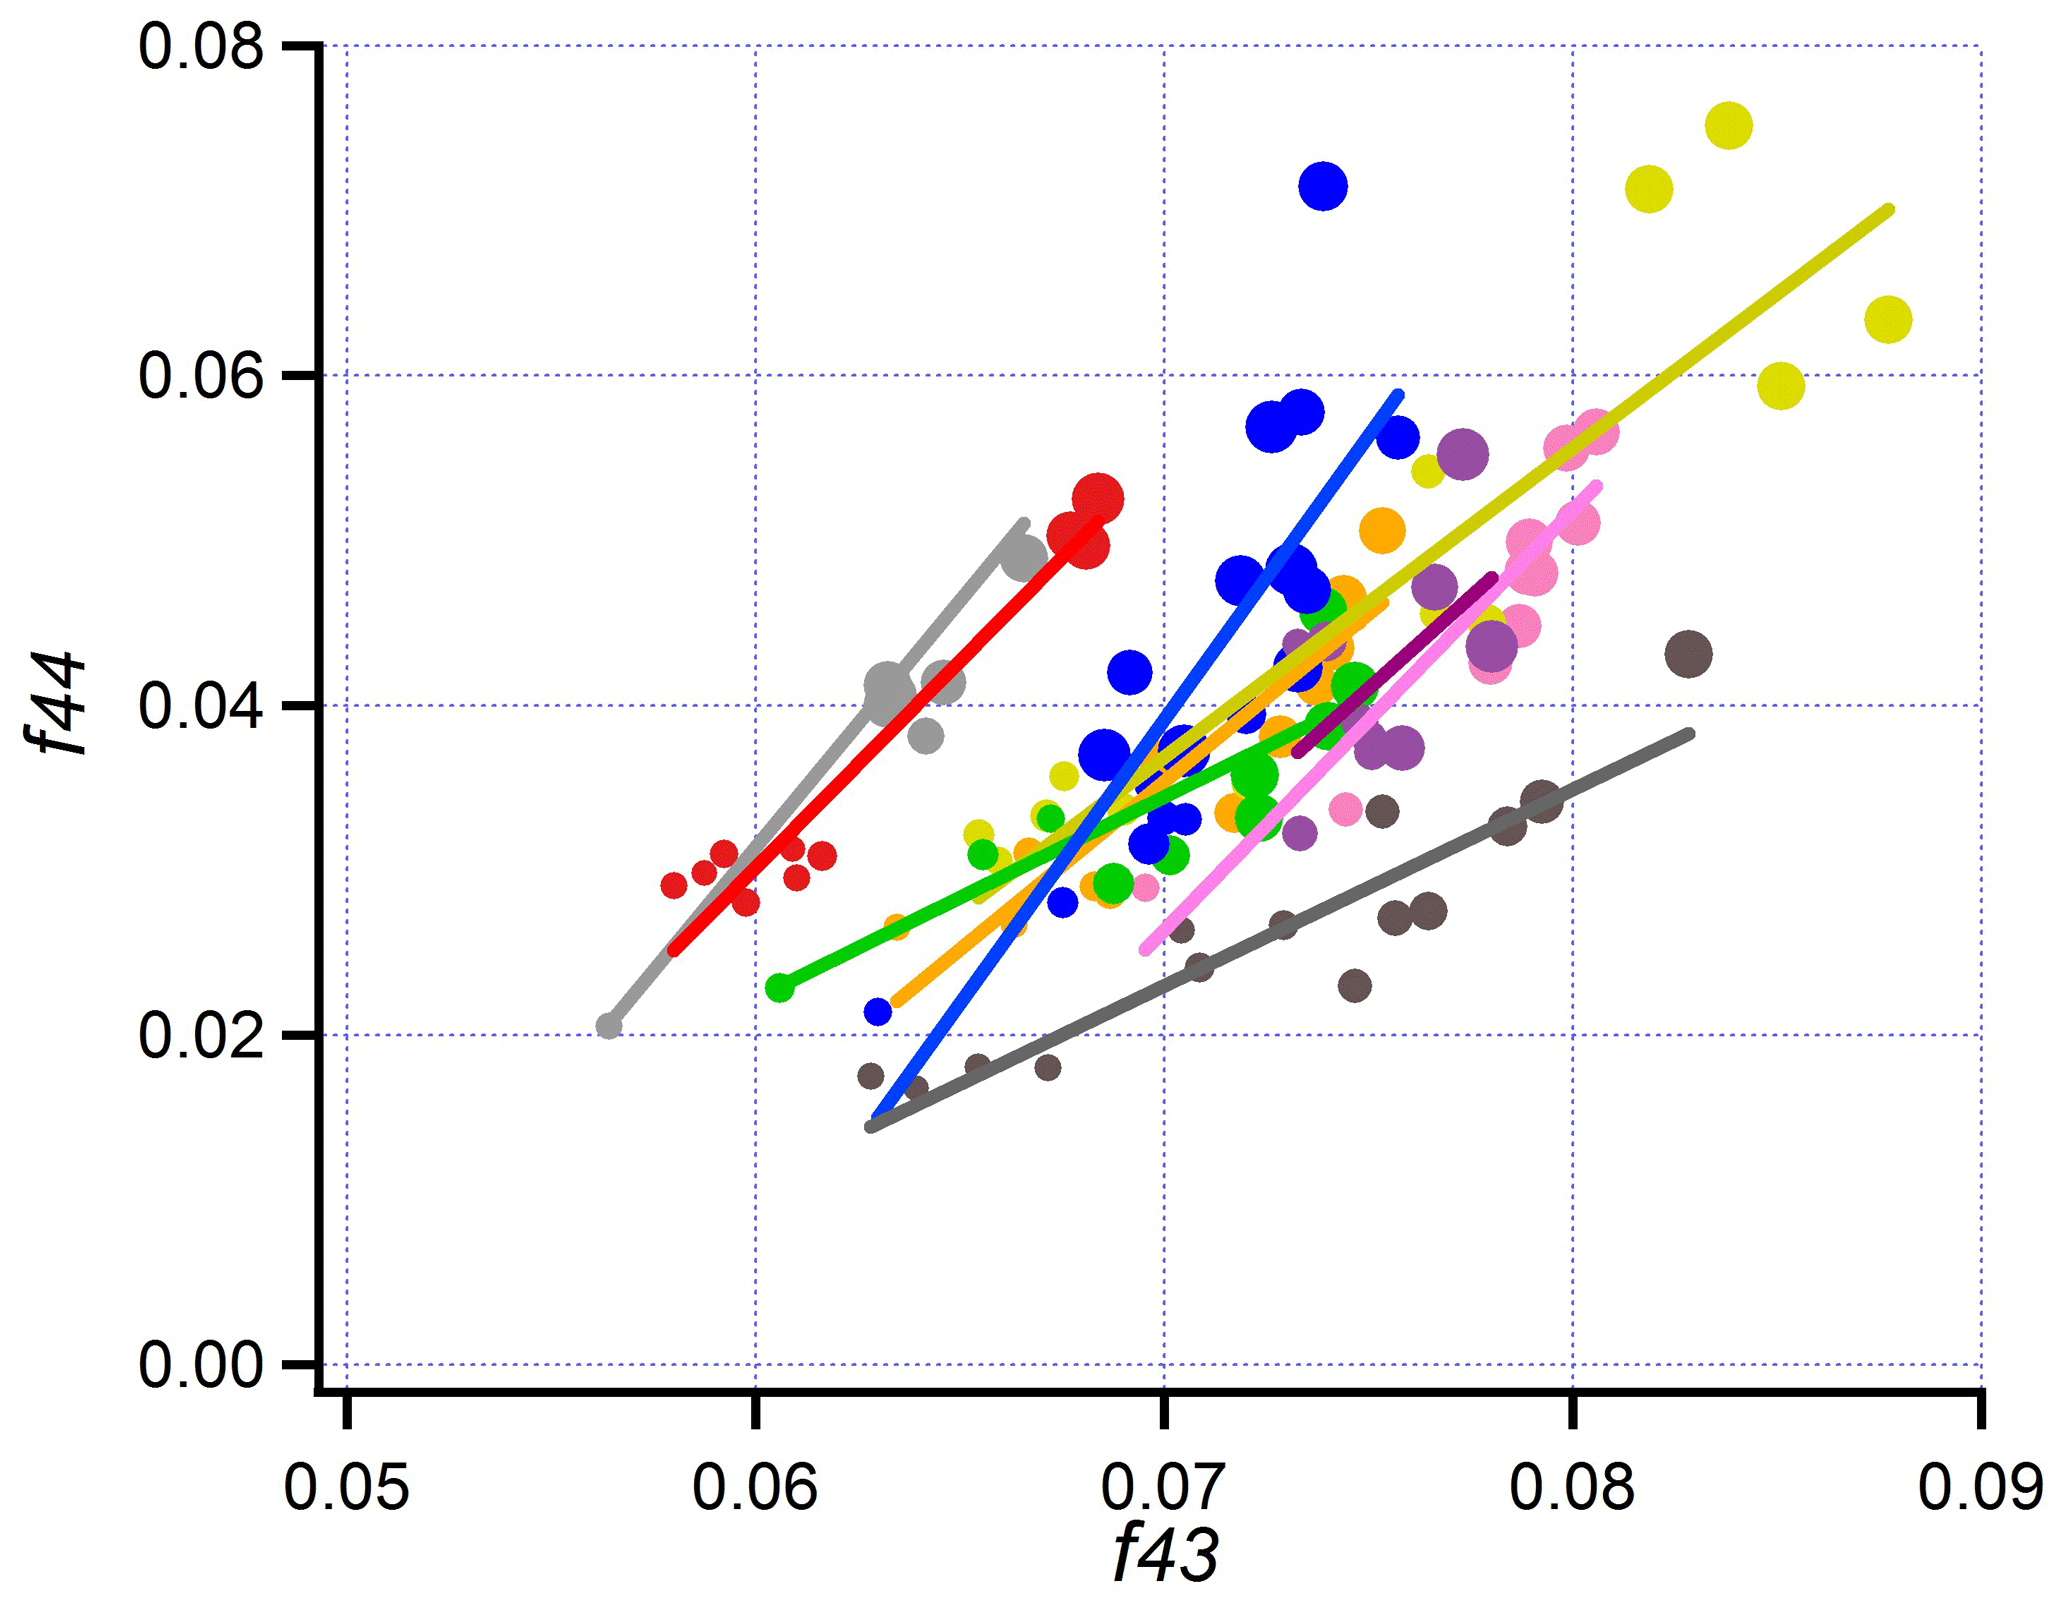
Figure 14f44 vs. f43 for transects on nine pseudo-Lagrangian flights. Size of symbol linearly proportional to photochemical age. Same format as Fig. 13.
A comparison with other BB aerosol elemental ratios (Ng et al., 2011) shows that BBOP elemental ratios have values characteristic of semi-volatile OOA species and that the 2 to 3.5 h of aging observed on BBOP flights leads to composition changes in the direction of lower-volatility species. A similar conclusion that BBOP aerosol is in the semi-volatile category, progressing to lower volatility with age, is supported by values of f43 and f44 shown via a “triangle plot” in Fig. 14. The age dependence of f43, f44, f60, H:C, O:C, and OSc is given explicitly in Fig. S10. Quantities related to aerosol oxidation state, f44, O:C, and OSc monotonically change with age for all flights, albeit with some scatter and flight-to-flight differences. f60, which is a surrogate for primary levoglucosan, and related compounds (Cubison et al., 2011) decrease with age for all flights (Fig. S10c).
Measurements from two regional-scale BBOP flights, 806a and 816a (not part of the current study), have been compared with observations at MBO. According to back-trajectories, MBO sampled in the same air masses as the G-1 after 6–12 h additional processing (Collier et al., 2016; Zhou et al., 2017; Zhang et al., 2018). A PMF analysis of the MBO observations (Zhang et al., 2018) indicated three BB components that differed in the degree of chemical processing. The least processed component, BBOA-1, had an O:C ratio = 0.35; the most processed component, BBOA-3, had an O:C ratio = 1.06 and was significantly less volatile (up to a temperature of 200 ∘C) than the other PMF components. The aged BBOP samples have an O:C ratio between 0.25 and 0.35 (Fig. 13), and on that basis most resemble BBOA-1. It appears from the age trends in Fig. S10e that O:C continues to increase past the values observed in our 2–3 h old samples (i.e., there is no indication of O:C reaching an asymptote). Aged BBOP samples had significant mass fractions of refractory TBs. Based on volatility, these aged BBOP samples resemble BBOA-3. The difference between aged BBOP samples and aerosol measured at MBO indicate the importance of chemical aging in the 3 to 15 h time frame.
5.1 Observations
Transect-average measurements in Fig. 10c and summarized in Table 6 indicate an average increase in mass scattering efficiency (MSE) of 56 % in aged as compared with fresh aerosol. For each transect a surrogate for particle size is determined from FIMS measurements as follows: size spectra are first averaged over a transect. The peak in the transect-averaged size spectrum is determined from a local quadratic fit that uses the three to five size bins nearest the largest value of dN/dLogDp. A restriction to Dp >100 nm yields a peak for dN/dLogDp within the accumulation mode. We will refer to this diameter as DGEO, in analogy with the geometric mean of a log-normal distribution.
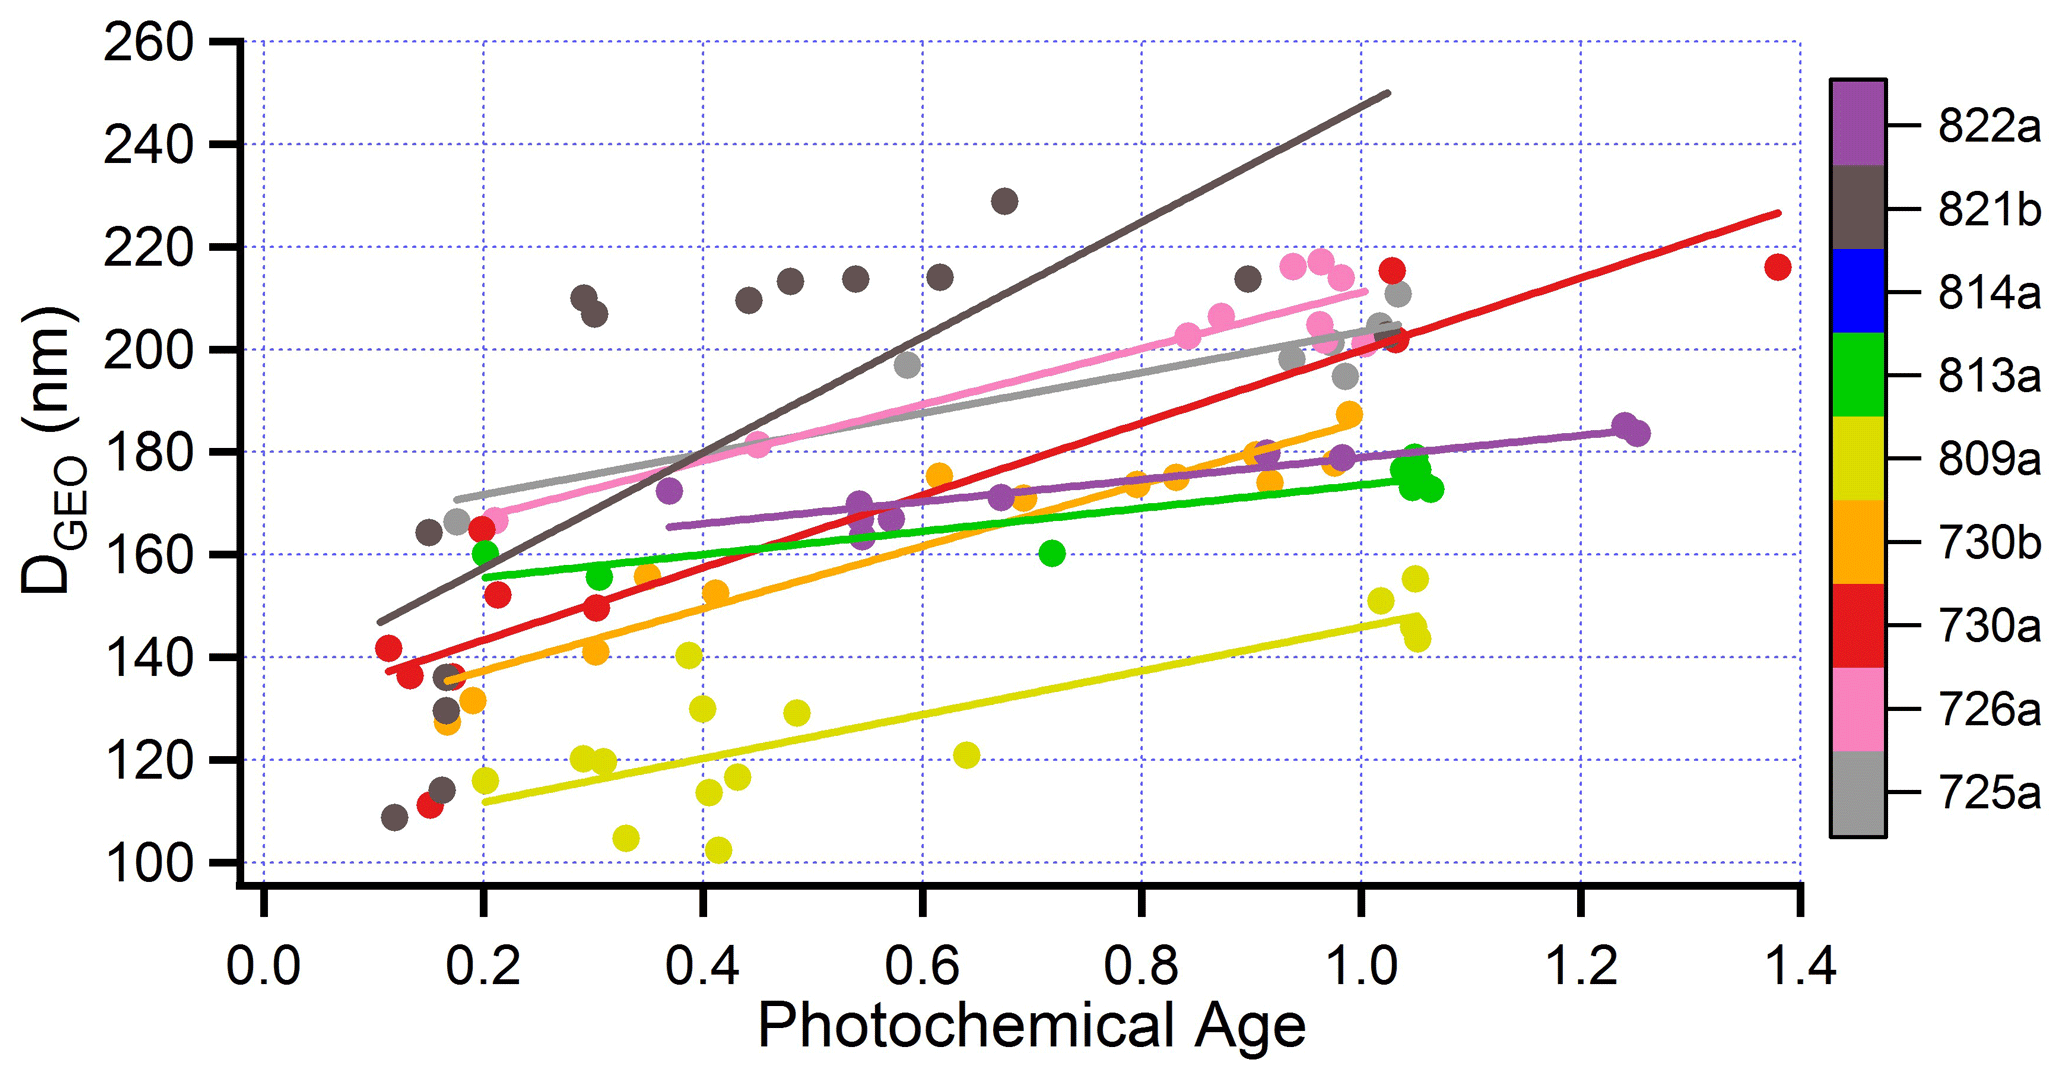
Figure 15DGEO as a function of photochemical age for eight flights. Calculation of DGEO from FIMS measurements given in text. Format similar to Fig. 10.
Figure 15 shows that DGEO is an increasing function of photochemical age, in accordance with multiple field observations of BB aerosol (e.g., Akagi et al., 2012; Carrico et al., 2016). MSE is observed to increase with DGEO (Fig. 16). This trend is expected for size distributions dominated by particles smaller than the wavelength of scattered light, here 550 nm. Laing et al. (2016) observed a correlation (r2) between DGEO and MSE of 0.73 for an ensemble of 19 BB plumes impacting MBO in a 1-month study. In BBOP, correlations between MSE and DGEO are high for individual flights (average r2= 0.75), but in contrast with the observations of Laing et al. (2016), the ensemble of flights shows little relation between MSE and DGEO. The low correlation between MSE and DGEO for the BBOP nine-flight ensemble appears to be caused by real fire-to-fire differences; said differences might be diminished by additional atmospheric processing in the more aged smoke seen at MBO by Laing et al. (2016).
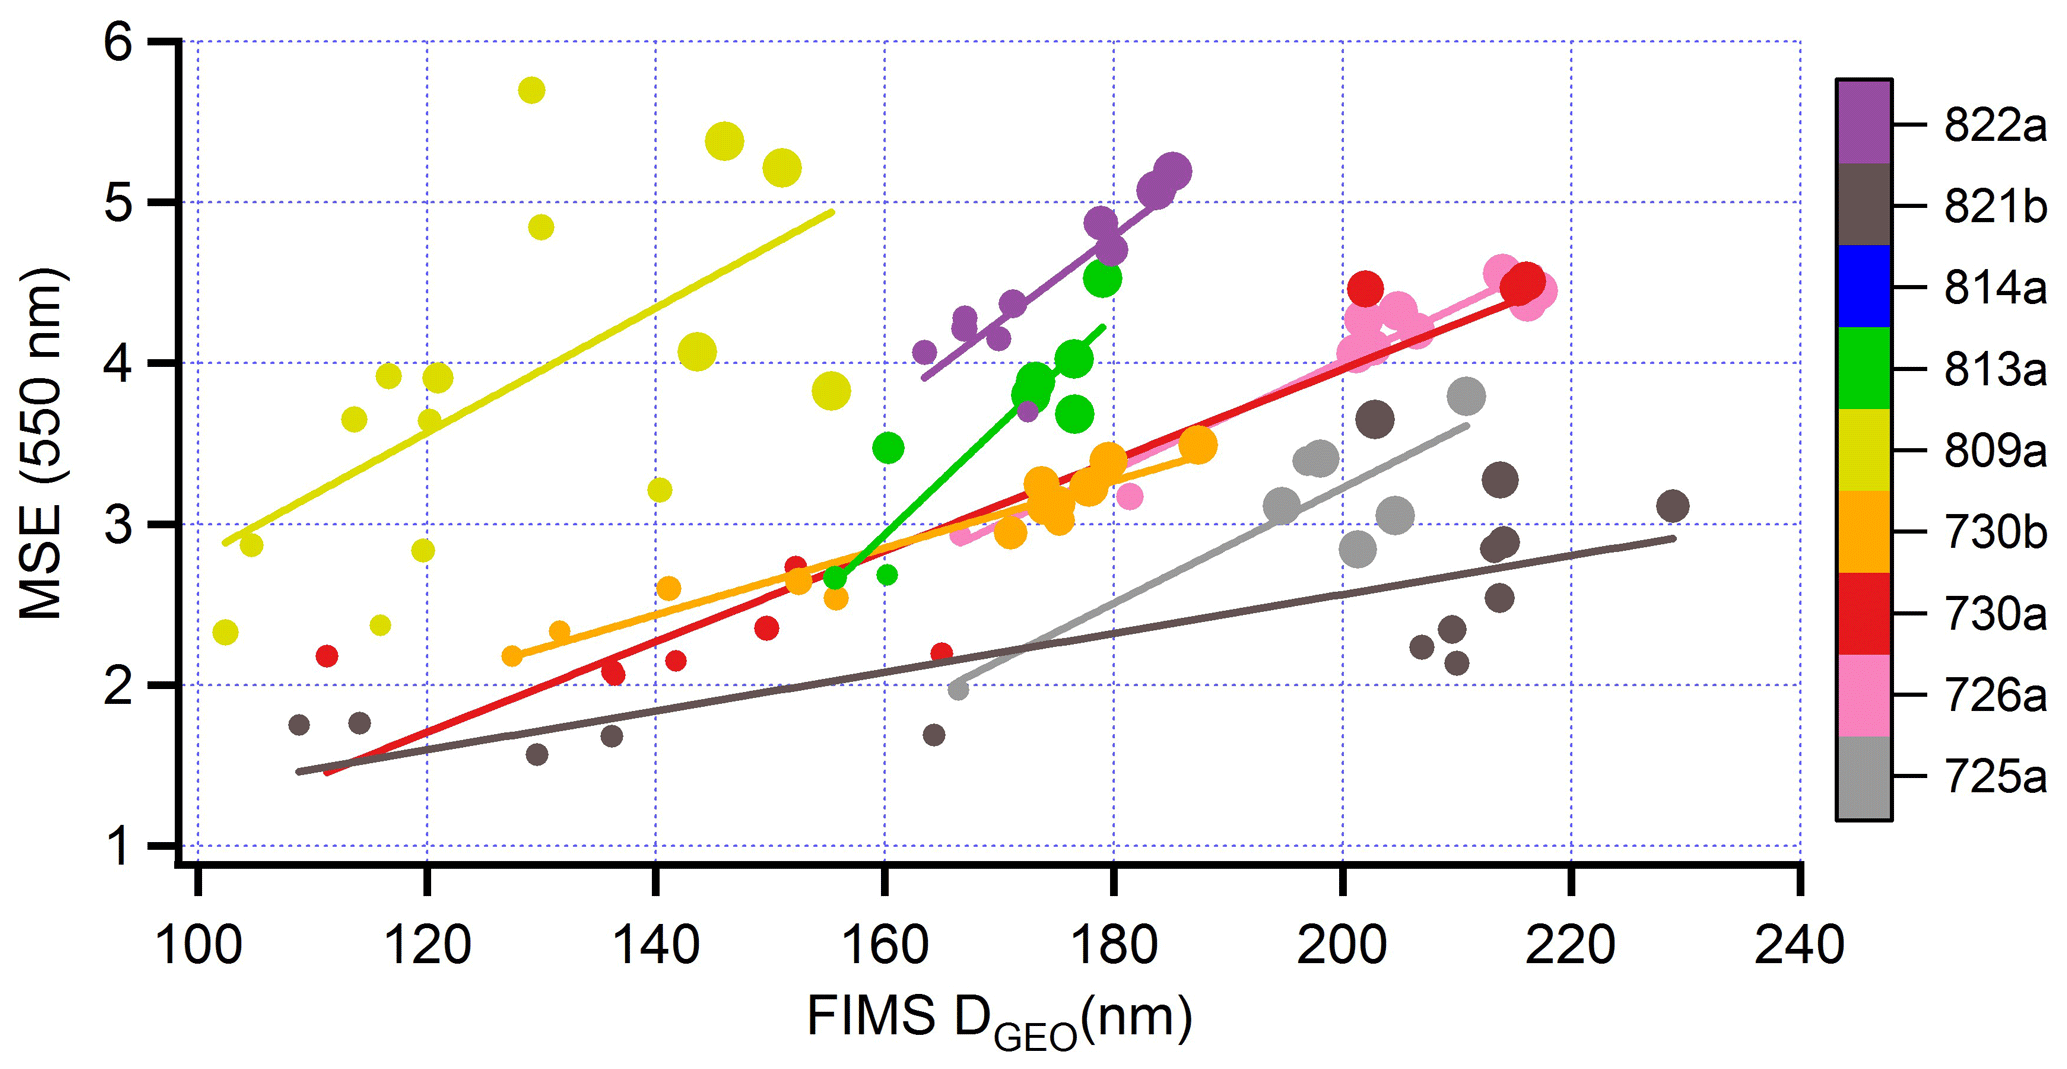
Figure 16Mass scattering efficiency (m2 g−1) as a function of DGEO. Format similar to Fig. 13.

Figure 17Mass scattering efficiency at 550 nm as a function of backscatter ratio at 450 nm. Same format as Fig. 13.
In the size range of our samples, backscatter ratios and scattering Ångström exponents decrease with particle size (Selimovic et al., 2019). An anti-correlation between these intensive parameters and MSE is expected and is observed (Figs. 17–18), both for individual flights and for the ensemble of nine flights that cover a range of MSE from 1.5 to 6.
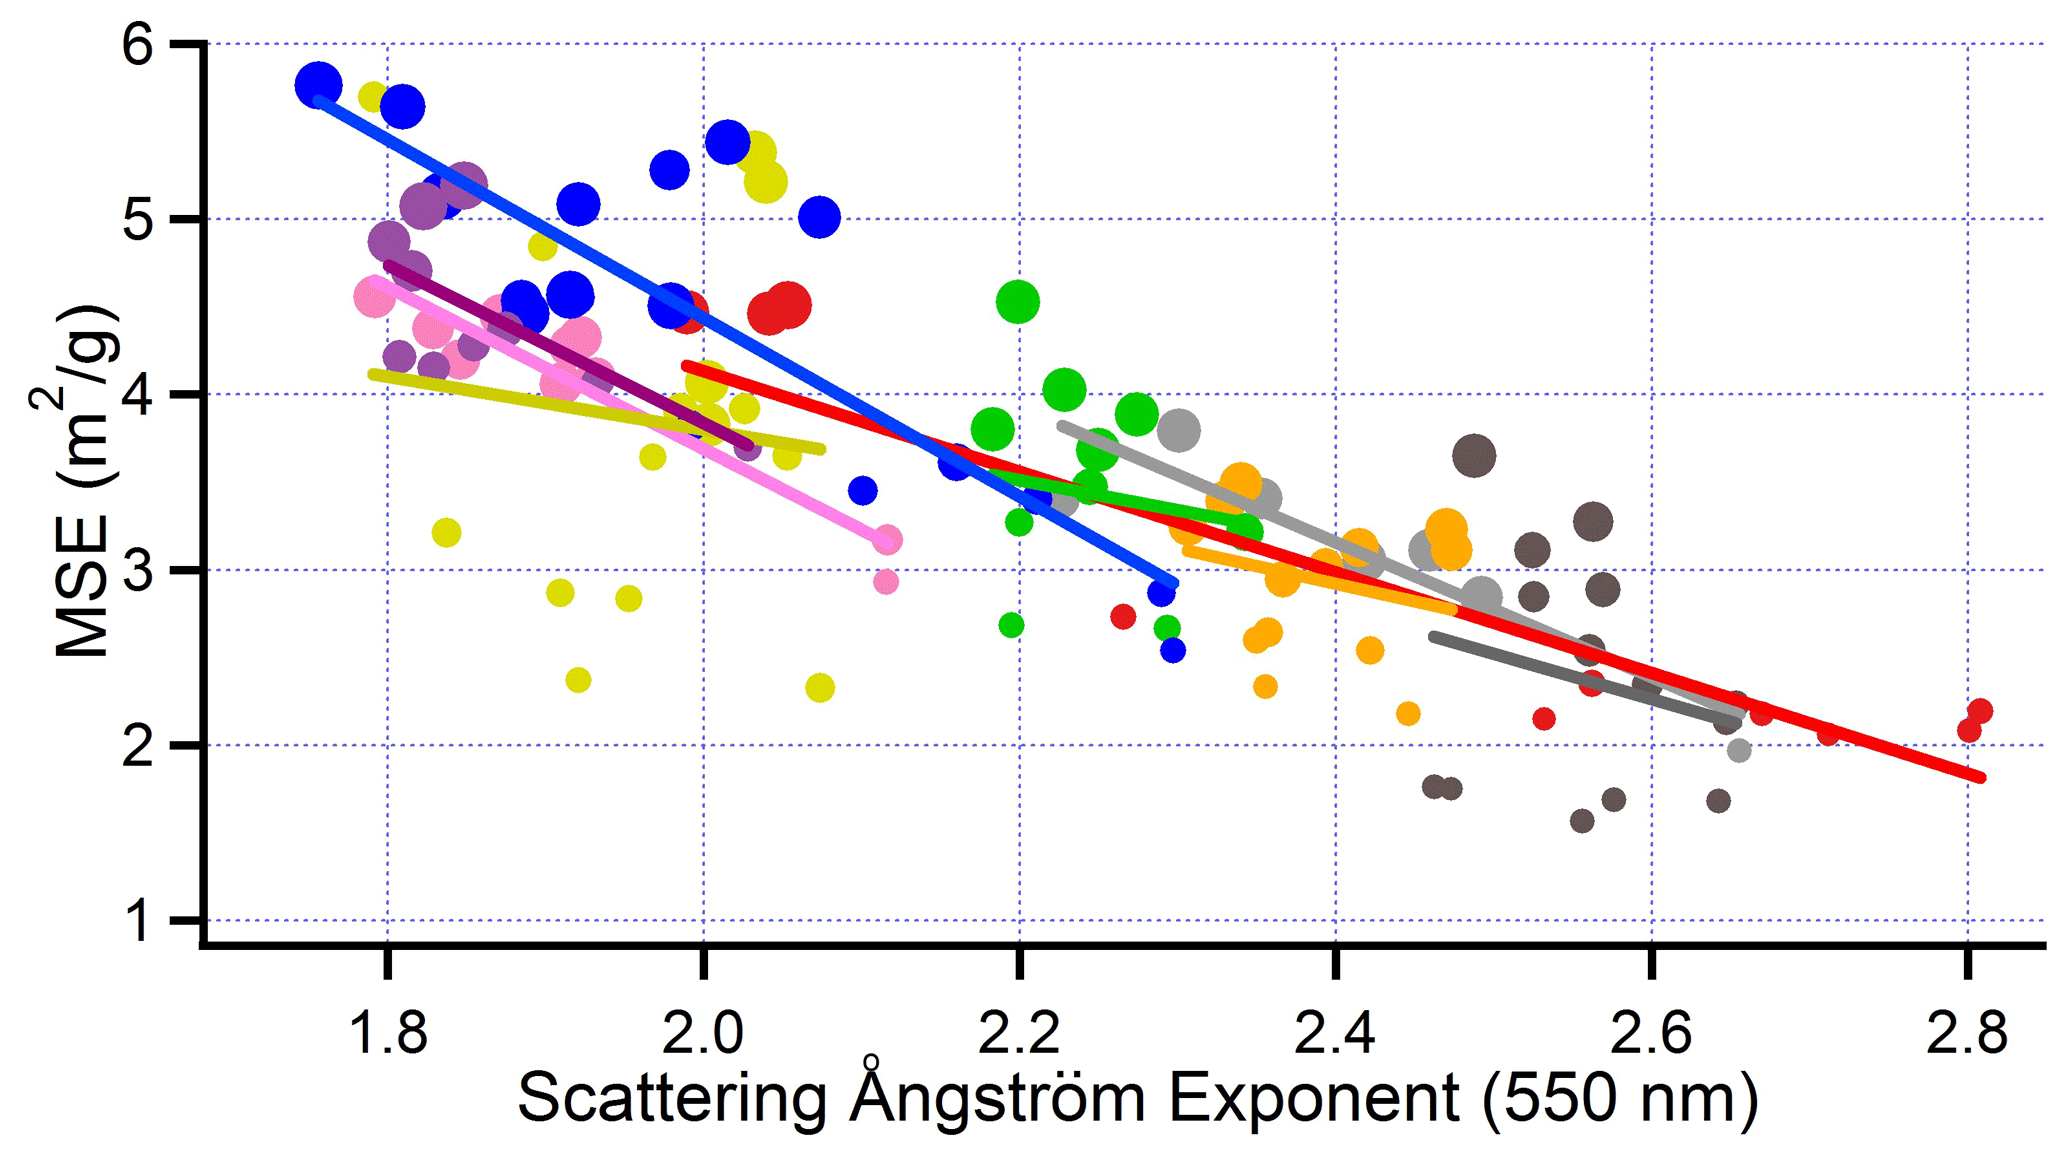
Figure 18Mass scattering efficiency at 550 nm as a function of scattering Ångström exponent at 550 nm. Same format as Fig. 13.
An increase in MSE could be caused by an increase in the real part of the refractive index, mR. In biomass burn aerosol generated in the laboratory or sampled in the ambient atmosphere, mR is observed to be ∼ 1.50 to 1.60 (Levin et al., 2010; Adler et al., 2011), with values above 1.60 occurring in smoke that has a higher fraction of BC than seen in BBOP. Based on literature values and Sedlacek et al. (2018a), we estimate that wildfire-generated aerosol in BBOP has a refractive index, m=1.53–0.02i. A change in mR from 1.53 to 1.60 during plume aging would result in a 17 % to 24 % increase in MSE according to Mie calculations of aerosol, with a log-normal distribution in which DGEO=200 nm and σG (geometric mean standard deviation) between 1.4 and 1.8. However, there are reports that mR is insensitive to aging (Levin et al., 2010) or decreases in aged aerosol (Adler et al., 2011).
5.2 Coagulation calculations
An increase in MSE with age is more likely to be caused by a rearrangement of particle mass, favoring large diameter efficient scatters at the expense of small inefficient scatters. Effects of coagulation upon an initial aerosol size distribution (Sakamoto et al., 2016) were calculated using a Brownian coagulation kernel and algorithms from Jacobson et al. (1994). Calculations were initialized with the near-fire FIMS particle size distribution, extrapolated to 1000 nm via a double log-normal fit to FIMS data between 70 and 260 nm. Particle concentrations in background air were negligible compared with in-plume values and were ignored. Plume dilution occurred at a fixed rate based on CO measurements.
In Fig. 19 we illustrate the effects of coagulation by FIMS-based observed and calculated aerosol size distributions for the along-plume segment of flight 821b. The calculation is initialized with the observed (extrapolated) measurements from transect 13 and integrated for 6600 s, corresponding to the estimated atmospheric transport time on the along-plume flight segment, between the fire and the furthest downwind sample on transect 7 (see Fig. 7). The near-source size distribution has peaks in the Aitken and accumulation mode size ranges. Observed and calculated size distributions show a growth in the number of accumulation mode particles relative to the Aitken mode as well as a shift in the accumulation mode to larger particle diameters as time increases. The resulting increase in MSE was 17 % for flight 821b and less (order 10 %) for other flights. We assign a high uncertainty to these figures as mass and, even more so, scattering, are primarily due to particles with diameters between the 260 nm upper limit of the FIMS and approximately 500 nm and are thus sensitive to the tail of our measurements and the method of extrapolation.

Figure 19Aerosol size distribution for five transects on the along-plume segment of 821b (see Fig. 7). (a) FIMS data extrapolated to 1000 nm using a double log normal. (b) Corresponding results of coagulation calculation initiated with FIMS size distribution on transect 13. Coagulation calculations include a factor of 4 dilution between transects 13 and 7 (not shown in the plot for clarity).
Correlations found in BBOP flights between (i) MSE and (ii) DGEO, aerosol Ångström exponent, and aerosol backscatter ratio are evidence that increases in MSE with time are due to the growth of aerosol particles, such that they become more efficient scatters. Similar correlations have been found in other biomass burning studies (Levin et al., 2010; Laing et al., 2016; Selimovic et al., 2019).
Coagulation moves mass from smaller to larger particles, but its effect on MSE appears to be minor. Chemical changes in the organic component of BB aerosol (Fig. S10) have been interpreted in terms of mass transfer between particulate and gas phases, processes that are capable of changing size distributions. In this scenario, high-volatility POA evaporates as the plume dilutes. Gas-phase reactions of primary flame emissions or the evaporated POA create oxygenated lower-volatility VOCs that subsequently partition as SOA to the aerosol phase (Grieshop et al., 2009; Hennigan et al., 2011; Jolleys et al., 2012; May et al., 2013; Morgan et al., 2020). Transfer of material between the gas and (bulk) aerosol phases and amongst particles in the aerosol phase is driven by the thermodynamic constraint of equalizing chemical potentials. Though thermodynamics defines quasi-stationary states in an evolving plume, actual distributions are commonly dictated by the kinetics of mass transfer within particles, between phases, and between individual particles (Marcolli et al., 2004; Zhang et al., 2012).
Time-dependent changes in the chemical composition of wildfire plumes observed in BBOP are consistent with a decrease in POA compensated by an increase in SOA, such that the total concentration of organic aerosol, corrected for dilution, is approximately constant. An increase in SOA is inferred by the systematic increase in f44, O-to-C ratio, and carbon oxidation state with time (Figs. S10b, e, and f). A decrease in f60 (Fig. S10c) has been linked to the evaporation of primary levoglucosan and related compounds.
Changes in chemical markers used to characterize the carbon oxidation state are several-fold smaller than observed in laboratory burns and in most field samples. Thus, the BBOP data set occupies a small fraction of composition space depicted in “triangle” diagrams of f44 vs. f43 (Ng et al., 2011) and a similarly small fraction of a Van Krevelen diagram (Heald et al., 2010). Arrows that one could construct between our fresh and aged samples point towards the more aged compositions that others have observed (see Figs. 1 and 4, Ng et al., 2011). Most of the plume samples described in this study have been exposed to atmospheric processing for 2 h or less; the oldest samples are exposed for less than 3.5 h. In contrast, the data sets used in Heald et al. (2010) and Ng et al. (2011) contain both fresh and more processed BB smoke with atmospheric residence times (or equivalent OH exposure) of days.
Given that there are aged-related changes in organic composition consistent with loss of POA and gain of SOA, is it possible that a transfer of mass between the gas and particulate phases and amongst particles can yield a size distribution in which MSE increases by as much as a factor of 2? It is likely that during mass exchange between the gas and aerosol phases, equilibrium amongst particles of different sizes is not maintained since the air mass is evolving rapidly (i.e., <1 h), and mass transfer between particles can have substantially longer time constants (Marcolli et al., 2004). The kinetics of diffusion in the continuum regime tends to favor evaporation of small particles since in that regime, dDp/dt ∼ Dp−1. A preferential evaporation of small particles occurs also for the transition regime size particles that produce most of the scattering in wildfire plumes. As total mass is nearly invariant, the concurrent process of condensation of SOA cannot have the same kinetics as evaporation of POA, else particles of a given size will have no net size change. If SOA were to be distributed amongst particles so as to equalize mole fractions (i.e., follow a volume growth law), then growth of large particles would be favored over smaller ones and MSE would increase. Detailed calculations invoking a wider choice of evaporation and growth options as well as possible kinetic limitations caused by within-aerosol diffusion are required to quantify effects of mass transfer on MSE.
As part of the BBOP campaign in the Pacific NW US, nine wildfire plumes were sampled in a pseudo-Lagrangian mode to determine the time evolution of pollutants between the fire and after up to 3.5 h of daytime atmospheric processing. Atmospheric processing was quantified by a photochemical age defined as −Log10(NOx/NOy). Typical ages were between 0.2 and 1.0 and maximum downwind times close to 2 h, though on occasion as long as 3.5 h. Plume concentrations were corrected for dilution using CO as a conservative tracer. Background subtraction depended on observations in nearby clean air.
On average, normalized aerosol mass concentrations were constant over several hours of atmospheric aging. Mass scattering efficiency increased with age by an average of 56 %; the range amongst flights was an increase of 33 % to 97 %. Except for two flights, mass absorption coefficients (MACs) are in the high teens and nearly independent of age. If absorption is due to coated BC, then coatings are formed early in the BB plume and of a thickness such that absorption is insensitive to further coating (Bond et al., 2006; Forrister et al., 2015). Scattering, normalized for dilution, increases with age, causing SSA to likewise increase. In fresh smoke albedos were 0.85–0.90. These SSAs increased to ∼0.95 in aged smoke. If we suppose our plumes to be over a portion of the globe with average albedo (that average including oceans, etc.), then the wildfire plumes when first observed would have a near-zero direct radiative effect on the Earth's radiative balance and a cooling effect after 2–3 h (Selimovic et al., 2019).
For typical BB particles, scattering and MSE are increasing functions of particle size. In order to establish that aerosol particles grow with age, we relied on (i) a decrease in aerosol backscatter ratio and Ångström exponent with age (as expected from Mie theory) and (ii) an increase with age of DGEO, the diameter, within the accumulation mode, at which point dN/dLogDp has a maximum value. DGEO is best thought of as a surrogate of particle size as it is obtained from measurements with Dp < 210 or 260 nm, short of covering the full range of optically active particles. Almost all values for the surrogate measures of Dp increase with age. Fire-to-fire variability of these metrics can be larger than the difference between fresh and aged emissions, which cautions against comparing fresh emissions from one fire with aged emissions from another.
A calculation from a high-concentration along-plume flight segment indicates that coagulation transfers particles from the Aitken mode to the larger accumulation mode, resulting in a small increase in MSE. Further calculations constrained by aerosol size distributions that fully cover the size range that contributes most to scattering are required to verify the role of coagulation and to identify other mechanisms that cause MSE to increase with age.
In newly emitted plumes and NO3have an equivalence ratio near unity, despite the presence of Cl and . That HNO3 and HCl were not volatilized argues against the initial and Cl being cations of strong acids. Primary Cl varied between 0.2 % and 2.5 %, with the higher value associated with grass fuels. Aged plumes had, on average, a neutral equivalence ratio (anions/ near unity). The ratio rBC/nr-PM1 varied amongst flights, with a range of 0.5 % to 2.5 %. In all cases organic aerosol constituted > 90 % of nr-PM1.
Organic composition changed with age as POA evaporated and SOA condensed. Loss of POA can be inferred from the age dependence of f60, a surrogate for primary emissions of levoglucosan and related compounds. Condensation of SOA is seen from the increase in f44 and O-to-C ratio in aged samples. Changes with age of these mass spectra fragments, though robust, are smaller than that observed in most laboratory and field studies of aerosol aging. This is expected as our aged samples were typically only 2 to 3 h downwind of their wildfire source.
Data from the BBOP field campaign have been archived at https://www.arm.gov/research/campaigns/aaf2013bbop (last access: December 2019; ARM, 2019).
The supplement related to this article is available online at: https://doi.org/10.5194/acp-20-13319-2020-supplement.
LIK and AJS were co-PIs of BBOP responsible for selecting objectives and designing the field campaign. RY advised. The primary responsibility for collecting data was as follows: PTI and SP2, AJS III; SP-AMS, TBO and JS; trace gas, SRS; CO2, MKD; FIMS, JW; electron microscopy, KA and PB; measurements at MBO, QZ, SC, and SZ; analysis of effects of dilution in BBOP flights, ALH and JRP; Mie calculations, EL. All the authors contributed towards the analysis of data contained herein and towards writing the manuscript.
The authors declare that they have no conflict of interest.
This research was performed under sponsorship of the U.S. DOE Office of Biological & Environmental Sciences (OBER) Atmospheric System Research Program (ASR) under contracts DE-SC0012704 (BNL) and DE-AC05-76RL01830 (JES, PNNL). The Pacific Northwest National Laboratory is operated for DOE by Battelle Memorial Institute. Manvendra K. Dubey thanks ASR for support. Kouji Adachi thanks the support of the Global Environment Research Fund of the Japanese Ministry of the Environment (2-1703 and 2-1403) and JSPS KAKENHI (grant nos. JP19H04259 and JP16K16188). Peter R. Buseck is grateful for support from the Pacific Northwest National Lab (PNNL) and the DOE Atmospheric Radiation Measurement (ARM) Program under Research Subcontract no. 205689. Timothy B. Onasch is grateful for support from the DOE ARM program during BBOP and the DOE ASR program for BBOP analysis (contract DE-SC0014287). Q. Zhang, S. Zhou, and S. Collier acknowledge support from the DOE ARM and ASR program (DE-SC001420) for supporting the MBO measurement during BBOP and associated data analysis. Jeffery R. Pierce and Anna L. Hodshire are grateful for support from the U.S. NOAA, an Office of Science, Office of Atmospheric Chemistry, Carbon Cycle, and Climate program, under cooperative agreement award NA17OAR4310001; the U.S. NSF Atmospheric Chemistry program, under grants AGS-1559607 and AGS-1950327; and the US Department of Energy's Atmospheric System Research, an Office of Science, Office of Biological and Environmental Research program, under grant DE-SC0019000. Robert J. Yokelson's effort was supported by NASA grant NNX14AP45G to the University of Montana.
Researchers recognize the DOE Atmospheric Radiation Measurement (ARM) Climate Research program and facility for both the support to carry out the BBOP campaign and for use of the G-1 research aircraft. The authors are grateful for the skill and safety ethos of the AAF (ARM Aerial Facility) pilots, flight staff, and instrument mentors. We are grateful for assistance from Christine Wiedinmyer of NCAR in providing western US fire statistics. We acknowledge the use of data products or imagery from the Land, Atmosphere Near real-time Capability for EOS (LANCE) system operated by NASA's Earth Science Data and Information System (ESDIS) with funding provided by NASA Headquarters.
This research has been supported by the U.S. Department of Energy, Office of Biological and Environmental Research (grant nos. DE-SC0012704, DE-AC05-76RL01830, DE-SC0014287, DE-SC001420, DE-SC0019000, and ARM Research subcontract 205689), the Global Environment Research Fund of the Japanese Ministry of the Environment (grant nos. 2-1703 and 2-1403), JSPS KAKENHI (grant nos. JP19H04259 and JP16K16188), an NOAA cooperative agreement award (award no. NA17OAR4310001), NSF (grant nos. AGS-1559607 and AGS-1950327), and NASA (grant no. NNX14AP45G).
This paper was edited by Yafang Cheng and reviewed by four anonymous referees.
Adachi, K., Sedlacek, A. J., Kleinman, L., Chand, D., Hubbe, J. M., and Buseck, P. R.: Volume changes upon heating of aerosol particles from biomass burning using transmission electron microscopy, Aerosol Sci. Technol., 52, 46–56, https://doi.org/10.1080/02786826.2017.1373181, 2018.
Adachi, K., Sedlacek, A. J., Kleinman, L., Springston, S. R., Wang, J., Chand, D., Hubbe, J. M., Shilling, J. E., Onasch, T. B., Kinase, T., Sakata, K., Takahashi, Y., and Buseck, P. R.: Spherical tarball particles form through rapid chemical and physical changes of organic matter in biomass-burning smoke, P. Natl. Acad. Sci. USA, 116, 19336, https://doi.org/10.1073/pnas.1900129116, 2019.
Adler, G., Flores, J. M., Abo Riziq, A., Borrmann, S., and Rudich, Y.: Chemical, physical, and optical evolution of biomass burning aerosols: a case study, Atmos. Chem. Phys., 11, 1491–1503, https://doi.org/10.5194/acp-11-1491-2011, 2011.
Akagi, S. K., Yokelson, R. J., Wiedinmyer, C., Alvarado, M. J., Reid, J. S., Karl, T., Crounse, J. D., and Wennberg, P. O.: Emission factors for open and domestic biomass burning for use in atmospheric models, Atmos. Chem. Phys., 11, 4039–4072, https://doi.org/10.5194/acp-11-4039-2011, 2011.
Akagi, S. K., Craven, J. S., Taylor, J. W., McMeeking, G. R., Yokelson, R. J., Burling, I. R., Urbanski, S. P., Wold, C. E., Seinfeld, J. H., Coe, H., Alvarado, M. J., and Weise, D. R.: Evolution of trace gases and particles emitted by a chaparral fire in California, Atmos. Chem. Phys., 12, 1397–1421, https://doi.org/10.5194/acp-12-1397-2012, 2012.
Alvarado, M. J., Logan, J. A., Mao, J., Apel, E., Riemer, D., Blake, D., Cohen, R. C., Min, K.-E., Perring, A. E., Browne, E. C., Wooldridge, P. J., Diskin, G. S., Sachse, G. W., Fuelberg, H., Sessions, W. R., Harrigan, D. L., Huey, G., Liao, J., Case-Hanks, A., Jimenez, J. L., Cubison, M. J., Vay, S. A., Weinheimer, A. J., Knapp, D. J., Montzka, D. D., Flocke, F. M., Pollack, I. B., Wennberg, P. O., Kurten, A., Crounse, J., Clair, J. M. St., Wisthaler, A., Mikoviny, T., Yantosca, R. M., Carouge, C. C., and Le Sager, P.: Nitrogen oxides and PAN in plumes from boreal fires during ARCTAS-B and their impact on ozone: an integrated analysis of aircraft and satellite observations, Atmos. Chem. Phys., 10, 9739–9760, https://doi.org/10.5194/acp-10-9739-2010, 2010.
ARM: Biomass Burning Obeservation Project (BBOP), available at: https://www.arm.gov/research/campaigns/aaf2013bbop, last access: December 2019.
Anderson, T. L. and Ogren, J. A.: Determining Aerosol Radiative Properties Using the TSI 3563 Integrating Nephelometer, Aerosol Sci. Technol., 29, 57–69, https://doi.org/10.1080/02786829808965551, 1998.
Andreae, M. O.: Emission of trace gases and aerosols from biomass burning – an updated assessment, Atmos. Chem. Phys., 19, 8523–8546, https://doi.org/10.5194/acp-19-8523-2019, 2019.
Bond, T. C., Doherty, S. J., Fahey, D. W., Forster, P. M., Berntsen, T., DeAngelo, B. J., Flanner, M. G., Ghan, S., Kärcher, B., Koch, D., Kinne, S., Kondo, Y., Quinn, P. K., Sarofim, M. C., Schultz, M. G., Schulz, M., Venkataraman, C., Zhang, H., Zhang, S., Bellouin, N., Guttikunda, S. K., Hopke, P. K., Jacobson, M. Z., Kaiser, J. W., Klimont, Z., Lohmann, U., Schwarz, J. P., Shindell, D., Storelvmo, T., Warren, S. G., and Zender, C. S.: Bounding the role of black carbon in the climate system: A scientific assessment, J. Geophys. Res.-Atmos., 118, 5380–5552, https://doi.org/10.1002/jgrd.50171, 2013.
Bond, T. C., Doherty, S. J., Fahey, D. W., Forster, P. M., Berntsen, T., DeAngelo, B. J., Flanner, M. G., Ghan, S., Kärcher, B., Koch, D., Kinne, S., Kondo, Y., Quinn, P. K., Sarofim, M. C., Schultz, M. G., Schulz, M., Venkataraman, C., Zhang, H., Zhang, S., Bellouin, N., Guttikunda, S. K., Hopke, P. K., Jacobson, M. Z., Kaiser, J. W., Klimont, Z., Lohmann, U., Schwarz, J. P., Shindell, D., Storelvmo, T., Warren, S. G., and Zender, C. S.: Bounding the role of black carbon in the climate system: A scientific assessment, J. Geophys. Res.-Atmos., 118, 5380–5552, https://doi.org/10.1002/jgrd.50171, 2013.
Briggs, N. L., Jaffe, D. A., Gao, H., Hee, J. R., Baylon, P. M., Zhang, Q., Zhou, S., Collier, S. C., Sampson, P. D., and Cary, R. A.: Particulate Matter, Ozone, and Nitrogen Species in Aged Wildfire Plumes Observed at the Mount Bachelor Observatory, Aerosol Air Qual. Res., 16, 3075–3087, https://doi.org/10.4209/aaqr.2016.03.0120, 2016.
Carrico, C. M., Prenni, A. J., Kreidenweis, S. M., Levin, E. J. T., McCluskey, C. S., DeMott, P. J., McMeeking, G. R., Nakao, S., Stockwell, C., and Yokelson, R. J.: Rapidly evolving ultrafine and fine mode biomass smoke physical properties: Comparing laboratory and field results, J. Geophys. Res.-Atmos., 121, 5750–5768, https://doi.org/10.1002/2015JD024389, 2016.
Chylek, P. and Wong, J.: Effect of absorbing aerosols on global radiation budget, Geophys. Res. Lett., 22, 929–931, https://doi.org/10.1029/95GL00800, 1995.
Collier, S., Zhou, S., Onasch, T. B., Jaffe, D. A., Kleinman, L., Sedlacek III, A. J., Briggs, N., Hee, J., Fortner, E., Shilling, J. E., Worsnop, D., Yokelson, R. J., Parworth, C., Ge, X., Xu, J., Butterfield, Z., Chand, D., Dubey, M. K., Pekour, M., Springston, S., and Zhang, Q.: Regional Influence of Aerosol Emissions from Wildfires Driven by Combustion Efficiency: Insights from the BBOP Campaign, Environ. Sci. Technol., 50, 8613–8622, https://doi.org/10.1021/acs.est.6b01617, 2016.
Corbin, J. C. and Gysel-Beer, M.: Detection of tar brown carbon with a single particle soot photometer (SP2), Atmos. Chem. Phys., 19, 15673–15690, https://doi.org/10.5194/acp-19-15673-2019, 2019.
Cubison, M. J., Ortega, A. M., Hayes, P. L., Farmer, D. K., Day, D., Lechner, M. J., Brune, W. H., Apel, E., Diskin, G. S., Fisher, J. A., Fuelberg, H. E., Hecobian, A., Knapp, D. J., Mikoviny, T., Riemer, D., Sachse, G. W., Sessions, W., Weber, R. J., Weinheimer, A. J., Wisthaler, A., and Jimenez, J. L.: Effects of aging on organic aerosol from open biomass burning smoke in aircraft and laboratory studies, Atmos. Chem. Phys., 11, 12049–12064, https://doi.org/10.5194/acp-11-12049-2011, 2011.
DeCarlo, P. F., Ulbrich, I. M., Crounse, J., de Foy, B., Dunlea, E. J., Aiken, A. C., Knapp, D., Weinheimer, A. J., Campos, T., Wennberg, P. O., and Jimenez, J. L.: Investigation of the sources and processing of organic aerosol over the Central Mexican Plateau from aircraft measurements during MILAGRO, Atmos. Chem. Phys., 10, 5257–5280, https://doi.org/10.5194/acp-10-5257-2010, 2010.
Forrister, H., Liu, J., Scheuer, E., Dibb, J., Ziemba, L., Thornhill, K. L., Anderson, B., Diskin, G., Perring, A. E., Schwarz, J. P., Campuzano-Jost, P., Day, D. A., Palm, B. B., Jimenez, J. L., Nenes, A., and Weber, R. J.: Evolution of brown carbon in wildfire plumes, Geophys. Res. Lett., 42, 4623–4630, https://doi.org/10.1002/2015GL063897, 2015.
Garofalo, L. A., Pothier, M. A., Levin, E. J. T., Campos, T., Kreidenweis, S. M., and Farmer, D. K.: Emission and Evolution of Submicron Organic Aerosol in Smoke from Wildfires in the Western United States, ACS Earth Space Chem., 3, 1237–1247, https://doi.org/10.1021/acsearthspacechem.9b00125, 2019.
Grieshop, A. P., Logue, J. M., Donahue, N. M., and Robinson, A. L.: Laboratory investigation of photochemical oxidation of organic aerosol from wood fires 1: measurement and simulation of organic aerosol evolution, Atmos. Chem. Phys., 9, 1263–1277, https://doi.org/10.5194/acp-9-1263-2009, 2009.
Heald, C. L., Kroll, J. H., Jimenez, J. L., Docherty, K. S., DeCarlo, P. F., Aiken, A. C., Chen, Q., Martin, S. T., Farmer, D. K., and Artaxo, P.: A simplified description of the evolution of organic aerosol composition in the atmosphere, Geophys. Res. Lett., 37, L08803, https://doi.org/10.1029/2010GL042737, 2010.
Hennigan, C. J., Miracolo, M. A., Engelhart, G. J., May, A. A., Presto, A. A., Lee, T., Sullivan, A. P., McMeeking, G. R., Coe, H., Wold, C. E., Hao, W.-M., Gilman, J. B., Kuster, W. C., de Gouw, J., Schichtel, B. A., Collett Jr., J. L., Kreidenweis, S. M., and Robinson, A. L.: Chemical and physical transformations of organic aerosol from the photo-oxidation of open biomass burning emissions in an environmental chamber, Atmos. Chem. Phys., 11, 7669–7686, https://doi.org/10.5194/acp-11-7669-2011, 2011.
Hodshire, A. L., Akherati, A., Alvarado, M. J., Brown-Steiner, B., Jathar, S. H., Jimenez, J. L., Kreidenweis, S. M., Lonsdale, C. R., Onasch, T. B., Ortega, A. M., and Pierce, J. R.: Aging Effects on Biomass Burning Aerosol Mass and Composition: A Critical Review of Field and Laboratory Studies, Environ. Sci. Technol., 53, 10007–10022, https://doi.org/10.1021/acs.est.9b02588, 2019a.
Hodshire, A. L., Bian, Q., Ramnarine, E., Lonsdale, C. R., Alvarado, M. J., Kreidenweis, S. M., Jathar, S. H., and Pierce, J. R.: More Than Emissions and Chemistry: Fire Size, Dilution, and Background Aerosol Also Greatly Influence Near-Field Biomass Burning Aerosol Aging, J. Geophys. Res.-Atmos., 124, 5589–5611, https://doi.org/10.1029/2018JD029674, 2019b.
Hodshire, A. L., Ramnarine, E., Akherati, A., Alvarado, M. L., Farmer, D. K., Jathar, S. H., Kreidenweis, S. M., Lonsdale, C. R., Onasch, T. B., Springston, S. R., Wang, J., Wang, Y., Kleinman, L. I., Sedlacek III, A. J., and Pierce, J. R.: Dilution impacts on smoke aging: Evidence in BBOP data, Atmos. Chem. Phys. Discuss., https://doi.org/10.5194/acp-2020-300, in review, 2020.
Jacobson, M. Z., Turco, R. P., Jensen, E. J., and Toon, O. B.: Modeling coagulation among particles of different composition and size, Atmos. Environ., 28, 1327–1338, https://doi.org/10.1016/1352-2310(94)90280-1, 1994.
Janhäll, S., Andreae, M. O., and Pöschl, U.: Biomass burning aerosol emissions from vegetation fires: particle number and mass emission factors and size distributions, Atmos. Chem. Phys., 10, 1427–1439, https://doi.org/10.5194/acp-10-1427-2010, 2010.
Jolleys, M. D., Coe, H., McFiggans, G., Capes, G., Allan, J. D., Crosier, J., Williams, P. I., Allen, G., Bower, K. N., Jimenez, J. L., Russell, L. M., Grutter, M., and Baumgardner, D.: Characterizing the Aging of Biomass Burning Organic Aerosol by Use of Mixing Ratios: A Meta-analysis of Four Regions, Environ. Sci. Technol., 46, 13093–13102, https://doi.org/10.1021/es302386v, 2012.
Kleinman, L. I. and Sedlacek, A. J.: Biomass Burning Observation Project (BBOP) Final Campaign Report DOE/SC-ARM-15-083, https://doi.org/10.2172/1236490, 2016.
Kleinman, L. I., Springston, S. R., Daum, P. H., Lee, Y.-N., Nunnermacker, L. J., Senum, G. I., Wang, J., Weinstein-Lloyd, J., Alexander, M. L., Hubbe, J., Ortega, J., Canagaratna, M. R., and Jayne, J.: The time evolution of aerosol composition over the Mexico City plateau, Atmos. Chem. Phys., 8, 1559–1575, https://doi.org/10.5194/acp-8-1559-2008, 2008.
Kroll, J. H., Donahue, N. M., Jimenez, J. L., Kessler, S. H., Canagaratna, M. R., Wilson, K. R., Altieri, K. E., Mazzoleni, L. R., Wozniak, A. S., Bluhm, H., Mysak, E. R., Smith, J. D., Kolb, C. E., and Worsnop, D. R.: Carbon oxidation state as a metric for describing the chemistry of atmospheric organic aerosol, Nat. Chem., 3, 133–139, https://doi.org/10.1038/nchem.948, 2011.
Lack, D. A., Cappa, C. D., Covert, D. S., Baynard, T., Massoli, P., Sierau, B., Bates, T. S., Quinn, P. K., Lovejoy, E. R., and Ravishankara, A. R.: Bias in Filter-Based Aerosol Light Absorption Measurements Due to Organic Aerosol Loading: Evidence from Ambient Measurements, Aerosol Sci. Technol., 42, 1033–1041, https://doi.org/10.1080/02786820802389277, 2008.
Laing, J. R., Jaffe, D. A., and Hee, J. R.: Physical and optical properties of aged biomass burning aerosol from wildfires in Siberia and the Western USA at the Mt. Bachelor Observatory, Atmos. Chem. Phys., 16, 15185–15197, https://doi.org/10.5194/acp-16-15185-2016, 2016.
Levin, E. J. T., McMeeking, G. R., Carrico, C. M., Mack, L. E., Kreidenweis, S. M., Wold, C. E., Moosmüller, H., Arnott, W. P., Hao, W. M., Collett Jr, J. L., and Malm, W. C.: Biomass burning smoke aerosol properties measured during Fire Laboratory at Missoula Experiments (FLAME), J. Geophys. Res.-Atmos., 115, D18210, https://doi.org/10.1029/2009JD013601, 2010.
Lim, C. Y., Hagan, D. H., Coggon, M. M., Koss, A. R., Sekimoto, K., de Gouw, J., Warneke, C., Cappa, C. D., and Kroll, J. H.: Secondary organic aerosol formation from the laboratory oxidation of biomass burning emissions, Atmos. Chem. Phys., 19, 12797–12809, https://doi.org/10.5194/acp-19-12797-2019, 2019.
Liu, X., Zhang, Y., Huey, L. G., Yokelson, R. J., Wang, Y., Jimenez, J. L., Campuzano-Jost, P., Beyersdorf, A. J., Blake, D. R., Choi, Y., St. Clair, J. M., Crounse, J. D., Day, D. A., Diskin, G. S., Fried, A., Hall, S. R., Hanisco, T. F., King, L. E., Meinardi, S., Mikoviny, T., Palm, B. B., Peischl, J., Perring, A. E., Pollack, I. B., Ryerson, T. B., Sachse, G., Schwarz, J. P., Simpson, I. J., Tanner, D. J., Thornhill, K. L., Ullmann, K., Weber, R. J., Wennberg, P. O., Wisthaler, A., Wolfe, G. M., and Ziemba, L. D.: Agricultural fires in the southeastern U.S. during SEAC4RS: Emissions of trace gases and particles and evolution of ozone, reactive nitrogen, and organic aerosol, J. Geophys. Res.-Atmos., 121, 7383–7414, https://doi.org/10.1002/2016JD025040, 2016.
Liu, X., Huey, L. G., Yokelson, R. J., Selimovic, V., Simpson, I. J., Müller, M., Jimenez, J. L., Campuzano-Jost, P., Beyersdorf, A. J., Blake, D. R., Butterfield, Z., Choi, Y., Crounse, J. D., Day, D. A., Diskin, G. S., Dubey, M. K., Fortner, E., Hanisco, T. F., Hu, W., King, L. E., Kleinman, L., Meinardi, S., Mikoviny, T., Onasch, T. B., Palm, B. B., Peischl, J., Pollack, I. B., Ryerson, T. B., Sachse, G. W., Sedlacek, A. J., Shilling, J. E., Springston, S., St. Clair, J. M., Tanner, D. J., Teng, A. P., Wennberg, P. O., Wisthaler, A., and Wolfe, G. M.: Airborne measurements of western U.S. wildfire emissions: Comparison with prescribed burning and air quality implications, J. Geophys. Res.-Atmos., 122, 6108–6129, https://doi.org/10.1002/2016JD026315, 2017.
Marcolli, C., Luo, B. P., Peter, T., and Wienhold, F. G.: Internal mixing of the organic aerosol by gas phase diffusion of semivolatile organic compounds, Atmos. Chem. Phys., 4, 2593–2599, https://doi.org/10.5194/acp-4-2593-2004, 2004.
May, A. A., Levin, E. J. T., Hennigan, C. J., Riipinen, I., Lee, T., Collett Jr., J. L., Jimenez, J. L., Kreidenweis, S. M., and Robinson, A. L.: Gas-particle partitioning of primary organic aerosol emissions: 3. Biomass burning, J. Geophys. Res.-Atmos., 118, 11327–311338, https://doi.org/10.1002/jgrd.50828, 2013.
May, A. A., Lee, T., McMeeking, G. R., Akagi, S., Sullivan, A. P., Urbanski, S., Yokelson, R. J., and Kreidenweis, S. M.: Observations and analysis of organic aerosol evolution in some prescribed fire smoke plumes, Atmos. Chem. Phys., 15, 6323-6335, https://doi.org/10.5194/acp-15-6323-2015, 2015.
McComiskey, A., Schwartz, S. E., Schmid, B., Guan, H., Lewis, E. R., Ricchiazzi, P., and Ogren, J. A.: Direct aerosol forcing: Calculation from observables and sensitivities to inputs, J. Geophys. Res.-Atmos., 113, D09202, https://doi.org/10.1029/2007JD009170, 2008.
Mebust, A. K., Russell, A. R., Hudman, R. C., Valin, L. C., and Cohen, R. C.: Characterization of wildfire NOx emissions using MODIS fire radiative power and OMI tropospheric NO2 columns, Atmos. Chem. Phys., 11, 5839–5851, https://doi.org/10.5194/acp-11-5839-2011, 2011.
Morgan, W. T., Allan, J. D., Bauguitte, S., Darbyshire, E., Flynn, M. J., Lee, J., Liu, D., Johnson, B., Haywood, J., Longo, K. M., Artaxo, P. E., and Coe, H.: Transformation and ageing of biomass burning carbonaceous aerosol over tropical South America from aircraft in situ measurements during SAMBBA, Atmos. Chem. Phys., 20, 5309–5326, https://doi.org/10.5194/acp-20-5309-2020, 2020.
Nemesure, S., Wagener, R., and Schwartz, S. E.: Direct shortwave forcing of climate by anthropogenic sulfate aerosol: Sensitivity to particle size, composition, and relative humidity, J. Geophys. Res., 100, 26105–26116, 1995.
Neuman, J. A., Parrish, D. D., Ryerson, T. B., Brock, C. A., Wiedinmyer, C., Frost, G. J., Holloway, J. S., and Fehsenfeld, F. C.: Nitric acid loss rates measured in power plant plumes, J. Geophys. Res.-Atmos., 109, D23304, https://doi.org/10.1029/2004JD005092, 2004.
Ng, N. L., Canagaratna, M. R., Jimenez, J. L., Chhabra, P. S., Seinfeld, J. H., and Worsnop, D. R.: Changes in organic aerosol composition with aging inferred from aerosol mass spectra, Atmos. Chem. Phys., 11, 6465–6474, https://doi.org/10.5194/acp-11-6465-2011, 2011.
Noyes, K. J., Kahn, R., Sedlacek, A., Kleinman, L., Limbacher, J., and Li, Z.: Widfire smoke particle properties and evolution, from spaced-based multi-angle imaging, Remote Sens., 12, 769, https://doi.org/10.3390/rs12050769, 2020.
Olfert, J. S., Kulkarni, P., and Wang, J.: Measuring aerosol size distributions with the fast integrated mobility spectrometer, J. Aerosol Sci., 39, 940–956, https://doi.org/10.1016/j.jaerosci.2008.06.005, 2008.
Olszyna, K. J., Bailey, E. M., Simonaitis, R., and Meagher, J. F.: O3 and NOy relationships at a rural site, J. Geophys. Res.-Atmos., 99, 14557–14563, https://doi.org/10.1029/94JD00739, 1994.
Onasch, T. B., Trimborn, A., Fortner, E. C., Jayne, J. T., Kok, G. L., Williams, L. R., Davidovits, P., and Worsnop, D. R.: Soot Particle Aerosol Mass Spectrometer: Development, Validation, and Initial Application, Aerosol Sci. Technol., 46, 804–817, https://doi.org/10.1080/02786826.2012.663948, 2012.
Onasch, T., Avery, A., Shilling, J., Wormhoudt, J., Sedlacek, A. J., Fortner, E., Pekour, M., Zhou, S., Collier, S., Zhang, Q., Kleinman, L., Lewis, E. R., Freedman, A., and Williams, L.: Chemical Composition of Biomass Burning Particles Measured with a Soot Particle Aerosol Mass Spectrometer Downwind during the BBOP Study, 10th International Aerosol Conference, St. Louis, MO, 2–7 September, 2018.
Sakamoto, K. M., Laing, J. R., Stevens, R. G., Jaffe, D. A., and Pierce, J. R.: The evolution of biomass-burning aerosol size distributions due to coagulation: dependence on fire and meteorological details and parameterization, Atmos. Chem. Phys., 16, 7709–7724, https://doi.org/10.5194/acp-16-7709-2016, 2016.
Schmid, B., Tomlinson, J. M., Hubbe, J. M., Comstock, J. M., Mei, F., Chand, D., Pekour, M. S., Kluzek, C. D., Andrews, E., Biraud, S. C., and McFarquhar, G. M.: The DOE ARM Aerial Facility, B. Am. Meteorol. Soc., 95, 723–742, https://doi.org/10.1175/BAMS-D-13-00040.1, 2014.
Schwarz, J. P., Gao, R. S., Fahey, D. W., Thomson, D. S., Watts, L. A., Wilson, J. C., Reeves, J. M., Darbeheshti, M., Baumgardner, D. G., Kok, G. L., Chung, S. H., Schulz, M., Hendricks, J., Lauer, A., Kärcher, B., Slowik, J. G., Rosenlof, K. H., Thompson, T. L., Langford, A. O., Loewenstein, M., and Aikin, K. C.: Single-particle measurements of midlatitude black carbon and light-scattering aerosols from the boundary layer to the lower stratosphere, J. Geophys. Res.-Atmos., 111, D16207, https://doi.org/10.1029/2006JD007076, 2006.
Sedlacek III, A. J. and Lee, J.: Photothermal interferometric aerosol https://doi.org/10.1080/02786820701697812, 2007.
Sedlacek III, A. J., Buseck, P. R., Adachi, K., Onasch, T. B., Springston, S. R., and Kleinman, L.: Formation and evolution of tar balls from northwestern US wildfires, Atmos. Chem. Phys., 18, 11289–11301, https://doi.org/10.5194/acp-18-11289-2018, 2018a.
Sedlacek III, A. J., Onasch, T. B., Nichman, L., Lewis, E. R., Davidovits, P., Freedman, A., and Williams, L.: Formation of Refractory Black Carbon by SP2-Induced Charring of Organic Aerosol, Aerosol Sci. Technol., online, https://doi.org/10.1080/02786826.2018.1531107, 2018b.
Selimovic, V., Yokelson, R. J., McMeeking, G. R., and Coefield, S.: In situ measurements of trace gases, PM, and aerosol optical properties during the 2017 NW US wildfire smoke event, Atmos. Chem. Phys., 19, 3905–3926, https://doi.org/10.5194/acp-19-3905-2019, 2019.
Stockwell, C. E., Yokelson, R. J., Kreidenweis, S. M., Robinson, A. L., DeMott, P. J., Sullivan, R. C., Reardon, J., Ryan, K. C., Griffith, D. W. T., and Stevens, L.: Trace gas emissions from combustion of peat, crop residue, domestic biofuels, grasses, and other fuels: configuration and Fourier transform infrared (FTIR) component of the fourth Fire Lab at Missoula Experiment (FLAME-4), Atmos. Chem. Phys., 14, 9727–9754, https://doi.org/10.5194/acp-14-9727-2014, 2014.
Vakkari, V., Kerminen, V.-M., Beukes, J. P., Tiitta, P., van Zyl, P. G., Josipovic, M., Venter, A. D., Jaars, K., Worsnop, D. R., Kulmala, M., and Laakso, L.: Rapid changes in biomass burning aerosols by atmospheric oxidation, Geophys. Res. Lett., 41, 2644–2651, https://doi.org/10.1002/2014GL059396, 2014.
Wang, J., Pikridas, M., Spielman, S. R., and Pinterich, T.: A fast integrated mobility spectrometer for rapid measurement of sub-micrometer aerosol size distribution, Part I: Design and model evaluation, J. Aerosol Sci., 108, 44–55, https://doi.org/10.1016/j.jaerosci.2017.02.012, 2017.
Weber, R. J., Sullivan, A. P., Peltier, R. E., Russell, A., Yan, B., Zheng, M., de Gouw, J., Warneke, C., Brock, C., Holloway, J. S., Atlas, E. L., and Edgerton, E.: A study of secondary organic aerosol formation in the anthropogenic-influenced southeastern United States, J. Geophys. Res.-Atmos., 112, D13302, https://doi.org/10.1029/2007JD008408, 2007.
Wiedinmyer, C., Akagi, S. K., Yokelson, R. J., Emmons, L. K., Al-Saadi, J. A., Orlando, J. J., and Soja, A. J.: The Fire INventory from NCAR (FINN): a high resolution global model to estimate the emissions from open burning, Geosci. Model Dev., 4, 625–641, https://doi.org/10.5194/gmd-4-625-2011, 2011.
Williams, E. J., Baumann, K., Roberts, J. M., Bertman, S. B., Norton, R. B., F. C. Fehsenfeld, Springston, S. R., Nunnermacker, L. J., Newman, L., Olszyna, K., Meagher, J., Hartsell, B., Edgerton, E., Pearson, J. R., and Rodgers, M. O.: Intercomparison of ground-based NOy measurement techniques, J. Geophys. Res., 103, 22261–222280, 1998.
Yokelson, R. J., Crounse, J. D., DeCarlo, P. F., Karl, T., Urbanski, S., Atlas, E., Campos, T., Shinozuka, Y., Kapustin, V., Clarke, A. D., Weinheimer, A., Knapp, D. J., Montzka, D. D., Holloway, J., Weibring, P., Flocke, F., Zheng, W., Toohey, D., Wennberg, P. O., Wiedinmyer, C., Mauldin, L., Fried, A., Richter, D., Walega, J., Jimenez, J. L., Adachi, K., Buseck, P. R., Hall, S. R., and Shetter, R.: Emissions from biomass burning in the Yucatan, Atmos. Chem. Phys., 9, 5785–5812, https://doi.org/10.5194/acp-9-5785-2009, 2009.
Yokelson, R. J., Andreae, M. O., and Akagi, S. K.: Pitfalls with the use of enhancement ratios or normalized excess mixing ratios measured in plumes to characterize pollution sources and aging, Atmos. Meas. Tech., 6, 2155–2158, https://doi.org/10.5194/amt-6-2155-2013, 2013.
Zhang, Q., Zhou, S., Collier, S., Jaffe, D., Onasch, T., Shilling, J., Kleinman, L., and Sedlacek, A.: Understanding Composition, Formation, and Aging of Organic Aerosols in Wildfire Emissions via Combined Mountain Top and Airborne Measurements, in: Multiphase Environmental Chemistry in the Atmosphere, ACS Symposium Series, Vol. 1299, ACS Symposium Series, 363–385, 2018.
Zhang, X., Pandis, S. N., and Seinfeld, J. H.: Diffusion-Limited Versus Quasi-Equilibrium Aerosol Growth, Aerosol Sci. Technol., 46, 874–885, https://doi.org/10.1080/02786826.2012.679344, 2012.
Zhou, S., Collier, S., Jaffe, D. A., Briggs, N. L., Hee, J., Sedlacek III, A. J., Kleinman, L., Onasch, T. B., and Zhang, Q.: Regional influence of wildfires on aerosol chemistry in the western US and insights into atmospheric aging of biomass burning organic aerosol, Atmos. Chem. Phys., 17, 2477–2493, https://doi.org/10.5194/acp-17-2477-2017, 2017.