the Creative Commons Attribution 4.0 License.
the Creative Commons Attribution 4.0 License.
 | 10 Nov 2020
Variability in gaseous elemental mercury at Villum Research Station, Station Nord, in North Greenland from 1999 to 2017
Jens Hjorth
Claus Nordstrøm
Bjarne Jensen
Christel Christoffersen
Maria Bech Poulsen
Jesper Baldtzer Liisberg
David Beddows
Manuel Dall'Osto
Jesper Heile Christensen
Mercury is ubiquitous in the atmosphere, and atmospheric transport is an important source for this element in the Arctic. Measurements of gaseous elemental mercury (GEM) have been carried out at Villum Research Station (Villum) at Station Nord, situated in northern Greenland. The measurements cover the period 1999–2017, with a gap in the data for the period 2003–2008 (for a total of 11 years). The measurements were compared with model results from the Danish Eulerian Hemispheric Model (DEHM) that describes the contribution from direct anthropogenic transport, marine emissions and general background concentration. The percentage of time spent over different surfaces was calculated by back-trajectory analysis, and the reaction kinetics were determined by a comparison with ozone.
The GEM measurements were analysed for trends, both seasonal and annual. The only significant trends found were negative ones for the winter and autumn months. Comparison of the measurements to simulations using the Danish Eulerian Hemispheric Model (DEHM) indicated that direct transport of anthropogenic emissions of mercury accounts for between 14 % and 17 % of the measured mercury. Analysis of the kinetics of the observed atmospheric mercury depletion events (AMDEs) confirms the results of a previous study at Villum of the competing reactions of GEM and ozone with Br, which suggests that the lifetime of GEM is about a month. However, a GEM lifetime of 12 months gave the best agreement between the model and measurements. The chemical lifetime is shorter, and thus, the apparent lifetime appears to be the result of deposition followed by reduction and re-emission; for this reason, the term “relaxation time” is preferred to “lifetime” for GEM. The relaxation time for GEM causes a delay between emission reductions and the effect on actual concentrations.
No significant annual trend was found for the measured concentrations of GEM over the measurement period, despite emission reductions. This is interesting, and together with low direct transport of GEM to Villum as found by the DEHM model, it shows that the dynamics of GEM are very complex. Therefore, in the coming years, intensive measurement networks are needed to describe the global distribution of mercury in the environment as the use of models to predict future levels will still be highly uncertain. The situation is increasingly complex due to global changes that most likely will change the transport patterns of mercury, not only in the atmosphere but also between matrixes.
- Article
(2502 KB) - Full-text XML
- BibTeX
- EndNote


The effects of long-range atmospheric transport of anthropogenic pollutants into the Arctic are well documented; contaminants are affecting the Arctic by the contamination of food chains and by altering the radiation budget, thus contributing to climate change (UNEP, 2013; AMAP/UNEP 2013; Heidam et al., 2004; Breider et al., 2017). There are still only a few local sources of pollutants in the Arctic, and long-range transport, mainly from mid-latitudes, represents the main source.
Mercury (Hg) is one of the first substances that has been identified as a pollutant in the food web worldwide, causing adverse effects on human health and wildlife. The Minamata Convention, aiming to reduce the exposure of human beings and the environment to mercury, was signed in 2013 (UNEP, 2013), and it entered into force in 2017.
The sources of mercury in the environment can be divided into terrestrial emissions (including geogenic, biomass burning and re-emissions from soils and vegetation), anthropogenic and oceanic emissions accounting for 2.1, 2.5 and 3.4 ktonnes of the emissions, respectively (Outridge et al., 2018). This is in good agreement with other estimates. The global anthropogenic emissions of mercury were estimated as being 2.5 ktonnes in 2010 (UNEP, 2013; AMAP/UNEP, 2013), and including the large uncertainty of these numbers, they are not significantly different. According to an estimate by (Pirrone et al., 2010) natural sources and re-emission processes (hereafter referred to as background sources), accounted for 5207 Mg yr−1 in 2005, while the amount of new anthropogenic inputs is 2320 Mg yr−1, also close to the latest emission estimate (Outridge et al., 2018). According to recent assessments (Pacyna et al., 2010; Pirrone et al., 2010; AMAP/UNEP, 2013; Muntean et al., 2014), the main anthropogenic sources of atmospheric mercury are coal combustion and artisanal as well as small gold mining, with relevant contributions from non-ferrous metal smelting and iron and steel production, along with several other industrial/residential sources such as waste incineration. The main background source is evasion from ocean surfaces, accounting for about half of the sum of the natural and re-emission contributions (Pirrone et al., 2010). Re-emission of deposited atmospheric mercury of anthropogenic origin gives a major contribution to the re-emission budget; for example, it has been found that the accumulation of mercury inputs from anthropogenic sources to oceans have led to an increase in the mercury concentration in surface waters of about a factor of 3 (Lamborg et al., 2014). Mercury is transported by rivers, sea currents and in the troposphere. Mercury in the air is mainly found in the gas phase, where the major part is gaseous elemental mercury (GEM), covering more than 90 %, while a minor part is oxidised mercury and particle-bound mercury. The share of oxidised mercury in the overall global emissions of mercury has been estimated to be around 25 %, based on speciation factors from the Arctic Monitoring and Assessment Program (Muntean et al., 2018). The atmospheric lifetime of GEM has earlier been estimated to be in the range of about 1 year (Steffen et al., 2008), while those of oxidised forms of mercury are shorter. Theoretical and laboratory studies showed that the lifetime of GEM towards bromine-initiated oxidation is much shorter than 1 year (Balabanov et al., 2005; Dibble et al., 2012; Donohoue et al., 2005, 2006; Goodsite et al., 2004, 2012; Jiao and Dibble, 2017). Applying the latest kinetic data, Horowitch et al. (2017) found a lifetime in the atmosphere of GEM, with respect to removal by oxidation, of 2.7 months using the GEOS–CHEM model coupled to an ocean general circulation model (MITgcm). Including photoreduction, the lifetime of total gaseous mercury (TGM) was found to be 5.2 months, close to the value of 6.1 months in Holmes et al. (2010), by applying a much higher Br concentration and, consequently, also a faster photoreduction to reach a similar result. The deposition rate depends on the chemical processes that transform GEM into the less volatile HgII species; these processes are only partially understood (Angot et al., 2016). Chemical conversion of GEM to HgII seems to be particularly important in the Arctic area, where ozone and mercury chemistry have been found to be coupled during events where both are observed at ground level to be depleted from the air. There is strong evidence that these depletion episodes are caused by the photochemical formation of bromine atoms (Skov et al., 2004, 2006; Goodsite et al., 2004, 2012; Kamp et al., 2018), and recently, direct evidence was found for bromine-initiated AMDEs and ozone-depletion episodes (ODEs) (Wang et al., 2019).
The geographical distribution of the emissions has changed in the last few decades, where Asian countries have gained importance compared to emissions in Europe, North America and Japan. Today, China accounts for about 40 % of the global Hg emissions (Muntean et al., 2014; Streets et al., 2019, 2017, 2018). In North America, Europe and on the North Atlantic, there is a decline in the GEM concentration of between −1.5 % yr−1 and −2.2 % yr−1 (Zhang et al., 2016). In the Arctic, the decline is zero at Svalbard (Berg et al., 2013) and −0.9 % at Alert (Cole et al., 2013).
The aim of the present article is to present and discuss the long time series of GEM measurements at Villum Research Station (Villum) at Station Nord in northern Greenland, with a focus on observed interannual and seasonal trends, and the likely explanations for these in terms of sources, transport patterns and dynamics.
2.1 Measurements
Villum at Station Nord in North Greenland is the second-most northerly, permanently open station in the Arctic, preceded only by Alert, Canada. The station has all the logistic requirements and infrastructure that are necessary for being a major international platform for scientific studies focused on the Arctic cryosphere, nature and interaction with humans. It is located in the furthermost northeastern corner of Greenland on the north–south oriented peninsula of Princess Ingeborg Halvø (81∘36′ N, 16∘40′ W), whose northern end is a 20 × 15 km2 Arctic lowland plain (see Fig. 1). Villum is an important logistic site for many scientific research activities in the Greenland National Park in northern Greenland (see http://www.villumresearchstation.dk, last access: 4 November 2020). Ozone and GEM were measured at Flyger's hut from 1996 to 1999, respectively, and until 2014 when the measurements were moved to the newly built Air Observatory (Fig. 2), where they continue to this day.

Figure 1The position of Villum Research Station at Station Nord in northern Greenland. The blue area represents the Greenland National Park.
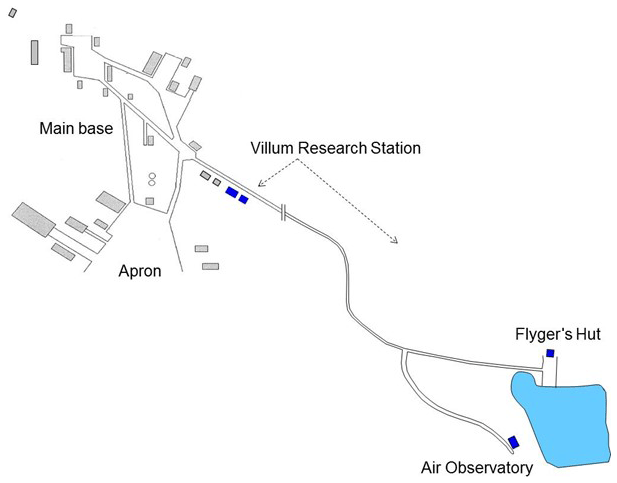
Figure 2Map of Villum Research Station with its buildings (blue) relative to the Station Nord military outpost. Flyger's hut and the Air Observatory are located about 2 km outside main base of Station Nord. Until 2014, all measurements were performed at Flyger's hut; thereafter, they were moved to the Air Observatory.
Since 1999, GEM has been measured by a Tekran 2537 mercury analyser. In the first few years, funding was only available for 6 months per year of observations, and thus, the data coverage over the entire year is limited to spring, summer and early autumn, except for the very first year. There are no measurements available for the years 2003–2008 as the research station was closed. Several generations of the instrument have been used (A, B and X versions), but we estimate that the uncertainty of measuring GEM has remained unchanged over the years as they are all calibrated towards the same standard, based on the vapour pressure of Hg0, using a Tekran 2505 calibration unit. The principle of the instruments is as follows: a measured volume of sample air is drawn through a gold trap that quantitatively retains elemental mercury. The collected mercury is desorbed thermally from the gold trap and is transferred by argon into the detection chamber, where the amount of mercury is detected by cold vapour atomic fluorescence spectroscopy. The detection limit is 0.1 ng m−3, and the reproducibility for concentrations above 0.5 ng m−3 is within 20 %, based on parallel measurements with two Tekran 2537A mercury analysers (at a 95 % confidence interval), using the principles described in the ISO/IEC Guide 98-3:2008 on the uncertainty of measurement (GUM, 1995). The calibration of the instrument is checked every 25 h by adding known quantities of elemental mercury to the detection system from an internal permeation source. The sample air was either taken through a sample tube heated to 50 ∘C or by drawing sample air from a 20 cm diameter stainless steel sample tube. The flow rate in the stainless steel tube was > 1 m3 min−1. Comparison of measurements from the two different sample lines did not reveal any difference within the uncertainty of the instruments. Prior to entering the instrument, air passes a soda lime trap to avoid the passivation of the gold traps.
Ozone has been measured since 1996. Though different instruments have been applied, the measurement uncertainty is unchanged, as the basic principle in all instruments is the absorption of UV light at 254 nm. The stability of the instruments is ensured by the addition of known concentrations of ozone from an internal ozone generator traceable to a primary standard. The uncertainty at a 95 % confidence level is < 7 % for concentrations above 20 and 1.4 parts per billion by volume (ppbv) for concentrations below 20 ppbv.
The calculation of interannual trends was performed by applying the non-parametric Mann–Kendall test and Sen's slope calculation, using the programme developed by Salmi et al. (2002).
2.2 Model calculations
We have applied the Danish Eulerian Hemispheric Model (DEHM) to calculate the concentrations and direct contributions from different source areas to the concentration levels in the air at Villum as a function of a prescribed chemical lifetime of Hg0 and the meteorological variability in the atmospheric transport from source areas.
DEHM is a 3D, offline, large-scale, Eulerian, atmospheric chemistry transport model (CTM) developed to study the long-range transport of air pollution in the Northern Hemisphere, with a focus on the Arctic or Europe. The model domain used in previous studies covers most of the Northern Hemisphere, discretised on a polar stereographic projection, and includes a two-way nesting procedure with several nests with higher resolution over Europe, Northern Europe and Denmark or the Arctic (Frohn et al., 2002; Brandt et al., 2012).
DEHM was originally developed in the early 1990s to study the atmospheric transport of sulfur and sulfate into the Arctic (Christensen, 1997; Heidam et al., 1999, 2004), and it has been used to study the transport of mercury to the Arctic (Christensen et al., 2004; Skov et al., 2004).
The model system has been set up with one model domain with 150 × 150 grid points. The domain covers the Northern Hemisphere, with a grid resolution on 150 km at 60∘ N. The vertical grid is defined using the σ coordinate system, with 29 vertical layers extending up to a height of 100 hPa.
The DEHM model is driven by meteorological data from the Advanced Research Weather Research and Forecasting model version 3.6 (WRF–ARW; Skamarock et al., 2008). This WRF model simulation was driven by global meteorological ERA-Interim data, which are a global atmospheric reanalysis data set from the European Centre for Medium-Range Weather Forecasts (ECMWF), starting from 1979 and being continuously updated in real time. These data have been inserted into the WRF model every 6 h. The WRF model has been run in a climate mode set-up, e.g.continuously updating sea surface temperature and deep soil temperature (both from the ERA-Interim).
The global historical AMAP Hg emissions inventories for 1990–2010 have been used as the anthropogenic emissions (AMAP/UNEP, 2013) for the model run with variable emissions. The 1990 emissions have been used for the model calculations for the period 1990–1992, 1995 emissions for the years 1993–1997, 2000 emissions for 1998–2002, 2005 emissions for 2003–2007 and, finally, the 2010 emissions for 2008–2017. The emissions for 2005 were used for the model run with constant emissions.
Emissions of mercury from biomass burning were based on CO emissions obtained from the Global Fire Emissions Database version 3 (van der Werf et al., 2006), where a fixed Hg0 ∕ CO ratio of 8 kg Hg0 (kg CO)−1 was applied. Emissions from oceans are based on calculated fluxes from the GEOS-Chem model (Soerensen et al., 2010).
The system has been set up with 11 different GEM tracers which represent eight different anthropogenic source areas (Russia, Eastern Europe, Western Europe, China, North America, the rest of Asia, Africa and South America) and biomass burning, ocean sources and the prescribed boundary conditions on 1.5 ng m−3 for the entire period. The latter is introduced because of the long lifetime of Hg0, and it accounts for the transport across the Equator with the exchange velocity between the two hemispheres of about 1 year. The boundary condition concentration of 1.5 ng m−3 represents the typical global background concentrations, which account for all emissions in both hemispheres, and are close to the concentrations at Equator as given in Selin et al. (2008). The boundary conditions were kept constant during the period covered by the model.
There have been 2 × 3 different model runs covering the period from 1990 to 2017, with two main emission set-ups, which are with either constant anthropogenic missions (using the emissions in 2005 for all years) or the variable emissions for 1990–2010. Each emission set-up is run with a simple fixed first-order reaction lifetime for Hg0 of 1 month, 6 months and 1 year, respectively. The model does not include Arctic mercury depletion in the runs presented here; it focuses only on the direct long-range transported mercury contribution to the GEM concentration at Villum. For each model run the contributions of the 11 different tracers are estimated in order to investigate this contribution as a function of the fixed first-order reaction lifetime for Hg0 and changing meteorology and changing emissions.
2.3 Trajectory model
In order to investigate the influence of different surfaces on the GEM concentration, 120 h back trajectories for air masses arriving at 100 m altitude at Villum were calculated with an hourly resolution using the British Atmospheric Data Centre (BADC) trajectory service. For each of the trajectories, the time spent over different surfaces was calculated using a polar stereographic map of the Northern Hemisphere, where each of the 1024 × 1024 24 km grid cells were classified as land, sea, snow or sea ice, and thus, the percentage of the total transport time spent over these four types of surfaces could be calculated. The snow and ice coverage values were generated by the National Oceanic and Atmospheric Administration (NOAA) and National Environmental Satellite, Data, and Information Service (NESDIS) Interactive Multisensor Snow and Ice Mapping System (IMS) developed by the interactive processing branch of the Satellite Services Division. Concerning the sea ice coverage, a similar calculation was performed using daily stereographic maps of sea ice concentration with a resolution of 12.5 km, also available from NOAA/NESDIS. This calculation allowed the establishment of the percentage of time in which the air mass of the back trajectory was passing over sea ice, as done earlier in studies of atmospheric particle dynamics (Dall'Osto et al., 2018). Combining these calculations for the periods during which GEM measurements were carried out at Villum, the percentages of the 120 h duration of the trajectory, where the air masses passed over land, sea, snow and sea ice surfaces could be established.
The measurements of GEM and ozone from 1996 to 2017 are shown in Fig. 3. A seasonal pattern is observed for each year (see Fig. 4). In January and February, the level of ozone and GEM is rather stable. After the polar sunrise, the concentration starts to fluctuate strongly, and ozone and GEM are depleted quickly (within 2 to 10 h). Figure 5 shows the variations in the yearly average GEM concentration and the average for the winter season between 1999 and 2018, where only periods with more than 50 % data coverage have been included. The annual averages show a negative trend; however, it is not significant at a 90 % confidence level. The autumn (September, October and November – SON) and the winter months both show negative trends that are significant at a 90 % confidence level. The trends, in a percentage of the average GEM concentrations during these periods, are −1.7 % yr−1 for the winter period and −1.4 % yr−1 for autumn. The annual trend also remains insignificant when excluding the years 1999 and 2000 or the extreme value in 2017. The lack of a significant annual trend seems to be explained by the high variability in the concentrations during the spring period and the fact that the GEM concentration during the summer period show no evidence of a decreasing trend. This result is similar to the result obtained at Zeppelin station on Svalbard, Norway, for the period 2000 to 2008 (Berg et al., 2013) and, as previously mentioned, at Alert, Canada, where a negative trend of −0.009 ng m−3 (−0.58 % yr−1) is seen for the period between 1995 and 2008 (Steffen et al., 2015). A study of GEM in firn snow from the Greenlandic inland ice, at about 3 km altitude, Dommergue et al. (2016), showed that there is a positive trend or no trend during the period of 2000–2010, though the authors pointed out that nothing can conclusively be said about the concentration trends based on their results. The behaviour of the trends may, in principle, be explained by changes in the emissions in the source regions, in transport patterns, in deposition, re-emission and atmospheric chemistry. The seasonal differences in the trends must be explained by a different influence of these factors during the different seasons. Finally, it has been suggested that decreasing GEM concentrations in the Northern Hemisphere over the last 20 years may be partially explained by increased uptake by vegetation due to increased net primary productivity (Jiskra et al., 2018). Our data set does not permit an evaluation of this hypothesis.
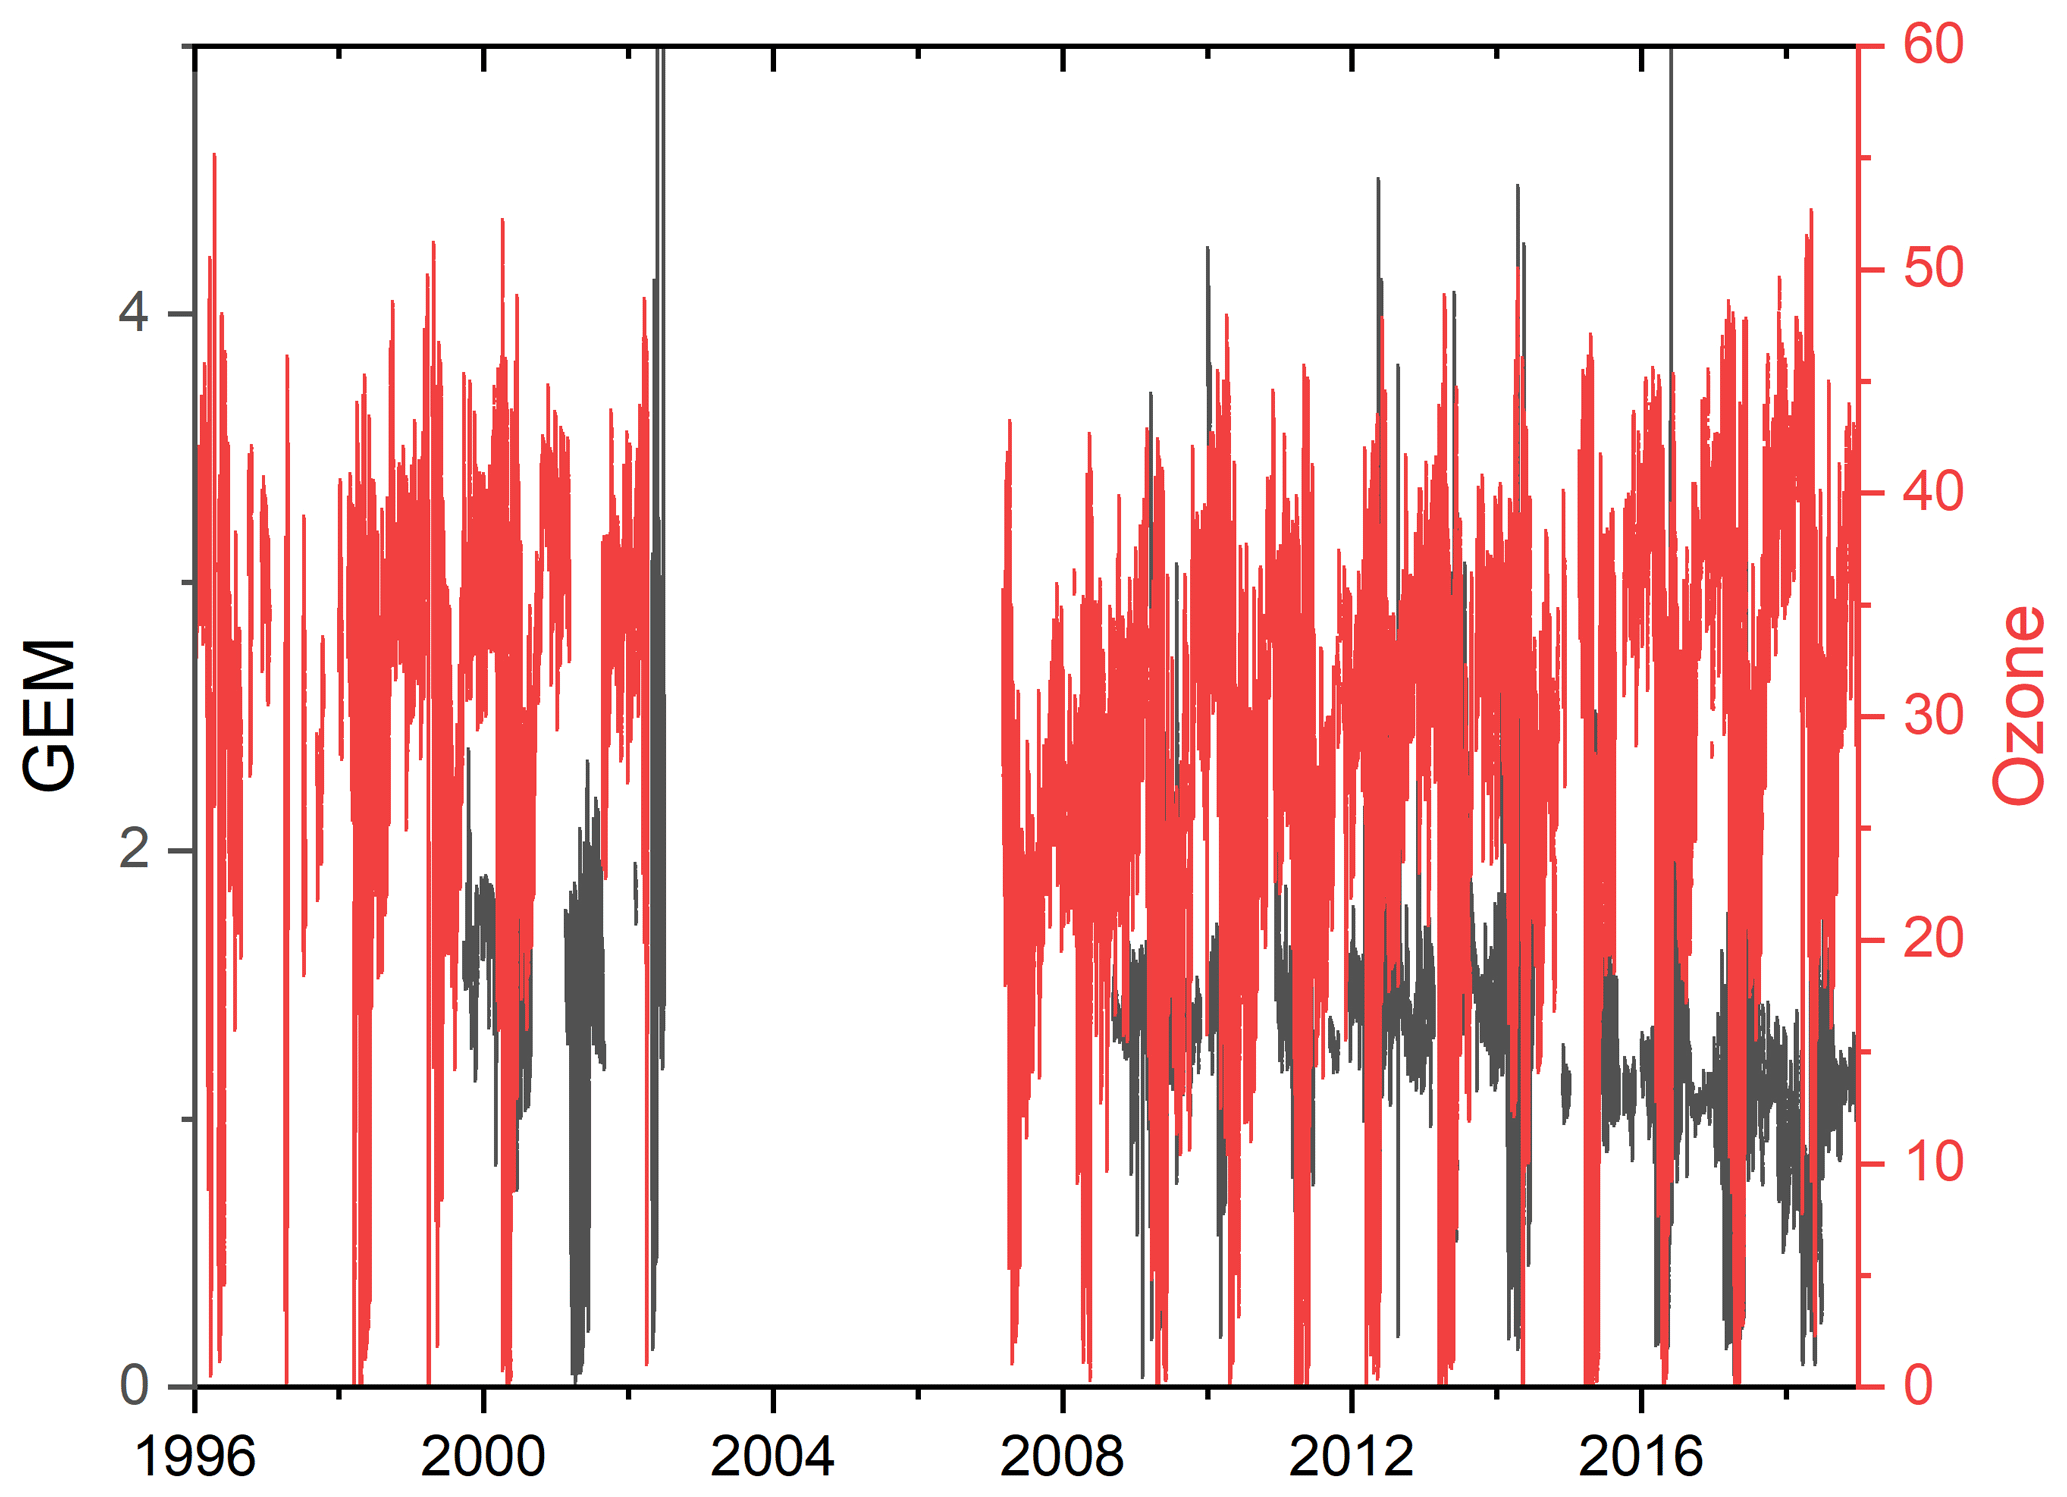
Figure 3Time series of the concentration of GEM and the mixing ratio of ozone at Villum Research Station.
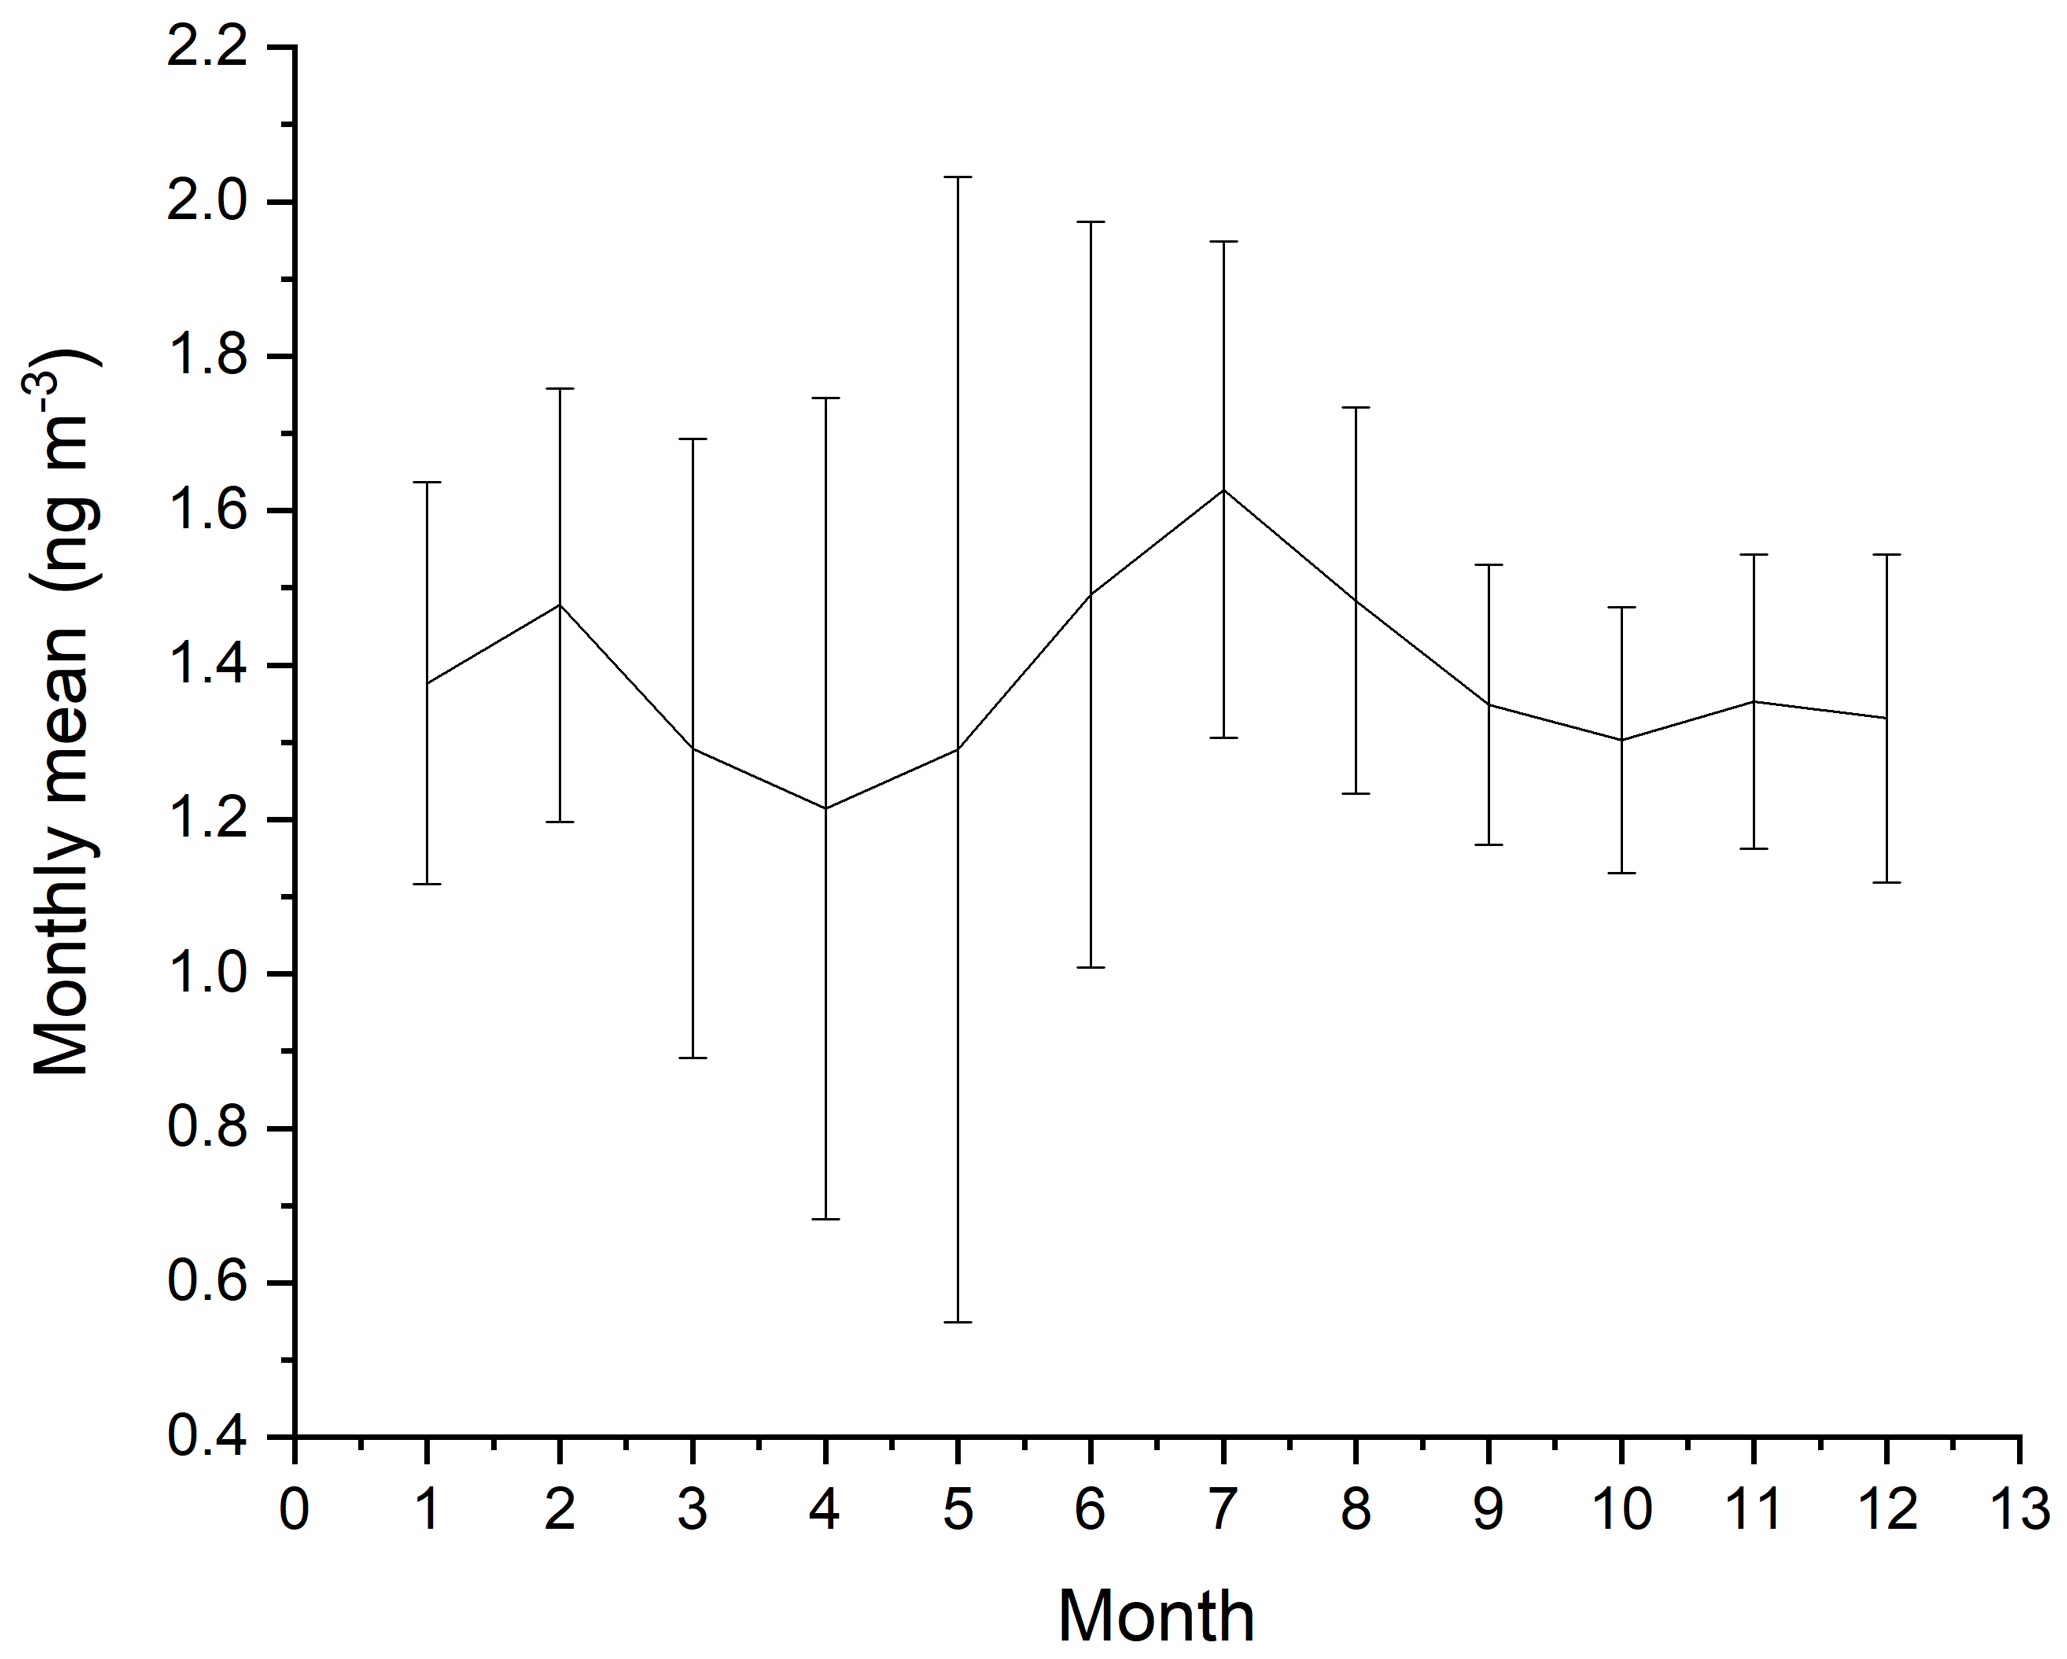
Figure 4Monthly averages of GEM for the years 1999 to 2002 and 2008 to 2018 at Villum Research Station. The spread in monthly mean value is shown as ± 1 SD.
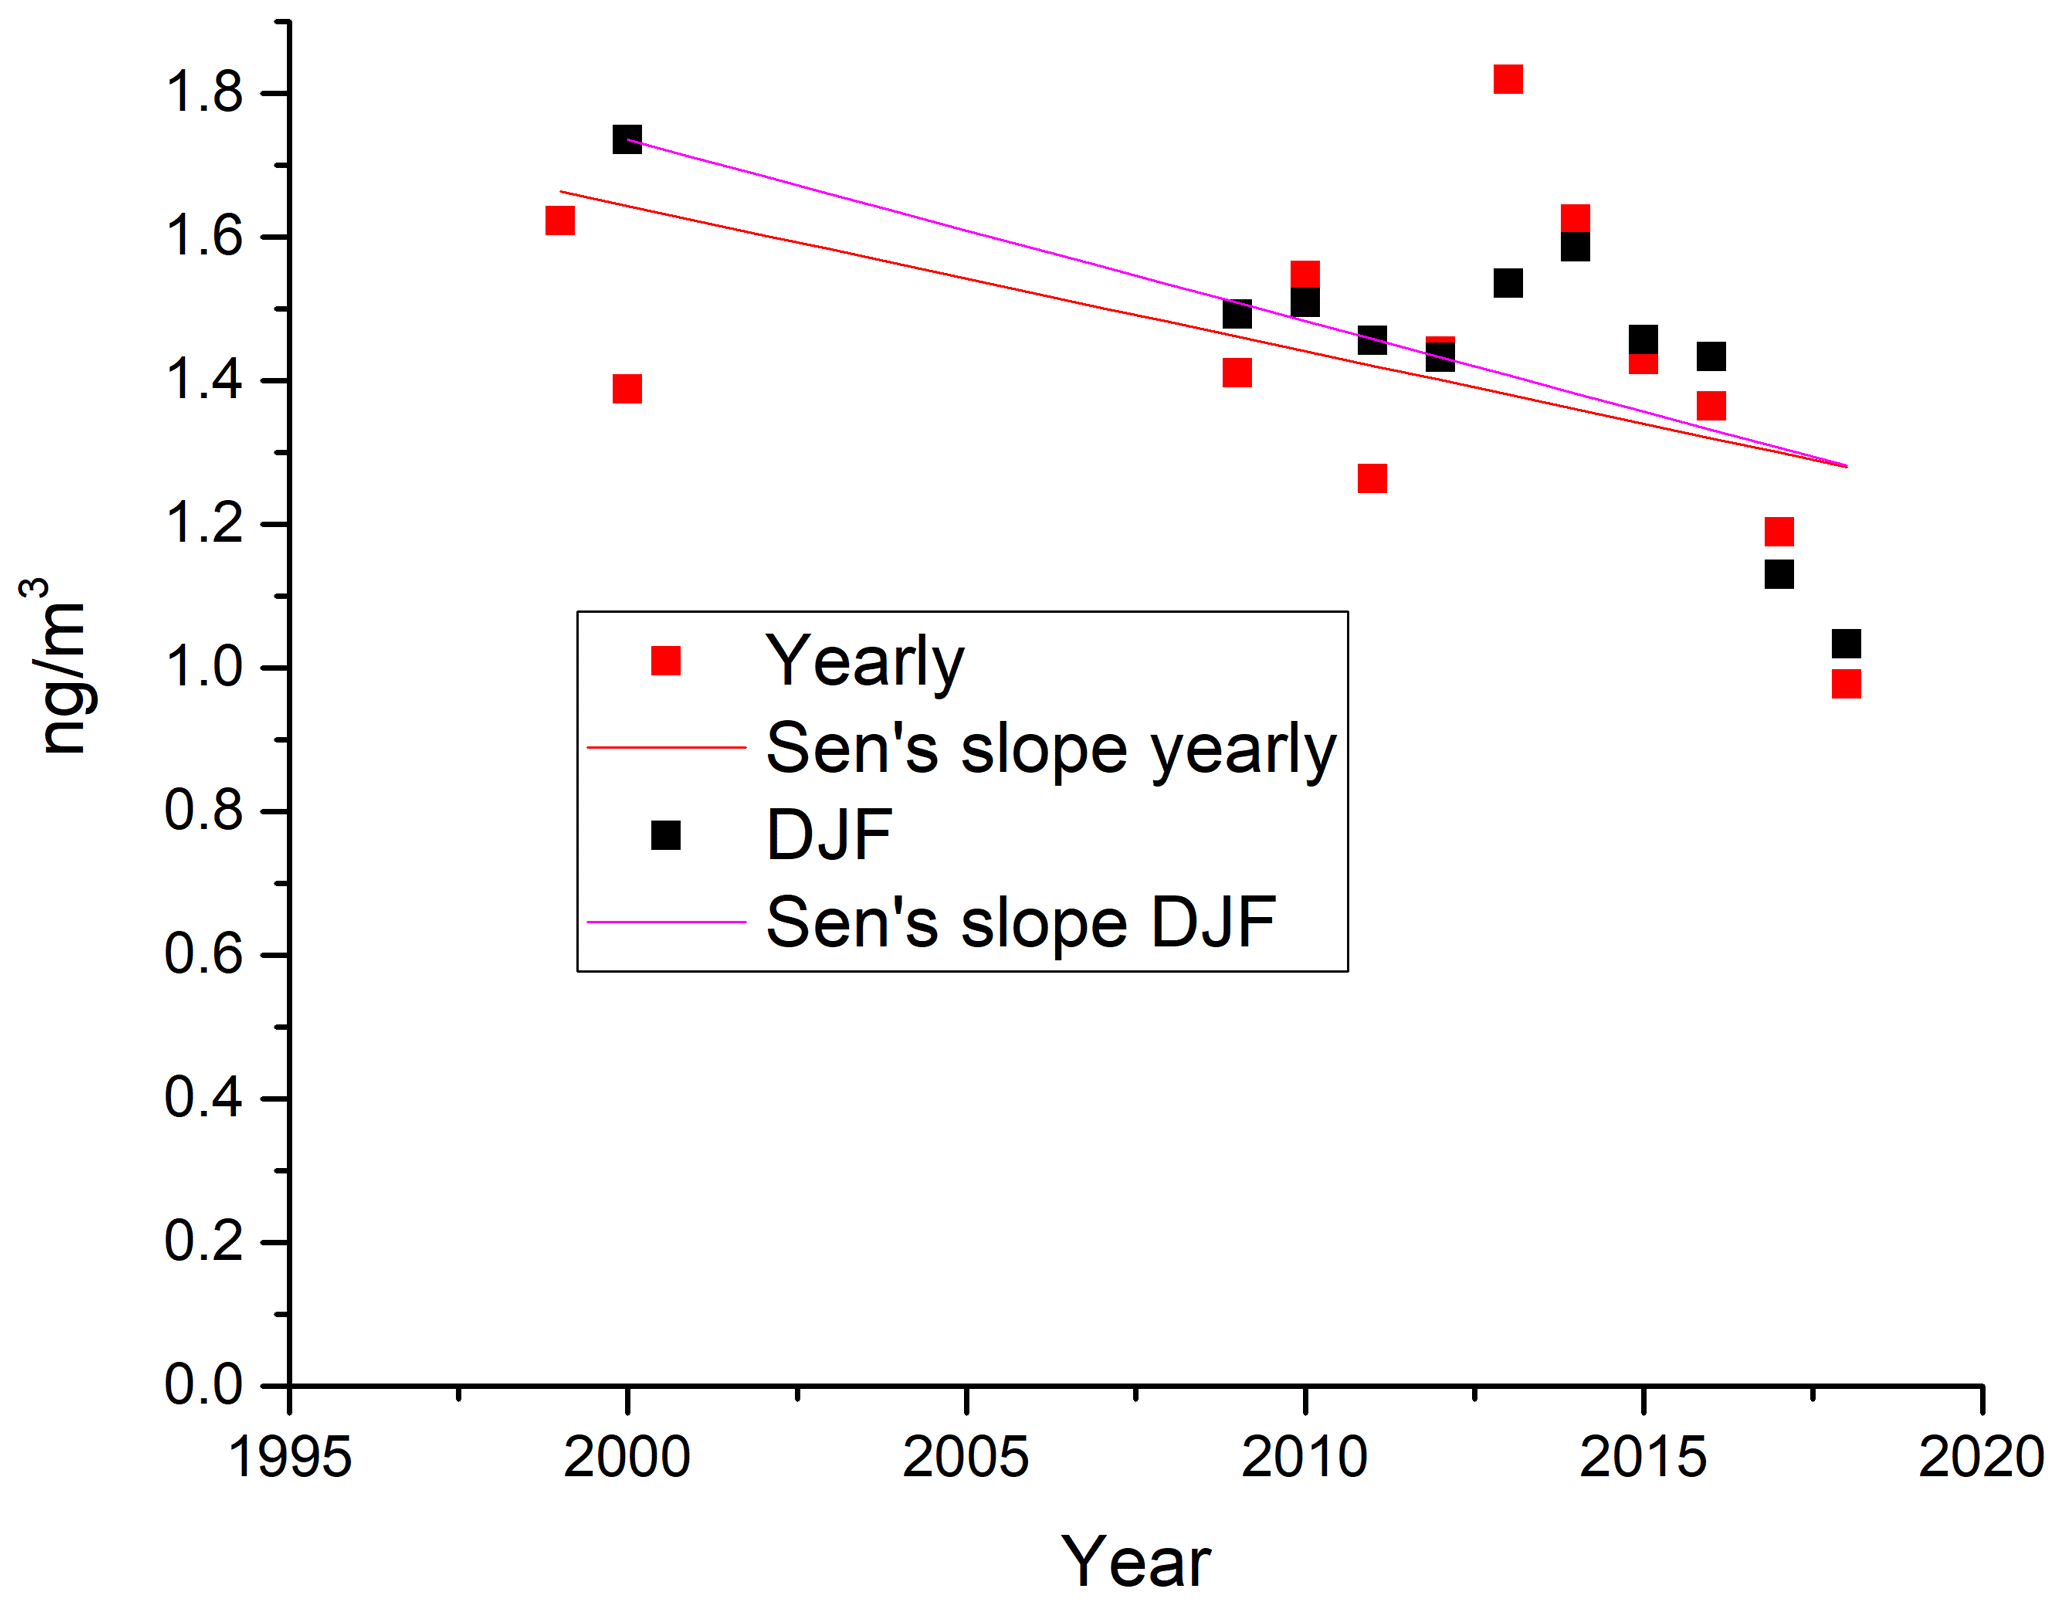
Figure 5Yearly (orange) and winter season (December, January and February – DJF; blue) average values of measured GEM concentrations at Villum, with trend lines.
3.1 Changes in atmospheric chemistry
The strongest concentration trend is found during the winter, when photochemically driven chemistry obviously does not take place in the area, but where long-range transport from mid-latitudes is at its maximum. The main influence of Arctic atmospheric chemistry on GEM concentrations is expected to be in the spring and summer period, when the fate of GEM is believed to depend on the presence of seasonal sea ice and the presence of air temperatures below −4 ∘C (Christensen et al., 2004). Figure 6 shows a conceptual description of mercury removal in the Arctic. A regression analysis of the number of hours with depletion events (defined here as GEM < 0.5 ng m−3) did not show any significant change over the years 2000–2017. The ozone data obtained during the period 1999–2017 also showed no significant trend for the concentrations in spring or summer. The ozone observations will be the subject of a separate publication.

Figure 6The mercury cycle in the Arctic atmosphere, where gaseous elemental mercury (Hg0) is converted to gaseous oxidised mercury (GOM) that is quickly either deposited or converted into total particulate mercury (TPM). The chemical composition of GOM is unknown, and HgBr2 is one suggestion among many.
The data until 2002 were used to investigate the reaction kinetics of ozone and GEM with a third reactant. Log–log plots of ozone against GEM gave a straight line, as seen earlier (Schroeder et al., 1998; Berg et al., 2003; Steffen et al., 2008; Skov et al., 2004). A reaction rate for Br with Hg0 was calculated, which fitted well with a reaction rate determined by theoretical chemistry (Goodsite et al., 2004, 2012; Skov et al., 2004). We conducted the same analysis on the data from 2007 onwards. GEM was averaged to a time resolution of 0.5 h. The new analysis confirmed the previous result, though the data points were more scattered, and thus, the resulting slope had a higher uncertainty, mostly due to smaller difference between the initial GEM concentration and the final concentration. An important point regarding the parameterisation of GEM depletion is that bromine-induced atmospheric mercury depletion events (AMDEs) were often observed under stagnant wind conditions and not only during situations with strong wind that may cause bromine release as proposed earlier (see Yang et al., 2020). Recently, the bromine-induced oxidation of Hg0 has been proven directly in a study, where Br, BrO, O3, GEM and gaseous oxidised mercury (GOM) were measured simultaneously during AMDE and ODE, using a multiphase box model to study the complex set of processes (Wang et al., 2019).
The seasonally averaged concentration has a maximum in the summer (June, July and August – JJA) and a minimum in the spring (March, April and May – MAM). In order to test the hypothesis that the spring minimum is related to the occurrence of the combined mercury and ozone depletion events, an indicator of the duration and frequency of such depletion episodes was created. The number of measured hourly GEM concentrations below 50 % of the average value in a previous event-free period was compared, as a percentage, to the total number of available hourly measurements during the period of interest. For the MAM period, this percentage of AMDE hours was found to be strongly correlated with the average GEM concentrations in the same period (Fig. 7). Thus, there is evidence for a strong impact of AMDE on GEM concentrations in the spring period. The frequency of AMDE in spring and GEM concentration in summer showed a poor negative correlation. If the deposited Hg during AMDE should be released again during snowmelt, a positive correlation would have been expected, but this was not observed. In fact, the analyses indicate that AMDE is a net sink for mercury, which is in agreement with direct flux measurements (Brooks et al., 2006). Interestingly, Angot et al. (2016) found a positive feedback between AMDE in spring and the concentration of GEM in summer at Alert that was attributed to the re-emission of mercury. Contrary to this result, even the annual mean value at Villum had a negative correlation with AMDE hours. Though this correlation is weak, it is an indication that AMDEs affect the GEM concentration level at Villum and represent a net sink. From studies of mercury isotopes at Utqiaġvik on the north coast of Alaska (Douglas et al., 2019) and Toolik research station in central Alaska (Jiskra et al., 2019), it was found that most mercury in meltwater was from the deposition of GEM, and that a large majority of deposited oxidised mercury during AMDE was reduced and reemitted. Further studies are needed to determine if these results are also valid for more northern Arctic locations such as Alert, Villum or Zeppelin.
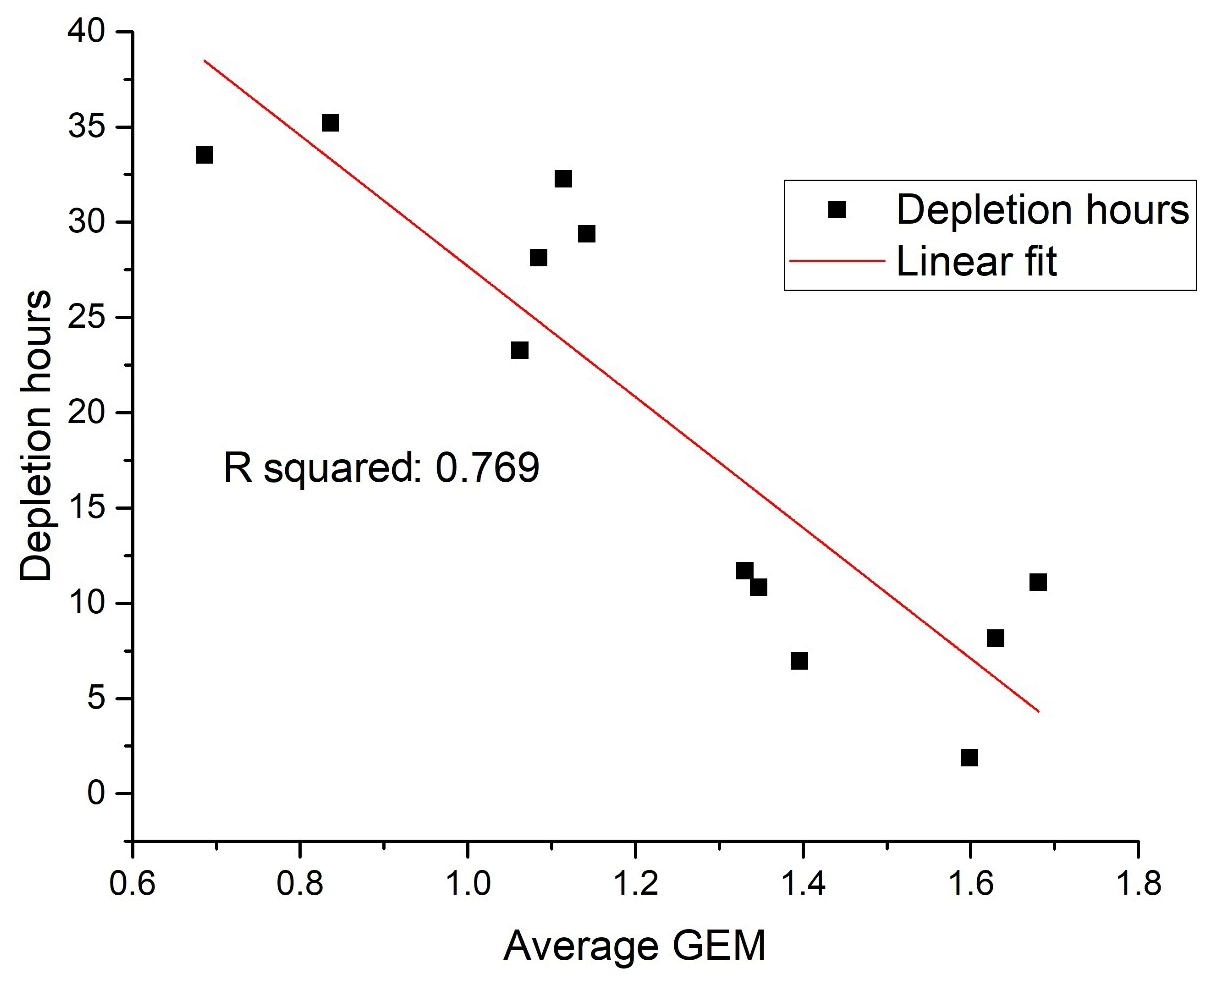
Figure 7Frequency of depletion episodes versus average GEM concentration in March, April and May (MAM). Unit: ng m−3.
It has been determined that outflows from rivers are a main source of Hg in the Arctic Ocean (e.g. Outridge et al., 2008; Fischer et al., 2012). The present study indicates that there is an atmospheric input as well. The significance of this source depends on its chemical form. Previously, atmospheric deposited mercury has been identified to be bioavailable (Moller et al., 2011) and, thus, might still be dominant for the mercury found in the Arctic food web.
3.2 Decrease in the emissions in the source regions
Recent studies show that mercury emissions from Europe and North America have been decreasing since 1990, while emissions in Asia have been increasing (AMAP/UNEP, 2013; Muntean et al., 2014). Russian emissions, considered as a separate entity, have been decreasing as well. Concentration data from cruises on the North Atlantic show a declining trend since 1990, with a steep decrease in the surface seawater Hg0 concentration, between the years of 1998–2000 and 2008–2010, of −5.7 % yr−1. It has been found that the corresponding decrease in mercury emissions from the sea can explain the decreasing trend observed over the North Atlantic and adjacent areas (Soerensen et al., 2012). Chen et al. (2015) found that the decline in atmospheric concentrations at northern mid-latitudes was significant for the period 2000–2009 but much weaker in the Arctic. They explained this by the fact that declining sea ice cover and increasing temperatures caused a tendency towards higher emissions from the sea that (partially) compensates for the forcing by decreasing surface water Hg0 concentrations in the North Atlantic. The observed seasonality, with significant declining tendencies in the atmospheric GEM concentration in winter (December, January and February – DJF) and (weaker) in autumn (SON) but not in spring (MAM) or summer (JJA), may be explained as suggested by Chen et al. (2015). The highest yearly average concentration of GEM was found in 2013; thereafter, there has been a continuous decrease which may be the effect of emission reductions that now is also evident in the high Arctic.
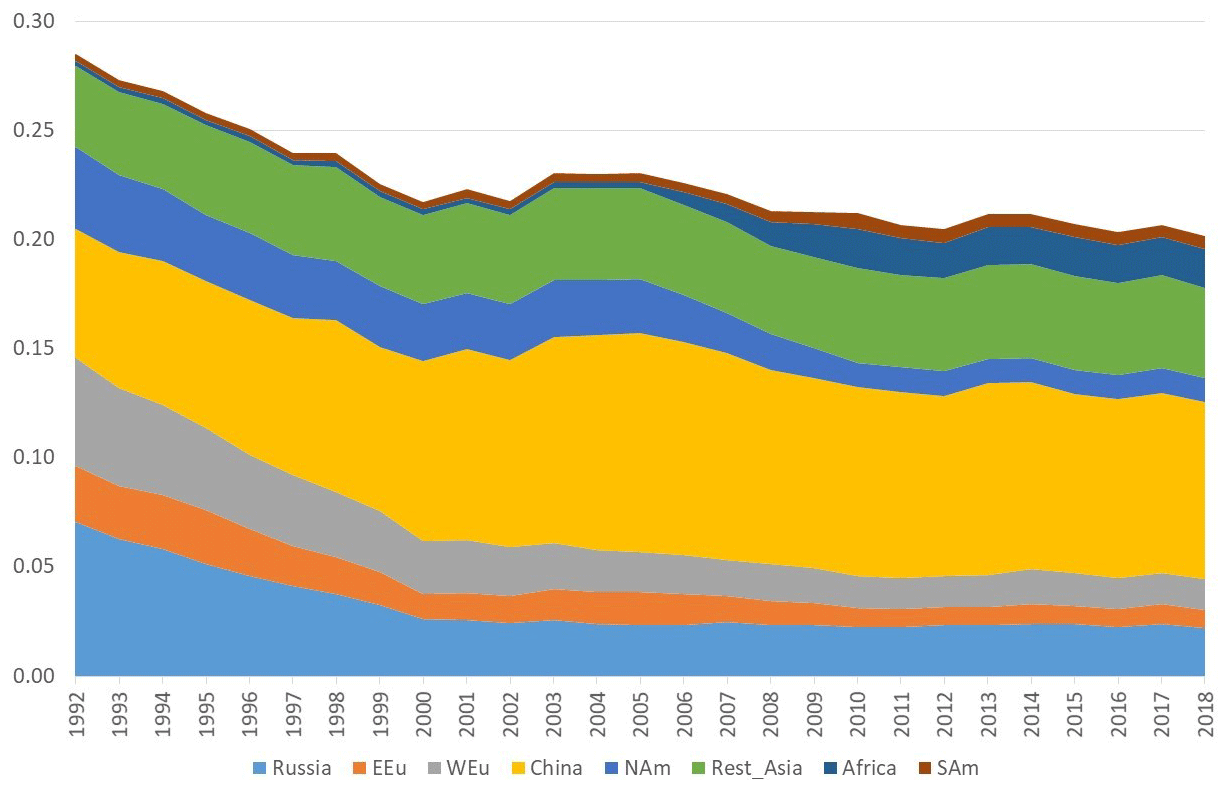
Figure 8Model calculations with variable emissions of the source apportionment of the direct anthropogenic contribution to the annual average GEM concentrations at Villum. The DEHM model was used for 2 years (1990 and 1991) to spin up the model. Source regions: Russia – Russia; EEU – eastern Europe; WEu – western Europe; China – China; Africa – Africa; SAm – South America. Unit: ng m−3.
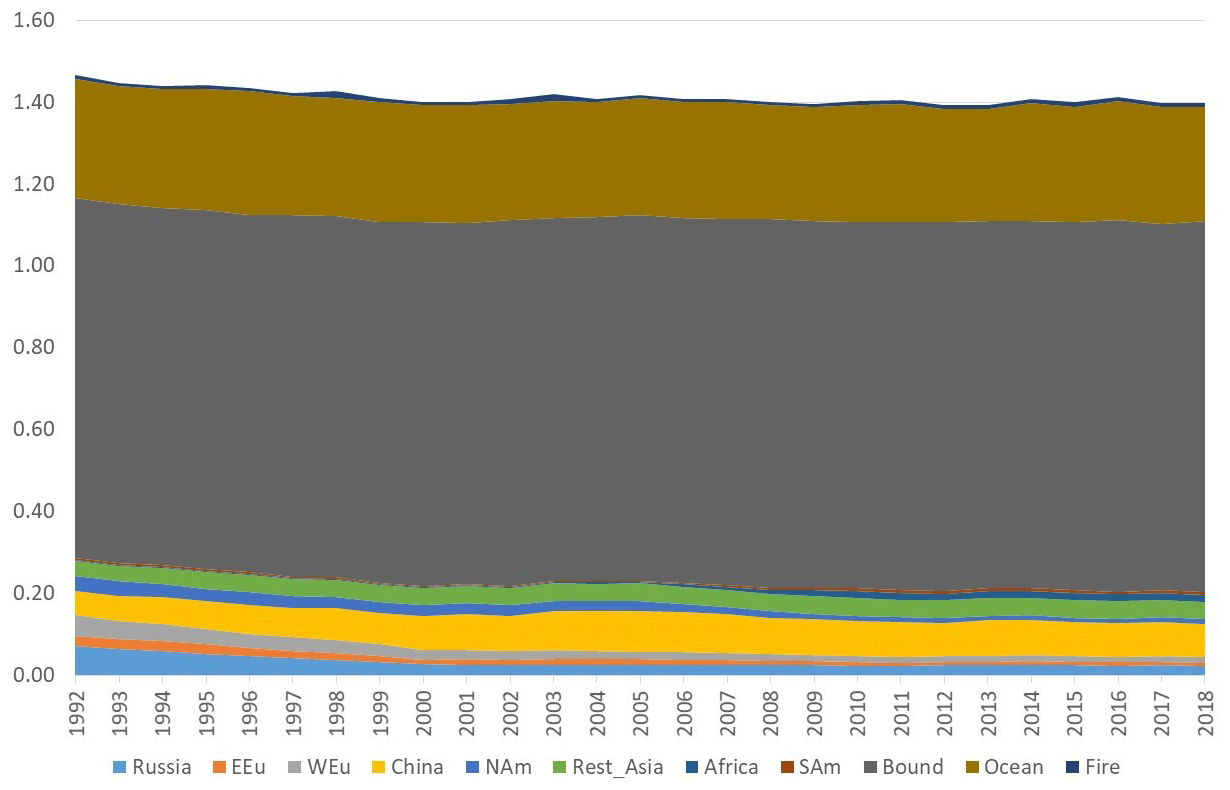
Figure 9Model calculations with variable emissions of the source apportionment of annual average GEM at Villum. The DEHM model was used for 2 years (1990 and 1991) to spin up the model. In the model, re-emissions from the ocean and contributions from boundary conditions at the Equator are included. Source regions: Russia – Russia; EEU – eastern Europe; WEu – western Europe; China – China; Africa – Africa; SAm – South America; Bound – boundary condition; Ocean – ocean; Fire – wildfire. Unit: ng m−3.
The DEHM model, using variable anthropogenic emissions, as described above, shows a slightly decreasing concentration trend of −0.7 % yr−1 (see Fig. 8). However, this direct anthropogenic input, assuming an atmospheric lifetime of GEM of 12 months, only accounts for between 14 % and 17 % of the observed GEM concentrations (Fig. 9). Including the impact of sea emissions and of the boundary conditions, and assuming a GEM atmospheric lifetime of 12 months, the model predicts an annual average GEM concentration of 1.40–1.43 ng m−3, i.e. in agreement with the measured average in the period of 1.46 ng m−3 , although the measured data covers a larger range of values (1.2–1.8 ng m−3). When applying longer or shorter GEM lifetimes, the model results deviate more from the measured concentrations. This indicates that the best relaxation time of GEM in the Northern Hemisphere is 12 months. The chemical lifetime of GEM in the atmosphere is most likely shorter, according to theoretical and experimental evidence (e.g. Goodsite et al., 2004, 2012; Ariya et al., 2008, Donohoue et al., 2005, 2006; Dibble et al., 2012). Therefore, the deposition of HgII species appears to be followed by the reduction and re-emission of Hg0 (e.g. Brooks et al., 2006; Kamp et al., 2018; Soerensen et al., 2012; Steen et al., 2009; Cobbett et al., 2007). Thus, the relaxation time seems to be a more appropriate name than lifetime for GEM. This is supported by a study on the photoreduction of HgII in cloud droplets, which was found to be much slower than the one used in models, leading to the conclusion that deposition and re-emission are involved in the dynamics of atmospheric mercury (Saiz-Lopez et al., 2018). The sea emissions were found to account for 20 %–21 % of the GEM concentration at Villum, and the boundary conditions of 1.5 ng m−3 explained 62 %–65 %, while emissions from wildfires contributed 1 % during the years of the measurements when still assuming a GEM atmospheric lifetime of 12 months.
In the calculations with DEHM, it was found that emissions from China had larger relative importance during the summer than in the winter season; however, this difference was only significant when applying relatively short (less than 1 year) atmospheric lifetimes of GEM. The calculations for Villum were performed for the year 2001. This result agrees with Chen et al. (2015), who found that East Asia is the main source for mercury deposition in the Arctic. A similar result is also reported by AMAP/UNEP (2013). Durnford et al. (2010), applying the global/regional atmospheric heavy metals model (GRAHM), investigated the contribution of different source regions to total mercury and GEM concentrations at several Arctic monitoring stations during different seasons of the year. They found that for the yearly concentration averages and their variability at the Arctic stations, including Villum, Asian emissions were the most important, accounting for more than the sum of the contributions from Europe, Russia and North America. This result is in agreement with the present study but in contrast with several studies addressing the origin of shorter lived pollutants, such as black carbon and sulfate, that point to the northerly part of Eurasia as the main source regions (Nguyen et al., 2013; Freud et al., 2017). Particularly in the case of Station Nord (now named Villum Research Station), Nguyen et al. (2013) found evidence of a strong influence of the direct transport of particles from Siberia, including results from previous work (Heidam et al., 2004). Heidam et al. (2004) identified Russia as the main contributor to sulfate concentrations, followed by Eastern and Western Europe, while Asian contributions appeared to be of minor importance. The explanation for this difference between modelling results regarding mercury and more short-lived air pollutants is likely to be the large difference in atmospheric lifetimes (relaxation time for GEM). The above discussion highlights the importance of assessing the chemistry of GEM and determining the fate of the resulting reaction products, especially the photoreduction of HgII compounds in marine waters.
3.3 Changing transport patterns
Results obtained by applying the DEHM model to simulate GEM concentrations at Villum indicate that changes in the direct atmospheric transport from source areas to Villum cannot explain the observed trend. We have found that the simulated yearly and seasonal GEM values show very little variability and no significant trend over the years 2000–2015 when the emission sources are kept constant at the 2005 level, while the meteorology is varying and treated as described above. That is opposite to the results of Dastoor et al. (2015) for a model run with constant emissions. The main reason for this is probably that processes, such as chemistry and surface exchanges in Dastoor et al. (2015), are more dependent on the atmosphere and surface conditions than the simple set-up in the present version of DEHM. There is better agreement between our results and Dastoor et al. (2015) for the model set-up with variable emissions. We see a decrease of 0.08 ng m−3 between 1992 and 2005 for Villum, while Dastoor et al. (2015) found approximately 0.1 ng m−3. The study by Hirdman et al. (2010) of long-term trends of sulfate and black carbon (BC) in the Arctic also concludes that changes in atmospheric transport can only explain a small fraction (0.3 %–7.2 %) of the observed trends.
Table 1The correlation of the time that air masses spent over different surfaces, and the GEM concentration shown for the different seasons (DJF – December, January and February; MAM – March, April and May; JJA – June, July and August; SON – September, October and November.). Values for both R and R2 are shown.

In an earlier paper on particle formation in the Arctic atmosphere, important results were obtained that correlated the time that air masses spent over different surfaces and measured concentrations (Dall'Osto et al., 2018). We did the same calculations for the GEM data. The correlations between the time that air masses passed over different surfaces and the measured GEM concentrations at Villum are shown in Table 1. Relatively strong negative correlations (R2 > 0.3) were found only with land and sea areas in the autumn. Performing a two-tailed t test, it was found that the only significant correlation at a 90 % confidence was the anti-correlation in the autumn with land (R2 = 0.44), while the anti-correlation with the sea area was significant only at an 85 % confidence level (R2 = 0.32). Different types of surfaces may influence deposition and emission rates for mercury, and they may have an influence on atmospheric chemistry, for example by releasing reactive bromine compounds. However, the correlations may also not be due to a relationship caused by the impact of the surfaces within the 120 h time span of the trajectories but rather by the longer term histories of the air masses. As the percentage of time passed over land by the air masses in the autumn months (SON) is very short (1 %–4 % of the 120 h), it seems most likely that the correlation observed is not due to a direct influence of land. It can thus be concluded from the results shown in Table 1 that no statistically significant impact of surfaces on GEM concentrations within the range of the 120 h back trajectories could be observed.
In this paper, we present measurements of GEM concentrations in the air at Villum Research Station from 1999 to 2017, with a break in the data set from July 2002 to 2007. The large fraction of GEM assigned to background contribution and from sea emissions makes it difficult to assess a trend from the otherwise predicted emission reduction in the source areas for direct anthropogenic emissions of mercury. A decreasing trend in the concentration of GEM was found during autumn and winter at a 90 % confidence level, but it was counteracted by a weak increase during summer and a high variability during spring. Therefore, there was not any significant trend in the yearly average concentrations at the 90 % confidence level.
Simulations of the concentrations at Villum, using the DEHM model with a fixed emission inventory, show no significant trends, and thus, it is concluded that the observed trends are not caused by changes in atmospheric transport patterns. The measurement area is known to be strongly influenced by long-range transport of pollutants in the winter and spring periods, and the only viable explanation of the observed trend in the winter appears to be decreasing emissions in the source regions. However, according to the DEHM simulations, the transport of direct anthropogenic emissions only accounted for between 14 % and 17 % of the GEM concentration and might be counteracted by the hemispheric background on 1.5 ng m−3 that accounts for 62 %–65 % and was kept constant in the model. The boundary conditions represent contributions from indirect transport from sources in the Northern Hemisphere and transport from sources in the Southern Hemisphere. Sea emissions account for 20 %–21 %. The emissions from the North Atlantic are likely to be decreasing due to the lower mercury concentrations in the water, but a decreasing extent of the sea ice cover around Greenland may counteract this effect.
The seasonal variation confirms the effect of AMDE, leading to generally lower concentrations during spring; in fact, a strong anti-correlation between the average GEM concentrations during springtime and the number of hours with AMDE conditions was observed. The analyses indicated that AMDEs are a net sink for mercury in the atmosphere, and that it affects the yearly average concentration.
Simulations with the DEHM model showed the best agreement with observations applying an atmospheric lifetime for GEM of 12 months; however, it was found that the apparent lifetime is likely to be the result of a shorter chemical lifetime with respect to oxidation followed by deposition, reduction and re-emission. Thus, “atmospheric relaxation time” seems to be a more appropriate term than “lifetime” for GEM.
The lack of a trend in the measured concentrations of GEM, despite emission reductions, is striking, but together with low direct transport of GEM to Villum as found by the DEHM model, it shows that the dynamics of GEM are very complex. Therefore, in the coming years, intensive measurement networks are strongly needed to describe the global distribution of mercury in the environment because the use of models to predict future levels will still be highly uncertain. The situation is increasingly complex due to global change that most likely will change the transport patterns of mercury, not only in the atmosphere but also between matrixes.
The measurements are derived from the European Monitoring and Evaluation Programme, Arctic Monitoring and Assessment Program, World Data Centre for Aerosols database (http://ebas.nilu.no, EBAS, 2020), and Skov et al. (2017).
All co-authors were involved in the scientific discussions of the paper. HS was the project leader and principal writer. JH was the co-writer and coordinated the statistical analysis. BJ and CC conducted the calibration, tests and set up the instruments. CN made the quality control measurements. MBP led the trend analysis and the analysis of the relation between ozone and GEM, while JBL performed the analysis of the depletion events. DB and MD'O conducted the trajectory clustering analysis and collected the K statistics, with MD'O also contributing to the overall design of article. JHC was responsible for the model calculations by DEHM.
The authors declare that they have no conflict of interest.
This article is part of the special issue “Research results from the 14th International Conference on Mercury as a Global Pollutant (ICMGP 2019), MercOx project, and iGOSP and iCUPE projects of ERA-PLANET in support of the Minamata Convention on Mercury (ACP/AMT inter-journal SI)”. It is not associated with a conference.
The Royal Danish Air Force is acknowledged for providing free transport of the equipment to Station Nord, and the staff at Station Nord are especially acknowledged for their excellent technical support. The Villum Foundation is gratefully acknowledged for financing the new research station, namely the Villum Research Station. Daniel Charles Thomas and Jakob Boyd Pernov are acknowledged for their assistance with proofreading and the language adjustments to the paper. The anonymous referees are acknowledged for their constructive comments.
This research has been supported by the Danish Environmental Protection Agency (DANCEA funds for Environmental Support to the Arctic Region project; grant no. 2019-7975) and by the European ERA-PLANET projects of iGOSP and iCUPE (consortium agreement no. 689443 for both projects).
This paper was edited by Ashu Dastoor and reviewed by two anonymous referees.
AMAP/UNEP: Technical Background Report for the Global Mercury Assessment, in: Arctic Monitoring and Assessment Programme and UNEP, Oslo, Norway and Geneva, Switzerland, available at: https://www.amap.no/documents/doc/Technical-Background-Report-for-the-Global-Mercury-Assessment-2013/848 (last access: 4 November 2020), 2013.
Angot, H., Dastoor, A., De Simone, F., Gårdfeldt, K., Gencarelli, C. N., Hedgecock, I. M., Langer, S., Magand, O., Mastromonaco, M. N., Nordstrøm, C., Pfaffhuber, K. A., Pirrone, N., Ryjkov, A., Selin, N. E., Skov, H., Song, S., Sprovieri, F., Steffen, A., Toyota, K., Travnikov, O., Yang, X., and Dommergue, A.: Chemical cycling and deposition of atmospheric mercury in polar regions: review of recent measurements and comparison with models, Atmos. Chem. Phys., 16, 10735–10763, https://doi.org/10.5194/acp-16-10735-2016, 2016.
Ariya, P. A., Skov, H., Grage, M. L., and Goodsite, M. E.: Gaseous Elemental Mercury in the Ambient Atmosphere: Review of the Application of Theoretical Calculations and Experimental Studies for Determination of Reaction Coefficients and Mechanisms with Halogens and Other Reactants, Adv. Quantum Chem., 55, 44–54, 2008.
Balabanov, N. B., Shepler, B. C., and Peterson, K. A.: Accurate global potential energy surface and reaction dynamics for the ground state of HgBr2, J. Phys. Chem. A, 109, 8765–8773, 2005.
Berg, T., Sekkesaeter, S., Steinnes, E., Valdal, A. K., and Wibetoe, G.: Springtime depletion of mercury in the European Arctic as observed at Svalbard, Sci. Total Environ., 304, 43–51, 2003.
Berg, T., Pfaffhuber, K. A., Cole, A. S., Engelsen, O., and Steffen, A.: Ten-year trends in atmospheric mercury concentrations, meteorological effects and climate variables at Zeppelin, Ny-Ålesund, Atmos. Chem. Phys., 13, 6575–6586, https://doi.org/10.5194/acp-13-6575-2013, 2013.
Brandt, J., Silver, J. D., Frohn, L. M., Geels, C., Gross, A., Hansen, A. B., Hansen, K. M., Hedegaard, G. B., Skjoth, C. A., Villadsen, H., Zare, A., and Christensen, J. H.: An integrated model study for Europe and North America using the Danish Eulerian Hemispheric Model with focus on intercontinental transport of air pollution, Atmos. Environ., 53, 156–76, 2012.
Breider, T. J., Mickley, L. J., Jacob, D. J., Ge, C., Wang, J., Sulprizio, M. P., Croft, B., Ridley, D. A., McConnell, J. R., Sharma, S., Husain, L., Dutkiewicz, V. A., Eleftheriadis, K., Skov, H., and Hopke, P. K.: Multidecadal trends in aerosol radiative forcing over the Arctic: Contribution of changes in anthropogenic aerosol to Arctic warming since 1980, J. Geophys. Res.-Atmos., 122, 3573–3594, 2017.
Brooks, S., Saiz-Lopez, A., Skov, H., Lindberg, S., Plane, J. M. C., and Goodsite, M. E.: The mass balance of mercury in the springtime polar environment, Geophys. Res. Lett., 33, L13812, https://doi.org/10.1029/2005GL025525, 2006.
Chen, L., Zhang, Y. X., Jacob, D. J., Soerensen, A. L., Fisher, J. A., Horowitz, H. M., Corbitt, E. S., and Wang, X. J.: A decline in Arctic Ocean mercury suggested by differences in decadal trends of atmospheric mercury between the Arctic and northern midlatitudes, Geophys. Res. Lett., 42, 6076–6083, 2015.
Christensen, J. H.: The Danish Eulerian hemispheric model – A three-dimensional air pollution model used for the Arctic, Atmos. Environ., 31, 4169–4191, 1997.
Christensen, J. H., Brandt, J., Frohn, L. M., and Skov, H.: Modelling of Mercury in the Arctic with the Danish Eulerian Hemispheric Model, Atmos. Chem. Phys., 4, 2251–2257, https://doi.org/10.5194/acp-4-2251-2004, 2004.
Cobbett, F. D., Steffen, A., Lawson, G., and Van Heyst, B. J.: GEM fluxes and atmospheric mercury concentrations (GEM, RGM and Hg-P) in the Canadian Arctic at Alert, Nunavut, Canada (February–June 2005), Atmos. Environ., 41, 6527–6543, 2007.
Cole, A. S., Steffen, A., Pfaffhuber, K. A., Berg, T., Pilote, M., Poissant, L., Tordon, R., and Hung, H.: Ten-year trends of atmospheric mercury in the high Arctic compared to Canadian sub-Arctic and mid-latitude sites, Atmos. Chem. Phys., 13, 1535–1545, https://doi.org/10.5194/acp-13-1535-2013, 2013.
Dall'Osto, M., Geels, C., Beddows, D. C. S., Boertmann, D., Lange, R., Nojgaard, J. K., Harrison, R. M., Simo, R., Skov, H., and Massling, A.: Regions of open water and melting sea ice drive new particle formation in North East Greenland, Sci. Rep., 8, 10, https://doi.org/10.1016/j.atmosenv.2018.07.019, 2018.
Dastoor, A., Ryzhkov, A., Dumford, D., Lehnherr, I., Steffen, A., and Morrison, H.: Atmospheric mercury in the Canadian Arctic. Part II: Insight from modeling, Sci. Total Environ., 509, 16–27, 2015,.
Dibble, T. S., Zelie, M. J., and Mao, H.: Thermodynamics of reactions of ClHg and BrHg radicals with atmospherically abundant free radicals, Atmos. Chem. Phys., 12, 10271–10279, https://doi.org/10.5194/acp-12-10271-2012, 2012.
Dommergue, A., Martinerie, P., Courteaud, J., Witrant, E., and Etheridge, D. M.: A new reconstruction of atmospheric gaseous elemental mercury trend over the last 60 years from Greenland firn records, Atmos. Environ., 136, 156–164, 2016.
Donohoue, D. L., Bauer, D., and Hynes, A. J.: Temperature and pressure dependent rate coefficients for the reaction of Hg with Cl and the reaction of Cl with Cl: A pulsed laser photolysis-pulsed laser induced fluorescence study. J. Phys. Chem. A, 109, 7732–7741, 2005.
Donohoue, D. L., Bauer, D., Cossairt, B., and Hynes, A. J.: Temperature and pressure dependent rate coefficients for the reaction of Hg with Br and the reaction of Br with Br: A pulsed laser photolysis-pulsed laser induced fluorescence study, J. Phys. Chem. A, 110, 6623–6632, 2006.
Douglas, T. A. and Blum, J. D.: Mercury Isotopes Reveal Atmospheric Gaseous Mercury Deposition Directly to the Arctic Coastal Snowpack, Environ. Sci. Technol. Lett., 6, 235–242, 2019.
Durnford, D., Dastoor, A., Figueras-Nieto, D., and Ryjkov, A.: Long range transport of mercury to the Arctic and across Canada, Atmos. Chem. Phys., 10, 6063–6086, https://doi.org/10.5194/acp-10-6063-2010, 2010.
EBAS: European Monitoring and Evaluation Programme, World Data Centre for Aerosols database, available at: http://ebas.nilu.no, last access: 10 November 2020.
Fisher, J. A., Jacob, D. J., Soerensen, A. L., Amos, H. M., Steffen, A., and Sunderland, E. M.: Riverine source of Arctic Ocean mercury inferred from atmospheric observations, Nat. Geosci., 5, 499–504, 2012.
Freud, E., Krejci, R., Tunved, P., Leaitch, R., Nguyen, Q. T., Massling, A., Skov, H., and Barrie, L.: Pan-Arctic aerosol number size distributions: seasonality and transport patterns, Atmos. Chem. Phys., 17, 8101–8128, https://doi.org/10.5194/acp-17-8101-2017, 2017.
Frohn, L. M., Christensen, J. H., and Brandt, J.: Development of a high-resolution nested air pollution model – The numerical approach, J. Comput. Phys., 179, 68–94, 2002.
Goodsite, M. E., Plane, J. M. C., and Skov, H.: A theoretical study of the oxidation of Hg-0 to HgBr2 in the troposphere, Environ. Sci. Technol., 38, 1772–1776, 2004.
Goodsite, M. E., Plane, J., and Skov, H.: A Theoretical Study of the Oxidation of Hg0 to HgBr2 in the Troposphere (vol. 38, pg. 1772, 2004), Environ. Sci. Technol., 46, 5262–5262, 2012.
Heidam, N. Z., Wahlin, P., and Christensen, J. H.: Tropospheric gases and aerosols in northeast Greenland, J. Atmos. Sci., 56, 261–278, 1999.
Heidam, N. Z., Christensen, J., Wahlin, P., and Skov, H.: Arctic atmospheric contaminants in NE Greenland: levels, variations, origins, transport, transformations and trends 1990–2001, Sci. Total Environ., 331, 5–28, 2004.
Hirdman, D., Burkhart, J. F., Sodemann, H., Eckhardt, S., Jefferson, A., Quinn, P. K., Sharma, S., Ström, J., and Stohl, A.: Long-term trends of black carbon and sulphate aerosol in the Arctic: changes in atmospheric transport and source region emissions, Atmos. Chem. Phys., 10, 9351–9368, https://doi.org/10.5194/acp-10-9351-2010, 2010.
Holmes, C. D., Jacob, D. J., Corbitt, E. S., Mao, J., Yang, X., Talbot, R., and Slemr, F.: Global atmospheric model for mercury including oxidation by bromine atoms, Atmos. Chem. Phys., 10, 12037–12057, https://doi.org/10.5194/acp-10-12037-2010, 2010.
Horowitz, H. M., Jacob, D. J., Zhang, Y., Dibble, T. S., Slemr, F., Amos, H. M., Schmidt, J. A., Corbitt, E. S., Marais, E. A., and Sunderland, E. M.: A new mechanism for atmospheric mercury redox chemistry: implications for the global mercury budget, Atmos. Chem. Phys., 17, 6353–6371, https://doi.org/10.5194/acp-17-6353-2017, 2017.
Jiao, Y. G. and Dibble, T. S.: First kinetic study of the atmospherically important reactions BrHg center dot + NO2 and BrHg center dot + HOO, Phys. Chem. Chem. Phys., 19, 1826–1838, 2017.
Jiskra, M., Sonke, J. E., Obrist, D., Bieser, J., Ebinghaus, R., Myhre, C. L., Pfaffhuber, K. A., Wangberg, I., Kyllonen, K., Worthy, D., Martin, L. G., Labuschagne, C., Mkololo, T., Ramonet, M., Magand, O., and Dommergue, A.: A vegetation control on seasonal variations in global atmospheric mercury concentrations, Nat. Geosci., 11, 244–251, 2018.
Jiskra, M., Sonke, J. E., Agnan, Y., Helmig, D., and Obrist, D.: Insights from mercury stable isotopes on terrestrial–atmosphere exchange of Hg(0) in the Arctic tundra, Biogeosciences, 16, 4051–4064, https://doi.org/10.5194/bg-16-4051-2019, 2019.
Kamp, J., Skov, H., Jensen, B., and Sørensen, L. L.: Fluxes of gaseous elemental mercury (GEM) in the High Arctic during atmospheric mercury depletion events (AMDEs), Atmos. Chem. Phys., 18, 6923–6938, https://doi.org/10.5194/acp-18-6923-2018, 2018.
Lamborg, C. H., Hammerschmidt, C. R., Bowman, K. L., Swarr, G. J., Munson, K. M., Ohnemus, D. C., Lam, P. J., Heimburger, L. E., Rijkenberg, M. J. A., and Saito, M. A.: A global ocean inventory of anthropogenic mercury based on water column measurements, Nature, 512, 65–69, 2014.
Moller, A. K., Barkay, T., Abu Al-Soud, W., Sorensen, S. J., Skov, H., and Kroer, N.: Diversity and characterization of mercury-resistant bacteria in snow, freshwater and sea-ice brine from the High Arctic, FEMS Microbiol. Ecol., 75, 390–401, 2011.
Muntean, M., Janssens-Maenhout, G., Song, S., Selin, N. E., Olivier, J. G. J., Guizzardi, D., Maas, R., and Dentener, F.: Trend analysis from 1970 to 2008 and model evaluation of EDGARv4 global gridded anthropogenic mercury emissions, Sci. Total Environ., 494–495, 337–350, 2014.
Muntean, M., Janssens-Maenhout, G., Song, S. J., Giang, A., Selin, N. E., Zhong, H., Zhao, Y., Olivier, J. G. J., Guizzardi, D., Crippa, M., Schaaf, E., and Dentener, F.: Evaluating EDGARv4.tox2 speciated mercury emissions ex-post scenarios and their impacts on modelled global and regional wet deposition patterns, Atmos. Environ., 184, 56–68, 2018.
Nguyen, Q. T., Skov, H., Sørensen, L. L., Jensen, B. J., Grube, A. G., Massling, A., Glasius, M., and Nøjgaard, J. K.: Source apportionment of particles at Station Nord, North East Greenland during 2008–2010 using COPREM and PMF analysis, Atmos. Chem. Phys., 13, 35–49, https://doi.org/10.5194/acp-13-35-2013, 2013.
Outridge, P. M., Macdonald, R. W., Wang, F., Stern, G. A., and Dastoor, A. P.: A mass balance inventory of mercury in the Arctic Ocean, Environ. Chem., 5, 1–23, 2008.
Outridge, P. M., Mason, R. P., Wang, F., Guerrero, S., and Heimbürger-Boavida, L. E.: Updated Global and Oceanic Mercury Budgets for the United Nations Global Mercury Assessment 2018, Environ. Sci. Technol., 52, 11466–11477, 2018.
Pacyna, E. G., Pacyna, J. M., Sundseth, K., Munthe, J., Kindbom, K., Wilson, S., Steenhuisen, F., and Maxson, P.: Global emission of mercury to the atmosphere from anthropogenic sources in 2005 and projections to 2020, Atmos. Environ., 44, 2487–2499, 2010.
Pirrone, N., Cinnirella, S., Feng, X., Finkelman, R. B., Friedli, H. R., Leaner, J., Mason, R., Mukherjee, A. B., Stracher, G. B., Streets, D. G., and Telmer, K.: Global mercury emissions to the atmosphere from anthropogenic and natural sources, Atmos. Chem. Phys., 10, 5951–5964, https://doi.org/10.5194/acp-10-5951-2010, 2010.
Saiz-Lopez, A., Sitkiewicz, S. P., Roca-Sanjuan, D., Oliva-Enrich, J. M., Davalos, J. Z., Notario, R., Jiskra, M., Xu, Y., Wang, F., Thackray, C. P., Sunderland, E. M., Jacob, D. J., Travnikov, O., Cuevas, C. A., Acuna, A. U., Rivero, D., Plane, J. M. C., Kinnison, D. E., and Sonke, J. E.: Photoreduction of gaseous oxidized mercury changes global atmospheric mercury speciation, transport and deposition, Nat. Commun., 9, 4796, https://doi.org/10.1038/s41467-018-07075-3, 2018.
Salmi, T., Määttä, A., Anttila, P., Ruoho-Airola, T., and Amnell, T. Detecting trends of annual values of atmospheric pollutants by the Mann-Kendall test and Sen's slope estimates – the Excel template application Makesens, Finnish Meteorological Institute, Helsinki, Finland, 2002.
Schroeder, W. H., Anlauf, K. G., Barrie, L. A., Lu, J. Y., Steffen, A., Schneeberger, D. R., and Berg, T.: Arctic springtime depletion of mercury, Nature, 394, 331–332, 1998.
Selin, N. E., Jacob, D. J., Yantosca, R. M., Strode, S., Jaeglé, L., and Sunderland, E. M.: Global 3-D land-ocean-atmosphere model for mercury: Present-day versus preindustrial cycles and anthropogenic enrichment factors for deposition, Global Biogeochem. Cy., 22, GB2011, https://doi.org/10.1029/2007GB003040, 2008.
Skamarock, W. C., Klemp, J. B., Dudhia, J., Gill, D. O., Barker, D., Duda, M. G., Huang, X.-Y., Wang, W., and Powers, J. G. A Description of the Advanced Research WRF Version 3, No. NCAR/TN-475+STR, University Corporation for Atmospheric Research, https://doi.org/10.5065/D68S4MVH, 2008.
Skov, H., Christensen, J. H., Goodsite, M. E., Heidam, N. Z., Jensen, B., Wahlin, P., and Geernaert, G.: Fate of elemental mercury in the arctic during atmospheric mercury depletion episodes and the load of atmospheric mercury to the arctic, Environ. Sci. Technol., 38, 2373–2382, 2004.
Skov, H., Brooks, S. B., Goodsite, M. E., Lindberg, S. E., Meyers, T. P., Landis, M. S., Larsen, M. R. B., Jensen, B., McConville, G., and Christensen, J.: Fluxes of reactive gaseous mercury measured with a newly developed method using relaxed eddy accumulation, Atmos. Environ., 40, 5452–5463, 2006.
Skov, H., Massling, A., Nielsen, I. E., Nordstrøm, C., Bossi, R., Vorkamp, K., Christensen, J., Larsen, M. M., Hansen, K. M., Liisberg, J. B., and Poulsen, M. B.: AMAP CORE – ATMOSPHERIC PART from 1990 to 2015, Results from Villum Research Station, Aarhus University, p 77, available at: http://dce2.au.dk/pub/TR101.pdf (last access: 10 November 2020), 2017.
Soerensen, A. L., Sunderland, E. M., Holmes, C. D., Jacob, D. J., Yantosca, R. M., Skov, H., Christensen, J. H., Strode, S. A., and Mason, R. P.: An Improved Global Model for Air-Sea Exchange of Mercury: High Concentrations over the North Atlantic, Environ. Sci. Technol., 44, 8574–8580, 2010.
Soerensen, A. L., Jacob, D. J., Streets, D. G., Witt, M. L. I., Ebinghaus, R., Mason, R. P., Andersson, M., and Sunderland, E. M.: Multi-decadal decline of mercury in the North Atlantic atmosphere explained by changing subsurface seawater concentrations, Geophys. Res. Lett., 39, L21810, https://doi.org/10.1029/2012gl053736, 2012.
Steen, A. O., Berg, T., Dastoor, A. P., Durnford, D. A., Hole, L. R., and Pfaffhuber, K. A.: Dynamic exchange of gaseous elemental mercury during polar night and day, Atmos. Environ., 43, 5604–5610, 2009.
Steffen, A., Douglas, T., Amyot, M., Ariya, P., Aspmo, K., Berg, T., Bottenheim, J., Brooks, S., Cobbett, F., Dastoor, A., Dommergue, A., Ebinghaus, R., Ferrari, C., Gardfeldt, K., Goodsite, M. E., Lean, D., Poulain, A. J., Scherz, C., Skov, H., Sommar, J., and Temme, C.: A synthesis of atmospheric mercury depletion event chemistry in the atmosphere and snow, Atmos. Chem. Phys., 8, 1445–1482, https://doi.org/10.5194/acp-8-1445-2008, 2008.
Steffen, A., Lehnherr, I., Cole, A., Ariya, P., Dastoor, A., Durnford, D., Kirk, J., and Pilote, M.: Atmospheric mercury in the Canadian Arctic. Part I: A review of recent field measurements, Sci. Total Environ., 509, 3–15, 2015.
Streets, D. G., Horowitz, H. M., Jacob, D. J., Lu, Z., Levin, L., ter Schure, A. F. H., and Sunderland, E. M.: Total Mercury Released to the Environment by Human Activities, Environ. Sci. Technol., 51, 5969–5977, https://doi.org/10.1021/acs.est.7b00451, 2017.
Streets, D. G., Lu, Z., Levin, L., ter Schure, A. F. H., and Sunderland, E. M.: Historical releases of mercury to air, land, and water from coal combustion, Sci. Total Environ., 615, 131–140, https://doi.org/10.1016/j.scitotenv.2017.09.207, 2018.
Streets, D. G., Horowitz, H. M., Lu, Z., Levin, L., Thackray, C. P., and Sunderland, E. M.: Five hundred years of anthropogenic mercury: spatial and temporal release profiles, Environ. Res. Lett., 14, 084004, https://doi.org/10.1088/1748-9326/ab281f, 2019.
UNEP: Minamata Convention on Mercury, UNEP, October 2013, available at: http://www.mercuryconvention.org/Convention/tabid/3426/Default.aspx (last access: 4 November 2020), 2013.
van der Werf, G. R., Randerson, J. T., Giglio, L., Collatz, G. J., Kasibhatla, P. S., and Arellano Jr., A. F.: Interannual variability in global biomass burning emissions from 1997 to 2004, Atmos. Chem. Phys., 6, 3423–3441, https://doi.org/10.5194/acp-6-3423-2006, 2006.
Wang, S. Y., McNamara, S. M., Moore, C. W., Obrist, D., Steffen, A., Shepson, P. B., Staebler, R. M., Raso, A. R. W., and Pratt, K. A.: Direct detection of atmospheric atomic bromine leading to mercury and ozone depletion, P. Natl. Acad. Sci. USA, 116, 14479–14484, 2019.
Yang, X., Blechschmidt, A.-M., Bognar, K., McClure–Begley, A., Morris, S., Petropavlovskikh, I., Richter, A., Skov, H., Strong, K., Tarasick, D., Uttal, T., Vestenius, M., and Zhao, X.: Pan-Arctic surface ozone: modelling vs measurements, Atmos. Chem. Phys. Discuss., https://doi.org/10.5194/acp-2019-984, in review, 2020.
Zhang, Y. X., Jacob, D. J., Horowitz, H. M., Chen, L., Amos, H. M., Krabbenhoft, D. P., Slemr, F., St Louis, V. L., and Sunderland, E. M.: Observed decrease in atmospheric mercury explained by global decline in anthropogenic emissions, P. Natl. Acad. Sci. USA, 113, 526–531, 2016.