the Creative Commons Attribution 4.0 License.
the Creative Commons Attribution 4.0 License.
 | 09 Nov 2020
Role of the dew water on the ground surface in HONO distribution: a case measurement in Melpitz
Yangang Ren
Bastian Stieger
Gerald Spindler
Benoit Grosselin
Abdelwahid Mellouki
Thomas Tuch
Alfred Wiedensohler
To characterize the role of dew water for the ground surface HONO distribution, nitrous acid (HONO) measurements with a Monitor for AeRosols and Gases in ambient Air (MARGA) and a LOng Path Absorption Photometer (LOPAP) instrument were performed at the Leibniz Institute for Tropospheric Research (TROPOS) research site in Melpitz, Germany, from 19 to 29 April 2018. The dew water was also collected and analyzed from 8 to 14 May 2019 using a glass sampler. The high time resolution of HONO measurements showed characteristic diurnal variations that revealed that (i) vehicle emissions are a minor source of HONO at Melpitz station; (ii) the heterogeneous conversion of NO2 to HONO on the ground surface dominates HONO production at night; (iii) there is significant nighttime loss of HONO with a sink strength of 0.16±0.12 ppbv h−1; and (iv) dew water with mean of 7.91±2.14 µg m−2 could serve as a temporary HONO source in the morning when the dew droplets evaporate. The nocturnal observations of HONO and NO2 allowed the direct evaluation of the ground uptake coefficients for these species at night: to , to . A chemical model demonstrated that HONO deposition to the ground surface at night was 90 %–100 % of the calculated unknown HONO source in the morning. These results suggest that dew water on the ground surface was controlling the temporal HONO distribution rather than straightforward NO2–HONO conversion. This can strongly enhance the OH reactivity throughout the morning time or in other planted areas that provide a large amount of ground surface based on the OH production rate calculation.
- Article
(585 KB) - Full-text XML
-
Supplement
(2272 KB) - BibTeX
- EndNote


Nitrous acid (HONO) is important in atmospheric chemistry as its photolysis (Reaction R1) is an important source of OH radicals. In the troposphere, OH radicals can initiate daytime photochemistry, leading not least to the formation of ozone (O3) and secondary organic aerosol (SOA):
At present, the mechanisms of HONO formation have been and are still widely discussed. In the absence of light, heterogeneous reactions of NO2 occur on wet surfaces (Reaction R2) and are considered to be an important source of HONO according to both laboratory studies and field observations (Acker et al., 2004):
Finlayson-Pitts et al. (2003) proposed a mechanism (Reaction R3) involving the formation of the NO2 dimer (N2O4) especially during nighttime. However, this pathway is not important in the real atmosphere (Gustafsson et al., 2008). The surface of soot (Ammann et al., 1998; Arens et al., 2001; Gerecke et al., 1998) or light-activated soot (Aubin and Abbatt, 2007; Monge et al., 2010) contains functionalities attached to the large carbonaceous structures or individual condensed organic species, like phenol (Reaction R4) (Gutzwiller et al., 2002) and light-activated humic acids (Stemmler et al., 2006) which undergo electron transfer reactions with NO2 yielding HONO (Reaction R5, in which HA, Ared and X are humic acid, the activation of reductive centers and oxidants, respectively). This reaction is also postulated for aromatics in the aqueous phase but only proceeds at a relevant rate at high pH levels (Ammann et al., 2005; Lahoutifard et al., 2002). Gustafsson et al. (2008) provide the evidence that the formation of HONO proceeds through a bimolecular reaction of absorbed NO2 and H (Reaction R6) on mineral dust in which H is formed from the dissociation of chemisorbed water. However, Finlayson-Pitts (2009) indicated that this pathway is probably not transferable from the laboratory to the real atmosphere. In addition to the direct emission from vehicle exhaust (Kurtenbach et al., 2001) and the homogeneous gas-phase reaction of NO with OH (Reaction R7) (Pagsberg et al., 1997), some other HONO formation mechanisms have been proposed, e.g., homogeneous reaction of NO2, H2O and NH3 (Reaction R8) (Zhang and Tao, 2010), the photolysis of nitric acid and nitrate () (Reaction R9) (Ye et al., 2016; Zhou et al., 2011), and nitrite emissions from soil (Reaction R10) (Su et al., 2011):
Several studies (Acker et al., 2004; He et al., 2006; Lammel and Perner, 1988; Lammel and Cape, 1996; Rubio et al., 2009; VandenBoer et al., 2013, 2014) reported that HONO deposited on wet surfaces can be a source for observed daytime HONO. He et al. (2006) observed HONO released from a drying forest canopy, and their lab studies showed that, on average, ∼90 % of was emitted as HONO during dew evaporation. Rubio et al. (2009) found a positive correlation between formaldehyde and HONO in dew and the atmosphere.
The dominant loss of HONO is photolysis during daytime which forms OH radicals (Reaction R1). An additional sink of HONO is the reaction with OH radicals (Reaction R11). Due to the absence of solar radiation and the low OH concentration, the main loss process of HONO during nighttime is dry deposition, which can reach a balance with HONO production and vertical mixing to generate a steady state of HONO mixing ratio:
Due to its significant atmospheric importance, HONO has been measured for many years with various techniques (Febo et al., 1993; Huang et al., 2002; Kanda and Taira, 1990; Platt et al., 1980; Schiller et al., 2001; Wang and Zhang, 2000). The LOng Path Absorption Photometer (LOPAP) is a two channel in situ HONO measurement instrument which detects HONO continuously by wet sampling and photometric detection. LOPAP is very selective without sampling artifact and chemical interferences (e.g., NO2, NO, O3, HCHO, HNO3, SO2, PAN, etc.). In addition, the detection limit of LOPAP can go down to 0.2 pptv (Kleffmann and Wiesen, 2008) by optimizing parameters like (a) sample gas flow rate, (b) liquid flow rates and (c) the length of the absorption tubing (Heland et al., 2001). LOPAP was validated and compared with the most established and reliable HONO instrumental differential optical absorption spectroscopy (DOAS). Both were used in the field and in a large simulation chamber under various conditions resulting in excellent agreement (Heland et al., 2001; Kleffmann et al., 2006).
The Monitor for AeRosols and Gases in ambient Air (MARGA) is a commercial instrument combining a steam-jet aerosol collector (SJAC) and a wet rotating denuder (WRD) which can quantify the inorganic water-soluble particulate matter (PM) ions (Cl−, , , , Na+, K+, Mg2+, Ca2+) and corresponding trace gases (HCl, HONO, HNO3, SO2, NH3). In recent years, MARGA measurements have been performed worldwide, which has been summarized by Stieger et al. (2018). Within the cited study, HONO concentrations measured by a MARGA system and an off-line batch denuder without an inlet system were compared. Although the slope between both instruments was 1.10 with slightly higher MARGA concentrations on average, both instruments biased equally in the measured concentrations resulting in a high scattering with a coefficient of determination of R2=0.41. The probable reason was the off-line analysis of the batch denuder sample since the resulting longer interaction of gas and liquid phase during the transport led to further heterogenous reactions. As both instruments are based on the same sampling technique, the present study could be a good starting point for an intercomparison between MARGA and LOPAP for HONO measurements to find possible reasons in the denuder deviations.
In this study, we present parallel measurements of HONO using LOPAP and MARGA in Melpitz, Germany, over 2 weeks in 2018. For further investigations, dew water was collected and analyzed from 8 to 14 May 2019 using two glass samplers. In addition, other water-soluble compounds, such as gaseous HNO3, NH3 and particulate , , , Na+, K+, Mg2+ and Ca2+, trace gases (NOx, SO2 and O3), and meteorological parameters were also measured simultaneously. Our observations provide a direct intercomparison between LOPAP and MARGA for HONO field measurements, offer additional insights into HONO chemical formation processes, and examine the relative importance of dew as a sink and source of HONO.
2.1 Site description
Measurements were performed at the research station of the Leibniz Institute for Tropospheric Research (TROPOS) in Melpitz (51∘32′ N, 12∘56′ E). This rural field site is situated in a meadow and surrounded by flat grass land, agricultural areas and forests. The Melpitz site can mainly be influenced by two different wind directions: the west wind of marine origin crossing a large area of Western Europe and the city of Leipzig (41 km northeast) and the east wind crossing Eastern Europe (Spindler et al., 2004).
2.2 MARGA instrument
The MARGA (1S ADI 2080, the Netherlands) used in this study has already been described in Stieger et al. (2018). Hence, only a little information is provided here. An inlet flow of 1 m3 h−1 was drawn into the sampling box after passing through an inner Teflon-coated PM10 inlet (3.5 m; URG, Chapel Hill, USA). Within the sample box, the sampled air laminarly passed a WRD, in which water-soluble gases diffuse into a 10 mg L−1 hydrogen peroxide (H2O2) solution at pH =5.7. Particles can reach the SJAC because of their smaller diffusion velocities. Within the SJAC, the particles grow into droplets under supersaturated water vapor conditions and were collected by a cyclone. The gas and particle samples are both collected over the course of 1 h. Then, the aqueous samples of the WRD (gas phase) and the SJAC (particle phase) were successively injected into two ion chromatographs (ICs) with conductivity detectors (Metrohm, Switzerland) by two syringe pumps for analyzing the anions and cations. The volumes of the injection loops for the anions and cations were 250 and 500 µL, respectively. The Metrosep A Supp 10 (75/4.0) column and Metrosep C 4 (100/4.0) column were used to separate anions and cations, respectively. Lithium bromide was used as the internal standard for both gas- and particle-phase samples and was added during the sample injection to the IC.
The detection limits and the blanks for the MARGA system were performed before the intercomparison campaign in 2018. The detection limit of HONO was determined to be 10 pptv. The blanks were analyzed when the system was set up in the field to consider potential contamination. For blank measurements, the MARGA blank measurement mode, which has a duration of 6 h, was used. Within the first 4 h, the MARGA air pump was off, and the denuder and SJAC liquids were analyzed. The first and second hour samples were discarded as they still included residual concentrations. The evaluation of the blank concentrations was performed for the third and fourth hour samples. No discernable peaks above the instrument detection limits were identified in both the gas- and particle-phase channels.
The precision for HONO quantification is below 4 %, indicating good repeatability. To test the robustness of the ion chromatography within the MARGA, standard solutions with defined concentrations of 70, 120 and 150 µg L−1 were injected in the IC system. The correlation between both the predefined concentrations within the standard solutions and the measured concentrations by the MARGA IC resulted in a slope of 1.13 (R2=0.99). This value indicates slightly lower measured concentrations, which might also be a result of nonstable in freshly made liquid standard solutions.
2.3 LOPAP instrument
The LOPAP (QUMA, Germany) employed in this work was described in previous studies (Bernard et al., 2016; Heland et al., 2001). Only a brief description is given here. The LOPAP instrument consists of two sections: a sampling unit and a detection unit. The ambient air was sampled in the sampling unit, which is composed of two glass coils in series in which the first coil (channel 1) accounted for HONO with interferences and the second coil (channel 2) sampled only interferences assuming that more than 99 % of HONO was absorbed into the acidic stripping solution (pH =0) to form diazonium salt in channel 1. This salt reacts with a 0.8 mM n-(1-naphthyl)ethylenediamine dihydrochloride solution to produce the final azo dye which is photometrically detected by long path absorption in special Teflon tubing (Heland et al., 2001; Kleffmann et al., 2006). During our field campaign in Melpitz, both the acidic stripping solution and 0.8 mM n-(1-naphthyl)ethylenediamine dihydrochloride solution were kept in the dark and were not changed during the whole campaign period. The temperature of the stripping coil was kept constant at 25 ∘C by a thermostat. Automatic zero air (Alphagaz 2, 99.9999 %, Air Liquid GmbH) measurements were performed for 30 min per 12 h measurement to correct for zero drifts. In addition, calibrations using standard solution (Heland et al., 2001) were applied at the beginning (17 April), middle (20, 24, 25 April) and end (29 April) of the campaign to derive the HONO mixing ratio. The detection limit of LOPAP was approximately 1–2 pptv with a response time of 5 min. The error of the HONO mixing ratio was estimated based on these detection limits and a relative error of 10 %. The relative error is calculated by error propagation of all systematic errors; i.e., uncertainties in the gas flow are ca. 2 % and in the liquid flow ca. 2 %, the error in the nitrite concentration during calibration is 1 %, and errors for the pipettes/flasks used are 2 times the specified errors of all volumetric glassware since all glassware was not used exactly at 20 ∘C as recommended by the manufacturer.
To investigate the possible sampling inlet and denuder artifacts of the MARGA, two different positions were selected for LOPAP during the measurement period (explained in the Supplement): (M1) sampling unit of LOPAP was connected to the MARGA inlet in the back of the 2 m sampling tube and the PM10 inlet of MARGA as shown in Fig. S1a in the Supplement (18 April 2018, 13:00 UTC, to 20 April 2018, 08:00 UTC), and (M2) the sampling unit of LOPAP was settled in the same level as the sampling head of MARGA (Fig. S1b) (20 April 2018, 15:00 UTC, to 29 April 2018, 07:00 UTC).
2.4 Dew water collection and analysis
To evaluate the HONO emission from the dew water in the morning, the dew water was collected 1 year later after the HONO comparison campaign and was analyzed on 8, 11, 13 and 14 May 2019. Similar conditions (grass height, dew formation and day length) were observed to improve the evaluation. For dew sampling, a glass sampler was used (as shown in Fig. S2). Two 1.5 m2 glass plates (Plates 1 and 2) were placed 40 cm above the ground with a tilt angle of approximately 10∘. A gutter was installed at the lower end of each plate to collect the water running down. The water was trapped in 500 mL bottles. The dew samplers were prepared each evening before a likely dew event would occur (low dew-point difference, clear sky and low winds). Each plate was rinsed with at least 2 L ultrapure water. A squeegee removed the excess water. Afterwards, the plates were cleaned with ethanol and were again rinsed with 2 L ultrapure water. The plate was splashed with ultrapure water and squeegeed six times and the gutter was cleaned. The sample of the sixth splash was collected as the blank (∼50 mL).
The dew water normally was collected from 18:00 to 05:00 UTC. In the morning, the excess dew on the plate was squeegeed. To achieve the volume of dew (Vdew), the bottles were weighed before and after sampling by a balance. The pH was measured by a pH meter (mod. Lab 850, Schott Instruments) on a subsample of the total volume. After sampling, the aqueous solutions were filtered and stored in a fridge (∼6 ∘C). Within 6 h, the HONO analyses of the dew and blank samples were performed by double injection in the MARGA in the manual measurement mode as HONO may volatilize between sampling and analysis. For the other ions (Cl−, , , Oxalate, Br−, F−, Formate, MSA, , Na+, , K+, Mg2+ and Ca2+), the samples were analyzed with laboratory ion chromatogram systems (mod. ICS-3000, Dionex, USA). Blanks from water, the filter, the syringes and bottles were subtracted.
2.5 Aerosol measurements
The particle size distributions were measured in the size range from 5 nm to 10 µm with a dual mobility particle size spectrometer (D-MPSS; TROPOS-type D-MPSS) (Birmili et al., 1999) and an aerodynamic particle size spectrometer (APSS; model 3321, TSI Inc., Shoreview, MN, USA). For the particle number size distribution measurements, the aerosol is sampled through a low-flow PM10 inlet and dried in an automatic diffusion dryer (Tuch et al., 2009). The measurements and quality assurance are done following the recommendations given in Wiedensohler et al. (2012, 2018). The MPSS-derived particle number size distribution was inverted by the algorithm described in Pfeifer et al. (2014) and following the bipolar charge distribution of Wiedensohler (1988).
2.6 Other measurements
Trace gases of NO-NO2-NOx, SO2 and O3 were measured with a NOx analyzer (Thermo Scientific Model 42i-TL, Waltham, Massachusetts, USA), SO2 analyzer (APSA-360A) and O3 analyzer (APOA-350E; both Horiba, Kyoto, Japan) with a time resolution of 1 min. It should be noted that NO2 was converted to NO within the NOx analyzer by a blue light converter (BLC2, Meteorologie Consult GmbH, Königstein, Germany). The provider for the replacement of the Mo converter in the 42i-TL analyzer is MLU Messtechnik GmbH, Essen, Germany. Meteorological parameters like temperature (T), precipitation and relative humidity (RH), as well as wind velocity and direction, were measured by PT1000, a rain gauge (R.M. Young Company, USA), the CS215 sensor (Sensirion AG, Switzerland) and a WindSonic by Gill Instruments (UK), respectively. Global radiation and barometric pressure were recorded by a net radiometer CNR1 (Kipp & Zonen, the Netherlands) and a digital barometer (Vaisala, Germany), respectively.
2.7 Calculation of photolysis rate
The off-line National Center for Atmospheric Research (NCAR) Tropospheric Ultraviolet and Visible (TUV) transfer model (https://www2.acom.ucar.edu/modeling/tropospheric-ultraviolet-and-visible-tuv-radiation-model, last access: 14 January 2019) was used to estimate the photolysis rate of HONO (JHONO), NO2 () and production rate of O1D () at Melpitz station scaled by the measured global radiation. Aerosol optical depth (AOD), total vertical ozone column, total NO2 column, total cloud optical depth and surface reflectivity (albedo) were taken from the NASA web page for the period of measurement (https://neo.sci.gsfc.nasa.gov/blog/, last access: 7 July 2018).

Figure 1Time courses of HONO as hourly measured by MARGA and 30 s measured by LOPAP (a) and normalized hourly for LOPAP (b). (c) blue and green lines represent the error weighted orthogonal regression analysis between MARGA and LOPAP for two different comparison period of M1 and M2, respectively. The error bar in the panel (c) indicates the measurement error of HONO concentrations in LOPAP and MARGA. The HONO concentration of MARGA in panel (c) is shifted 400 pptv for clarity.
3.1 Intercomparison of LOPAP and MARGA
The hourly HONO mixing ratio obtained from MARGA with the 30 s and hourly averaged HONO mixing ratios from LOPAP are shown in Fig. 1a and b, respectively. They indicate that the MARGA values were higher than the values of LOPAP. In addition, the comparison between both instruments in Fig. 1a shows a delay in the MARGA concentrations after reaching the maximum concentrations in the morning. This pattern was also observed in previous studies by Volten et al. (2012) and Dammers et al. (2017), who compared miniDOAS instruments with wet denuder systems. Compared to rapid responses of the miniDOAS, the denuder-based instruments showed offsets and delays because of inlet memory artifacts by particles or water. Both groups also suggested transport effects of the liquid samples from the sampling to the analysis unit resulted in delays and slow responses.
The comparisons of the MARGA and LOPAP HONO measurements for period M1 and period M2 in Fig. 1c result in slopes of 1.71 and 2.17 using an error-weighted Deming regression, respectively. These results are consistent with the former intercomparison of both instrument types in the Chinese field campaign (Lu et al., 2010; Xu et al., 2019) in which the HONO mixing ratio measured with the wet denuder–ion chromatography (WD/IC) instrument was affected by a factor of 3 on average. Within the present work, we evaluated the relative importance of the denuder artifact with the inlet artifact. The heterogeneous reactions of NO2 with H2O, as well as NO2 with SO2, in water as described by Spindler et al. (2003) or volatile organic compounds (VOCs) with NO2 could explain the artifacts in the denuder solution (Kleffmann and Wiesen, 2008), which could account for ca. 71 % (M1, where both LOPAP and MARGA used the common MARGA inlet) of the ca. 117 % overestimated HONO measurements from MARGA. Additional artifacts such as the heterogeneous formation of HONO due to the long MARGA inlet system should be responsible for another ca. 46 % (the difference between slopes M2 and M1). Hence, the results show that the use of massive sampling inlets, even if they are coated with Teflon, should be avoided for any in situ HONO instrument. As a result, we chose the LOPAP-measured HONO in the following sections because of its high accuracy.
Table 1Mean and mean error as 2 times the standard deviation of the measured HONO (LOPAP) and the other pollutants at Melpitz station during daytime (D, 04:00–18:00 UTC) and nighttime (N, 18:00–04:00 UTC).

a HONO derived from LOPAP. b Data obtained from the MARGA instrument.
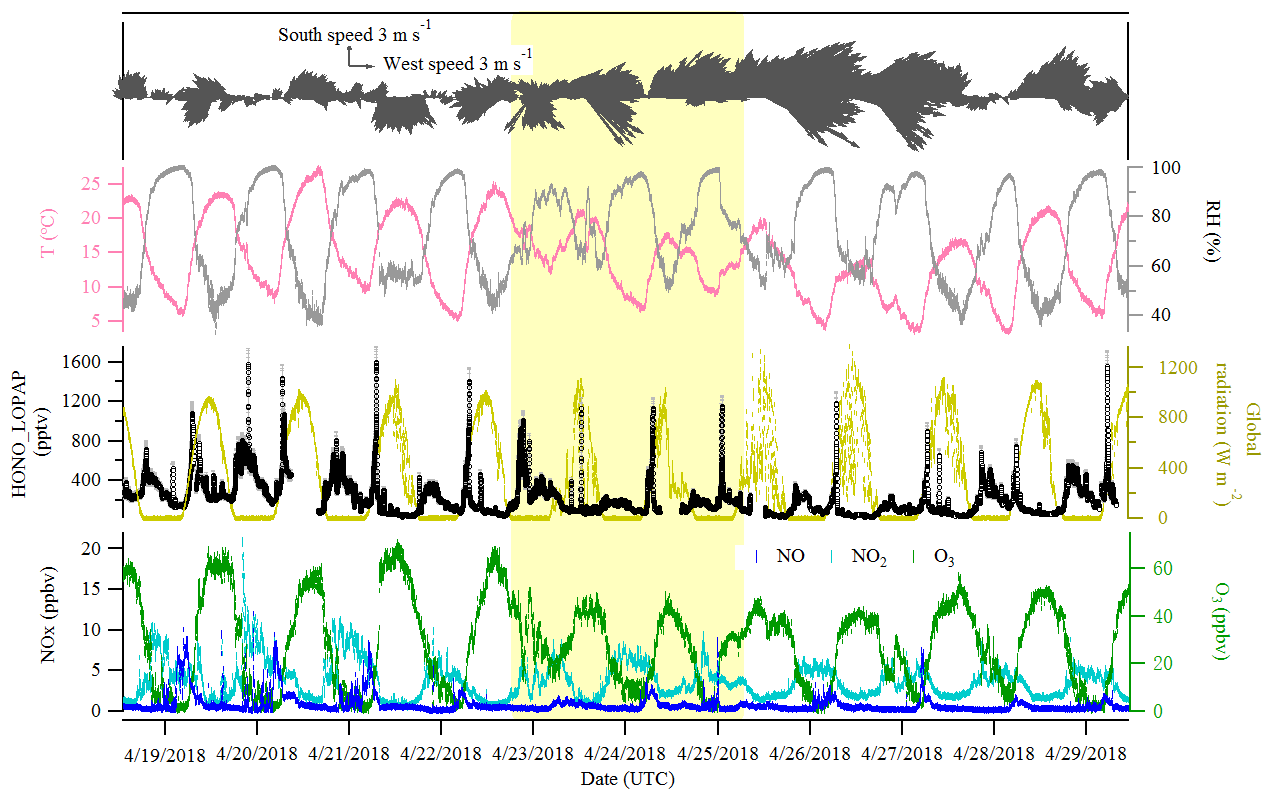
Figure 2Time series of HONO (LOPAP measurement), NO, NO2, O3, global radiation, temperature (T), relative humidity (RH) and surface wind in Melpitz from 19 to 29 April 2018. The gaps are mainly due to the maintenance of the instruments. The yellow shading indicates two sets of observations discussed in Sect. 3.3. The gray color in the HONO panel indicates the measurement error of HONO concentrations.
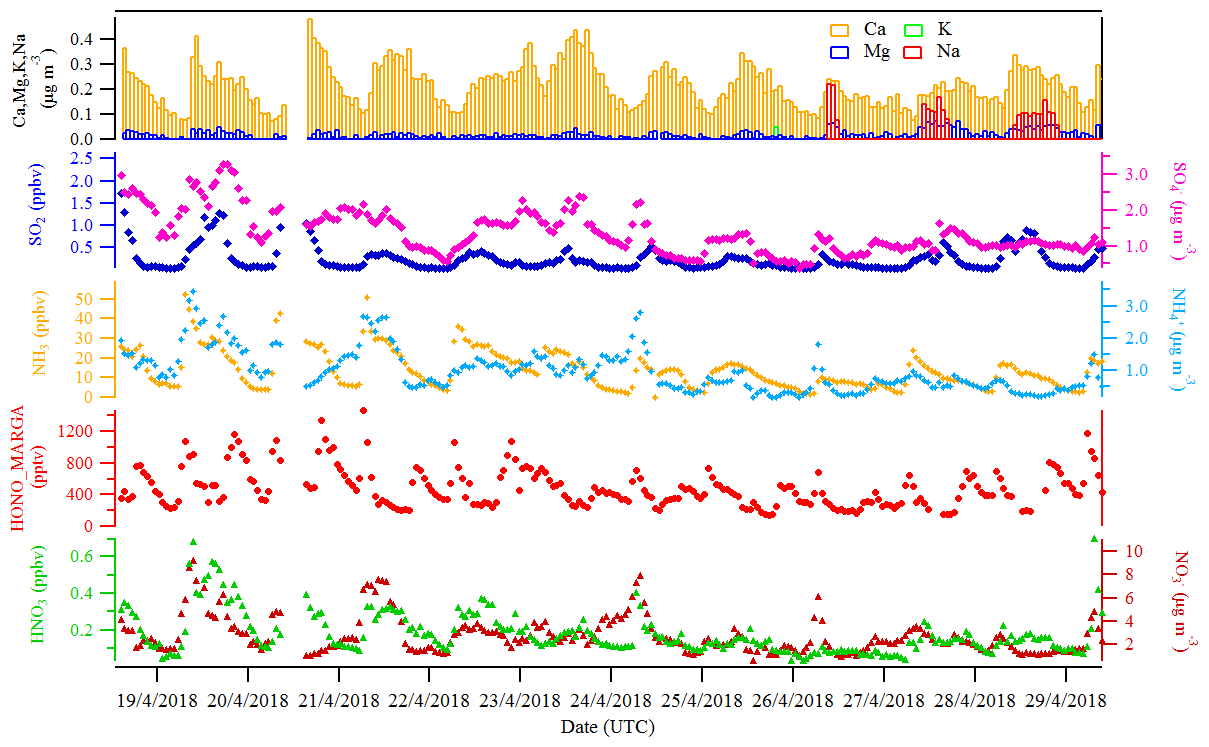
Figure 3The hourly time-resolved quantification of water-soluble ions in PM10 (, , , Na+, K+, Mg2+, Ca2+) and their corresponding trace gases (HONO, HNO3, SO2, NH3) were measured by MARGA in Melpitz from 19 to 29 April 2018.
3.2 General results
Figures 2 and 3 show an overview of the measured HONO, NO, NO2, O3, meteorological parameters, water-soluble ions in PM10 (, , , Na+, K+, Mg2+, Ca2+) and their corresponding trace gases (HONO, HNO3, SO2, NH3) in the present study. The daytime (D, 04:00–18:00 UTC) and nighttime (N, 18:00–04:00) averages are also provided in Table 1. During the 2 week measurements, the prevailing winds were from the southwest and northwest sectors, indicating a possible influence of city emissions from Leipzig, Germany, on the site. The strong wind (maximum 13 m s−1) led to a low concentration of water-soluble ions in PM10 (, , ) and their corresponding trace gases (HNO3, SO2, NH3) during the 24 to 29 April 2018 period. The air temperature ranged from 5 to 27 ∘C, and the RH showed a clear variation pattern with higher levels during the night and lower levels during daytime. In addition, the low mixing ratio of NO and NO2 with a diurnal average of 0.9±1.2 ppbv and 3.7±2.2 ppbv, respectively, were recorded. These observations highlight the nature of our measurement site as a typical background environment. The HONO concentration from the LOPAP measurements varied from 30 to 1582 pptv and showed diurnal variations (with average values of 162±96 and 254±114 pptv during daytime and nighttime, respectively).
Größ et al. (2018) reported the linear function of the global radiation flux vs. OH radical concentration for the EUCAARI 2008 campaign at Melpitz:
with Rad being the global solar irradiance (in W m−2) and [OH] being the hydroxyl radical concentration. The proportionality parameter A is 6110 . On the basis of such a correlation, we derived the OH concentration during the period of this field measurement with an average of during daytime.
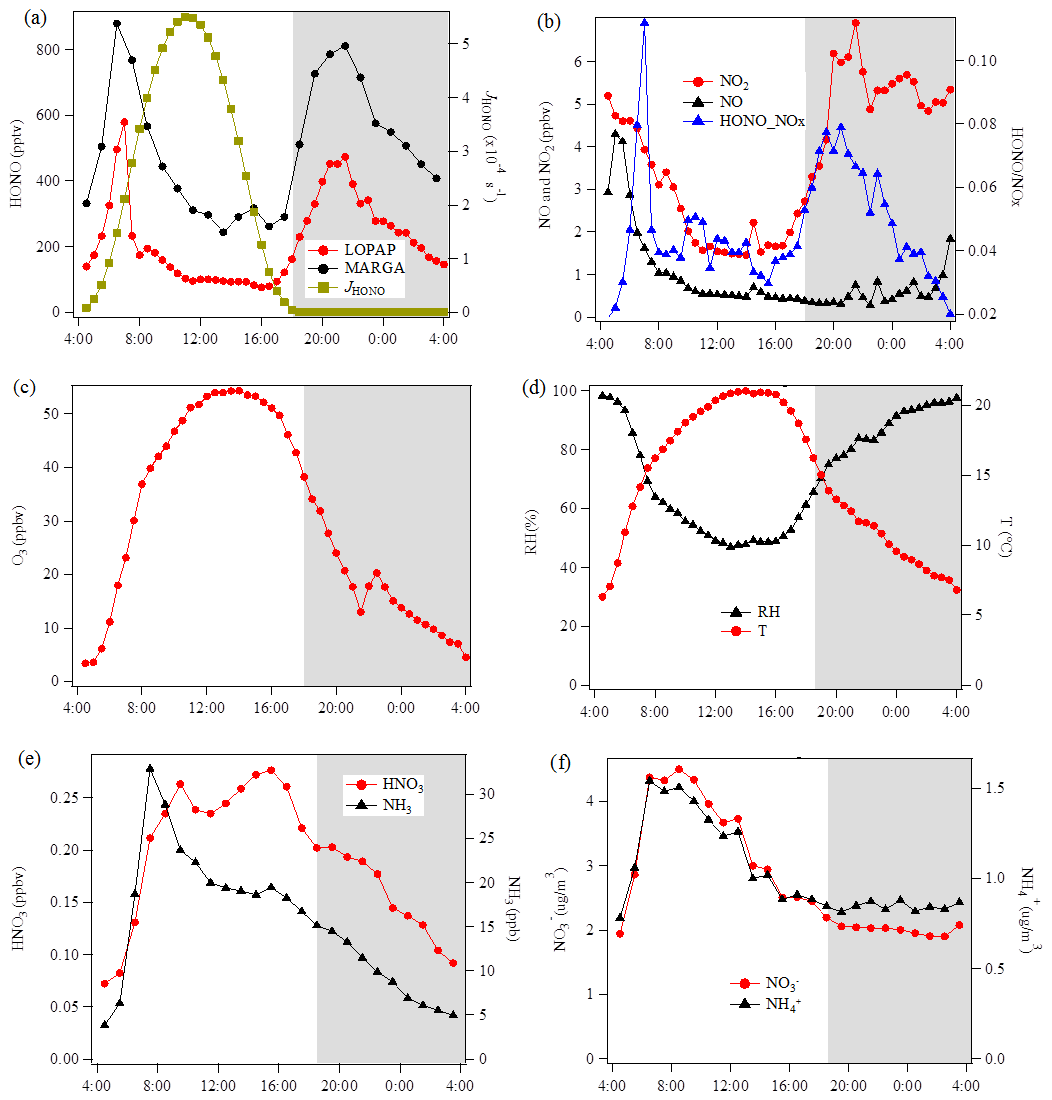
Figure 4Diurnal variations of HONO and related species during the measurement period except for two sets of observations show in Fig. 5 at the Melpitz site. The photolysis rate of HONO was obtained from the TUV model. The shaded gray area indicates the nighttime period (18:00–04:00 UTC).
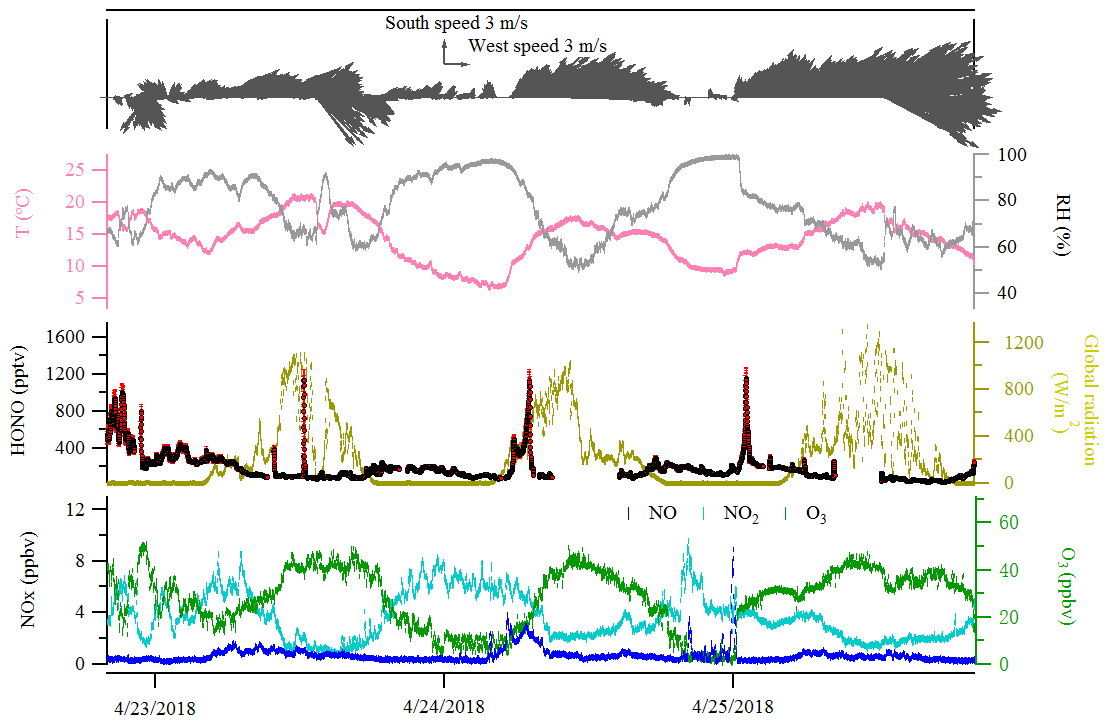
Figure 5Case events for HONO (LOPAP) and related species at Melpitz site during the day from 23 to 25 April 2018. The red color in the HONO panel indicates the measurement error of HONO concentrations.
3.3 Diurnal variation of HONO, particles and trace gas species
The diurnal profiles of HONO and related supporting parameters are shown in Fig. 4 for the whole period except for two sets of observations: (1) no HONO peak in the morning of 23 April and (2) HONO peak observed at 00:00–02:00 UTC on 25 April (Fig. 5). Overall, the HONO increased rapidly after sunrise and peaked at 07:00 UTC, then dropped quickly, reached a minimum at around 10:00 UTC, and remained constant until 17:00 UTC. Such a daytime pattern was also found in Spain for a site surround by forests and sandy soils (Sörgel et al., 2011). Sörgel et al. (2011) explained this by local emissions, which are trapped in the stable boundary layer before its breakup of the inversion in the morning based on a similar diurnal cycle for NO and NO2, which is different from this work. In this work, the NO2 mixing ratio decreased from midnight until noon, and NO peaked at 05:00 UTC then remained at a low concentration (<1 ppbv) for 18 h of 1 d. However, three hypotheses could be expected to explain this HONO morning peak. For hypothesis (a), the HONO morning peak might possibly be caused by the photolysis of particle-phase (Ye et al., 2016; Zhou et al., 2003, 2011) since, as shown in Fig. 4a, e and f, the early morning variation trend of HONO during daytime was similar to the one of NH3 in the gas phase, as well as and in PM10. Hypothesis (b), as reported by Stemmler et al. (2006), states that the photosensitized NO2 on humic acid could act as a source of HONO during the daytime. For hypothesis (c), this morning peak of HONO has been reported for Melpitz (4–14 April 2008) by Acker et al. (2004), who expected that the storage of HONO on wet surfaces can be a source for observed daytime HONO. To be precise, it was observed that dew was formed overnight during our campaign in Melpitz. Gaseous HONO could be deposited in these droplets. Due to evaporation after sunrise, HONO would be reemitted in the atmosphere which would lead to a HONO morning peak. These hypotheses will be further discussed in Sect. 4.
As shown in Fig. 4a and b, the HONO and NO2 concentrations started to increase coincidentally at 16:00 UTC when the sunshine was weak. This could be explained by the variation of the vertical mixing increasing the level of all near-ground-emitted formed species or by the heterogeneous conversion of NO2 to HONO during nighttime; both will be discussed in Sect. 4. The HONO mixing ratio then decreased from 21:00 UTC to around 100 pptv even though the NO2 concentration was kept constant around 5–6 ppbv. This decrease during nighttime indicates the HONO loss process (dry and wet deposition, trapped in the boundary layer, dew, etc.) that surpasses the HONO formation from the NO2–HONO conversion. The diurnal cycle of O3 reflects the balance between the photochemical formation of O3 (e.g., NO2+hν) and O3 consumption (e.g., ozonolysis of terpenes).
Table 2Nitrite concentration measured in dew water.
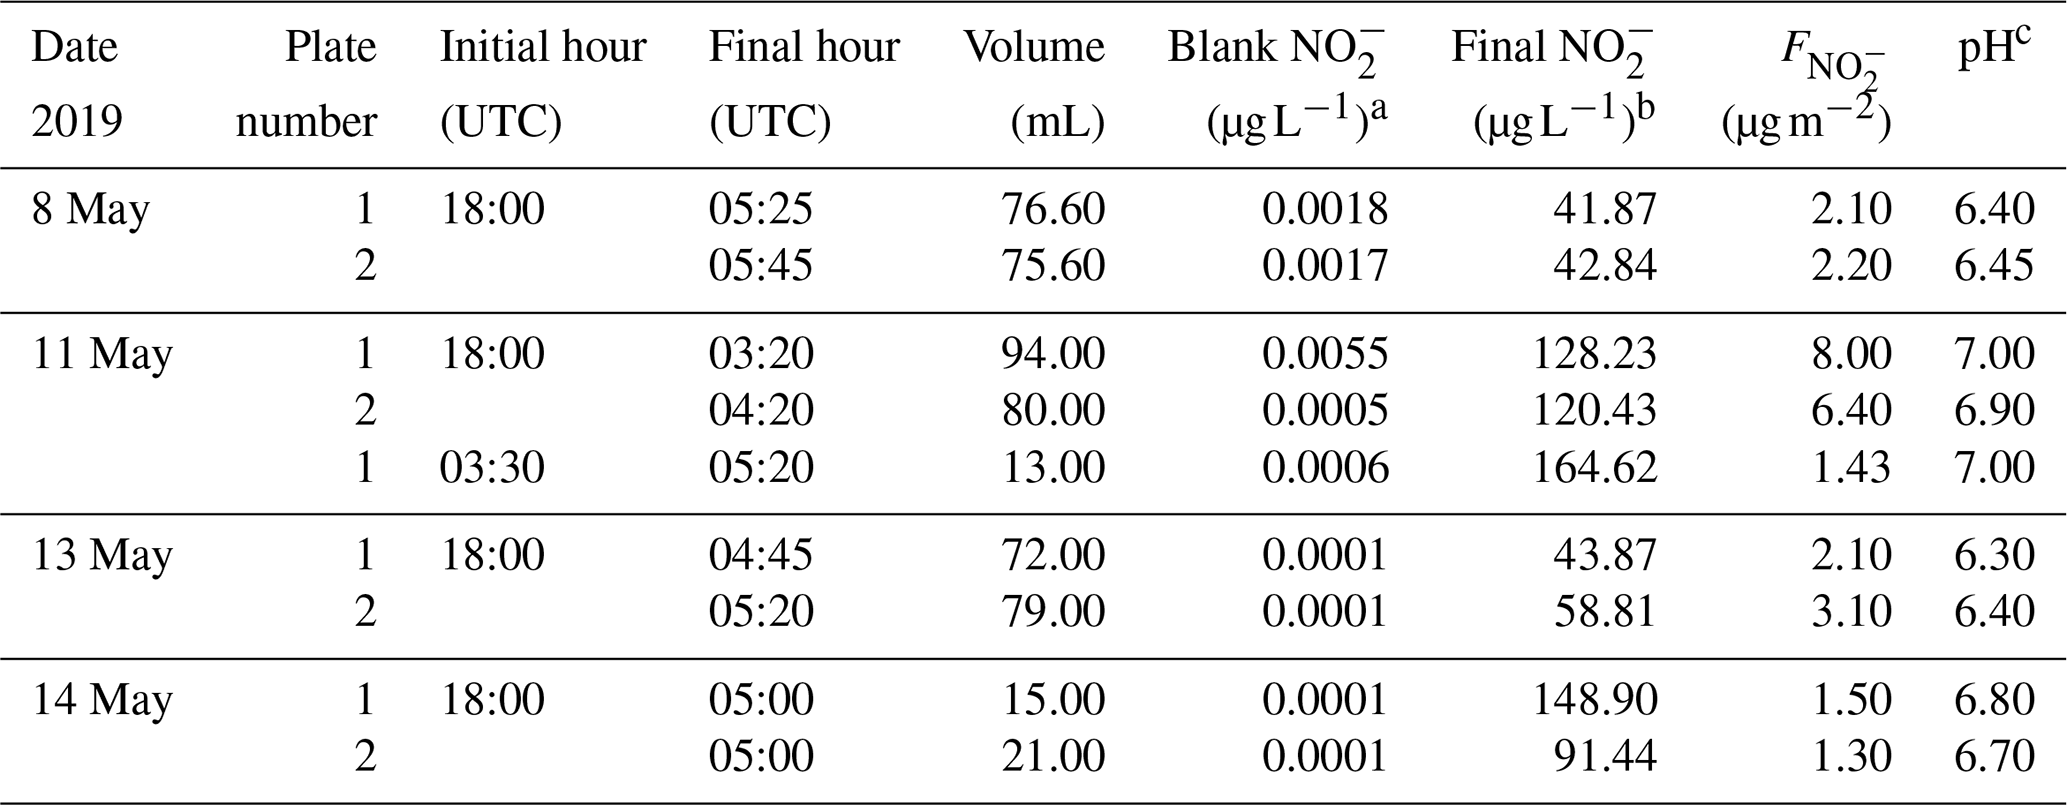
a Note that the blank concentration is below the
detection limit of 0.02 µg L−1.
b Final = Raw – Blank .
c pH was measured by a pH meter on a subsample of the total volume.
3.4 HONO in the dew water
Dew water formation on canopy surfaces could be an efficient removal pathway of water-soluble pollutants. High solubility of HONO makes dew water an efficient sink and a stable reservoir for atmospheric HONO. Actually, a lot of dew water has been observed on the grass around the Melpitz station during the sampling period of 19 to 29 April 2018. Hence, to investigate the dissolved HONO in the dew water at Melpitz station, the dew water was collected and analyzed from 8 to 14 May 2019 during the same season as the HONO measurements. Many ions, e.g., , Cl−, , , Oxalate, Br−, F−, Formate, MSA, , Na+, , K+, Mg2+ and Ca2+, were analyzed using MARGA and laboratory IC, but our discussion only focuses on . The sample parameters (time, pH etc.) and concentration in the sample (µg L−1) are shown in Table 2 from two glass plates (plate 1 and plate 2). The final dew water was calculated by subtracting the blank from the raw data of dew water analysis in MARGA. The pH of dew water in Melpitz ranged from 6.30 to 7.00. It should be noted that the dew water was frozen until 1 h after sunrise on 8, 13 and 14 May 2019 but not on 11 May 2019. On this day, a third sample was collected from 03:30 to 05:20 UTC after collecting the first sample (18:00–03:20 UTC). The concentration per square meter of the sampler surface () was calculated with the following equation:
where [] is the sample concentration (in µg L−1), Vdew is the sample volume (in mL), and S is the surface area of the glass sampler (1.5 m2). As shown in Table 2, higher was obtained on 11 May when dew water was not frozen. On other days (8, 13 and 14 May) frozen dew water was observed, which likely inhibited the dissolving of HONO. Hence, these frozen samples were not considered in this paper. On 11 May, the final could be obtained by averaging the of the sum (9.43 µg m−2) of the first and third samples with the second sample (6.40 µg m−2) on 11 May, resulting in a mean of 7.91±2.14 µg m−2. This value will be used for the following calculation and discussion.
4.1 Contribution of vehicle emissions
Because the Melpitz site is close to a main national road from Leipzig to Torgau (Germany) that is within the main southwest wind direction, the contribution of vehicle emissions to the measured HONO mixing ratio should be evaluated. Generally, the HONO∕NOx ratio is usually chosen to derive the emission factor of HONO in the freshly emitted plumes (Kurtenbach et al., 2001). As illustrated in Fig. S3, NOx concentrations were normally lower than 15 ppbv, and NO∕NOx ratios were ∼0.4 in this campaign, suggesting the detected air is a mixture of fresh and aged air during the measurement period. Therefore, a substantial part of HONO is secondary. Additionally, following the criteria of Li et al. (2018), the bad correlation between HONO and NOx (R2≈0.35) suggests that the direct HONO emissions from the vehicle-emitted plumes were less important in this work.
4.2 Nighttime HONO
The nighttime HONO is different to some reported literatures (Huang et al., 2017; Li et al., 2012; Wang et al., 2017; Zhou et al., 2007). HONO increased after sunset to a maximum at 21:00 UTC and decreased until sunrise.
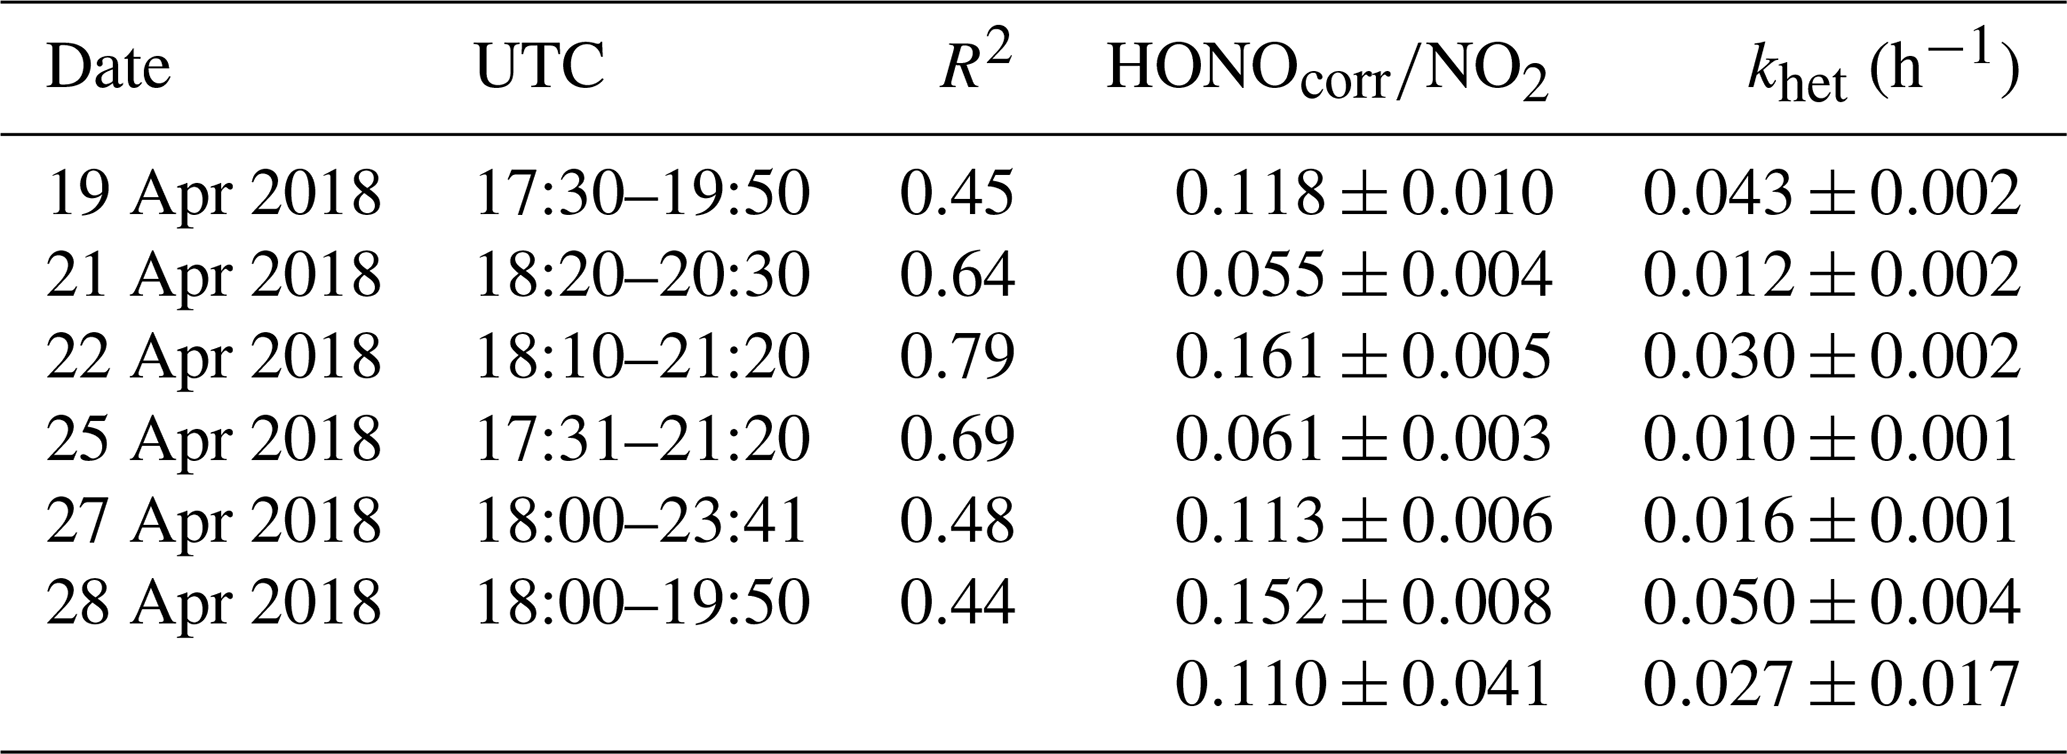
Table 3The ratio HONOcorr∕NO2 and the NO2–HONO conversion frequency during early nighttime.
4.2.1 Formation through heterogeneous conversion of NO2
The ratio of HONO∕NO2 is generally used as an index to estimate the efficiency of heterogeneous NO2–HONO conversion because it is less influenced by transport processes than individual concentrations. However, the ratio might be influenced when a large fraction of HONO is emitted from traffic, but this is expected to be less important as shown in Sect. 4.1. Hence in this work, a low emission factor of 0.3 % was used to correct the direct HONO emissions from vehicles (HONOcorr) (Kurtenbach et al., 2001). Six conditions as listed in Table 3 are selected to calculate the NO2–HONO frequency following the criteria of Li et al. (2018).
- (a)
Only the nighttime data in the absence of sunlight (i.e., 17:30–06:00 UTC) are used.
- (b)
Both HONOcorr and HONOcorr∕NO2 ratios increased steadily during the target case.
- (c)
The meteorological conditions, especially surface winds, should be stable.
Figure S4 presents an example of the heterogeneous HONO formation occurring on 28 April 2018. In this case, the HONO mixing ratios increased rapidly after sunset from 100 to 600 pptv. Together with the HONO mixing ratio, the HONOcorr∕NO2 ratio increased almost linearly between 18:00 and 19:50 UTC. The slope fitted by the least squares regression for HONOcorr∕NO2 ratios against time can be taken as the conversion frequency of NO2 to HONO (khet).
The ratio of HONOcorr∕NO2 ranged from 0.055 to 0.161 with a mean value of 0.110±0.041 (Table 3) using the data during early nighttime (17:30–00:00 UTC) in the Melpitz campaign. The mean values are within the wide range of reported values of 0.008–0.13 in the fresh air masses from most sampling sites (Alicke et al., 2002, 2003; Sörgel et al., 2011; Su et al., 2008; VandenBoer et al., 2013; Wang et al., 2017; Zhou et al., 2007) except for the study of Yu et al. (2009), who got a high value of 0.3. To our best knowledge, the present work also presents a high NO2–HONO conversion frequency (khet) of 0.027±0.017 h−1 compared to most of the previous studies at urban sites, such as Alicke et al. (2002) in Milan (0.012 h−1), Wang et al. (2017) in Beijing (0.008 h−1), and Acker and Möller (2007) in Rome (0.01 h−1). However, our value is additionally comparable to Li et al. (2012) with 0.024±0.015 h−1, Alicke et al. (2003) with 0.018±0.009 h−1, and Acker and Möller (2007) with 0.027±0.012 h−1, who also conducted rural measurements in the Pearl River Delta (PRD) area in southern China, Pabstthum in Germany, and Melpitz, respectively, surrounded by farmland (grasses, trees, small forests). The higher value may suggest that a more efficient heterogeneous conversion from NO2 to HONO is present in rural sites than in urban sites.
4.2.2 Relative importance of particle and ground surface in nocturnal HONO production
The particle surface density Sa was calculated as (0.4–9.9) × 10−4 m2 m−3 from the particle size distribution (Fig. S5a) ranging from 5 nm to 10 µm of APSS and D-MPSS data by assuming the particles are in a spherical shape for the whole day period of 19–29 April 2018. Due to the high RH (RH ∼100 % during nighttime in Fig. S5b), the particle surface density Sa would be strongly enhanced (1 magnitude) by the RH correction to be (0.5–1.9) × 10−3 m2 m−3 with a hygroscopic factor f (RH) following the method of Li et al. (2012) and Liu et al. (2008) and calculated as follows:
where the empirical factors a and b were set to 2.06 and 3.6, respectively.
The formation of HONO through heterogeneous NO2 conversion on particle surfaces (Sa) can be approximated following the recommendations in Li et al. (2010) by considering 100 % HONO yield on the particle surface (NO2+Org, soot, etc.):
where is the mean molecular velocity of NO2 (370 m s−1) (Ammann et al., 1998), Sa∕V is the particle surface to volume ratio (m−1) representing the surfaces available for heterogeneous reaction, and is the uptake coefficient of NO2 at the particle surface. Assuming the entire HONO formation was taking place on the particle surface, the calculated from Eq. (4) varied from to with a mean value of . This number is 2–3 orders of magnitude higher than typical uptake coefficients determined in the lab for the uptake of NO2 in the dark on different substrates, e.g., Teflon, glass, NaCl, TiO2, soot, phenol, etc.: 10−6 to less than 10−8 (Ammann et al., 1998; Gutzwiller et al., 2002; Kleffmann et al., 1998; Kurtenbach et al., 2001). Thus, this theoretical uptake coefficient clearly shows that formation on particles is not important. In addition, the weak correlations between HONOcorr (R2=0.566), HONOcorr∕NO2 (R2=0.208) and Sa (Fig. S6) confirm that the HONO formed on particle surfaces could be unimportant, as previously reported (Kalberer et al., 1999; Sörgel et al., 2011; Wong et al., 2011).
As illustrated above, the heterogeneous NO2 conversion on ground surfaces (including surfaces such as plants, building, soils, etc.) contributes mainly to the nighttime formation of HONO, which can be approximated by Eq. (5) following the method in the literature (Kurtenbach et al., 2001; Li et al., 2010; VandenBoer et al., 2013, 2014) and also been applied by Zhang et al. (2016) by considering a 50 % HONO yield from Reaction (R2):
where is the uptake coefficient of NO2 at the ground surface, and Sg∕V represents the ground surface to volume ratio. As described by Zhang et al. (2016), the leaf area index (LAI; m2 m−2) was used to estimate the surface to volume ratio for the vegetation-covered areas following the method in Sarwar et al. (2008):
where H is the mixing layer height, which was calculated from the backward trajectory analysis based on Global Data Assimilation System (GDAS) data under dynamic conditions (Fig. S7). The mixing layer height ranged between 20 and 300 m from 17:00 until around 00:00 UTC in April 2018 (Fig. S7). The LAI value is multiplied by a factor of 2 to take the areas on both sides of the leaves into account. In Wohlfahrt et al. (2001), the LAI for meadows with different grass heights are given. Regarding the grass height of ∼30 cm in April 2018, we used a factor of 6 in the present study. If the entire HONO formation was taking place on the ground surface, the calculated varied from to with a mean value of . This value agrees well with the reported range of from 10−6 to 10−5 on the ground surface based on the laboratory studies (Donaldson et al., 2014; VandenBoer et al., 2015) and field campaign in Colorado, USA (VandenBoer et al., 2013) during the nighttime. As the S∕V ratio of particles is typically orders of magnitude lower than for ground surfaces, it is suggested that the heterogeneous reactions of NO2 on the ground surface may play a dominant role for the nighttime HONO formation.
In addition, the relationship of the NO2–HONO conversion frequency (khet presented in Table 3) with the inverse of wind speed is illustrated in Fig. S8a. As indicated in Fig. S8a, wind speed was predominantly less than 3 m s−1 during the field campaign period in Melpitz. The high conversion frequency of NO2 to HONO mostly happened when wind speed was less than 1 m s−1, which confirms that HONO formation mainly takes place on the ground. However, one point (in blue in Fig. S8a) showed highest NO2–HONO conversion frequency (khet) when wind speed was ca. 4 m s−1 according to the second set of observation mentioned in Sect. 3.3 and Fig. 5. The likely reason for the temporary HONO peak is the dew droplet evaporation after increasing wind speed.
4.2.3 HONO deposition on the ground surface
As illustrated in Figs. 4a and S4, between midnight and sunrise (19:00–04:00 UTC), the deposition of HONO becomes increasingly important as the absolute amount of HONO decreased. Assuming a constant conversion frequency of NO2 to HONO, khet, the HONO deposition rate (LHONO) can be roughly estimated by the following:
The strength of the HONO sink during night is on average 0.16±0.12 ppbv h−1 and ranged from 0.04 to 0.45 ppbv h−1. This value is similar with reported ones in the literature (He et al., 2006).
The relationship of [HONO]∕[NO2] with RH during nighttime (18:00–04:00) is illustrated in Fig. S8a. A positive trend of the [HONO]∕[NO2] ratio along the RH was found when RH was less than 70 %. However, [HONO]∕[NO2] performs a negative trend with RH for values over 70 %. The same phenomenon was also observed by Yu et al. (2009) in Kathmandu and Li et al. (2012) in the PRD region, China. This finding can be associated with larger amounts of water on various ground surfaces (plants and grasses) when ambient humidity approached saturation, leading to an efficient uptake of HONO.
Assuming all the extra HONO is removed through deposition on the ground surface, the change in HONO in the time interval of 22:00–04:00 UTC is parameterized using a combination of Eq. (7) and the following equation:
where γHONO,ground is the HONO uptake coefficient on the ground surface, υHONO is the mean molecular velocity of HONO with 3.67×104 cm s−1, and H is the mixing layer height calculated from the backward trajectory analysis ranging between 20 and 150 m with an average of ca. 55 m from 22:00 until 04:00 UTC in April 2018. This approach yielded a γHONO,ground uptake coefficient in the range of to with an average of , which is similar to data found in Boulder, Colorado, ranging from to (VandenBoer et al., 2013).
As observed by several studies (He et al., 2006; Rubio et al., 2009; Wentworth et al., 2016), the effective Henry's law solubility of HONO is highly pH-dependent (from borderline soluble at pH =3 to highly soluble at pH ≥6), as would be expected for a weak acid. The pH of collected dew water during nighttime in May 2019 was 6.3–7.0 (Table 2), for which the effective Henry's law solubility of HONO would be high. The amount of HONO in this dew water was quantified using MARGA and ranged between 42 and 165 µg L−1, which is higher than the in dew waters in Santiago, Chile (Rubio et al., 2009). This could strongly support the obtained HONO uptake coefficient on the ground surface. These field-derived surface parameters of nighttime HONO production from NO2 and surface deposition of HONO are valuable to the model evaluation. However, it should be noted that the measured pH of collected dew from the glass plate might differ compared to the pH of dew found on soil or vegetated surfaces. The chemical nature of the material with which the water is in contact can influence the effective pH.
A simple resistance model based on the concept of aerodynamic transport, molecular diffusion and uptake at the surface (presented in the Supplement) as proposed by Huff and Abbatt (2002) was used to evaluate the factor(s) controlling the potential applicability of the γ coefficients calculated here for the uptake of NO2 and deposition of HONO. As shown in Fig. S9, the deposition loss of HONO is potentially limited by a combination of aerodynamic transport, molecular diffusion and reaction processes. However, the HONO uptake will be transport-limited if the real uptake coefficients are greater than or equal to 2.8 and wind speed is less than 0.5 m s−1. In addition, molecular diffusion could play an important role for HONO uptake on the surface. Regarding the uptake of NO2 on the ground surface, the range of NO2 uptake coefficients of to obtained in the present work indicates a limitation only in the reactive uptake process. The consistency between our findings and the values of these parameters in models (Wong et al., 2011; Zhang et al., 2016) suggests that the broad scale applicability of these field-derived terms for the surface conversion of NO2 should therefore be possible. However, those value of γ found for HONO ( to ) require further exploration from various field environments and controlled lab studies.
4.3 Daytime HONO
HONO concentrations started to increase after sunrise and peaked at 07:00 UTC (Fig. 4); during that time, it also underwent photolysis, eventually reaching a steady state between 10:30 and 16:30 UTC. Throughout the day, HONO was observed to reach an averaged minimum mixing ratio of 98±15 pptv. Since NO and NO2 do not have the same diurnal cycle as HONO (Fig. 4), Reactions (R2) and (R7) are not expected to be responsible for this HONO morning peak but could contribute to the daytime HONO for the period of 10:30–16:30 UTC.
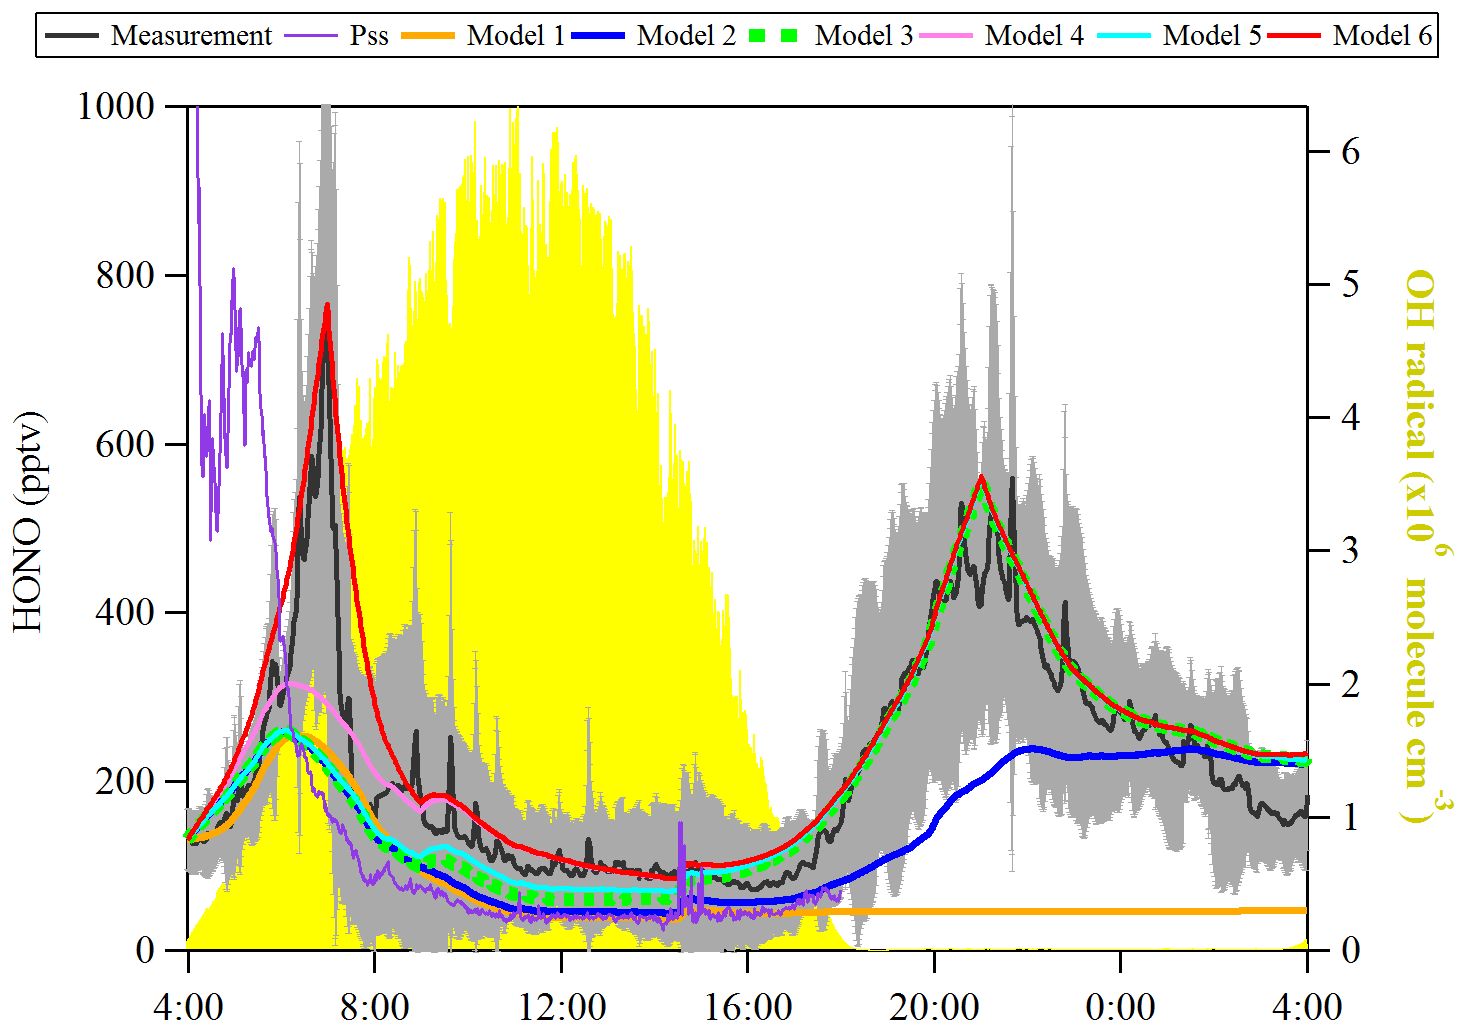
Figure 6Observed average HONO atmospheric concentration (black line, ±1σ in shaded area) and the model calculated HONO concentration including different HONO production and loss processes. The particle size spectrometer presents model results by assuming an instantaneous photo-equilibrium between the gas-phase formation (Reaction R7) and gas-phase loss processes (Reactions R1 and R11) of HONO. Model 1 includes Reactions (R1), (R7) and (R11). Model 2 includes Reactions (R1), (R2), (R7) and (R11) and surface deposition from 00:00 to 00:00, whereas Model 3 describes Reactions (R1), (R2), (R7) and (R11) and surface deposition from 17:00 to 08:00. Model 3 is used as the base to investigate the effect of Reaction (R9) (Model 4), Reaction (R5) (Model 5) and the combination of Reactions (R5) and (R9) and dew HONO emissions (04:30–07:00) (Model 6).
4.3.1 Photostationary state in the gas phase
The measured diurnal daytime HONO could be compared to model results by assuming an instantaneous photo-equilibrium between the gas-phase formation (Reaction R7) and gas-phase loss processes (Reactions R1 and R11), which is described by the following expression (Kleffmann et al., 2005):
OH concentration was estimated from the linear function of the global radiation flux vs. OH radical concentration as described in the previous section and shown in Fig. 6. JHONO was calculated using the TUV model as described in Sect. 2.6. The rate constants of NO+OH (k7) and HONO+OH (k11) used are (Burkholder et al., 2015) and (Atkinson et al., 2004), respectively. As a result, shown in Fig. 6, the [HONO]pss (PSS, violet curve) could not explain the sudden HONO increase after sunrise, but it indicates a HONO peak around 04:40 UTC according to the relatively high NO concentration. However, some studies (Michoud et al., 2012; Sörgel et al., 2011) already discussed that the stationary state of HONO can be only reached during noontime. Hence, a model calculation (named Model 1) was also used to discuss the HONO contribution from the gas-phase reaction of NO with OH radicals:
where khet derived in this work is 0.027 h−1, and [NO] and [NO2] are averaged concentrations from field measurements. The results are shown in Fig. 6 (orange line, Model 1). It is reasonable to indicate that Reaction (R7) only contribute 30 %–55 % to the HONO increase in the early morning (04:30–07:30 UTC). Reaction (R7) can continually contribute 50 % of the measured HONO from 10:30 to 16:30 UTC. However, regarding the large uncertainty of [OH] (a factor of 2), the “unknown HONO sources” exist but could be non-crucial. Basically, the additional HONO contribution rate could be estimated from the following equation:
An additional source of 91±41 pptv h−1 was derived beside the OH reaction with NO according to a HONO mixing ratio of 98±15 pptv for the time period of 10:30 to 16:30 UTC. This could be well explained by the photochemical processes such as Reactions (R5) and (R9) and will be discussed deeply in the next section.
4.3.2 Evidence for nighttime-deposited HONO as a morning source
As observed in our field measurements and shown in Fig. 2, the HONO concentrations always presented a strong increase from 04:00 to 07:00 UTC, which induces three hypotheses as also mentioned in Sect. 3.3: (a) photolysis of gas-phase and particulate nitrate, (b) photosensitized conversion of NO2, and (c) dew on ground surfaces serving as a HONO sink during the night and becoming a morning source by releasing the trapped nitrite back into ambient air.
To identify this HONO source, the chemical box model as expressed in Eq. (12) was extended with additional processes. The heterogeneous reaction of NO2 on the wet surface (Reaction R2) and HONO deposition on the ground surface were firstly used to quantify the contributions of the well-known HONO production and loss processes. In addition, the HONO deposition on the ground surface independent of RH (24 h, named Model 2) and with an RH dependence (nighttime 17:00–08:00 UTC, named Model 3) are also discussed:
Both the surface production of HONO through the NO2 heterogeneous reaction and subsequent loss by ground surface deposition are already termed in Eqs. (5) and (8), respectively. Here, khet is 0.027 h−1, and γHONO,ground is , which have been calculated from the present observations. These values are applied to the model calculation to simulate the diurnal cycle of HONO. As shown in Fig. 6, both Model 2 (blue line) and Model 3 (green square) cannot explain the HONO morning peak, but Model 3 can reproduce well the nighttime HONO, indicating that surface loss of HONO is an important sink to consider when the RH was saturated. Hence, Model 3 was used as basic run for the following model calculation.
To investigate the contribution of photolysis of nitric acid and nitrate () (Reaction R9) on the diurnal HONO based on hypothesis (a), the following model calculation (Model 4, pink line) was made:
Here gas-phase HNO3 and particle are summed up, and the photolysis frequency was derived from the TUV model by multiplying by an enhanced factor of 30 due to a faster photolysis of particle-phase HNO3 (Romer et al., 2018). As a result, the photolysis of HNO3/ (Model 4, pink line) could not reproduce the HONO morning peak shown in Fig. 6. However, it could reproduce well the HONO for the time period of 10:30 to 16:30 UTC.
To investigate the contribution of the photosensitized conversion of NO2 (Reaction R5) on the diurnal HONO based on hypothesis (b), the following model calculation (Model 5) was performed:
Here γa and γg are the light-enhanced NO2 uptake coefficients, both (Zhang et al., 2016), on both the aerosol surface and ground surface, respectively. was multiplied by the light intensity divided by 400 when the light intensity was greater than or equal to 400 W m−2. As shown in Fig. 6 (Model 5, cyan line), the photosensitized NO2 on the aerosol and ground surface could not reproduce the HONO morning peak. This favors the third hypothesis that dew evaporation processes release HONO resulting in the sudden morning peak.
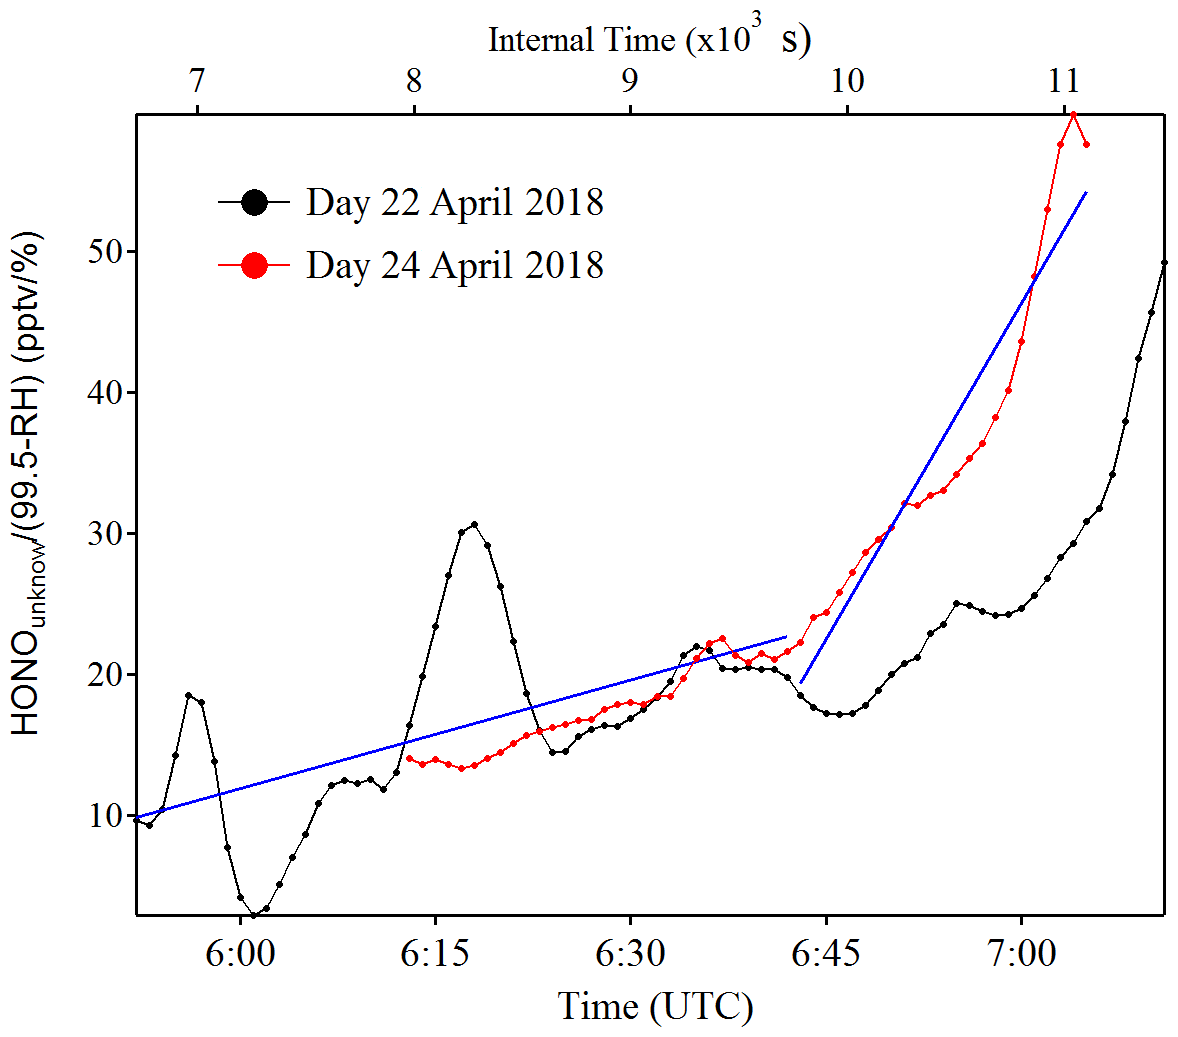
Figure 7Example of as a function of time (zero point from time 04:30 UTC) to estimate the temporary HONO emission rate from dew water (kemission). The blue line is the linear least square analysis of vs. the internal time to obtain the minimum (e.g., 22 April for the low slope) and maximum (e.g., 24 April for the high slope) of kemission.
Indeed, as shown in Fig. S10, the HONO morning peak always happens according to a rapid decrease in RH between 04:30 and 09:00 UTC. However, there is one case that happened at 01:00 UTC on 25 April 2018 possibly due to an upcoming strong wind which decreased the RH and evaporated the dew water on the ground surface. It should be noted that this HONO morning peak was never observed during this field measurement period without a rapid RH decrease as in the case of a dry ground surface, as was observed during the morning of 23 April 2018. To figure out the relationship between temporary HONO emission from dew water and decreasing RH, the following equation was defined:
where was calculated for each day of the whole campaign period. The kemission values could be obtained from the linear least square analysis of vs. the internal time of the HONO morning peak (04:30–07:00 UTC), as shown in Fig. 7. The maximum and minimum of kemission are obtained as 0.026±0.008 and 0.006±0.001 , respectively, with an average of 0.016±0.014 , as presented in Table 4. The average value was used in the following model calculation to reproduce the diurnal cycle of HONO:
In Fig. 6, Model 6 (red line) shows that the amount of deposited HONO could represent the amount of HONO during the morning peak. In Fig. S11, the measured atmospheric HONO mixing ratio and the calculated HONO mixing ratio using Model 6 with a minimum dew HONO emission (kemission=0.006 ) and a maximum dew HONO emission (kemission=0.026 ) are shown. HONO emission from the dew water evaporation represented at least 90 % and likely in excess of 100 % of the calculated unknown HONO morning peak, which may continually serve as a HONO source for the whole daytime as long as water evaporates depending on the weather conditions.
Table 4Summary of the temporary HONO emission rate from dew water, kemission, from 19 to 29 April 2018.

4.3.3 HONO emission from dew water evaporation in the morning
The hypothetical morning HONO mixing ratio (pptv) due to the complete dew water evaporation could be estimated from the following equation by taking the measured dew nitrite and the mixing layer height:
is the concentration per square meter of the glass sampler surface. The mean from 11 May 2019 was used for the calculation. Sg represents the surface area of the flat ground (analog to the surface area of the glass sampler), and α is the enhanced factor for Vdew (dew water sample volume of the glass sampler in Eq. 2) due to the larger cold surfaces from grass which can get in contact with humid air than the flat glass sampler. The α value was calculated as 2×LAI to take the areas on both sides of the leaves and the vegetation-covered areas on the ground into account, and a factor of 6 for LAI was assumed and used in Sect. 4.2.2. However, regarding the possibly different grass height during the HONO field measurement and dew measurements in April 2018 and May 2019, respectively, we would use a range of 1–6 for LAI in this section. During the HONO peak at 06:00 or 07:00 UTC, the mixing height ranged between 175 and 600 m, while the value ranged from 20 to 200 m at 00:00–05:00 UTC. Hence, the overall concentration increase from this source would be 377–2264, 189–1132, 76–122, 38–226 and 13–76 pptv if all of the deposited HONO is released into the overlying air column for mixing heights of 20, 40, 100, 200 and 600 m, respectively. Since the released HONO was subjected to photolysis, using a JHONO from the TUV model scaled by global radiation (Sect. 2.7), a maximum [HONO] of 176–1053, 88–527, 35–211, 18–105 and 6–35 pptv for the mixing heights of 20, 40, 100, 200 and 600 m, respectively, would be contributed from the surface nitrite release at 07:00 UTC after the process started at 04:00 UTC. For a reasonable 100 m mixing height, this would account for 5 %–30 % of the observed HONO morning peak in Fig. 6. This low percentage might be a result of the different sampling time of dew measurements compared to HONO measurements, and further studies are required for the exact quantification. Although the above calculations may be simplified well, the results do suggest that the release of the deposited HONO on wet/moist canopy surfaces may contribute to the morning HONO concentrations in the overlying atmosphere right after dew evaporation.
Indeed, few field studies (He et al., 2006; Rubio et al., 2009) have reported that dew water can serve as a sink and a temporary reservoir of atmospheric HONO. Previously, the role of dew as a nighttime reservoir and morning source for atmospheric NH3 has been reported by Wentworth et al. (2016). Our results suggest that nocturnally deposited HONO forms a ground surface reservoir which can be released on the following morning by dew evaporation. Therefore, a significant fraction of the daytime HONO source can be explained for the Melpitz observations.
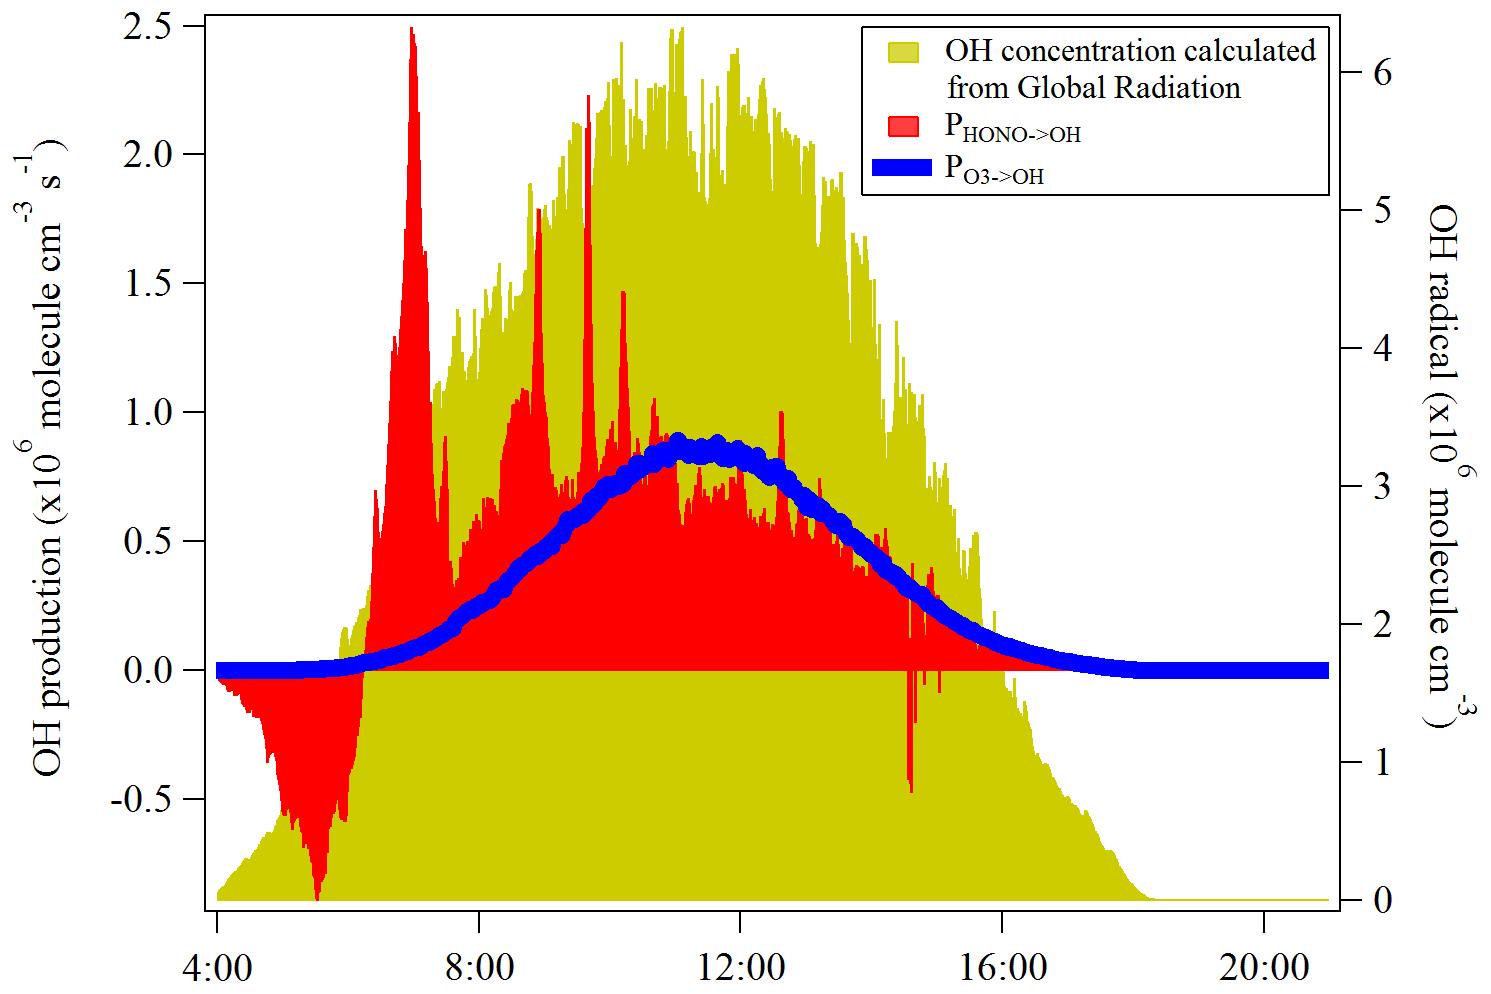
Figure 8The OH production rates from the photolysis of HONO and O3 at Melpitz station from 19 to 29 April 2018. The OH concentration is also shown as the yellow area plot, which was calculated from the global radiation flux measurement: , which is taken from Größ et al. (2018).
4.3.4 Impact on the primary OH sources
HONO serves as an important primary source of OH during daytime in the troposphere (Kanaya et al., 2007; Kleffmann et al., 2005; Villena et al., 2011). Seiler et al. (2012) reported that the HONO is almost the only source of OH radicals in the early morning. The morning peak of HONO is mainly released from the dew evaporation and could imply a strong supply of OH radicals which, hence, enhances the atmospheric oxidizing capacity in the atmosphere around Melpitz. Here, the net rate of OH radicals from the HONO photolysis was calculated and compared with that from ozone photolysis, which is typically proposed as the major OH radical source in the atmosphere when water vapor is not limited.
Other OH sources, such as the photolysis of oxidized VOCs, peroxides and ozonolysis of unsaturated VOCs, are not considered due to the lack of measurement data for these radical precursors. The net rate of OH production from HONO photolysis (PHONO→OH) was calculated by the source strength subtracting the sink terms due to the reactions of Reactions (R7) and (R11). The OH production rate () from O3 photolysis can be calculated by using the method proposed by Su et al. (2008) and Li et al. (2018):
where J(O1D) was obtained from the TUV model scaled by the global radiation. The temperature dependences of k13 and k14 are taken from Jet Propulsion Laboratory/NASA evaluation number 18 (Burkholder et al., 2015). As shown in Fig. 8, the photolysis of HONO produced similar amounts of OH compared to the photolysis of ozone at the mean daytime (09:00–14:00 UTC), which is . was, as expected, highest during the highest J values and negligible at sunrise and sunset. PHONO→OH had a similar trend after noontime but presented a strong OH production around 07:00 UTC due to the HONO morning peak. These results demonstrate the significant role of HONO in an atmospheric oxidizing capacity, especially for areas that experience frequent dew formation. In addition, the OH concentration calculated from the global radiation flux measurement was also shown in the yellow color in Fig. 8. The different trend of calculated OH concentration compared to PHONO indicates that the morning OH concentration could be highly underestimated.
The intercomparison of MARGA and LOPAP for the HONO measurement was applied from 19 to 29 April 2018 at the Melpitz site. A higher HONO mixing ratio (ca. 117 %) was obtained from MARGA compared to that of LOPAP caused by heterogeneous reactions within the MARGA WRD or a potential sampling inlet artifact.
The maximum dew water concentration per square meter of the glass sampler surface was determined to be 7.91±2.14 µg m−2 in May 2019. Thus, under consideration of photolytical losses and homogeneous mixing, the maximum contribution to the HONO morning peak from dew water evaporation could be calculated, and it ranged from 1053±45 to 35±1 pptv for mixing heights of 20 to 600 m, respectively.
Well-defined diurnal cycles of HONO with concentration peaks in the early morning and in the evening are found. The high time resolution of HONO measurements revealed that (i) vehicle emissions are a negligible HONO source at the Melpitz site, (ii) HONO formed from the heterogeneous reaction of NO2 on the ground surface is the dominant nighttime source with a high NO2–HONO conversion frequency of 0.027±0.017 h−1, and (iii) significant amounts of HONO (0.16±0.12 ppbv h−1) are deposited on the ground surface at night. The accurate observations of HONO and NO2 allowed for the direct estimation of the ground uptake coefficients for these species at night: to and to . The ground uptake coefficients of NO2 and HONO are within the ranges of laboratory and model coefficients. The range of HONO uptake coefficient values calculated in this investigation is potentially limited by a combination of transport and diffusion to the ground surface.
A chemical model utilizing observational constraints on the HONO chemical system and known sources and sinks supports the hypothesis that dew water on the ground surface, especially on leaf surfaces, behaves as a sink at night and a temporary reservoir for atmospheric HONO in the morning. The dew evaporation had a negative relationship with the RH in the atmosphere, and, hence, the HONO emission rate was estimated to be 0.016±0.014 depending on the RH after sunrise (start from 04:00 UTC). Furthermore, the formation and evaporation of dew on the ground surface influence significantly the air–surface exchange of HONO and, thus, its temporal distributions in the atmospheric boundary layer in the morning and night. The OH production rate from the photolysis of HONO compared to that from the photolysis of O3 showed that this dew emission of HONO can strongly enhance the OH reactivity throughout the morning time and, hence, plays a vital role in the atmospheric oxidation.
The compiled datasets used to produce each figure within this paper are available as Igor Pro files upon request.
The supplement related to this article is available online at: https://doi.org/10.5194/acp-20-13069-2020-supplement.
YR wrote the paper with input from all authors. BS and GS analyzed the MARGA and dew data and wrote the paper. YR and BG conducted the HONO measurements using LOPAP. TT and AW were responsible for the particle measurements. AM and HH designed the experiments and led the campaign. All coauthors commented on the paper.
The authors declare that they have no conflict of interest.
For the laboratory analysis and the preparation of solutions, we thank Anett Dietze, Anke Rödger and Susanne Fuchs. For support especially in the field, we thank Rene Rabe and Achim Grüner. We also thank the TROPOS mechanical workshop for the construction of the dew sampler.
This research has been supported by the German Federal Environment Agency (UBA) research foundation (grant nos. 351 01 093 and 351 01 070) and the European Union (EU) for the transnational access (TNA) under ACTRIS-2. The comparison of HONO measurements with MARGA and LOPAP at TROPOS research site Melpitz (MARLO) is part of the project that has received funding from the European Union's Horizon 2020 research and innovation program (grant no. 654109). The CNRS team (Orléans-France) acknowledges the support from Labex Voltaire (grant no. ANR-10-LABX-100-01) and the ARD PIVOTS program (supported by the Centre-Val de Loire regional council). Europe invests in Centre-Val de Loire through the European Regional Development Fund.
This paper was edited by Hang Su and reviewed by two anonymous referees.
Acker, K. and Möller, D.: Corrigendum to: Atmospheric variation of nitrous acid at different sites in Europe, Environ. Chem., 4, 364–364, https://doi.org/10.1071/EN07023_CO, 2007.
Acker, K., Spindler, G., and Brüggemann, E.: Nitrous and nitric acid measurements during the INTERCOMP2000 campaign in Melpitz, Atmos. Environ., 38, 6497–6505, https://doi.org/10.1016/j.atmosenv.2004.08.030, 2004.
Alicke, B., Platt, U., and Stutz, J.: Impact of nitrous acid photolysis on the total hydroxyl radical budget during the Limitation of Oxidant Production/Pianura Padana Produzione di Ozono study in Milan, J. Geophys. Res.-Atmos., 107, 8196, https://doi.org/10.1029/2000JD000075, 2002.
Alicke, B., Geyer, A., Hofzumahaus, A., Holland, F., Konrad, S., Pätz, H. W., Schäfer, J., Stutz, J., Volz-Thomas, A., and Platt, U.: OH formation by HONO photolysis during the BERLIOZ experiment, J. Geophys. Res.-Atmos., 108, 8247, https://doi.org/10.1029/2001JD000579, 2003.
Ammann, M., Kalberer, M., Jost, D. T., Tobler, L., Rössler, E., Piguet, D., Gäggeler, H. W., and Baltensperger, U.: Heterogeneous production of nitrous acid on soot in polluted air masses, Nature, 395, 157, https://doi.org/10.1038/25965, 1998.
Ammann, M., Rössler, E., Strekowski, R., and George, C.: Nitrogen dioxide multiphase chemistry: Uptake kinetics on aqueous solutions containing phenolic compounds, Phys. Chem. Chem. Phys., 7, 2513–2518, https://doi.org/10.1039/B501808K, 2005.
Arens, F., Gutzwiller, L., Baltensperger, U., Gäggeler, H. W., and Ammann, M.: Heterogeneous Reaction of NO2 on Diesel Soot Particles, Environ. Sci. Technol., 35, 2191–2199, https://doi.org/10.1021/es000207s, 2001.
Atkinson, R., Baulch, D. L., Cox, R. A., Crowley, J. N., Hampson, R. F., Hynes, R. G., Jenkin, M. E., Rossi, M. J., and Troe, J.: Evaluated kinetic and photochemical data for atmospheric chemistry: Volume I – gas phase reactions of Ox, HOx, NOx and SOx species, Atmos. Chem. Phys., 4, 1461–1738, https://doi.org/10.5194/acp-4-1461-2004, 2004.
Aubin, D. G., and Abbatt, J. P. D.: Interaction of NO2 with Hydrocarbon Soot: Focus on HONO Yield, Surface Modification, and Mechanism, J. Phys. Chem. A, 111, 6263–6273, https://doi.org/10.1021/jp068884h, 2007.
Bernard, F., Cazaunau, M., Grosselin, B., Zhou, B., Zheng, J., Liang, P., Zhang, Y. J., Ye, X. N., Daële, V., Mu, Y. J., Zhang, R. Y., Chen, J. M., and Mellouki, A.: Measurements of nitrous acid (HONO) in urban area of Shanghai, China, Environ. Sci. Pollut. Res., 23, 5818–5829, https://doi.org/10.1007/s11356-015-5797-4, 2016.
Birmili, W., Stratmann, F., and Wiedensohler, A.: Design of a DMA-based size spectrometer for a large particle size range and stable operation, J. Aerosol Sci., 30, 549–553, https://doi.org/10.1016/S0021-8502(98)00047-0, 1999.
Burkholder, J. B., P. Sander, S., Abbatt, J., Barker, J. R., Huie, R. E., Kolb, C. E., Kurylo, M. J., Orkin, V. L., Wilmouth, D. M., and Wine, P. H.: Chemical Kinetics and Photochemical Data for Use in Atmospheric Studies, Evaluation No. 18, JPL Publication 15-10, J. P. L., Pasadena, 2015.
Dammers, E., Schaap, M., Haaima, M., Palm, M., Kruit, R. J. W., Volten, H., Hensen, A., Swart, D., and Erisman, J. W.: Measuring atmospheric ammonia with remote sensing campaign: Part 1-Characterisation of vertical ammonia concentration profile in the centre of The Netherlands, Atmos. Environ., 169, 97–112, https://doi.org/10.1016/j.atmosenv.2017.08.067, 2017.
Donaldson, M. A., Berke, A. E., and Raff, J. D.: Uptake of Gas Phase Nitrous Acid onto Boundary Layer Soil Surfaces, Environ. Sci. Technol., 48, 375–383, https://doi.org/10.1021/es404156a, 2014.
Febo, A., Perrino, C., and Cortiello, M.: A denuder technique for the measurement of nitrous acid in urban atmospheres, Atmos. Environ., 27, 1721–1728, https://doi.org/10.1016/0960-1686(93)90235-q, 1993.
Finlayson-Pitts, B. J., Wingen, L. M., Sumner, A. L., Syomin, D., and Ramazan, K. A.: The heterogeneous hydrolysis of NO2 in laboratory systems and in outdoor and indoor atmospheres: An integrated mechanism, Phys. Chem. Chem. Phys., 5, 223–242, https://doi.org/10.1039/B208564J, 2003.
Finlayson-Pitts, B. J.: Reactions at surfaces in the atmosphere: integration of experiments and theory as necessary (but not necessarily sufficient) for predicting the physical chemistry of aerosols, Phys. Chem. Chem. Phys., 11, 7760–7779, https://doi.org/10.1039/b906540g, 2009.
Gerecke, A., Thielmann, A., Gutzwiller, L., and Rossi, M. J.: The chemical kinetics of HONO formation resulting from heterogeneous interaction of NO2 with flame soot, Geophys. Res. Lett., 25, 2453–2456, https://doi.org/10.1029/98gl01796, 1998.
Größ, J., Hamed, A., Sonntag, A., Spindler, G., Manninen, H. E., Nieminen, T., Kulmala, M., Hõrrak, U., Plass-Dülmer, C., Wiedensohler, A., and Birmili, W.: Atmospheric new particle formation at the research station Melpitz, Germany: connection with gaseous precursors and meteorological parameters, Atmos. Chem. Phys., 18, 1835–1861, https://doi.org/10.5194/acp-18-1835-2018, 2018.
Gustafsson, R. J., Kyriakou, G., and Lambert, R. M.: The molecular mechanism of tropospheric nitrous acid production on mineral dust surfaces, Chem. Phys. Chem, 9, 1390–1393, https://doi.org/10.1002/cphc.200800259, 2008.
Gutzwiller, L., Arens, F., Baltensperger, U., Gäggeler, H. W., and Ammann, M.: Significance of Semivolatile Diesel Exhaust Organics for Secondary HONO Formation, Environ. Sci. Technol., 36, 677–682, https://doi.org/10.1021/es015673b, 2002.
He, Y., Zhou, X., Hou, J., Gao, H., and Bertman, S. B.: Importance of dew in controlling the air-surface exchange of HONO in rural forested environments, Geophys. Res. Lett., 33, L02813, https://doi.org/10.1029/2005GL024348, 2006.
Heland, J., Kleffmann, J., Kurtenbach, R., and Wiesen, P.: A New Instrument To Measure Gaseous Nitrous Acid (HONO) in the Atmosphere, Environ. Sci. Technol., 35, 3207–3212, https://doi.org/10.1021/es000303t, 2001.
Huang, G., Zhou, X. L., Deng, G. H., Qiao, H. C., and Civerolo, K.: Measurements of atmospheric nitrous acid and nitric acid, Atmos. Environ., 36, 2225–2235, https://doi.org/10.1016/s1352-2310(02)00170-x, 2002.
Huang, R. J., Yang, L., Cao, J. J., Wang, Q. Y., Tie, X. X., Ho, K. F., Shen, Z. X., Zhang, R. J., Li, G. H., Zhu, C. S., Zhang, N. N., Dai, W. T., Zhou, J. M., Liu, S. X., Chen, Y., Chen, J., and O'Dowd, C. D.: Concentration and sources of atmospheric nitrous acid (HONO) at an urban site in Western China, Sci. Total Environ., 593, 165–172, https://doi.org/10.1016/j.scitotenv.2017.02.166, 2017.
Huff, A. K. and Abbatt, J. P. D.: Kinetics and Product Yields in the Heterogeneous Reactions of HOBr with Ice Surfaces Containing NaBr and NaCl, J. Phys. Chem. A, 106, 5279–5287, https://doi.org/10.1021/jp014296m, 2002.
Kalberer, M., Ammann, M., Arens, F., Gäggeler, H. W., and Baltensperger, U.: Heterogeneous formation of nitrous acid (HONO) on soot aerosol particles, J. Geophys. Res.-Atmos., 104, 13825–13832, https://doi.org/10.1029/1999JD900141, 1999.
Kanaya, Y., Cao, R., Akimoto, H., Fukuda, M., Komazaki, Y., Yokouchi, Y., Koike, M., Tanimoto, H., Takegawa, N., and Kondo, Y.: Urban photochemistry in central Tokyo: 1. Observed and modeled OH and HO2 radical concentrations during the winter and summer of 2004, J. Geophys. Res.-Atmos., 112, D21312, https://doi.org/10.1029/2007JD008670, 2007.
Kanda, Y. and Taira, M.: Chemiluminescent method for continuous monitoring of nitrous acid in ambient air, Anal. Chem., 62, 2084–2087, 10.1021/ac00218a007, 1990.
Kleffmann, J., Becker, K. H., and Wiesen, P.: Heterogeneous NO2 conversion processes on acid surfaces: Possible atmospheric implications, Atmos. Environ., 32, 2721–2729, https://doi.org/10.1016/s1352-2310(98)00065-x, 1998.
Kleffmann, J., Gavriloaiei, T., Hofzumahaus, A., Holland, F., Koppmann, R., Rupp, L., Schlosser, E., Siese, M., and Wahner, A.: Daytime formation of nitrous acid: A major source of OH radicals in a forest, Geophys. Res. Lett., 32, L05818, https://doi.org/10.1029/2005GL022524, 2005.
Kleffmann, J., Lörzer, J. C., Wiesen, P., Kern, C., Trick, S., Volkamer, R., Rodenas, M., and Wirtz, K.: Intercomparison of the DOAS and LOPAP techniques for the detection of nitrous acid (HONO), Atmos. Environ., 40, 3640–3652, https://doi.org/10.1016/j.atmosenv.2006.03.027, 2006.
Kleffmann, J. and Wiesen, P.: Technical Note: Quantification of interferences of wet chemical HONO LOPAP measurements under simulated polar conditions, Atmos. Chem. Phys., 8, 6813–6822, https://doi.org/10.5194/acp-8-6813-2008, 2008.
Kurtenbach, R., Becker, K. H., Gomes, J. A. G., Kleffmann, J., Lörzer, J. C., Spittler, M., Wiesen, P., Ackermann, R., Geyer, A., and Platt, U.: Investigations of emissions and heterogeneous formation of HONO in a road traffic tunnel, Atmos. Environ., 35, 3385–3394, https://doi.org/10.1016/s1352-2310(01)00138-8, 2001.
Lahoutifard, N., Ammann, M., Gutzwiller, L., Ervens, B., and George, Ch.: The impact of multiphase reactions of NO2 with aromatics: a modelling approach, Atmos. Chem. Phys., 2, 215–226, https://doi.org/10.5194/acp-2-215-2002, 2002.
Lammel, G. and Cape, J. N.: Nitrous acid and nitrite in the atmosphere, Chem. Soc. Rev., 25, 361–369, https://doi.org/10.1039/CS9962500361, 1996.
Lammel, G. and Perner, D.: The atmospheric aerosol as a source of nitrous acid in the polluted atmosphere, J. Aerosol Sci., 19, 1199–1202, https://doi.org/10.1016/0021-8502(88)90135-8, 1988.
Li, D., Xue, L., Wen, L., Wang, X., Chen, T., Mellouki, A., Chen, J., and Wang, W.: Characteristics and sources of nitrous acid in an urban atmosphere of northern China: Results from 1-yr continuous observations, Atmos. Environ., 182, 296–306, https://doi.org/10.1016/j.atmosenv.2018.03.033, 2018.
Li, G., Lei, W., Zavala, M., Volkamer, R., Dusanter, S., Stevens, P., and Molina, L. T.: Impacts of HONO sources on the photochemistry in Mexico City during the MCMA-2006/MILAGO Campaign, Atmos. Chem. Phys., 10, 6551–6567, https://doi.org/10.5194/acp-10-6551-2010, 2010.
Li, X., Brauers, T., Häseler, R., Bohn, B., Fuchs, H., Hofzumahaus, A., Holland, F., Lou, S., Lu, K. D., Rohrer, F., Hu, M., Zeng, L. M., Zhang, Y. H., Garland, R. M., Su, H., Nowak, A., Wiedensohler, A., Takegawa, N., Shao, M., and Wahner, A.: Exploring the atmospheric chemistry of nitrous acid (HONO) at a rural site in Southern China, Atmos. Chem. Phys., 12, 1497–1513, https://doi.org/10.5194/acp-12-1497-2012, 2012.
Liu, X., Cheng, Y., Zhang, Y., Jung, J., Sugimoto, N., Chang, S.-Y., Kim, Y. J., Fan, S., and Zeng, L.: Influences of relative humidity and particle chemical composition on aerosol scattering properties during the 2006 PRD campaign, Atmos. Environ., 42, 1525–1536, https://doi.org/10.1016/j.atmosenv.2007.10.077, 2008.
Lu, K., Zhang, Y., Su, H., Brauers, T., Chou, C. C., Hofzumahaus, A., Liu, S. C., Kita, K., Kondo, Y., Shao, M., Wahner, A., Wang, J., Wang, X., and Zhu, T.: Oxidant (O3+ NO2) production processes and formation regimes in Beijing, J. Geophys. Res.-Atmos., 115, D07303, https://doi.org/10.1029/2009jd012714, 2010.
Michoud, V., Kukui, A., Camredon, M., Colomb, A., Borbon, A., Miet, K., Aumont, B., Beekmann, M., Durand-Jolibois, R., Perrier, S., Zapf, P., Siour, G., Ait-Helal, W., Locoge, N., Sauvage, S., Afif, C., Gros, V., Furger, M., Ancellet, G., and Doussin, J. F.: Radical budget analysis in a suburban European site during the MEGAPOLI summer field campaign, Atmos. Chem. Phys., 12, 11951–11974, https://doi.org/10.5194/acp-12-11951-2012, 2012.
Monge, M. E., D'Anna, B., Mazri, L., Giroir-Fendler, A., Ammann, M., Donaldson, D. J., and George, C.: Light changes the atmospheric reactivity of soot, P. Natl. Acad. Sci. USA, 107, 6605–6609, https://doi.org/10.1073/pnas.0908341107, 2010.
Pagsberg, P., Bjergbakke, E., Ratajczak, E., and Sillesen, A.: Kinetics of the gas phase reaction OH + NO(+M)HONO(+M) and the determination of the UV absorption cross sections of HONO, Chem. Phys. Lett., 272, 383–390, https://doi.org/10.1016/S0009-2614(97)00576-9, 1997.
Pfeifer, S., Birmili, W., Schladitz, A., Müller, T., Nowak, A., and Wiedensohler, A.: A fast and easy-to-implement inversion algorithm for mobility particle size spectrometers considering particle number size distribution information outside of the detection range, Atmos. Meas. Tech., 7, 95–105, https://doi.org/10.5194/amt-7-95-2014, 2014.
Platt, U., Perner, D., Harris, G. W., Winer, A. M., and Pitts, J. N.: Observations of nitrous acid in an urban atmosphere by differential optical absorption, Nature, 285, 312–314, https://doi.org/10.1038/285312a0, 1980.
Romer, P. S., Wooldridge, P. J., Crounse, J. D., Kim, M. J., Wennberg, P. O., Dibb, J. E., Scheuer, E., Blake, D. R., Meinardi, S., Brosius, A. L., Thames, A. B., Miller, D. O., Brune, W. H., Hall, S. R., Ryerson, T. B., and Cohen, R. C.: Constraints on Aerosol Nitrate Photolysis as a Potential Source of HONO and NOx, Environ. Sci. Technol., 52, 13738–13746, https://doi.org/10.1021/acs.est.8b03861, 2018.
Rubio, M. A., Lissi, E., Villena, G., Elshorbany, Y. F., Kleffmann, J., Kurtenbach, R., and Wiesen, P.: Simultaneous measurements of formaldehyde and nitrous acid in dews and gas phase in the atmosphere of Santiago, Chile, Atmos. Environ., 43, 6106–6109, https://doi.org/10.1016/j.atmosenv.2009.09.017, 2009.
Sarwar, G., Roselle, S. J., Mathur, R., Appel, W., Dennis, R. L., and Vogel, B.: A comparison of CMAQ HONO predictions with observations from the Northeast Oxidant and Particle Study, Atmos. Environ., 42, 5760–5770, https://doi.org/10.1016/j.atmosenv.2007.12.065, 2008.
Schiller, C. L., Locquiao, S., Johnson, T. J., and Harris, G. W.: Atmospheric measurements of HONO by tunable diode laser absorption spectroscopy, J. Atmos. Chem., 40, 275–293, https://doi.org/10.1023/a:1012264601306, 2001.
Seiler, W., Becker, K.-H., and Schaller, E.: Tropospheric Chemistry: Results of the German Tropospheric Chemistry Programme, Springer, the Netherlands, 2012.
Sörgel, M., Regelin, E., Bozem, H., Diesch, J.-M., Drewnick, F., Fischer, H., Harder, H., Held, A., Hosaynali-Beygi, Z., Martinez, M., and Zetzsch, C.: Quantification of the unknown HONO daytime source and its relation to NO2, Atmos. Chem. Phys., 11, 10433–10447, https://doi.org/10.5194/acp-11-10433-2011, 2011.
Spindler, G., Hesper, J., Brüggemann, E., Dubois, R., Müller, T., and Herrmann, H.: Wet annular denuder measurements of nitrous acid: laboratory study of the artefact reaction of NO2 with S(IV) in aqueous solution and comparison with field measurements, Atmos. Environ., 37, 2643–2662, https://doi.org/10.1016/s1352-2310(03)00209-7, 2003.
Spindler, G., Müller, T., Brüggemann, E., Gnauk, T., and Herrmann, H.: Long-term size-segregated characterization of PM10, PM2.5, and PM1 at the IfT research station Melpitz downwind of Leipzig (Germany) using high and low-volume filter samplers, Atmos. Environ., 38, 5333–5347, https://doi.org/10.1016/j.atmosenv.2003.12.047, 2004.
Stemmler, K., Ammann, M., Donders, C., Kleffmann, J., and George, C.: Photosensitized reduction of nitrogen dioxide on humic acid as a source of nitrous acid, Nature, 440, 195, https://doi.org/10.1038/nature04603, 2006.
Stieger, B., Spindler, G., Fahlbusch, B., Müller, K., Grüner, A., Poulain, L., Thöni, L., Seitler, E., Wallasch, M., and Herrmann, H.: Measurements of PM10 ions and trace gases with the online system MARGA at the research station Melpitz in Germany – A five-year study, J. Atmos. Chem., 75, 33–70, https://doi.org/10.1007/s10874-017-9361-0, 2018.
Su, H., Cheng, Y. F., Shao, M., Gao, D. F., Yu, Z. Y., Zeng, L. M., Slanina, J., Zhang, Y. H., and Wiedensohler, A.: Nitrous acid (HONO) and its daytime sources at a rural site during the 2004 PRIDE-PRD experiment in China, J. Geophys. Res.-Atmos., 113, D14312, https://doi.org/10.1029/2007JD009060, 2008.
Su, H., Cheng, Y. F., Oswald, R., Behrendt, T., Trebs, I., Meixner, F. X., Andreae, M. O., Cheng, P., Zhang, Y., and Poschl, U.: Soil Nitrite as a Source of Atmospheric HONO and OH Radicals, Science, 333, 1616–1618, https://doi.org/10.1126/science.1207687, 2011.
Tuch, T. M., Haudek, A., Müller, T., Nowak, A., Wex, H., and Wiedensohler, A.: Design and performance of an automatic regenerating adsorption aerosol dryer for continuous operation at monitoring sites, Atmos. Meas. Tech., 2, 417–422, https://doi.org/10.5194/amt-2-417-2009, 2009.
VandenBoer, T. C., Brown, S. S., Murphy, J. G., Keene, W. C., Young, C. J., Pszenny, A. A. P., Kim, S., Warneke, C., de Gouw, J. A., Maben, J. R., Wagner, N. L., Riedel, T. P., Thornton, J. A., Wolfe, D. E., Dubé, W. P., Öztürk, F., Brock, C. A., Grossberg, N., Lefer, B., Lerner, B., Middlebrook, A. M., and Roberts, J. M.: Understanding the role of the ground surface in HONO vertical structure: High resolution vertical profiles during NACHTT-11, J. Geophys. Res.-Atmos., 118, 10155–10171, https://doi.org/10.1002/jgrd.50721, 2013.
VandenBoer, T. C., Markovic, M. Z., Sanders, J. E., Ren, X., Pusede, S. E., Browne, E. C., Cohen, R. C., Zhang, L., Thomas, J., Brune, W. H., and Murphy, J. G.: Evidence for a nitrous acid (HONO) reservoir at the ground surface in Bakersfield, CA, during CalNex 2010, J. Geophys. Res.-Atmos., 119, 9093–9106, https://doi.org/10.1002/2013jd020971, 2014.
VandenBoer, T. C., Young, C. J., Talukdar, R. K., Markovic, M. Z., Brown, S. S., Roberts, J. M., and Murphy, J. G.: Nocturnal loss and daytime source of nitrous acid through reactive uptake and displacement, Nat. Geosci., 8, 55–60, https://doi.org/10.1038/ngeo2298, 2015.
Villena, G., Wiesen, P., Cantrell, C. A., Flocke, F., Fried, A., Hall, S. R., Hornbrook, R. S., Knapp, D., Kosciuch, E., Mauldin III, R. L., McGrath, J. A., Montzka, D., Richter, D., Ullmann, K., Walega, J., Weibring, P., Weinheimer, A., Staebler, R. M., Liao, J., Huey, L. G., and Kleffmann, J.: Nitrous acid (HONO) during polar spring in Barrow, Alaska: A net source of OH radicals?, J. Geophys. Res.-Atmos., 116, D00R07, https://doi.org/10.1029/2011jd016643, 2011.
Volten, H., Bergwerff, J. B., Haaima, M., Lolkema, D. E., Berkhout, A. J. C., van der Hoff, G. R., Potma, C. J. M., Wichink Kruit, R. J., van Pul, W. A. J., and Swart, D. P. J.: Two instruments based on differential optical absorption spectroscopy (DOAS) to measure accurate ammonia concentrations in the atmosphere, Atmos. Meas. Tech., 5, 413–427, https://doi.org/10.5194/amt-5-413-2012, 2012.
Wang, J., Zhang, X., Guo, J., Wang, Z., and Zhang, M.: Observation of nitrous acid (HONO) in Beijing, China: Seasonal variation, nocturnal formation and daytime budget, Sci. Total Environ., 587, 350–359, https://doi.org/10.1016/j.scitotenv.2017.02.159, 2017.
Wang, L. M. and Zhang, J. S.: Detection of nitrous acid by cavity ring down spectroscopy, Environ. Sci. Technol., 34, 4221–4227, https://doi.org/10.1021/es0011055, 2000.
Wentworth, G. R., Murphy, J. G., Benedict, K. B., Bangs, E. J., and Collett Jr., J. L.: The role of dew as a night-time reservoir and morning source for atmospheric ammonia, Atmos. Chem. Phys., 16, 7435–7449, https://doi.org/10.5194/acp-16-7435-2016, 2016.
Wiedensohler, A.: An approximation of the bipolar charge distribution for particles in the submicron size range, J. Aerosol Sci., 19, 387–389, https://doi.org/10.1016/0021-8502(88)90278-9, 1988.
Wiedensohler, A., Birmili, W., Nowak, A., Sonntag, A., Weinhold, K., Merkel, M., Wehner, B., Tuch, T., Pfeifer, S., Fiebig, M., Fjäraa, A. M., Asmi, E., Sellegri, K., Depuy, R., Venzac, H., Villani, P., Laj, P., Aalto, P., Ogren, J. A., Swietlicki, E., Williams, P., Roldin, P., Quincey, P., Hüglin, C., Fierz-Schmidhauser, R., Gysel, M., Weingartner, E., Riccobono, F., Santos, S., Grüning, C., Faloon, K., Beddows, D., Harrison, R., Monahan, C., Jennings, S. G., O'Dowd, C. D., Marinoni, A., Horn, H.-G., Keck, L., Jiang, J., Scheckman, J., McMurry, P. H., Deng, Z., Zhao, C. S., Moerman, M., Henzing, B., de Leeuw, G., Löschau, G., and Bastian, S.: Mobility particle size spectrometers: harmonization of technical standards and data structure to facilitate high quality long-term observations of atmospheric particle number size distributions, Atmos. Meas. Tech., 5, 657–685, https://doi.org/10.5194/amt-5-657-2012, 2012.
Wiedensohler, A., Wiesner, A., Weinhold, K., Birmili, W., Hermann, M., Merkel, M., Müller, T., Pfeifer, S., Schmidt, A., Tuch, T., Velarde, F., Quincey, P., Seeger, S., and Nowak, A.: Mobility particle size spectrometers: Calibration procedures and measurement uncertainties, Aerosol Sci. Technol., 52, 146–164, https://doi.org/10.1080/02786826.2017.1387229, 2018.
Wohlfahrt, G., Sapinsky, S., Tappeiner, U., and Cernusca, A.: Estimation of plant area index of grasslands from measurements of canopy radiation profiles, Agric. For. Meteorol., 109, 1–12, https://doi.org/10.1016/S0168-1923(01)00259-3, 2001.
Wong, K. W., Oh, H.-J., Lefer, B. L., Rappenglück, B., and Stutz, J.: Vertical profiles of nitrous acid in the nocturnal urban atmosphere of Houston, TX, Atmos. Chem. Phys., 11, 3595–3609, https://doi.org/10.5194/acp-11-3595-2011, 2011.
Xu, Z., Liu, Y., Nie, W., Sun, P., Chi, X., and Ding, A.: Evaluating the measurement interference of wet rotating-denuder–ion chromatography in measuring atmospheric HONO in a highly polluted area, Atmos. Meas. Tech., 12, 6737–6748, https://doi.org/10.5194/amt-12-6737-2019, 2019.
Ye, C., Gao, H., Zhang, N., and Zhou, X.: Photolysis of Nitric Acid and Nitrate on Natural and Artificial Surfaces, Environ. Sci. Technol., 50, 3530–3536, https://doi.org/10.1021/acs.est.5b05032, 2016.
Yu, Y., Galle, B., Panday, A., Hodson, E., Prinn, R., and Wang, S.: Observations of high rates of NO2-HONO conversion in the nocturnal atmospheric boundary layer in Kathmandu, Nepal, Atmos. Chem. Phys., 9, 6401–6415, https://doi.org/10.5194/acp-9-6401-2009, 2009.
Zhang, B. and Tao, F.-M.: Direct homogeneous nucleation of NO2, H2O, and NH3 for the production of ammonium nitrate particles and HONO gas, Chem. Phys. Lett., 489, 143–147, https://doi.org/10.1016/j.cplett.2010.02.059, 2010.
Zhang, L., Wang, T., Zhang, Q., Zheng, J., Xu, Z., and Lv, M.: Potential sources of nitrous acid (HONO) and their impacts on ozone: A WRF-Chem study in a polluted subtropical region, J. Geophys. Res.-Atmos., 121, 3645–3662, https://doi.org/10.1002/2015JD024468, 2016.
Zhou, X., Gao, H., He, Y., Huang, G., Bertman, S. B., Civerolo, K., and Schwab, J.: Nitric acid photolysis on surfaces in low-NOx environments: Significant atmospheric implications, Geophys. Res. Lett., 30, 12-1–12-4, https://doi.org/10.1029/2003gl018620, 2003.
Zhou, X., Huang, G., Civerolo, K., Roychowdhury, U., and Demerjian, K. L.: Summertime observations of HONO, HCHO, and O3 at the summit of Whiteface Mountain, New York, J. Geophys. Res.-Atmos., 112, D08311, https://doi.org/10.1029/2006JD007256, 2007.
Zhou, X., Zhang, N., TerAvest, M., Tang, D., Hou, J., Bertman, S., Alaghmand, M., Shepson, P. B., Carroll, M. A., Griffith, S., Dusanter, S., and Stevens, P. S.: Nitric acid photolysis on forest canopy surface as a source for tropospheric nitrous acid, Nat. Geosci., 4, 440–443, https://doi.org/10.1038/ngeo1164, 2011.