the Creative Commons Attribution 4.0 License.
the Creative Commons Attribution 4.0 License.
 | 05 Nov 2020
A test of the ability of current bulk optical models to represent the radiative properties of cirrus cloud across the mid- and far-infrared
Richard J. Bantges
Helen E. Brindley
Jonathan E. Murray
Alan E. Last
Jacqueline E. Russell
Cathryn Fox
Stuart Fox
Chawn Harlow
Sebastian J. O'Shea
Keith N. Bower
Bryan A. Baum
Ping Yang
Hilke Oetjen
Juliet C. Pickering
Measurements of mid- to far-infrared nadir radiances obtained from the UK Facility for Airborne Atmospheric Measurements (FAAM) BAe 146 aircraft during the Cirrus Coupled Cloud-Radiation Experiment (CIRCCREX) are used to assess the performance of various ice cloud bulk optical property models. Through use of a minimization approach, we find that the simulations can reproduce the observed spectra in the mid-infrared to within measurement uncertainty, but they are unable to simultaneously match the observations over the far-infrared frequency range. When both mid- and far-infrared observations are used to minimize residuals, first-order estimates of the spectral flux differences between the best-performing simulations and observations indicate a compensation effect between the mid- and far-infrared such that the absolute broadband difference is < 0.7 W m−2. However, simply matching the spectra using the mid-infrared (far-infrared) observations in isolation leads to substantially larger discrepancies, with absolute differences reaching ∼ 1.8 (3.1) W m−2. These results show that simulations using these microphysical models may give a broadly correct integrated longwave radiative impact but that this masks spectral errors, with implicit consequences for the vertical distribution of atmospheric heating. They also imply that retrievals using these models applied to mid-infrared radiances in isolation will select cirrus optical properties that are inconsistent with far-infrared radiances. As such, the results highlight the potential benefit of more extensive far-infrared observations for the assessment and, where necessary, the improvement of current ice bulk optical models.
- Article
(6404 KB) - Full-text XML
- BibTeX
- EndNote


The role of ice clouds (e.g. cirrus) in determining the radiative balance of the Earth and its atmosphere is particularly complex and uncertain (e.g. Baran et al., 2014b; Yang et al., 2015). Recent calculations based on ice cloud properties retrieved from active satellite instruments suggest that ice clouds have a net warming effect on the global climate, with enhanced trapping of outgoing infrared radiation, particularly from cirrus anvils, exceeding the enhanced reflection of incoming solar radiation (Hong et al., 2016). More generally, the net radiative effect of all types of ice cloud, including cirrus, is critically dependent upon its optical thickness, which itself is linked to the cloud microphysical properties. Other important characteristics include the vertical position and extent as well as the geographical location of the cloud (e.g. Heymsfield et al., 2013; Hong and Liu, 2015). Key microphysical parameters include the ice particle habit, the particle size distribution (PSD) and the morphology, such as aggregation, roughness and concavity (Zhang et al., 1999; Baran, 2012; Yang et al., 2012; Baum et al., 2014). However, these parameters vary both temporally and spatially, and they are dependent on the changes in the temperature, humidity and meteorological environment that the cloud experiences (Yang et al., 2012; Baran et al., 2015; Voigt et al., 2017).
To accurately predict the radiative effect of cirrus in global climate and numerical weather prediction models, the interaction of radiation with the ice particles that make up the cloud must be known. This relationship is reliant on knowledge of cirrus optical properties which are currently poorly constrained (Baran, 2012). Nevertheless, several cirrus bulk optical (single-scattering) property models have been developed using in situ observations and databases of ice single-scattering properties (SSPs), which aim to include realistic physical representations of ice particles, including habit, aggregation and roughness (Yang et al., 2008, 2012; Baran et al., 2014a, b; Baum et al., 2014).
A key test for these cirrus models is whether, when constrained by suitable in situ observations, they are able to replicate simultaneous radiance observations across the electromagnetic spectrum. Previous assessments of model consistency with observations in the solar and mid-infrared (MIR; typically defined as wave numbers from ∼ 600 to 2500 cm−1), such as Baran and Francis (2004), Baum et al. (2014), Platnick et al. (2017), Loeb et al. (2018) and Yang et al. (2018), have shown reasonable agreement; however, very few studies have been performed in the far-infrared (FIR; defined here as wave numbers from ∼ 100 to < 600 cm−1). It is particularly important to validate cirrus models in the FIR, as this region not only contributes approximately 50 % of the outgoing longwave radiation in the global mean (Harries et al., 2008), but theoretical studies have also indicated that the radiation is highly sensitive to the ice particle optical properties in this region (e.g. Maestri and Rizzi, 2003; Baran, 2005, 2007). In particular, Edwards and Slingo (1996) and Kuo et al. (2017) have shown that scattering by cirrus clouds in the far-infrared regime contributes substantially to longwave radiation observed at the top of the atmosphere (TOA). The effect of neglecting longwave scattering is comparable to the effect associated with doubling CO2. Moreover, it has been demonstrated that the addition of a few narrowband FIR channels to the MIR channels typically used in satellite retrieval algorithms could significantly improve our ability to retrieve ice cloud radiative properties (Libois and Blanchet, 2017).
However, compared with the well-studied MIR, global observations specifically measuring across the FIR are unavailable. There are some narrowband and spectrally resolved measurements available from focused field campaigns. Maestri et al. (2014) analysed downwelling FIR spectral radiances in the presence of cirrus as recorded by the REFIR-PAD (Radiation Explorer in the Far InfraRed – Prototype for Applications and Development) instrument (Bianchini and Palchetti, 2008) at the ground-based Testa Grigia station (Italy), 3500 m above sea level, during the Earth COoling by WAter vapouR emission (ECOWAR) campaign. Retrieved cloud properties from the MIR were used to simulate radiances in the region from 250 to 1100 cm−1. Unsurprisingly, these showed excellent agreement with the observations in the MIR window from 820 to 960 cm−1 but large residuals were apparent in the FIR from 330 to 600 cm−1. More recent work by Palchetti et al. (2016) and di Natale et al. (2017) has suggested that simulated and observed downwelling radiances at the surface can be reconciled within uncertainties across much of the FIR and MIR range if temperature, water vapour and cirrus properties are simultaneously retrieved from the observations. Maestri et al. (2019) reported the first tentative retrievals of ice particle habit from downwelling FIR spectra obtained by REFIR-PAD over Antarctica in 2013, although they noted that large residuals in their retrievals did not permit clear identification of ice particle habit in most cases.
Maestri et al. (2014) also discussed the advantages of a “view-from-above” (satellite or aircraft) experimental configuration for the study of FIR cirrus optical properties. A further benefit of aircraft campaigns for performing model validation exercises is that, in principle, the radiative signature of the clouds can be recorded closely in time with in situ measurements of the cloud microphysics, allowing them to be linked directly (Baran and Francis, 2004; Maestri, 2005). However, to the best of our knowledge, the only published study based on simultaneous aircraft observations of MIR and FIR radiances in the presence of cirrus is that of Cox et al. (2010). This study concluded that simulations were not able to consistently reproduce observed spectral radiances across the infrared and were particularly poor in the FIR region from 330 to 600 cm−1, where the analysis was hampered by the presence of large uncertainties in the atmospheric state and a lack of instrumentation capable of measuring small ice particles (diameter < 20 µm).
Here, we make use of upwelling radiances recorded above cirrus across both the FIR and MIR spectral regions simultaneously during the Cirrus Coupled Cloud-Radiation Experiment (CIRCCREX), a flight campaign using the Facility for Airborne Atmospheric Measurements (FAAM) British Aerospace (BAe) 146 aircraft based out of Prestwick, Scotland. We focus on flight B895 which took place over the North Sea to the north-east of Scotland on 13 March 2015, and we test, for the first time, the ability of the bulk optical models for cirrus developed by Yang et al. (2013) and Baum et al. (2014) to reproduce radiance observations across the infrared, including the FIR. Although these by no means represent the only resource for simulating cirrus radiative effects (e.g. Baran et al., 2014b; van Diedenhoven and Cairns, 2020), they are widely used by the remote sensing community and therefore warrant investigation. The paper is organized as follows: Sect. 2 provides a summary of the flight and the measurements obtained, along with details of how suitable case studies were identified. Section 3 describes the methodology applied to simulate the observed FIR and MIR spectra and the performance criteria for assessing the “best” matches between observations and simulations. The results are presented in Sect. 4, and conclusions from the study are drawn in Sect. 5.
2.1 Flight B895 overview
FAAM flight B895 left Prestwick in the UK on 13 March 2015 and overflew a decaying band of cirrus cloud associated with an occluded front. The main objective of the flight was to characterize both the cirrus cloud microphysics and their associated IR radiative signatures. To achieve this aim, the aircraft performed a series of straight and level runs (SLRs) above the cloud followed by a descent into the cloud deck where a further series of SLRs were performed at varying levels within the cloud. Figure 1a and b show the flight track and altitude of the aircraft as a function of time respectively.
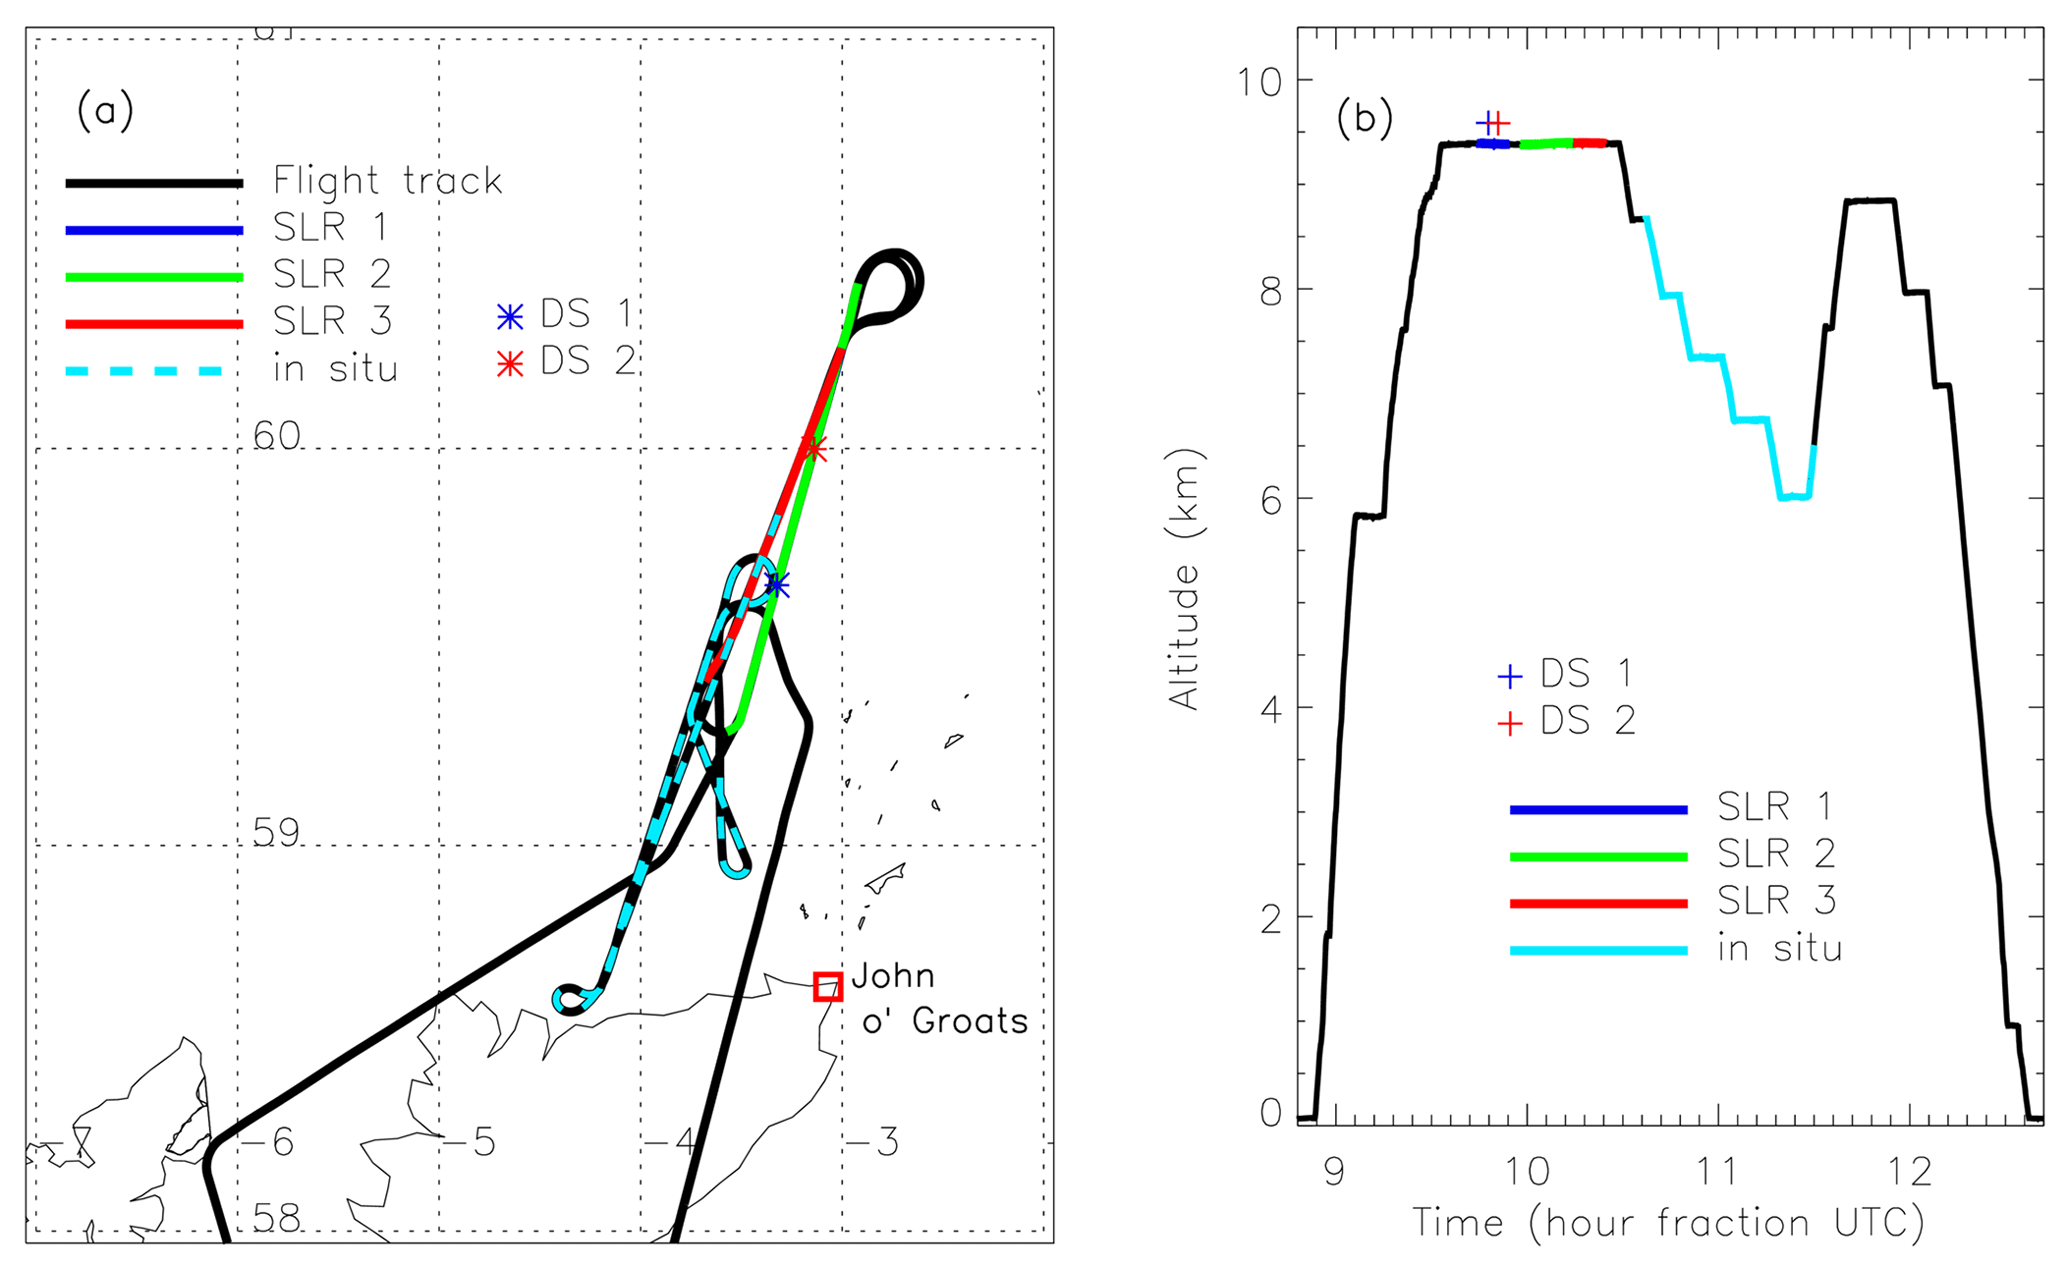
Figure 1(a) Flight track for FAAM flight B895 (shown in black). The three SLRs are shown in colour; note that SLR-1 lies directly beneath SLR-2 and is, therefore, not visible. The deployment of dropsondes (DS) 1 and 2 are indicated along with the period following SLR 3 when in situ sampling of the cloud layer was performed. (b) Aircraft altitude as a function of time, with the three SLRs and in situ measurement phases shown as well as the DS 1 and 2 deployment times.
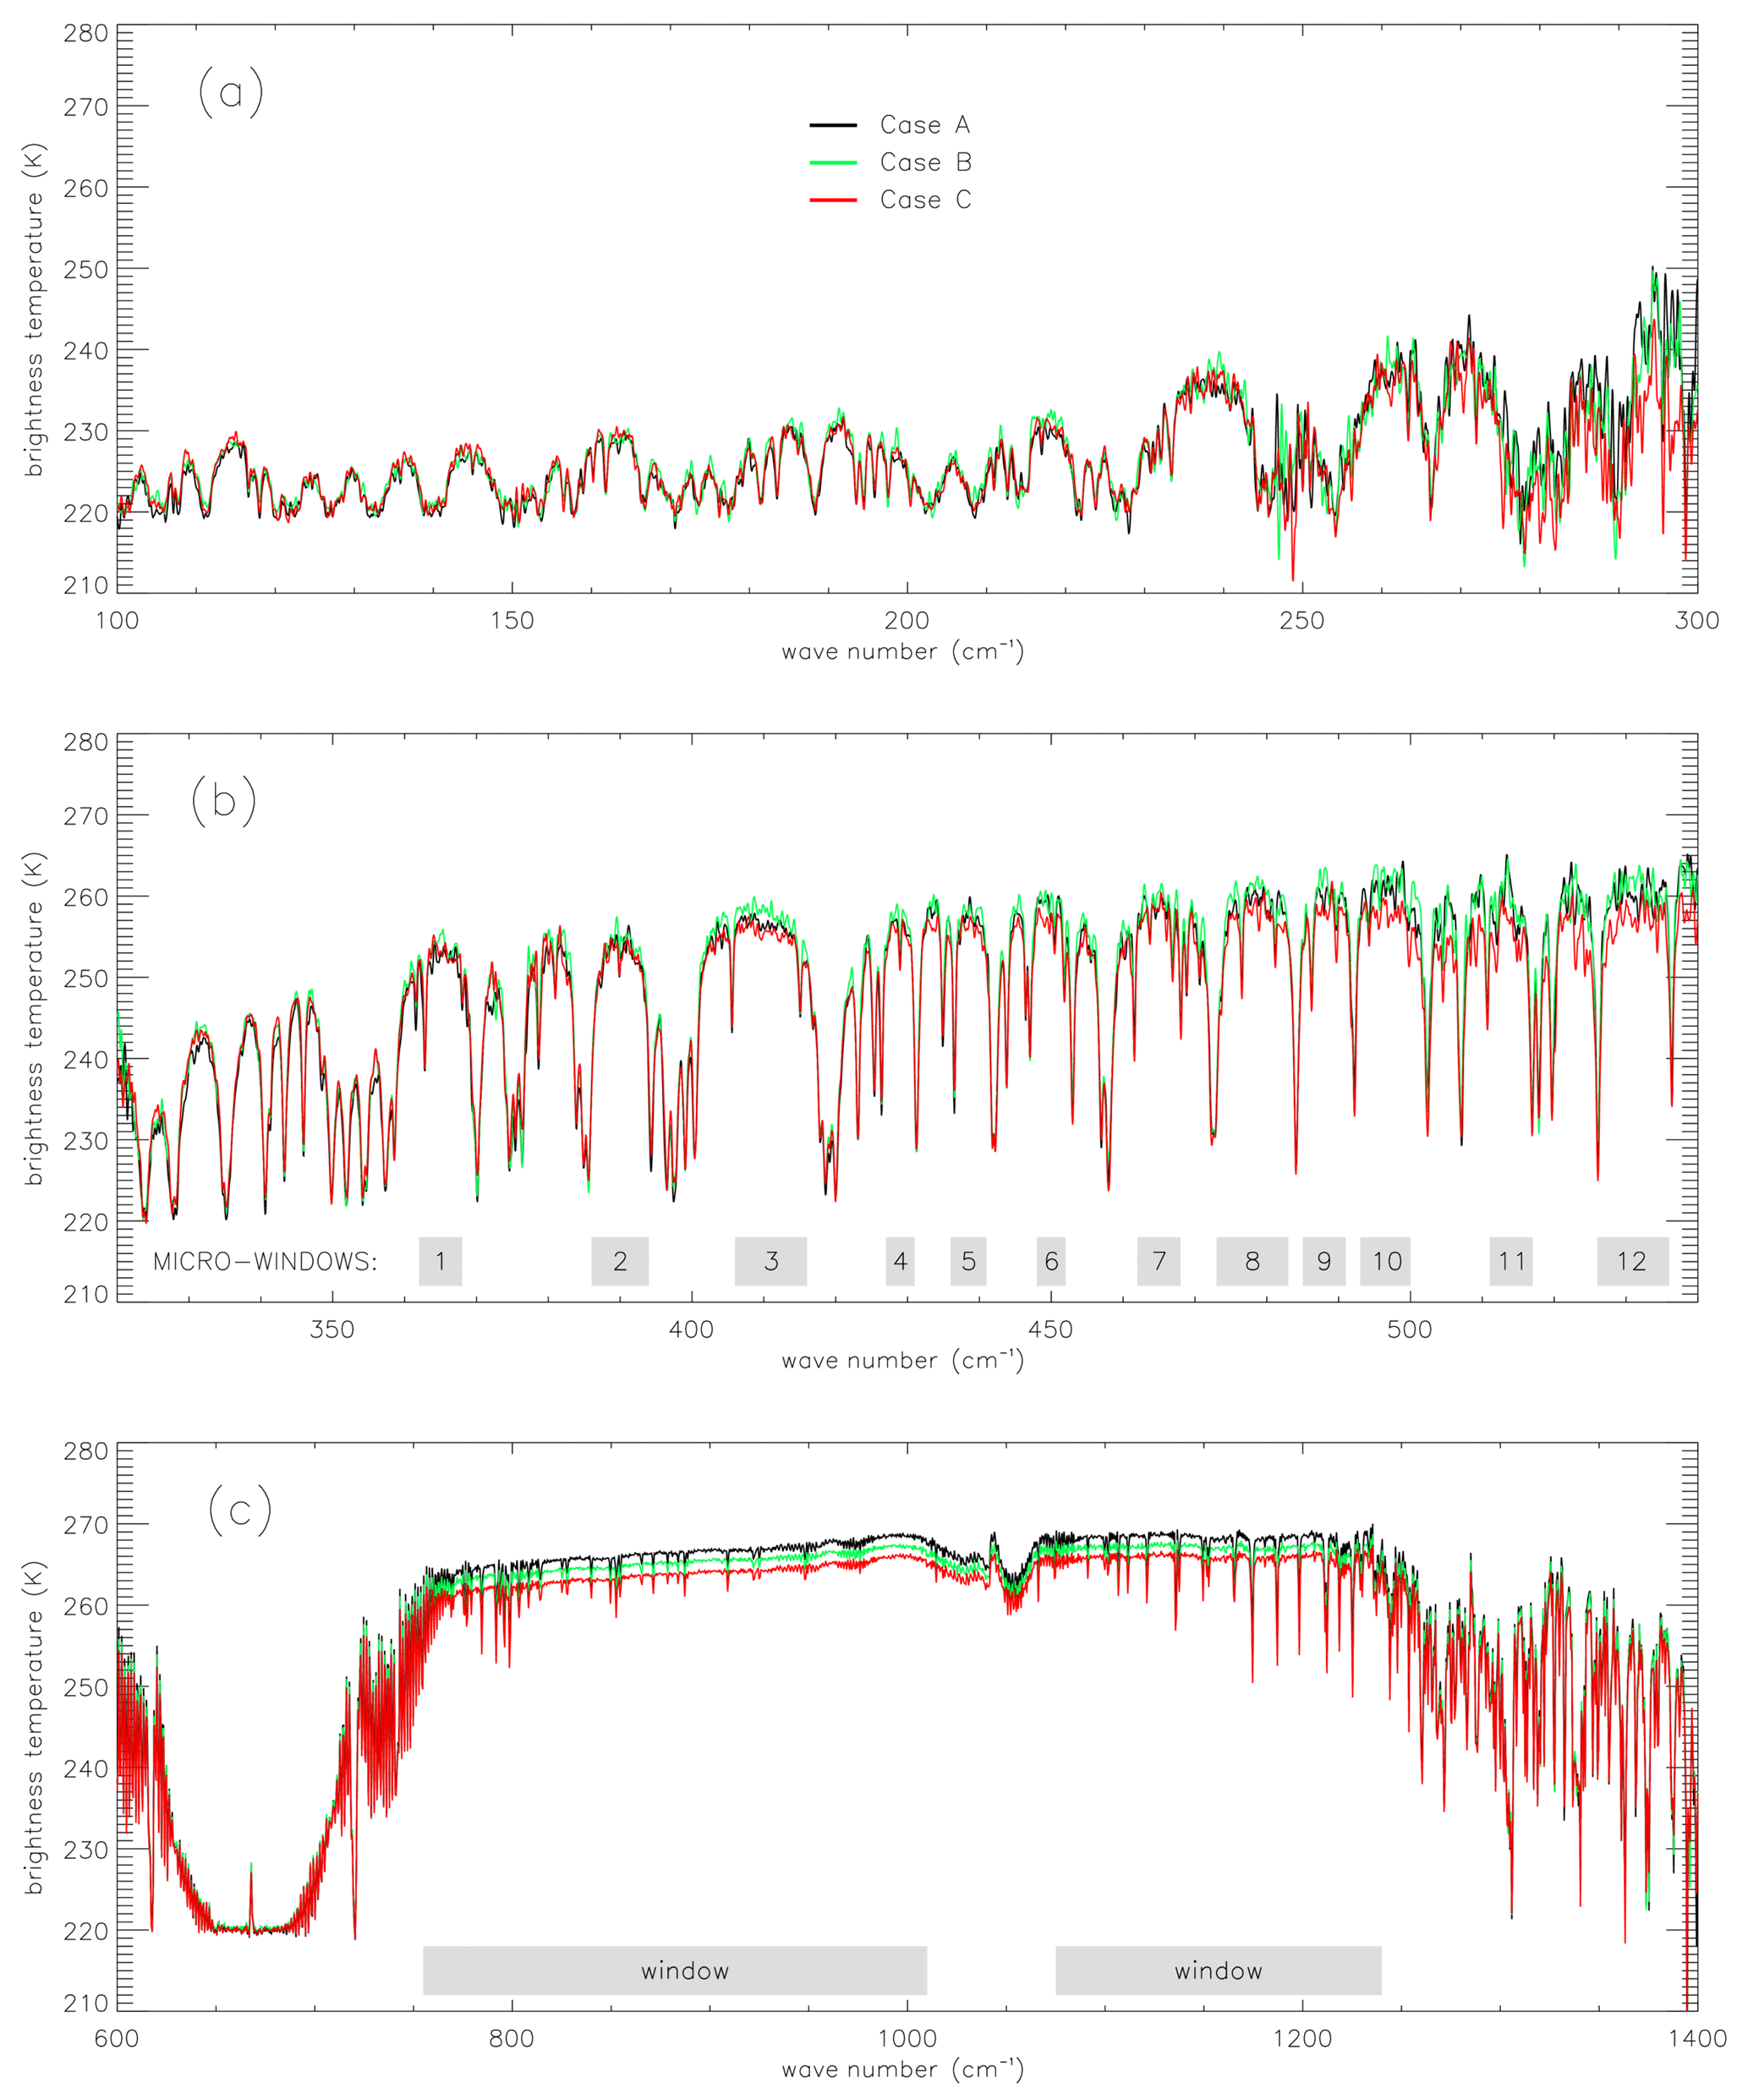
Figure 2Brightness temperature spectra for the cases A–C. (a) Individual TAFTS LW channel spectra. (b) Individual TAFTS SW channel spectra. (c) For each case, the mean of eight ARIES individual radiance spectra, converted to equivalent brightness temperature spectra, is shown. Also shown are (b) a selection of atmospheric micro-window regions and (c) the two main window regions.
2.2 Instrumentation and measurements
The FAAM aircraft was fitted with a “cloud-radiation” suite of instruments that included radiation sensors, cloud microphysical probes and a lidar. The radiation instruments included two Fourier transform spectrometers: the Tropospheric Airborne Fourier Transform Spectrometer (TAFTS, Canas et al., 1997) with nominal spectral coverage from 80 to 600 cm−1 (two channels: LW from 80 to 300 cm−1 and SW from 320 to 600 cm−1) operating at 0.12 cm−1 resolution, and the Airborne Research Interferometer Evaluation System (ARIES, Wilson et al., 1999) with nominal spectral coverage from 550 to 3000 cm−1 (two channels: LW from 550 to 1800 cm−1 and SW from 1700 to 3000 cm−1) at a 1 cm−1 resolution. The cloud microphysics (PSD and habit) were measured using a series of probes that included a 2-DS, a 3-View Cloud Particle Imager (3V-CPI), a CIP 100 and a holographic cloud probe (HALOHolo; Lawson et al., 2006; O'Shea et al., 2016). The lidar installed on the aircraft was a Leosphere ALS450 355 nm elastic backscatter lidar (Marenco, 2010) which provided cloud vertical extent information and ice volume extinction profiles at 355 nm from the range-corrected backscatter profiles following the two-stage process of Marenco et al. (2011). Vertical profiles of the particle extinction coefficient were estimated (Fox et al., 2019) from which the cloud optical depth at 355 nm, (τ355), was derived. Finally, along with the standard aircraft positioning, temperature and humidity sensors, the aircraft was also equipped with the Airborne Vertical Atmospheric Profiling System (AVAPS) which launched RD94 dropsondes (Vaisala, 2010) at various stages of the flight to enable characterization of the atmospheric column below the aircraft.
2.3 Identification of suitable case studies
The driving factor in selecting periods for analysis was the availability of near-simultaneous TAFTS and ARIES nadir radiance spectra from SLRs above the cloud. Ideally, the simulation of radiance spectra equivalent to those observed at the aircraft level above the cirrus cloud requires knowledge of the cloud microphysical and optical properties, its vertical location and the atmospheric profile from the surface to the aircraft. Hence, the additional selection criteria were that cirrus could be clearly identified and characterized by the lidar observations and that the atmospheric state below the aircraft was well characterized by dropsonde measurements. The final requirement was that the atmosphere above the aircraft was cloud-free in order to ensure that any downwelling radiation from above the aircraft, reflected by the cloud beneath, could be ignored.
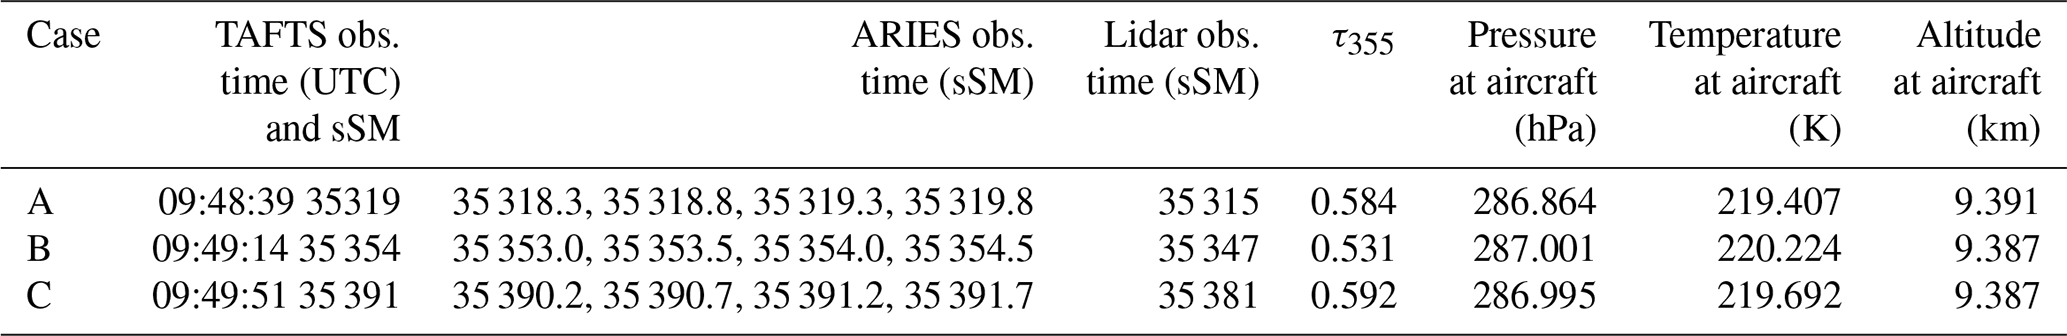
Preliminary examination of the available data from the three above-cloud SLRs suggested that there were two periods which satisfied these requirements: one during SLR 1 from 09:48:39 to 09:49:51 UTC and another during SLR 3 from 10:16:22 to 10:17:24 UTC. Unfortunately, ARIES data from the period identified in SLR 3 were found to have deficiencies (Stuart Fox, personal communication, 2019) and were consequently considered to be of insufficient quality for the purpose of this study. Thus, only those data from the period during SLR 1 were considered for further investigation. Three sets of radiance observations were identified from within SLR 1, and the times of these observations along with a summary of the conditions at the aircraft are given in Table 1.
For each of the three cases identified, only a single TAFTS spectrum was available; however, owing to the relatively high temporal sampling frequency of the ARIES instrument, eight ARIES spectra are available within ± 1 s of the TAFTS acquisition time. To provide an indication of the scene variability within the 2 s period around the TAFTS measurement, the mean and the associated standard deviation are calculated for the eight ARIES radiance spectra. The mean ARIES and the associated TAFTS spectra are then converted into equivalent brightness temperature spectra. These are shown for all three cases in Fig. 2. In the MIR, signatures of cirrus are most apparent in the main atmospheric window (∼ 760–1000 and 1080–1250 cm−1) as indicated in Fig. 2c. At FIR frequencies, the atmosphere is less transparent because water vapour absorption fills in many spectral lines, but there are a series of semi-transparent, so-called “micro-windows”, as shown in Fig. 2b, that clearly show the variation in the cirrus properties. For the lowest frequencies in the FIR, the atmosphere is comparatively opaque and generally has a much lower sensitivity (less than 1 K) to the cirrus with the exception of a few wave number regions (e.g. ∼ 110, 218 to 221, 240 cm−1, etc.). It is interesting to note that there is a variation in the order of the three cases between the different spectral regions. For example, the maximum brightness temperature is observed at around 110 cm−1 for case C followed by B and then A; case B shows the highest values in micro-window 3 (around 410 cm−1) followed by A and then C; and the largest values are for case A in the MIR window regions, followed by B and then C. The variation in the relative order of the individual cases indicates a frequency-dependent sensitivity of the cloud's radiative signature to the cirrus properties. This sensitivity to the ice particle size and habit is discussed further in Sect. 4.2.
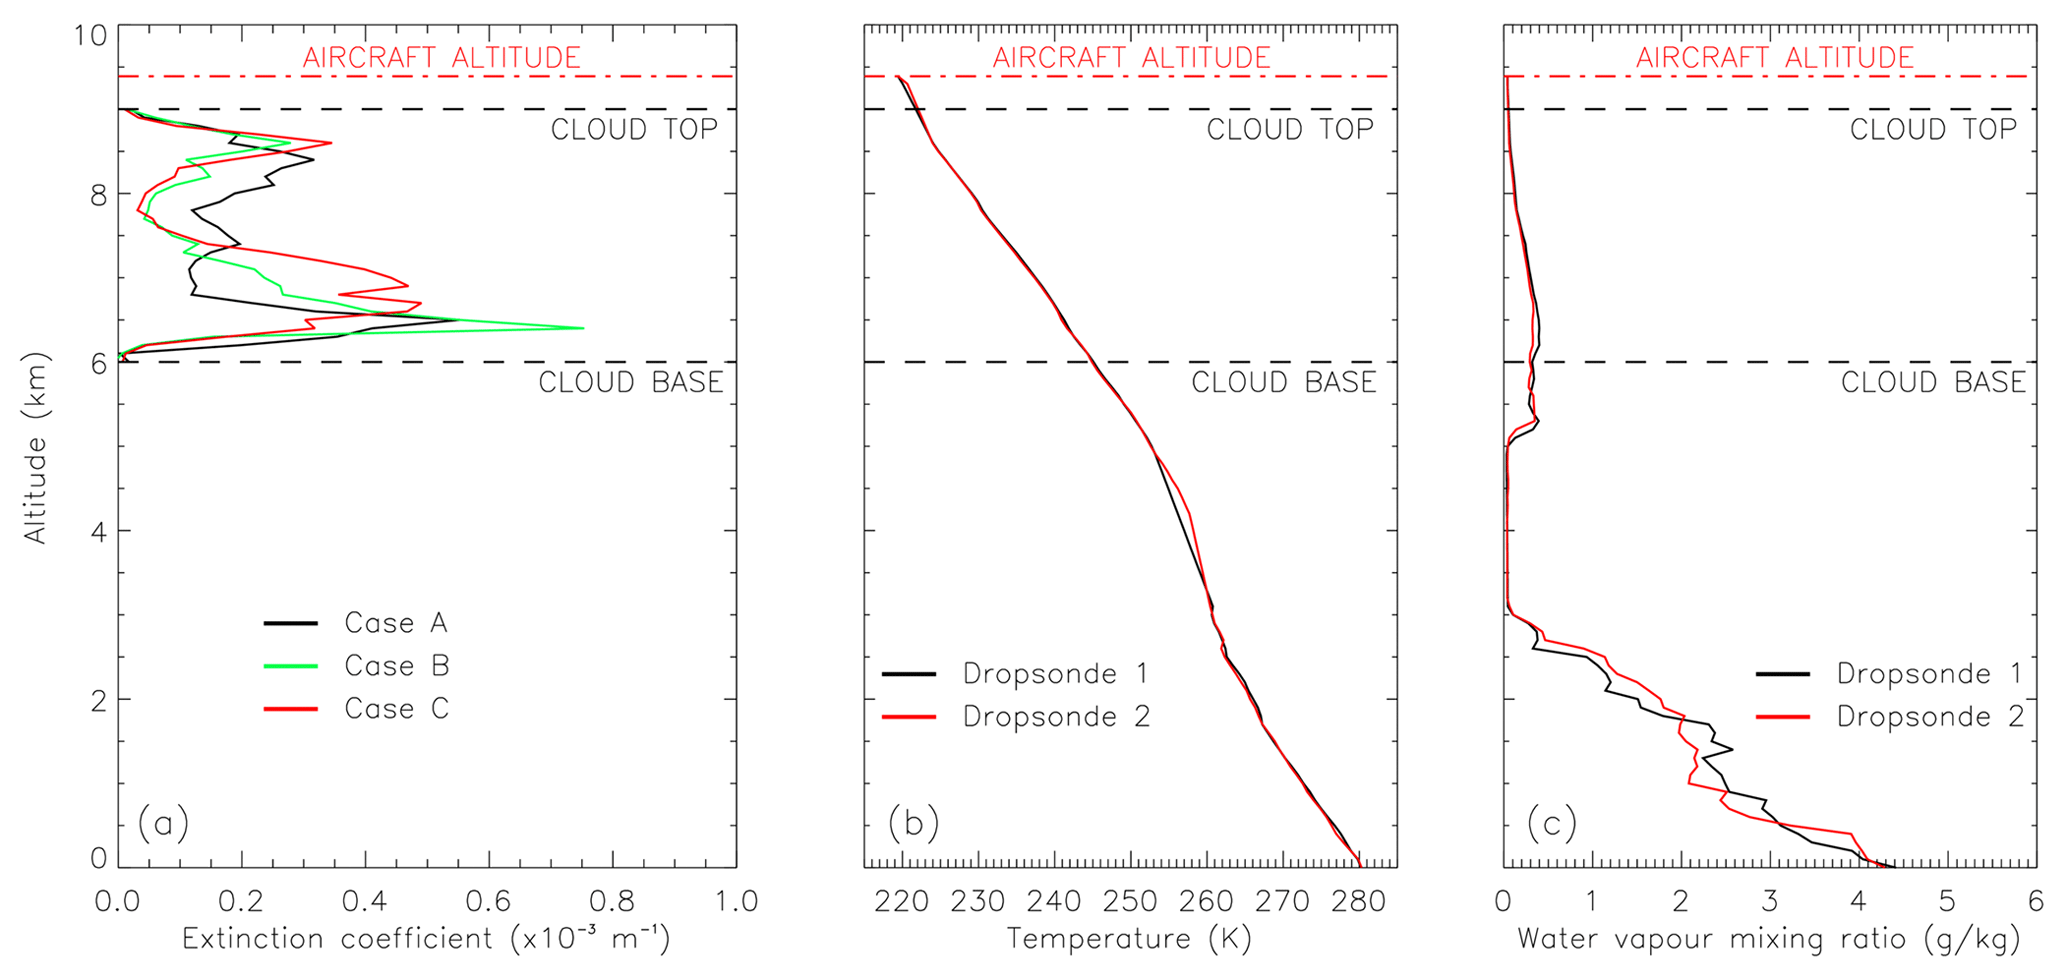
Figure 3(a) Lidar extinction coefficient profiles for cases A–C. (b) Dropsonde temperature profiles from the two dropsondes deployed during SLR 1. (c) As in panel (b) but for the water vapour mixing ratio profiles. The altitude of the aircraft and the upper and lower boundaries of the cirrus cloud layer are indicated by the black dashed lines.
Figure 3a shows the lidar extinction profiles for the three cases (A–C). Panels (b) and (c) show the respective atmospheric temperature and water vapour mixing ratio profiles obtained from the two dropsondes deployed nearest to the time of the selected radiance observations at 09:47:48 UTC (DS1) and 09:50:52 (DS2). The aircraft altitude is shown by the dashed red line. The extinction profiles derived from the lidar measurements indicate that a band of cirrus was located between an altitude of approximately 6 and 9 km with no evidence of any underlying cloud. Integration of these extinction profiles for the three cases, from 6 to 9 km, indicates that τ355 ranged from approximately 0.53 to 0.59. Therefore these clouds would typically have been classified as optically thin (e.g. Dessler and Yang, 2003). Examination of DS1 and DS2 demonstrates that the atmospheric state remained relatively stable between their deployments, with a noticeably dry layer evident between approximately 3 and 5 km in both water vapour profiles. There is a degree of variability in the temperature profile around 4 km as well as in the water vapour mixing ratio below 3 km. The impact of this variability on the simulated radiance spectra is discussed in Sect. 4.
Table 1Summary of the three cases (A, B and C) identified for use in this study, detailing the time of TAFTS, ARIES and lidar observations, along with the key variables from the onboard aircraft instrumentation obtained at the time of the TAFTS observations. Note that the TAFTS observation (obs.) times represent the UTC time (hh:mm:ss) and the equivalent seconds since midnight (sSM) times. Also, note that there are two ARIES spectra (forward and reverse scan directions of the interferometer) associated with each ARIES observation time. The lidar time indicates the start of a 10 s period over which the data are averaged.
The simulation approach makes use of two radiative transfer models, the Line-by-Line Radiative Transfer Model (LBLRTM, Clough et al., 2005) and the Line-by-Line Discrete Ordinates (LBLDIS v3.0, Turner, 2005) code, in conjunction with a representation of the atmospheric state including cloud location and microphysics, expressed in terms of optical depth and effective radius.
For all three cases simulated, the aircraft was overflying ocean. The radiative temperature of the ocean surface was assumed to equal the temperature measured at the lowest altitude from the closest dropsonde in time to the radiance observation. These values were compared to co-located European Centre for Medium Range Weather Forecasts (ECMWF) Interim reanalysis (ERA-I; Dee et al., 2011) surface skin temperatures and were found to agree to within 0.1 K in all cases. The ocean surface spectral emissivity was defined, for wave numbers down to ∼ 769 cm−1, using the wind-speed-dependent model from Masuda et al. (1988), with estimates of the wind speed obtained from the nearest available ERA-I value. The ocean surface spectral emissivity for wave numbers lower than ∼ 769 cm−1 was set to 0.99, although the impact of this choice is negligible given the strong water vapour absorption between the surface and cloud level in the FIR. The atmospheric column beneath the aircraft was divided into 0.1 km thick layers, providing 93 layers from the surface to 9.3 km, with an additional layer closest to the aircraft varying in thickness depending upon the aircraft altitude (between 0.085 and 0.091 km). Temperature and water vapour concentrations for each layer were obtained by interpolating the corresponding dropsonde measurements onto the 0.1 km vertical grid, with the exception of the layer closest to the aircraft which was prescribed by the onboard measurements. In the absence of direct measurements, concentrations of CO2 and minor trace gases were obtained from a standard mid-latitude winter (MLW) atmospheric profile (Anderson et al., 1986) and scaled to present-day concentrations using data from Mace Head (Dlugokencky et al., 2019). Ozone concentrations were obtained from co-located ERA-I data and interpolated to the required vertical resolution.
The quantities describing the surface and atmospheric column were then input into LBLRTM to calculate the optical depths for every layer in the atmosphere between the surface and the aircraft over the spectral range from 105 to 1600 cm−1. The latest version currently available, LBLRTM v12.8, was used with the molecular absorption defined by the Atmospheric and Environmental Research (AER) v3.6 spectral line database, which is based on the HITRAN 2012 database (Rothman et al., 2013). The water vapour continuum was defined by the recently released Mlawer–Tobin–Clough–Kneizys–Davies (MT_CKD) model, version 3.2 (Mlawer et al., 2019).
The wavelength-dependent LBLRTM-derived layer optical depths were then passed to LBLDIS, which takes scattering by particles in the cloud layer into account via the Discrete Ordinate Radiative Transfer (DISORT) code (Stamnes et al., 2000). In this study, the bulk optical properties used to simulate cloudy radiances were those provided by Baum et al. (2014) using 16 streams. This parameterization consists of three databases that are based on different ice particle habits: solid columns only (SC); the aggregate of solid columns only (ASC); and a general habit mixture (GHM) that incorporates plates, droxtals, hollow and solid columns, hollow and solid bullet rosettes, an aggregate of solid columns and a small and large aggregate of plates. Further details on the geometries of these habits are given in Baum et al. (2011), and the method by which the parameterization was built is reported in Baum et al. (2005a, b, 2007). Each database contains the SSPs expressed as a function of wavelength (0.2 to 100 µm) for a range of PSDs, assuming a gamma distribution (see Heymsfield et al., 2013), with a particle effective radius (reff) ranging from 5 to 60 µm. LBLDIS also requires the cloud height, reff, and optical depth for each cloud layer as input. Based on these input parameters, LBLDIS is used to simulate radiances over a wave number range and with a spectral resolution set by the user.
Appropriate instrument apodization functions were then applied to the simulated radiance spectra. To ensure that this process did not introduce errors, the simulations were performed at a 0.01 cm−1 resolution. Once the instrument apodization functions had been applied, the simulated spectra were interpolated onto the same wave number scale as the observations, facilitating direct comparison. A schematic summarizing the simulation methodology is provided in Fig. 4.
We separate the results into three subsections: the first section describes the initial efforts to simulate the observed spectra, utilizing the best available information on the cirrus cloud properties; the second section describes the minimization methods adopted to find the best agreement between the simulated and observed spectra; and the results using these methods are presented in the final section.
4.1 Initial simulation
A single aircraft is not able to simultaneously measure in situ cloud properties and above-cloud radiance spectra. Here, the in situ cloud microphysical measurements were obtained over a period of 1 h and 20 min, starting from approximately 50 min after the radiation observations were obtained (Fig. 1). While the cloud vertical structure remained relatively constant during cases A–C (Fig. 3a), the lidar observations indicated significant variability in the geometrical thickness of the observed cloud during the three SLRs as a whole. Moreover, previous examination of the available in situ cloud microphysical properties indicated a high degree of variability in the PSDs and a wide variety of ice particle habits, which were summarized for seven different temperatures (altitudes) sampled within the cloud (see Figs. 5b and 6b in O'Shea et al., 2016). These issues, combined with the knowledge that the cloud was decaying over time, suggested that it would be impossible to associate a particular observed PSD or habit to the radiation measurements with any confidence. Therefore, we chose to perform an initial simulation for each case for a cloud, split into layers 0.1 km thick, with a vertical extent from 6 to 9 km, taking bulk optical properties from the Baum et al. (2014) ASC ice particle habit model and assuming a fixed reff=30 µm for all layers within the cloud. The relative optical depth for each cloud layer was derived from the lidar observations, ensuring the cloud's total optical depth was equal to the appropriate value from Table 1.
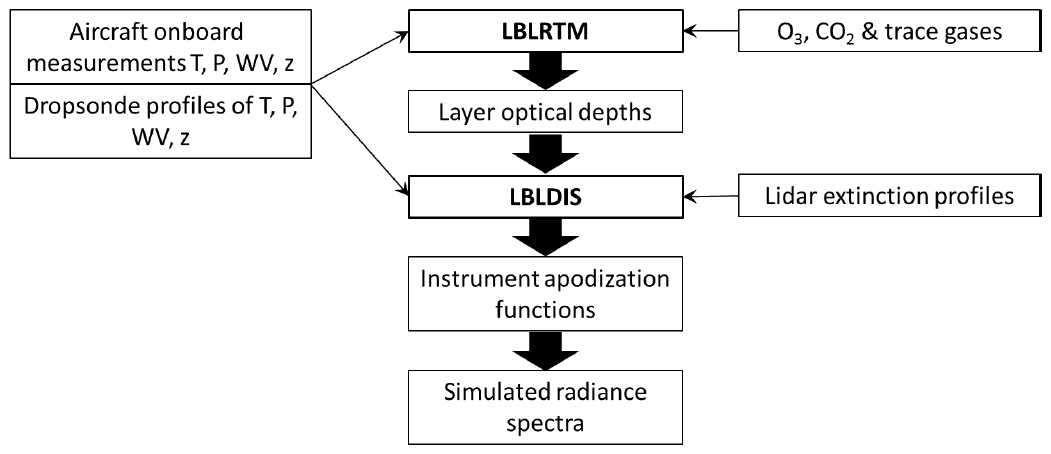
Figure 4Schematic of the inputs (T denotes temperature, P denotes pressure, WV denotes water vapour and z denotes altitude) and steps involved in simulating the radiance spectra observed by the TAFTS and ARIES spectrometers.
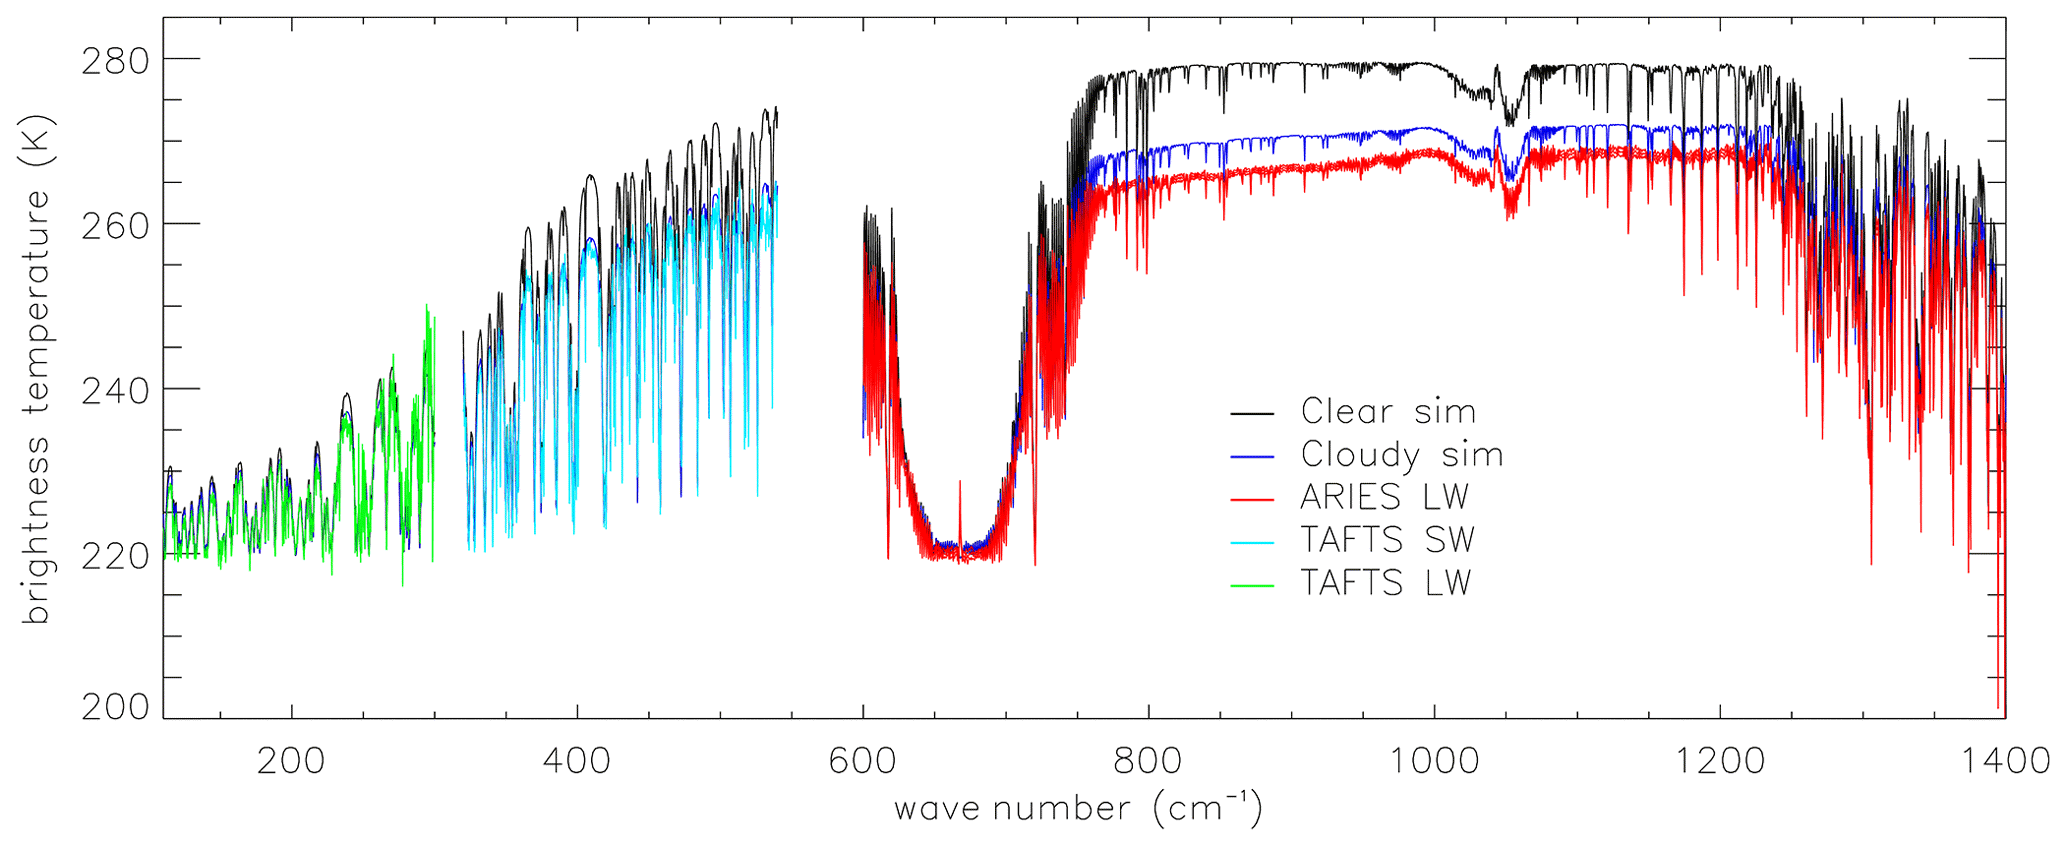
Figure 5Simulation for case A assuming a cirrus cloud with τ355=0.584, composed of ice particles with reff=30 µm, and Baum et al. (2014) ASC particle habit. The TAFTS LW and SW channel spectra are each a single spectrum. The ARIES LW channel spectrum plotted is a mean of eight ARIES observations, and the width of the curve indicates the standard deviation about the mean.
Figure 5 shows the results of such a simulation for case A. For reference, the equivalent clear-sky simulation is also shown. The estimated uncertainty associated with the ARIES spectral calibration is approximately 1 K (Stuart Fox, Met. Office, personal communication, 2019), while the 1σ variability in the eight ARIES spectra matched to the TAFTS acquisition time is approximately ± 0.5 K. Therefore, we estimate the total uncertainty on a mean ARIES spectrum as these values added in quadrature, so ∼ 1.1 K. However, the simulated brightness temperature spectrum overestimates the observed ARIES values in the main atmospheric window by around 4 K, with a smaller (∼ 2 K) overestimate also seen relative to the TAFTS measurements in the FIR micro-windows. Conversely, the level of agreement in the strong CO2 absorption band from 650 to 700 cm−1 (excluding the spike in the centre of the band at 667 cm−1), indicates that the temperature of the uppermost layer in the simulation (i.e. close to the aircraft) is well represented in the temperature profile used in the simulation. These differences point to issues with the cloud properties used in the initial simulation, especially given that interchanging dropsondes 1 and 2 has a comparatively small impact on the simulated spectrum.
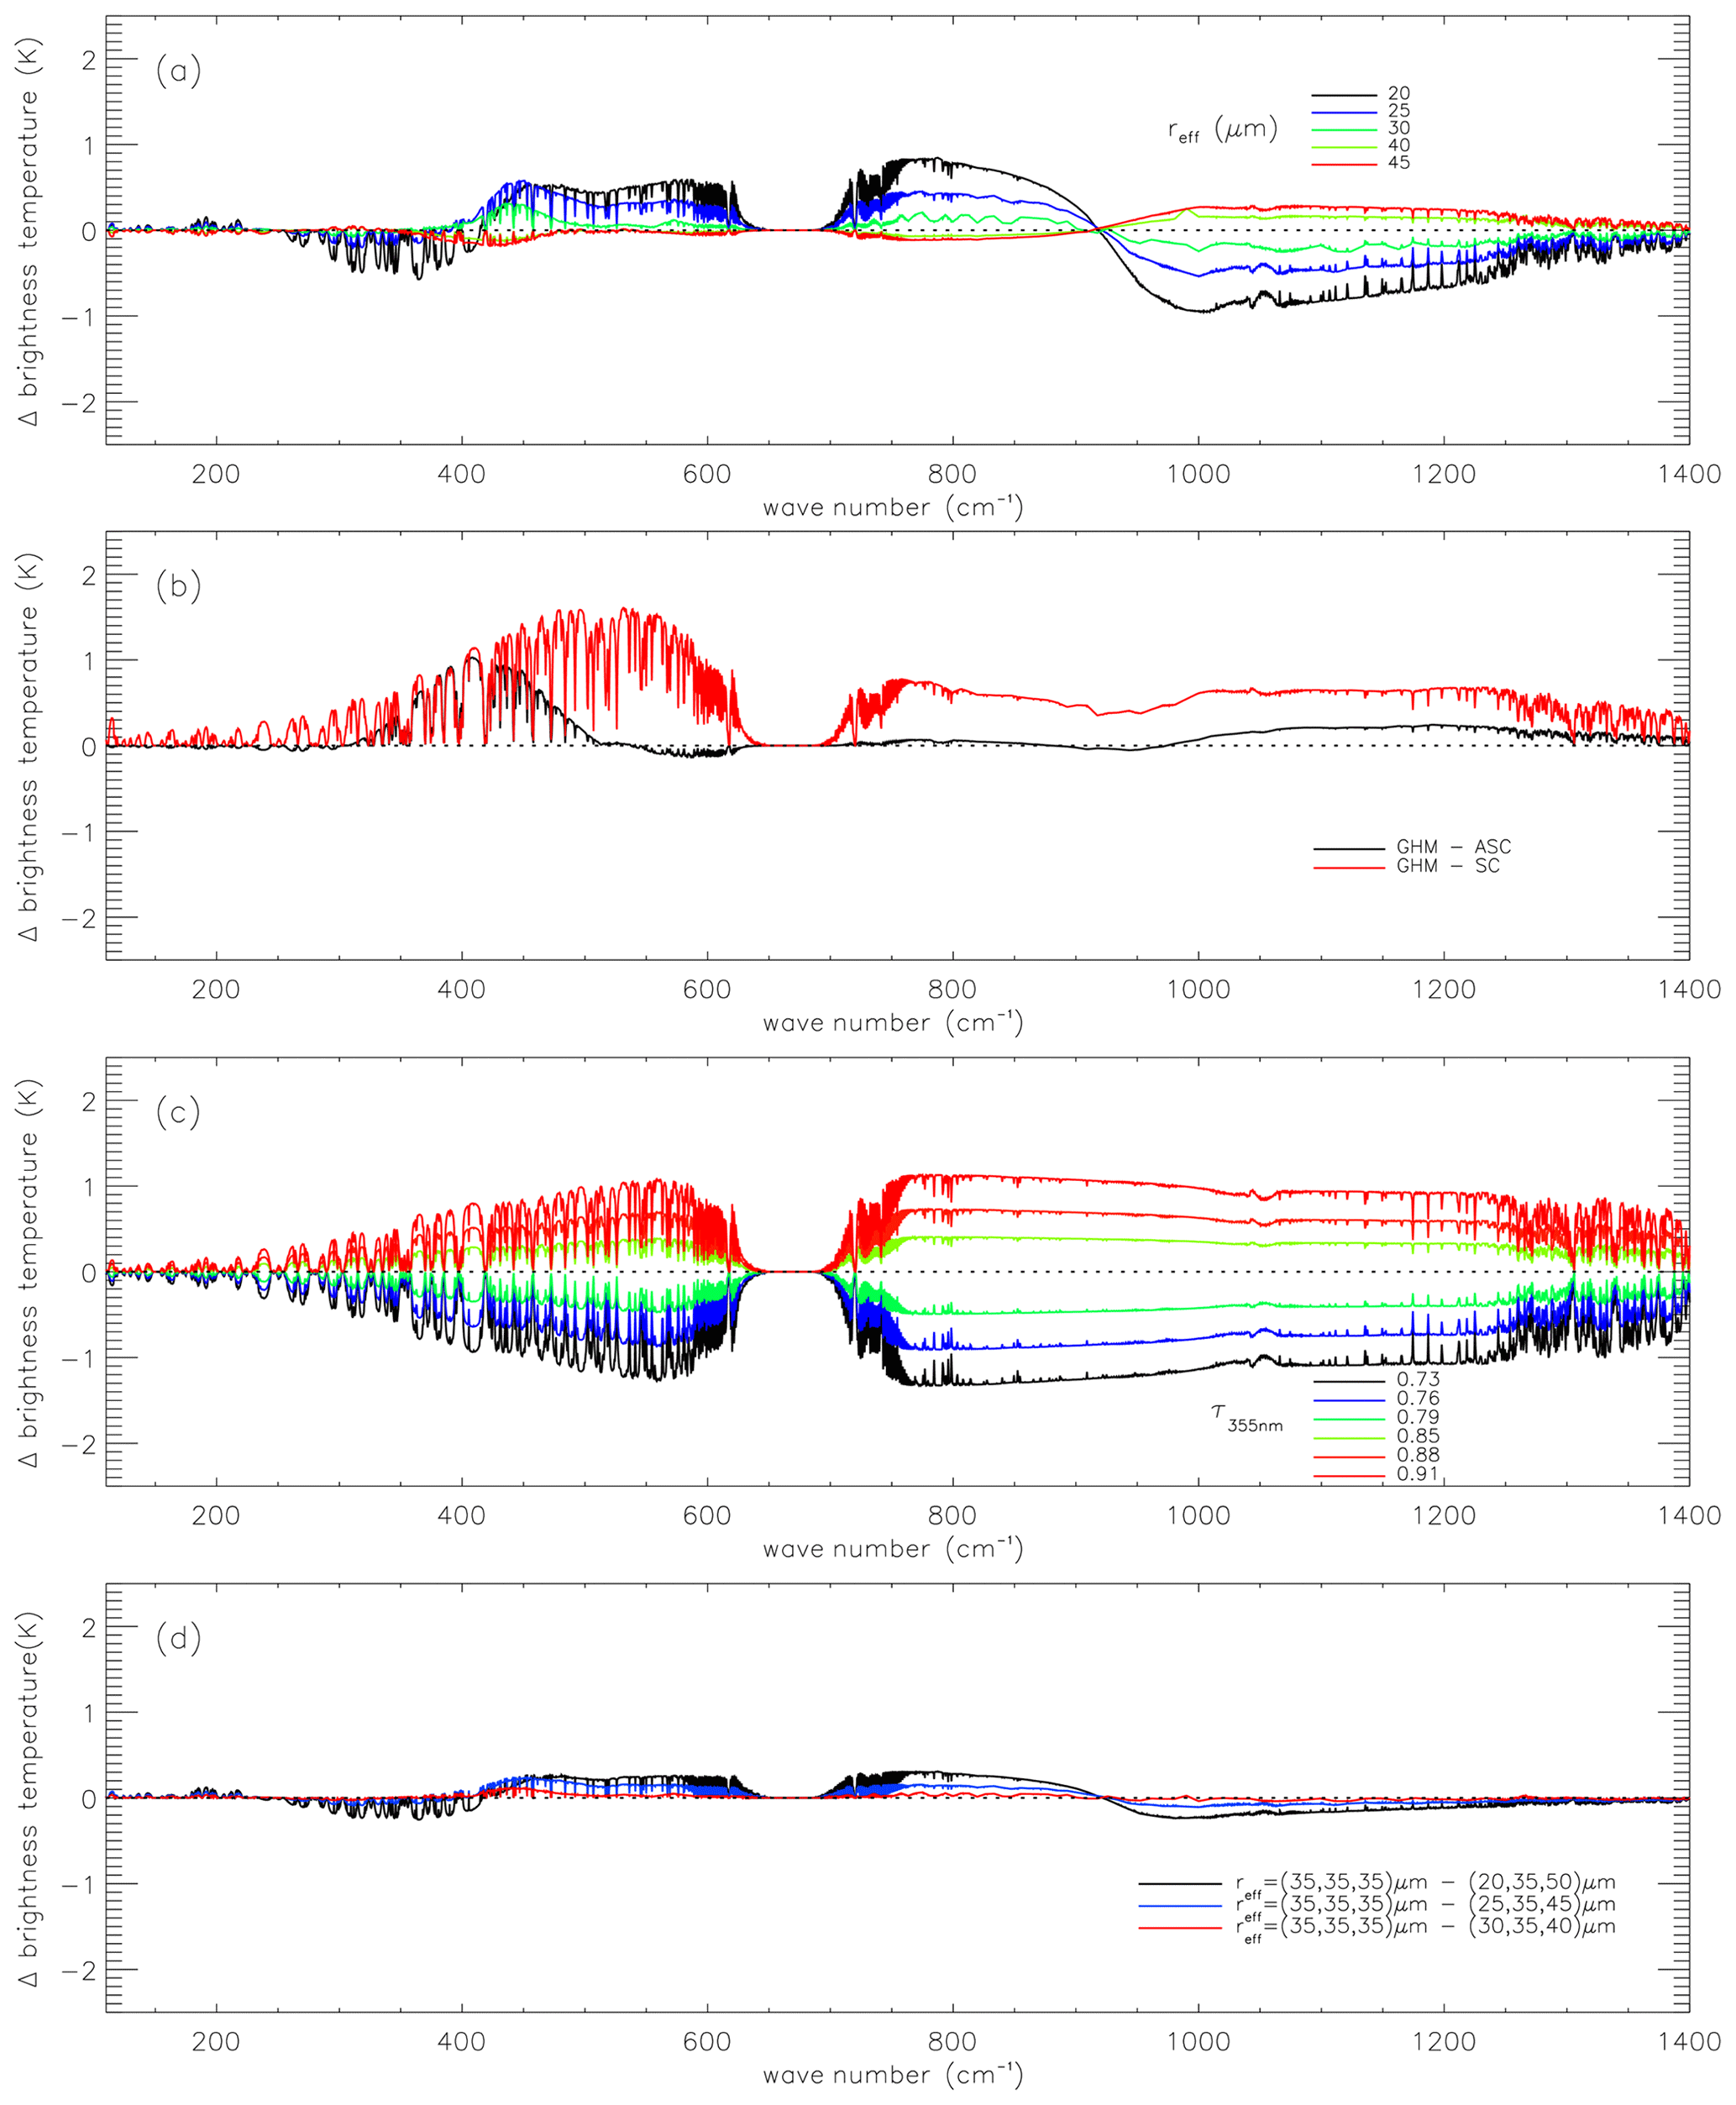
Figure 6Simulated brightness temperature difference spectra to illustrate where there is sensitivity to reff (a), particle habit (b) and τ355 (c). Panel (d) illustrates the effect of varying reff in three 1 km thick layers through the cloud, with smaller crystals assumed at the top. In all panels, the differences are relative to a simulation using the GHM model assuming τ355=0.82 and reff=35 µm.
4.2 Achieving an improved simulation–observation fit
It is evident from Fig. 5 that the initial choice of cloud parameters used to simulate the observed radiance was suboptimal. The two key parameters typically required to define the microphysical properties of an ice cloud are reff and the ice particle habit. The sensitivity of the mid-infrared to ice particle size has been known for many years (e.g. Bantges et al., 1999), and more recently sensitivity studies extending into the far-infrared have been performed (e.g. Yang, 2003; Yang et al., 2013). Figure 6a–c show the results of a series of simulations performed to examine the impact of varying reff, ice particle habit and optical depth for case A. As part of this analysis, while we have no direct observational evidence for a variation in reff with height through the cloud, it is reasonable to explore the response to such a variation as it might be expected to be different in the MIR and FIR regimes. Hence, Fig. 6d shows the impact of varying reff in three 1 km thick layers through the cloud.
Figure 6a indicates that there are a wide range of spectral regions that demonstrate sensitivity to size from approximately 300 to 600 cm−1, 750 to 850 cm−1 and 950 to 1250 cm−1. In contrast, there are spectral regions that exhibit sensitivity primarily to ice particle habit (Fig. 6b). Differences between the GHM and SC model are greatest around 500 cm−1, while they are greatest at around 400 cm−1 for GHM and ASC differences. Sensitivity to optical depth (Fig. 6c) is broadly similar across the MIR and FIR from 400 to 1400 cm−1, but it drops off rapidly at wave numbers lower than 400 cm−1 due to the increasing effect of strong water vapour absorption and the overall reduction in radiative energy at these frequencies. Introducing a vertical variation in reff (Fig. 6d) produces a change which has a very similar spectral shape (although much smaller magnitude) to that observed for a bulk change in reff.
Using this information, a scheme was developed to minimize the differences between the simulated and observed spectra in regions showing particular sensitivity to reff and habit. Four wave number channels in the MIR and four in the FIR were used (each of ∼ 2 cm−1 width): 775, 850, 900 and 1200 cm−1 in the MIR and 365, 410, 450 and 497 cm−1 in the FIR. The ultimate goal was to investigate whether there was any combination of parameters that could fit the observations across the MIR and FIR simultaneously given measurement uncertainties. Because of the reduced sensitivity to the vertical profile of reff and the similarity of the associated spectral signature to those generated from vertically uniform perturbations to reff, we do not attempt to account for any vertical variation in our simulations.
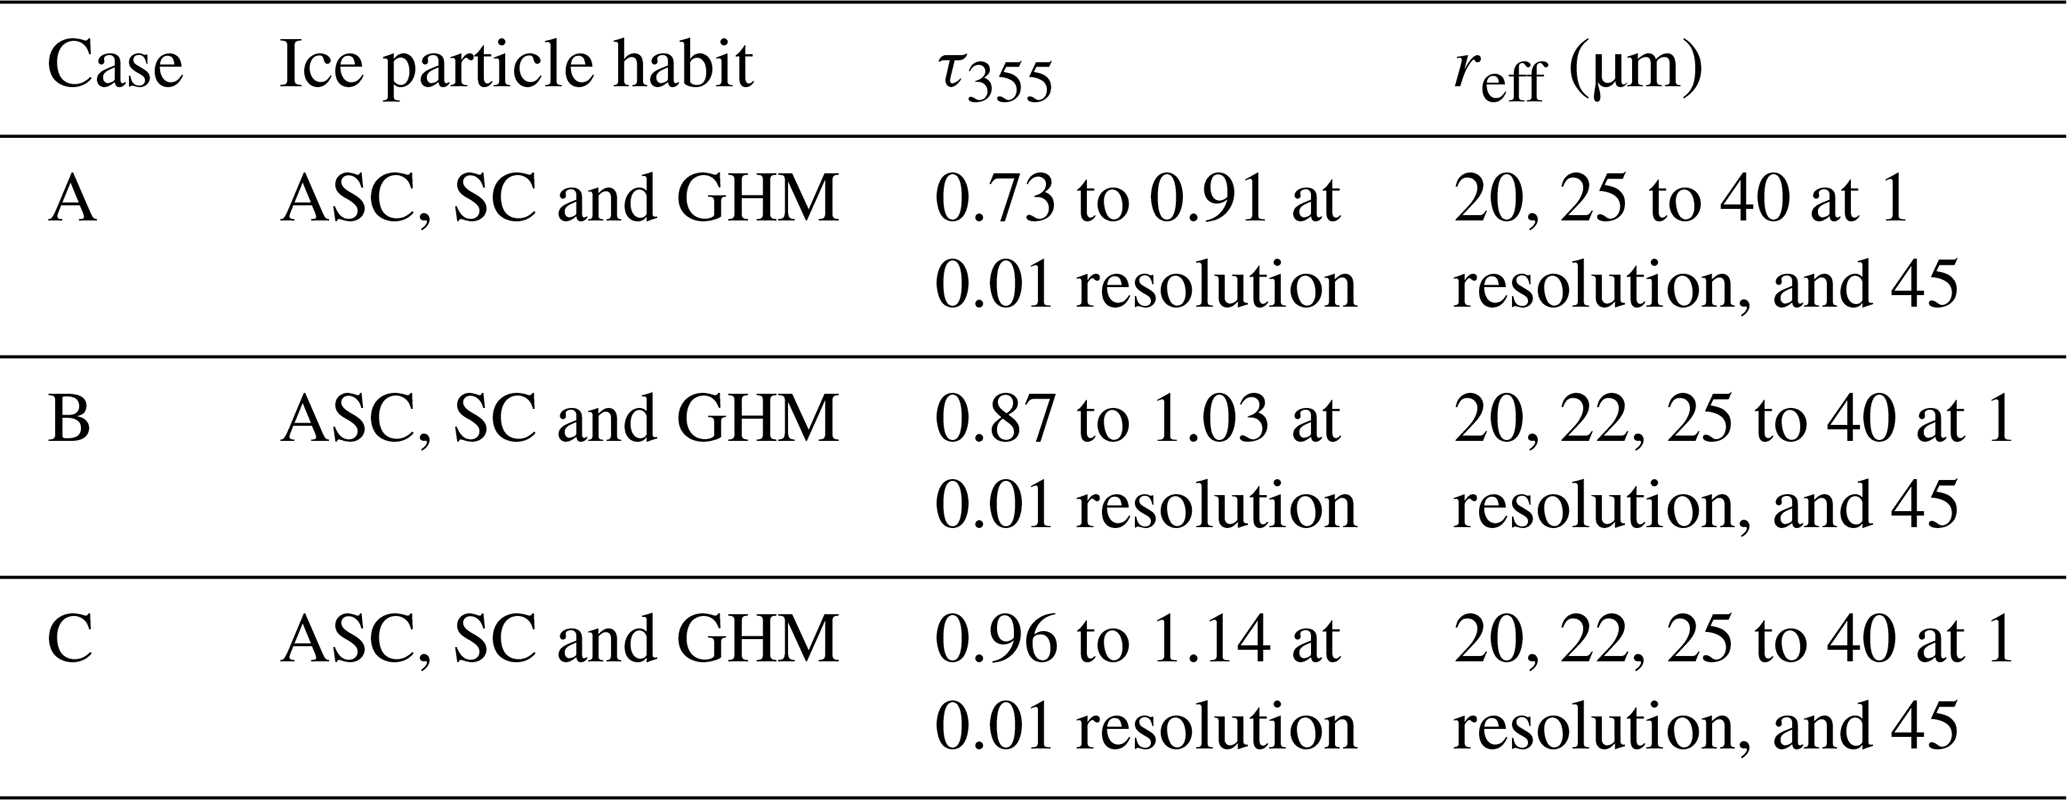
To facilitate the minimization, a series of simulations were performed for a range of reff and τ for the three ice particle habits in the Baum et al. (2014) database. Table 2 provides a summary of the ranges covered for each variable. These values were chosen, based on initial simulation attempts to match the observed spectrum, to produce a range of simulations that encompassed the observations and their associated uncertainties.
Table 2Summary of the variation in the cloud bulk optical properties for which radiance spectra were simulated for cases A, B and C. For each case, the cloud optical depth vertical profile was scaled according to the corresponding lidar extinction profile. The effective radius of the ice particle size distribution were assumed to be constant for all layers within the cloud.
The simulations were compiled into a database ordered by τ355, reff and ice particle habit. Four different approaches were then adopted to identify the simulation that most closely matched the observations for each case. The first approach comprised two stages. The initial stage identified the simulated radiance spectra that agreed to within the measurement uncertainties for the ARIES spectrum for all four of the selected MIR channels to create a subset of “matched” simulated spectra. This subset was then processed to find the simulation that most closely matched the corresponding TAFTS SW spectrum for the four channels identified in the FIR. The absolute difference between the simulations and observations for each FIR channel was weighted by the observation uncertainty and then summed:
where Rsimi and Robsi are the simulated and observed radiances respectively, and Rerrori is the observation uncertainty for FIR channel i. X was then minimized to obtain the “best” solution.
The second approach also comprised two stages, with the first stage mimicking that of the first approach. In the second step, the uncertainty weighting was removed such that the minimum of Eq. (2) was sought,
The third approach focused on determining the best agreement that could be obtained using the individual MIR spectral range. This was achieved by minimizing the integrated absolute difference between the simulation and observation across the MIR from 600 to 1400 cm−1. For completeness, a fourth approach, similar to the third, but in this case minimizing the integrated difference in the FIR from 320 to 540 cm−1, was considered to demonstrate whether agreement solely in the FIR could be achieved.
Table 3Summary of the cloud optical properties that yield the closest agreement between the simulated and observed spectra for the four different minimization approaches.
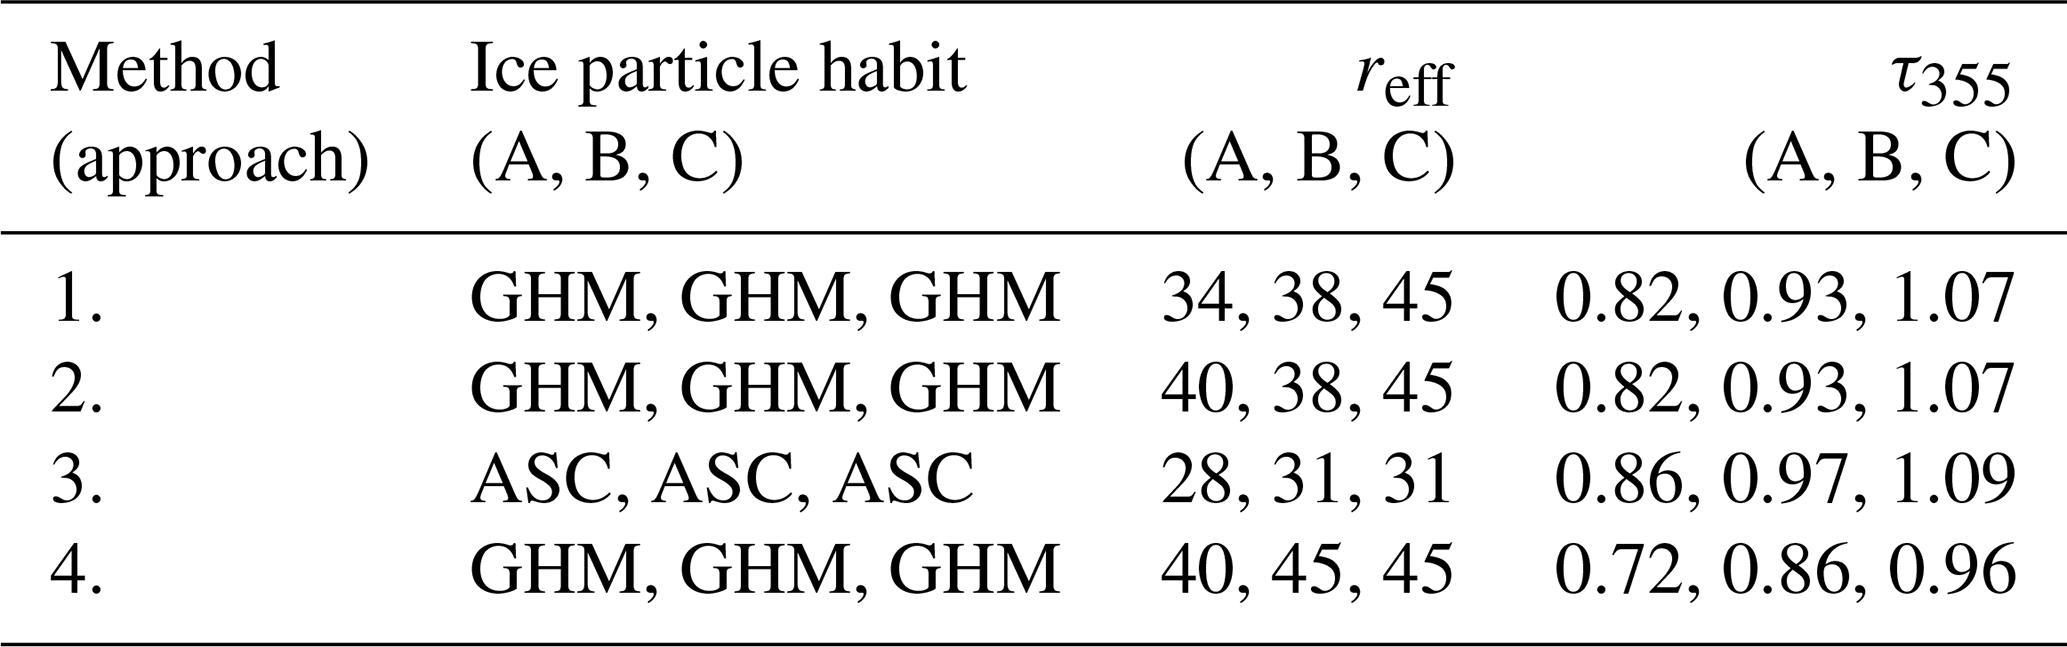
4.3 Minimization results
The combinations of ice particle habit, reff and τ355 that give the simulated spectra which most closely match the observations using each of the three minimization methods are summarized in Table 3. The results for all the methods indicate a need to increase τ355 nm above the lidar-derived value by an amount larger than the stated uncertainty in the lidar values of ± 20 % (Stuart Fox, personal communication, 2019). However, the required change to the derived optical depth can be produced by adjusting the lidar backscatter-to-cloud extinction ratio from the flight-averaged value used in this study (Fox et al., 2019) to values that still lie within the typical range observed for ice clouds (e.g. Chen et al., 2002; Heymsfield et al., 2008; Young et al., 2013; Gouveia et al., 2017). We note that changing this value would not significantly impact the lidar-determined relative variation of the extinction or the cloud geometrical thickness used in this study.
Minimization methods 1 and 2 yield very similar results, both indicating that the GHM habit provides the closest agreement, with the only difference that method 1 suggests being a slightly smaller reff compared with method 2 for case A. Method 3 demonstrates that using the MIR in isolation gives markedly different values. In this case, the results would suggest a cloud comprised of relatively small ASC habit ice particles with an optical depth slightly larger than that indicated by methods 1 and 2. Finally, when matching the FIR observations in isolation (method 4), a cloud with lower optical depth composed of relatively large GHM habit ice particles is implied.
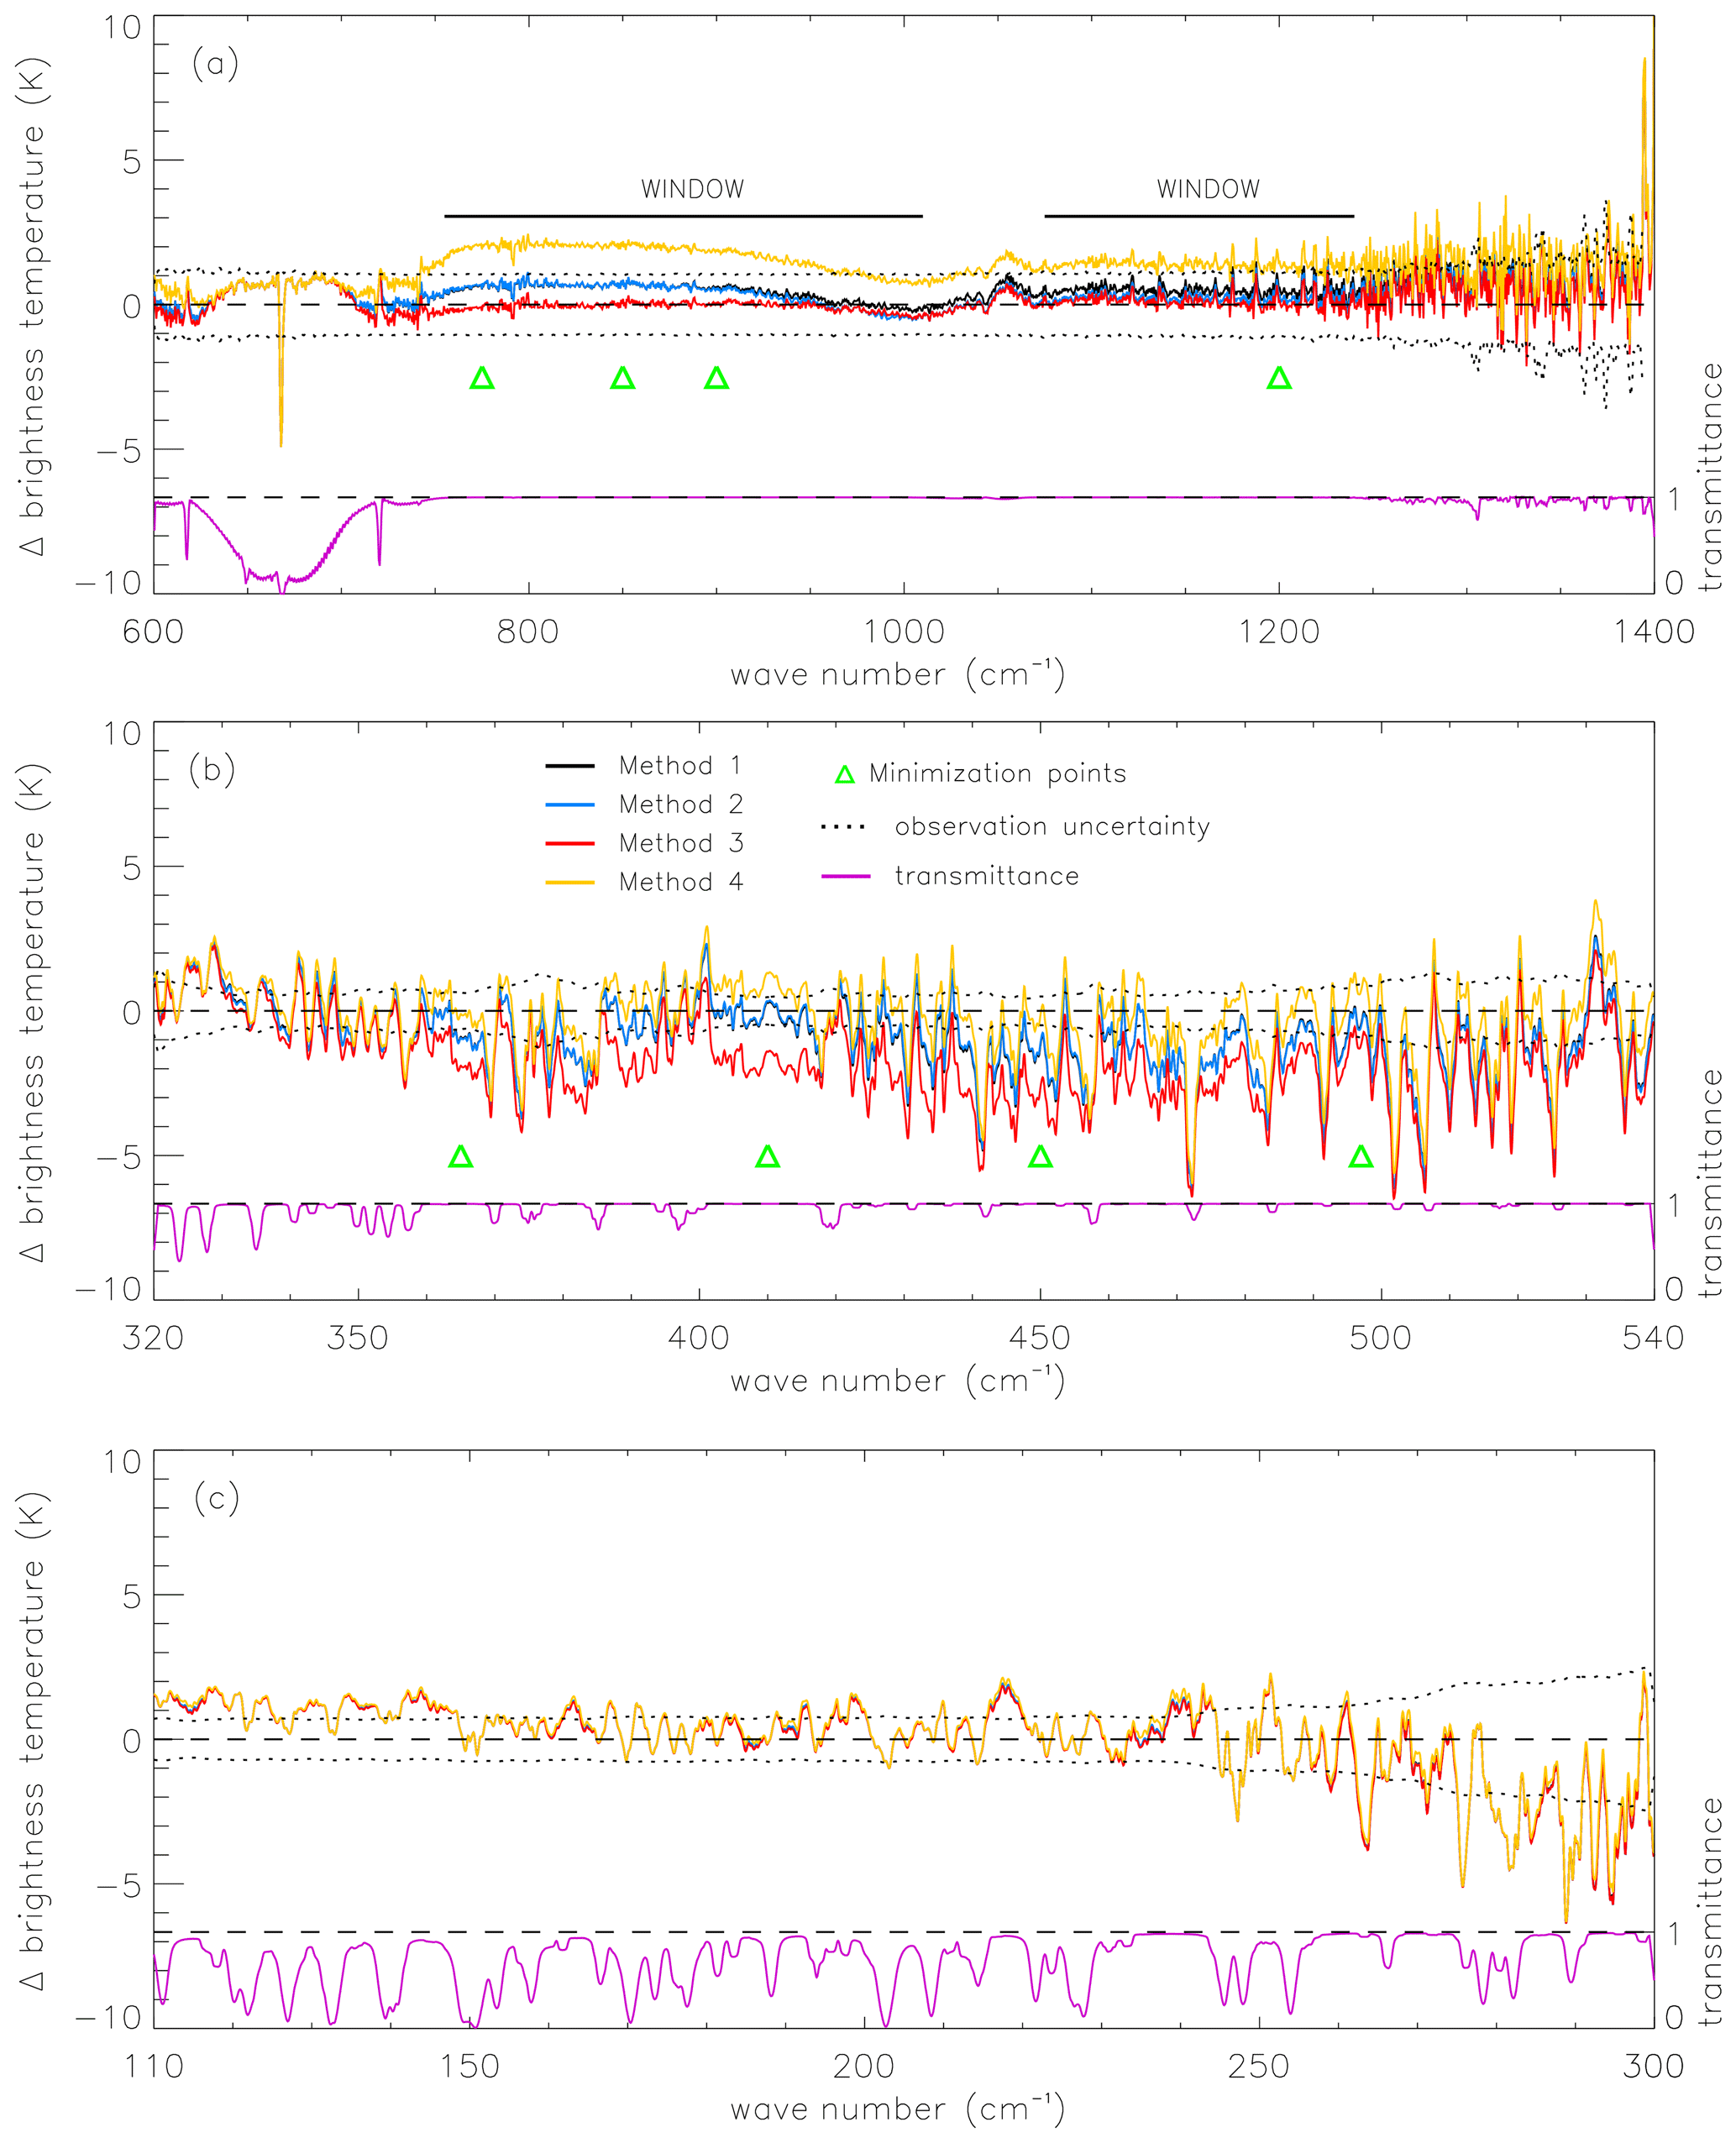
Figure 7Simulation minus observation difference spectra for case A for each minimization approach, for the (a) MIR, (b) SW FIR and (c) LW FIR frequency ranges. The transmission of the atmosphere (derived from a simulation) between the cloud top and the aircraft level is also shown.
The spectral differences between the observations and the best-matching simulations are shown in Fig. 7 for each minimization method, separated into three different spectral regions defined as MIR (600 to 1400 cm−1), SW FIR (320 to 540 cm−1) and LW FIR (110 to 300 cm−1). It is important to note that the large differences consistently found around 667 cm−1 are most likely a measurement artefact due to the extremely strong absorption by CO2 around this frequency. This results in measurements reflecting the temperature of the air inside or very close to the ARIES instrument. Similar effects can be present due to strong water vapour lines and are particularly evident at wave numbers > 1300 cm−1. As evidenced by Fig. 3, cloud signatures are more apparent in the more transparent spectral regions, indicated by the “window” labels in Fig. 7a, and where the atmospheric transmission between the cloud top and aircraft is close to 1 (Fig. 7b, c).
Unsurprisingly, given the values in Table 2, the difference spectra from methods 1 and 2 lie almost on top of each other across the full spectral range analysed. Within the MIR (Fig. 7a), the differences are within the measurement uncertainties with the exception of those spectral regions most strongly influenced by CO2 and water vapour discussed above. Within the TAFTS LW channel (Fig. 7c), the simulations overlie each other, as the models predict a greatly reduced sensitivity to ice particle habit and size for frequencies lower than around 300 cm−1, as shown in Fig. 6. The atmospheric layer above the cloud in this spectral region is also less transparent, further reducing the observed impact of variations in the ice particle properties. However, there are several regions in the SW FIR (e.g. 375, 450 and 475 cm−1) where the differences lie outside of the measurement uncertainty estimates (Fig. 7b). Overall, for case A, a total of 1488 simulations were performed. Of these, 739 matched the observed spectrum to within uncertainties in the MIR and a unique 14 matched (using method 4) the observed spectrum in the FIR. For the bulk optical models tested, this result shows that any combination of τ355 and reff is unable to match the TAFTS and ARIES observations simultaneously within measurement error. Analysis of cases B and C (not shown) yields similar conclusions.
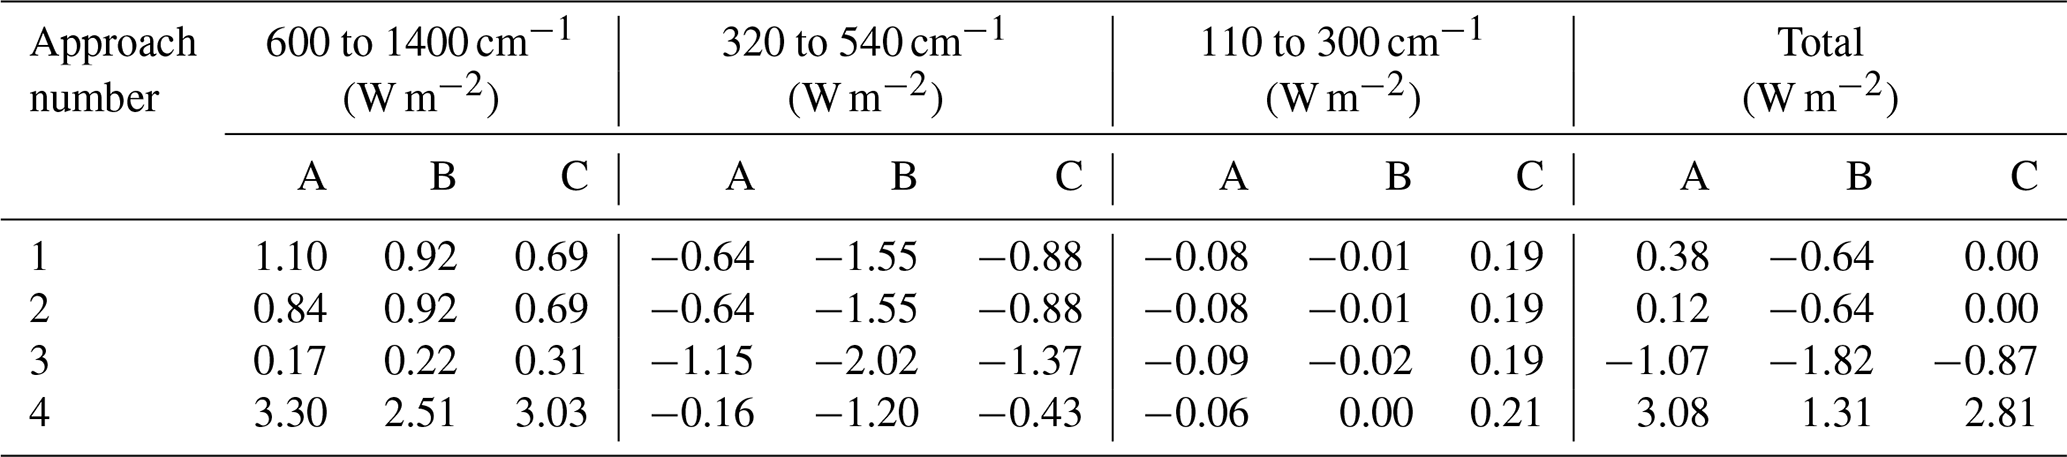
Table 4Integrated, simulation minus observation, flux differences for selected spectral ranges (MIR, SW FIR and LW FIR) as well as the total, for the best-matching spectra obtained using the four different minimization methods, for the three case studies. Results from method 4 are included for completeness, although we do not anticipate future observations to be restricted to only FIR frequencies.
It is worth reiterating that the difference spectra obtained using method 3 demonstrate that it is possible to achieve excellent agreement in the MIR using MIR observations in isolation (Fig. 7a). However, extending the best-fitting parameters to the FIR generates large residuals (Fig. 7b), and using the FIR in isolation yields closer agreement across the FIR (albeit not within measurement uncertainty across all micro-windows) but even larger residuals in the MIR. This highlights that the combined use of MIR and FIR measurements should provide a much tighter constraint on the ability of any given ice cloud optical property model to capture the observed radiative behaviour of cirrus across the infrared spectrum and that FIR observations are needed to refine and test bulk ice cloud optical model development.
To assess the energetic impact of misrepresenting the cirrus spectral signature, a first-order estimate of the upwelling flux difference between the simulations selected by all minimization methods (1–4) and the observations is obtained by multiplying the upwelling nadir radiances by pi (assuming an approximation to the diffusivity-factor approximation; Elsasser, 1942) and integrating over selected spectral ranges (Table 4). For completeness, results from all three cases analysed are shown. Table 4 indicates that there is a compensation effect between the differences seen in the MIR and in the shortwave FIR channel in all cases and for all methods. This compensation means that rather large differences (of the order of 0.6–1.6 W m−2) are seen in the individual bands for methods 1 and 2, but these differences are somewhat masked when looking at the deviation integrated across all three bands. Our results suggest that the use of information solely from the MIR to estimate the cirrus properties (method 3) can result in sizable deviations in both the SW FIR and the total flux, with values exceeding 2.0 W m−2 for one of the cases analysed. Using the FIR only (method 4) can lead to even greater deviations, with values exceeding 3.0 W m−2, dominated by differences in the MIR.
The ability to simulate the radiative signatures of cirrus cloud across the mid- and far-infrared as measured by the ARIES and TAFTS instruments on the FAAM aircraft has been assessed using sophisticated radiative transfer codes in combination with state-of-the-art cirrus optical property databases. Despite considering a wide range of cloud properties, comparisons between the simulated and observed spectra have shown that it is currently not possible to achieve agreement across the infrared to within the estimated measurement uncertainties for the Baum et al. (2014) bulk optical property models tested here.
Using a variety of minimization approaches, we have shown that restricting the matching frequency range to the mid-infrared generates multiple solutions that span a wide range of cirrus optical properties. These can give agreement with the observations to within measurement uncertainty in the mid-infrared, but they result in discrepancies that exceed measurement uncertainty at far-infrared frequencies. While no solutions are able to simultaneously capture the observed mid- and far-infrared behaviour to within uncertainties, the combined use of the mid- and far-infrared gives the tightest constraint on optical model parameters, thereby enabling the identification of the most representative optical properties for the observed cloud.
First-order analysis of the longwave energetic flux errors that result from deficiencies in the simulations' ability to represent the radiative properties of the observed thin cirrus demonstrate that these can be significant, reaching values of the order of 1 to 2 W m−2 across the far-infrared for simulations that best match the mid-infrared in isolation. Deviations are even higher, reaching 3 W m−2 across the mid-infrared for simulations that best match the far-infrared measurements in isolation. Interestingly, these errors tend to compensate for one another when summed across the infrared as a whole and would not be very apparent in broadband flux measurements. This illustrates the need for spectral information, as spectrally dependent errors would also be expected to translate into errors in the vertical profile of heating (e.g. Clough and Iacono, 1995; Brindley and Harries, 1998; Turner et al., 2018), potentially affecting cloud and atmospheric dynamics.
It is noted that the ice cloud optical property databases employed in this study do not yet take the temperature dependency of the refractive indices of ice into account (Iwabuchi and Yang, 2011). This is particularly important in the far-infrared, as they show that the spectral effects of this temperature dependence on the ice optical properties has the greatest impact on the scattering between ∼ 200 and 330 cm−1 and on the absorption between 250 and 500 cm−1. Studies imply that this can exert a noticeable impact on retrievals of the cirrus optical depth and effective radius utilizing the mid- and far-infrared simultaneously (Saito et al., 2020). Other parameters included in the optical property databases, such as ice particle roughness, which although observed to be less important than habit and size (Maestri et al., 2019), may also require consideration in future. A further question relates to the relative sensitivity of the far- and mid-infrared regimes to depth within the cloud. To address this, the impact of varying the vertical profile of reff within the cloud on the simulated spectra was also considered, but it was found to have an almost identical spectral signature to that generated by a bulk change in reff but of a greatly reduced magnitude.
Within the Baum et al. (2014) bulk optical models there is also an implicit assumption that the cloud PSD follows a gamma distribution. These PSDs were generated from in situ aircraft measurements from a variety of 11 field campaigns (Heymsfield et al., 2013). How realistic these fitted PSDs may be for the clouds studied here is an open question; however, using PSDs generated from the in situ measurements of the cloud microphysics for this campaign, obtained over a period between 50 min to a little over 2 h after the radiation measurements, does not improve upon the simulation performance. We note again that the high variability of the cloud field also raises questions as to how closely these in situ measurements represent the cloud sampled by the radiation instruments. Future campaigns should seek to employ a dual platform approach to enable simultaneous in-cloud sampling and above-cloud radiative observations.
The European Space Agency recently announced the selection of its ninth Earth Explorer mission, Far-infrared Outgoing Radiation Understanding and Monitoring (FORUM), scheduled for launch no earlier than 2025. The mission will see the Earth's emitted radiation from 100 to 1600 cm−1 measured from sun-synchronous orbit, providing global coverage for at least 4 years. These observations should enable a consistent link to be made between the microphysical properties of cirri and their radiative signatures, ultimately helping to provide an improved representation of cirrus clouds in climate and forecast models, both in terms of the physical processes driving specific types of cirri formation and their associated impact on the Earth's energy budget. Key preparatory steps will be the development of bulk optical property models for ice cloud that show consistency with measurements across the electromagnetic spectrum, necessitating additional airborne observations of cirrus and their associated microphysical properties over a range of cirrus types in addition to the optically thin frontal cloud analysed here.
Data from the CIRCCREX field campaign can be found at the Natural Environment Research Council's Data Repository for Atmospheric Science and Earth Observation: https://catalogue.ceda.ac.uk/uuid/6ba397d6c8854da19bcced8ea588c1f9 (CEDA, 2016).
RJB performed the simulations and designed and co-wrote the paper. HEB provided guidance and focus for the study and co-wrote the paper. JEM, AEL and JEP were responsible for enabling the measurements from the TAFTS instrument as part of the CIRCCREX campaign flight B895. CF provided some background material. SF and CH provided ARIES and lidar data. PY and BAB provided ice cloud optical models and guidance. KNB and SJO provided information on the in situ microphysical data obtained during the CIRCCREX campaign flight B895. JER and HO provided guidance and scientific feedback for the study.
The authors declare that they have no conflict of interest.
The CIRCCREX campaign and processing of these data were funded by the Natural Environment Research Council (UK) grant nos. NE/K015133/1 and NE/K01515X/1.
This research has been supported by the NERC National Centre for Earth Observation (grant no. PR140015) and the ESA (contract no. 4000124917).
This paper was edited by Bernhard Mayer and reviewed by Quentin Libois and one anonymous referee.
Anderson G., Chetwynd, J., Clough, S., Shettle, E., and Kneizys, F.: AFGL atmospheric constituent profiles (0–120 km). Technical Report, U.S. Air Force Geophysics Laboratory, Hanscom Air Force Base, MA, p. 01731, 1986.
Bantges, R. J., Russell, J. E., and Haigh, J. D.: Cirrus cloud top-of-atmosphere radiance spectra in the thermal infrared, J. Quant. Spect. Radiat. Trans., 63, 487–498, 1999.
Baran, A.: The dependence of cirrus infrared radiative properties on ice crystal geometry and shape of the size-distribution function, Q. J. R. Meteorol. Soc., 131, 1129–1142, https://doi.org/10.1256/qj.04.91, 2005.
Baran, A.: The impact of cirrus microphysical and macrophysical properties on upwelling far-infrared spectra, Q. J. R. Meteorol. Soc., 133, 1425–1437, 2007.
Baran, A.: From the single-scattering properties of ice crystals to climate prediction: A way forward, Atmos. Res., 112, 45–69, https://doi.org/10.1016/j.atmosres.2012.04.010, 2012.
Baran, A. and Francis, P.: On the radiative properties of cirrus cloud at solar and thermal wavelengths: A test of model consistency using high-resolution airborne radiance measurements, Q. J. R. Meteorol. Soc., 130, 763–778, https://doi.org/10.1256/qj.03.151, 2004.
Baran, A., Cotton, R., Furtado, K., Havemann, S., Labonnote, L.-C., Marenco, F. , Smith, A., and Thelen, J.-C.: A self-consistent scattering model for cirrus, II: The high and low frequencies, Q. J. R. Meteorol. Soc., 140, 1039–1057, https://doi.org/10.1002/qj.2193, 2014a.
Baran, A., Hill, P., Furtado, K., Field, P., and Manners, J.: A coupled cloud physics-radiation parameterization of the bulk optical properties of cirrus and its impact on the Met Office Unified Model Global Atmosphere 5.0 configuration, J. Clim., 27, 7725–7752, 2014b.
Baran, A. J., Furtado, K., Labonnote, L.-C., Havemann, S., Thelen, J.-C., and Marenco, F.: On the relationship between the scattering phase function of cirrus and the atmospheric state, Atmos. Chem. Phys., 15, 1105–1127, https://doi.org/10.5194/acp-15-1105-2015, 2015.
Baum, B., Heymsfield, A., Yang, P., and Bedka, S.: Bulk Scattering Properties for the Remote Sensing of Ice Clouds, Part I: Microphysical Data and Models, J. Appl. Meteorol., 44, 1885–1895, 2005a.
Baum, B., Yang, P., Heymsfield, A., Platnick, S., King, M., Hu, Y., and Bedka, S.: Bulk Scattering Properties for the Remote Sensing of Ice Clouds, Part II: Narrowband Models, J. Appl. Meteorol., 44, 1896–1911, 2005b.
Baum, B., Yang, P., Nasiri, S., Heidinger, A. K., Heymsfield, A., and Li, J.: Bulk Scattering Properties for the Remote Sensing of Ice Clouds, Part III: High-Resolution Spectral Models from 100 to 3250 cm−1, J. Appl. Meteorol. Clim., 46, 423–434, https://doi.org/10.1175/JAM2473.1, 2007.
Baum, B., Yang, P., Heymsfield, A., Schmitt, C., Xie, Y., Bansemer, A., Hu, Y.-X., and Zhang, Z.: Improvements in Shortwave Bulk Scattering and Absorption Models for the Remote Sensing of Ice Clouds, J. Appl. Meteorol. Clim., 50, 1037–1056, https://doi.org/10.1175/2010JAMC2608.1, 2011.
Baum, B., Yang, P., Heymsfield, A., Bansemer, A., Cole, B., Merrelli, A., Schmitt, C., and Wang, C.: Ice cloud single-scattering property models with the full phase matrix at wavelengths from 0.2 to 100 µm, J. Q. Sp. Ra. T., 146, 123–139, https://doi.org/10.1016/j.jqsrt.2014.02.029, 2014.
Bianchini, G. and Palchetti, L.: Technical Note: REFIR-PAD level 1 data analysis and performance characterization, Atmos. Chem. Phys., 8, 3817–3826, https://doi.org/10.5194/acp-8-3817-2008, 2008.
Brindley H. and Harries, J. E.: The impact of far IR absorption on clear sky greenhouse forcing, J. Q. Sp. Ra. T., 60, 151–180, 1998.
Canas, T., Murray, J., Harries, J., and Haigh, J.: Tropospheric Airborne Fourier Transform Spectrometer (TAFTS), P. Soc. Photo.-Opt. Ins. II, 3220, 91–102, 1997.
CEDA: Facility for Airborne Atmospheric Measurements; Natural Environment Research Council; Met Office, FAAM B895 CIRCCREX and ISMAR flight: Airborne atmospheric measurements from core and non-core instrument suites on board the BAE-146 aircraft, NCAS British Atmospheric Data Centre, available at: https://catalogue.ceda.ac.uk/uuid/6ba397d6c8854da19bcced8ea588c1f9 (last access: 2 November 2020), 2016.
Chen, W.-N., Chiang, C.-W., and Nee, J.-B.: Lidar ratio and depolarization ratio for cirrus clouds, Appl. Opt., 41, 6470–6476, https://doi.org/10.1364/AO.41.006470, 2002.
Clough, S. A. and Iacono, M. J.: Line-by-line calculation of atmospheric fluxes and cooling rates: 2. Application to carbon dioxide, ozone, methane, nitrous oxide and the halocarbons, J. Geophys. Res.-Atmos., 100, 16519–16535, https://doi.org/10.1029/95JD01386, 1995.
Clough, S., Shephard, M., Mlawer, E., Delamere, J., Iacono, M., Cady-Pereira, K., Boukabara, S., and Brown, P.: Atmospheric radiative transfer modeling: a summary of the AER codes, J. Q. Sp. Ra. T., 91, 233–244, https://doi.org/10.1016/j.jqsrt.2004.05.058, 2005.
Cox, C., Harries, J., Taylor, J., Green, P., Baran, A., Pickering, J., Last, A., and Murray, J.: Measurement and simulation of mid- and far-infrared spectra in the presence of cirrus, Q. J. R. Meteorol. Soc., 136, 718–739, https://doi.org/10.1002/qj.596, 2010.
Dee, D. P., Uppala, S. M., Simmons, A. J., , Berrisford, P., Poli, P., Kobayashi, S., Andrae, U., Balmaseda, M. A., Balsamo, G., Bauer, P., Bechtold, P., Beljaars, A. C. M., van de Berg, L., Bidlot, J., Bormann, N., Delsol, C., Dragani, R., Fuentes, M., Geer, A. J., Haimberger, L., Healy, S. B., Hersbach, H., Holm, E. V., Isaksen, L., Kallberg, P., Kohlera, M., Matricardi, M., McNally, A. P., Monge-Sanz, B. M., Morcrette, J. -J., Park, B. K. , Peubey, C., deRosnay, P., Tavolato, C., Thepaut, J. -N., and Vitart, F.: The ERA-Interim reanalysis: configuration and performance of the data assimilation system, Q. J. R. Meteorol. Soc., 137, 553–597, https://doi.org/10.1002/qj.828, 2011.
Dessler, A. E. and Yang, P.: The distribution of tropical thin cirrus clouds inferred from Terra MODIS data, J. Clim., 16, 1241–1247, 2003.
Di Natale, G., Palchetti, L., Bianchini, G., and Del Guasta, M.: Simultaneous retrieval of water vapour, temperature and cirrus clouds properties from measurements of far infrared spectral radiance over the Antarctic Plateau, Atmos. Meas. Tech., 10, 825–837, https://doi.org/10.5194/amt-10-825-2017, 2017.
Dlugokencky, E. J., Mund, J. W., Crotwell, A. M., Crotwell, M. J., and Thoning, K. W.: Atmospheric Carbon Dioxide Dry Air Mole Fractions from the NOAA GML Carbon Cycle Cooperative Global Air Sampling Network, 1968–2019, Version: 2019-07, https://doi.org/10.15138/wkgj-f215, 2019.
Edwards, J. M. and Slingo, A.: Studies with a flexible new radiation code, I: Choosing a configuration for a large-scale model, Q. J. Roy. Meteorol. Soc., 122, 689–719, https://doi.org/10.1002/qj.49712253107, 1996.
Elsasser, W. M.: Heat Transfer by Infrared Radiation in the Atmosphere, Vol. 6, Harvard Meteorological Studies, Harvard University Press, 107 pp., 1942.
Fox, S., Mendrok, J., Eriksson, P., Ekelund, R., O'Shea, S. J., Bower, K. N., Baran, A. J., Harlow, R. C., and Pickering, J. C.: Airborne validation of radiative transfer modelling of ice clouds at millimetre and sub-millimetre wavelengths, Atmos. Meas. Tech., 12, 1599–1617, https://doi.org/10.5194/amt-12-1599-2019, 2019.
Gouveia, D. A., Barja, B., Barbosa, H. M. J., Seifert, P., Baars, H., Pauliquevis, T., and Artaxo, P.: Optical and geometrical properties of cirrus clouds in Amazonia derived from 1 year of ground-based lidar measurements, Atmos. Chem. Phys., 17, 3619–3636, https://doi.org/10.5194/acp-17-3619-2017, 2017.
Harries, J., Carli, B., Rizzi, R., Serio, C., Mlynczak, M., Palchetti, L., Maestri, T., Brindley, H., and Masiello, G.: The far-infrared Earth, Rev. Geophys., 46, RG4004, https://doi.org/10.1029/2007RG000233, 2008.
Heymsfield, A. J., Protat, A., Austin, R. T., Bouniol, D., Hogan, R. J., Delanoe, J., Okamoto, H., Sato., K., Van Zadelhoff, G.-J., Donovan, D. P., and Wang, Z.: Testing IWC retrieval methods using radar and ancillary measurements with in situ data, J. Appl. Meteorol. Clim., 47, 135–163, https://doi.org/10.1175/2007JAMC1606.1, 2008.
Heymsfield, A. J., Schmitt, C., and Bansemer, A.: Ice cloud particle size distributions and pressure dependent terminal velocities from in situ observations at temperatures from 0∘ to −86 ∘C, J. Atmos. Sci., 70, 4123–4154, https://doi.org/10.1175/JAS-D-12-0124.1, 2013.
Hong, Y. and Liu, G.: The characteristics of ice cloud properties derived from CloudSat and CALIPSO measurements, J. Clim., 28, 3880–3901, https://doi.org/10.1175/JCLI-D-14-00666.1, 2015.
Hong, Y., Liu, G., and Li, J. F.: Assessing the radiative effects of global ice clouds based on CloudSat and CALIPSO measurements, J. Clim., 29, 7651–7674, https://doi.org/10.1175/JCLI-D-15-0799.1, 2016.
Iwabuchi, H. and Yang, P.: Temperature dependence of ice optical constants: Implications for simulating the single-scattering properties of cold ice clouds, J. Q. Sp. Rad. T., 112, 2520–2525, 2011.
Kuo, C.-P., Yang, P., Huang, X., Feldman, D., Flanner, M., Kuo, C., and Mlawer, E. J.: Impact of multiple scattering on longwave radiative transfer involving clouds, J. Adv. Model. Earth Syst., 9, 3082–3098, https://doi.org/10.1002/2017MS001117, 2017.
Lawson, R., O'Connor, D., Zmarzly, P., Weaver, K., Baker, B., and Mo, Q.: The 2D-S (Stereo) Probe: Design and Preliminary Tests of a New Airborne, High-Speed, High-Resolution Particle Imaging Probe, J. Atmos. Ocean. Technol., 23, 1462–1477, 2006.
Libois, Q. and Blanchet, J. -P.: Added value of far-infrared radiometry for remote sensing of ice clouds, J. Geophys. Res.-Atmos., 122, 6541–6564, https://doi.org/10.1002/2016JD026423, 2017.
Loeb, N. G., Yang, P., Rose, F. G., Hong, G., Sun-Mack, S., Minnis, P., Kato, S., Ham, S. -H., Smith, J., Hioki, S., and Tang, G.: Impact of ice cloud microphysics on satellite cloud retrievals and broadband flux radiative transfer model calculations, J. Clim., 31, 1851–1864, https://doi.org/10.1175/JCLI-D-17-0426.1, 2018.
Maestri, T.: Spectral infrared analysis of a cirrus cloud based on Airborne Research Interferometer Evaluation System (ARIES) measurements, J. Geophys. Res., 110, D06111, https://doi.org/10.1029/2004JD005098, 2005.
Maestri, T. and Rizzi, R.: A study of infrared diabatic forcing of ice clouds in the tropical atmosphere, J. Geophys. Res., 108, 4139, https://doi.org/10.1029/2002JD002146, 2003.
Maestri, T., Rizzi, R., Tosi, E., Veglio, P., Palchetti, L., Bianchini, G., Di Girolamo, P., Masiello, G., Serio, C., and Summa, D.: Analysis of cirrus cloud spectral signatures in the far infrared, J. Q. Sp. Ra. T., 141, 49–64, https://doi.org/10.1016/j.jqsrt.2014.02.030, 2014.
Maestri, T., Arosio, C., Rizzi, R., Palchetti, L., Bianchini, G., and Del Guasta, M.: Antarctic ice cloud identification and properties using downwelling spectral radiance from 100 to 1,400 cm−1, J. Geophys. Res.-Atmos., 124, 4761–4781, 2019.
Marenco, F.: Capabilities and operation of the FAAM EZlidar, Met Office OBR Tech. Note, no. 79, 18 pp., 2010.
Marenco, F., Johnson, B., Turnbull, K., Newman, S., Haywood, J., Webster, H., and Ricketts, H.: Airborne lidar observations of the 2010 Eyjafjallajökull volcanic ash plume, J. Geophys. Res.-Atmos., J. Geophys. Res., 116, D00U05, https://doi.org/10.1029/2011JD016396, 2011.
Masuda, K., Takashima, T., and Takayama, Y.: Emissivity of pure and sea waters for the model sea surface in the infrared window regions, Remote Sens. Environ., 24, 313–329, 1988.
Mlawer, E. J., Turner, D. D., Paine, S. N., Palchetti, L., Bianchini, G., Payne, V. H., Cady-Pereira, K. E., Pernak, R. L., Alvarado, M. J., Gombos, D., Delamere, J. S., and Mlynczak, M. G.: Analysis of water vapour absorption in the Far-infrared and submillimeter regions using surface radiometric measurements from extremely dry location. J. Geophys. Res.-Atmos., 124, 8134–8160, https://doi.org/10.1029/2018JD029508, 2019.
O'Shea, S. J., Choularton, T. W., Lloyd, G., Crosier, J., Bower, K. N., Gallagher, M., Abel, S. J., Cotton, R. J., Brown, P. R. A., Fugal, J. P., Schlenczek, O., Borrmann, S., and Pickering, J. C.: Airborne observations of the microphysical structure of two contrasting cirrus clouds, J. Geophys. Res.-Atmos., 121, 13510–13536, https://doi.org/10.1002/2016JD025278, 2016.
Palchetti, L., Di Natale, G., and Bianchini, G.: Remote sensing of cirrus cloud microphysical properties using spectral measurements over the full range of their thermal emission: Cirrus cloud far IR signature, J. Geophys. Res.-Atmos., 121, 10804–10819, https://doi.org/10.1002/2016JD025162, 2016.
Platnick, S., Meyer, K. G., King, M. D., Wind, G., Amarasinghe, N., Marchant, B., Arnold, G. T., Zhang, Z., Hubanks, P. A., Holz, R. E., Yang, P., Ridgway, W. L., and Riedi, J.: The MODIS cloud optical and microphysical products: Collection 6 updates and examples from Terra and Aqua, IEEE Trans. Geosci. Remote Sens., 55, 502–525, https://doi.org/10.1109/TGRS.2016.2610522, 2017.
Rothman, L. S., Gordon, I. E., Babikov, Y., et al.: The HITRAN 2012 molecular spectroscopic database, J. Q. Sp. Ra. T., 130, 4–50, 2013.
Saito, M., Yang, P., Huang, X., Brindley, H. E., Mlynczak, M. G., and Kahn, B. H.: Spaceborne mid- and far-infrared observations improving nighttime ice cloud property retrievals, Geophys. Res. Lett., 47, e2020GL087491, https://doi.org/10.1029/2020GL087491, 2020.
Stamnes, K., Tsay, S.-C., and Laszlo, I.: DISORT, a General-Purpose Fortran Program for Discrete-Ordinate-Method Radiative Transfer in Scattering and Emitting Layered Media: Documentation of Methodology, DISORT Report v1.1 available at: http://www.libradtran.org/lib/exe/fetch.php?media=disortreport1.1.pdf (last access: 28 October 2020), 2000.
Turner, D. D.: Arctic mixed-phase cloud properties from AERI-lidar observations: Algorithm and results from SHEBA, J. Appl. Meteorol., 44, 427–444, https://doi.org/10.1175/JAM2208.1, 2005.
Turner, D. D., Shupe, M. D., and Zwink, A. B.: Characteristic atmospheric radiative heating rate profiles in Arctic clouds as observed at Barrow, Alaska, J. Appl. Meteorol. Clim., 57, 953–968, https://doi.org/10.1175/JAMC-D-17-0252.1, 2018.
Vaisala: Vaisala Dropsonde RD94 Technical Datasheet, available at: https://www.vaisala.com/sites/default/files/documents/RD94-Datasheet-B210936EN-B.pdf (last access: 28 October 2020) 2010.
van Diedenhoven, B. and Cairns, B.: A flexible parameterization for shortwave and longwave optical properties of ice crystals and derived bulk optical properties for climate models, J. Atmos. Sci., 77, 1245–1260, https://doi.org/10.1175/JAS-D-19-0193.1, 2020.
Voigt, C., Schumann, U., and Minikin, A.: ML-CIRRUS, The airborne experiment on natural cirrus and contrail cirrus with the high-altitude long-range research aircraft HALO, Bull. Am. Meteorol. Soc., 98, 271–288, https://doi.org/10.1175/BAMS-D-15-00213.1, 2017.
Wilson, S., Atkinson, N., and Smith, J.: The development of an airborne infrared interferometer for meteorological sounding studies, J. Atmos. Ocean. Tech., 16, 1912–1927, 1999.
Yang, H., Dobbie, S., Herbert, R., Connolly, P., Gallagher, M., Ghosh, S., Al-Jumur, S., and Clayton, J.: The effect of observed vertical structure, habits, and size distributions on the solar radiative properties and cloud evolution of cirrus clouds, Q. J. R. Meteorol. Soc., 138, 1221–1232, https://doi.org/10.1002/qj.973, 2012.
Yang, P.: Spectral signature of ice clouds in the far-infrared region: Single-scattering calculations and radiative sensitivity study, J. Geophys. Res., 108, 4569, https://doi.org/10.1029/2002JD003291, 2003.
Yang, P., Kattawar, G., Hong, G., Minnis, P., and Hu, Y.-X.: Uncertainties Associated With the Surface Texture of Ice Particles in Satellite-Based Retrieval of Cirrus Clouds – Part I: Single-Scattering Properties of Ice Crystals With Surface Roughness, IEEE Trans. Geosci. Remote Sens., 46, 1940–1947, https://doi.org/10.1109/TGRS.2008.916471, 2008.
Yang, P., Bi, L., Baum, B. A., Liou, K-N., Kattawar, G. W., Mishchenko, M. I., and Cole, B.: Spectrally consistent scattering, absorption, and polarization properties of atmospheric ice crystals at wavelengths from 0.2 to 100 µm, J. Atmos. Sci., 70, 330–347, 2013.
Yang, P., Liou, K.-N. , Bi, L., Liu, C., Yi, B., and Baum, B. A.: On the radiative properties of ice clouds: Light scattering, remote sensing and radiation parameterization, Adv. Atmos. Sci., 32, 32–63, https://doi.org/10.1007/s00376-014-0011-z, 2015.
Yang, P., Hioki, S., Saito, M., Kuo, C.-P., Baum, B. A., and Liou, K.-N.: A review of ice cloud optical property models for passive satellite remote sensing, Atmosphere, 9, 1–31, https://doi.org/10.3390/atmos9120499, 2018.
Young, S. A., Vaughan, M. A., Kuehn, R. E., and Winker, D. M.: The Retrieval of Profiles of Particulate Extinction from Cloud-Aerosol Lidar and Infrared Pathfinder Satellite Observations (CALIPSO) Data: Uncertainty and Error Sensitivity Analyses, J. Atmos. Ocean. Tech., 30, 395–428, https://doi.org/10.1175/JTECH-D-12-00046.1, 2013.
Zhang, Y., Macke, A., and Albers, F.: Effect of crystal size spectrum and crystal shape on stratiform cirrus radiative forcing, Atmos. Res., 52, 59–75, https://doi.org/10.1016/S0169-8095(99)00026-5, 1999.