the Creative Commons Attribution 4.0 License.
the Creative Commons Attribution 4.0 License.
 | 04 Nov 2020
Size-segregated particle number and mass concentrations from different emission sources in urban Beijing
Jing Cai
Liine M. Heikkinen
Feixue Zheng
Chang Li
Xiaolong Fan
Shaojun Zhang
Daoyuan Yang
Yonghong Wang
Tom V. Kokkonen
Tommy Chan
Ying Zhou
Lubna Dada
Yongchun Liu
Pauli Paasonen
Joni T. Kujansuu
Tuukka Petäjä
Claudia Mohr
Juha Kangasluoma
Federico Bianchi
Philip L. Croteau
Douglas R. Worsnop
Veli-Matti Kerminen
Markku Kulmala
Kaspar R. Daellenbach
Although secondary particulate matter is reported to be the main contributor of PM2.5 during haze in Chinese megacities, primary particle emissions also affect particle concentrations. In order to improve estimates of the contribution of primary sources to the particle number and mass concentrations, we performed source apportionment analyses using both chemical fingerprints and particle size distributions measured at the same site in urban Beijing from April to July 2018. Both methods resolved factors related to primary emissions, including vehicular emissions and cooking emissions, which together make up 76 % and 24 % of total particle number and organic aerosol (OA) mass, respectively. Similar source types, including particles related to vehicular emissions (1.6±1.1 µg m−3; cm−3 and cm−3 for two traffic-related components), cooking emissions (2.6±1.9 µg m−3 and cm−3) and secondary aerosols (51±41 µg m−3 and cm−3), were resolved by both methods. Converted mass concentrations from particle size distributions components were comparable with those from chemical fingerprints. Size distribution source apportionment separated vehicular emissions into a component with a mode diameter of 20 nm (“traffic-ultrafine”) and a component with a mode diameter of 100 nm (“traffic-fine”). Consistent with similar day- and nighttime diesel vehicle PM2.5 emissions estimated for the Beijing area, traffic-fine particles, hydrocarbon-like OA (HOA, traffic-related factor resulting from source apportionment using chemical fingerprints) and black carbon (BC) showed similar diurnal patterns, with higher concentrations during the night and morning than during the afternoon when the boundary layer is higher. Traffic-ultrafine particles showed the highest concentrations during the rush-hour period, suggesting a prominent role of local gasoline vehicle emissions. In the absence of new particle formation, our results show that vehicular-related emissions (14 % and 30 % for ultrafine and fine particles, respectively) and cooking-activity-related emissions (32 %) dominate the particle number concentration, while secondary particulate matter (over 80 %) governs PM2.5 mass during the non-heating season in Beijing.
- Article
(2928 KB) - Full-text XML
-
Supplement
(2981 KB) - BibTeX
- EndNote


Even though it is commonly recognized that secondary aerosol mass governs haze formation in megacities in China (Huang et al., 2014; Zhang et al., 2013; Tao et al., 2017; Sun et al., 2018), the contributions of primary (direct) particle sources cannot be neglected. Previous studies have demonstrated that primary emission sources, such as residential heating, traffic and cooking activities, can contribute significantly to both particle number and mass concentrations in the urban atmosphere in China (He et al., 2004a; Xu et al., 2014; Du et al., 2017; Wang et al., 2013; Sun et al., 2018). It was recently reported that traffic could be a major source of nanoclusters (sub-3 nm) in urban environments (Ronkko et al., 2017). On average, 13 %–24 % of the total fine organic aerosol (OA) mass concentration can be attributed to cooking activities and 11 %–20 % to traffic emissions in Beijing, China (Hu et al., 2016, 2017). Together with direct particle emissions, many identified primary sources co-emit high concentrations of volatile organic compounds (VOCs), which in turn contribute to secondary organic aerosol (SOA) mass formation (T. Liu et al., 2017a, b). Therefore, it is important to identify primary particle sources and disentangle them from the secondary organic and inorganic aerosol (SOA and SIA) whose precursors were co-emitted, with the goal to better understand their contributions in highly complex urban atmospheres for advising air pollution control policies.
Beijing, a megacity with a population of 20 million, has suffered from severe fine particulate matter (PM) pollution for several decades (He et al., 2001; Tao et al., 2017). Due to its impact on human health and the climate, fine particulate matter has gained increased attention (Lelieveld et al., 2015; Huang et al., 2014). To study the fine PM sources in Beijing, numerous receptor source apportionment studies have been conducted (Ding et al., 2016; Tao et al., 2017; Hu et al., 2016; Zhang et al., 2013). These studies can be grouped into two approaches: the widely applied chemical component method (Xu et al., 2019; Hu et al., 2017; Sun et al., 2013b, 2018) and the less-applied size distribution method (Wang et al., 2013; Z. Liu et al., 2017; Du et al., 2017), based on the variations of chemical component and size distribution of fine PM from different sources, respectively.
Most of the aforementioned source apportionment studies in Beijing based on the chemical component method used data from online or offline measurements for receptor models, such as positive matrix factorization (PMF) and chemical mass balance (CMB) (Zhang et al., 2013; Y. Zhang et al., 2017; Tao et al., 2017). Among them, many focused on the sources of OA due to its large contribution to fine PM, its complex mix of origins and its tracers from different sources. The development of aerosol mass spectrometer technologies has allowed identification of the primary sources of OA in Beijing, namely traffic emissions, cooking activities, biomass burning and coal combustion (Xu et al., 2019; Hu et al., 2017; Sun et al., 2013b, 2018). Generally, in OA source apportionment using chemical fingerprints from mass spectrometers (aerosol chemical speciation monitor, ACSM, and aerosol mass spectrometer, AMS), particle size distributions are disregarded. Results of source contributions focus on mass and not on number, which has however shown to be of importance from a health perspective as well. Aerosol mass spectrometers are blind to particles smaller than ∼70 nm (Xu et al., 2017). Apportioning smaller particles to their sources is therefore crucial for air quality mitigation.
Size-distribution-based source apportionment can provide, though less applied and with more uncertainties, size-segregated particle number concentrations of sources and processes. Until now, size distribution source apportionment has successfully been applied to data from US, European and Chinese cities, such as London (Harrison et al., 2011; Beddows and Harrison, 2019), New York (Ogulei et al., 2007), Barcelona (Vu et al., 2015) and Beijing (Wang et al., 2013; Du et al., 2017; Liu et al., 2014). Different sources, such as different types of traffic, cooking, road dust, combustion, resuspension and secondary sulfate and nitrate have been identified in Beijing by this approach (Du et al., 2017; Liu et al., 2014; Vu et al., 2015; Wang et al., 2013). The application of size PMF from previous literature is summarized in Table S1 in the Supplement. Yet, until now, very few studies have combined particle number size distribution source apportionment with chemical speciation source apportionment and compared their results in a comprehensive manner. In general, size-distribution-based source apportionment results tend to lack validation as well as comparison to other methods, which results in larger uncertainties and a necessity to combine it with chemical speciation source apportionment.
In this study, we aim to better constrain the chemical and physical properties of primary organic aerosol in Beijing using particle number size distribution and chemical speciation source apportionment approaches. We applied both chemical fingerprints (OA PMF) and particle size distribution (size PMF) analyses to resolve the particle mass and number contributions from various sources during the same period. Combining physical information with chemical characterization is crucial for studies on health and atmospheric pollution. In the complex atmosphere of Beijing, we found that on days with no signs of new particle formation (NPF), primary emissions, from for example traffic and cooking, contributed most to the particle number concentration below 100 nm, while secondary mass formation dominated the total particle mass concentration.
2.1 Measurement site and instrumentation
The sampling site is located in the west campus of Beijing University of Chemical Technology (BUCT; 39∘56′31′′ N, 116∘17′50′′ E), near the west 3rd Ring Road of Beijing. The measurement station is located on the top floor of a five-floor teaching building (about 20 ). The sampling site is surrounded by residential areas with possible local emissions, such as from traffic, commercial and domestic cooking sources. The station can be viewed as a typical urban residential site in Beijing. Detailed information of the sampling site can be found in Zhou et al. (2020). Our sampling period was from 6 April to 2 July 2018 (84 d), which is outside the heating period (usually mid-November to mid-March). Ambient daily average temperature ranged between 8.2 and 34 ∘C during the sampling period. A few days were excluded due to necessary calibrations and power cuts (27 April and 5–13 June for size distribution and 26–29 April, 11–12 June and 26–27 June for chemical component measurement). In our study, we did not find contributions of residential coal combustion and biomass burning for cooking and heating (Fig. S5 and Sect. S2.2 in the Supplement). Coal and biomass burning, from the residential sectors, are more important during winter in Beijing and the North China Plain (Hu et al., 2017; Sun et al., 2018). In addition, the transition in energy consumption from coal burning to natural gas and electricity in urban Beijing took place from the years 2009 to 2017, which led to a decrease in the proportion of coal to total primary energy consumption from 43 % in 2007 to less than 20 % in 2015 (Zhang et al., 2018). The effects of residential coal combustion and biomass burning were not strong during our sampling period, which is supported by the chemical component measurements (more supporting information is provided in Sect. 3.2 and Figs. S5 and S12 in the Supplement).
An online Time-of-Flight Aerosol Chemical Speciation Monitor (ToF-ACSM; Aerodyne Research Inc.) equipped with a PM2.5 lens and standard vaporizer was operated at the BUCT site. A PM2.5 cyclone was deployed on the rooftop with a flow rate of 3 L min−1 and connected to the ToF-ACSM by a 3 m stainless steel tube through a Nafion dryer (Perma Pure, MD-700-24F-3). The use of the ToF-ACSM and related techniques have been widely used to measure the concentrations of non-refractory (NR) PM components, including sulfate, nitrate, ammonium, organics and chloride, and to identify sources of fine PM in different environments around the world (Crippa et al., 2014; Huang et al., 2014; Jimenez et al., 2009; Zhang et al., 2011). The black carbon (BC) component of PM2.5 was measured by a co-located 7-wavelength aethalometer (AE33, Magee Scientific Corp.) with a sampling flow rate of 1 L min−1. To measure gas-phase tracers, a nitrate Chemical Ionization–Atmospheric Pressure interface–Time of Flight mass spectrometer (nitrate CI-APi-TOF, Aerodyne Research Inc.) was also deployed at the same station from 28 May to 10 June 2018 (Jokinen et al., 2012).
Size-resolved particle number concentrations (size range 20 to 680 nm) were measured with a scanning mobility particle sizer (SMPS; Model 3936, TSI Corp.) at a 5 min time resolution. The SMPS was equipped with a long differential mobility analyzer (LDMA; Model 3080, TSI Corp.) and a condensation particle counter (CPC; Model 3775, TSI Corp.) with a sampling flow rate of 0.3 L min−1, as well as with a PM2.5 cyclone. To reduce sampling losses, an extra pump (flow rate of 16.7 L min−1) was used, which resulted in a residence time in the sampling lines shorter than 1.2 s. The atmospheric boundary layer height (BLH) was measured from the optical backscattering of the ceilometer observations (CL-51, Vaisala Inc.) by applying a three-step idealized profile proposed by Eresmaa et al. (2012). Trace gases, including CO, SO2, NOx and O3, were also measured at the same site (48i, 43i-TLE, 42i, and 49i, Thermo Environmental Instruments Inc.). Total PM2.5 and PM10 concentrations used in this study were measured by the China National Environmental Monitoring Center (CNEMC) and averaged over the four nearest monitoring stations of Wanliu, Gucheng, Wanshouxigong and Guanyuan.
In this study, the SMPS and ToF-ACSM cover the size ranges of 20 to 680 nm and ∼100 to ∼2500 nm, respectively (Xu et al., 2017). In addition, the SMPS measures the mobility diameter (Dm) of particles, while the ToF-ACSM uses the vacuum aerodynamic diameter (Dva) for defining the measurement particle size range. Since we used both these instruments for our study, we had to determine the overlapping size range of these two instruments. For spherical particles, Dva is assumed to be roughly equal to Dm multiplied by the particle chemical component density (ρcomp) (DeCarlo et al., 2004). According to the calculations of ρcomp shown below, the overlapping Dva size range was found to be around 100–1000 nm, which is the dominant size range of PM2.5.
We estimated ρcomp using Eq. (1) (Salcedo et al., 2006):
where NO3, SO4, NH4, Cl, Org and BC are the hourly concentrations of nitrate, sulfate, ammonium, chloride, organics and BC measured by the ToF-ACSM and aethalometer. The densities of ammonium nitrate and ammonium sulfate, ammonium chloride, organic aerosols and BC were assumed to be equal to 1.75, 1.52, 1.77 and 1.2 g cm−3, respectively (Park et al., 2004; Poulain et al., 2014; Turpin and Lim, 2001). Through this method, we calculated time- and chemical-component-dependent densities of particles. The obtained densities were used to convert the Dm diameters from the SMPS measurements into Dva and to calculate size-segregated mass concentrations from particle number size distributions. The SMPS and ToF-ACSM instruments compared well with each other when using the calculated densities and assuming spherical particles (Fig. S1 in the Supplement). The calculated mass concentration from SMPS (PMSMPS) agreed well with NR-PM2.5 plus BC during non-NPF days, which were used for source apportionment (PM, r=0.94; Fig. 1a). The slope between these two concentrations decreased at high PM2.5 levels, which was likely due to an increasing fraction of particles larger than the SMPS size range during the haze periods. Overall, the good comparison suggests a stable performance of both instruments during the sampling period. We may, therefore, conclude that the overlapping size range of the two instruments was validated. Mineral particles (from, e.g., dust storms) are not measured by the ToF-ACSM and likely not by the SMPS (with an upper size cutoff at around 700 and 1000 nm Dm and Dva, respectively) due to their sizes (Zhang et al., 2003).
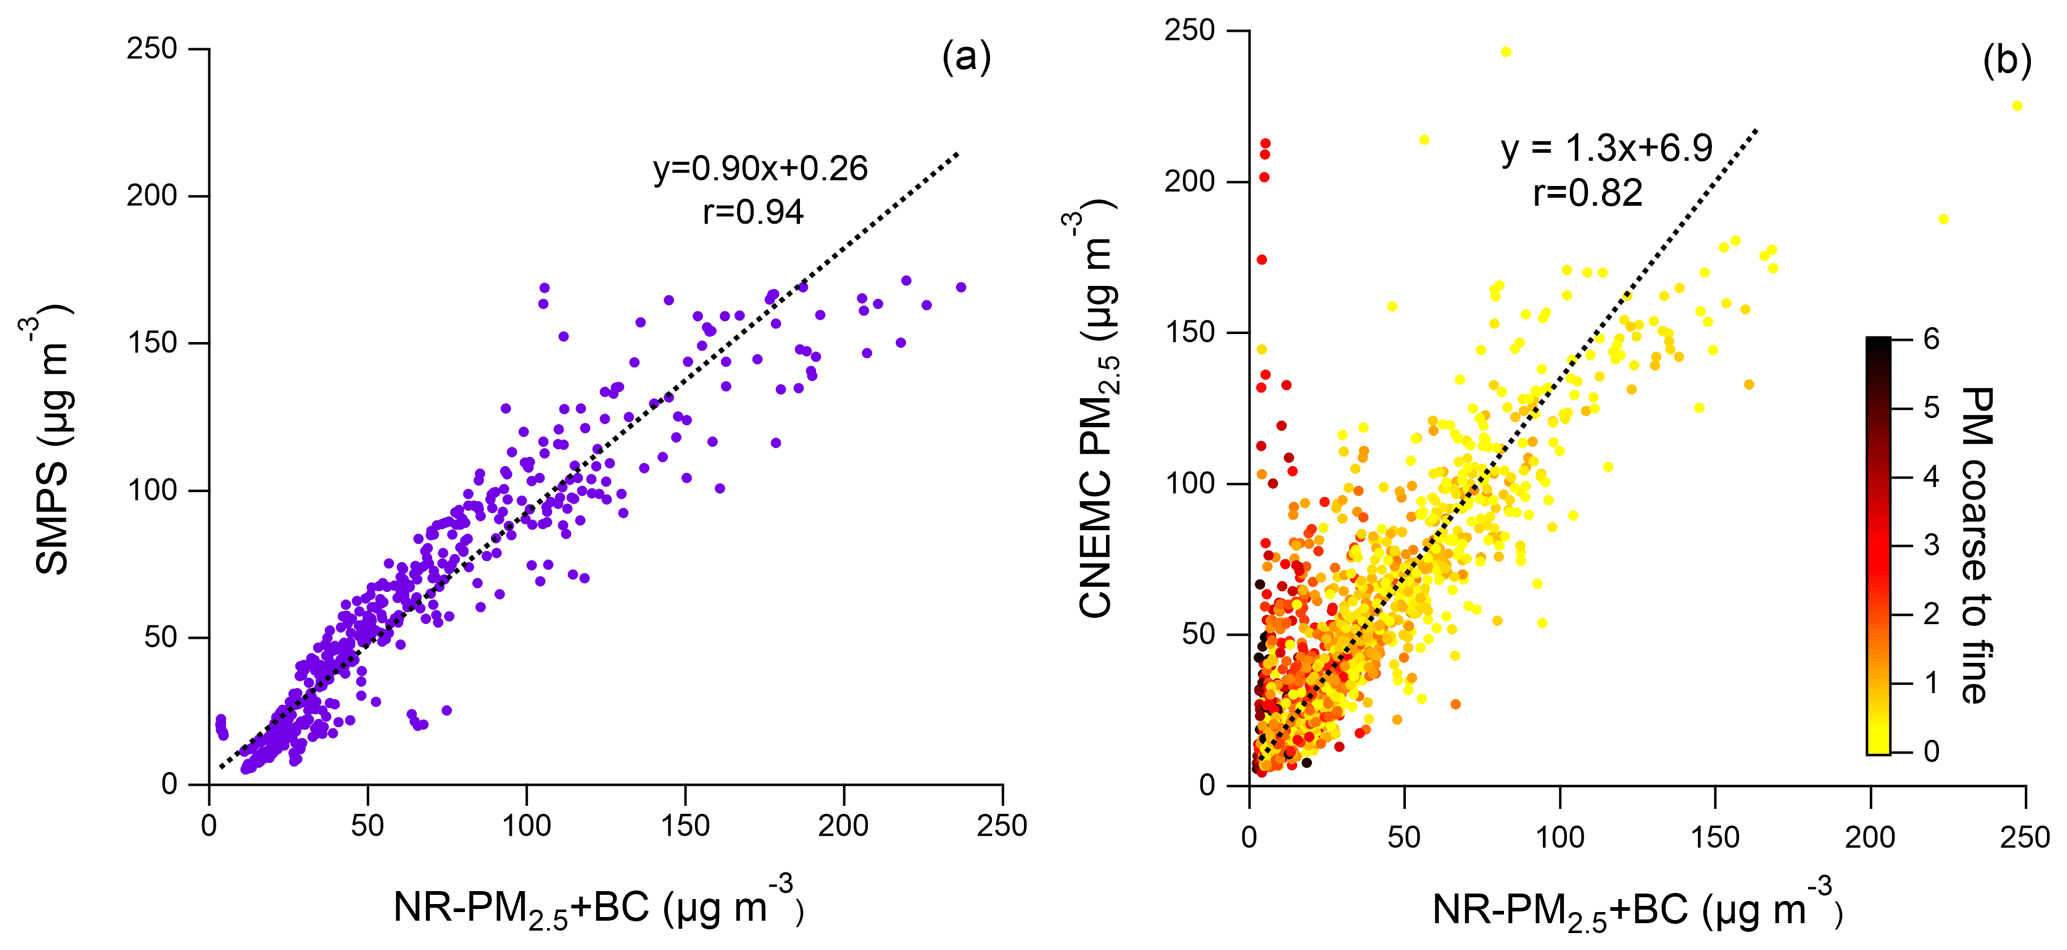
Figure 1Scatterplot of (a) calculated PM mass concentration of SMPS and measured NR-PM2.5+BC. (b) Comparison between CNEMC PM2.5 and NR-PM2.5+BC during the sampling period. PMcoarse to fine is defined as the ratio of ( measured at CNEMC.
2.2 Data treatment and source apportionment analysis
Non-refractory PM2.5 (NR-PM2.5), which includes sulfate, nitrate, ammonium, organics and chloride, was obtained by using the standard ToF-ACSM data analysis software (Tofware ver. 2.5.13) within IgorPro ver. 6.3.7.2 (Wavemetrics). The relative ionization efficiencies (RIEs) for sulfate, nitrate, ammonium, chloride and organics applied were 0.86, 1.05, 4.0, 1.5 and 1.4, respectively. Among those, the RIEs of ammonium, sulfate and chloride were determined by calibrations with pure standards. The good ion balance during the sampling period suggests those RIEs to be acceptable (NH, r=1.0). A chemical-component-dependent collection efficiency (CE) was applied to the ToF-ACSM data with the correction method suggested by Middlebrook et al. (2012). The sum of NR-PM2.5 and BC correlates with PM2.5 from the surrounding measurement sites (CNEMC, r=0.82), except for periods with higher coarse particle concentrations in spring shown by higher ratios of coarse to fine particle mass concentrations (Fig. 1b), particularly pronounced during a dust storm in May 2018. However, the chemically resolved PM2.5 (sum of NR-PM2.5 and BC) accounts overall for 77 % of the bulk PM2.5, indicating the presence of refractory PM such as mineral dust.
In this study, positive matrix factorization (PMF) was applied separately to chemical fingerprints of OA from ToF-ACSM (OA PMF) and particle number concentrations from SMPS datasets (size PMF). For OA PMF, the mass spectra of organics were imported into the Source Finder toolkit (SoFi, ver. 6.8.4), which communicates with the multi-linear engine (ME-2). In this study, the partially constrained method utilizing the a value and pulling equations was applied. Detailed information of SoFi and the a value method is described elsewhere (Canonaco et al., 2013; Daellenbach et al., 2016).
In size PMF, the ambient size-resolved number concentrations measured with an SMPS were imported (total of 106 size bins) to the PMF model (PMF 2, ver. 4.2) (Ulbrich et al., 2009). To better estimate the uncertainties in size PMF, a typical uncertainty estimation method for size-resolved number concentration data was applied (Du et al., 2017; Ogulei et al., 2007). The uncertainties were defined as heuristic errors, σij, which were calculated based on the measurement errors, Sij:
where C1 and C2 are constants with values of 0.01 and 0.1, respectively, which are proposed by Ogulei et al. (2007) according to residual distributions and typically applied in SMPS PMF analyses (Du et al., 2017). X is the measured particle number concentration in the jth size bin at the ith point in time. is the arithmetic average for the jth size bin. In the PMF analysis, size-resolved particle number concentrations were averaged to a 15 min resolution, and NPF days were excluded to better estimate contributions from the primary sources. NPF events were classified by the appearance of nucleation-mode particles showing signs of growth following the methods proposed by Dal Maso et al. (2005) and Kulmala et al. (2012). In this study, the classification relied on the particle number size distribution measured using the SMPS and a complementary NAIS (Neutral cluster and Air Ion Spectrometer, 2–42 nm; Manninen et al., 2011; Mirme and Mirme, 2013) for confirming our classification. Of our sampling period, 39 NPF days were excluded, and exact dates are provided in Table S1 in the Supplement. Haze days were classified based on visibility. When the visibility went below 10 km while the relative humidity did not exceed 90 % for 8 consecutive hours, the day was defined as a haze day (Zhou et al., 2020).
2.3 Traffic emissions
Yang et al. (2019) used real-world traffic observations from major roads in Beijing, including hourly traffic volume, speed and vehicle mix information and the real-time congestion index as well as traffic density modeling to map street-level, hourly traffic data for 2013 and 2017. After several years of traffic monitoring, no significant changes in diurnal traffic patterns were found across various years or seasons (Song et al., 2013; Han et al., 2009). This study used the hourly traffic profiles for the nearest arterial road (Zizhuqiao Road) to represent average traffic conditions close to the monitoring site.
Emissions of PM2.5 from different categories of vehicles in urban Beijing (within 5th Ring Road) and whole Beijing area were estimated using the EMBEV-Link model (Link-level Emission factor Model for the BEijing Vehicle fleet; Yang et al., 2019). This model is based on multiple datasets extracted from the extensive road traffic monitoring network in Beijing, including vehicle speed, traffic volume and fleet types. Speed-dependent emission factors were also applied to estimate the vehicular PM2.5 emissions from different types of vehicles in urban Beijing (within 5th Ring Road) and the Beijing area (whole city area). Detailed information of this model and results can be found in Yang et al. (2019).
3.1 Time variations of fine PM
The temporal variation of size-binned particle number concentration, chemical components of NR-PM2.5 and temperature and relative humidity (RH) for all sampling days are displayed in Fig. 2a, b and c. During the sampling period, frequent new particle formation events occurred, in line with previous studies (Wu et al., 2007; Chu et al., 2019; Zhou et al., 2020). Organic aerosols, nitrate and ammonium were the dominating contributors to the total PM2.5 mass concentration, especially during the haze events, showing the contribution of secondary species to the high PM concentration and haze formation. The sharp decreases of the particle number and mass concentrations in the sampling period can mainly be explained by precipitation. In addition, the strong north wind could also largely decrease the fine particulate matter concentrations such as on 27 May, shown in Fig. 2d. Generally, despite their strong diurnal cycle, the temperature increased from spring to summer during the sampling period. Moreover, PM concentrations appear in general to be elevated at increased RH. This can be attributed to air masses with higher humidity transported from the polluted south, together with heterogeneous secondary PM formation (Cai et al., 2017; Jia et al., 2008).
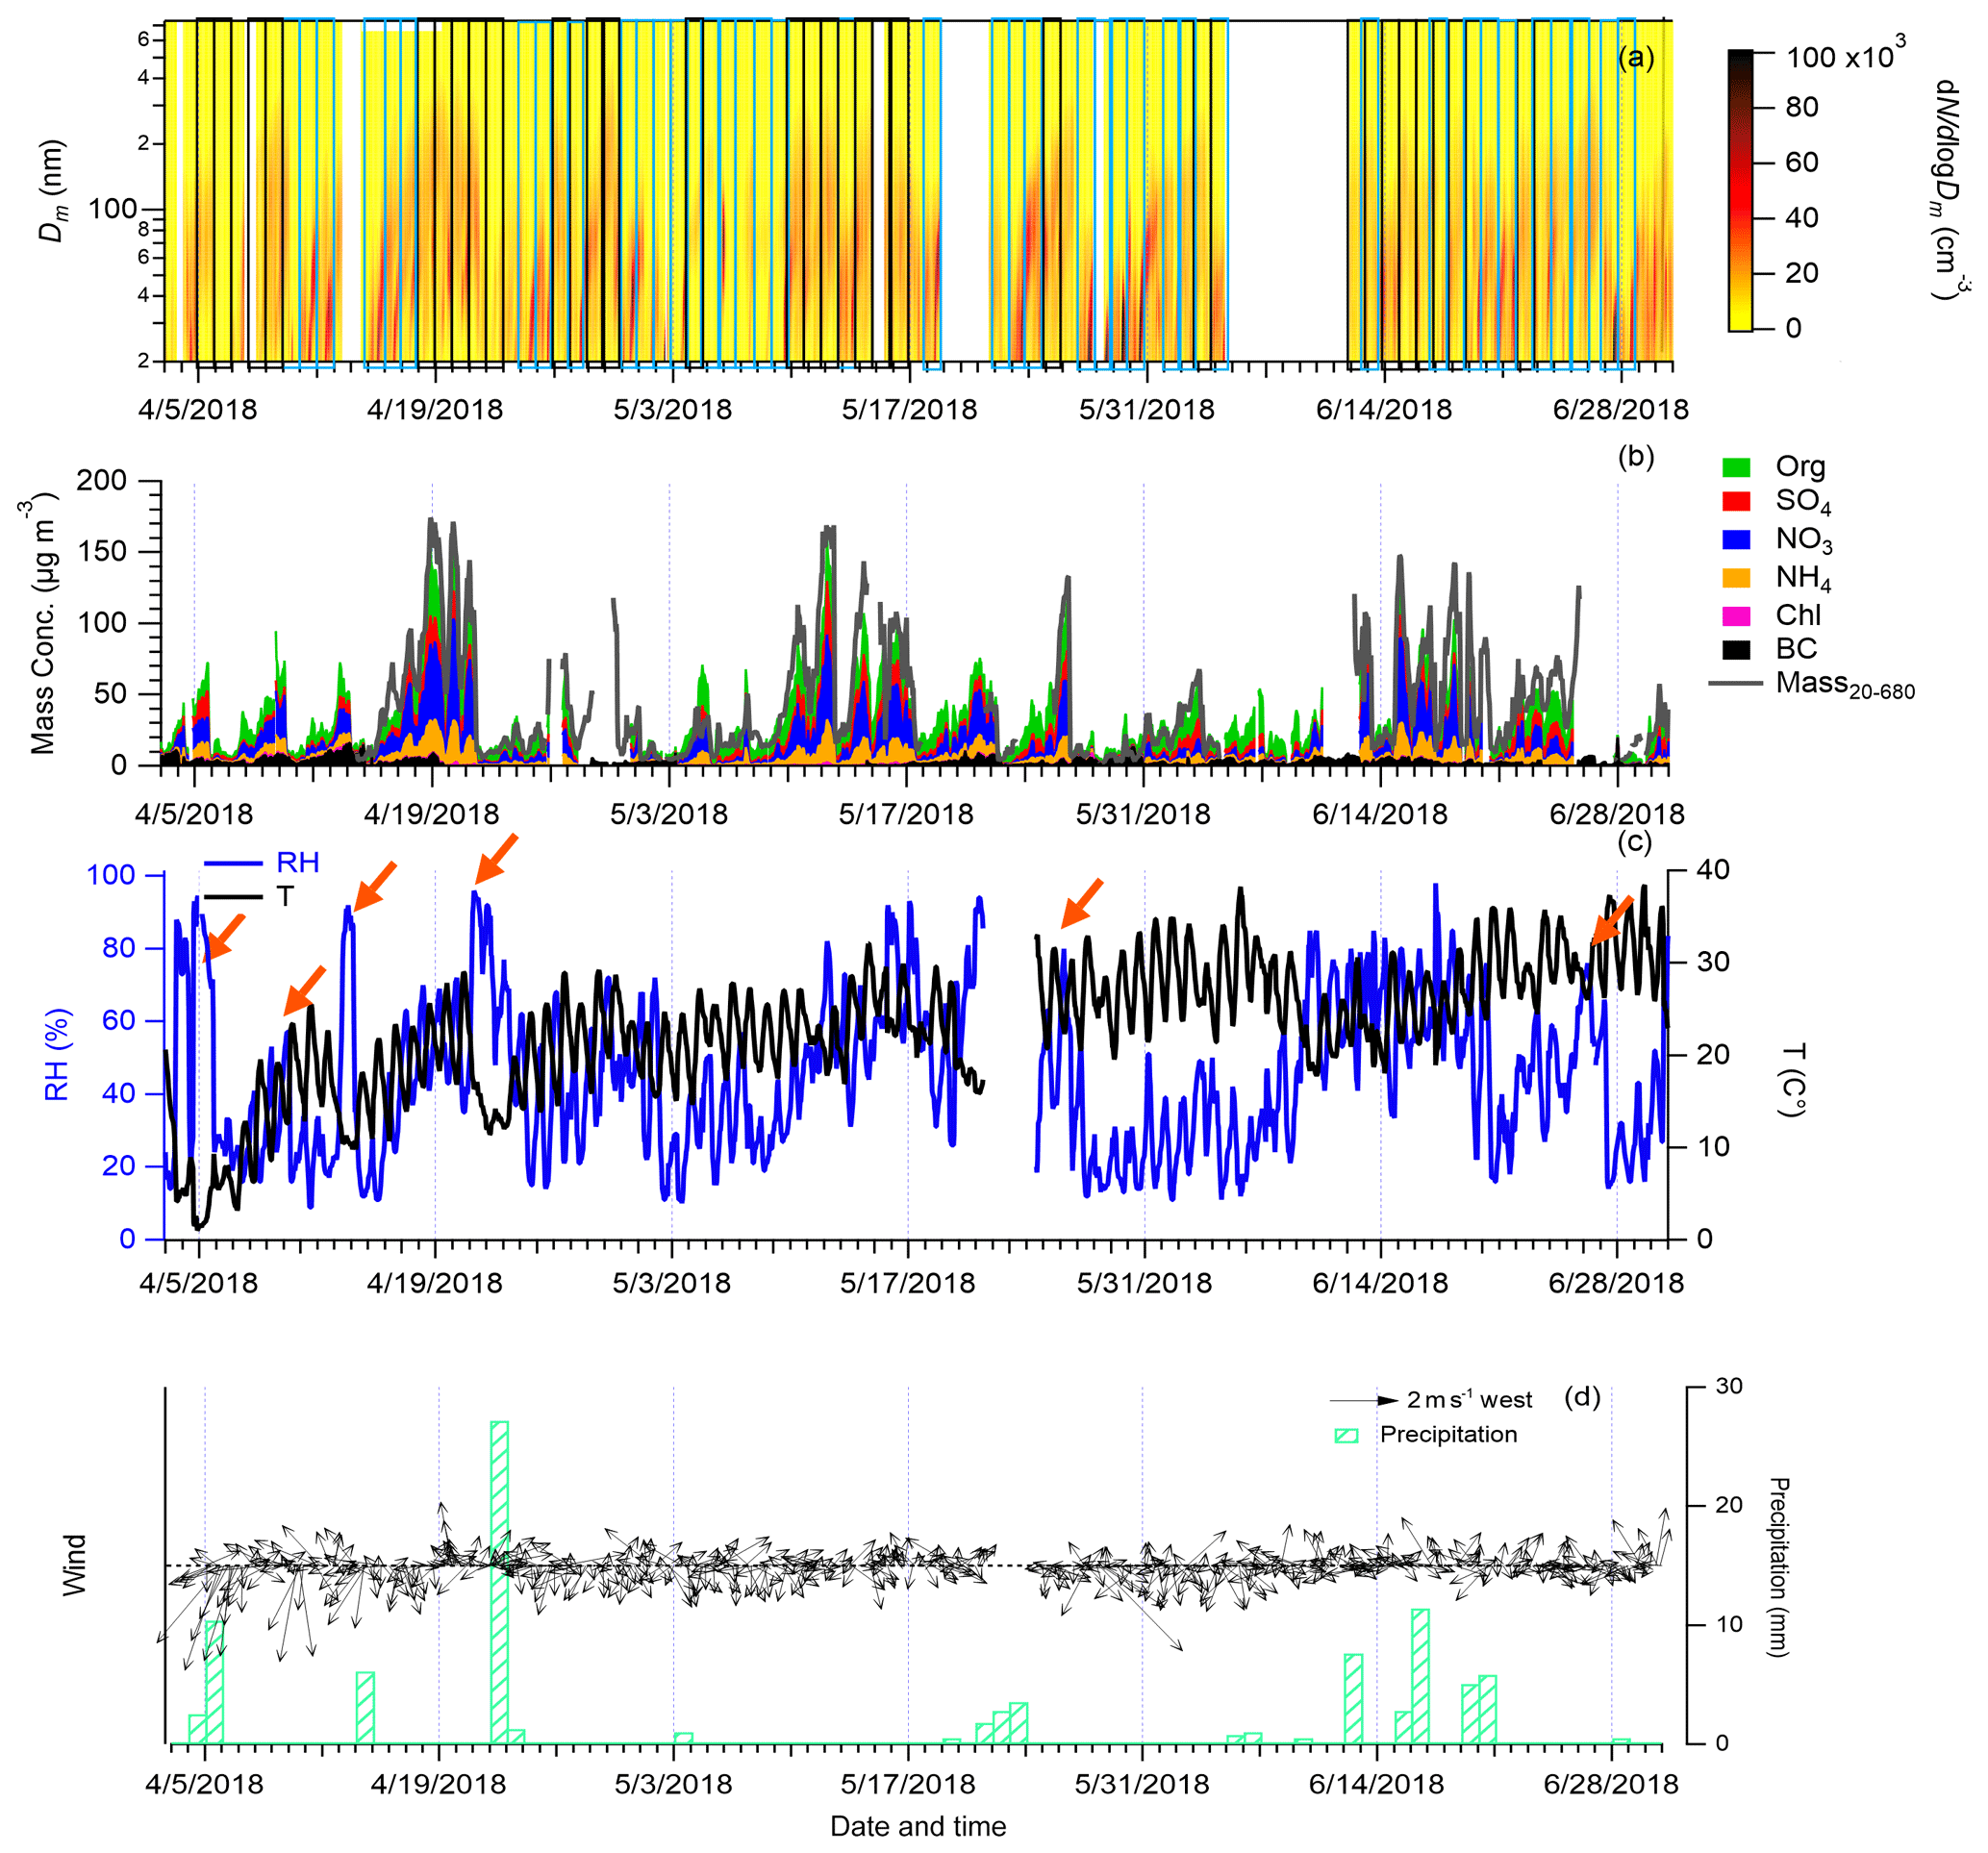
Figure 2Temporal variation of (a) particle number size distribution; NPF and haze days are marked by blue and grey boxes, respectively. (b) Mass concentrations of NR-PM2.5 (including organics, sulfate, nitrate, ammonium and chloride) from ToF-ACSM and BC from AE-33 and the comparison of hourly NR-PM2.5+BC between calculated mass concentrations from SMPS. (c), RH (%) and temperature (∘C); red arrows indicate the arrivals of cold fronts. (d) 3 h averaged wind direction, wind speed (m s−1) and precipitation (precipitation data source: Beijing Nanyuan airport station).
As a result of the effective air pollution control strategies by the Chinese government in the recent years (Cheng et al., 2019; Y. Wang et al., 2019), the average PM2.5 during our sampling period was 56±40 µg m−3 (53±40 µg m−3 for the year of 2018), far lower than the levels from the early 2010s in Beijing (annual average: 135±63 µg m−3 for 2013) (Zhang et al., 2013; Sun et al., 2013a, b). The average number concentrations in the size range from 20 to 680 nm were around 1.6×104 cm−3, which is close to the values observed at other urban and regional sites in China, such as Guangzhou (1.4×104 cm−3), Shanghai (1.3×104 cm−3) and Wuxi (1.8×104 cm−3), and 2–3 times higher than the values observed at background sites (e.g., Wenling 5.7×103 cm−3 and Changdao 6.7×103 cm−3) or in marine environments (5.6×103 cm−3) (Peng et al., 2014).
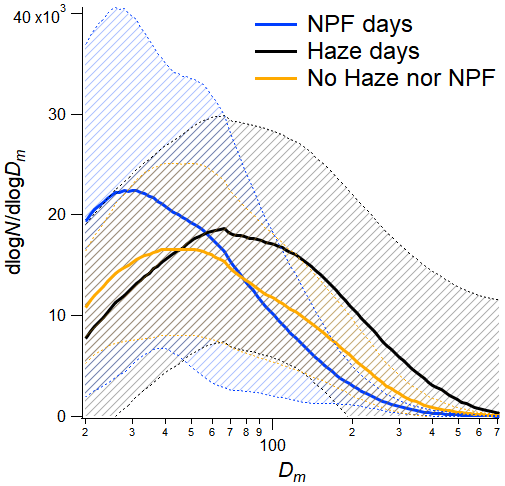
Figure 3Average particle size distribution of NPF days, haze days and no haze nor NPF event days. The shaded areas represent 1 standard deviation. The average size distribution of PMF input is displayed in Fig. S19 in the Supplement. NPF days were excluded from the PMF analysis.
The average size distributions of NPF days, haze days and no NPF nor haze event days are displayed in Fig. 3. During NPF days, sub-30 nm particle concentrations are much higher than during non-NPF days. During NPF days, an additional shoulder in the particle size distribution can be observed at 50 nm, which is likely affected by primary particle emissions. In contrast, during haze days, the fraction of sub-30 nm particles is much lower, while the fraction of large particles strongly increased, especially for particles >200 nm. This suggests an enhanced contribution of secondary formation and regional transport. The size distribution of particles during the days without either NPF or haze events is in between NPF and haze days.
3.2 Characteristics of PM and PMF analyses
The average diurnal evolution of the particle number size distribution, calculated over the non-NPF days, showed a clear impact of the primary emissions around early morning, noon, evening and midnight (Fig. 4a). We further divided the particles into two size groups: particles smaller than 100 nm (N20–100 (20–100 nm)) and particles larger than 100 nm (N100–680 (100–680 nm)) in diameter. In general, N20–100 and N100–680 contributed to 66 % and 34 % of the total particle number concentration (N), respectively. Unlike N20–100, the value of N100–680 stayed relatively stable over the course of the day (especially for particles >200 nm), implying that these large particles were likely of regional origin and were not strongly impacted by local primary emissions. A strong source of particles in the size range of 20–100 nm was observed from 17:00 to 23:00, when the highest particle number concentrations of the whole day were also observed. Although it is expected that on non-NPF days, the highest particle number concentration is observed during the nighttime with the lowest boundary layer conditions; this was not the case in our study (Fig. 4a, b – 17:00 to 23:00), which indicates that the particle number concentration is driven not only by the boundary layer height but also by primary sources during 17:00 to 23:00. The variations of the fractions of N20–100 and N100–680 are similar to the aforementioned pattern and displayed in Fig. S2 in the Supplement.

Figure 4Average diurnal evolution of particle number size distribution during non-NPF days. (a) Particle size distribution, (b) number concentrations of particles in N20–100 (20–100 nm) and N100–680 (100–680 nm), (c) different component concentrations and (d) mass fractions of different components. Average diurnal evolution of all days (NPF days are also included) is also presented in Fig. S1 in the Supplement.
Organic aerosols and nitrate were the largest contributors to the total PM2.5 mass (21.8 µg m−3, 35 % and 17.9 µg m−3, 28 %, respectively), followed by sulfate, ammonium, BC and chloride. Unlike secondary inorganic species, the diurnal pattern of organics showed an obvious increase influenced by local primary emissions during the morning, noon and evening at around 07:00, 12:00 and 19:00, respectively. Peaks of the organic aerosol mass concentrations and fractions were found at noon (16.5 µg m−3, 34 % of NR-PM2.5+BC) and evening (24.9 µg m−3, 46 % of NR-PM2.5+BC). In contrast, secondary inorganic aerosols showed very different diurnal patterns, which suggests that they were affected more by regional/aging processes and boundary layer effects.
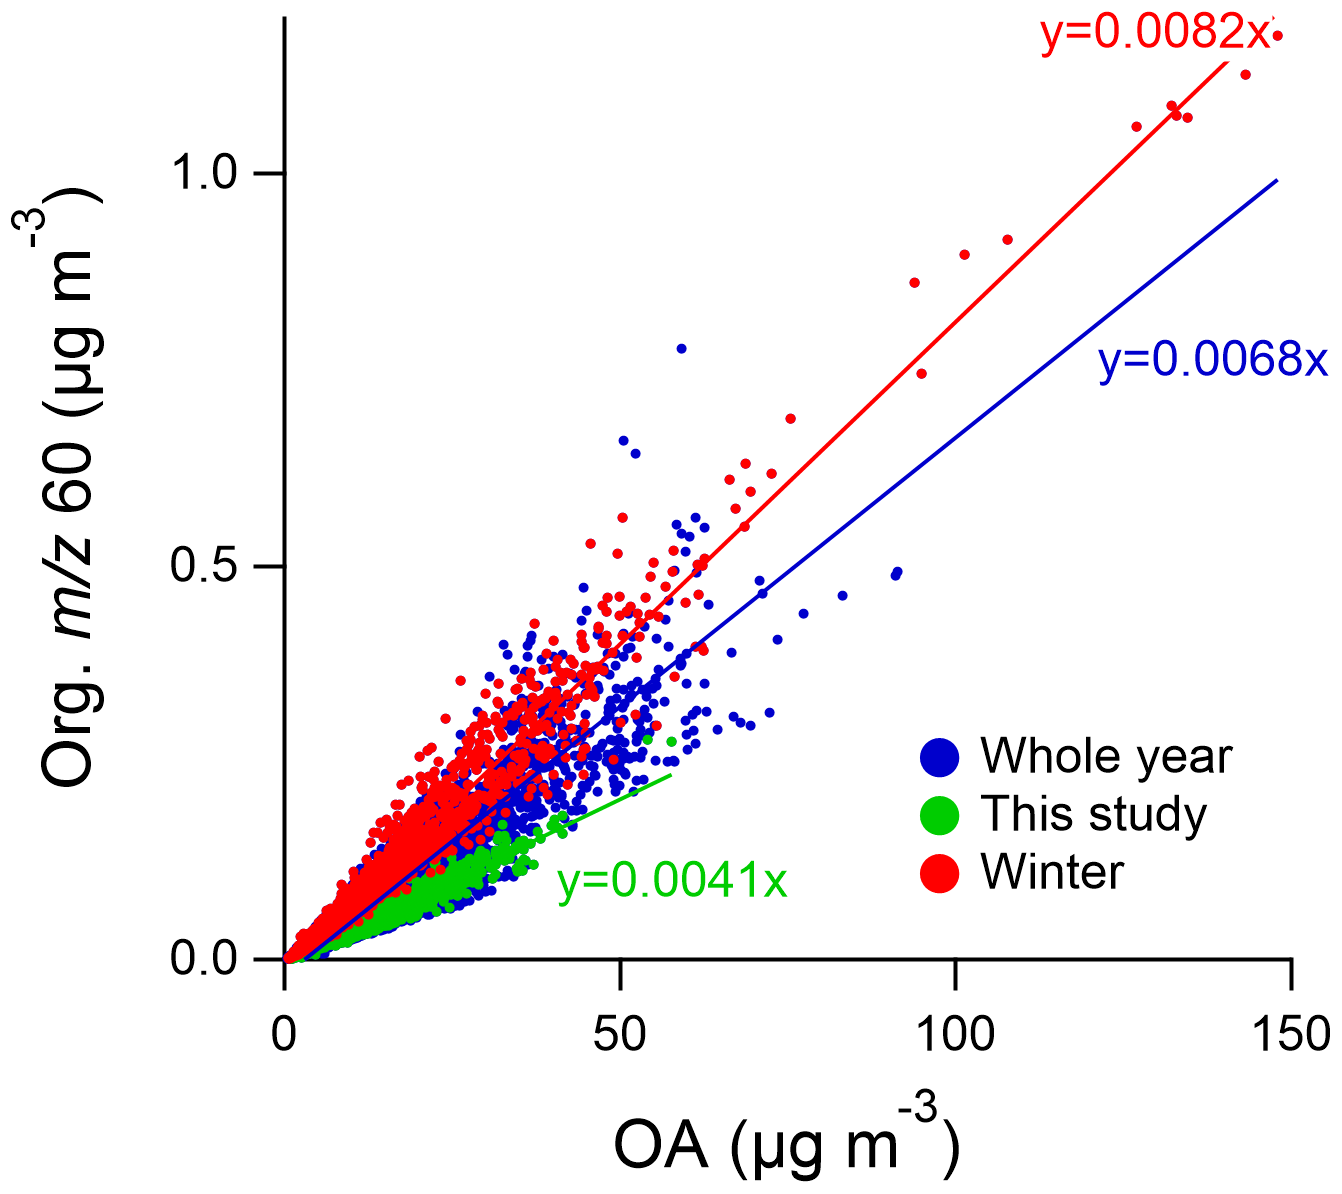
Figure 5The ratio of m∕z 60 in organics to total OA in our sampling period (6 April to 2 July 2018), winter period (December 2018 to February 2019) and the whole year measurement (February 2018 to June 2019).
We applied OA PMF and size PMF analysis to classify the major sources during the non-NPF days. The evaluation of the OA PMF and size PMF results and validations can be found in Sect. S2 in the Supplement. During our sampling period, the fraction of OA observed at m∕z 60 (assumed to be affected by levoglucosan from biomass burning; Elser et al., 2016) and at m∕z 115 (assumed to be affected by PAHs from coal combustion; Li et al., 2017; Hu et al., 2017) was the lowest in comparison to the whole year of measurements (Figs. 5 and S5 in the Supplement), which indicates that no substantial biomass burning or coal combustion was taking place during our study period. This result is consistent with observations in similar seasons of previous years (2011–2013) (Hu et al., 2017; Sun et al., 2018). In addition, the slope of m∕z 60 to total OA concentration (f60, 0.004) is very close to the backgroundf60 level without biomass burning activities (f60, 0.003) proposed by Cubison et al. (2011), confirming that biomass burning emissions were only a minor contributor to OA during our sampling period. In the absence of identifiable OA components related to residential biomass burning or coal combustion, primary OA (POA) can be assumed to be dominated by traffic and cooking emissions in Beijing. By using the ME-2 method to obtain a better extraction of the factors and separation of similar profiles, prior information of the source profiles from hydrocarbon-like organic aerosol (HOA) and cooking organic aerosol (COA) were applied to constrain the PMF runs (Crippa et al., 2014, 2013a, b). These profiles were very similar to other previous source tests (Mohr et al., 2012; He et al., 2010; Eilmann et al., 2011) and can be recognized as the typical profiles of their source types. Due to the high similarity of the mass spectral fingerprints of gasoline and diesel exhausts, OA PMF is unable to further separate HOA into two factors attributed to these two different types of vehicles, even by using gasoline and diesel exhaust fingerprints from literature as a priori information (Canagaratna et al., 2004; Mohr et al., 2009) (Fig. S10 in the Supplement). Due to the lower mass contribution and smaller particle size range of gasoline exhausts, HOA from OA PMF in this study is assumed to be most strongly affected by diesel emissions, which is consistent with previous research (Canagaratna et al., 2004) and further discussed in Sect. 3.3.
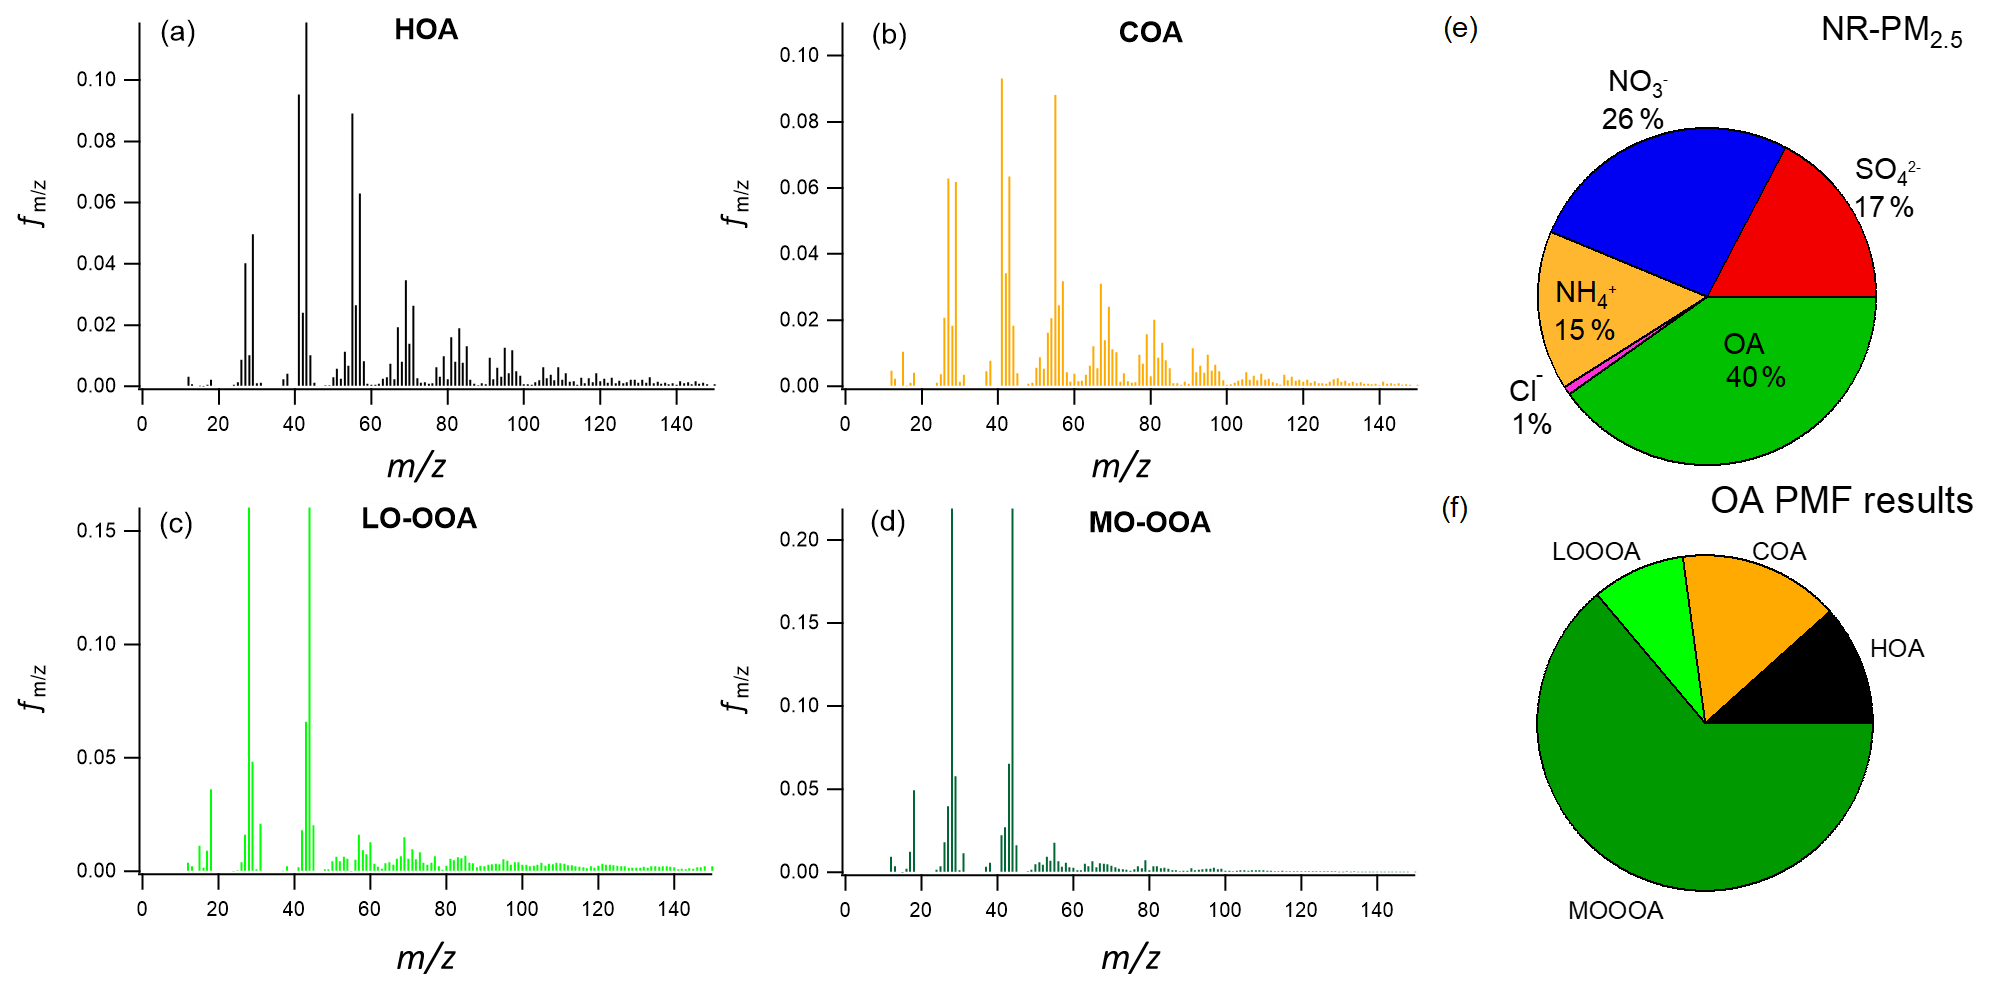
Figure 6Profiles of organic aerosols of the factors from OA PMF analysis: (a) HOA, (b) COA, (c) LO-OOA and (d) MO-OOA. (e) The mass fractions of NR-PM2.5. (f) The mass fractions of OA sources. HOA is hydrocarbon-like organic aerosol, COA is cooking organic aerosol (COA), LO-OOA is less oxygenated organic aerosol (LO-OOA) and MO-OOA is more oxygenated organic aerosol (MO-OOA).
In OA PMF source apportionment analysis, we separated four factors with distinctly different chemical composition in OA PMF: HOA, COA, less oxygenated organic aerosol (LO-OOA) and more oxygenated organic aerosol (MO-OOA). Here also, the residual analyses showed no noticeable contributions from biomass burning and coal combustion (Fig. S12 in the Supplement). The contribution of aerosol components to NR-PM2.5 and the chemical fingerprints from OA PMF are displayed in Fig. 6. Generally, the source types and contributions exhibited a large fraction of OOA, consistent with those from previous studies conducted in the same seasons in urban Beijing (Hu et al., 2017; Sun et al., 2018). We observe a slightly higher contribution of SOA to OA (73 % for April–July 2018 in this study) than what was reported in literature for the early 2010s (65 %–68 %) (Table S2 in the Supplement). The decreased contribution of POA to OA compared to the early 2010s is likely related to the implementation of emission controls for the recent years in Beijing. Yet, it should also be noted that different factors might affect the comparison, such as sampling location and the uncertainties in source apportionment, as well as particle size cuts.
From the size PMF analysis, five factors were resolved based on the particle number size distributions: traffic-fine particles (traffic-fine), traffic-ultrafine particles (traffic-ultrafine), cooking-activity-related particles (cooking-related) and two kinds of regional particles (regional 1 and 2). The number and volume size distributions (assuming spherical particles) of the components resolved in size PMF are displayed in Fig. 7. In the following sections, we discuss the impact of sources and processes on particle number and mass concentrations.
3.3 Traffic-related particles
3.3.1 Traffic-fine particles
In the OA PMF, the traffic emissions were represented by a factor dominated by fragments related to hydrocarbon-like OA (HOA), including m∕z 27, 29, 43, 55 and 57 (Fig. 6a). These fragments and HOA are generally believed to be affected by traffic emissions (especially diesel vehicle emissions; Canagaratna et al., 2004). In this study, HOA (9 % of the total OA) had a high correlation with BC (r=0.71), and the HOA∕BC ratio (0.45±0.22) was consistent with traffic emissions (0.4 to 0.79; Daellenbach et al., 2016).
From size PMF, a corresponding factor was found that correlates with BC and HOA plus BC as well (r=0.55 and r=0.65). This factor is characterized by a single mode in the number size distribution, with a peak size at around 100 nm (Fig. 7c) and termed “traffic-fine”. This result supports previous studies that suggested BC and primary organics to be the dominant components in this size range of PM in Beijing (Cruz et al., 2019; Xu et al., 2016; Ding et al., 2019; Su et al., 2018; Sun et al., 2015; J. Wang et al., 2019; Hu et al., 2016). Assuming particle densities of 1.5 g cm−3 in this size range (Hu et al., 2012; Yin et al., 2015) for estimating the mass concentration of traffic-fine particles, the sum of HOA and BC explains 57 % (average: 5.2 µg m−3) of the mass concentrations of traffic-fine particles from the SMPS (average: 8.2 µg m−3) (Fig. 8a, e, and i). The lower mass concentration from the chemically resolved measurements could be related to the following factors: (1) the transmission efficiency of the ToF-ACSM PM2.5 lens is relatively low for particles that contribute to the volume of traffic-fine particles (102–322 nm; 10th and 90th percentile) (Peck et al., 2016). (2) Secondary inorganic compounds contribute to particles emitted from traffic (Q. Zhang et al., 2017; Xing et al., 2020), influencing the size PMF results and thereby resulting in overestimation of the traffic-fine component. (3) There are uncertainties arising from the performance and measurement of the instruments, including SMPS (assumed 31 % for PM1; Buonanno et al., 2009a), ToF-ACSM (assumed ∼30 % but varied among species; Budisulistiorini et al., 2014) and aethalometer (assumed 36 % for BC; Sharma et al., 2017), as well as from the PMF analyses. (4) The co-emitted refractory compounds, such as zinc, copper, calcium and phosphate, and brake wear particles which cannot be measured by the ToF-ACSM, even though these compounds can assumed to be minor, play a role (Wright and Institute of Marine, 2000; Dallmann et al., 2014).
Traffic-fine particles, HOA and BC showed similar diurnal patterns, with higher concentrations during the night and morning than during the afternoon when the boundary layer is higher (Fig. 8a, e and i). We assume the boundary layer to have the biggest influence in our study period; day- and nighttime diesel vehicle PM2.5 emissions are estimated to be similar for the Beijing area. Yet, within urban Beijing (area within the 5th Ring Road), the PM2.5 emissions of diesel vehicles increase during the night, which can be related to the heavy-duty vehicle (HDV) restrictions during daytime in Beijing (Song et al., 2013). This suggests that in addition to the emissions in urban Beijing, traffic-fine particles, HOA and BC are also strongly impacted by diesel vehicle emissions from the Beijing area due to their size ranges and life time. Furthermore, traffic-fine particles had similar mode number diameters to heavy-duty vehicle emissions from reported source tests or near-road studies in Beijing (Song et al., 2013; Wang et al., 2011; Vu et al., 2015; Wehner et al., 2009). According to previous source tests, typically particles from HDV emissions have the dominant number mode of 40 to 160 nm, which is much larger than those from light-duty vehicles (LDVs; 20 nm or smaller; Vu et al., 2015). However, HDV emissions of some smaller particles (<30 nm) were also observed in emission tests and at roadside measurements during the night of Beijing when HDV emissions were dominated (Song et al., 2013). Those small particles from HDVs were not observed in the traffic-fine component and were explained by another factor.
3.3.2 Traffic-ultrafine particles
Ultrafine particles (<30 nm) were mainly explained by another factor characterized by a large contribution of particles with a mode diameter of around 20 nm (Fig. 8b) to its particle number size distribution. The separated factor exhibits a similar particle number size distribution to gasoline vehicular emissions (both source tests as well as urban roadside measurements; Wehner et al., 2002; Vu et al., 2015; Du et al., 2017; Liu et al., 2014; Wang et al., 2013). In this study, we minimized the effect of NPF on the size PMF results by excluding NPF days based on an evaluation starting from 2 nm particle concentrations from the NAIS. Therefore, we termed this factor “traffic-ultrafine”. By assuming a density of 1.5 g cm−3, which was typically reported for this size range in Chinese megacities (Hu et al., 2012; Yin et al., 2015; Qiao et al., 2018), the number concentrations of this component were converted to mass concentrations.
Traffic-ultrafine concentrations were higher during daytime than nighttime, which suggests a prominent impact of local gasoline vehicle emissions (Fig. 8b). In the morning, traffic-ultrafine particle concentrations started to increase concurrent with the morning rush hour and reached the first peak of the day (1.8×103 cm−3, 0.72 µg m−3), which is 1.5 times the background concentration between midnight and 04:00, consistent with enhanced estimated gasoline vehicles emissions in urban Beijing and NOx concentrations. After that, the concentrations of this component decreased, consistent with the distinct decrease in gasoline PM2.5 emissions (Fig. 8f). The background late night particle concentrations can be attributed to nighttime cluster formation or to sub-30 nm particle emissions from HDV emissions (Song et al., 2013; Wehner et al., 2009). In addition, the lower boundary layer during the night increases particle concentrations. Enhanced concentrations between 10:00 and 11:00 could be explained by prevailing winds from north and east (winds from the north and east observed on two-thirds of all days during this time window). This causes the measurement location to be strongly affected by the main intersections and arterial roads upwind (Fig. S15 in the Supplement). However, considering the absence of strong nucleation-mode particle burst, this peak was far more likely to originate from the primary emissions such as gasoline vehicle emission, which is supported by a shoulder of the NOx peak at the same time of day that was still observed even though NOx is depleted by increasing concentrations of O3. Bootstrap analyses also confirmed that this peak occurred at this time of day during most of the sampling period.
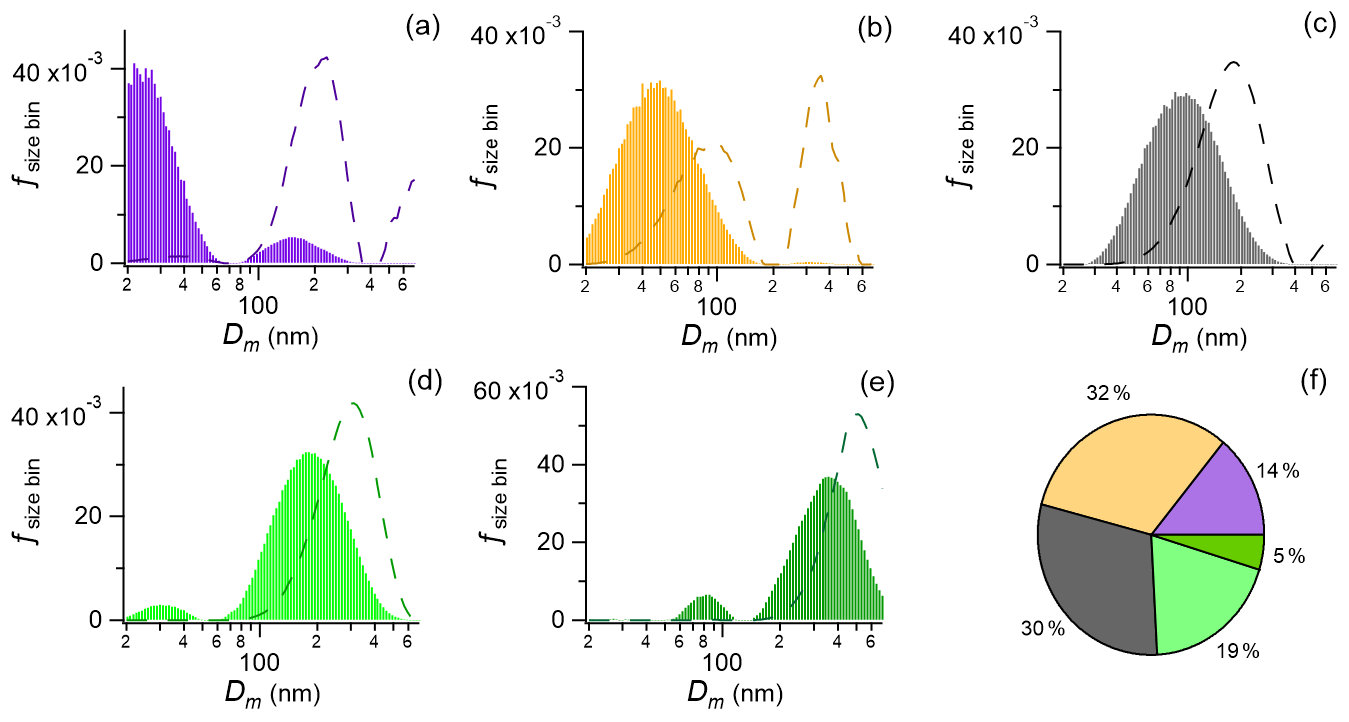
Figure 7Number (shown as bars) and volume (shown as dashed lines) size distributions of the factors from size PMF analysis and number fractions of total particle number concentrations: (a) traffic-ultrafine particles, (b) cooking-related particles, (c) traffic-fine particles, (d) reg 1 and (e) reg 2. (f) Number fractions of different factors. Traffic-ultrafine denotes the ultrafine particles related to traffic emissions, traffic-fine denotes the fine particles related to traffic emissions and cooking-related denotes the particles related to cooking emissions. Reg 1 and reg 2 denote the particles related to regional sources type 1 and 2, respectively.
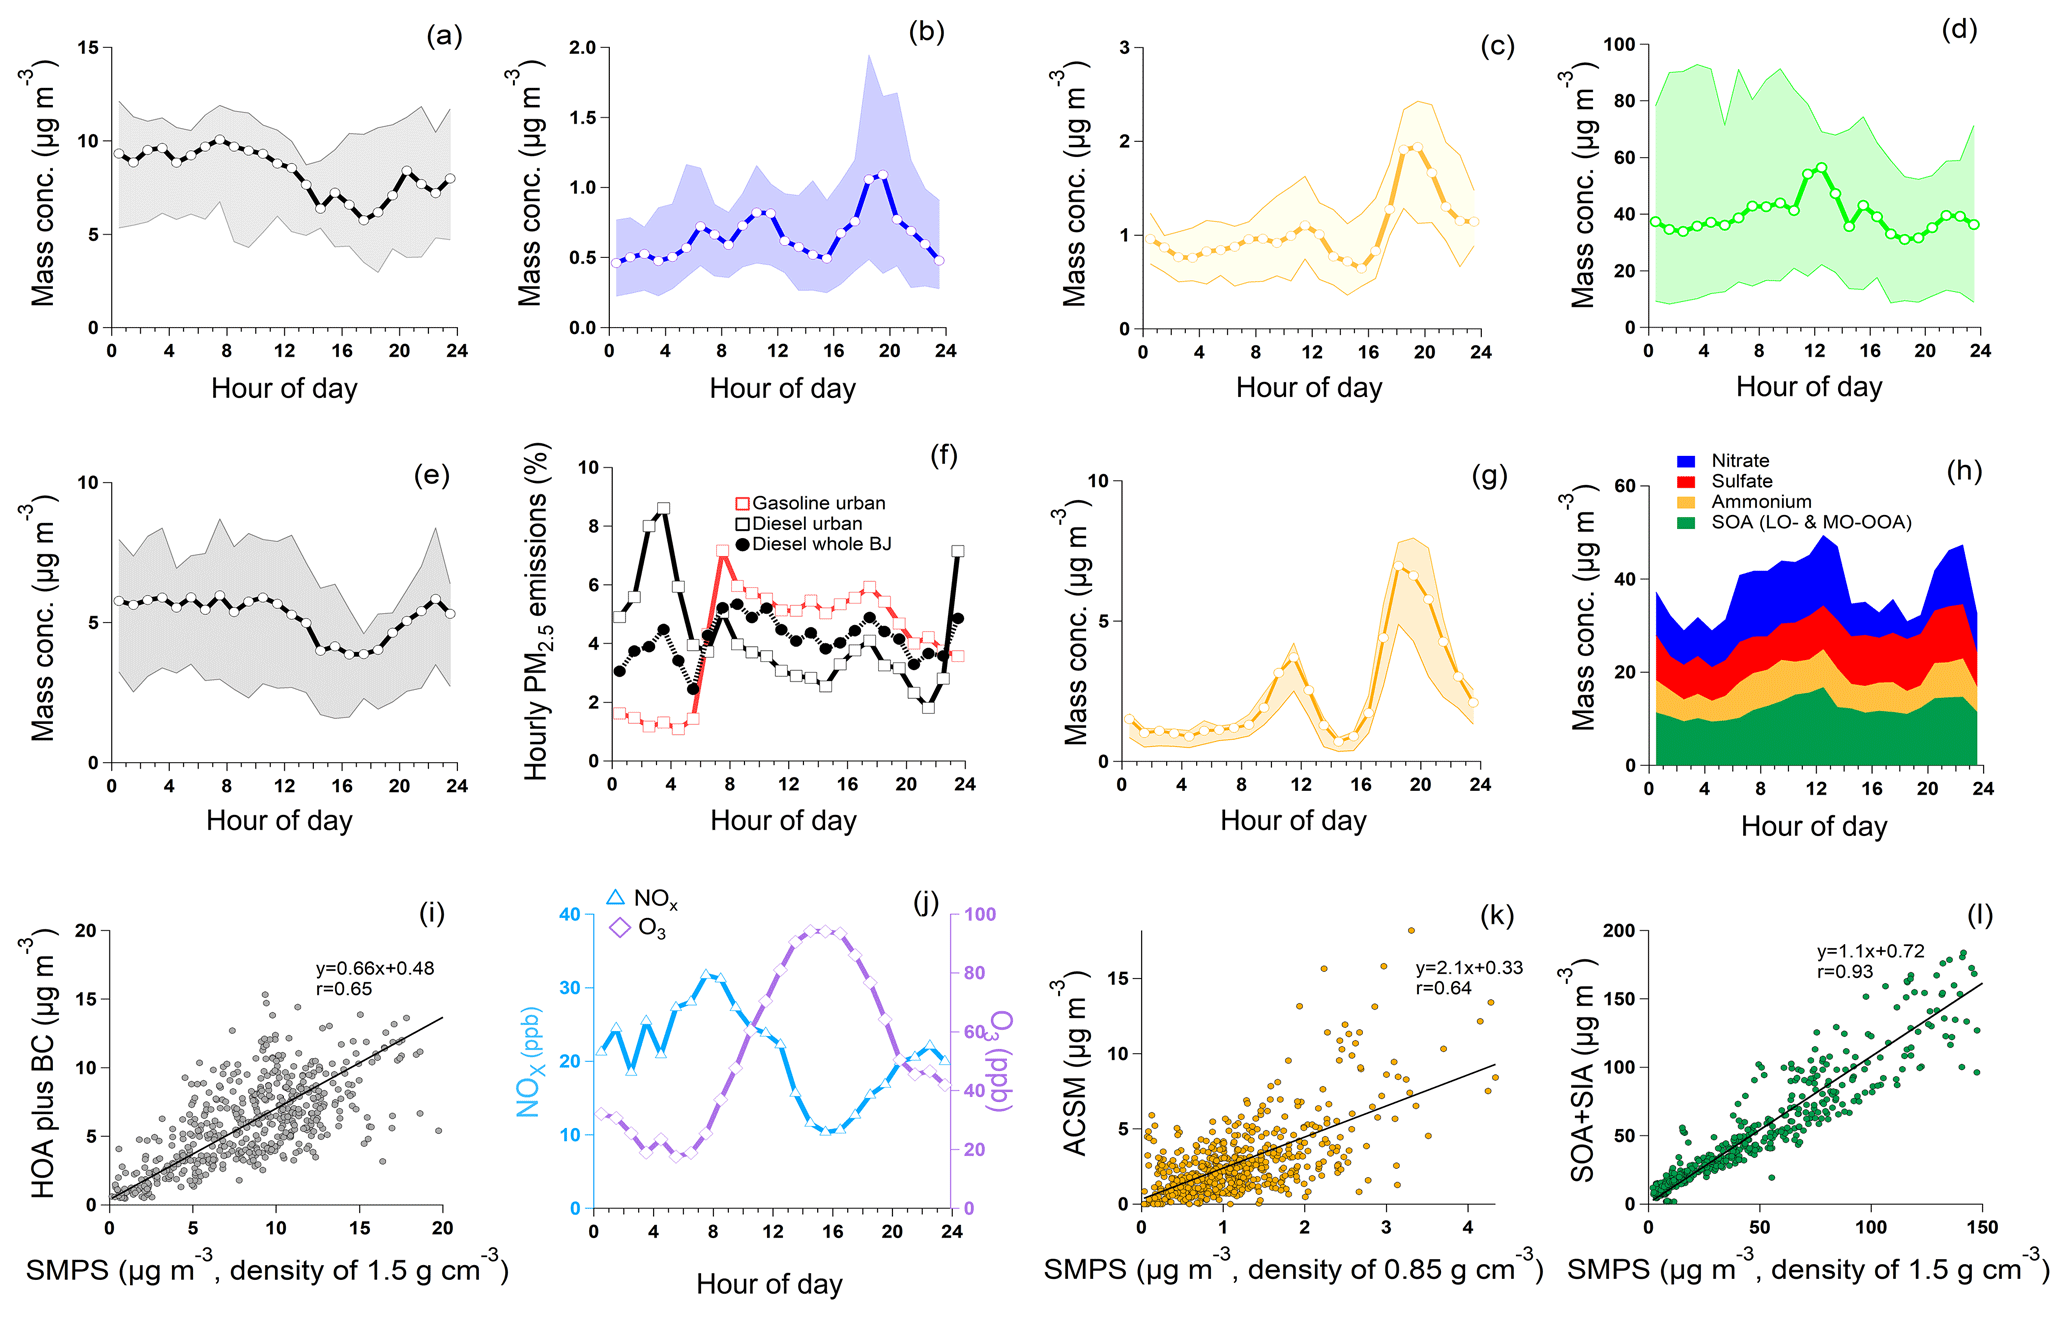
Figure 8Median diurnal patterns of (a) traffic-ultrafine particles resolved from size PMF, (b) traffic-fine particles from size PMF, (c) cooking-related particles resolved from SMPS and (d) regional-related sources from SMPS. (e) Simulated hourly variation of PM2.5 emissions from different traffic types. For each traffic type, the proportions are calculated from hourly emissions divided by the whole day emissions of its type; red and black lines represent gasoline and diesel vehicles in urban Beijing, respectively, and dashed black lines represent diesel vehicles in the whole Beijing area, (f) HOA plus BC from ToF-ACSM and aethalometer. (g) COA from ToF-ACSM. (h) Secondary from ToF-ACSM. (i) NOx (blue line) and O3 (purple line). (j) Comparison between HOA plus BC and traffic-fine particles. (k) Comparison between COA and cooking-related particles. (l) Comparison between secondary species from ACSM and regional-related sources from SMPS. Shaded areas are the 25th and 75th percentiles.
In the evening (18:00–20:00), the concentration (2.2×103 cm−3, 1.0 µg m−3) reached ∼2 times the background value (1.4×103 cm−3, 0.55 µg m−3), which can be attributed to a decreasing boundary layer height and the evening rush-hour peak from gasoline emissions. We note that the evening rush-hour concentration of traffic-ultrafine particles was 30 % larger than the morning rush hour, which might be related to differences in the ultrafine particle emission factors (EFs) in different traffic regimes. Ultrafine particle (UFP; <100 nm) EFs were, e.g., found to be 2 to 4 times higher during traffic congestion than during free flow (Zhai et al., 2016). Yet, additional processes not resolved in our analysis might also contribute to this observation, such as the variation of boundary layer height. The diurnal pattern of the traffic-ultrafine factor was similar to that of typical UFPs reported in previous near-road measurement (Du et al., 2017; Liu et al., 2014; Wang et al., 2013). In contrast to traffic-ultrafine particles, NOx did not show an evening rush-hour peak, which is hypothesized to be related to a prominent daytime photochemical depletion of NOx, validated in Beijing winter in recent research (Lu et al., 2019). In winter when photochemistry is weaker, NOx showed a clear evening rush-hour peak (Fig. S14 in the Supplement). Additionally, increased HDV traffic volume during the night could also emit large amounts of NOx (Tan et al., 2019; Dallmann et al., 2013).
We did not observe a similar component in OA PMF, which is possibly related to the following reasons: (1) the small size of the particles not transmitted through the PM2.5 ToF-ACSM inlet, (2) the low mass concentration of this factor and (3) the difficulties in the separation of this factor from other vehicle types using the chemical fingerprint method. Therefore, we cannot comment on the chemical composition of these particles, a feature which should be addressed in future research.
3.4 Cooking-activity-related particles
We identified a factor related to cooking emissions with a mono-modal number size distribution (20–200 nm, geometric mean diameter (GMD) around 50 nm), contributing 32 % to the total particle number concentration (Fig. 8c and g). This mode is similar to that from cooking emission tests (Li et al., 1993; Yeung and To, 2008; Zhao and Zhao, 2018; Abdullahi et al., 2013; Hussein et al., 2006; Buonanno et al., 2009b) and field observations (Harrison et al., 2011; Du et al., 2017). Typically, Chinese cooking activities release particles with a size range from 30 to 100 nm at typical cooking temperatures (Li et al., 1993; Wu et al., 2011; Yeung and To, 2008; Zhao and Zhao, 2018). The time series of this factor could be explained very well by cooking times.
Consistently, cooking emissions in OA PMF (COA) are represented by a factor with a chemical fingerprint that is somewhat similar to HOA, with the latter having a much higher 57 to 55 m∕z ratio in comparison to that of COA. The 57 to 55 m∕z ratio is typically used as the tracer of COA (Daellenbach et al., 2017; Mohr et al., 2012, 2009). Cooking activities can emit saturated alkanes, alkenes, cycloalkanes and oxygenated species such as organic acids, resulting in a higher intensity of the m∕z 55 component (mainly C3H3O+ and ) compared to the prominent peak at m∕z 57 for HOA, which is characteristic of saturated hydrocarbons (Mohr et al., 2012). Similar to the typical cooking aerosols estimated from ACSM or AMS studies in Beijing (Ding et al., 2016; Sun et al., 2013b; Hu et al., 2017, 2016), the diurnal patterns of COA in this study exhibited two peaks: one during lunchtime (11:00 to 12:00, 3.7 µg m−3) and the other one during dinnertime (18:00 to 20:00, 6.9 µg m−3). The average mass concentration of COA in this study was 2.6 µg m−3 (15 % of OA and 4 % of PM2.5). These concentrations are similar to those reported in other studies in Beijing (He et al., 2019; Hu et al., 2017, 2016) but higher than those reported in Europe and the United States (He et al., 2019). The larger amount of UFPs and higher PM concentrations related to cooking emissions in Beijing might be attributed to the much larger magnitude of cooking activities as well as higher cooking temperatures, high fatty ingredients and stir-fry cooking styles that are common in Chinese cooking (Buonanno et al., 2009b; Zhao and Zhao, 2018). To confirm our observations, we used measurements of gas-phase tracers from NO3-CIMS. Our measurements show that gas-phase pyroglutamic acid (C5H7NO3), previously identified as a cooking marker in the particle phase (Reyes-Villegas et al., 2018), correlated highly with the COA concentration (r=0.81, 14 daily averages) in a daily comparison (Fig. S18b in the Supplement). Linoleic acid (C18H32O2), which is a typical tracer for Chinese cooking (He et al., 2004a, b; Xu et al., 2018; Schauer et al., 2002; Rogge et al., 1991; Reyes-Villegas et al., 2018; Abdullahi et al., 2013), exhibited a weaker correlation with the COA concentration, likely due to potential interferences from other high signal peaks in the same unit mass from photochemistry during the summer in Beijing (Fig. S17a, b in the Supplement).
The number concentration of cooking-related particles from size PMF exhibited very similar diurnal patterns to COA (Fig. 8c), both having a larger dinnertime peak (10.2×103 cm−3) and a lower lunchtime peak (6.7×103 cm−3). Since fatty acids are a major component of Chinese cooking emissions (He et al., 2004a; Wu et al., 2015; Reyes-Villegas et al., 2018), the number concentrations of this emission type could be further converted into mass concentrations by assuming a cooking particle density close to oil (0.85 g cm−3) (Reyes-Villegas et al., 2018). A high correlation (r=0.64, Fig. 8k) between COA from ToF-ACSM and cooking particles from size PMF suggests that the results from the two methods are robust. Yet, the concentration of COA was 2.3 times the mass concentration derived from size PMF. This is consistent with the previous studies that found a higher relative ionization efficiency (RIE) of COA (RIECOA) compared with other OA (Fig. S16 in the Supplement) (Xu et al., 2018; Canagaratna et al., 2007). However, additional uncertainties in this comparison may arise from the following aspects: (1) there are differences in the measured size ranges of these two instruments and uncertainties in the density of oil for cooking particles. (2) Both PMF analyses have their own uncertainties, especially pertaining to the SMPS without the use of unique cooking tracers. (3) During lunchtime and dinnertime, the contribution of COA to the NR-PM2.5 could significantly increase, making the actual CE higher than the only ammonium-nitrate-dependent CE applied in this study.
3.5 Secondary/regional effects
In this study, we quantify the impact of primary particle emissions on air pollution in a megacity while accounting for secondary/regional effects using two different approaches. Both size PMF and OA PMF approaches extracted two separate secondary or regional factors related to the different stages of the aging process in the atmosphere and precursor emissions. The two factors resolved from size PMF were related to regional secondary aerosols, regional 1 and 2, both displaying a bimodal number size distribution with a dominant peak at 200 and 400 nm, respectively (Fig. 7d and e). A much smaller mode in the small size range could be found in both factors, which might be due to the transport of small particles or the uncertainties in the size PMF analysis. The regional 2 factor had a larger median diameter, indicating that this factor might have been subject to a longer aging process than regional 1. Meanwhile, from OA PMF, two oxygenated organic aerosol factors are related to secondary organic aerosol (SOA) and less oxidized and more oxidized oxygenated OA (LO-OOA and MO-OOA). They both were dominated by oxygenated fragments (e.g., m∕z 44 attributed to CO) and much lower hydrocarbon fragments at the same time. Yet, LO-OOA profile had higher signals of less oxygenated fragments (e.g., m∕z 26 and m∕z 43) and much stronger signals of ions with m∕z larger than 100. MO-OOA had even lower hydrocarbon fragments and less high-weight fragments, suggesting longer aging and oxidation processes. A strong correlation was observed between MO-OOA and sulfate (r=0.75), which was another indication of the long aging processes for this factor. The correlation between LO-OOA and nitrate was lower (r=0.64), which is a feature commonly found in many recent studies in Beijing (Sun et al., 2018; Zhao et al., 2017). This phenomenon was previously explained by the different formation pathways between nitrate and secondary organic aerosols (Sun et al., 2018).
In total, the two regional factors from size PMF contributed to a total of 24 % (regional 1 (19 %) and regional 2 (5 %)) to the total particle number concentration yet are the major contributors to the particles larger than 100 nm (57 %) (Fig. 7f). Meanwhile, secondary organic and inorganic aerosols (NO3, SO4, NH4, Chl) dominated the fine PM mass concentration (85 %, Fig. 8h). Here, we compared the sum of secondary organic (LO-OOA, MO-OOA) and inorganic particulate matter with the mass concentration derived for the sum of both regional factors from size PMF (termed “regional”, assuming a density of 1.5 g cm−3, which is close to the density of secondary aerosols and also to the density of particles in this size range reported previously; Hu et al., 2012). Secondary particulate matter and regional mass concentrations agreed well with each other (r=0.93, slope = 1.1), implying that particles from secondary sources showed more aged signals in the ToF-ACSM and exhibited larger sizes in the SMPS. The diurnal patterns of the secondary sources were likely driven by boundary layer effects, photochemistry and long-range transport (Fig. 8d).
3.6 Number, surface areas and volume distributions of different sources
To compare the correlations of different factors extracted from OA PMF and size PMF, Pearson correlation coefficients (r) between different factors and BC and NOx are displayed in Fig. 9. HOA from OA PMF was found to be strongly correlated with BC, traffic-fine particles and NOx, indicating that these components were affected by a similar source type, very likely HDVs. COA from OA PMF was correlated best with cooking-related particles from size PMF. A weak correlation was observed between COA and traffic-ultrafine particles, which is probably due to both of them being daytime activities. The COA component had no correlation with other source types and tracers, indicating the robustness of the PMF results by the two approaches. Secondary aerosols were strongly correlated with the regional component extracted from size PMF, suggesting that secondary PM consists of larger particles (>100 nm) of more regional character. In addition, the secondary component was also correlated with BC and traffic-fine particles, which is consistent with the fact that particles emitted from HDVs, such as BC particles, may have a longer lifetime and thus are transported further.
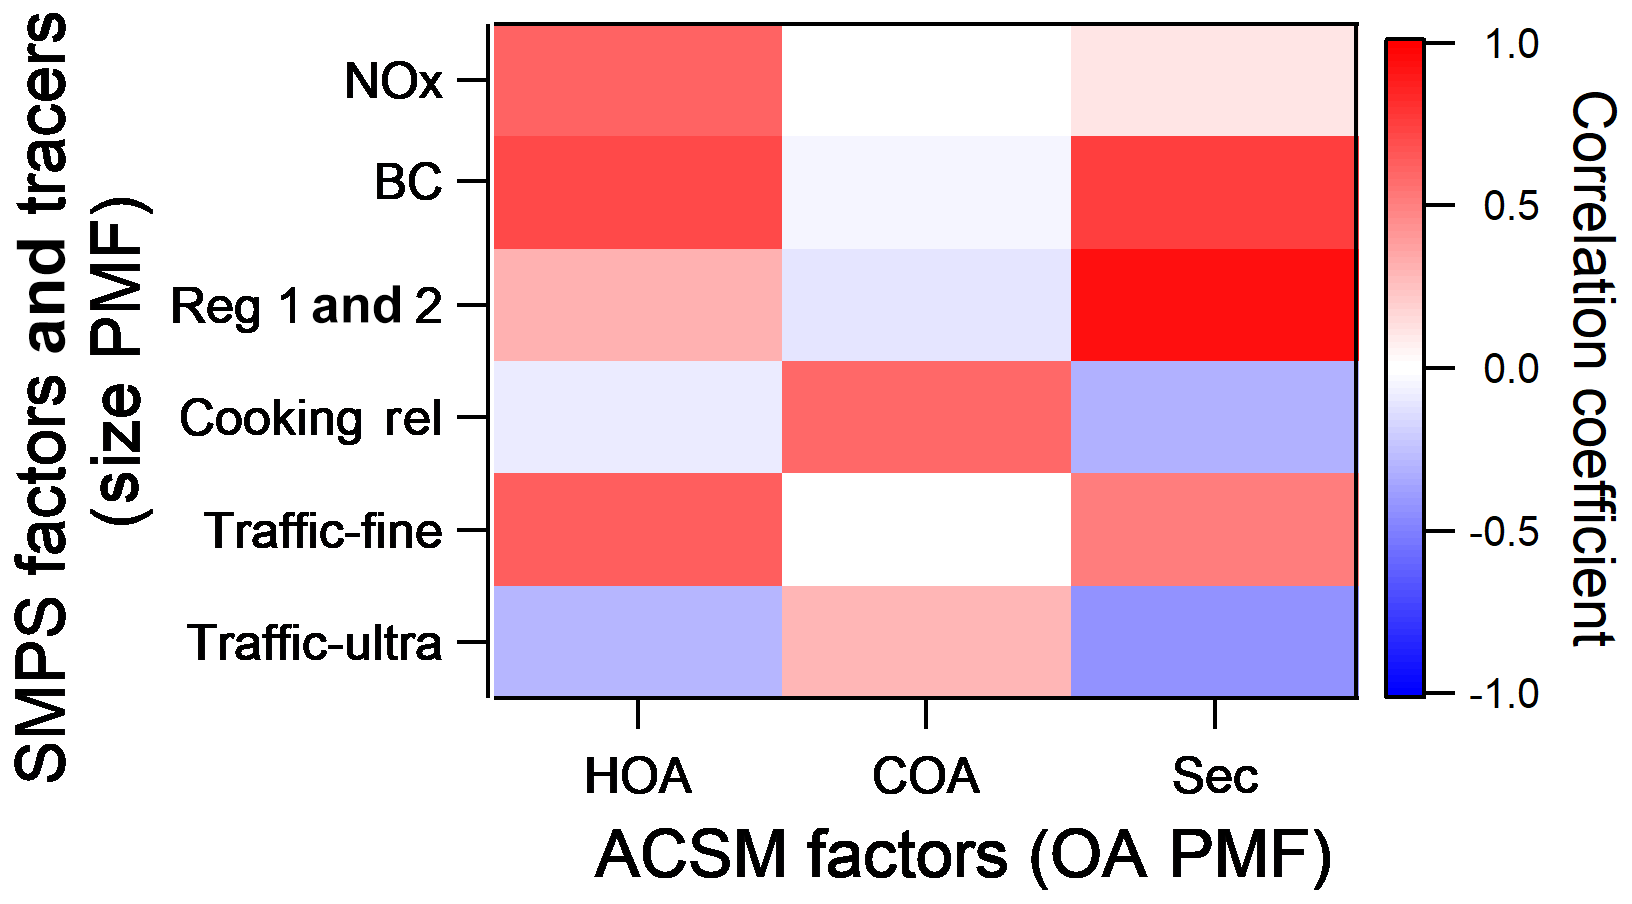
Figure 9Pearson correlation coefficients (r) of ToF-ACSM vs. SMPS factors and BC and NOx time series. Traffic-ultra denotes the ultrafine particles related to traffic, traffic-fine denotes the fine particles related to traffic and cooking rel denotes the particles related to cooking activities. Reg 1 and 2 denote the sum of particles related to regional sources type 1 and 2. Sec is the sum of SIA and SOA.
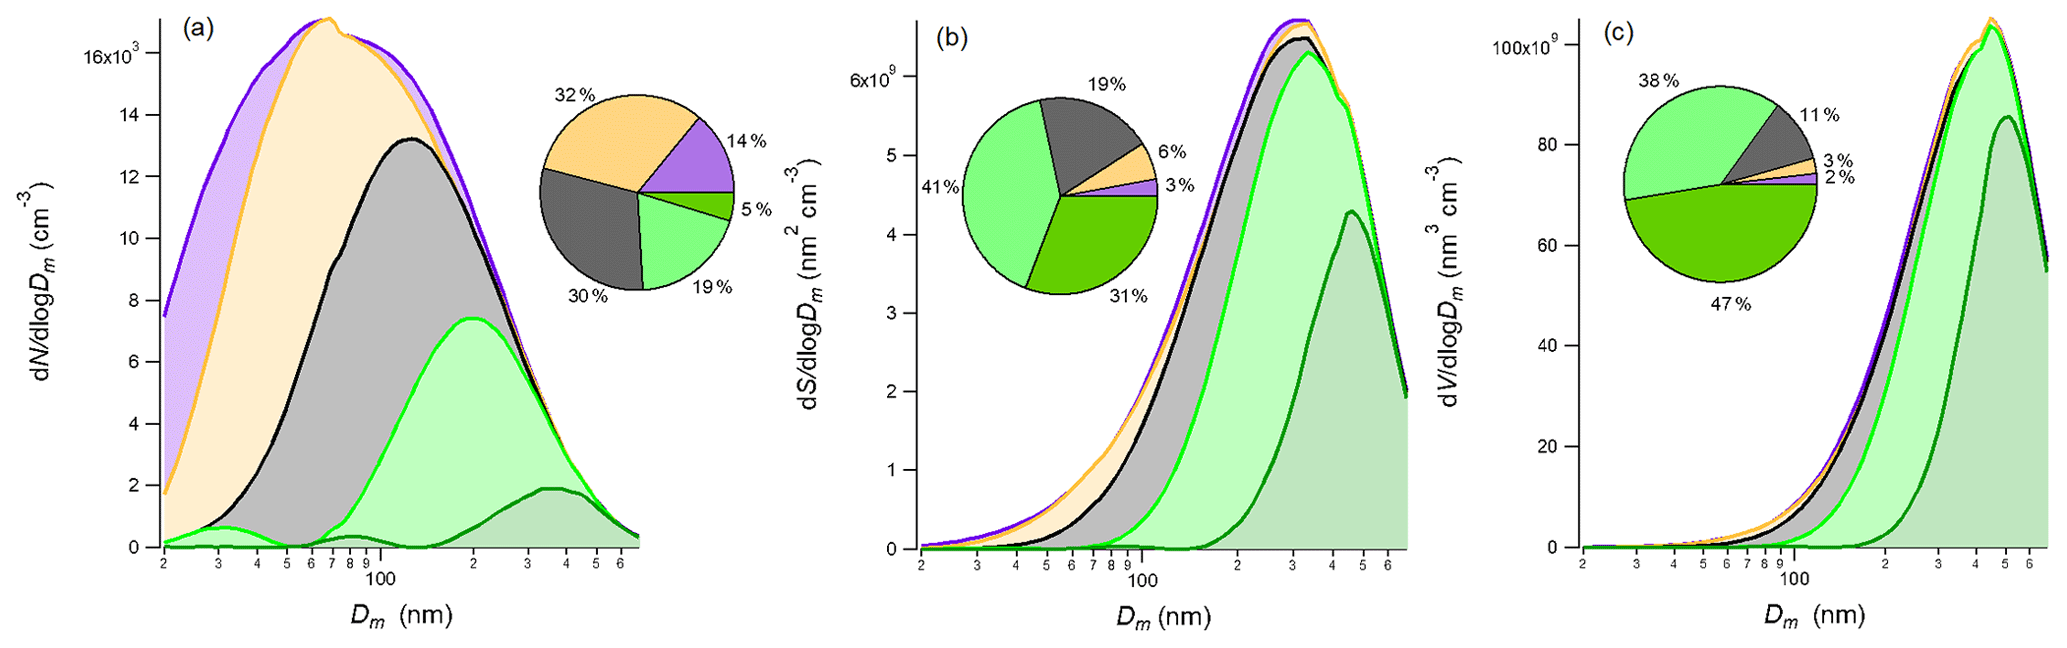
Figure 10Profiles and fractions of (a) number, (b) surface area (c) and volume distributions from size PMF analysis. Traffic-ultrafine denotes the ultrafine particles related to traffic emissions (purple range), traffic-fine denotes the fine particles related to traffic emissions (black range) and cooking rel denotes the particles related to cooking activities (yellow range). Reg 1 and reg 2 denote the particles related to regional sources type 1 (light green range) and 2 (dark green range), respectively.
The average particle number, surface area and volume size distributions of different factors are displayed in Fig. 10 (assuming spherical particles). Traffic-ultrafine, traffic-fine, cooking, regional 1 and regional 2 components contributed 14 %, 30 %, 32 %, 19 % and 5 % to the particle number concentration, respectively (20 %, 49 %, 27 %, 3 %, 0.6 % of particles with diameters 20–100 nm and 4 %, 5 %, 35 %, 45 %, 11 % of particles with diameters 100 nm). The number fraction of traffic-ultrafine particles in this study is lower than that found in a previous size PMF study using a twin differential mobility particle sizer (TDMPS; 25 %) in Beijing (Wang et al., 2013). A potential reason for this is that we excluded sub-20 nm particles in the size PMF analysis. Such particles, originating mainly from traffic during non-NPF days, can be an important contributor to the total particle number concentration (Kontkanen et al., 2020).
Although the traffic-ultrafine, cooking and traffic-fine factors contributed the majority (76 %) of the total particle number concentration, they only contributed 28 % and 16 % to the total surface area and volume concentration, respectively. Meanwhile, the two regional sources dominated the total surface area (regional 1: 41 %; regional 2: 31 %) and volume (regional 1: 38 %; regional 2: 47 %) concentrations. This observation is in agreement with previous findings that the mass concentrations of fine PM are dominated by secondary mass formation (Huang et al., 2014; Sun et al., 2012, 2013a, b; Guo et al., 2014). Our results highlight the importance of secondary formation for PM2.5 mass as well as the importance of the contribution of primary sources to the UFP number concentration during the non-heating season in Beijing in the absence of NPF.
3.7 Uncertainties and limitations
Even though promising results and good comparisons were obtained by size and OA PMF analyses, there were some uncertainties and limitations in this study. First, since the size ranges of ToF-ACSM (Dva∼100 nm–2.5 µm) and SMPS (Dva∼30 nm–1 µm) do not fully overlap, and since the smallest particles cannot be measured with the ToF-ACSM due to its lower detection efficiency at smaller sizes, we could not characterize the chemical composition of the traffic-ultrafine particle type. Secondly, we used assumptions, including of spherical particles and component-dependent densities, which may create uncertainties, especially due to the complexity of morphological characteristics for PM in Beijing (Li et al., 2011). Regardless of the aforementioned possible uncertainties, measured PM2.5 and PM2.5 estimated from SMPS agreed well with each other, suggesting no strong impacts due to these uncertainties. Finally, we cannot exclude that some cluster formation (even though NPF days were excluded in this study), secondary reactions or air mass transport could have affected measured size distributions and thus the results of size PMF. Yet, ultrafine particles have a short lifetime and are strongly affected by local emissions, so their contribution to our identified factors must be minimal, especially when excluding NPF event days.
In this study, we only used data from the non-heating period when no significant biomass burning and coal combustion activities could be identified. The performance of this method when applied to measurements affected by a more complex mixture of sources, such as wintertime, needs to be assessed in future studies. In addition, a comparison between the sources among different types of measurement sites needs to be quantified in future studies.
We measured the aerosol chemical composition as well as size distribution at an urban site in Beijing between April and July 2018. By conducting two independent PMF analyses (OA PMF, size PMF), similar sources and contributions, as well as diurnal patterns from primary emissions were extracted, validating the robustness of the size PMF in our study period. Furthermore, we identified and quantified the sources and processes contributing to the particle number, surface area and mass concentrations. For primary emissions, size PMF extracted both traffic-fine and traffic-ultrafine factors, while HOA from ACSM was mainly influenced by the contribution from HDV emissions. The combination of particle chemical composition and size shows clearly that during non-NPF days, the aerosol number concentration is dominated by direct anthropogenic particle emissions while the PM mass concentration is governed by secondary processes. The methods and results of this study could pave the way for a more comprehensive understanding of primary sources in Beijing, including the particle size, number and mass. Additionally, it has the potential to provide detailed physical and chemical characteristics of sources for future studies.
Data are available from the authors upon request.
The supplement related to this article is available online at: https://doi.org/10.5194/acp-20-12721-2020-supplement.
JC, WD and KRD designed the research and analyzed the data. JC, WD, KRD, BC, LY, CY, LMH, FZ, CL, XF, YW, TVK, TC and YZ performed the measurements for this study. SZ and DY provided traffic flow and emission data. JC, WD, KRD, BC, LY, YL, LD, HH, PP, JTK, TP, CM, JK, FB, YS, PLC, DRW, VMK and MK interpreted the results and revised the manuscript. MK supported and supervised this research. JC wrote the manuscript with contributions from all co-authors. All authors have given approval to the final version of this manuscript.
The authors declare that they have no conflict of interest.
The work is supported by the Academy of Finland (Center of Excellence in Atmospheric Sciences, project no. 307331, and PROFI3 funding, 311932) and the European Research Council via ATM-GTP (742206). Kaspar R. Daellenbach acknowledges support by the SNF mobility grant P2EZP2_181599
This research has been supported by the Academy of Finland via the Center of Excellence in Atmospheric Sciences (grant nos. 307331, 311932), the European Research Council via ATM-GTP (grant no. 742206) and the SNF mobility grant (grant no. P2EZP2_181599).
Open access funding provided by Helsinki University Library.
This paper was edited by Yafang Cheng and reviewed by three anonymous referees.
Abdullahi, K. L., Delgado-Saborit, J. M., and Harrison, R. M.: Emissions and indoor concentrations of particulate matter and its specific chemical components from cooking: A review, Atmos. Environ., 71, 260–294, https://doi.org/10.1016/j.atmosenv.2013.01.061, 2013.
Beddows, D. C. S. and Harrison, R. M.: Receptor modelling of both particle composition and size distribution from a background site in London, UK – a two-step approach, Atmos. Chem. Phys., 19, 4863–4876, https://doi.org/10.5194/acp-19-4863-2019, 2019.
Budisulistiorini, S. H., Canagaratna, M. R., Croteau, P. L., Baumann, K., Edgerton, E. S., Kollman, M. S., Ng, N. L., Verma, V., Shaw, S. L., Knipping, E. M., Worsnop, D. R., Jayne, J. T., Weber, R. J., and Surratt, J. D.: Intercomparison of an Aerosol Chemical Speciation Monitor (ACSM) with ambient fine aerosol measurements in downtown Atlanta, Georgia, Atmos. Meas. Tech., 7, 1929–1941, https://doi.org/10.5194/amt-7-1929-2014, 2014.
Buonanno, G., Dell'Isola, M., Stabile, L., and Viola, A.: Uncertainty Budget of the SMPS–APS System in the Measurement of PM1, PM2.5, and PM10, Aerosol Sci. Tech., 43, 1130–1141, https://doi.org/10.1080/02786820903204078, 2009a.
Buonanno, G., Morawska, L., and Stabile, L.: Particle emission factors during cooking activities, Atmos. Environ., 43, 3235–3242, https://doi.org/10.1016/j.atmosenv.2009.03.044, 2009b.
Cai, J., Wang, J., Zhang, Y., Tian, H., Zhu, C., Gross, D. S., Hu, M., Hao, J., He, K., Wang, S., and Zheng, M.: Source apportionment of Pb-containing particles in Beijing during January 2013, Environ. Pollut., 226, 30–40, https://doi.org/10.1016/j.envpol.2017.04.004, 2017.
Canagaratna, M. R., Jayne, J. T., Ghertner, D. A., Herndon, S., Shi, Q., Jimenez, J. L., Silva, P. J., Williams, P., Lanni, T., Drewnick, F., Demerjian, K. L., Kolb, C. E., and Worsnop, D. R.: Chase Studies of Particulate Emissions from in-use New York City Vehicles, Aerosol Sci. Tech., 38, 555–573, https://doi.org/10.1080/02786820490465504, 2004.
Canagaratna, M. R., Jayne, J. T., Jimenez, J. L., Allan, J. D., Alfarra, M. R., Zhang, Q., Onasch, T. B., Drewnick, F., Coe, H., Middlebrook, A., Delia, A., Williams, L. R., Trimborn, A. M., Northway, M. J., DeCarlo, P. F., Kolb, C. E., Davidovits, P., and Worsnop, D. R.: Chemical and microphysical characterization of ambient aerosols with the aerodyne aerosol mass spectrometer, Mass Spectrom. Rev., 26, 185–222, https://doi.org/10.1002/mas.20115, 2007.
Canonaco, F., Crippa, M., Slowik, J. G., Baltensperger, U., and Prévôt, A. S. H.: SoFi, an IGOR-based interface for the efficient use of the generalized multilinear engine (ME-2) for the source apportionment: ME-2 application to aerosol mass spectrometer data, Atmos. Meas. Tech., 6, 3649–3661, https://doi.org/10.5194/amt-6-3649-2013, 2013.
Cheng, J., Su, J., Cui, T., Li, X., Dong, X., Sun, F., Yang, Y., Tong, D., Zheng, Y., Li, Y., Li, J., Zhang, Q., and He, K.: Dominant role of emission reduction in PM2.5 air quality improvement in Beijing during 2013–2017: a model-based decomposition analysis, Atmos. Chem. Phys., 19, 6125–6146, https://doi.org/10.5194/acp-19-6125-2019, 2019.
Chu, B., Kerminen, V.-M., Bianchi, F., Yan, C., Petäjä, T., and Kulmala, M.: Atmospheric new particle formation in China, Atmos. Chem. Phys., 19, 115–138, https://doi.org/10.5194/acp-19-115-2019, 2019.
Crippa, M., Canonaco, F., Slowik, J. G., El Haddad, I., DeCarlo, P. F., Mohr, C., Heringa, M. F., Chirico, R., Marchand, N., Temime-Roussel, B., Abidi, E., Poulain, L., Wiedensohler, A., Baltensperger, U., and Prévôt, A. S. H.: Primary and secondary organic aerosol origin by combined gas-particle phase source apportionment, Atmos. Chem. Phys., 13, 8411–8426, https://doi.org/10.5194/acp-13-8411-2013, 2013a.
Crippa, M., DeCarlo, P. F., Slowik, J. G., Mohr, C., Heringa, M. F., Chirico, R., Poulain, L., Freutel, F., Sciare, J., Cozic, J., Di Marco, C. F., Elsasser, M., Nicolas, J. B., Marchand, N., Abidi, E., Wiedensohler, A., Drewnick, F., Schneider, J., Borrmann, S., Nemitz, E., Zimmermann, R., Jaffrezo, J.-L., Prévôt, A. S. H., and Baltensperger, U.: Wintertime aerosol chemical composition and source apportionment of the organic fraction in the metropolitan area of Paris, Atmos. Chem. Phys., 13, 961–981, https://doi.org/10.5194/acp-13-961-2013, 2013b.
Crippa, M., Canonaco, F., Lanz, V. A., Äijälä, M., Allan, J. D., Carbone, S., Capes, G., Ceburnis, D., Dall'Osto, M., Day, D. A., DeCarlo, P. F., Ehn, M., Eriksson, A., Freney, E., Hildebrandt Ruiz, L., Hillamo, R., Jimenez, J. L., Junninen, H., Kiendler-Scharr, A., Kortelainen, A.-M., Kulmala, M., Laaksonen, A., Mensah, A. A., Mohr, C., Nemitz, E., O'Dowd, C., Ovadnevaite, J., Pandis, S. N., Petäjä, T., Poulain, L., Saarikoski, S., Sellegri, K., Swietlicki, E., Tiitta, P., Worsnop, D. R., Baltensperger, U., and Prévôt, A. S. H.: Organic aerosol components derived from 25 AMS data sets across Europe using a consistent ME-2 based source apportionment approach, Atmos. Chem. Phys., 14, 6159–6176, https://doi.org/10.5194/acp-14-6159-2014, 2014.
Cruz, M. T., Bañaga, P. A., Betito, G., Braun, R. A., Stahl, C., Aghdam, M. A., Cambaliza, M. O., Dadashazar, H., Hilario, M. R., Lorenzo, G. R., Ma, L., MacDonald, A. B., Pabroa, P. C., Yee, J. R., Simpas, J. B., and Sorooshian, A.: Size-resolved composition and morphology of particulate matter during the southwest monsoon in Metro Manila, Philippines, Atmos. Chem. Phys., 19, 10675–10696, https://doi.org/10.5194/acp-19-10675-2019, 2019.
Cubison, M. J., Ortega, A. M., Hayes, P. L., Farmer, D. K., Day, D., Lechner, M. J., Brune, W. H., Apel, E., Diskin, G. S., Fisher, J. A., Fuelberg, H. E., Hecobian, A., Knapp, D. J., Mikoviny, T., Riemer, D., Sachse, G. W., Sessions, W., Weber, R. J., Weinheimer, A. J., Wisthaler, A., and Jimenez, J. L.: Effects of aging on organic aerosol from open biomass burning smoke in aircraft and laboratory studies, Atmos. Chem. Phys., 11, 12049–12064, https://doi.org/10.5194/acp-11-12049-2011, 2011.
Daellenbach, K. R., Bozzetti, C., Křepelová, A., Canonaco, F., Wolf, R., Zotter, P., Fermo, P., Crippa, M., Slowik, J. G., Sosedova, Y., Zhang, Y., Huang, R.-J., Poulain, L., Szidat, S., Baltensperger, U., El Haddad, I., and Prévôt, A. S. H.: Characterization and source apportionment of organic aerosol using offline aerosol mass spectrometry, Atmos. Meas. Tech., 9, 23–39, https://doi.org/10.5194/amt-9-23-2016, 2016.
Daellenbach, K. R., Stefenelli, G., Bozzetti, C., Vlachou, A., Fermo, P., Gonzalez, R., Piazzalunga, A., Colombi, C., Canonaco, F., Hueglin, C., Kasper-Giebl, A., Jaffrezo, J.-L., Bianchi, F., Slowik, J. G., Baltensperger, U., El-Haddad, I., and Prévôt, A. S. H.: Long-term chemical analysis and organic aerosol source apportionment at nine sites in central Europe: source identification and uncertainty assessment, Atmos. Chem. Phys., 17, 13265–13282, https://doi.org/10.5194/acp-17-13265-2017, 2017.
Dallmann, T. R., Kirchstetter, T. W., DeMartini, S. J., and Harley, R. A.: Quantifying On-Road Emissions from Gasoline-Powered Motor Vehicles: Accounting for the Presence of Medium- and Heavy-Duty Diesel Trucks, Environ. Sci. Technol., 47, 13873–13881, https://doi.org/10.1021/es402875u, 2013.
Dallmann, T. R., Onasch, T. B., Kirchstetter, T. W., Worton, D. R., Fortner, E. C., Herndon, S. C., Wood, E. C., Franklin, J. P., Worsnop, D. R., Goldstein, A. H., and Harley, R. A.: Characterization of particulate matter emissions from on-road gasoline and diesel vehicles using a soot particle aerosol mass spectrometer, Atmos. Chem. Phys., 14, 7585–7599, https://doi.org/10.5194/acp-14-7585-2014, 2014.
Dal Maso, M., Kulmala, M., Riipinen, I., Wagner, R., Hussein, T., Aalto, P. P., and Lehtinen, K. E. J.: Formation and growth of fresh atmospheric aerosols: eight years of aerosol size distribution data from SMEAR II, Hyytiala, Finland, Boreal Environ. Res., 10, 323–336, 2005.
DeCarlo, P. F., Slowik, J. G., Worsnop, D. R., Davidovits, P., and Jimenez, J. L.: Particle Morphology and Density Characterization by Combined Mobility and Aerodynamic Diameter Measurements. Part 1: Theory, Aerosol Sci. Technol., 38, 1185–1205, https://doi.org/10.1080/027868290903907, 2004.
Ding, A. J., Huang, X., Nie, W., Sun, J. N., Kerminen, V. M., Petaja, T., Su, H., Cheng, Y. F., Yang, X. Q., Wang, M. H., Chi, X. G., Wang, J. P., Virkkula, A., Guo, W. D., Yuan, J., Wang, S. Y., Zhang, R. J., Wu, Y. F., Song, Y., Zhu, T., Zilitinkevich, S., Kulmala, M., and Fu, C. B.: Enhanced haze pollution by black carbon in megacities in China, Geophys. Res. Lett., 43, 2873–2879, https://doi.org/10.1002/2016gl067745, 2016.
Ding, J., Zhao, P., Su, J., Dong, Q., Du, X., and Zhang, Y.: Aerosol pH and its driving factors in Beijing, Atmos. Chem. Phys., 19, 7939–7954, https://doi.org/10.5194/acp-19-7939-2019, 2019.
Du, W., Zhao, J., Wang, Y., Zhang, Y., Wang, Q., Xu, W., Chen, C., Han, T., Zhang, F., Li, Z., Fu, P., Li, J., Wang, Z., and Sun, Y.: Simultaneous measurements of particle number size distributions at ground level and 260 m on a meteorological tower in urban Beijing, China, Atmos. Chem. Phys., 17, 6797–6811, https://doi.org/10.5194/acp-17-6797-2017, 2017.
Eilmann, B., Zweifel, R., Buchmann, N., Graf Pannatier, E., and Rigling, A.: Drought alters timing, quantity, and quality of wood formation in Scots pine, J. Exp. Bot., 62, 2763–2771, 2011.
Elser, M., Huang, R.-J., Wolf, R., Slowik, J. G., Wang, Q., Canonaco, F., Li, G., Bozzetti, C., Daellenbach, K. R., Huang, Y., Zhang, R., Li, Z., Cao, J., Baltensperger, U., El-Haddad, I., and Prévôt, A. S. H.: New insights into PM2.5 chemical composition and sources in two major cities in China during extreme haze events using aerosol mass spectrometry, Atmos. Chem. Phys., 16, 3207–3225, https://doi.org/10.5194/acp-16-3207-2016, 2016.
Eresmaa, N., Härkönen, J., Joffre, S. M., Schultz, D. M., Karppinen, A., and Kukkonen, J.: A Three-Step Method for Estimating the Mixing Height Using Ceilometer Data from the Helsinki Testbed, J. Appl. Meteorol. Clim., 51, 2172–2187, https://doi.org/10.1175/jamc-d-12-058.1, 2012.
Guo, S., Hu, M., Zamora, M. L., Peng, J., Shang, D., Zheng, J., Du, Z., Wu, Z., Shao, M., Zeng, L., Molina, M. J., and Zhang, R.: Elucidating severe urban haze formation in China, P. Natl. Acad. Sci. USA, 111, 17373–17378, https://doi.org/10.1073/pnas.1419604111, 2014.
Han, S., Kondo, Y., Oshima, N., Takegawa, N., Miyazaki, Y., Hu, M., Lin, P., Deng, Z., Zhao, Y., Sugimoto, N., and Wu, Y.: Temporal variations of elemental carbon in Beijing, J. Geophys. Res., 114, D23202, https://doi.org/10.1029/2009jd012027, 2009.
Harrison, R. M., Beddows, D. C., and Dall'Osto, M.: PMF analysis of wide-range particle size spectra collected on a major highway, Environ. Sci. Technol., 45, 5522–5528, https://doi.org/10.1021/es2006622, 2011.
He, K. B., Yang, F. M., Ma, Y. L., Zhang, Q., Yao, X. H., Chan, C. K., Cadle, S., Chan, T., and Mulawa, P.: The characteristics of PM2.5 in Beijing, China, Atmos. Environ., 35, 4959–4970, https://doi.org/10.1016/s1352-2310(01)00301-6, 2001.
He, L. Y., Hu, M., Huang, X. F., Yu, B.-D., Zhang, Y.-H., and Liu, D.-Q.: Measurement of emissions of fine particulate organic matter from Chinese cooking, Atmos. Environ., 38, 6557–6564, https://doi.org/10.1016/j.atmosenv.2004.08.034, 2004a.
He, L. Y., Hu, M., Wang, L., Huang, X. F., and Zhang, Y. H.: Characterization of fine organic particulate matter from Chinese cooking, J. Environ. Sci., 16, 570–575, 2004b.
He, L.-Y., Lin, Y., Huang, X.-F., Guo, S., Xue, L., Su, Q., Hu, M., Luan, S.-J., and Zhang, Y.-H.: Characterization of high-resolution aerosol mass spectra of primary organic aerosol emissions from Chinese cooking and biomass burning, Atmos. Chem. Phys., 10, 11535–11543, https://doi.org/10.5194/acp-10-11535-2010, 2010.
He, Y., Sun, Y., Wang, Q., Zhou, W., Xu, W., Zhang, Y., Xie, C., Zhao, J., Du, W., Qiu, Y., Lei, L., Fu, P., Wang, Z., and Worsnop, D. R.: A Black Carbon – Tracer Method for Estimating Cooking Organic Aerosol From Aerosol Mass Spectrometer Measurements, Geophys. Res. Lett., 46, 8474–8483, https://doi.org/10.1029/2019gl084092, 2019.
Hu, M., Peng, J., Sun, K., Yue, D., Guo, S., Wiedensohler, A., and Wu, Z.: Estimation of size-resolved ambient particle density based on the measurement of aerosol number, mass, and chemical size distributions in the winter in Beijing, Environ. Sci. Technol., 46, 9941–9947, https://doi.org/10.1021/es204073t, 2012.
Hu, W., Hu, M., Hu, W.-W., Zheng, J., Chen, C., Wu, Y., and Guo, S.: Seasonal variations in high time-resolved chemical compositions, sources, and evolution of atmospheric submicron aerosols in the megacity Beijing, Atmos. Chem. Phys., 17, 9979–10000, https://doi.org/10.5194/acp-17-9979-2017, 2017.
Hu, W. W., Hu, M., Hu, W., Jimenez, J. L., Yuan, B., Chen, W. T., Wang, M., Wu, Y. S., Chen, C., Wang, Z. B., Peng, J. F., Zeng, L. M., and Shao, M.: Chemical composition, sources, and aging process of submicron aerosols in Beijing: Contrast between summer and winter, J. Geophys. Res.-Atmos., 121, 1955–1977, https://doi.org/10.1002/2015jd024020, 2016.
Huang, R. J., Zhang, Y., Bozzetti, C., Ho, K. F., Cao, J. J., Han, Y., Daellenbach, K. R., Slowik, J. G., Platt, S. M., Canonaco, F., Zotter, P., Wolf, R., Pieber, S. M., Bruns, E. A., Crippa, M., Ciarelli, G., Piazzalunga, A., Schwikowski, M., Abbaszade, G., Schnelle-Kreis, J., Zimmermann, R., An, Z., Szidat, S., Baltensperger, U., El Haddad, I., and Prevot, A. S.: High secondary aerosol contribution to particulate pollution during haze events in China, Nature, 514, 218–222, https://doi.org/10.1038/nature13774, 2014.
Hussein, T., Glytsos, T., Ondráček, J., Dohányosová, P., Ždímal, V., Hämeri, K., Lazaridis, M., Smolík, J., and Kulmala, M.: Particle size characterization and emission rates during indoor activities in a house, Atmos. Environ., 40, 4285–4307, https://doi.org/10.1016/j.atmosenv.2006.03.053, 2006.
Jia, Y., Rahn, K. A., He, K., Wen, T., and Wang, Y.: A novel technique for quantifying the regional component of urban aerosol solely from its sawtooth cycles, J. Geophys. Res., 113, D21309, https://doi.org/10.1029/2008jd010389, 2008.
Jimenez, J. L., Canagaratna, M. R., Donahue, N. M., Prevot, A. S., Zhang, Q., Kroll, J. H., DeCarlo, P. F., Allan, J. D., Coe, H., Ng, N. L., Aiken, A. C., Docherty, K. S., Ulbrich, I. M., Grieshop, A. P., Robinson, A. L., Duplissy, J., Smith, J. D., Wilson, K. R., Lanz, V. A., Hueglin, C., Sun, Y. L., Tian, J., Laaksonen, A., Raatikainen, T., Rautiainen, J., Vaattovaara, P., Ehn, M., Kulmala, M., Tomlinson, J. M., Collins, D. R., Cubison, M. J., Dunlea, E. J., Huffman, J. A., Onasch, T. B., Alfarra, M. R., Williams, P. I., Bower, K., Kondo, Y., Schneider, J., Drewnick, F., Borrmann, S., Weimer, S., Demerjian, K., Salcedo, D., Cottrell, L., Griffin, R., Takami, A., Miyoshi, T., Hatakeyama, S., Shimono, A., Sun, J. Y., Zhang, Y. M., Dzepina, K., Kimmel, J. R., Sueper, D., Jayne, J. T., Herndon, S. C., Trimborn, A. M., Williams, L. R., Wood, E. C., Middlebrook, A. M., Kolb, C. E., Baltensperger, U., and Worsnop, D. R.: Evolution of organic aerosols in the atmosphere, Science, 326, 1525–1529, https://doi.org/10.1126/science.1180353, 2009.
Jokinen, T., Sipilä, M., Junninen, H., Ehn, M., Lönn, G., Hakala, J., Petäjä, T., Mauldin III, R. L., Kulmala, M., and Worsnop, D. R.: Atmospheric sulphuric acid and neutral cluster measurements using CI-APi-TOF, Atmos. Chem. Phys., 12, 4117–4125, https://doi.org/10.5194/acp-12-4117-2012, 2012.
Kontkanen, J., Deng, C., Fu, Y., Dada, L., Zhou, Y., Cai, J., Daellenbach, K. R., Hakala, S., Kokkonen, T. V., Lin, Z., Liu, Y., Wang, Y., Yan, C., Petäjä, T., Jiang, J., Kulmala, M., and Paasonen, P.: Size-resolved particle number emissions in Beijing determined from measured particle size distributions, Atmos. Chem. Phys., 20, 11329–11348, https://doi.org/10.5194/acp-20-11329-2020, 2020.
Kulmala, M., Petäjä, T., Nieminen, T., Sipilä, M., Manninen, H. E., Lehtipalo, K., Dal Maso, M., Aalto, P. P., Junninen, H., Paasonen, P., Riipinen, I., Lehtinen, K. E. J., Laaksonen, A., and Kerminen, V.-M.: Measurement of the nucleation of atmospheric aerosol particles, Nat. Protoc., 7, 1651–1667, https://doi.org/10.1038/nprot.2012.091, 2012.
Lelieveld, J., Evans, J. S., Fnais, M., Giannadaki, D., and Pozzer, A.: The contribution of outdoor air pollution sources to premature mortality on a global scale, Nature, 525, 367–371, https://doi.org/10.1038/nature15371, 2015.
Li, C. S., Lin, W. H., and Jenq, F. T.: Size Distributions of Submicrometer Aerosols from Cooking, Environ. Int., 19, 147–154, https://doi.org/10.1016/0160-4120(93)90365-o, 1993.
Li, H., Zhang, Q., Zhang, Q., Chen, C., Wang, L., Wei, Z., Zhou, S., Parworth, C., Zheng, B., Canonaco, F., Prévôt, A. S. H., Chen, P., Zhang, H., Wallington, T. J., and He, K.: Wintertime aerosol chemistry and haze evolution in an extremely polluted city of the North China Plain: significant contribution from coal and biomass combustion, Atmos. Chem. Phys., 17, 4751–4768, https://doi.org/10.5194/acp-17-4751-2017, 2017.
Li, W. J., Zhang, D. Z., Shao, L. Y., Zhou, S. Z., and Wang, W. X.: Individual particle analysis of aerosols collected under haze and non-haze conditions at a high-elevation mountain site in the North China plain, Atmos. Chem. Phys., 11, 11733–11744, https://doi.org/10.5194/acp-11-11733-2011, 2011.
Liu, T., Li, Z., Chan, M., and Chan, C. K.: Formation of secondary organic aerosols from gas-phase emissions of heated cooking oils, Atmos. Chem. Phys., 17, 7333–7344, https://doi.org/10.5194/acp-17-7333-2017, 2017a.
Liu, T., Wang, Z., Huang, D. D., Wang, X., and Chan, C. K.: Significant Production of Secondary Organic Aerosol from Emissions of Heated Cooking Oils, Environ. Sci. Tech. Let., 5, 32–37, https://doi.org/10.1021/acs.estlett.7b00530, 2017b.
Liu, Z., Hu, B., Zhang, J., Xin, J., Wu, F., Gao, W., Wang, M., and Wang, Y.: Characterization of fine particles during the 2014 Asia-Pacific economic cooperation summit: Number concentration, size distribution and sources, Tellus B, 69, 1303228, https://doi.org/10.1080/16000889.2017.1303228, 2017.
Liu, Z. R., Hu, B., Liu, Q., Sun, Y., and Wang, Y. S.: Source apportionment of urban fine particle number concentration during summertime in Beijing, Atmos. Environ., 96, 359–369, https://doi.org/10.1016/j.atmosenv.2014.06.055, 2014.
Lu, K., Fuchs, H., Hofzumahaus, A., Tan, Z., Wang, H., Zhang, L., Schmitt, S. H., Rohrer, F., Bohn, B., Broch, S., Dong, H., Gkatzelis, G. I., Hohaus, T., Holland, F., Li, X., Liu, Y., Liu, Y., Ma, X., Novelli, A., Schlag, P., Shao, M., Wu, Y., Wu, Z., Zeng, L., Hu, M., Kiendler-Scharr, A., Wahner, A., and Zhang, Y.: Fast Photochemistry in Wintertime Haze: Consequences for Pollution Mitigation Strategies, Environ. Sci. Technol., 53, 10676–10684, https://doi.org/10.1021/acs.est.9b02422, 2019.
Manninen, H. E., Franchin, A., Schobesberger, S., Hirsikko, A., Hakala, J., Skromulis, A., Kangasluoma, J., Ehn, M., Junninen, H., Mirme, A., Mirme, S., Sipilä, M., Petäjä, T., Worsnop, D. R., and Kulmala, M.: Characterisation of corona-generated ions used in a Neutral cluster and Air Ion Spectrometer (NAIS), Atmos. Meas. Tech., 4, 2767–2776, https://doi.org/10.5194/amt-4-2767-2011, 2011.
Middlebrook, A. M., Bahreini, R., Jimenez, J. L., and Canagaratna, M. R.: Evaluation of Composition-Dependent Collection Efficiencies for the Aerodyne Aerosol Mass Spectrometer using Field Data, Aerosol Sci. Tech., 46, 258–271, https://doi.org/10.1080/02786826.2011.620041, 2012.
Mirme, S. and Mirme, A.: The mathematical principles and design of the NAIS – a spectrometer for the measurement of cluster ion and nanometer aerosol size distributions, Atmos. Meas. Tech., 6, 1061–1071, https://doi.org/10.5194/amt-6-1061-2013, 2013.
Mohr, C., Huffman, J. A., Cubison, M. J., Aiken, A. C., Docherty, K. S., Kimmel, J. R., Ulbrich, I. M., Hannigan, M., and Jimenez, J. L.: Characterization of Primary Organic Aerosol Emissions from Meat Cooking, Trash Burning, and Motor Vehicles with High-Resolution Aerosol Mass Spectrometry and Comparison with Ambient and Chamber Observations, Environ. Sci. Technol., 43, 2443–2449, https://doi.org/10.1021/es8011518, 2009.
Mohr, C., DeCarlo, P. F., Heringa, M. F., Chirico, R., Slowik, J. G., Richter, R., Reche, C., Alastuey, A., Querol, X., Seco, R., Peñuelas, J., Jiménez, J. L., Crippa, M., Zimmermann, R., Baltensperger, U., and Prévôt, A. S. H.: Identification and quantification of organic aerosol from cooking and other sources in Barcelona using aerosol mass spectrometer data, Atmos. Chem. Phys., 12, 1649–1665, https://doi.org/10.5194/acp-12-1649-2012, 2012.
Ogulei, D., Hopke, P. K., Chalupa, D. C., and Utell, M. J.: Modeling Source Contributions to Submicron Particle Number Concentrations Measured in Rochester, New York, Aerosol Sci. Tech., 41, 179–201, https://doi.org/10.1080/02786820601116012, 2007.
Park, K., Kittelson, D. B., Zachariah, M. R., and McMurry, P. H.: Measurement of Inherent Material Density of Nanoparticle Agglomerates, J. Nanopart. Res., 6, 267–272, https://doi.org/10.1023/B:NANO.0000034657.71309.e6, 2004.
Peck, J., Gonzalez, L. A., Williams, L. R., Xu, W., Croteau, P. L., Timko, M. T., Jayne, J. T., Worsnop, D. R., Miake-Lye, R. C., and Smith, K. A.: Development of an aerosol mass spectrometer lens system for PM2.5, Aerosol Sci. Tech., 50, 781–789, https://doi.org/10.1080/02786826.2016.1190444, 2016.
Peng, J. F., Hu, M., Wang, Z. B., Huang, X. F., Kumar, P., Wu, Z. J., Guo, S., Yue, D. L., Shang, D. J., Zheng, Z., and He, L. Y.: Submicron aerosols at thirteen diversified sites in China: size distribution, new particle formation and corresponding contribution to cloud condensation nuclei production, Atmos. Chem. Phys., 14, 10249–10265, https://doi.org/10.5194/acp-14-10249-2014, 2014.
Poulain, L., Birmili, W., Canonaco, F., Crippa, M., Wu, Z. J., Nordmann, S., Spindler, G., Prévôt, A. S. H., Wiedensohler, A., and Herrmann, H.: Chemical mass balance of 300 ∘C non-volatile particles at the tropospheric research site Melpitz, Germany, Atmos. Chem. Phys., 14, 10145–10162, https://doi.org/10.5194/acp-14-10145-2014, 2014.
Qiao, K., Wu, Z., Pei, X., Liu, Q., Shang, D., Zheng, J., Du, Z., Zhu, W., Wu, Y., Lou, S., Guo, S., Chan, C. K., Pathak, R. K., Hallquist, M., and Hu, M.: Size-resolved effective density of submicron particles during summertime in the rural atmosphere of Beijing, China, J. Environ. Sci.-China, 73, 69–77, https://doi.org/10.1016/j.jes.2018.01.012, 2018.
Reyes-Villegas, E., Bannan, T., Le Breton, M., Mehra, A., Priestley, M., Percival, C., Coe, H., and Allan, J. D.: Online Chemical Characterization of Food-Cooking Organic Aerosols: Implications for Source Apportionment, Environ. Sci. Technol., 52, 5308–5318, https://doi.org/10.1021/acs.est.7b06278, 2018.
Rogge, W. F., Hildemann, L. M., Mazurek, M. A., Cass, G. R., and Simoneit, B. R. T.: Sources of fine organic aerosol. 1. Charbroilers and meat cooking operations, Environ. Sci. Technol., 25, 1112–1125, https://doi.org/10.1021/es00018a015, 1991.
Ronkko, T., Kuuluvainen, H., Karjalainen, P., Keskinen, J., Hillamo, R., Niemi, J. V., Pirjola, L., Timonen, H. J., Saarikoski, S., Saukko, E., Jarvinen, A., Silvennoinen, H., Rostedt, A., Olin, M., Yli-Ojanpera, J., Nousiainen, P., Kousa, A., and Dal Maso, M.: Traffic is a major source of atmospheric nanocluster aerosol, P. Natl. Acad. Sci. USA, 114, 7549–7554, https://doi.org/10.1073/pnas.1700830114, 2017.
Salcedo, D., Onasch, T. B., Dzepina, K., Canagaratna, M. R., Zhang, Q., Huffman, J. A., DeCarlo, P. F., Jayne, J. T., Mortimer, P., Worsnop, D. R., Kolb, C. E., Johnson, K. S., Zuberi, B., Marr, L. C., Volkamer, R., Molina, L. T., Molina, M. J., Cardenas, B., Bernabé, R. M., Márquez, C., Gaffney, J. S., Marley, N. A., Laskin, A., Shutthanandan, V., Xie, Y., Brune, W., Lesher, R., Shirley, T., and Jimenez, J. L.: Characterization of ambient aerosols in Mexico City during the MCMA-2003 campaign with Aerosol Mass Spectrometry: results from the CENICA Supersite, Atmos. Chem. Phys., 6, 925–946, https://doi.org/10.5194/acp-6-925-2006, 2006.
Schauer, J. J., Kleeman, M. J., Cass, G. R., and Simoneit, B. R. T.: Measurement of Emissions from Air Pollution Sources. 4. C1-C27 Organic Compounds from Cooking with Seed Oils, Environ. Sci. Technol., 36, 567–575, https://doi.org/10.1021/es002053m, 2002.
Sharma, S., Leaitch, W. R., Huang, L., Veber, D., Kolonjari, F., Zhang, W., Hanna, S. J., Bertram, A. K., and Ogren, J. A.: An evaluation of three methods for measuring black carbon in Alert, Canada, Atmos. Chem. Phys., 17, 15225–15243, https://doi.org/10.5194/acp-17-15225-2017, 2017.
Song, S., Wu, Y., Xu, J., Ohara, T., Hasegawa, S., Li, J., Yang, L., and Hao, J.: Black carbon at a roadside site in Beijing: Temporal variations and relationships with carbon monoxide and particle number size distribution, Atmos. Environ., 77, 213–221, https://doi.org/10.1016/j.atmosenv.2013.04.055, 2013.
Su, J., Zhao, P., and Dong, Q.: Chemical Compositions and Liquid Water Content of Size-Resolved Aerosol in Beijing, Aerosol Air Qual. Res., 18, 680–692, https://doi.org/10.4209/aaqr.2017.03.0122, 2018.
Sun, K., Liu, X., Gu, J., Li, Y., Qu, Y., An, J., Wang, J., Zhang, Y., Hu, M., and Zhang, F.: Chemical characterization of size-resolved aerosols in four seasons and hazy days in the megacity Beijing of China, J. Environ. Sci.-China, 32, 155–167, https://doi.org/10.1016/j.jes.2014.12.020, 2015.
Sun, Y. L., Wang, Z., Dong, H., Yang, T., Li, J., Pan, X., Chen, P., and Jayne, J. T.: Characterization of summer organic and inorganic aerosols in Beijing, China with an Aerosol Chemical Speciation Monitor, Atmos. Environ., 51, 250–259, https://doi.org/10.1016/j.atmosenv.2012.01.013, 2012.
Sun, Y. L., Wang, Z., Fu, P., Jiang, Q., Yang, T., Li, J., and Ge, X.: The impact of relative humidity on aerosol composition and evolution processes during wintertime in Beijing, China, Atmos. Environ., 77, 927–934, https://doi.org/10.1016/j.atmosenv.2013.06.019, 2013a.
Sun, Y. L., Wang, Z. F., Fu, P. Q., Yang, T., Jiang, Q., Dong, H. B., Li, J., and Jia, J. J.: Aerosol composition, sources and processes during wintertime in Beijing, China, Atmos. Chem. Phys., 13, 4577–4592, https://doi.org/10.5194/acp-13-4577-2013, 2013b.
Sun, Y. L., Xu, W., Zhang, Q., Jiang, Q., Canonaco, F., Prévôt, A. S. H., Fu, P., Li, J., Jayne, J., Worsnop, D. R., and Wang, Z.: Source apportionment of organic aerosol from 2-year highly time-resolved measurements by an aerosol chemical speciation monitor in Beijing, China, Atmos. Chem. Phys., 18, 8469–8489, https://doi.org/10.5194/acp-18-8469-2018, 2018.
Tan, Y., Henderick, P., Yoon, S., Herner, J., Montes, T., Boriboonsomsin, K., Johnson, K., Scora, G., Sandez, D., and Durbin, T. D.: On-Board Sensor-Based NOx Emissions from Heavy-Duty Diesel Vehicles, Environ. Sci. Technol., 53, 5504–5511, https://doi.org/10.1021/acs.est.8b07048, 2019.
Tao, J., Zhang, L., Cao, J., and Zhang, R.: A review of current knowledge concerning PM2.5 chemical composition, aerosol optical properties and their relationships across China, Atmos. Chem. Phys., 17, 9485–9518, https://doi.org/10.5194/acp-17-9485-2017, 2017.
Turpin, B. J. and Lim, H.-J.: Species Contributions to PM2.5 Mass Concentrations: Revisiting Common Assumptions for Estimating Organic Mass, Aerosol Sci. Tech., 35, 602–610, https://doi.org/10.1080/02786820119445, 2001.
Ulbrich, I. M., Canagaratna, M. R., Zhang, Q., Worsnop, D. R., and Jimenez, J. L.: Interpretation of organic components from Positive Matrix Factorization of aerosol mass spectrometric data, Atmos. Chem. Phys., 9, 2891–2918, https://doi.org/10.5194/acp-9-2891-2009, 2009.
Vu, T. V., Delgado-Saborit, J. M., and Harrison, R. M.: Review: Particle number size distributions from seven major sources and implications for source apportionment studies, Atmos. Environ., 122, 114–132, https://doi.org/10.1016/j.atmosenv.2015.09.027, 2015.
Wang, J., Liu, D., Ge, X., Wu, Y., Shen, F., Chen, M., Zhao, J., Xie, C., Wang, Q., Xu, W., Zhang, J., Hu, J., Allan, J., Joshi, R., Fu, P., Coe, H., and Sun, Y.: Characterization of black carbon-containing fine particles in Beijing during wintertime, Atmos. Chem. Phys., 19, 447–458, https://doi.org/10.5194/acp-19-447-2019, 2019.
Wang, X., Westerdahl, D., Wu, Y., Pan, X., and Zhang, K. M.: On-road emission factor distributions of individual diesel vehicles in and around Beijing, China, Atmos. Environ., 45, 503–513, https://doi.org/10.1016/j.atmosenv.2010.09.014, 2011.
Wang, Y., Wang, Y., Wang, L., Petäjä, T., Zha, Q., Gong, C., Li, S., Pan, Y., Hu, B., Xin, J., and Kulmala, M.: Increased inorganic aerosol fraction contributes to air pollution and haze in China, Atmos. Chem. Phys., 19, 5881–5888, https://doi.org/10.5194/acp-19-5881-2019, 2019.
Wang, Z. B., Hu, M., Wu, Z. J., Yue, D. L., He, L. Y., Huang, X. F., Liu, X. G., and Wiedensohler, A.: Long-term measurements of particle number size distributions and the relationships with air mass history and source apportionment in the summer of Beijing, Atmos. Chem. Phys., 13, 10159–10170, https://doi.org/10.5194/acp-13-10159-2013, 2013.
Wehner, B., Birmili, W., Gnauk, T., and Wiedensohler, A.: Particle number size distributions in a street canyon and their transformation into the urban-air background: measurements and a simple model study, Atmos. Environ., 36, 2215–2223, https://doi.org/10.1016/s1352-2310(02)00174-7, 2002.
Wehner, B., Uhrner, U., von Löwis, S., Zallinger, M., and Wiedensohler, A.: Aerosol number size distributions within the exhaust plume of a diesel and a gasoline passenger car under on-road conditions and determination of emission factors, Atmos. Environ., 43, 1235–1245, https://doi.org/10.1016/j.atmosenv.2008.11.023, 2009.
Wright, A. A. and Institute of Marine Engineers: Exhaust emissions from combustion machinery, Institute of Marine Engineers, London, 2000.
Wu, C. L., Chao, C. Y. H., Sze-To, G. N., Wan, M. P., and Chan, T. C.: Ultrafine Particle Emissions from Cigarette Smouldering, Incense Burning, Vacuum Cleaner Motor Operation and Cooking, Indoor Built Environ., 21, 782–796, https://doi.org/10.1177/1420326x11421356, 2011.
Wu, S.-P., Schwab, J., Liu, B.-L., Li, T.-C., and Yuan, C.-S.: Seasonal variations and source identification of selected organic acids associated with PM10 in the coastal area of Southeastern China, Atmos. Res., 155, 37–51, https://doi.org/10.1016/j.atmosres.2014.11.014, 2015.
Wu, Z., Hu, M., Liu, S., Wehner, B., Bauer, S., Ma ßling, A., Wiedensohler, A., Petäjä, T., Dal Maso, M., and Kulmala, M.: New particle formation in Beijing, China: Statistical analysis of a 1-year data set, J. Geophys. Res., 112, 797–806, https://doi.org/10.1029/2006jd007406, 2007.
Xing, J., Shao, L., Zhang, W., Peng, J., Wang, W., Shuai, S., Hu, M., and Zhang, D.: Morphology and size of the particles emitted from a gasoline-direct-injection-engine vehicle and their ageing in an environmental chamber, Atmos. Chem. Phys., 20, 2781–2794, https://doi.org/10.5194/acp-20-2781-2020, 2020.
Xu, J., Zhang, Q., Chen, M., Ge, X., Ren, J., and Qin, D.: Chemical composition, sources, and processes of urban aerosols during summertime in northwest China: insights from high-resolution aerosol mass spectrometry, Atmos. Chem. Phys., 14, 12593–12611, https://doi.org/10.5194/acp-14-12593-2014, 2014.
Xu, J., Shi, J., Zhang, Q., Ge, X., Canonaco, F., Prévôt, A. S. H., Vonwiller, M., Szidat, S., Ge, J., Ma, J., An, Y., Kang, S., and Qin, D.: Wintertime organic and inorganic aerosols in Lanzhou, China: sources, processes, and comparison with the results during summer, Atmos. Chem. Phys., 16, 14937–14957, https://doi.org/10.5194/acp-16-14937-2016, 2016.
Xu, W., Croteau, P., Williams, L., Canagaratna, M., Onasch, T., Cross, E., Zhang, X., Robinson, W., Worsnop, D., and Jayne, J.: Laboratory characterization of an aerosol chemical speciation monitor with PM2.5 measurement capability, Aerosol Sci. Tech., 51, 69–83, https://doi.org/10.1080/02786826.2016.1241859, 2017.
Xu, W., Lambe, A., Silva, P., Hu, W. W., Onasch, T., Williams, L., Croteau, P., Zhang, X., Renbaum-Wolff, L., Fortner, E., Jimenez, J. L., Jayne, J., Worsnop, D., and Canagaratna, M.: Laboratory evaluation of species-dependent relative ionization efficiencies in the Aerodyne Aerosol Mass Spectrometer, Aerosol Sci. Tech., 52, 626–641, https://doi.org/10.1080/02786826.2018.1439570, 2018.
Xu, W., Sun, Y., Wang, Q., Zhao, J., Wang, J., Ge, X., Xie, C., Zhou, W., Du, W., Li, J., Fu, P., Wang, Z., Worsnop, D. R., and Coe, H.: Changes in Aerosol Chemistry From 2014 to 2016 in Winter in Beijing: Insights From High-Resolution Aerosol Mass Spectrometry, J. Geophys. Res.-Atmos., 124, 1132–1147, https://doi.org/10.1029/2018jd029245, 2019.
Yang, D., Zhang, S., Niu, T., Wang, Y., Xu, H., Zhang, K. M., and Wu, Y.: High-resolution mapping of vehicle emissions of atmospheric pollutants based on large-scale, real-world traffic datasets, Atmos. Chem. Phys., 19, 8831–8843, https://doi.org/10.5194/acp-19-8831-2019, 2019.
Yeung, L. L., and To, W. M.: Size Distributions of the Aerosols Emitted from Commercial Cooking Processes, Indoor Built Environ., 17, 220–229, https://doi.org/10.1177/1420326x08092043, 2008.
Yin, Z., Ye, X., Jiang, S., Tao, Y., Shi, Y., Yang, X., and Chen, J.: Size-resolved effective density of urban aerosols in Shanghai, Atmos. Environ., 100, 133–140, https://doi.org/10.1016/j.atmosenv.2014.10.055, 2015.
Zhai, W., Wen, D., Xiang, S., Hu, Z., and Noll, K. E.: Ultrafine-Particle Emission Factors as a Function of Vehicle Mode of Operation for LDVs Based on Near-Roadway Monitoring, Environ. Sci. Technol., 50, 782–789, https://doi.org/10.1021/acs.est.5b03885, 2016.
Zhang, P., Zhang, L., Tian, X., Hao, Y., and Wang, C.: Urban energy transition in China: Insights from trends, socioeconomic drivers, and environmental impacts of Beijing, Energ. Policy, 117, 173–183, https://doi.org/10.1016/j.enpol.2018.02.039, 2018.
Zhang, Q., Jimenez, J. L., Canagaratna, M. R., Ulbrich, I. M., Ng, N. L., Worsnop, D. R., and Sun, Y.: Understanding atmospheric organic aerosols via factor analysis of aerosol mass spectrometry: a review, Anal. Bioanal. Chem., 401, 3045–3067, https://doi.org/10.1007/s00216-011-5355-y, 2011.
Zhang, Q., Ning, Z., Shen, Z., Li, G., Zhang, J., Lei, Y., Xu, H., Sun, J., Zhang, L., Westerdahl, D., Gali, N. K., and Gong, X.: Variations of aerosol size distribution, chemical composition and optical properties from roadside to ambient environment: A case study in Hong Kong, China, Atmos. Environ., 166, 234–243, https://doi.org/10.1016/j.atmosenv.2017.07.030, 2017.
Zhang, R., Jing, J., Tao, J., Hsu, S.-C., Wang, G., Cao, J., Lee, C. S. L., Zhu, L., Chen, Z., Zhao, Y., and Shen, Z.: Chemical characterization and source apportionment of PM2.5 in Beijing: seasonal perspective, Atmos. Chem. Phys., 13, 7053–7074, https://doi.org/10.5194/acp-13-7053-2013, 2013.
Zhang, X. Y., Gong, S. L., Shen, Z. X., Mei, F. M., Xi, X. X., Liu, L. C., Zhou, Z. J., Wang, D., Wang, Y. Q., and Cheng, Y.: Characterization of soil dust aerosol in China and its transport and distribution during 2001 ACE-Asia: 1. Network observations, J. Geophys. Res.-Atmos., 108, 4261, https://doi.org/10.1029/2002jd002632, 2003.
Zhang, Y., Cai, J., Wang, S., He, K., and Zheng, M.: Review of receptor-based source apportionment research of fine particulate matter and its challenges in China, Sci. Total Environ., 586, 917–929, https://doi.org/10.1016/j.scitotenv.2017.02.071, 2017.
Zhao, J., Du, W., Zhang, Y., Wang, Q., Chen, C., Xu, W., Han, T., Wang, Y., Fu, P., Wang, Z., Li, Z., and Sun, Y.: Insights into aerosol chemistry during the 2015 China Victory Day parade: results from simultaneous measurements at ground level and 260 m in Beijing, Atmos. Chem. Phys., 17, 3215–3232, https://doi.org/10.5194/acp-17-3215-2017, 2017.
Zhao, Y., and Zhao, B.: Emissions of air pollutants from Chinese cooking: A literature review, Build. Simul.-China, 11, 977–995, https://doi.org/10.1007/s12273-018-0456-6, 2018.
Zhou, Y., Dada, L., Liu, Y., Fu, Y., Kangasluoma, J., Chan, T., Yan, C., Chu, B., Daellenbach, K. R., Bianchi, F., Kokkonen, T. V., Liu, Y., Kujansuu, J., Kerminen, V.-M., Petäjä, T., Wang, L., Jiang, J., and Kulmala, M.: Variation of size-segregated particle number concentrations in wintertime Beijing, Atmos. Chem. Phys., 20, 1201–1216, https://doi.org/10.5194/acp-20-1201-2020, 2020.