the Creative Commons Attribution 4.0 License.
the Creative Commons Attribution 4.0 License.
 | 03 Nov 2020
Vertical variability of the properties of highly aged biomass burning aerosol transported over the southeast Atlantic during CLARIFY-2017
Huihui Wu
Jonathan W. Taylor
Kate Szpek
Justin M. Langridge
Paul I. Williams
Michael Flynn
James D. Allan
Steven J. Abel
Joseph Pitt
Michael I. Cotterell
Cathryn Fox
Nicholas W. Davies
Jim Haywood
Seasonal biomass burning (BB) from June to October in central and southern Africa leads to absorbing aerosols being transported over the South Atlantic Ocean every year and contributes significantly to the regional climate forcing. The vertical distribution of submicron aerosols and their properties were characterized over the remote southeast Atlantic, using airborne in situ measurements made during the CLoud-Aerosol-Radiation Interactions and Forcing for Year 2017 (CLARIFY-2017) campaign. BB aerosols emitted from flaming-controlled fires were intensively observed in the region surrounding Ascension Island, in the marine boundary layer (MBL) and free troposphere (FT) up to 5 km. We show that the aerosols had undergone a significant ageing process during > 7 d transit from source, as indicated by the highly oxidized organic aerosol. The highly aged BB aerosols in the far-field CLARIFY region were also especially rich in black carbon (BC), with relatively low single-scattering albedos (SSAs), compared with those from other BB transported regions.
The column-weighted dry SSAs during CLARIFY were observed to be 0.85, 0.84 and 0.83 at 405, 550 and 658 nm respectively. We also found significant vertical variation in the dry SSA, as a function of relative chemical composition and size. The lowest SSA in the column was generally in the low FT layer around 2000 m altitude (averages: 0.82, 0.81 and 0.79 at 405, 550 and 658 nm). This finding is important since it means that BB aerosols across the southeast Atlantic region are more absorbing than currently represented in climate models, implying that the radiative forcing from BB may be more strongly positive than previously thought. Furthermore, in the FT, average SSAs at 405, 550 and 658 nm increased to 0.87, 0.86 and 0.85 with altitude up to 5 km. This was associated with an enhanced inorganic nitrate mass fraction and aerosol size, likely resulting from increased partitioning of ammonium nitrate to the existing particles at higher altitude with lower temperature and higher relative humidity. After entrainment into the boundary layer (BL), aerosols were generally smaller in dry size than in the FT and had a larger fraction of scattering material with resultant higher average dry SSA, mostly due to marine emissions and aerosol removal by drizzle. In the BL, the SSA decreased from the surface to the BL top, with the highest SSA in the column observed near the surface. Our results provide unique observational constraints on aerosol parameterizations used in modelling regional radiation interactions over this important region. We recommend that future work should consider the impact of this vertical variability on climate models.
- Article
(3167 KB) - Full-text XML
-
Supplement
(404 KB) - BibTeX
- EndNote


Open biomass burning (BB) is a major source of global trace gases and carbonaceous aerosol particles in the atmosphere. The smoke aerosol emitted from BB is mainly comprised of strongly absorbing black carbon (BC) and fine organic aerosol (OA), whose proportions vary according to vegetation type, oxygen availability and combustion phase (Andreae and Merlet, 2001; Andreae, 2019). As controls continue to reduce aerosol emissions from fossil fuels and a changing climate potentially leads to more fires, the relative impact of BB on climate forcing is expected to increase (Fuzzi et al., 2015).
Seasonal burning of grasslands and agricultural residue occurs between June and October across the central and southern African savanna, contributing about one-third of the global BB emissions (van der Werf et al., 2010). Previous space-based observations showed that smoke aerosols produced by this burning are primarily transported westward for thousands of kilometres over the South Atlantic region by free tropospheric (FT) winds (Edwards et al., 2006; Adebiyi and Zuidema, 2016). These smoke layers typically over-lie vast stretches of marine stratocumulus clouds (Adebiyi et al., 2015), where they can exert a warming effect by absorbing both downwelling solar radiation and that scattered upwards from the low-lying clouds (Samset et al., 2013). This direct radiative effect is sensitive to the smoke's single-scattering albedo (SSA), which is a function of aerosol composition and size and evolves with particle age (Abel et al., 2005). Space-based and in situ field observations also suggested that the smoke layers can be entrained into the marine boundary layer (MBL) during its transport from land over ocean (Painemal et al., 2014; Zuidema et al., 2018; Haslett et al., 2019a). The entrained aerosols in the MBL can affect cloud microphysics by acting as cloud condensation nuclei (CCN), inducing indirect radiative effects over the southeast Atlantic by increasing cloud droplet number and reducing precipitation, thereby increasing cloud coverage and cloud albedo (e.g. Costantino and Bréon, 2013). In addition, BC immersed in cloud droplets absorbs light and may facilitate water evaporation. BC below clouds could enhance the formation of convection by providing additional heating within the sub-cloud layer. Zhang and Zuidema (2019) reported that shortwave absorption within the smoky MBL reduces the sub-cloud relative humidity due to raising the temperature and so reduces daytime low-level cloud cover over the southeast Atlantic, which is opposite to the mechanism of increased aerosol increasing cloud droplet numbers. Furthermore, large eddy model studies have shown that marine stratocumulus clouds over the southeast Atlantic also adjust to the presence of overlying absorbing aerosol layers, depending on their properties and distance with low-cloud deck (e.g. Herbert et al., 2020). The above-cloud shortwave absorption can warm the FT, strengthening the temperature inversion and reducing the entrainment of warm and dry air from the FT into the MBL, thus influencing MBL humidity, temperature and dynamics. These effects described above, which perturb the temperature structure of the atmosphere and influence the cloud distribution, are collectively termed semi-direct effects.
BB emission in Africa has been shown to be relatively stable on multi-annual timescales (Voulgarakis et al., 2015), implying that transport of African BB aerosol (BBA) across the Atlantic region has likely been a consistent phenomenon over past decades. Although BB transport regions have lower aerosol concentrations than areas closer to the source, the large spatial coverage means that their contribution to the regional/global-average forcing is important. Moreover, the southeast Atlantic has persistent overlying semi-permanent stratocumulus clouds, and therefore aerosol cloud interactions in this specific transport region are strong. Gordon et al. (2018) simulated the radiative effects of smoke aerosols transported from Africa over the southeast Atlantic area near Ascension Island in a regional model, reporting substantial regional direct radiative effects of +11 W m−2, a semi-direct effect of −30.5 W m−2 and an indirect effect of −10.1 W m−2. This implies an overall cooling effect and highlights the important climate effect of transported BBA over the southeast Atlantic region. The extent to which smoke layers over the Atlantic Ocean subside and entrain into the MBL varies between different models (Peers et al., 2016; Das et al., 2017). Some modelled BB smoke layers quickly descend to lower levels just off the western coast of the continent, whereas space-based observations suggest that smoke layers continue their horizontal transport at elevated levels above the MBL for thousands of kilometres (Das et al., 2017). This is crucial because the simulated aerosol effects are dependent on the vertical distribution of aerosol (especially with respect to clouds) and whether the absorbing aerosols is present within, below or above the cloud (Samset et al., 2013). The uncertainty in simulated aerosol vertical distribution would cause a significant diversity in modelled climate forcing over the region. A recent study demonstrated that models generally underestimate the smoke base height over the southeast Atlantic and thus lead to an overestimation of aerosol loading in the MBL (Shinozuka et al., 2020). Uncertainty in SSA is also one of the largest sources of uncertainty in estimating the aerosol direct effects (McComiskey et al., 2008; Shinozuka et al., 2020). To improve simulations of aerosol radiative effects, it is vital to constrain models using observational studies.
Satellite-based observations have been employed in this region, but satellite retrievals often detect the bottom of the aerosol layer too high and thereby overestimate the above-cloud aerosol height (e.g. Rajapakshe et al., 2017). The ability of satellites to quantify BBA amount and its microphysical and optical properties in the marine BL is also limited, since the presence of intervening cloud layers brings significant challenges to retrievals of aerosol properties. Due to the persistent stratocumulus cloud deck over the South Atlantic, most of the region is affected by clouds, and so MBL properties are hard to obtain from satellites. Furthermore, satellite retrievals provide column-integrated aerosol properties and fail to provide information on the large vertical variabilities in aerosol properties. The LASIC (Layered Atlantic Smoke Interactions with Clouds) field campaign was conducted on Ascension Island in the southeast Atlantic, delivering in situ ground-based aerosol measurements (Zuidema et al., 2018) and column information retrieved from surface-based remote sensing. These measurements were limited to single-point or column observations but provide a long and continuous time series. The vertically resolved retrievals obtained during the LASIC campaign using a co-located micropulse lidar also have retrieval limitations (Delgadillo et al., 2018).
Previous key aircraft measurements focusing on the southern African BB include the SAFARI 2000 (the Southern African Regional Science Initiative) campaign in September 2000 (Haywood et al., 2003a, b). Fresh BB smoke in SAFARI 2000 was observed on a single flight directly over a terrestrial large fire (on 13 September 2000), aged smoke was observed from flights over the continent or near the Namibian coast, and a single profile of BBA was analysed close to Ascension Island. More recently, the NASA ORACLES (ObseRvations of Aerosols above CLouds and their intEractionS) campaigns in September 2016, August to September 2017, and October 2018 extended measurements over the South Atlantic, mostly sampling westward of the SAFARI region and eastward of 0∘ E (Zuidema et al., 2016; Pistone et al., 2019). The AEROCLO-sA (Aerosols, Radiation and Clouds in southern Africa) campaign in August to September 2017 also focused on BBA just before crossing the Namibian coast (Formenti et al., 2019). The DACCIWA (Dynamics-Aerosol-Chemistry-Cloud Interactions in West Africa) campaign in June to July 2016 reported aged BBAs that were transported from southern Africa to both the FT and MBL near the southern coastal region of West Africa (Haslett et al., 2019a, b). Although these aircraft measurements covered African BBA with different ages, they did not provide a broad-scale picture of long-range transported BBA over the remote southeast Atlantic. Observations of the vertical distribution of transported BBA over the remote southeast Atlantic are therefore essential to provide better constraints on future climate model studies in this region.
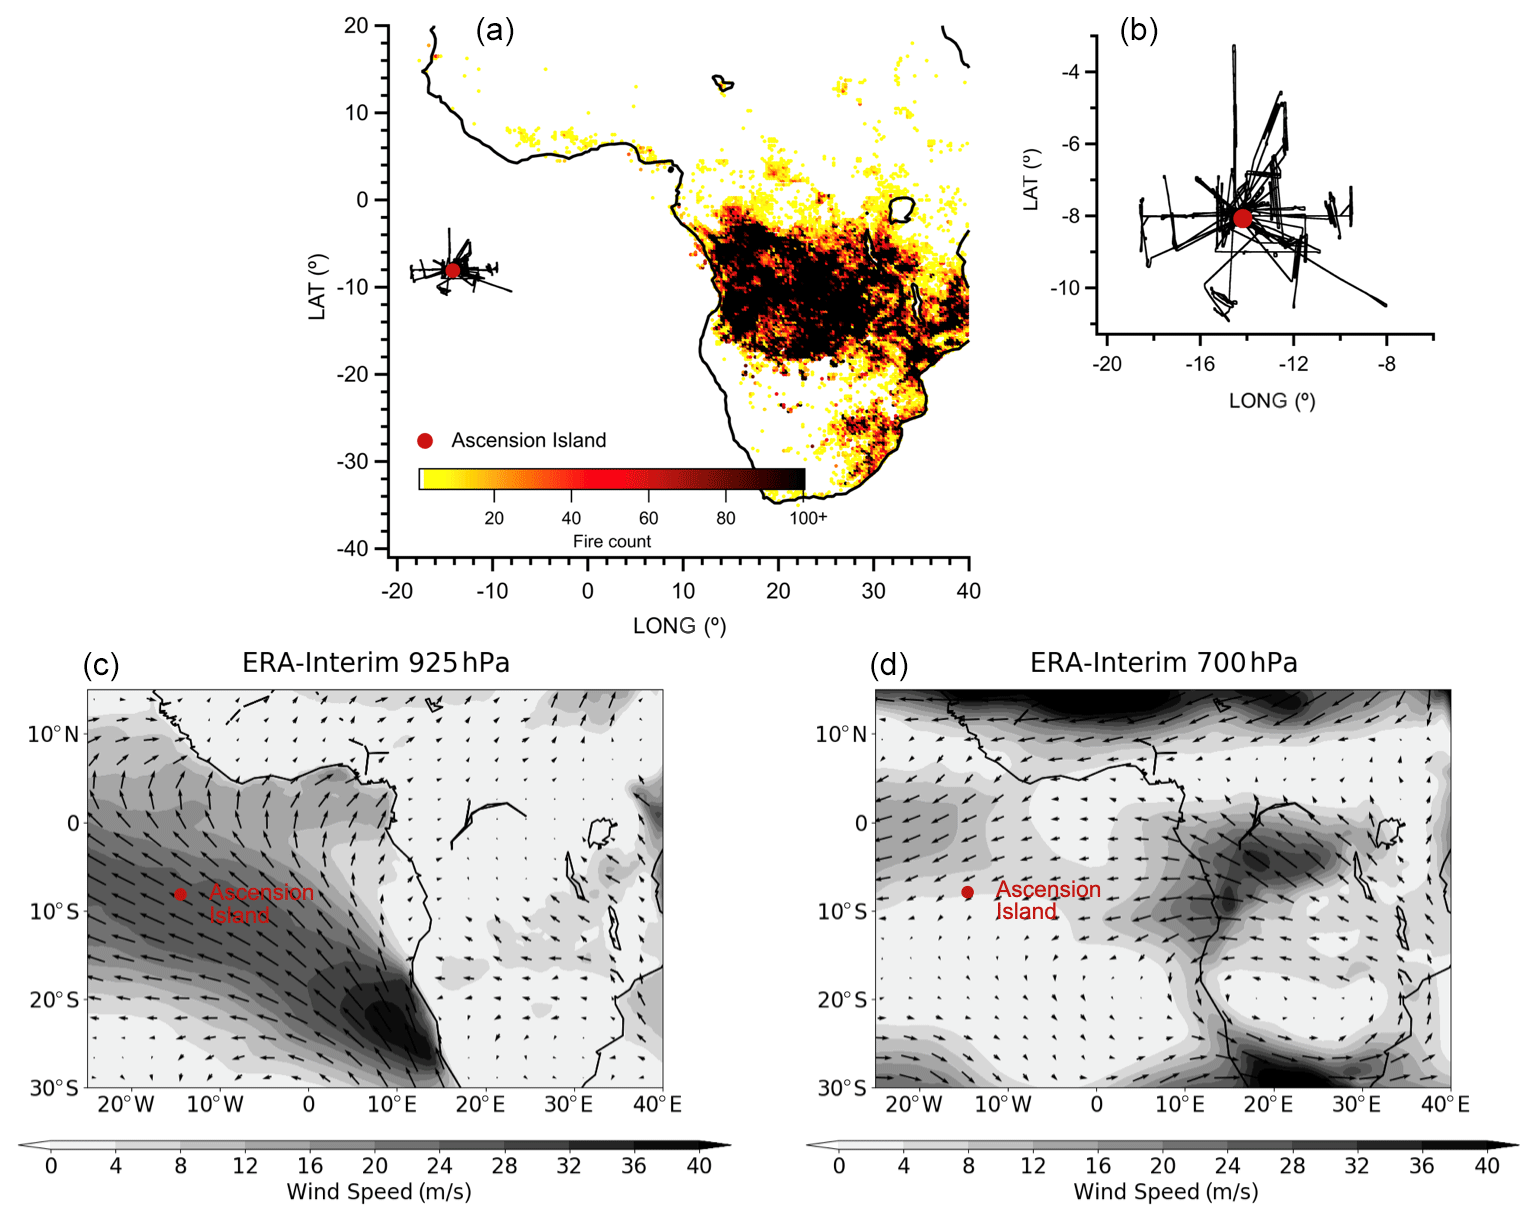
Figure 1(a, b) The integrated spatial distribution of MODIS-detected fire counts in August 2017, coupled with flight tracks (without transit flights) during the CLARIFY-2017 aircraft campaign (16 August–7 September). (c, d) Average wind speed and direction at 925 hPa (c) and 700 hPa (d) in ERA-Interim reanalysis for August 2017. The wind speed is shown in greyscale bars.
This study uses data from the CLARIFY-2017 (CLoud-Aerosol-Radiation Interactions and Forcing for Year 2017) aircraft campaign, which was conducted in August–September 2017, based from Ascension Island in the southeast Atlantic Ocean. The spatial distribution of MODIS-detected fires for August 2017 is shown in Fig. 1, with the average wind fields at 925 and 700 hPa corresponding to levels in the BL and FT separately. The burning mostly occurred in central and southern Africa (0–20∘ S) during the campaign period. Large quantities of BBA generally occur in a deep, turbulent, surface-heating-driven layer extending to between 3 and 4.5 km (Labonne et al., 2007). The smoke is then advected westward over the Atlantic Ocean by the southerly branch of the African easterly jet, as seen in the wind field at around 700 hPa in Fig. 1. The typical atmospheric BL flow, as indicated by the 925 hPa wind field in Fig. 1, follows the climatological wind pattern of south-easterlies, advecting clean Southern Hemisphere air around the southern Atlantic subtropical anticyclone. When smoke is transported from Africa over the South Atlantic it encounters the BL that has deepened further offshore and north of 5∘ S (Das et al., 2017). Subsiding smoke layers can be entrained into the BL and mix with clean air masses that are transported from the southeast to northwest over the Atlantic Ocean. Typically, smoke plumes have undergone at least 7 d transport since emission before arriving in the BL around Ascension Island (Gordon et al., 2018; Zuidema et al., 2018). Haywood et al. (2020) conducted back trajectories with particles released from Ascension Island at different altitudes from the MBL to FT, and they reported that air masses sampled in the CLARIFY operating area were of African BB origin and also indicated that the aerosol age was likely in a range of 4 to 10 d. The CLARIFY aircraft campaign provides the opportunity to observe vertical structures of African BBA transported to the far-field region over the southeast Atlantic.
This paper presents a synthesis of in situ airborne measurements, including the vertical distribution of submicron aerosols; their chemical, physical, and optical properties; and mixing state using the CLARIFY measurements. We use this analysis to investigate the main factors influencing BBA properties over the southeast Atlantic after long-range transport.
2.1 Airborne measurements
The measurements described here were made using the UK Facility for Airborne Atmospheric Measurements (FAAM) BAe-146 Atmospheric Research Aircraft (ARA), which was based out of Ascension Island (7.93∘ S, 14.42∘ W) in the southeast Atlantic, as part of the CLARIFY project. 28 scientific flights (designated flight labels from C028 to C055) took place between 16 August and 7 September 2017. A series of straight and level runs (SLRs) and vertical profiles were performed during each flight. The flight tracks during the campaign are shown in Fig. 1a. Transit flights, C040-41, which took place on 26 August are not included since the aircraft was predominately in clean air at high altitude. A summary of the flights and scientific deployment is provided by Haywood et al. (2020), while relevant instruments used in this study are discussed in more detail here.
The BAe-146 facility can provide aircraft position information and conducts routine measurements of standard atmospheric variables, such as temperature, pressure and winds. Humidity is measured by a CR-2 chilled mirror hygrometer. The inboard instruments used in this study drew their sample via standard BAe-146 Rosemount inlets, which have sampling efficiencies close to unity for submicron particles (Trembath et al., 2012).
The chemical composition of non-refractory submicron aerosols was measured by a compact time-of-flight aerosol mass spectrometer (C-ToF-AMS, Aerodyne Research Inc, Billerica, MA, USA) (Drewnick et al., 2005), which provides chemical characterization across a range of ion mass-to-charge (m∕z) ratios from 10 to 500. The detailed operation of the AMS, including calibration and correction factors, during aircraft deployment has been described previously (Morgan et al., 2009). The AMS was calibrated using mono-disperse ammonium nitrate and ammonium sulfate particles. The AMS data were processed using the standard SQUIRREL (SeQUential Igor data RetRiEvaL, v.1.60N) ToF-AMS software package. A time- and composition-dependent collection efficiency (CE) was applied to the data based on the algorithm by Middlebrook et al. (2012). The uncertainties of mass concentrations from aircraft AMS are estimated in Bahreini et al. (2009). In this study, the mass concentrations of organic aerosol (OA), sulfate, nitrate and ammonium are determined, and markers (m∕z 60, m∕z 43 and m∕z 44) were used to provide information on the composition of the OA fraction. Proportional contributions of OA fragment markers, f60, f43 and f44, were calculated as the ratios of m∕z 60, m∕z 43 and m∕z 44 to the total OA mass concentration respectively (Ng et al., 2011; Cubison et al., 2011; Ortega et al., 2013). The AMS suffered from a blockage of the inlet during some periods, and data collected from six flights (C042–C044, C052, C054 and C055) are not available.
The refractory black carbon (rBC; hereafter referred to as BC) was characterized using a single particle soot photometer (SP2, Droplet Measurement Technologies, Boulder, CO, USA). The instrument setup, operation and data interpretation procedures can be found elsewhere (McMeeking et al., 2010; Liu et al., 2010). The SP2 can measure BC-containing particles equivalent to a spherical diameter of 70–850 nm (Liu et al., 2010; Adachi et al., 2016). The SP2 incandescence signal is proportional to the mass of refractory BC present in the particle, regardless of mixing state. The SP2 incandescence signal was calibrated using Aquadag black carbon particle standards (Aqueous Deflocculated Acheson Graphite, manufactured by Acheson Inc., USA), including the correction (0.75) recommended by Laborde et al. (2012a). The overall uncertainty of the BC mass concentration calibration is ±20 % (Laborde et al., 2012a, b).
Aerosol number size distribution was measured via two wing-mounted passive cavity aerosol spectrometer probes (PCASP) and an on-board scanning mobility particle sizer (SMPS). The PCASP uses the intensity of scattered light to measure the size of a particle at 1 Hz, over a nominal diameter range of 0.1–3 µm across 30 channels. Particle size is determined via calibrations using di-ethyl-hexyl-sebacate (DEHS) and a polystyrene latex sphere (PSL) with known size and refractive index (Rosenberg et al., 2012). Mie scattering theory was used to determine the bin sizes by assuming particles are spherical, with a refractive index of 1.54 − 0.027i. The refractive index was obtained by the methods reported by Peers et al. (2019), where the aerosol model best represents the PCASP measurement. The SMPS sampled from the same inlet as the AMS measured distributions of particle mobility diameter divided into 26 or 31 logarithmically spaced bins in the range of 20–350 nm. A low-pressure water-based condensation particle counter (WCPC model 3786-LP) was connected to a TSI 3081 differential mobility analyser (DMA). The SMPS data were inverted using the scheme developed by Zhou (2001), based on a ∼ 1 min averaging time only during straight and level runs when AMS and SP2 concentrations generally varied less than 20 %. The combination of SMPS and PCASP measurements was used to determine size distributions from 20 nm to 3 µm, providing information on the sub-Aitken and accumulation mode aerosol.
A comparison of the estimated volumes from the AMS and SP2 with the PCASP was conducted, following the method in Morgan et al. (2010). The total mass concentrations measured from the AMS and SP2 were converted to total volume concentrations, using densities of 1.27 g cm−3 for organics, 1.77 g cm−3 for inorganics and 1.8 g cm−3 for BC (Morgan et al., 2010; Liu et al., 2010). The submicron volume concentrations from PCASP were estimated using bins with diameter below 1 µm, assuming particles are spherical. The estimated volumes from the AMS and SP2 were 83 % and 77 % of the estimated PCASP volumes in the BL and FT respectively. These discrepancies are considered tolerable given the 30 %–50 % uncertainty in PCASP volume estimates (e.g. Moore et al., 2004) and the uncertainty in densities required to convert the AMS mass to volume.
The aerosol dry extinction and absorption were measured with the EXSCALABAR instrument (EXtinction, SCattering and Absorption of Light for AirBorne Aerosol Research) which has been developed by the Met Office for use on the ARA (Davies et al., 2018, 2019). It consists of an array of spectrometers making use of photoacoustic spectroscopy (PAS) and cavity ring-down spectroscopy (CRDS) techniques. The dry (RH < 10 %) aerosol absorption coefficient is measured at wavelengths 405, 514 and 658 nm, and the dry extinction coefficient is measured at wavelengths 405 and 658 nm. An impactor ensures any aerosol with aerodynamic diameter greater than 1.3 µm is removed from the sample. The instrument, including the PAS calibration method, is described in detail by Davies et al. (2018) and Cotterell et al. (2019). The relative contributions of scattering and absorption are given by the single-scattering albedo (SSA), which is calculated as
in which BAbs is the light-absorption coefficient measured by PAS, BExt is the light-extinction coefficient measured by CRDS and λ is the wavelength. The uncertainty in the SSA calculations is related to the corresponding uncertainties in the extinction and absorption coefficient measurements. The mean SSA uncertainties are determined to be 0.013 and 0.018 at the wavelengths of 405 and 658 nm respectively when only considering systematic errors (Peers et al., 2019).
Carbon monoxide (CO) was measured by a vacuum ultraviolet florescence spectroscopy (AL5002, Aerolaser GmbH, Germany), with an accuracy of ±3 % and a precision of 1 ppbv (Gerbig et al., 1999). Calibration was performed using in-flight measurements of a single gas standard and the background signal at zero CO mole fraction. Carbon dioxide (CO2) was measured using a Fast Greenhouse Gas Analyzer (FGGA; Los Gatos Research, USA). The instrument setup, operation and performance on the ARA has been described for several previous aircraft campaigns (O'Shea et al., 2013). The FGGA was calibrated hourly in flight, using a calibration gas standard traceable to the WMO-X2007 scale for CO2. Liquid water content (LWC) was calculated from 1 Hz measurements by the Cloud Droplet Probe (CDP), with the operation and calibration of the CDP described in Lance (2012). An LWC value of 0.01 g m−3 was used to define the low threshold for the presence of cloud.
2.2 Data analysis and classification
All measurements reported here were corrected to standard temperature and pressure (STP, 273.15 K and 1013.25 hPa), and in-cloud data were removed. SP2, PAS, CRDS, CO, CO2 and PCASP data were recorded at 1 Hz and were averaged onto the AMS time base, which recorded data about every 8–9 s. SSA was calculated from the averaged PAS and CRDS data. Submicron aerosol (PM1) number concentrations from the PCASP were calculated using bins with diameter below 1 µm. SMPS and PCASP size distributions were averaged over each SLR. Flights with the AMS sampling problem mentioned above (C042–C044, C052, C054 and C055), sampling mainly in-cloud (C052–C054) or the transits (C040–C041), are not considered in the following analysis. Flights used in this study are listed in Table S1 in the Supplement.
Over the southeast Atlantic, there is typically a strong thermodynamic inversion at the top of the BL (e.g. Lock et al., 2000). The profiles of temperature and specific humidity were derived from all the flights used in this study (C028–C039, C045–C051), as seen in Fig. S1. The lack of variability shown by the bars demonstrates the ubiquitous nature of this inversion. Here, we define the BL top to be coincident with the base of the temperature inversion, typically at an altitude around 1400–2000 m. The inversion layer sits immediately above the BL and is characterized by a sharp increase in temperature and coincident steep decrease in specific humidity, typically in a thickness range of 100–400 m. Above the inversion layer, the air is dry (specific humidity < 0.002 kg kg−1 compared to > 0.01 kg kg−1 in the BL) and is regarded as being in the FT. Using these thermodynamic criteria, we divided the data from each flight into three parts: the BL, the inversion layer and the FT. The inversion layer data are in the transition between the BL below and FT aloft, and since their characteristics cannot easily be classified, these data are not used in further analysis. In this study, the air masses perturbed by BB pollutants were identified when BC > 0.1 µg m−3 to prevent the noise at low aerosol concentrations affecting our analysis. Clean BL air masses were selected when CO < 66 ppbv (53 µg m−3), which corresponds to the lowest 5th percentile of all CO data collected in the BL.
Figure 2 shows the average vertical distribution of submicron (PM1, µg m−3) aerosol mass concentration for each flight. PM1 mass concentration was calculated from the AMS non-refractory submicron species and BC mass from the SP2. During the month-long campaign, there was significant variability in measured aerosol loadings at different layers. Three distinct types of aerosol vertical structures were observed, and consequently we divided the campaign into three periods. From 16 to 19 August (period 1, C028–C032), BBA was concentrated in the BL. During period 2 (from 22 to 25 August, C033–C039), the FT was BB-polluted, and the BL was mostly clean. During period 3 (from 29 August to 5 September, C045–C051), the BB pollution was observed throughout the BL and FT. The following aerosol characterizations (chemical, physical and optical properties) were divided into these periods and different vertical layers (the FT and the BL).
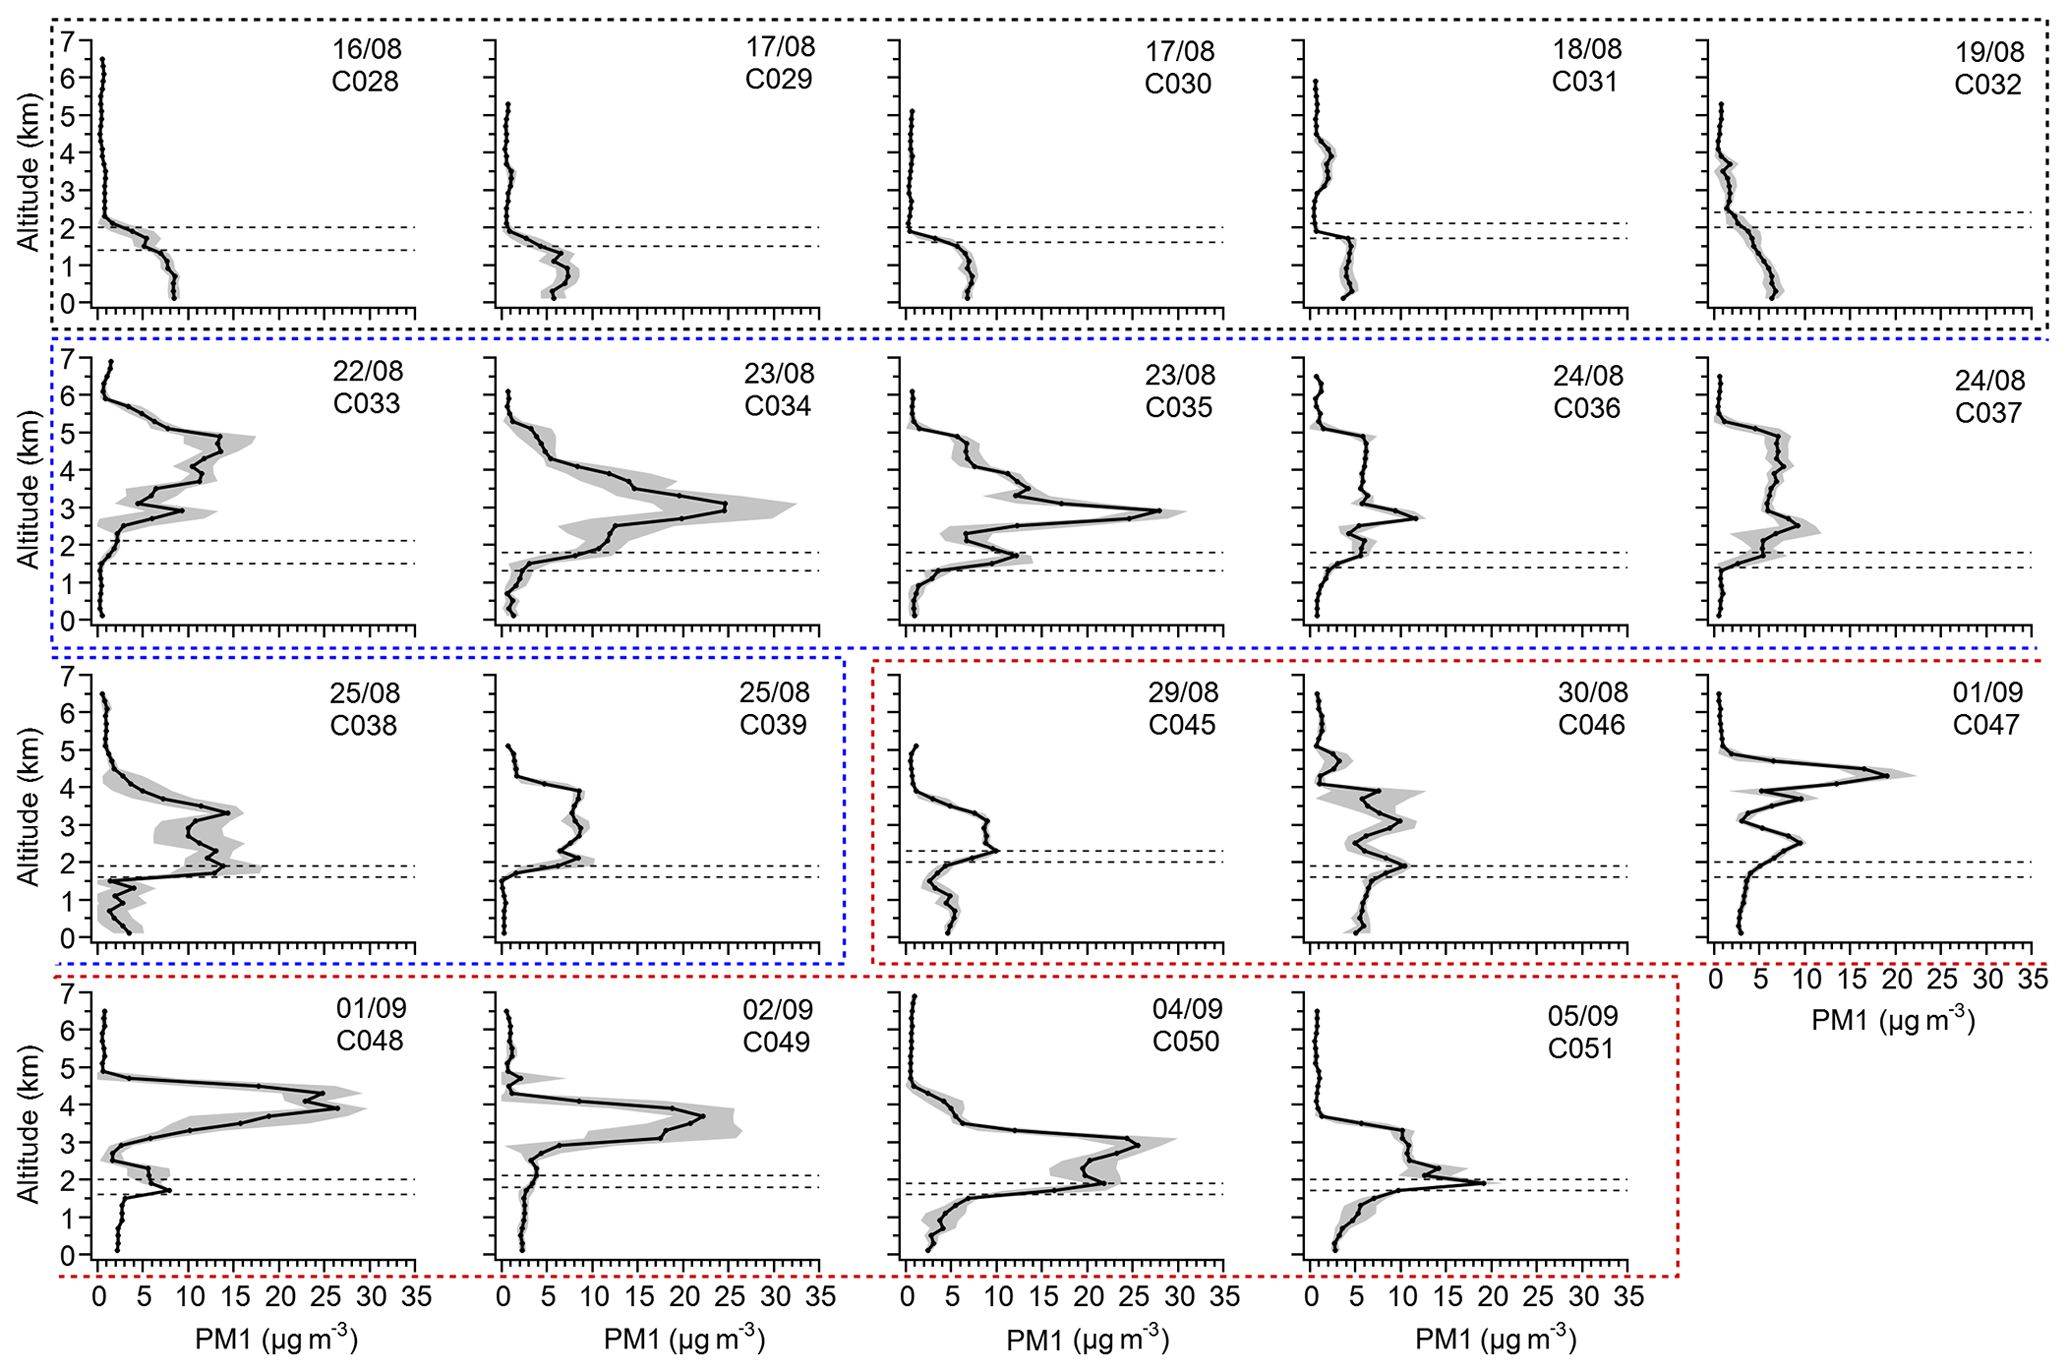
Figure 2The average vertical distribution of submicron aerosol (PM1) in flights used in this study. The mass concentration of PM1 is calculated from AMS non-refractory submicron species and SP2 BC. The grey shades represent standard deviation. The dashed lines represent the low and upper level of the inversion layer. Period 1 is marked by the black dashed rectangle, which shows that BBA was concentrated in the BL. Period 2 is marked by blue, which shows that the FT was BB-polluted and the BL was mostly clean. Period 3 is marked by red, which shows that the BB pollution was observed throughout the BL and FT.
3.1 Aerosol chemical properties
In this section, we consider the chemical composition of observed PM1 during CLARIFY and percentage contribution of different components to the total mass. We also investigate the vertical variability of the fractional chemical composition. The OA markers and elemental analysis are used to indicate the properties and ageing status of observed organics. The enhancement ratios of BC and OA were also calculated to obtain some information on the emission conditions at source and the removal during transport (Yokelson et al., 2013).
3.1.1 Submicron aerosol compositions
Average composition ratios of BL and FT aerosols for each period are summarized in Table 1, with campaign-average pie charts shown in Fig. 3. Detailed vertical distributions of concentrations of different chemical components in each flight are shown in Fig. S2 in the Supplement. In the BB-polluted FT (periods 2 and 3), the relative chemical composition was similar between flights and periods. The composition fractions (average ± standard deviation) were (61 ± 5) %, (13 ± 3) %, (11 ± 4) %, (8 ± 3) % and (7 ± 2) % for OA, BC, sulfate, nitrate and ammonium respectively. In the BB-polluted BL (periods 1 and 3), chemical composition ratios showed temporal variations. The BL in period 1 had ∼ 10 % higher average sulfate mass fraction and ∼ 6 % lower BC mass fraction than in period 3. The relative chemical compositions in the BB-polluted BL and FT also showed differences. Sulfate average mass fractions in the BL were (30 ± 4) % in period 1 and (21 ± 5) % in period 3, which were 2–3 times larger than those in the FT ((11 ± 4) %). BL ammonium mass fraction was also slightly higher than in the FT. The linear fitted ratios in the BL were (0.86 ± 0.01) and (0.99 ± 0.02) for period 1 and 3 respectively, indicating the possible presence of acidic aerosol during the first period ( is the measured ammonium concentration from the AMS, and is the calculated ammonium concentration if all acids in the aerosol were neutralized) (Zhang et al., 2007). When sulfate is not fully neutralized, nitrate aerosol formation is suppressed due to the absence of excess of ammonia. OA and BC accounted for smaller fractions of PM1 in the BL than in the FT.
Table 1The summary of CLARIFY aerosol composition and comparison with other studies of southern African BB.
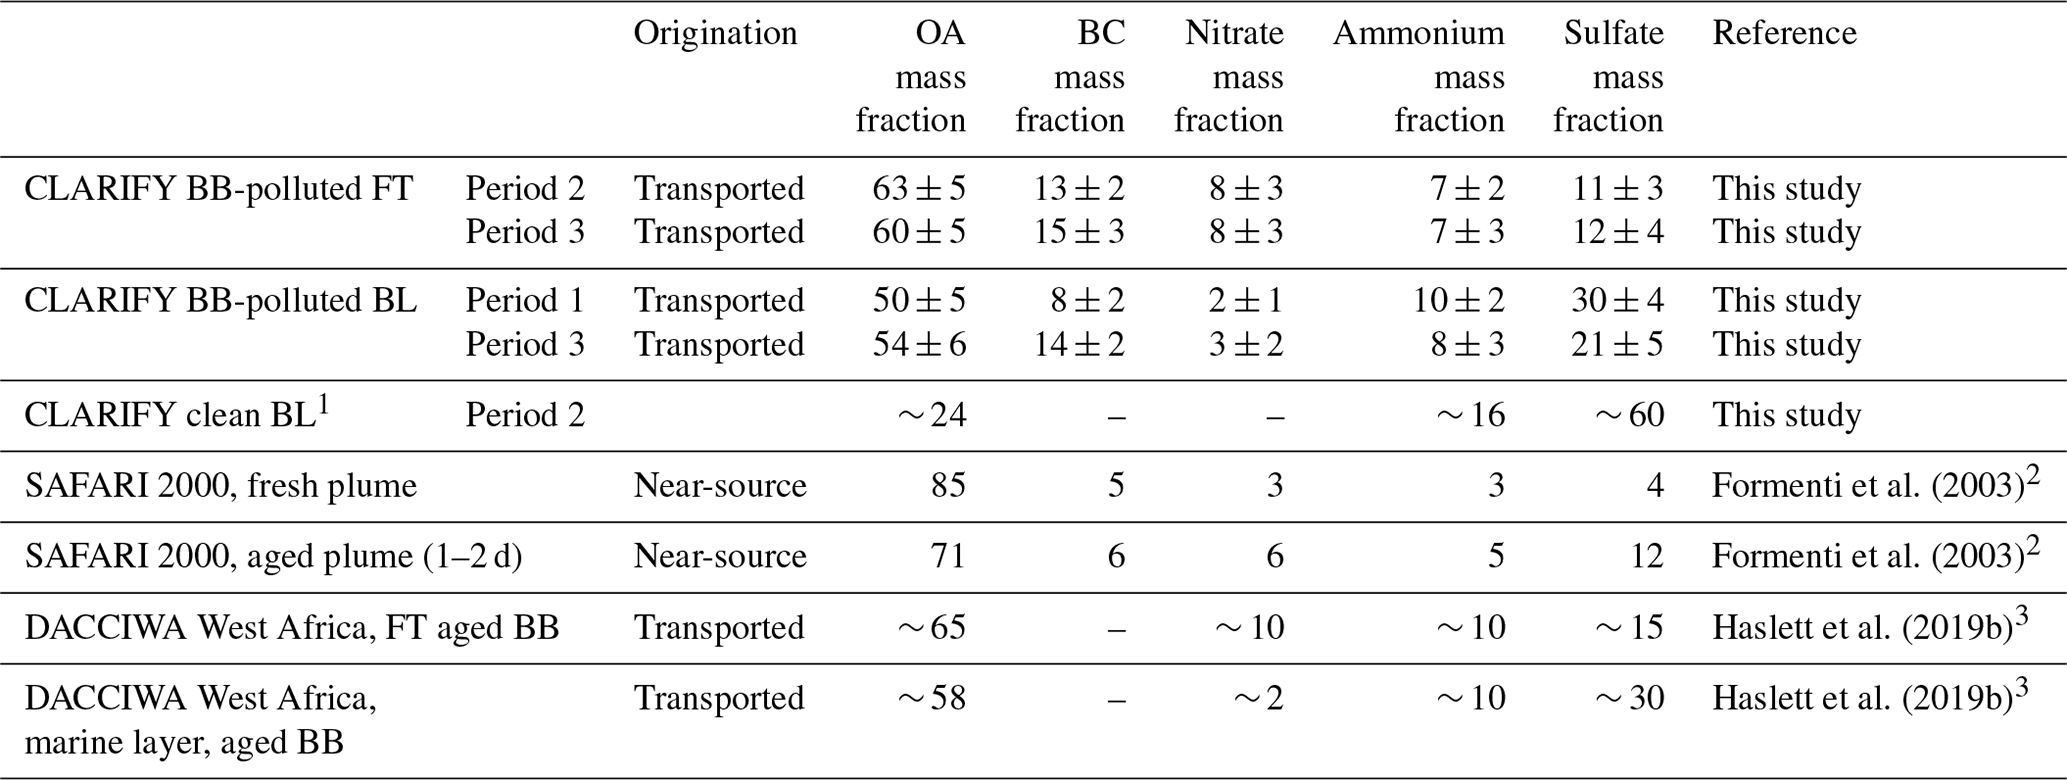
1 The nitrate and BC mass concentrations were around zero, have large uncertainty and are therefore not provided here. 2 Formenti et al. (2003) used a factor of 2 to convert
measured organic carbon (OC) to organic mass. It should be noted that BC was not measured optically for blackness as SP2 in this study but instead for the elemental carbon (EC).
3 The fraction of BC is not provided by Haslett et al. (2019b); only data from the AMS are calculated, and hence the mass fractions of the non-BC components are likely elevated.
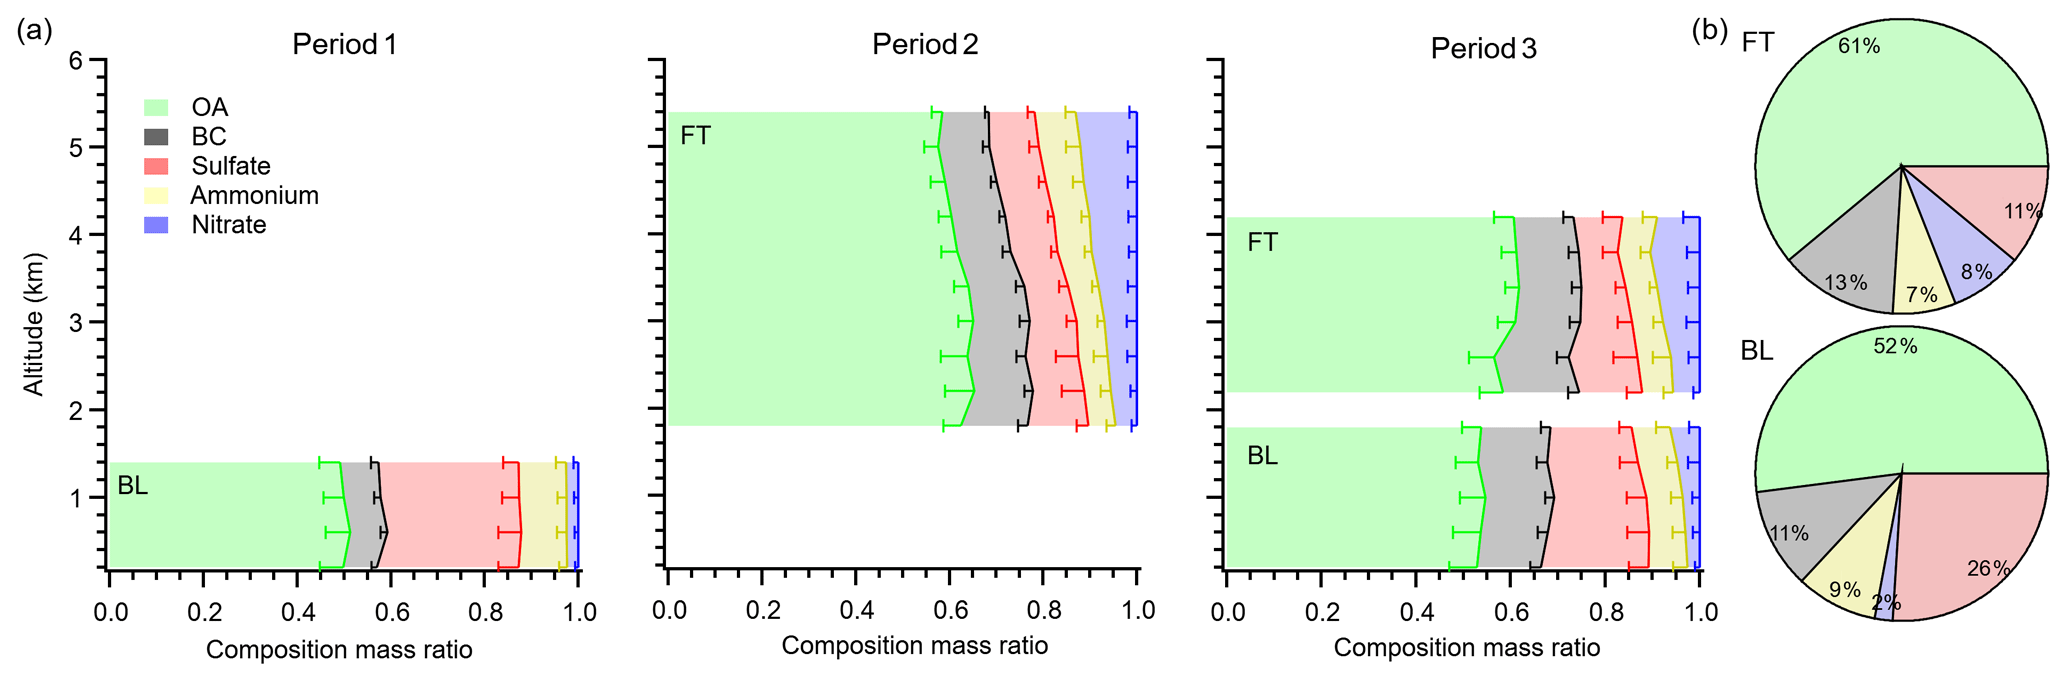
Figure 3(a) The average vertical distribution of PM1 chemical composition ratios in the BB-polluted FT and BL separately in each period. The width of colour bars represents the average mass ratio of different species in every 400 m bin. The error bars represent 1 standard deviation. (b) Pie charts showing campaign-average chemical composition ratios in the BB-polluted FT and BL respectively.
In the clean BL air masses encountered during period 2, which were representative of a background marine environment, the submicron particle mass (0.23 ± 0.18 µg m−3) was dominated by sulfate (0.14 ± 0.10 µg m−3), with small amounts of OA (0.06 ± 0.07 µg m−3) and negligible other components (see chemical fractions in Table 1). Sulfate mass loadings were significantly enhanced (1.9 ± 0.5 µg m−3 in period 1 and 0.7 ± 0.2 µg m−3 in period 3), and other aerosol species were present when BB smoke was transported into the BL. Contribution from the marine sulfate background may explain the higher sulfate fraction reported for the BL BBA than the FT. During the DACCIWA project, sampling near the southern coastal region of West African, aircraft observations showed that the sulfate mass fraction was also enhanced in BL BBA compared with the FT BB layer (see Table 1), after long-range transport of southern African BB smoke (Haslett et al., 2019b).
Table 1 also compares the chemical composition of BBA measured during CLARIFY and other studies focusing on southern African BB of different ages. The chemical composition of FT non-refractory BBA in CLARIFY is similar to the transported FT BBA in DACCIWA (Haslett et al., 2019b). During SAFARI 2000, off-line methods using filter samples were employed (Formenti et al., 2003). Concentration of water extractable ions (NO, SO, NH) was determined using ion chromatography (IC), and total carbon (TC = organic carbon + elemental carbon) was determined using thermo-optical analysis techniques. The comparison shows composition differences between the fresh and aged BBA (1–2 d) in SAFARI 2000 and more aged BBA sampled during the CLARIFY and DACCIWA experiments. The lower OA fraction of more aged BBA is likely due to the possible OA loss after emission as a result of evaporation or oxidation (Hodshire et al., 2019), or the formation of the secondary inorganic components (Pratt et al., 2011).
We also observed vertical variation in the fractional chemical composition of the BB layers, as shown in Fig. 3. In the BB-polluted FT, the linear fitted C-ToF-AMS ratios of aerosols in period 2 and 3 were (1.06 ± 0.01) and (1.05 ± 0.02) respectively, indicating that sulfate was fully neutralized and nitrate aerosol was formed with the excess ammonia. Therefore, the amounts of measured nitrate, ammonium and sulfate reached ion balance in the FT. When the observed nitrate mass fraction increased with altitude (mean values ranged from 4 % to 13 % in period 2 and from 6 % to 11 % in period 3 respectively), the sulfate mass fraction was relatively constant, and the ammonium mass fraction consistently increased with altitude. The BC mass fraction generally decreased with altitude in the FT; mean values changed from 14 % to 9 % in period 2 and from 16 % to 12 % in period 3. In the BB-polluted BL, there was no significant vertical variability in period 1. In period 3, the sulfate mass fraction increased from 17 % at the top of the BL to 23 % when close to the surface, while other component mass fractions showed slightly opposite trends (BC and nitrate mass fractions) or were relatively stable (OA and ammonium mass fractions).
3.1.2 Organic composition and elemental analysis
The OA fragment marker, f60, represents the prevalence of anhydrous sugars such as levoglucosan that are known pyrolysis products of wood burning. Hence, f60 is regarded as an indicator of emitted primary aerosol during BB (Schneider et al., 2006; Alfarra et al., 2007). Meanwhile, f44 is associated with the CO ion and is a marker for oxidized OA (Aiken et al., 2008). The method used by Cubison et al. (2011) that relies on f44 vs. f60 to represent the ageing of BB OA in the atmosphere is reproduced in this work. This approach compares the increasing oxidation of the OA (increasing f44) with the oxidative decay of the levoglucosan-like species (decreasing f60), allowing a simplified description of BB OA ageing to be compared across different BB studies. Figure 4a shows the f44 vs. f60 diagram of the average values in each flight and compares these values with those obtained by previous studies. During CLARIFY, average f60 were calculated to be (0.6 ± 0.3) % and (0.5 ± 0.2) % in the BB-polluted FT and BL respectively. Previous field studies have sampled BBA from flaming fires at Lake McKay (Cubison et al., 2011) and Amazonia fires (Morgan et al., 2020). These previous studies observed much higher f60 at source and in the near-source region than that observed in this study. Substantial oxidation and loss of levoglucosan-like species has occurred in the CLARIFY region after > 7 d transport. Cubison et al. (2011) observed that f60 decayed to near background level (0.3 %, in air masses without BB influence) during 1 d transport. The f60 is currently thought to be a robust BB tracer for ageing timescales within 1 d from emission (Cubison et al., 2011; Ortega et al., 2013). However, Jolleys et al. (2015) reported an average f60 of 1.2 % in aged BB smoke that had been transported ∼ 5 d in the FT after emission from boreal forest fires, which is well above the 0.3 % background level, suggesting that the lofting of BB smoke into the FT may lead to the retention of levoglucosan-like species. The low values presented in this paper indicate f60 in the far-field region eventually decayed to near background levels even when the smoke was transported into the FT. Average f44 values from each flight were mainly in a range of 18 %–23 % and 20 %–25 % in the BB-polluted FT and BL. As shown in Fig. 4a, f44 and f60 values during CLARIFY lie in the left top of the panel, and f44 values are at a high level compared with other BB studies in source, near-source or transport regions (Cubison et al., 2011; Haslett et al., 2019b). These high f44 values indicate the large fraction of oxidized OA (OOA) and/or highly oxidized OA state.
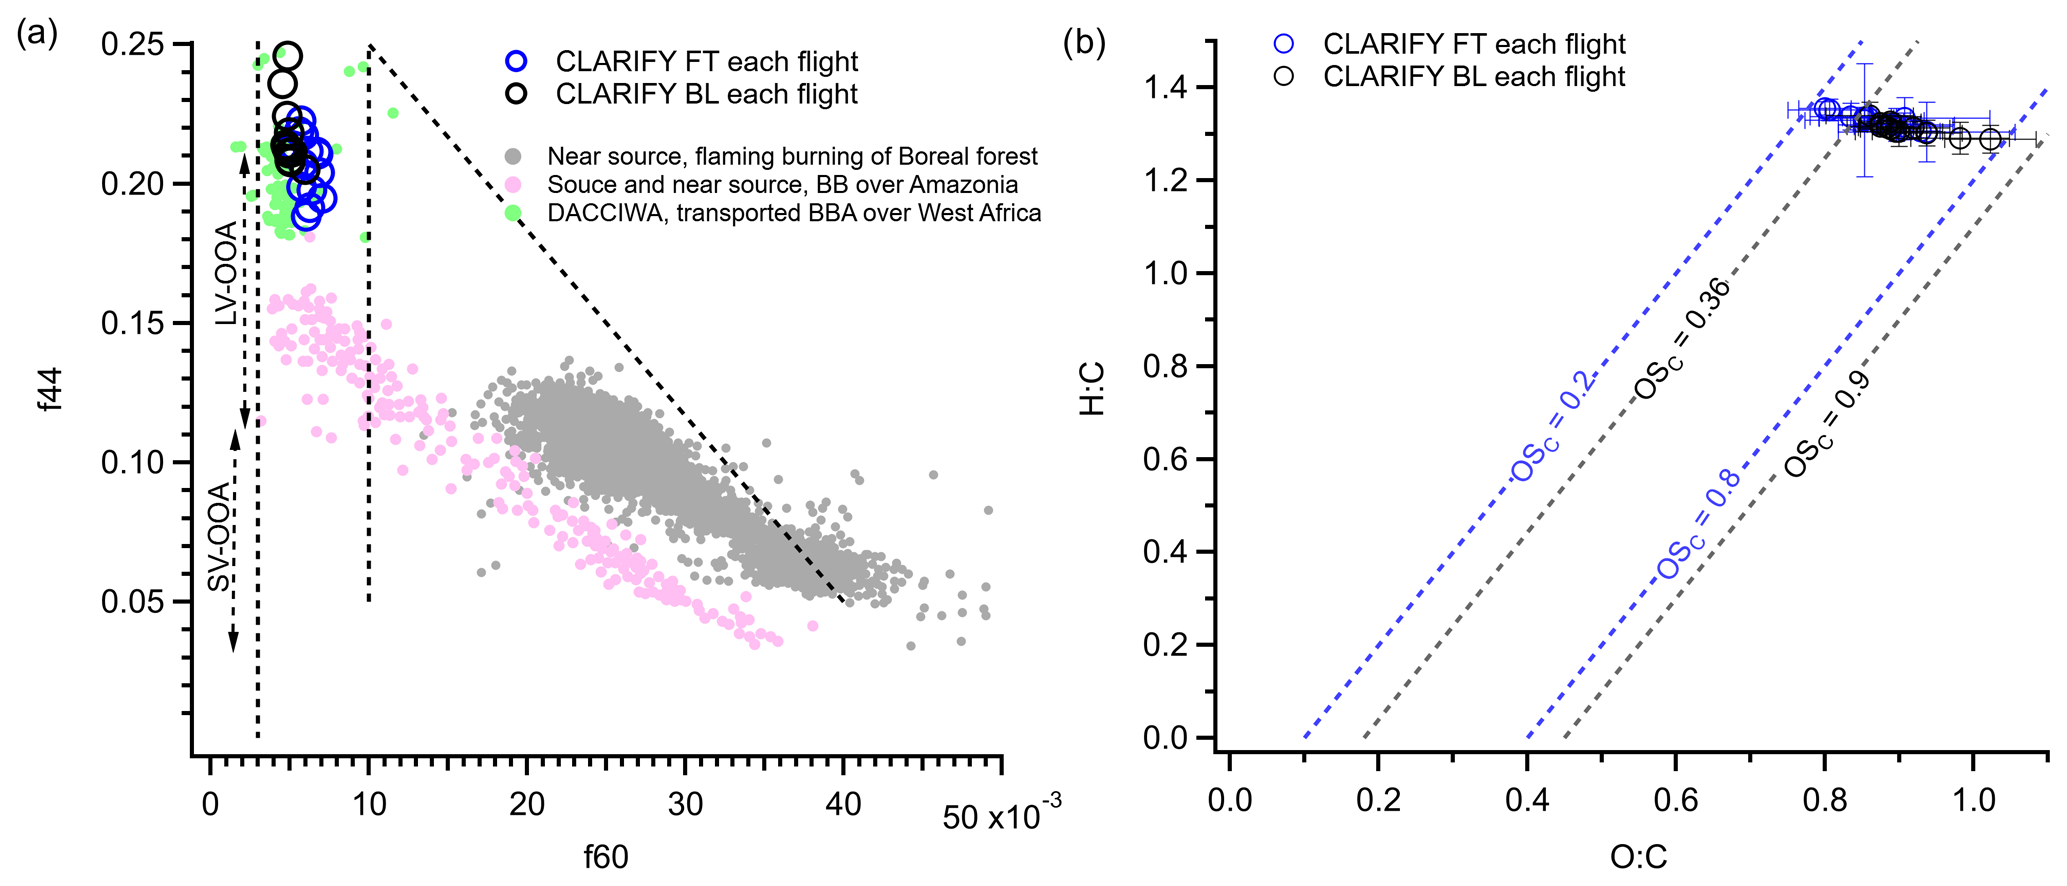
Figure 4(a) The fractional signals f44 vs. f60 of BBA sampled in this and other studies. Blue and black markers represent the average of FT and BL BBA layers, respectively, for each flight. The vertical dashed grey line indicates the background of f60 (0.3 %) under non-BB conditions, as recommended by Cubison et al. (2011). (b) The average and standard deviation of H∕C vs. O∕C for sampled BBA in each flight and the boundaries of OSc in the BL (black) and FT (blue) respectively.
We also calculated the elemental composition ratios of oxygen to carbon (O∕C) and hydrogen to carbon (H∕C) based on the estimates proposed by Aiken et al. (2008) and Ng et al. (2011). It should be noted that f44 in this study is at the top end of the f44 range reported by Aiken et al. (2008), and f43 is at the bottom end of the f43 range reported by Ng et al. (2011), and the aerosols were sampled from different fire sources in these studies; thus the O∕C and H∕C may have larger uncertainty than the reported error of 9 % (Aiken et al., 2008) and 10 % (Ng et al., 2011). The average carbon oxidation state (OSc) was estimated using O∕C and H∕C (Kroll et al., 2011). Figure 4b shows the Van Krevelen diagram (H∕C vs. O∕C), with average values in each flight and the boundaries of OSc in the BL and FT respectively, following the method in Ng et al. (2011). The elemental composition ratios and OSc are within the observed values of low-volatility oxygenated OA (LV-OOA) (Kroll et al., 2011; Ng et al., 2011). The organic-mass-to-organic-carbon ratios (OM∕OC) (Aiken et al., 2008) were calculated as 2.1–2.4 in the FT and 2.2–2.5 in the BL, with the same median of 2.3. In general, ageing increases the oxidation state of OA, associated with increasing f44, O∕C and OM∕OC ratios (Jimenez et al., 2009). These high values consistently reflect the highly oxidized and low-volatility nature of BB OA in the CLARIFY region.
3.1.3 Enhancement ratios of BC and OA
The modified combustion efficiency (MCE) was calculated to indicate the combustion conditions at source (Yokelson et al., 2009). Details of the method of calculating MCE are listed in Sect. S1 in the Supplement. The MCEs of FT smoke were generally around 0.97 during CLARIFY, as shown in Fig. 5. An MCE > 0.9 is commonly used to indicate BB smoke predominantly influenced by combustion during the flaming phase, whereas MCE < 0.9 represents the smouldering phase (Reid et al., 2005). By this definition, CLARIFY smoke plumes transported from southern Africa are likely to be mostly controlled by flaming-phase combustion at source. The emission of BC is usually high during flaming combustion, while smouldering combustion tends to emit smoke high in CO and organic mass (e.g. Christian et al., 2003). The enhancement ratios of BC and OA with respect to CO (BC∕ΔCO and OA∕ΔCO, µg m−3 (µg m−3)−1) are generally used to indicate the emission conditions of fire at source. For example, BC∕ΔCO values from 0.005 to 0.023 and OA∕ΔCO values from 0.037 to 0.066 were observed for BB source in flaming combustion from previous measurements (May et al., 2014; Pratt et al., 2011), while a lower range of (0.0014–0.0072) for BC∕ΔCO and a higher range of (0.080–0.096) for OA∕ΔCO were reported for BB source in smouldering combustion (Capes et al., 2008; Kondo et al., 2011; May et al., 2014).
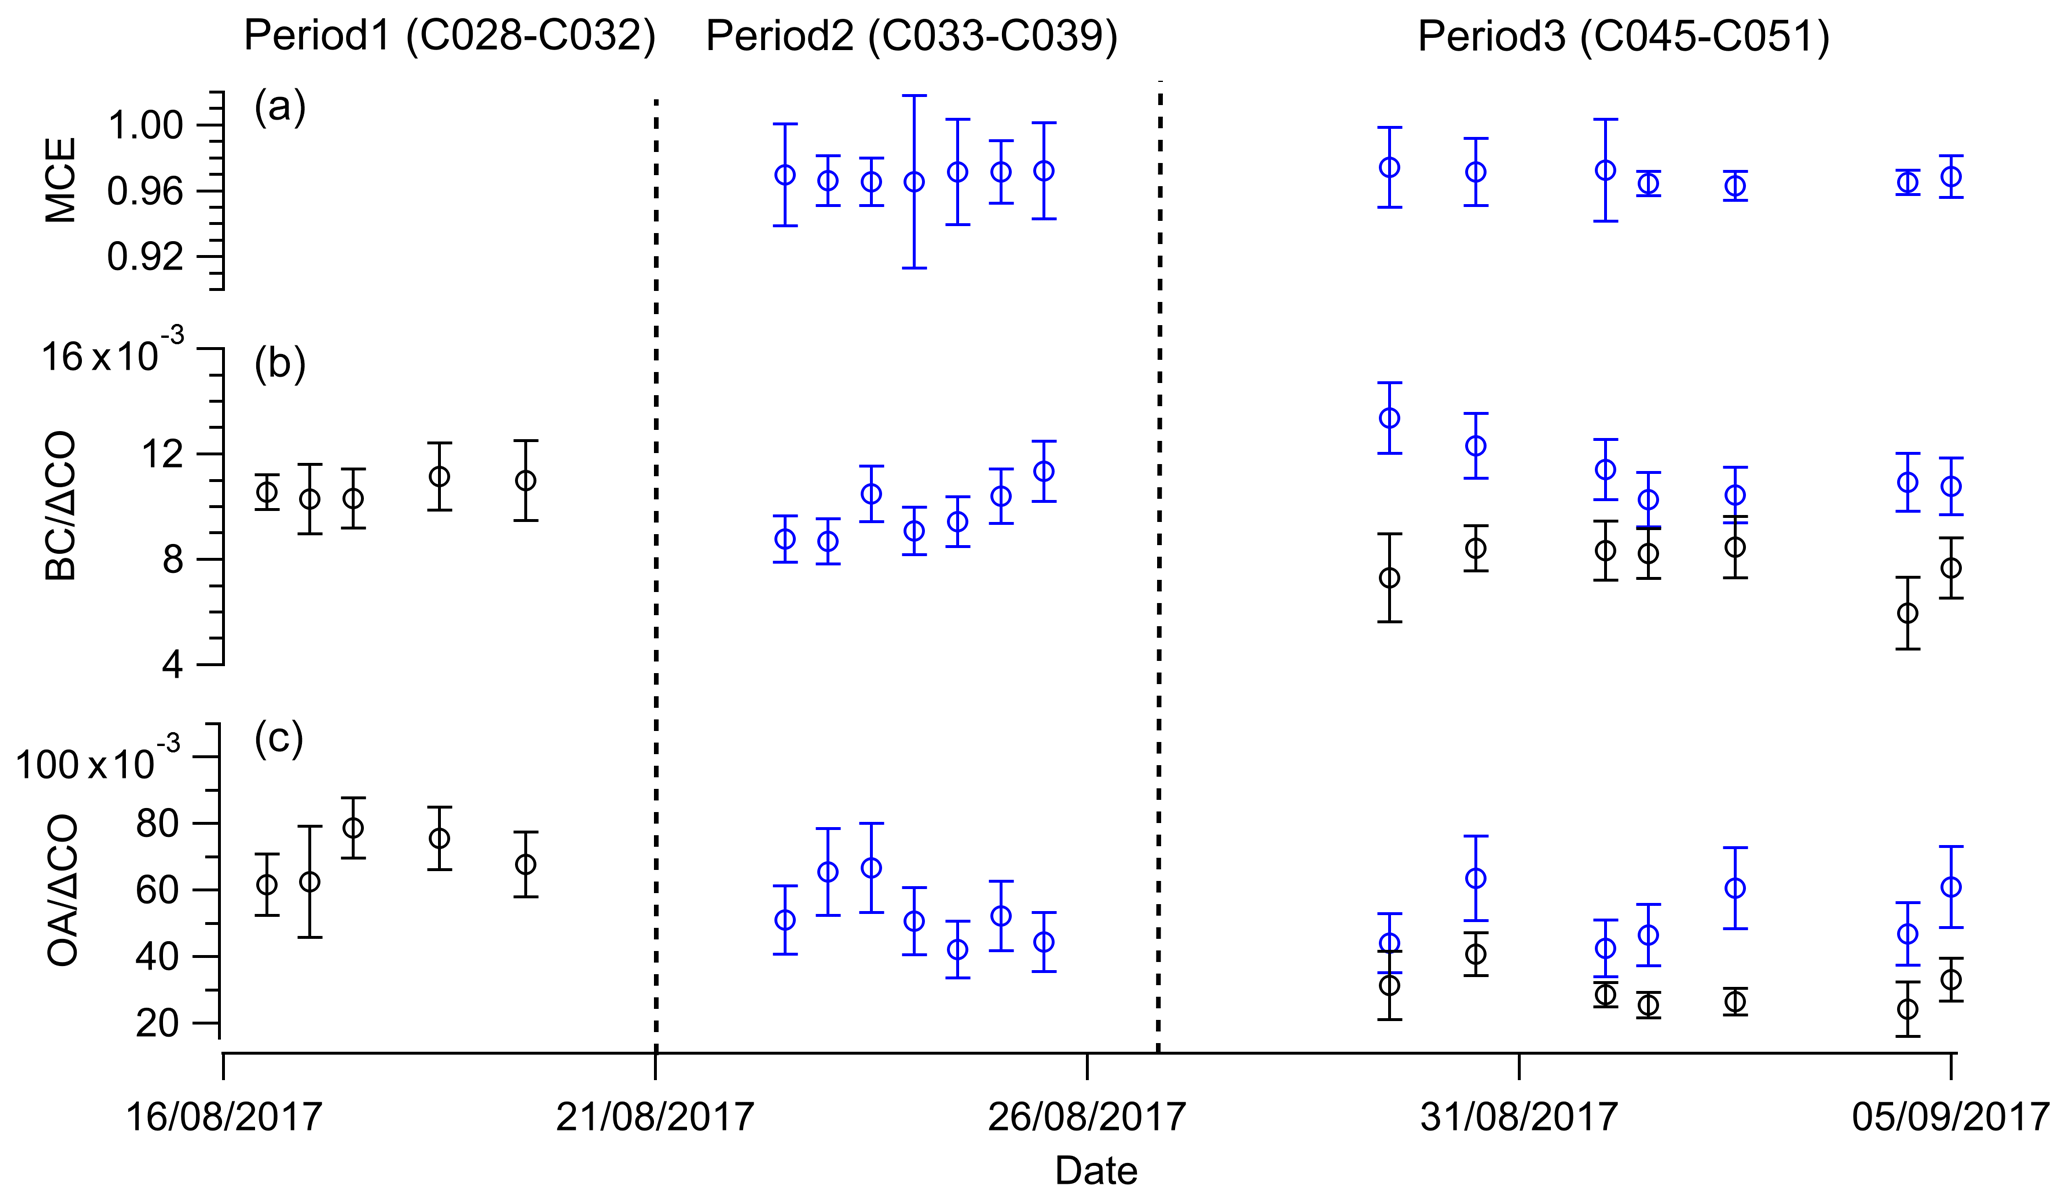
Figure 5(a) The calculated MCE of CLARIFY FT smoke plumes for each flight. The error bars show the uncertainty. (b, c) The calculated BC∕ΔCO and OA∕ΔCO in FT and BL smoke plumes respectively for each flight. The blue markers and error bars represent the fitted slopes and uncertainty in the FT; the black markers and errors represent the average and standard deviation of calculated ratios in the BL.
For CLARIFY, the BC∕ΔCO and OA∕ΔCO ratios (µg m−3 (µg m−3)−1) were calculated in the FT by the unconstrained linear orthogonal distance regression (ODR) fit (Yokelson et al., 2013) and were calculated in the BL by dividing BC and OA by the excess concentration of CO, after background values had been removed (Lefer et al., 1994). The detailed calculation method is listed in Sect. S1. The calculated enhancement ratios in FT and BL smoke for each flight are shown in Fig. 5. In the BB-polluted FT, the ODR fitted BC∕ΔCO ratios ranged from 0.0087 to 0.0114 in period 2 and were higher (0.0103–0.0134) in period 3, while OA∕ΔCO values were comparable between the two periods (period 2: 0.042–0.067; period 3: 0.043–0.064). In the BB-polluted BL, the average BC∕ΔCO and OA∕ΔCO ratios in period 1 (0.0103–0.0111; 0.062–0.079) were higher than in period 3 (0.006–0.0085; 0.024–0.041). Particles are unlikely to have been subject to significant wet removal after being lofted into the FT, due to the low water contents and low probability of encountering clouds in the FT over the southeast Atlantic. Hence the FT aerosols are likely to be long-lived. It is also acknowledged that CO has a lifetime of around a month by gas-phase oxidation; this lifetime is much longer than the transport timescales in this study. Previous studies have observed the transatlantic transport of BB pollutants from Africa to the Amazon basin, reporting a BC∕ΔCO value of 0.0117 in FT transported smoke, which is within the observed range in this study (Baars et al., 2011; Holanda et al., 2020). For CLARIFY, it is likely that BC∕ΔCO values in FT smoke are similar to values at source. However, OA∕ΔCO may be more complex due to ageing of primary organics (POA) and secondary organic aerosol (SOA) formation after emission (Yokelson et al., 2009; Cubison et al., 2011; Vakkari et al., 2018). During CLARIFY, BC∕ΔCO ratios in FT smoke were in the reported range of BB sources controlled by flaming combustion. The slight variations between flights may be due to differences in emission if there is no significant removal process. Back trajectories initiated from Ascension Island (Zuidema et al., 2018; Haywood et al., 2020) and climate model simulations made by Gordon et al. (2018) indicated that the BB smoke from south African fires had entrained into the marine BL over the southeast Atlantic. BC∕ΔCO and OA∕ΔCO ratios in the BL were generally lower than that in the FT, clearly seen throughout period 3, indicating that a fraction of particles may be removed by cloud activation or scavenging and subsequent precipitation after FT aerosols mix into the BL. However, the ratios were not considerably lower than those in the FT, suggesting that the removal processes were inefficient. During period 3, the difference between BL and FT BC∕ΔCO varied from 20 % to 45 %, suggesting different scavenging fractions. In the BL, both the differences due to emission and the extent of aerosol removal may cause the variation in the ratios.
3.2 Aerosol size distribution
We determined dry number size distributions from both PCASP and SMPS, during SLRs in the FT and BL separately. The mean size distributions of observed BBA from SLRs for each period are shown in Fig. 6a. During CLARIFY, we mainly detected a single dominant accumulation mode for both FT and BL BBA. The lognormal fitted count median diameters (CMDs) of mean size distributions derived from the PCASP were 232 and 202 nm for the BB-polluted FT and BL respectively. Figure 6b shows the mean number size distribution for SLRs in the clean BL air masses in period 2. This indicates that new particle formation and growth was occurring in the background marine environment, with a CMD of ∼ 30 nm in the Aitken mode and a CMD of ∼ 160 nm in the accumulation mode.
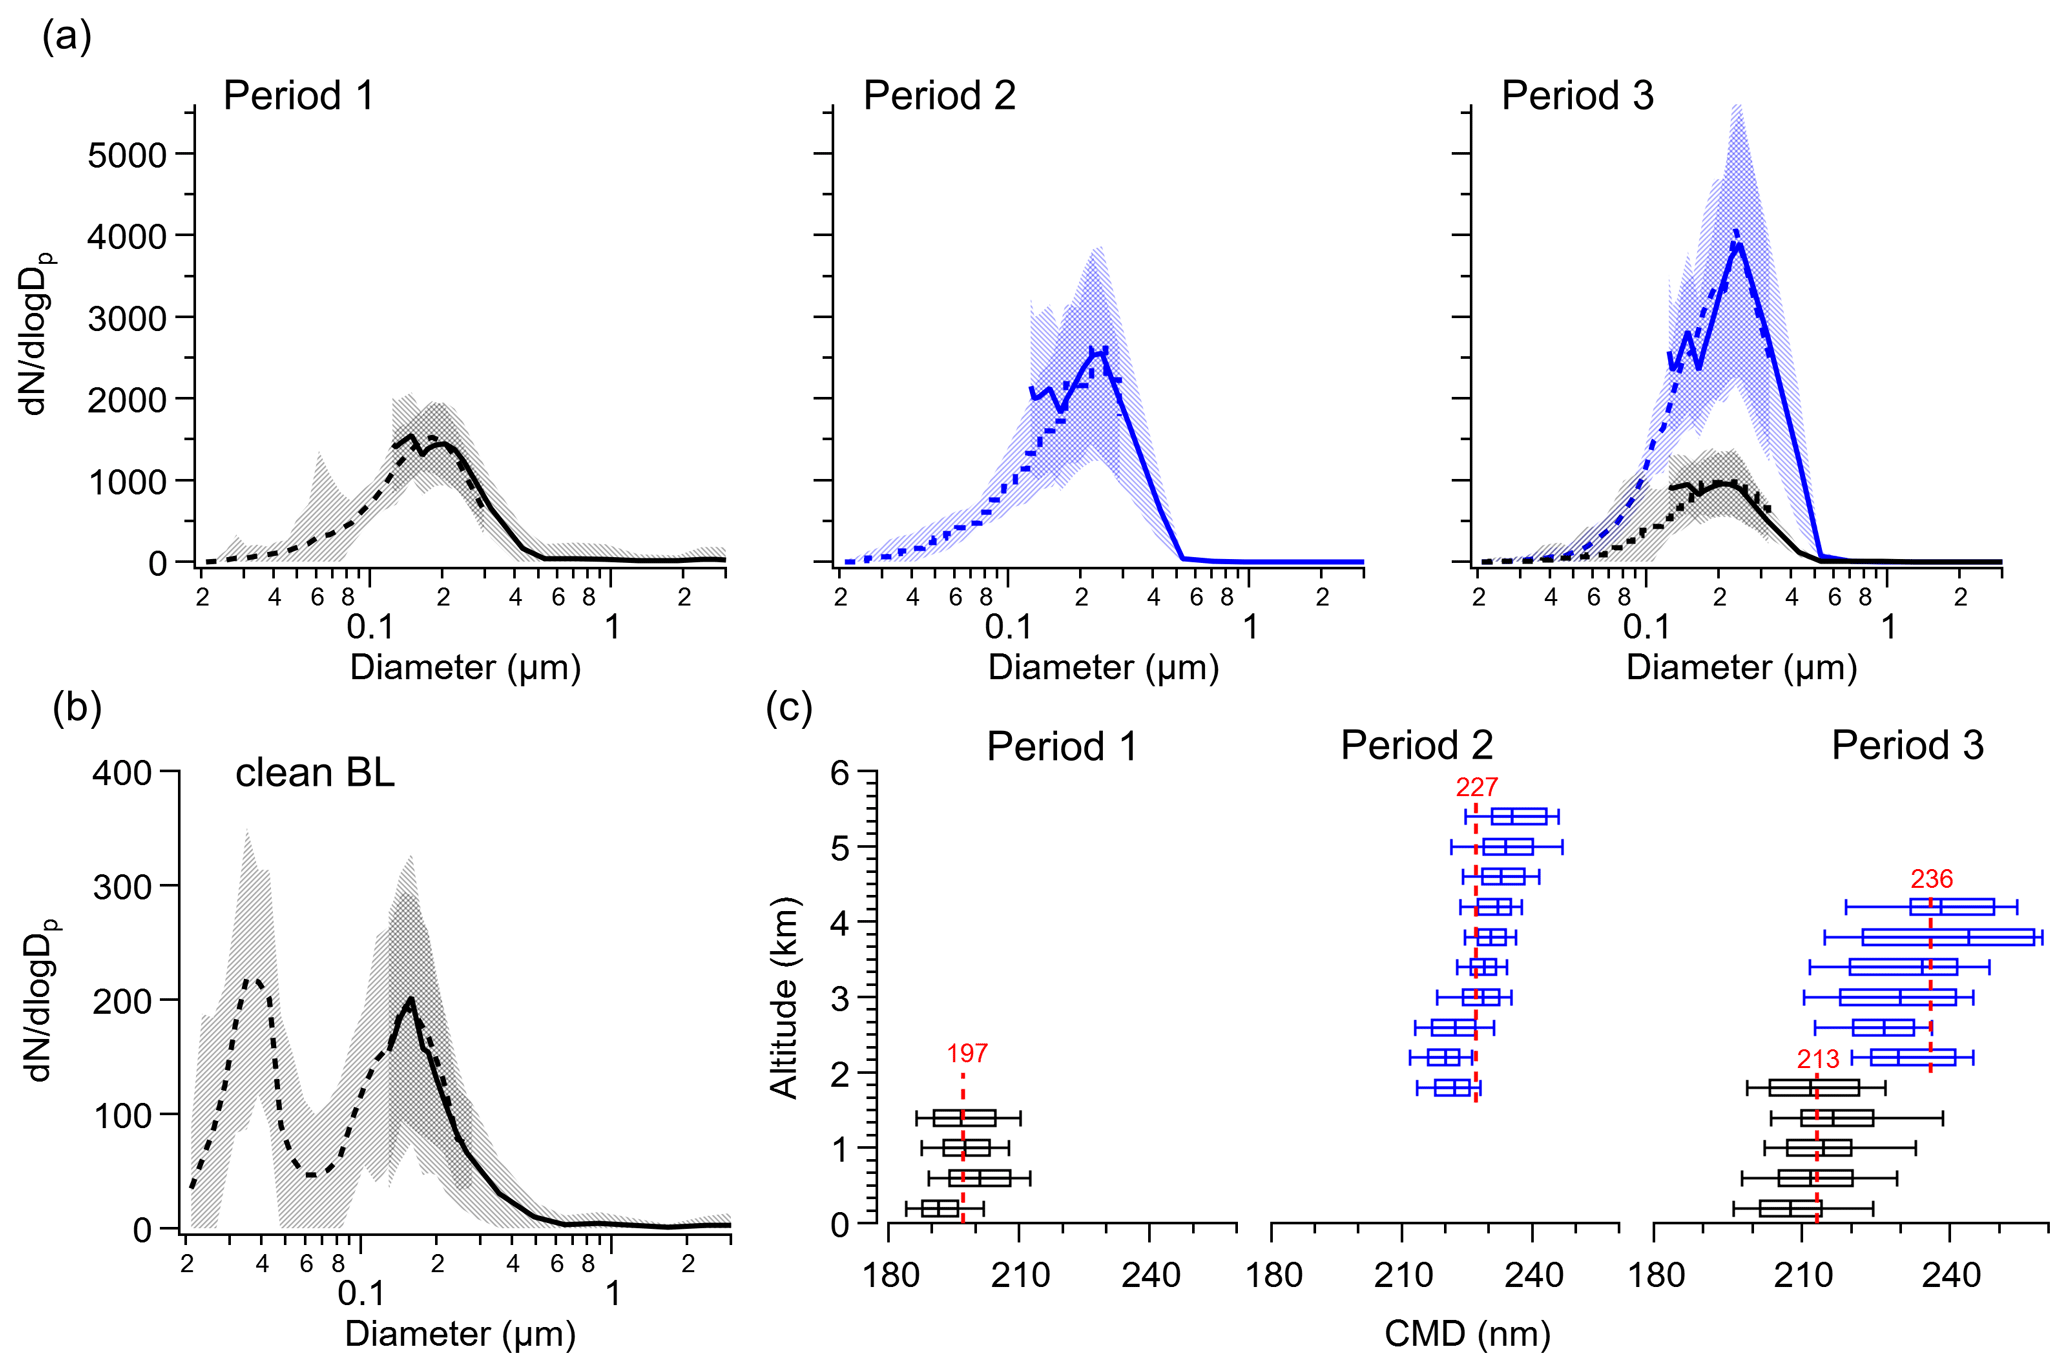
Figure 6(a) The average size distributions of SLRs in the BB-polluted FT (blue) and BL (black) respectively for each period. The solid lines represent results from PCASP; dashed lines represent results from SMPS. The blue lines and shading show mean and standard deviation from the FT; the black lines represent the BL. (b) The average size distribution of SLRs in the clean BL. (c) The vertical distribution of lognormal fitted count median diameters (CMD) from the PCASP. The box-and-whisker plots indicate the 10th percentile, 25th percentile, median, 75th percentile and 90th percentile in every 400 m bin in the BB-polluted FT (blue) and BL (black). The red dashed lines and numbers represent the lognormal fitted CMD of mean size distribution in the BB-polluted FT (blue) and BL (black) for each period.
Recent ground-based measurements of southern African savanna and grassland fires found a CMD of 69 nm in fresh smoke (age < 0.5 h), which grew to 123 nm in the next 3 h (Vakkari et al., 2018). CLARIFY-observed BBAs are much larger than those reported for fresh African smoke; this may be due to substantial coagulation and condensation during transport. However, Haywood et al. (2003a) reported a CMD of ∼ 240 nm for aged BBA (1–2 d) off the Namibian coast and ∼ 200 nm for fresh BBA (∼ 5 h) during SAFARI 2000. There is size similarity between SAFARI aged BBA (1–2 d) and more aged BBA (> 7 d) in this study, despite the different ages of aerosols. This consistency validates a priori size distribution assumptions for the aerosol model recently used in SEVIRI satellite retrievals of aerosols (CMD = 238 nm) made by Peers et al. (2019).
Vertical profiles of lognormal fitted CMDs calculated from the PCASP data are shown in Fig. 6c. There is a slightly increasing trend of CMDs with altitude (by ∼ 5 %) in the BB-polluted FT and no significant vertical variability in the BL. CMDs in the BL were generally smaller than that in the FT, which is consistent with the lower BC∕ΔCO and OA∕ΔCO ratios in the BL than in the FT presented in the previous section and likely a result of more efficient removal of larger particles.
3.3 Aerosol single-scattering albedo
During CLARIFY, the column-weighted dry SSAs derived from EXSCALABAR measurements were 0.85, 0.84 and 0.83 at 405, 550 and 658 nm respectively. Vertical profiles of SSA were also calculated for each 400 m altitude bin. The profile for 658 nm is shown in Fig. 7 as an example; the same trends were observed at all reported wavelengths. In the BB-polluted FT, average SSAs at 405, 550 and 658 nm increased from 0.82, 0.81 and 0.79 in the low FT to 0.87, 0.86 and 0.85 at an altitude up to 5 km. In the BB-polluted BL, the SSAs decreased from the surface to the BL top. During period 3, average SSAs at 405, 550 and 658 nm were 0.85, 0.85 and 0.84 in the lowermost bin of 0–400 m, decreasing to 0.83, 0.81 and 0.80 at the BL top. The BL SSAs in period 1 showed a weak vertical change and were higher than in period 3.

Figure 7The vertical distribution of SSA at 658 nm in the BB-polluted FT (blue) and BL (black) respectively for each period. The box-and-whisker plots represent the 10th percentile, 25th percentile, median, 75th percentile and 90th percentile in every 400 m bin. The lines are the trend of average values in every 400 m bin.
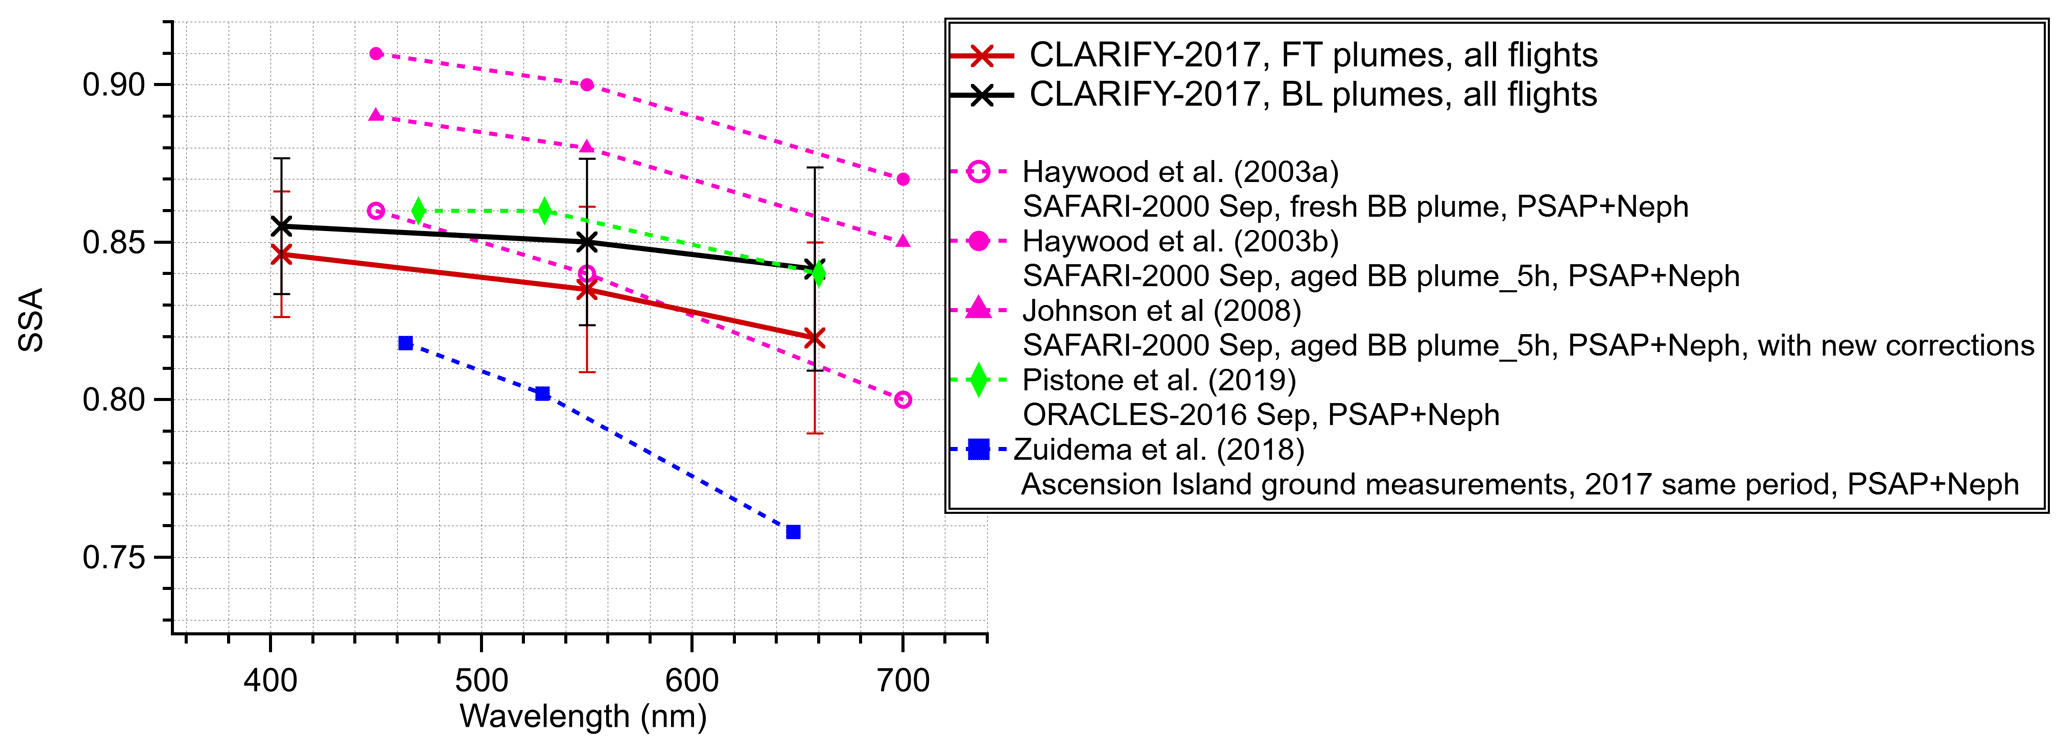
Figure 8Wavelength dependence of the average SSA of FT and BL BBA for all flights used in this study. The markers and lines represent the mean value and standard deviation. The average SSAs from previous studies in this region are shown for comparison. (Note that the PSAP only measured absorption at 567 nm in SAFARI 2000; assumptions about the wavelength dependence of absorption coefficient were made to estimate absorption at 450 and 700 nm, which was then used to calculate the SSA.)
Figure 8 shows the CLARIFY average SSAs at different wavelengths in the BL and FT separately, compared with previous observation studies of southern African BB at different ages and covering various relevant regions. In the source region, the average SSAs of fresh BBA measured during SAFARI 2000 were 0.86, 0.84, and 0.80 at 450, 550 and 700 nm; aged BBA (1–2 d) usually had higher SSAs (Haywood et al., 2003a, b; Johnson et al., 2008). However, SSAs of more aged BBA (> 4 d, mainly in the FT) during ORACLES 2016 were observed to be lower than the SAFARI aged BBA (1–2 d) (Pistone et al., 2019). The CLARIFY observations presented in this study were made further west than the ORACLES region and had undergone additional days of ageing (> 7 d since emission). The average SSAs of CLARIFY FT BBA were (0.85 ± 0.02), (0.83 ± 0.03) and (0.82 ± 0.03) at 405, 550 and 658 nm respectively, falling within the lowest level of the above-reported range. The average SSAs of CLARIFY BL BBA were (0.86 ± 0.02), (0.85 ± 0.03) and (0.84 ± 0.03) at 405, 550 and 658 nm respectively, which is higher than FT values. Ground-based in situ SSA measurements made on Ascension Island in 2017 (Zuidema et al., 2018) are lower than CLARIFY BL SSA values and are the lowest values compared to all previously reported observations of southern African BBA.
These previous observations employed filter-based measurements, using the particle soot absorption photometer (PSAP) and nephelometer, in contrast to the PAS/CRDS methods employed during CLARIFY. CLARIFY FT SSA values are similar to those measured from the FT during the ORACLES mission. It is also interesting to note that the radiometrically retrieved SSA from nine above-cloud flights performed during ORACLES in 2016 and 2017 (Cochrane et al., 2020; their Fig. 4), which do not depend on in situ measurements, yielded average SSAs of (0.85 ± 0.02), (0.83 ± 0.03) and (0.82 ± 0.04) at wavelengths of 380, 550 and 660 nm respectively for FT BBA. These values are also in good agreement with our FT SSAs within the expected variability. However, CLARIFY BL SSA values do not agree with those from LASIC ground-based measurements. Although limitations with filter-based measurements of aerosol light absorption are known to introduce systematic measurement biases (Lack et al., 2008; Davies et al., 2019), the LASIC-derived aerosol absorption is comparable with those from the CLARIFY campaign. The difference between CLARIFY and LASIC BL SSAs is possibly due to differences in the extinction measurements, which may be caused by the different inlet cut-offs (aerosol dynamic diameter of 1 µm for LASIC and 1.3 µm for CLARIFY).
Despite the systematic variability between different measurement methods, the datasets mentioned above imply some important information on SSA evolution from the African BB source to the remote region. Abel et al. (2003) showed that SSA increased in the first 5 h after emission during SAFARI 2000, which is likely due to the condensation of scattering material and the change in BC morphology from a chain agglomerate to a more spheroidal shape because the particle collapses as it becomes coated. Despite this initial increase, observations of SSA in regions where the aerosols are highly aged (> 4 d since emission), like the ORACLES, CLARIFY and ground-based measurements on Ascension Island, are close to or lower than those sampled closer to source (< 2 d). These observations show that BBA remains strongly absorbing from near the coast of southern Africa to the far-field region around Ascension Island, suggesting that models with too little absorption for aged BBA will under-estimate the warming effect of BBA over the southeast Atlantic.
4.1 Factors influencing vertical variability
4.1.1 In the FT
CLARIFY OA was highly oxidized, which is characteristic of aged, low-volatility organic aerosol. Aerosol properties will be relatively insensitive to further ageing processes of OA. The main feature in the vertical variability of aerosol properties in the CLARIFY region is the nitrate aerosol which makes a greater fractional contribution to PM1 at higher altitudes.
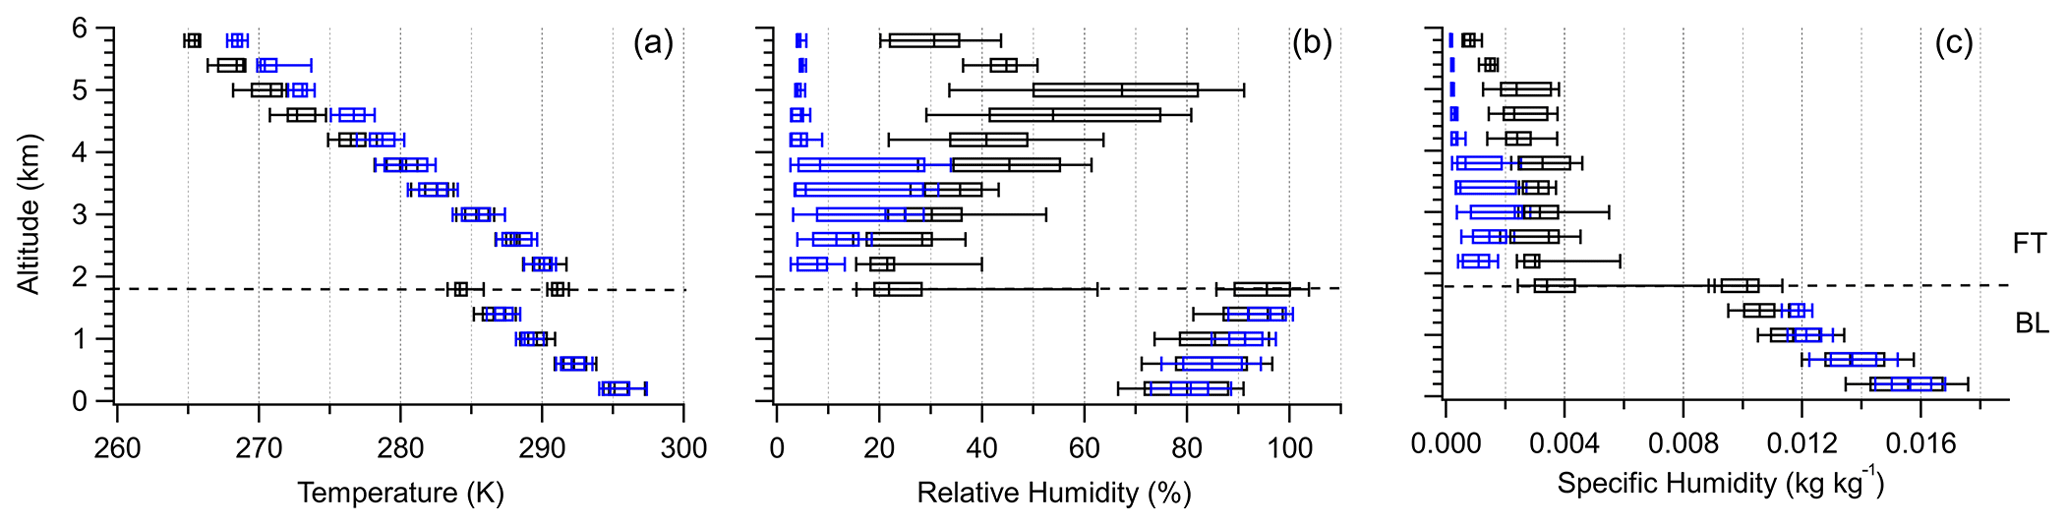
Figure 9The vertical distributions of temperature (a), RH (b) and specific humidity (c) under clean (blue) and BB-polluted (black) conditions. Data for BB-polluted conditions are composited from periods 2 and 3 in the FT and periods 1 and 3 in the BL. Data for clean conditions are composited from period 1 in the FT and period 2 in the BL. The box-and-whisker plots represent the 10th percentile, 25th percentile, median, 75th percentile and 90th percentile in every 400 m bin.
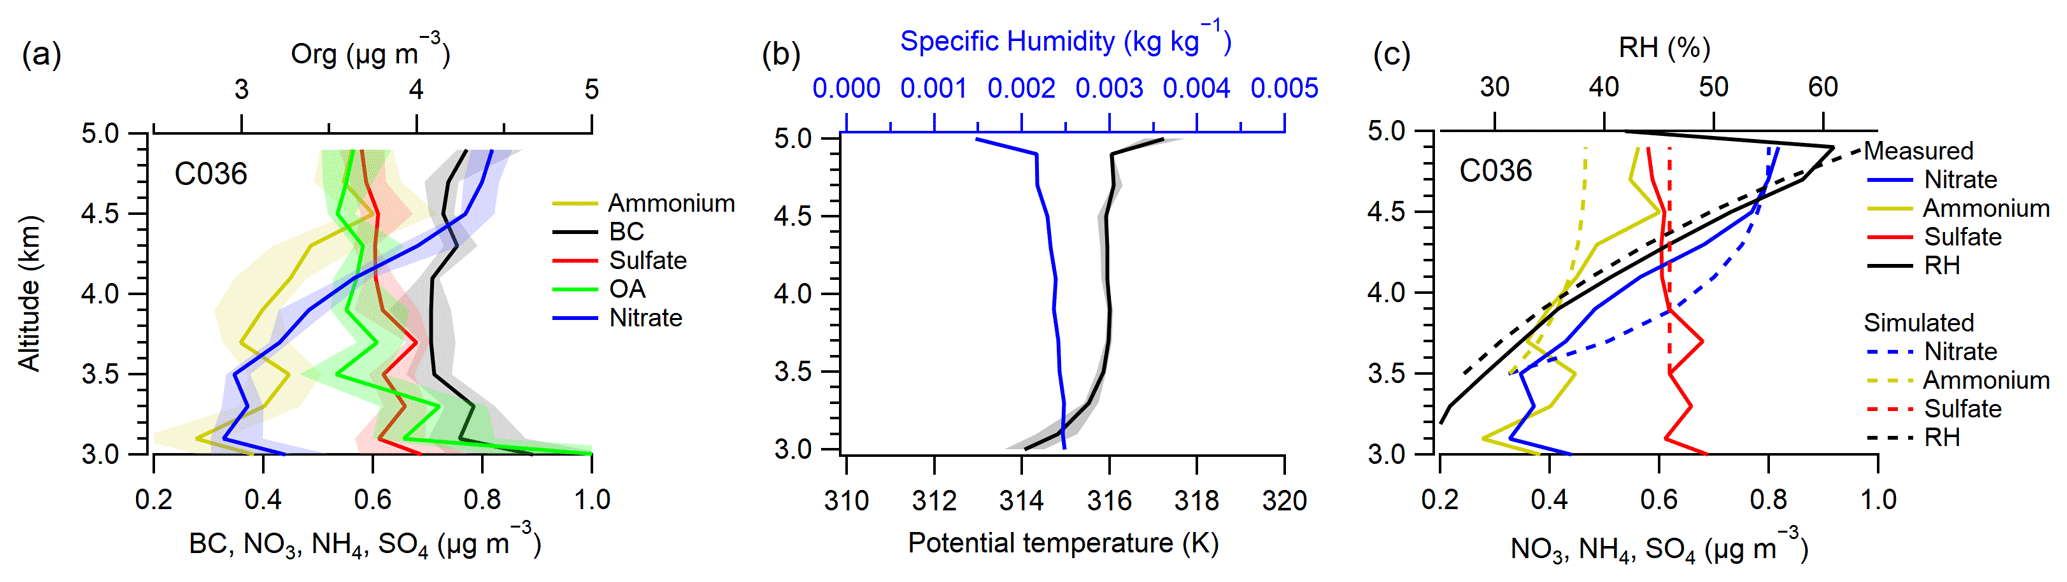
Figure 10The vertical distributions (3000–5000 m) of (a) different chemical composition concentrations and (b) potential temperature and specific humidity in flight C036 (24 August). The lines and shades represent the 25th percentile, median and 75th percentile in every 200 m bin. (c) The simulated and measured chemical composition and RH at different altitudes with variable temperatures.
Individual aerosol layers at different altitudes may have different source or transport history, as evidenced by the back-trajectory studies in Haywood et al. (2020), very probably leading to variation in the fractional chemical composition. CLARIFY measurements show that the nitrate aerosol was largely inorganic and existed in the form of ammonium nitrate (NH4NO3) in the FT (see Sect. S2), which is a semi-volatile and hygroscopic inorganic salt. The increasing nitrate mass fraction with altitude could also be reasonably explained by the chemical thermodynamics of the HNO3–NH3–NH4NO3 system across large temperature gradients (temperature could drop over 20 K from the low FT to the top of the aerosol layer, as seen in Fig. 9). During some flights, individual layers were well mixed, indicated by a constant potential temperature throughout their depth. In these smoke layers, increasing mass concentrations of nitrate and ammonium with increasing altitude were observed, while other species were relatively invariant with altitude. An example of a well-mixed smoke layer from flight C036 is shown in Fig. 10a and b. We conducted a simulation of the chemical thermodynamics in this example smoke layer, using a temperature-dependent thermodynamic model described in Friese and Ebel (2010). The inputs of ambient conditions (temperature and water content) and inorganic compositions (sulfate, nitrate and ammonium) were set to measured values in flight C036, and the ammonia value was assumed based on previous savanna wildfire studies in Andreae (2019). With the same initial compositions, the nitrate and ammonium concentrations were simulated over a measured temperature range (at different altitudes) from 281 to 269 K. The modelled nitrate and ammonium showed an increasing trend with height, in a similar way to that of the measurements (see Fig. 10c), suggesting lower temperatures at higher altitudes would shift the gas–particle partitioning of the HNO3–NH3–NH4NO3 system toward the aerosol phase and significantly increase the amount of NH4NO3. The intrusion of BB smoke in the FT during periods 2 and 3 increased specific humidity compared with the cleaner FT in period 1 (see Fig. 9), since the FT smoke tends to coexist with enhanced water vapour as discussed in Adebiyi et al. (2015). With relatively constant specific humidity in BB smoke over the vertical profile, the measured and simulated RH (Figs. 9 and 10c) were both shown to increase at higher altitudes, consistent with colder temperatures aloft. As RH values reach 70 %, i.e. at the top of the aerosol layers around 5 km, aerosols are likely to become liquid particles and allow NH4NO3 to dissolve in the aqueous aerosol phase. In summary, there is a greater chance for nitrate to be present in the aerosol phase in the colder and higher RH atmosphere encountered towards the top of the aerosol layers.

Figure 11The vertical distributions of BC mass fraction and number fraction in the BB-polluted FT (blue) and BL (black) respectively. The box-and-whisker plots represent the 10th percentile, 25th percentile, median, 75th percentile and 90th percentile in every 400 m.
With higher nitrate mass fraction at higher altitudes, BC constituted a smaller mass fraction, while the BC number fraction remained relatively constant in the FT (see Fig. 11). This indicates that the additional nitrate is likely to be mostly internally mixed with existing particles. From the low FT up to 5 km, the mass was observed to increase by ∼ 15 % due to the additional NH4NO3. The average aerosol composition fractions in the low FT were observed to be 64 %, 14 %, 6 %, 12 % and 4 % for OA, BC, ammonium, sulfate and nitrate. The average density of a particle in the low FT was estimated to be 1.356 g cm−3 following the method in Haslett et al. (2019a), assuming all particles are internally mixed. The density of NH4NO3 is assumed to be 1.725 g cm−3 (Haslett et al., 2019a). When the additional NH4NO3 is internally mixed, it is estimated to lead to a ∼ 4 % increase in aerosol radius, assuming the particles are spherical. This is consistent with the slight vertical change of CMDs of bulk aerosols in the FT. It is likely that this internal mixing did not significantly alter the overall dry aerosol size distributions. SSA is closely related to the particle size and chemical composition. The slightly increased particle size and the larger fraction of scattering material at higher levels would consistently contribute to the increasing SSA with altitude observed during CLARIFY.
In this study, the calculated SSAs from the PAS and CRDS instruments are for dry aerosols. It is well known that an increase in RH can result in an increase in aerosol scattering, since particle size and refractive index vary with particle water content (e.g. Zieger et al., 2013; Burgos et al., 2019). In the CLARIFY region, increasing RH with altitude in the FT is likely to result in an increase in aerosol size and scattering, when aerosol particles are most likely to acquire water near the top of the aerosol layers. Previous studies have reported that aerosol absorption can be also affected by humidification. However, it is noted that most of studies considering the effect of humidification on aerosol absorption observed little or no increase in absorption for RH < 85 % (e.g. Brem et al., 2012). The RH of observed smoke in the FT during CLARIFY was rarely over 80 %. If there is little effect of humidity on absorption, we would expect that the impact of humidification is likely to increase SSA at higher levels, indicating a substantially larger vertical variation in SSA in the FT.
4.1.2 In the BL
The entrainment of FT smoke is a recognized source for BL BBA over the southeast Atlantic (Gordon et al., 2018; Zuidema et al., 2018; Haslett et al., 2019b). There are two important factors that are likely to alter aerosol properties after FT BBA mix into the BL. The first factor is marine emissions in the BL, and the second is removal processes as evidenced by lower BC∕ΔCO and OA∕ΔCO ratios in the BL than in the FT.
Dimethyl sulfide (DMS) from oceanic biogenic emission is an important source of sulfate precursor, SO2, and sulfate aerosol (Perraud et al., 2015). The clean BL described in Sect. 3 suggests new particle formation and growth and a marine sulfate background. Some of these marine sulfates would become internally mixed with BBA either by condensation of H2SO4 or by cloud processing, thus driving nitrate to evaporate into the gas phase and causing the loss of nitrate aerosol in the BL. Taylor et al. (2020) did not observe thicker BC coatings in the BL than those in the low FT, while in this study the sulfate mass fraction in the BL was significantly enhanced, suggesting that some of the marine sulfate would be also externally mixed with BBA. Sea salt particles from sea spray can also provide submicron particles which exhibit an SSA close to 1. The mixing of more scattering material from marine emissions can result in a higher SSA in the BL than in the FT.
The wet removal events usually occur via aerosol activation to form cloud droplets during in-cloud processing and subsequent removal of those droplets by precipitation, which would also facilitate below-cloud aerosol scavenging (Moteki et al., 2012; Taylor et al., 2014). In this study, OA dominated the aerosol composition and was characterised by high f44, which is closely associated with carboxylic acid content (Heald et al., 2010; Duplissy et al., 2011). The aerosols with a large proportion of inorganic species and OA are likely to be hygroscopic. Larger aerosol particles which are hygroscopic were preferentially activated and scavenged during removal events in the BL; thus the dry CMDs of remaining bulk aerosols in the BL were smaller than those in the FT. However, the removal rates were not as significant as previous studies of BBA removal affected by strong precipitation events which show a scavenging fraction of over 80 % (Taylor et al., 2014). This suggests that the scavenging efficiency of removal by drizzle in the marine BL was not large in the CLARIFY region. Our measurements show that the extent of this removal process is sufficient to reduce the dry CMD by ∼ 10 % (Fig. 6).
The BC mass and number fractions in the BL were both lower when close to the surface (see Fig. 11). This may suggest variations in the extent of external mixing between BBA and marine particles throughout the BL. In the CLARIFY region, the widespread stratocumulus clouds commonly lead to a decoupled BL (Lock et al., 2000; Gordon et al., 2018). Abel et al. (2020) showed an example structure of decoupled BL during period 3, with an unstable layer from the sea surface up to an altitude of about 600 to 700 m and then another layer up to the main BL inversion. The surface layer is likely to have a significant source of marine sulfate from secondary formation as well as submicron sea salt aerosol from sea spray. This could explain the higher sulfate mass fraction and higher SSA close to the sea surface.
These properties (chemical, size and optical) and variations that we have reported are all for dry aerosols in the BL. The RH in the BB-polluted BL was mostly over 80 % and up to 95 % at the BL top (Fig. 9), which would result in significant aerosol growth and scattering enhancement. Based on a scattering enhancement factor of ∼ 1.4 at RH of 80 % reported for ORACLES (Pistone et al., 2019) and SAFARI (Magi et al., 2003) aged BBA, there will be an increase in SSA by 0.03–0.05 in the BL, without considering absorption change. However, in reality, this value will be lower since absorption enhancement is suggested to be significant at high humidity (RH > 85 %) (e.g. Brem et al., 2012), which would have the opposite effect of lowering SSA. Due to high uncertainties surrounding these competing effects, more quantification studies of humidification impacts on aerosol optical properties are needed to determine BL biomass burning SSA in detail in this region.
4.2 Drivers of the low SSA
Previous measurements of fresh or transported BBA from forest fires in the Amazon, Siberia and North America reported a range of (2 %–9 %) for the average BC mass fractions of BBA (Kondo et al., 2011; Sahu et al., 2012; Artaxo et al., 2013; Allan et al., 2014; Morgan et al., 2020). Corresponding average dry SSA (at ∼ 550 nm) ranged from 0.88 to 0.97, using in situ measurements with the PSAP and nephelometer (Corr et al., 2012; Johnson et al., 2016; Laing et al., 2016). Compared with other BB-type regions, BBA during CLARIFY was richer in BC, with larger BC mass fraction and lower SSA. Many factors contribute to the larger BC mass fraction. Burning sources of the CLARIFY transported BB smoke were controlled by flaming combustion with very high MCE, indicating that the emission of BC is likely to be proportionally high. The burning fuel of the southern Africa savanna is also suggested to have higher BC emission factors than forests or peat (Andreae, 2019). Both high MCE and the fuel type would lead to BC-rich smoke plumes at sources. OA loss induced by the ageing process and volatilization of semi-volatile material during dilution are likely to further enhance the BC mass fraction. This is consistent with the chemical composition comparison between BBA of different ages from other relevant studies, detailed in Table 1. In the absence of significant removal over the South Atlantic, these BC-rich smoke plumes from the southern Africa fires lead to the high BC contents far offshore, even after > 7 d transport. The high BC fraction leads to a large fraction of absorbing material in the sampled BBA and therefore contributes to the low observed SSA during CLARIFY.
The mass absorption cross section (MAC = BAbs ∕ BC mass concentration) describes the absorption efficiency of BC particles. In the CLARIFY region, MAC was found to be much higher than the MAC of fresh, uncoated BC (MAC = 7.5 m2 g−1 at 550 nm) suggested by Bond and Bergstrom (2006). Average MAC values from ground-based measurements at Ascension Island were reported as 15.1, 13.3 and 10.7 m2 g−1 at 464, 529 and 648 nm respectively (Zuidema et al., 2018). Higher MAC values (20.3, 14.6 and 11.8 m2 g−1 at 405, 514 and 658 nm respectively) were also observed from aircraft observations during CLARIFY (Taylor et al., 2020). The absorption Ångström exponent (AAE) of CLARIFY BBA was reported to be close to 1 (Taylor et al., 2020). It is assumed that an AAE over 1 indicates absorption from particles like brown carbon (BrC) or dust which have higher AAEs than BC (Lack and Langridge, 2013). There was only a minor non-BC material contribution to the total aerosol absorption in the CLARIFY region (Taylor et al., 2020). The enhanced absorption is therefore likely to be mostly due to the observed thick coatings on BC (Taylor et al., 2020), causing a lensing effect and additional absorption of sunlight (Lack et al., 2009). The high MAC values of BC would also contribute to the relatively low observed SSA.
The relatively low dry SSA measured during CLARIFY, as determined by highly sensitive and accurate measurements that are not subject to the artefacts of filter-based methods, is an important result. The SSA of aged BBA used in climate models is generally higher than the SSA in this study (e.g. Randles and Ramaswamy, 2010; Johnson et al., 2016; Herbert et al., 2020). Furthermore, the vertical profiles of SSA show that the lowest values (averages: 0.82, 0.81 and 0.79 at 405, 550 and 658 nm) occur at low FT layers around 2000 m altitude, immediately above the stratiform cloud. The air is also relatively dry within these low FT layers, meaning that the measured dry SSA is analogous to ambient condition. This is important as the positive radiative feedback associated with the aerosol direct effects may be underestimated in current models, especially for the cases with low and thin smoke layers above clouds. Herbert et al. (2020) also found that both the cloud response and semi-direct radiative effects increase for thinner and denser overlying aerosol layers with lower SSA. The bias in modelled SSA values is likely to lead to misrepresentation of semi-direct effects as may neglecting the vertical variation in SSA. These findings suggest that modelled climate effects of BBA in this region need reassessment in future studies, and the variation in SSA values in different BB regions should be considered.
We have presented a detailed study of BBA chemical, physical and optical properties from the CLARIFY aircraft campaign, based from Ascension Island in the southeast Atlantic Ocean. These are the first accurate in situ airborne measurements providing aerosol vertical information in this area, which is affected by long-range transport of southern African BBA every year and is important climatically. Our dataset complements previous observations of the southern African BBA and extends previous studies to a wider geographical range and to a greater age of smoke. It provides unique parameterizations with which to constrain global and regional climate models and predict radiative effects across this region.
BB smoke plumes during CLARIFY have been shown to be mostly controlled by flaming combustion at their sources, and BBA has not undergone significant removal processes before arrival in the CLARIFY region, since enhancement ratios of BC remain relatively high. Transported submicron BBA was mainly composed of OA (50 %–60 % by mass) and BC (8 %– 15 % by mass), over the southeast Atlantic. The particles have undergone a significant ageing process during > 7 d transit from source, as indicated by highly oxidized and low-volatility OA in this study and thickly coated BC in Taylor et al. (2020). CLARIFY data provide a good representation of highly aged aerosols from the southern African BB.
The highly aged BBA in the CLARIFY region has relatively low dry SSA as the BBAs are rich in BC and the MAC of the sampled BC is high. The column-weighted dry SSAs were observed to be 0.85, 0.84 and 0.83 at 405, 550 and 658 nm respectively. We also observed vertical variability of the dry SSA: the lowest SSA (averages: 0.82, 0.81 and 0.79 at 405, 550 and 658 nm) in the column was generally in the low FT layer around 2000 m altitude, and the SSA increased with altitude in the FT. In the BL, the SSA decreased from the surface to the BL top, with the highest SSA in the column observed in the near-surface layer. The measured BBA in the CLARIFY region is generally more absorbing than currently represented in climate models. Considering these BBAs have a long lifetime and their spatial range spans thousands of kilometres, and the direct and semi-direct radiative effects of smoke layers in the southeast Atlantic area are highly sensitive to the absorbing properties of BBA (Mallet et al., 2020), modelled climate effects need reassessment over this region.
In the CLARIFY region, the observed vertical variation in SSA is likely to be a persistent feature, which is a function of vertical variations in relative chemical composition, size and mixing state of these aerosols. In the FT, the main driver for vertical variability is the thermodynamic processing of inorganic nitrate driven by lower temperatures and higher RH at the top of the BBA layer. The increasing fraction of condensed nitrates is likely to be internally mixed with existing particles, which alters the relative chemical composition but does not significantly change the aerosol size distributions. Increases in the dry SSA with altitude are associated with the larger fractions of scattering material and slightly increased particle size at higher levels. These effects describe the variation in the dry aerosol properties. However, considering the effect of elevated RH on aerosol scattering at higher altitudes, the vertical variation in SSA is likely to be more significant when adjusted to ambient conditions.
The aerosols in the BL are essentially separate from the FT. Once aerosols are entrained into the BL, the BBA circulates independently of the aerosol above it owing to the strong inversion. There are two important factors affecting aerosol properties in the BL. One is marine emissions providing marine sulfate and sea salt, which can be internally or externally mixed with BBA. Another one is the possible aerosol removal by drizzle, resulting in smaller bulk aerosol size distributions. A larger fraction of scattering material may lead to a higher average dry SSA in the BL than in the FT. Vertical variability of aerosol properties exists since the BL is commonly decoupled over the southeast Atlantic. A larger concentration of marine sulfate or submicron sea salt is more likely to be present in the surface layer than above, leading to more scattering material and therefore higher SSA.
These observations provide new information in a climatically important region and demonstrate that the persistence of strongly absorbing aerosol from southern African BB across wide regions of the South Atlantic is prevalent and must be taken into account when considering regional radiation interactions. The observed vertical variation in aerosol properties throughout the BL and FT, especially SSA, should be also considered as part of any future studies which rely on prescribed aerosol composition and optical properties.
Airborne measurements are available from the Centre for Environmental Data Analysis (https://catalogue.ceda.ac.uk/uuid/38ab7089781a4560b067dd6c20af3769, Facility for Airborne Atmospheric Measurements et al., 2017).
The supplement related to this article is available online at: https://doi.org/10.5194/acp-20-12697-2020-supplement.
HC and JH designed the research; JWT, JML, PIW, MF, JP, MIC, SJA, CF and NWD performed field experiments; HW, JWT, KS, JML, JDA and JP prepared datasets of AMS, SP2, PAS, CRD and FGGA; HW and JWT analysed datasets; and HW, JWT and HC wrote the paper.
The authors declare that they have no conflict of interest.
This article is part of the special issue “New observations and related modelling studies of the aerosol–cloud–climate system in the Southeast Atlantic and southern Africa regions (ACP/AMT inter-journal SI)”. It is not associated with a conference.
The staff of Airtask, Avalon Engineering and the Facility for Airborne Atmospheric Measurements (FAAM) are thanked for their thoroughly professional work, before, during and after the deployment.
This research has been supported by the Natural Environment Research Council (grant no. NE/L013584/1).
This paper was edited by Paquita Zuidema and reviewed by Steven Howell, Allison C. Aiken, and one anonymous referee.
Abel, S. J., Haywood, J. M., Highwood, E. J., Li, J., and Buseck, P. R.: Evolution of biomass burning aerosol properties from an agricultural fire in southern Africa, Geophys. Res. Lett., 30, 1783, https://doi.org/10.1029/2003GL017342, 2003.
Abel, S. J., Highwood, E. J., Haywood, J. M., and Stringer, M. A.: The direct radiative effect of biomass burning aerosols over southern Africa, Atmos. Chem. Phys., 5, 1999–2018, https://doi.org/10.5194/acp-5-1999-2005, 2005.
Abel, S. J., Barrett, P. A., Zuidema, P., Zhang, J., Christensen, M., Peers, F., Taylor, J. W., Crawford, I., Bower, K. N., and Flynn, M.: Open cells exhibit weaker entrainment of free-tropospheric biomass burning aerosol into the south-east Atlantic boundary layer, Atmos. Chem. Phys., 20, 4059–4084, https://doi.org/10.5194/acp-20-4059-2020, 2020.
Adachi, K., Moteki, N., Kondo, Y., and Igarashi, Y.: Mixing states of light-absorbing particles measured using a transmission electron microscope and a single-particle soot photometer in Tokyo, Japan, J. Geophys. Res.-Atmos., 121, 9153–9164, https://doi.org/10.1002/2016JD025153, 2016.
Adebiyi, A. and Zuidema, P.: The Role of the Southern African Easterly Jet in Modifying the Southeast Atlantic Aerosol and Cloud Environments, Q. J. Roy. Meteor. Soc., 142, 697, 1574–1589, https://doi.org/10.1002/qj.2765, 2016
Adebiyi, A. A., Zuidema, P., and Abel, S. J.: The Convolution of Dynamics and Moisture with the Presence of Shortwave Absorbing Aerosols over the Southeast Atlantic, J. Climate, 28, 1997–2024, https://doi.org/10.1175/JCLI-D-14-00352.1, 2015.
Aiken, A. C., Decarlo, P. F., Kroll, J. H., Worsnop, D. R., Huffman, J. A., Docherty, K. S., Ulbrich, I. M., Mohr, C., Kimmel, J. R., Sueper, D., Sun, Y., Zhang, Q., Trimborn, A., Northway, M., Ziemann, P. J., Canagaratna, M. R., Onasch, T. B., Alfarra, M. R., Prevot, A. S. H., Dommen, J., Duplissy, J., Metzger, A., Baltensperger, U., and Jimenez, J. L.: O∕C and OM∕OC ratios of primary, secondary, and ambient organic aerosols with highresolution time-of-flight aerosol mass spectrometry, Environ. Sci. Technol., 42, 4478–4485, https://doi.org/10.1021/es703009q, 2008.
Alfarra, M. R., Prevôt, A. S. H., Szidat, S., Sandradewi, J., Weimer, S., Lanz, V. A., Schreiber, D., Mohr, M., and Baltensperger, U.: Identification of the mass spectral signature of organic aerosols from wood burning emissions, Environ. Sci. Technol., 41, 5770–5777, https://doi.org/10.1021/es062289b, 2007.
Allan, J. D., Morgan, W. T., Darbyshire, E., Flynn, M. J., Williams, P. I., Oram, D. E., Artaxo, P., Brito, J., Lee, J. D., and Coe, H.: Airborne observations of IEPOX-derived isoprene SOA in the Amazon during SAMBBA, Atmos. Chem. Phys., 14, 11393–11407, https://doi.org/10.5194/acp-14-11393-2014, 2014.
Andreae, M. O.: Emission of trace gases and aerosols from biomass burning – an updated assessment, Atmos. Chem. Phys., 19, 8523–8546, https://doi.org/10.5194/acp-19-8523-2019, 2019.
Andreae, M. O. and Merlet, P.: Emission of trace gases and aerosols from biomass burning, Global Biogeochem. Cy., 15, 955–966, https://doi.org/10.1029/2000gb001382, 2001.
Artaxo, P., Rizzo, L. V., Brito, J. F., Barbosa, H. M., Arana, A., Sena, E. T., Cirino, G. G., Bastos, W., Martin, S. T., and Andreae, M. O.: Atmospheric aerosols in Amazonia and land use change: from natural biogenic to biomass burning conditions, Faraday Discuss, 165, 203–235, https://doi.org/10.1039/c3fd00052d, 2013.
Baars, H., Ansmann, A., Althausen, D., Engelmann, R., Artaxo, P., Pauliquevis, T., and Souza, R.: Further evidence for significant smoke transport from Africa to Amazonia, Geophys. Res. Lett., 38, L20802, https://doi.org/10.1029/2011GL049200, 2011.
Bahreini, R., Ervens, B., Middlebrook, A. M., Warneke, C., de Gouw, J. A., DeCarlo, P. F., Jimenez, J. L., Brock, C. A., Neuman, J. A., Ryerson, T. B., Stark, H., Atlas, E., Brioude, J., Fried, A., Holloway, J. S., Peischl, J., Richter, D., Walega, J., Weibring, P., Wollny, A. G., and Fehsenfeld, F. C.: Organic aerosol formation in urban and industrial plumes near Houston and Dallas, Texas, J. Geophys. Res., 114, D00f16, https://doi.org/10.1029/2008jd011493, 2009.
Bond, T. C. and Bergstrom, R. W.: Light absorption by carbonaceous particles: An investigative review, Aerosol Sci. Tech., 40, 27–67, https://doi.org/10.1080/02786820500421521, 2006.
Brem, B. T., Mena Gonzalez, F. C., Meyers, S. R., Bond, T. C., and Rood, M. J.: Laboratory-Measured Optical Properties of Inorganic and Organic Aerosols at Relative Humidities up to 95 %, Aerosol Sci. Tech., 46, 178–190, https://doi.org/10.1080/02786826.2011.617794, 2012.
Burgos, M.A., Andrews, E., Titos, G., Alados-Arboledas, L., Baltensperger, U., Day, D., Jefferson, A., Kalivitis, N., Mihalpoulos, N., Sherman, J., Sun, J., Weingartner, E., and Zieger, P.: A global view on the effect of water uptake on aerosol particle light scattering, Sci Data, 6, 157, https://doi.org/10.1038/s41597-019-0158-7, 2019.
Capes, G., Johnson, B., McFiggans, G., Williams, P. I., Haywood, J., and Coe, H.: Aging of biomass burning aerosols over West Africa: Aircraft measurements of chemical composition, microphysical properties, and emission ratios, J. Geophys. Res.-Atmos., 113, D00C15, https://doi.org/10.1029/2008JD009845, 2008.
Christian, T., Kleiss, B., Yokelson, R. J., Holzinger, R., Crutzen, P. J., Hao, W. M., Saharjo, B. H., and Ward, D. E.: Comprehensive laboratory measurements of biomass-burning emissions: 1. Emissions from Indonesian, African, and other fuels, J. Geophys. Res., 108, 4719, https://doi.org/10.1029/2003JD003704, 2003.
Cochrane, S. P., Schmidt, K. S., Chen, H., Pilewskie, P., Kittelman, S., Redemann, J., LeBlanc, S., Pistone, K., Kacenelenbogen, M., Segal Rozenhaimer, M., Shinozuka, Y., Flynn, C., Dobracki, A., Zuidema, P., Howell, S., Freitag, S., and Doherty, S.: Empirically-Derived Parameterizations of the Direct Aerosol Radiative Effect based on ORACLES Aircraft Observations, Atmos. Meas. Tech. Discuss., https://doi.org/10.5194/amt-2020-137, in review, 2020.
Corr, C. A., Hall, S. R., Ullmann, K., Anderson, B. E., Beyersdorf, A. J., Thornhill, K. L., Cubison, M. J., Jimenez, J. L., Wisthaler, A., and Dibb, J. E.: Spectral absorption of biomass burning aerosol determined from retrieved single scattering albedo during ARCTAS, Atmos. Chem. Phys., 12, 10505–10518, https://doi.org/10.5194/acp-12-10505-2012, 2012.
Costantino, L. and Bréon, F.-M.: Aerosol indirect effect on warm clouds over South-East Atlantic, from co-located MODIS and CALIPSO observations, Atmos. Chem. Phys., 13, 69–88, https://doi.org/10.5194/acp-13-69-2013, 2013.
Cotterell, M. I., Orr-Ewing, A. J., Szpek, K., Haywood, J. M., and Langridge, J. M.: The impact of bath gas composition on the calibration of photoacoustic spectrometers with ozone at discrete visible wavelengths spanning the Chappuis band, Atmos. Meas. Tech., 12, 2371–2385, https://doi.org/10.5194/amt-12-2371-2019, 2019.
Cubison, M. J., Ortega, A. M., Hayes, P. L., Farmer, D. K., Day, D., Lechner, M. J., Brune, W. H., Apel, E., Diskin, G. S., Fisher, J. A., Fuelberg, H. E., Hecobian, A., Knapp, D. J., Mikoviny, T., Riemer, D., Sachse, G. W., Sessions, W., Weber, R. J., Weinheimer, A. J., Wisthaler, A., and Jimenez, J. L.: Effects of aging on organic aerosol from open biomass burning smoke in aircraft and laboratory studies, Atmos. Chem. Phys., 11, 12049–12064, https://doi.org/10.5194/acp-11-12049-2011, 2011.
Das, S., Harshvardhan, H., Bian, H., Chin, M., Curci, G., Protonotariou, A. P., Mielonen, T., Zhang, K., Wang, H., and Liu, X.: Biomass burning aerosol transport and vertical distribution over the South African-Atlantic region, J. Geophys. Res.-Atmos., 122, 6391–6415, https://doi.org/10.1002/2016jd026421, 2017.
Davies, N. W., Cotterell, M. I., Fox, C., Szpek, K., Haywood, J. M., and Langridge, J. M.: On the accuracy of aerosol photoacoustic spectrometer calibrations using absorption by ozone, Atmos. Meas. Tech., 11, 2313–2324, https://doi.org/10.5194/amt-11-2313-2018, 2018.
Davies, N. W., Fox, C., Szpek, K., Cotterell, M. I., Taylor, J. W., Allan, J. D., Williams, P. I., Trembath, J., Haywood, J. M., and Langridge, J. M.: Evaluating biases in filter-based aerosol absorption measurements using photoacoustic spectroscopy, Atmos. Meas. Tech., 12, 3417–3434, https://doi.org/10.5194/amt-12-3417-2019, 2019.
Delgadillo, R., Voss, K. J., and Zuidema, P.: Characteristics of Optically Thin Coastal Florida Cumuli Derived From Surface-Based Lidar Measurements, J. Geophys. Res.-Atmos., 123, 10591–10605, https://doi.org/10.1029/2018JD028867, 2018.
Drewnick, F., Hings, S. S., DeCarlo, P., Jayne, J. T., Gonin, M., Fuhrer, K., Weimer, S., Jimenez, J. L., Demerjian, K. L., Borrmann, S., and Worsnop, D. R.: A new time-of-flight aerosol mass spectrometer (TOF-AMS) – Instrument description and first field deployment, Aerosol Sci. Tech., 39, 637–658, https://doi.org/10.1080/02786820500182040, 2005.
Duplissy, J., DeCarlo, P. F., Dommen, J., Alfarra, M. R., Metzger, A., Barmpadimos, I., Prevot, A. S. H., Weingartner, E., Tritscher, T., Gysel, M., Aiken, A. C., Jimenez, J. L., Canagaratna, M. R., Worsnop, D. R., Collins, D. R., Tomlinson, J., and Baltensperger, U.: Relating hygroscopicity and composition of organic aerosol particulate matter, Atmos. Chem. Phys., 11, 1155–1165, https://doi.org/10.5194/acp-11-1155-2011, 2011.
Edwards, D. P., Emmons, L. K., Gille, J. C., Chu, A., Attie, J., Giglio, L., Wood, S. W., Haywood, J., Deeter, M. N., Massie, S. T., Ziskin, D. C., and Drummond, J. R.: Satellite-observed pollution from Southern Hemisphere biomass burning, J. Geophys. Res.-Atmos., 111, D14312, https://doi.org/10.1029/2005JD006655, 2006.
Facility for Airborne Atmospheric Measurements, Natural Environment Research Council, and Met Office: CLARIFY: in-situ airborne observations by the FAAM BAE-146 aircraft, Centre for Environmental Data Analysis, available at: http://catalogue.ceda.ac.uk/uuid/38ab7089781a4560b067dd6c20af3769 (last access: 28 October 2020), 2017.
Formenti, P., Elbert, W., Maenhaut, W., Haywood, J., Osborne, S., and Andreae, M. O.: Inorganic and carbonaceous aerosols during the Southern African Regional Science Initiative (SAFARI 2000) experiment: Chemical characteristics, physical properties, and emission data for smoke from African biomass burning, J. Geophys. Res.-Atmos., 108, 8488, https://doi.org/10.1029/2002jd002408, 2003.
Formenti, P., D'Anna, B., Flamant, C., Mallet, M. D., Piketh, S. J., Schepanski, K., Waquet, F., Auriol, F., Brogniez, G., Burnet, F., Chaboureau, J.-P., Chauvigné, A., Chazette, P., Denjean, C., Desboeufs, K., Doussin, J.-F., Elguindi, N., Feuerstein, S., Gaetani, M., Giorio, C., Klopper, D., Mallet, M. D., Nabat, P., Monod, A., Solmon, F., Namwoonde, A., Chikwililwa, C., Mushi, R., Welton, E. J., Holben, B., Formenti, P., D'Anna, B., Flamant, C., Mallet, M. D., Piketh, S. J., Schepanski, K., Waquet, F., Auriol, F., Brogniez, G., Burnet, F., Chaboureau, J.-P., Chauvigné, A., Chazette, P., Denjean, C., Desboeufs, K., Doussin, J.-F., Elguindi, N., Feuerstein, S., Gaetani, M., Giorio, C., Klopper, D., Mallet, M. D., Nabat, P., Monod, A., Solmon, F., Namwoonde, A., Chikwililwa, C., Mushi, R., Welton, E. J., and Holben, B.: The Aerosols, Radiation and Clouds in southern Africa (AEROCLOsA) field campaign in Namibia: overview, illustrative observations and way forward, B. Am. Meteorol. Soc., 100, 1277–1298, https://doi.org/10.1175/BAMS-D-17-0278.1, 2019.
Friese, E. and Ebel, A.: Temperature dependent thermodynamic model of the system H+–NH–Na+–SO–NO–Cl−–H2O, J. Phys. Chem. A, 114, 11595–11631, https://doi.org/10.1021/Jp101041j, 2010.
Fuzzi, S., Baltensperger, U., Carslaw, K., Decesari, S., Denier van der Gon, H., Facchini, M. C., Fowler, D., Koren, I., Langford, B., Lohmann, U., Nemitz, E., Pandis, S., Riipinen, I., Rudich, Y., Schaap, M., Slowik, J. G., Spracklen, D. V., Vignati, E., Wild, M., Williams, M., and Gilardoni, S.: Particulate matter, air quality and climate: lessons learned and future needs, Atmos. Chem. Phys., 15, 8217–8299, https://doi.org/10.5194/acp-15-8217-2015, 2015.
Gerbig, C., Schmitgen, S., Kley, D., Volz-Thomas, A., Dewey, K., and Haaks, D.: An improved fast-response vacuum-UV resonance fluorescence CO instrument, J. Geophys. Res.-Atmos., 104, 1699–1704, https://doi.org/10.1029/1998JD100031, 1999.
Gordon, H., Field, P. R., Abel, S. J., Dalvi, M., Grosvenor, D. P., Hill, A. A., Johnson, B. T., Miltenberger, A. K., Yoshioka, M., and Carslaw, K. S.: Large simulated radiative effects of smoke in the south-east Atlantic, Atmos. Chem. Phys., 18, 15261–15289, https://doi.org/10.5194/acp-18-15261-2018, 2018.
Haslett, S. L., Taylor, J. W., Deetz, K., Vogel, B., Babić, K., Kalthoff, N., Wieser, A., Dione, C., Lohou, F., Brito, J., Dupuy, R., Schwarzenboeck, A., Zieger, P., and Coe, H.: The radiative impact of out-of-cloud aerosol hygroscopic growth during the summer monsoon in southern West Africa, Atmos. Chem. Phys., 19, 1505–1520, https://doi.org/10.5194/acp-19-1505-2019, 2019a.
Haslett, S. L., Taylor, J. W., Evans, M., Morris, E., Vogel, B., Dajuma, A., Brito, J., Batenburg, A. M., Borrmann, S., Schneider, J., Schulz, C., Denjean, C., Bourrianne, T., Knippertz, P., Dupuy, R., Schwarzenböck, A., Sauer, D., Flamant, C., Dorsey, J., Crawford, I., and Coe, H.: Remote biomass burning dominates southern West African air pollution during the monsoon, Atmos. Chem. Phys., 19, 15217–15234, https://doi.org/10.5194/acp-19-15217-2019, 2019b.
Haywood, J. M., Osborne, S. R., Francis, P. N., Keil, A., Formenti, P., Andreae, M. O., and Kaye, P. H.: The mean physical and optical properties of regional haze dominated by biomass burning aerosol measured from the C-130 aircraft during SAFARI 2000, J. Geophys. Res., 108, 8473, https://doi.org/10.1029/2002JD002226, 2003a.
Haywood, J. M., Francis, P., Dubovik, O., Glew, M., and Holben, B.: Comparison of aerosol size distributions, radiative properties, and optical depths determined by aircraft observations and Sun photometers during SAFARI 2000, J. Geophys. Res., 108, 8471, https://doi.org/10.1029/2002JD002250, 2003b.
Haywood, J. M., Abel, S. J., Barrett, P. A., Bellouin, N., Blyth, A., Bower, K. N., Brooks, M., Carslaw, K., Che, H., Coe, H., Cotterell, M. I., Crawford, I., Cui, Z., Davies, N., Dingley, B., Field, P., Formenti, P., Gordon, H., de Graaf, M., Herbert, R., Johnson, B., Jones, A. C., Langridge, J. M., Malavelle, F., Partridge, D. G., Peers, F., Redemann, J., Stier, P., Szpek, K., Taylor, J. W., Watson-Parris, D., Wood, R., Wu, H., and Zuidema, P.: Overview: The CLoud-Aerosol-Radiation Interaction and Forcing: Year-2017 (CLARIFY-2017) measurement campaign, Atmos. Chem. Phys. Discuss., https://doi.org/10.5194/acp-2020-729, in review, 2020.
Heald, C. L., Kroll, J. H., Jimenez, J. L., Docherty, K. S., DeCarlo, P. F., Aiken, A. C., Chen, Q., Martin, S. T., Farmer, D. K., and Artaxo, P.: A simplified description of the evolution of organic aerosol composition in the atmosphere, Geophys. Res. Lett., 37, L08803, https://doi.org/10.1029/2010GL042737, 2010.
Herbert, R. J., Bellouin, N., Highwood, E. J., and Hill, A. A.: Diurnal cycle of the semi-direct effect from a persistent absorbing aerosol layer over marine stratocumulus in large-eddy simulations, Atmos. Chem. Phys., 20, 1317–1340, https://doi.org/10.5194/acp-20-1317-2020, 2020.
Hodshire, A. L., Akherati, A., Alvarado, M. J., Brown-Steiner, B., Jathar, S. H., Jimenez, J. L., Kreidenweis, S. M., Lonsdale, C. R., Onasch, T. B., Ortega, A. M., and Pierce, J. R.: Aging Effects on Biomass Burning Aerosol Mass and Composition: A Critical Review of Field and Laboratory Studies, Environ. Sci. Technol., 53, 10007–10022, https://doi.org/10.1021/acs.est.9b02588, 2019
Holanda, B. A., Pöhlker, M. L., Walter, D., Saturno, J., Sörgel, M., Ditas, J., Ditas, F., Schulz, C., Franco, M. A., Wang, Q., Donth, T., Artaxo, P., Barbosa, H. M. J., Borrmann, S., Braga, R., Brito, J., Cheng, Y., Dollner, M., Kaiser, J. W., Klimach, T., Knote, C., Krüger, O. O., Fütterer, D., Lavrič, J. V., Ma, N., Machado, L. A. T., Ming, J., Morais, F. G., Paulsen, H., Sauer, D., Schlager, H., Schneider, J., Su, H., Weinzierl, B., Walser, A., Wendisch, M., Ziereis, H., Zöger, M., Pöschl, U., Andreae, M. O., and Pöhlker, C.: Influx of African biomass burning aerosol during the Amazonian dry season through layered transatlantic transport of black carbon-rich smoke, Atmos. Chem. Phys., 20, 4757–4785, https://doi.org/10.5194/acp-20-4757-2020, 2020.
Jimenez, J. L., Canagaratna, M. R., Donahue, N. M., Prevot, A. S., Zhang, Q., Kroll, J. H., DeCarlo, P. F., Allan, J. D., Coe, H., Ng, N. L., Aiken, A. C., Docherty, K. S., Ulbrich, I. M., Grieshop, A. P., Robinson, A. L., Duplissy, J., Smith, J. D., Wilson, K. R., Lanz, V. A., Hueglin, C., Sun, Y. L., Tian, J., Laaksonen, A., Raatikainen, T., Rautiainen, J., Vaattovaara, P., Ehn, M., Kulmala, M., Tomlinson, J. M., Collins, D. R., Cubison, M. J., Dunlea, E. J., Huffman, J. A., Onasch, T. B., Alfarra, M. R., Williams, P. I., Bower, K., Kondo, Y., Schneider, J., Drewnick, F., Borrmann, S., Weimer, S., Demerjian, K., Salcedo, D., Cottrell, L., Griffin, R., Takami, A., Miyoshi, T., Hatakeyama, S., Shimono, A., Sun, J. Y., Zhang, Y. M., Dzepina, K., Kimmel, J. R., Sueper, D., Jayne, J. T., Herndon, S. C., Trimborn, A. M., Williams, L. R., Wood, E. C., Middlebrook, A. M., Kolb, C. E., Baltensperger, U., and Worsnop, D. R.: Evolution of organic aerosols in the atmosphere, Science, 326, 1525–1529, https://doi.org/10.1126/science.1180353, 2009.
Johnson, B. T., Osborne, S. R., Haywood, J. M., and Harrison, M. A. J.: Aircraft measurements of biomass burning aerosol over West Africa during DABEX, J. Geophys. Res.-Atmos., 113, D00C06, https://doi.org/10.1029/2007JD009451, 2008.
Johnson, B. T., Haywood, J. M., Langridge, J. M., Darbyshire, E., Morgan, W. T., Szpek, K., Brooke, J. K., Marenco, F., Coe, H., Artaxo, P., Longo, K. M., Mulcahy, J. P., Mann, G. W., Dalvi, M., and Bellouin, N.: Evaluation of biomass burning aerosols in the HadGEM3 climate model with observations from the SAMBBA field campaign, Atmos. Chem. Phys., 16, 14657–14685, https://doi.org/10.5194/acp-16-14657-2016, 2016.
Jolleys, M. D., Coe, H., McFiggans, G., Taylor, J. W., O'Shea, S. J., Le Breton, M., Bauguitte, S. J.-B., Moller, S., Di Carlo, P., Aruffo, E., Palmer, P. I., Lee, J. D., Percival, C. J., and Gallagher, M. W.: Properties and evolution of biomass burning organic aerosol from Canadian boreal forest fires, Atmos. Chem. Phys., 15, 3077–3095, https://doi.org/10.5194/acp-15-3077-2015, 2015.
Kondo, Y., Matsui, H., Moteki, N., Sahu, L., Takegawa, N., Kajino, M., Zhao, Y., Cubison, M. J., Jimenez, J. L., Vay, S., Diskin, G. S., Anderson, B., Wisthaler, A., Mikoviny, T., Fuelberg, H. E., Blake, D. R., Huey, G., Weinheimer, A. J., Knapp, D. J., and Brune, W. H.: Emissions of black carbon, organic, and inorganic aerosols from biomass burning in North America and Asia in 2008, J. Geophys. Res.-Atmos., 116, D08204, https://doi.org/10.1029/2010JD015152, 2011.
Kroll, J. H., Donahue, N. M., Jimenez, J. L., Kessler, S., Canagaratna, M. R., Wilson, K., Alteri, K. E., Mazzoleni, L. R., Wozniak, A. S., Bluhm, H., Mysak, E. R., Smith, J. D., Kolb, C. E., and Worsnop, D. R.: Carbon oxidation state as a metric for describing the chemistry of atmospheric organic aerosol, Nat. Chem., 3, 133–139, https://doi.org/10.1038/nchem.948, 2011.
Labonne, M., Bre'on, F. M., and Chevallier, F.: Injection height of biomass burning aerosols as seen from a spaceborne lidar, Geophys. Res. Lett., 34, L11806, https://doi.org/10.1029/2007GL029311, 2007.
Laborde, M., Mertes, P., Zieger, P., Dommen, J., Baltensperger, U., and Gysel, M.: Sensitivity of the Single Particle Soot Photometer to different black carbon types, Atmos. Meas. Tech., 5, 1031–1043, https://doi.org/10.5194/amt-5-1031-2012, 2012a.
Laborde, M., Schnaiter, M., Linke, C., Saathoff, H., Naumann, K.-H., Möhler, O., Berlenz, S., Wagner, U., Taylor, J. W., Liu, D., Flynn, M., Allan, J. D., Coe, H., Heimerl, K., Dahlkötter, F., Weinzierl, B., Wollny, A. G., Zanatta, M., Cozic, J., Laj, P., Hitzenberger, R., Schwarz, J. P., and Gysel, M.: Single Particle Soot Photometer intercomparison at the AIDA chamber, Atmos. Meas. Tech., 5, 3077–3097, https://doi.org/10.5194/amt-5-3077-2012, 2012b.
Lack, D. A. and Langridge, J. M.: On the attribution of black and brown carbon light absorption using the Ångström exponent, Atmos. Chem. Phys., 13, 10535–10543, https://doi.org/10.5194/acp-13-10535-2013, 2013.
Lack, D. A., Cappa, C. D., Covert, D. S., Baynard, T., Massoli, P., Sierau, B., Bates, T. S., Quinn, P. K., Lovejoy, E. R., and Ravishankara, A. R.: Bias in Filter-Based Aerosol Light Absorption Measurements Due to Organic Aerosol Loading: Evidence from Ambient Measurements, Aerosol Sci. Tech., 42, 1033–1041, https://doi.org/10.1080/02786820802389277, 2008.
Lack, D. A., Cappa, C. D., Cross, E. S., Massoli, P., Ahern, A. T., Davidovits, P., and Onasch, T. B.: Absorption Enhancement of Coated Absorbing Aerosols: Validation of the Photo-Acoustic Technique for Measuring the Enhancement, Aerosol Sci. Tech., 43, 1006–1012, https://doi.org/10.1080/02786820903117932, 2009.
Laing, J. R., Jaffe, D. A., and Hee, J. R.: Physical and optical properties of aged biomass burning aerosol from wildfires in Siberia and the Western USA at the Mt. Bachelor Observatory, Atmos. Chem. Phys., 16, 15185–15197, https://doi.org/10.5194/acp-16-15185-2016, 2016.
Lance, S.: Coincidence Errors in a Cloud Droplet Probe (CDP) and a Cloud and Aerosol Spectrometer (CAS), and the Improved Performance of a Modified CDP, J. Atmos. Ocean. Tech., 29, 1532–1541, https://doi.org/10.1175/JTECH-D-11-00208.1, 2012.
Lefer, B. L., Talbot, R. W., Harriss, R. H., Bradshaw, J. D., Sandholm, S. T., Olson, J. O., Sachse, G. W., Collins, J., Shipham, M. A., Blake, D. R., Klemm, K. I., Klemm, O., Gorzelska, K., and Barrick, J.: Enhancement of acidic gases in biomass burning impacted air masses over Canada, J. Geophys. Res., 99, 1721–1737, https://doi.org/10.1029/93JD02091, 1994.
Liu, D., Flynn, M., Gysel, M., Targino, A., Crawford, I., Bower, K., Choularton, T., Jurányi, Z., Steinbacher, M., Hüglin, C., Curtius, J., Kampus, M., Petzold, A., Weingartner, E., Baltensperger, U., and Coe, H.: Single particle characterization of black carbon aerosols at a tropospheric alpine site in Switzerland, Atmos. Chem. Phys., 10, 7389–7407, https://doi.org/10.5194/acp-10-7389-2010, 2010.
Lock, A. P., Brown, A. R., Bush, M. R., Martin, G. M., and Smith, R. N. B.: A New Boundary Layer Mixing Scheme. Part I: Scheme Description and Single-Column Model Tests, Mon. Weather Rev., 128, 3187–3199, https://doi.org/10.1175/1520-0493(2000)128<3187:ANBLMS>2.0.CO;2, 2000.
Magi, B. I. and Hobbs, P. V.: Effects of humidity on aerosols in southern Africa during the biomass burning season, J. Geophys. Res.-Atmos., 108, 8495, https://doi.org/10.1029/2002JD002144, 2003.
Mallet, M., Solmon, F., Nabat, P., Elguindi, N., Waquet, F., Bouniol, D., Sayer, A. M., Meyer, K., Roehrig, R., Michou, M., Zuidema, P., Flamant, C., Redemann, J., and Formenti, P.: Direct and semi-direct radiative forcing of biomass burning aerosols over the Southeast Atlantic (SEA) and its sensitivity to absorbing properties: a regional climate modeling study, Atmos. Chem. Phys. Discuss., https://doi.org/10.5194/acp-2020-317, in review, 2020.
May, A. A., McMeeking, G. R., Lee, T., Taylor, J. W., Craven, J. S., Burling, I., Sullivan, A. P., Akagi, S., Collett Jr., J. L., Flynn, M., Coe, H., Urbanski, S. P., Seinfeld, J. H., Yokelson, R. J., and Kreidenweis, S. M.: Aerosol emissions from prescribed fires in the United States: a synthesis of laboratory and aircraft measurements, J. Geophys. Res.-Atmos., 119, 11826–11849, https://doi.org/10.1002/2014JD021848, 2014.
McComiskey, A., Schwartz, S. E., Schmid, B., Guan, H., Lewis, E. R., Ricchiazzi, P., and Ogren, J. A.: Direct aerosol forcing: Calculation from observables and sensitivities to inputs, J. Geophys. Res.-Atmos., 113, 9202, https://doi.org/10.1029/2007JD009170, 2008.
McMeeking, G. R., Hamburger, T., Liu, D., Flynn, M., Morgan, W. T., Northway, M., Highwood, E. J., Krejci, R., Allan, J. D., Minikin, A., and Coe, H.: Black carbon measurements in the boundary layer over western and northern Europe, Atmos. Chem. Phys., 10, 9393–9414, https://doi.org/10.5194/acp-10-9393-2010, 2010.
Middlebrook, A. M., Bahreini, R., Jimenez, J. L., and Canagaratna, M. R.: Evaluation of composition-dependent collection efficiencies for the aerodyne aerosol mass spectrometer using field data, Aerosol Sci. Tech., 46, 258–271, https://doi.org/10.1080/02786826.2011.620041, 2012.
Moore, K. G., I., Clarke, A. D., Kapustin, V. N., McNaughton, C., Anderson, B. E., Winstead, E. L., Weber, R., Ma, Y., Lee, Y. N., Talbot, R., Dibb, J., Anderson, T., Doherty, S., Covert, D., and Rogers, D.: A comparison of similar aerosol measurements made on the NASA P3-B, DC-8, and NSF C-130 aircraft during TRACE-P and ACE-Asia, J. Geophys. Res., 109, D15S15, https://doi.org/10.1029/2003JD003543, 2004.
Morgan, W. T., Allan, J. D., Bower, K. N., Capes, G., Crosier, J., Williams, P. I., and Coe, H.: Vertical distribution of sub-micron aerosol chemical composition from North-Western Europe and the North-East Atlantic, Atmos. Chem. Phys., 9, 5389–5401, https://doi.org/10.5194/acp-9-5389-2009, 2009.
Morgan, W. T., Allan, J. D., Bower, K. N., Highwood, E. J., Liu, D., McMeeking, G. R., Northway, M. J., Williams, P. I., Krejci, R., and Coe, H.: Airborne measurements of the spatial distribution of aerosol chemical composition across Europe and evolution of the organic fraction, Atmos. Chem. Phys., 10, 4065–4083, https://doi.org/10.5194/acp-10-4065-2010, 2010.
Morgan, W. T., Allan, J. D., Bauguitte, S., Darbyshire, E., Flynn, M. J., Lee, J., Liu, D., Johnson, B., Haywood, J., Longo, K. M., Artaxo, P. E., and Coe, H.: Transformation and ageing of biomass burning carbonaceous aerosol over tropical South America from aircraft in situ measurements during SAMBBA, Atmos. Chem. Phys., 20, 5309–5326, https://doi.org/10.5194/acp-20-5309-2020, 2020.
Moteki, N., Kondo, Y., Oshima, N., Takegawa, N., Koike, M., Kita, K., Matsui, H., and Kajino, M.: Size dependence of wet removal of black carbon aerosols during transport from the boundary layer to the free troposphere, Geophys. Res. Lett., 39, L13802, https://doi.org/10.1029/2012GL052034, 2012.
Ng, N. L., Canagaratna, M. R., Jimenez, J. L., Chhabra, P. S., Seinfeld, J. H., and Worsnop, D. R.: Changes in organic aerosol composition with aging inferred from aerosol mass spectra, Atmos. Chem. Phys., 11, 6465–6474, https://doi.org/10.5194/acp-11-6465-2011, 2011.
Ortega, A. M., Day, D. A., Cubison, M. J., Brune, W. H., Bon, D., de Gouw, J. A., and Jimenez, J. L.: Secondary organic aerosol formation and primary organic aerosol oxidation from biomass-burning smoke in a flow reactor during FLAME-3, Atmos. Chem. Phys., 13, 11551–11571, https://doi.org/10.5194/acp-13-11551-2013, 2013.
O'Shea, S. J., Bauguitte, S. J.-B., Gallagher, M. W., Lowry, D., and Percival, C. J.: Development of a cavity-enhanced absorption spectrometer for airborne measurements of CH4 and CO2, Atmos. Meas. Tech., 6, 1095–1109, https://doi.org/10.5194/amt-6-1095-2013, 2013.
Painemal, D., Kato, S., and Minnis, P.: Boundary layer regulation in the southeast Atlantic cloud microphysics during the biomass burning season as seen by the A-train satellite constellation, J. Geophys. Res.-Atmos., 119, 11288–11302, https://doi.org/10.1002/2014jd022182, 2014.
Peers, F., Bellouin, N., Waquet, F., Ducos, F., Goloub, P., Mollard, J., Myhre, G., Skeie, R. B., Takemura, T., Tanré, D., Thieuleux, F., and Zhang, K.: Comparison of aerosol optical properties above clouds between POLDER and AeroCom models over the South East Atlantic Ocean during the fire season, Geophys. Res. Lett., 43, 3991–4000, https://doi.org/10.1002/2016GL068222, 2016.
Peers, F., Francis, P., Fox, C., Abel, S. J., Szpek, K., Cotterell, M. I., Davies, N. W., Langridge, J. M., Meyer, K. G., Platnick, S. E., and Haywood, J. M.: Observation of absorbing aerosols above clouds over the south-east Atlantic Ocean from the geostationary satellite SEVIRI – Part 1: Method description and sensitivity, Atmos. Chem. Phys., 19, 9595–9611, https://doi.org/10.5194/acp-19-9595-2019, 2019.
Perraud, V., Horne, J. R., Martinez, A. S., Kalinowski, J., Meinardi, S., Dawson, M. L., Wingen, L. M., Dabdub, D., Blake, D. R., Gerber, R. B., and Finlayson-Pitts, B. J.: The future of airborne sulfur-containing particles in the absence of fossil fuel sulfur dioxide emissions, P. Natl. Acad. Sci. USA, 112, 13514–13519, https://doi.org/10.1073/pnas.1510743112, 2015.
Pistone, K., Redemann, J., Doherty, S., Zuidema, P., Burton, S., Cairns, B., Cochrane, S., Ferrare, R., Flynn, C., Freitag, S., Howell, S. G., Kacenelenbogen, M., LeBlanc, S., Liu, X., Schmidt, K. S., Sedlacek III, A. J., Segal-Rozenhaimer, M., Shinozuka, Y., Stamnes, S., van Diedenhoven, B., Van Harten, G., and Xu, F.: Intercomparison of biomass burning aerosol optical properties from in situ and remote-sensing instruments in ORACLES-2016, Atmos. Chem. Phys., 19, 9181–9208, https://doi.org/10.5194/acp-19-9181-2019, 2019.
Pratt, K. A., Murphy, S. M., Subramanian, R., DeMott, P. J., Kok, G. L., Campos, T., Rogers, D. C., Prenni, A. J., Heymsfield, A. J., Seinfeld, J. H., and Prather, K. A.: Flight-based chemical characterization of biomass burning aerosols within two prescribed burn smoke plumes, Atmos. Chem. Phys., 11, 12549–12565, https://doi.org/10.5194/acp-11-12549-2011, 2011.
Rajapakshe, C., Zhang, Z., Yorks, J. E., Yu, H., Tan, Q., Meyer, K., Platnick, S., and Winker, D. M.: Seasonally transported aerosol layers over southeast Atlantic are closer to underlying clouds than previously reported, Geophys. Res. Lett., 44, 5818–5825, https://doi.org/10.1002/2017gl073559, 2017.
Randles, C. A. and Ramaswamy, V.: Direct and semi-direct impacts of absorbing biomass burning aerosol on the climate of southern Africa: a Geophysical Fluid Dynamics Laboratory GCM sensitivity study, Atmos. Chem. Phys., 10, 9819–9831, https://doi.org/10.5194/acp-10-9819-2010, 2010.
Reid, J. S., Koppmann, R., Eck, T. F., and Eleuterio, D. P.: A review of biomass burning emissions part II: intensive physical properties of biomass burning particles, Atmos. Chem. Phys., 5, 799–825, https://doi.org/10.5194/acp-5-799-2005, 2005.
Rosenberg, P. D., Dean, A. R., Williams, P. I., Dorsey, J. R., Minikin, A., Pickering, M. A., and Petzold, A.: Particle sizing calibration with refractive index correction for light scattering optical particle counters and impacts upon PCASP and CDP data collected during the Fennec campaign, Atmos. Meas. Tech., 5, 1147–1163, https://doi.org/10.5194/amt-5-1147-2012, 2012.
Sahu, L. K., Kondo, Y., Moteki, N., Takegawa, N., Zhao, Y., Cubison, M. J., Jimenez, J. L., Vay, S., Diskin, G. S., Wisthaler, A., Mikoviny, T., Huey, L. G., Weinheimer, A. J., and Knapp, D. J.: Emission characteristics of black carbon in anthropogenic and biomass burning plumes over California during ARCTAS-CARB 2008, J. Geophys. Res.-Atmos., 117, D16302, https://doi.org/10.1029/2011JD017401, 2012.
Samset, B. H., Myhre, G., Schulz, M., Balkanski, Y., Bauer, S., Berntsen, T. K., Bian, H., Bellouin, N., Diehl, T., Easter, R. C., Ghan, S. J., Iversen, T., Kinne, S., Kirkevåg, A., Lamarque, J.-F., Lin, G., Liu, X., Penner, J. E., Seland, Ø., Skeie, R. B., Stier, P., Takemura, T., Tsigaridis, K., and Zhang, K.: Black carbon vertical profiles strongly affect its radiative forcing uncertainty, Atmos. Chem. Phys., 13, 2423–2434, https://doi.org/10.5194/acp-13-2423-2013, 2013.
Schneider, J., Weimer, S., Drewnick, F., Borrmann, S., Helas, G., Gwaze, P., Schmid, O., Andreae, M. O., and Kirchner, U.: Mass spectrometric analysis and aerodynamic properties of various types of combustion-related aerosol particles, Int. J. Mass Spectrom., 258, 37–49, https://doi.org/10.1016/j.ijms.2006.07.008, 2006.
Shinozuka, Y., Saide, P. E., Ferrada, G. A., Burton, S. P., Ferrare, R., Doherty, S. J., Gordon, H., Longo, K., Mallet, M., Feng, Y., Wang, Q., Cheng, Y., Dobracki, A., Freitag, S., Howell, S. G., LeBlanc, S., Flynn, C., Segal-Rosenhaimer, M., Pistone, K., Podolske, J. R., Stith, E. J., Bennett, J. R., Carmichael, G. R., da Silva, A., Govindaraju, R., Leung, R., Zhang, Y., Pfister, L., Ryoo, J.-M., Redemann, J., Wood, R., and Zuidema, P.: Modeling the smoky troposphere of the southeast Atlantic: a comparison to ORACLES airborne observations from September of 2016, Atmos. Chem. Phys., 20, 11491–11526, https://doi.org/10.5194/acp-20-11491-2020, 2020.
Taylor, J. W., Allan, J. D., Allen, G., Coe, H., Williams, P. I., Flynn, M. J., Le Breton, M., Muller, J. B. A., Percival, C. J., Oram, D., Forster, G., Lee, J. D., Rickard, A. R., Parrington, M., and Palmer, P. I.: Size-dependent wet removal of black carbon in Canadian biomass burning plumes, Atmos. Chem. Phys., 14, 13755–13771, https://doi.org/10.5194/acp-14-13755-2014, 2014.
Taylor, J. W., Wu, H., Szpek, K., Bower, K., Crawford, I., Flynn, M. J., Williams, P. I., Dorsey, J., Langridge, J. M., Cotterell, M. I., Fox, C., Davies, N. W., Haywood, J. M., and Coe, H.: Absorption closure in highly aged biomass burning smoke, Atmos. Chem. Phys., 20, 11201–11221, https://doi.org/10.5194/acp-20-11201-2020, 2020.
Trembath, J., Bart, M., and Brooke, J.: FAAM Technical Note: Efficiencies of modified Rosemount housings for sampling aerosol on a fast atmospheric research aircraft, Facility for Airborne Atmospheric Measurements, FAAM, Cranfield, UK, available at: https://old.faam.ac.uk/index.php/faam-documents/science-instruments/ (last access: 20 May 2020), 2012.
Vakkari, V., Beukes, J. P., Dal Maso, M., Aurela, M., Josipovic, M., and van Zyl, P. G.: Major secondary aerosol formation in southern African open biomass burning plumes, Nat. Geosci., 11, 580–583, https://doi.org/10.1038/s41561-018-0170-0, 2018.
van der Werf, G. R., Randerson, J. T., Giglio, L., Collatz, G. J., Mu, M., Kasibhatla, P. S., Morton, D. C., DeFries, R. S., Jin, Y., and van Leeuwen, T. T.: Global fire emissions and the contribution of deforestation, savanna, forest, agricultural, and peat fires (1997–2009), Atmos. Chem. Phys., 10, 11707–11735, https://doi.org/10.5194/acp-10-11707-2010, 2010.
Voulgarakis, A., Marlier, M. E., Faluvegi, G., Shindell, D. T., Tsigaridis, K., and Mangeon, S.: Interannual variability of tropospheric trace gases and aerosols: The role of biomass burning emissions, J. Geophys. Res.-Atmos., 120, 7157–7173, https://doi.org/10.1002/2014jd022926, 2015.
Yokelson, R. J., Crounse, J. D., DeCarlo, P. F., Karl, T., Urbanski, S., Atlas, E., Campos, T., Shinozuka, Y., Kapustin, V., Clarke, A. D., Weinheimer, A., Knapp, D. J., Montzka, D. D., Holloway, J., Weibring, P., Flocke, F., Zheng, W., Toohey, D., Wennberg, P. O., Wiedinmyer, C., Mauldin, L., Fried, A., Richter, D., Walega, J., Jimenez, J. L., Adachi, K., Buseck, P. R., Hall, S. R., and Shetter, R.: Emissions from biomass burning in the Yucatan, Atmos. Chem. Phys., 9, 5785–5812, https://doi.org/10.5194/acp-9-5785-2009, 2009.
Yokelson, R. J., Andreae, M. O., and Akagi, S. K.: Pitfalls with the use of enhancement ratios or normalized excess mixing ratios measured in plumes to characterize pollution sources and aging, Atmos. Meas. Tech., 6, 2155–2158, https://doi.org/10.5194/amt-6-2155-2013, 2013.
Zhang, J. and Zuidema, P.: The diurnal cycle of the smoky marine boundary layer observed during August in the remote southeast Atlantic, Atmos. Chem. Phys., 19, 14493–14516, https://doi.org/10.5194/acp-19-14493-2019, 2019.
Zhang, Q., Jimenez, J. L., Worsnop, D. R., and Canagaratna, M.: A case study of urban particle acidity and its influence on secondary organic aerosol, Environ. Sci. Technol., 41, 3213–3219, https://doi.org/10.1021/es061812j, 2007.
Zhou, J.: Hygroscopic Properties of Atmospheric Aerosol Particles in Various Environments, Doctoral dissertation, Lund University, Lund, Sweden, ISBN 91-7874-120-3, 14–20, 2001.
Zieger, P., Fierz-Schmidhauser, R., Weingartner, E., and Baltensperger, U.: Effects of relative humidity on aerosol light scattering: results from different European sites, Atmos. Chem. Phys., 13, 10609–10631, https://doi.org/10.5194/acp-13-10609-2013, 2013.
Zuidema, P., Redemann, J., Haywood, J., Wood, R., Piketh, S., Hipondoka, M., and Formenti, P.: Smoke and Clouds above the Southeast Atlantic: Upcoming Field Campaigns Probe Absorbing Aerosol's Impact on Climate, B. Am. Meteorol. Soc., 97, 1131–1135, https://doi.org/10.1175/BAMS-D-15-00082.1, 2016.
Zuidema, P., Sedlacek III, A. J., Flynn, C., Springston, S., Delgadillo, R., Zhang, J., Aiken, A. C., Koontz, A., and Muradyan, P.: The Ascension Island Boundary Layer in the Remote Southeast Atlantic is Often Smoky, Geophys. Res. Lett., 45, 4456–4465, https://doi.org/10.1002/2017GL076926, 2018.