the Creative Commons Attribution 4.0 License.
the Creative Commons Attribution 4.0 License.
 | 03 Feb 2020
The impact of biomass burning and aqueous-phase processing on air quality: a multi-year source apportionment study in the Po Valley, Italy
Stefania Gilardoni
Matteo Rinaldi
Stefano Decesari
Nicola Zanca
Silvia Sandrini
Lara Giulianelli
Dimitri Bacco
Silvia Ferrari
Vanes Poluzzi
Fabiana Scotto
Arianna Trentini
Laurent Poulain
Hartmut Herrmann
Alfred Wiedensohler
Francesco Canonaco
André S. H. Prévôt
Paola Massoli
Claudio Carbone
Maria Cristina Facchini
Sandro Fuzzi
The Po Valley (Italy) is a well-known air quality hotspot characterized by particulate matter (PM) levels well above the limit set by the European Air Quality Directive and by the World Health Organization, especially during the colder season. In the framework of Emilia-Romagna regional project “Supersito”, the southern Po Valley submicron aerosol chemical composition was characterized by means of high-resolution aerosol mass spectroscopy (HR-AMS) with the specific aim of organic aerosol (OA) characterization and source apportionment. Eight intensive observation periods (IOPs) were carried out over 4 years (from 2011 to 2014) at two different sites (Bologna, BO, urban background, and San Pietro Capofiume, SPC, rural background), to characterize the spatial variability and seasonality of the OA sources, with a special focus on the cold season.
On the multi-year basis of the study, the AMS observations show that OA accounts for averages of 45±8 % (ranging from 33 % to 58 %) and 46±7 % (ranging from 36 % to 50 %) of the total non-refractory submicron particle mass (PM1-NR) at the urban and rural sites, respectively. Primary organic aerosol (POA) comprises biomass burning (23±13 % of OA) and fossil fuel (12±7 %) contributions with a marked seasonality in concentration. As expected, the biomass burning contribution to POA is more significant at the rural site (urban / rural concentration ratio of 0.67), but it is also an important source of POA at the urban site during the cold season, with contributions ranging from 14 % to 38 % of the total OA mass.
Secondary organic aerosol (SOA) contributes to OA mass to a much larger extent than POA at both sites throughout the year (69±16 % and 83±16 % at the urban and rural sites, respectively), with important implications for public health. Within the secondary fraction of OA, the measurements highlight the importance of biomass burning aging products during the cold season, even at the urban background site. This biomass burning SOA fraction represents 14 %–44 % of the total OA mass in the cold season, indicating that in this region a major contribution of combustion sources to PM mass is mediated by environmental conditions and atmospheric reactivity.
Among the environmental factors controlling the formation of SOA in the Po Valley, the availability of liquid water in the aerosol was shown to play a key role in the cold season. We estimate that the organic fraction originating from aqueous reactions of biomass burning products (“bb-aqSOA”) represents 21 % (14 %–28 %) and 25 % (14 %–35 %) of the total OA mass and 44 % (32 %–56 %) and 61 % (21 %–100 %) of the SOA mass at the urban and rural sites, respectively.
- Article
(3716 KB) - Full-text XML
-
Supplement
(16737 KB) - BibTeX
- EndNote


Ambient air pollution represents the highest environmental risks for human health, leading to about 3 million premature deaths every year (WHO, 2016) due to the exacerbation of respiratory and cardio-vascular diseases, especially in young children and elderly people. In Europe atmospheric pollution is responsible for more than 400 000 premature deaths a year (EEA, 2016), with the largest share due to fine particulate matter (PM2.5 and PM1) exposure. Organic aerosol (OA) accounts for 20 % to 90 % of fine particle mass worldwide (Zhang et al., 2007) and for up to 50 % (20 %–90 %) of fine particle mass in Europe (Putaud et al., 2010). The OA global budget and atmospheric processing are still characterized by large uncertainties (Hallquist et al., 2009). Better knowledge of OA is essential to support effective air quality control and remediation measures.
OA is directly emitted by various sources, including traffic, other combustion sources and biogenic emissions, and can also be produced via secondary formation pathways in the atmosphere (Hallquist et al., 2009). In particular, our understanding of the formation mechanisms and evolution processes of secondary OA (SOA) is still largely uncertain.
Direct quantification of SOA in the ambient aerosol is challenging, but many recent studies have established that oxygenated OA (OOA) determined by multivariate statistical analysis (e.g., positive matrix factorization, PMF) of OA fragmentation mass spectra is a good proxy of SOA (Zhang et al., 2007; Ulbrich et al., 2009). Therefore, OOA is widely used to study the abundance and formation mechanisms of SOA. Although several types of these OOAs were isolated in ambient aerosol everywhere (often representing more than half of the total OA, Zhang et al., 2007; Ng et al., 2010; Crippa et al., 2014), their link to a specific source or mechanism remains largely undetermined. This is a consequence of their complexity in terms of chemical and physical properties and the difficulty in reproducing the real conditions in which SOAs are formed/transformed. As a result, traditional models often show substantial discrepancies in simulating SOA mass concentrations (Kleinman et al., 2008; Matsui et al., 2009) and oxidation states (Chen et al., 2011), especially in wintertime.
The Po Valley, located in northern Italy, is amongst the most polluted areas in Europe (EEA, 2016). It is surrounded by the Alps to the north and northwest and by the Apennines to the south. The occurrence of frequent and prolonged low-wind periods and atmospheric stability conditions favor the accumulation of particulate and gaseous pollutants locally emitted, especially during the cold months. The distinctive features of the Po Valley make it an interesting “laboratory” to study the development of POA and SOA concentrations in the ambient atmosphere.
The Supersito project (https://www.arpae.it/supersito, last access: 14 December 2019) is a comprehensive study of atmospheric particulate matter pollution in the Emilia-Romagna Region, encompassing the southern part of the Po Valley from the Po River to the Apennines. Overall, the project deals with chemical, physical and toxicological parameters of the aerosol and integrates them with epidemiological and medical assessments through interpretative models. Results about aerosol chemical characterization using offline techniques were presented by Ricciardelli et al. (2017).
Here we describe the results of HR-AMS PM1 measurements carried out during eight intensive measurement campaigns with a focus on OA source apportionment. Previous projects have investigated the properties of fine aerosols at urban, rural and regional sites of the Po Valley, including their chemical features (Carbone et al., 2014; Putaud et al., 2002, 2010; Saarikoski et al., 2012) and main sources (Belis et al., 2013; Gilardoni et al., 2011; Larsen et al., 2012; Perrone et al., 2012). Further studies based on Aerosol Mass Spectrometer (AMS) measurements have been conducted in the same area during specific field experiments with the aim of characterizing specific phenomena and seasonal features (fog events, cooking aerosols, biomass burning emissions, etc.) (Gilardoni et al., 2014; Decesari et al., 2014; Paglione et al., 2014; Dall'Osto et al., 2015). Nevertheless, systematic AMS observations in the valley are available from very few studies. Bressi et al. (2016), using a 1-year long dataset of measurements by an Aerosol Chemical Speciation Monitor (ACSM), described the chemical composition and the organic PM1 sources of the northwestern edge of the Po Valley at the rural background site of Ispra, 60 km northwest of Milan.
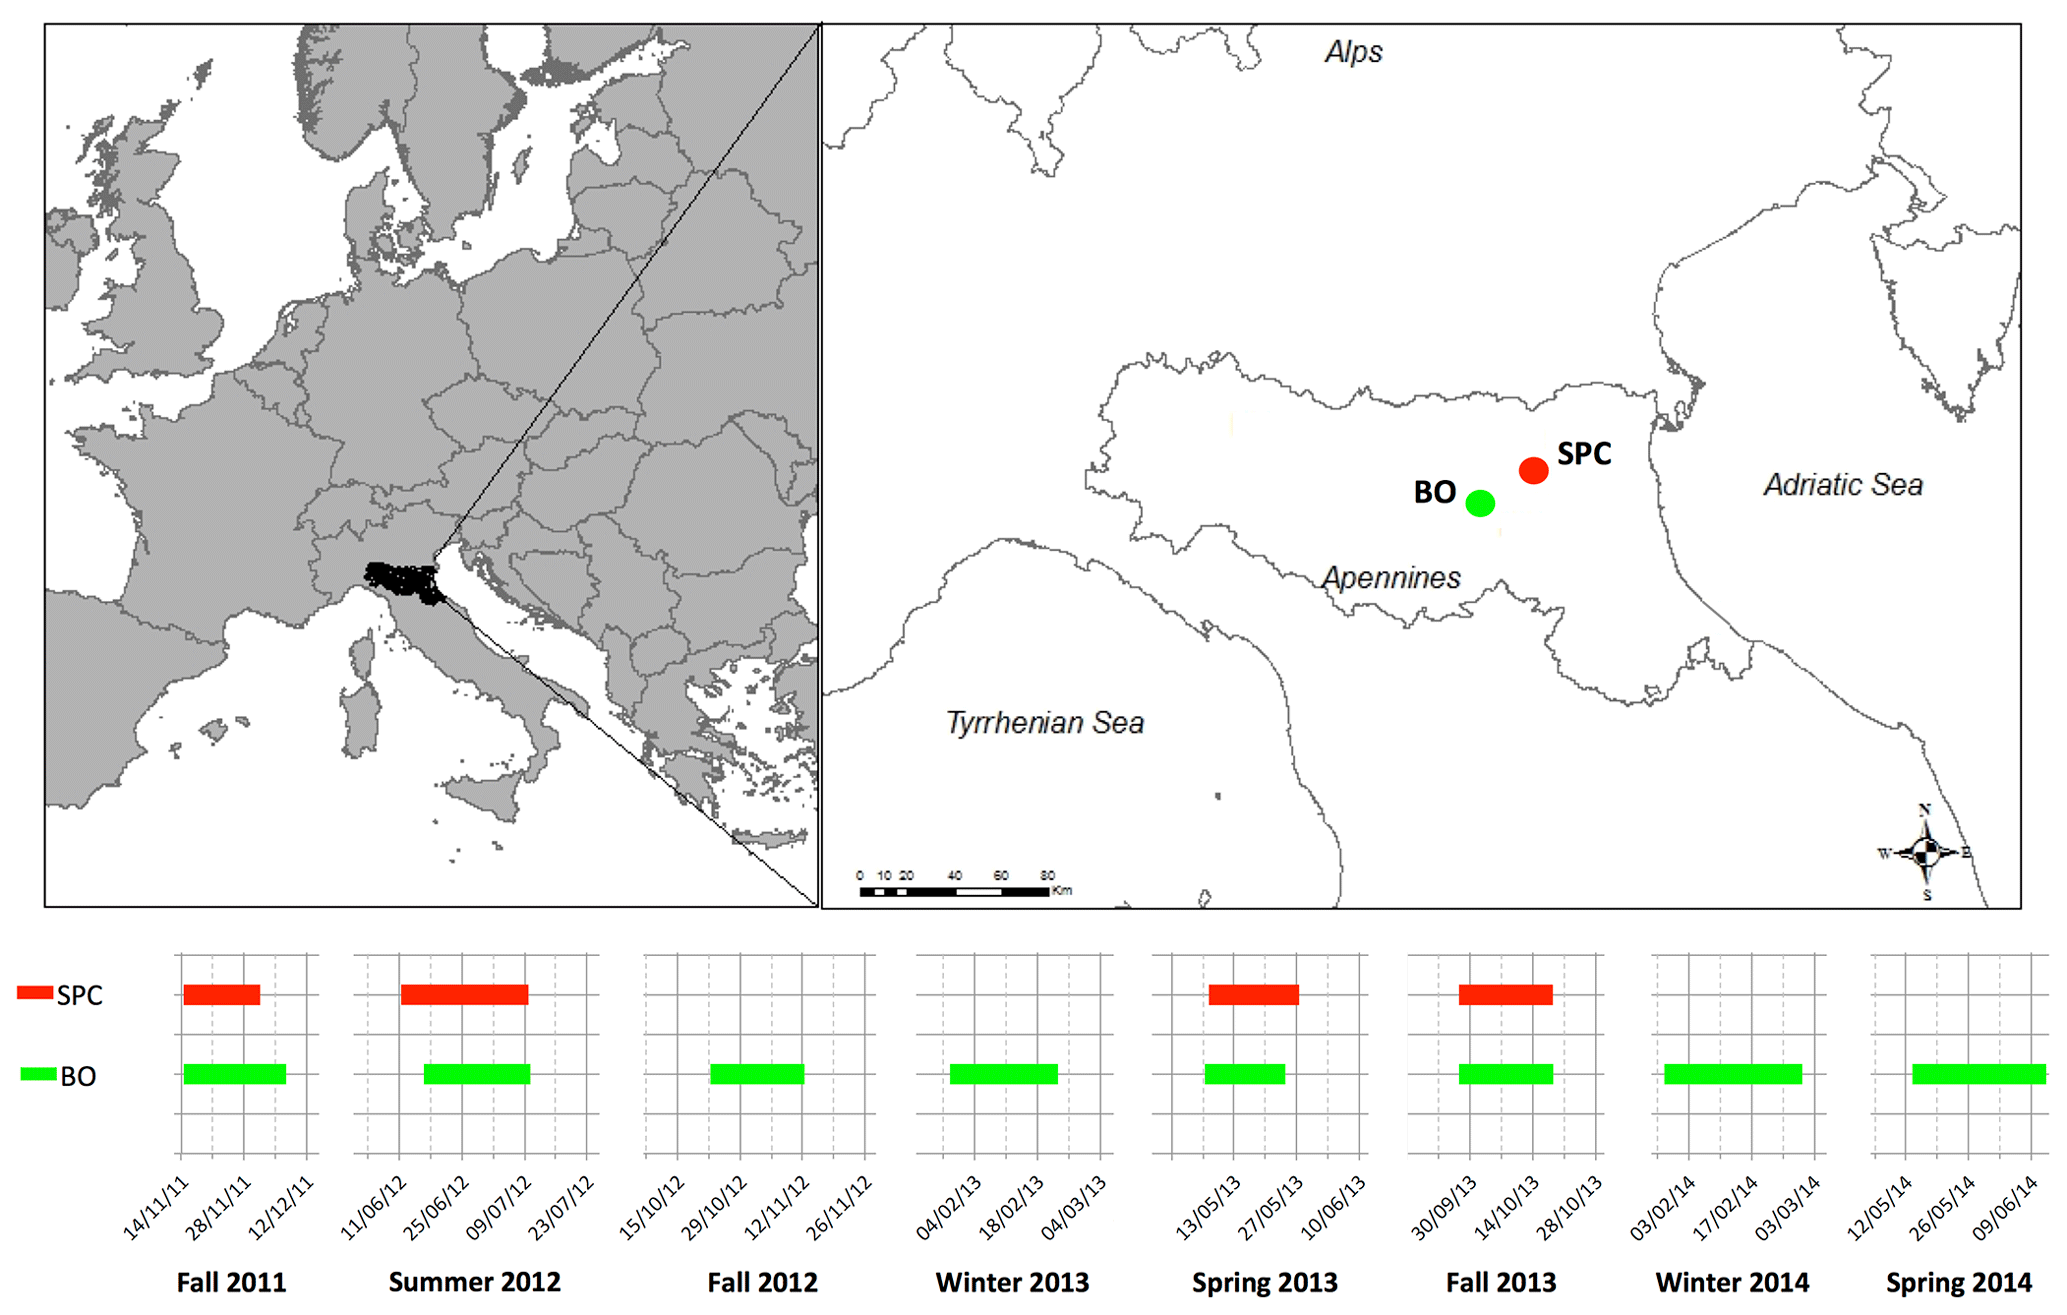
Figure 1Supersito field campaigns: map of the sites and measurement periods considered in this study.
In this study, we analyze a multi-year dataset of high-resolution measurements carried out at two different sites (Bologna and San Pietro Capofiume), exploring for the first time the spatial–temporal variability of OA sources, chemical features and formation/transformation processes in the southern part of the Po Valley. A special focus is dedicated to the interpretation of the main sources and formation/transformation processes of the SOA in the region active during the cold period.
2.1 Measurement field campaigns
Eight intensive observation periods (IOPs) were carried out over 4 years (from November 2011 to June 2014) at two different sites of the southern part of the Po Valley (Bologna, BO, urban background, and San Pietro Capofiume, SPC, rural background). Figure 1 shows a map of the measurement sites and a timeline of the field campaigns carried out during the Supersito project. Bologna is located at the foot of the Apennines and is an important population basin for the region (400 000 inhabitants), impacted by significant industrial and agricultural activities and crossed by several major highways. The BO measurement site is located in the National Research Council (CNR) Research Area (44∘31′29′′ N, 11∘20′27′′ E). The rural background station of San Pietro Capofiume (SPC) is located in a sparsely populated flat countryside (44∘39′15′′ N, 11∘37′29′′ E) surrounded by kilometers of flat lands in the southeastern part of the Po Valley, 30 km northeast of Bologna, and is representative of the regional background. This site has been used for many atmospheric characterization studies and research projects (Saarikoski et al., 2012; Paglione et al., 2014; Decesari et al., 2014; Sandrini et al., 2016).
During the 4-year project, the intensive campaigns were programmed to account for the marked seasonality in both sources and weather conditions of this region. Nevertheless, most of the Supersito campaigns took place in the cold season (three campaigns in fall and two in winter, out of eight in total), when the highest PM levels are found. Similarly to other continental sites, during fall–winter the reduced height of the planetary boundary layer (PBL) and calm wind conditions favor the accumulation of pollutants and are responsible for the rise in the PM concentration (Perrone et al., 2012; Stanier et al., 2012; Bressi et al., 2013). Another feature of the cold months in this area is the high relative humidity, which leads to fogs and hazes (i.e., conditions of high aerosol liquid water content, ALWC). The consequence of these meteorological conditions for PM concentrations is 2-fold: it promotes both wet removal (Gilardoni et al., 2014; Giulianelli et al., 2014; Montero-Martìnez et al., 2014) and aqueous-phase processing with SOA formation (Gilardoni et al., 2016).
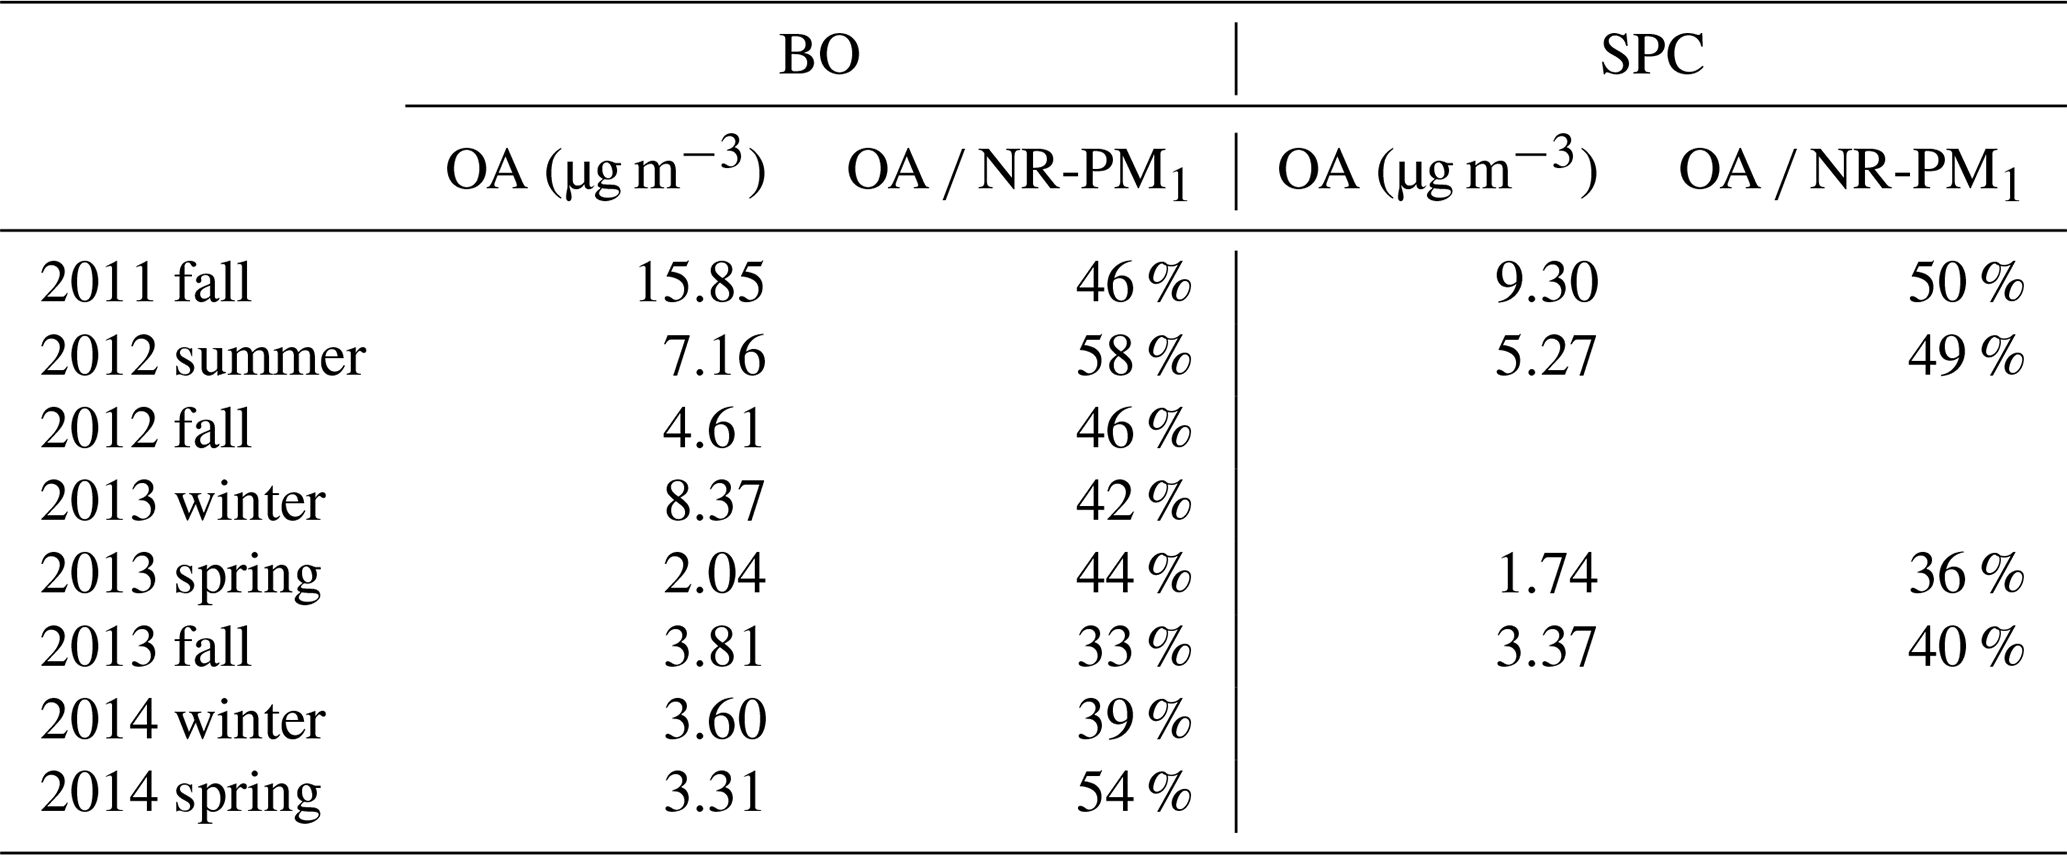
Table 1Average organic aerosol (OA) concentrations and their relative contributions to the NR-PM1 mass measured by the HR-ToF-AMS within each campaign.
2.2 Aerosol mass spectrometer measurements and apportionment of organic fraction
During all of the Supersito campaigns, the mass loading and the size-resolved chemical composition of submicron aerosol particles were obtained online by the Aerodyne High-Resolution Time-of-Flight Aerosol Mass Spectrometer (HR-ToF-AMS, Aerodyne Research, Canagaratna et al., 2007). The HR-ToF-AMS provides measurements of the non-refractory sulfate, nitrate, ammonium, chloride, and organic mass of the submicron particles (NR-PM1). The average concentrations of NR-PM1 chemical components and their relative contributions as measured by the AMS in each campaign are reported in the Supplement (Table S1 and Fig. S1). For some of the Supersito campaigns, specific studies have already been published. We refer to Gilardoni et al. (2014, 2016) for the SPC fall 2011 and BO winter 2013 campaigns, respectively, and to Sullivan et al. (2016) for the SPC summer 2012 campaign. In this paper we focus on the organic aerosol (OA) component that represents the most abundant fraction of submicron particle mass for most of the campaigns, ranging from 33 % to 58 % of NR-PM1 (concentration range: 1.8–18.4 µg m−3), consistent with the value found by Jimenez et al. (2009), Ng et al. (2010) and Crippa et al. (2014). Table 1 summarizes the average OA concentration for each site and season and the relative organic contribution to the NR-PM1 as measured by the HR-ToF-AMS.
The working principle of the HR-ToF-AMS is described in detail in Canagaratna et al. (2007), Jayne et al. (2000), and Jimenez et al. (2003). Briefly, during all the campaigns, the HR-ToF-AMS operated by alternating between “V” and “W” ion path modes every 5 min. The concentrations reported here correspond to the data collected in V mode. The resolving power (DeCarlo et al., 2006) of the V-ion mode was about 2000–2200 during all the campaigns.
Ionization efficiency (IE) calibrations were performed before and after every campaign and approximately once a week during the campaigns. Data from IE calibrations were also used to quantify the interference of ammonium nitrate in the signal for the different instruments and campaigns following the criteria suggested by Pieber et al. (2016). The relationship “b” (the slope of the orthogonal distance linear fit of the and signals expressed in nitrate equivalent mass, i.e., RIE = 1) in our estimations resulted in spanning between +0.2 % and +1.4 % ( % on average), well below the limit considered acceptable even for periods of high inorganic mass fractions set to +3.4 % (Pieber et al., 2016). Filter blank acquisitions during the campaign were performed once a day to evaluate the background and correct for the gas-phase contribution. All data were analyzed using the standard SQUIRREL v1.51 and PIKA v1.10 ToF-AMS analysis software (Donna Sueper, Aerodyne Research Inc., CIRES, University of Colorado, Boulder, available at http://cires.colorado.edu/jimenez-group/ToFAMSResources/ToFSoftware/index.html, last access: 14 December 2019) within Igor Pro 6.2.1 (WaveMetrics, Lake Oswego, OR). The HR-ToF-AMS collection efficiency (CE) was calculated based on aerosol composition, according to Middlebrook et al. (2012), and evaluated against parallel offline measurements (see Sect. 2.3 and Table S2 in the Supplement). The aerosol was dried to about 35 %–40 % by means of a Nafion drier before sampling with the HR-ToF-AMS.
The organic fraction (OA) measured by HR-ToF-AMS was apportioned using the PMF approach (Paatero and Tapper, 1994; Lanz et al., 2007; Ulbrich et al., 2009; Zhang et al., 2011) by applying the Multilinear Engine 2 solver (ME-2, Paatero, 2000) controlled within the Source Finder software (SoFi v4.8, Canonaco et al., 2013; Crippa et al., 2014).
Similarly to the classical PMF solvers (e.g., PMF2, PMF3, Paatero and Tapper, 1994), the ME-2 solver (Paatero, 1999) executes the positive matrix factorization algorithm. However, the user has the advantage of supporting the analysis by introducing a priori information such as known factor profiles (FPs), for example within the so-called a-value approach. The a-value is a scalar (defined between 0 and 1) that determines how much the resolved factor profiles are allowed to vary from the reference ones (Canonaco et al., 2013). For instance, applying an a-value of 0.05 lets ±5 % variability into our FP solution with respect to the reference FP during the PMF iteration.
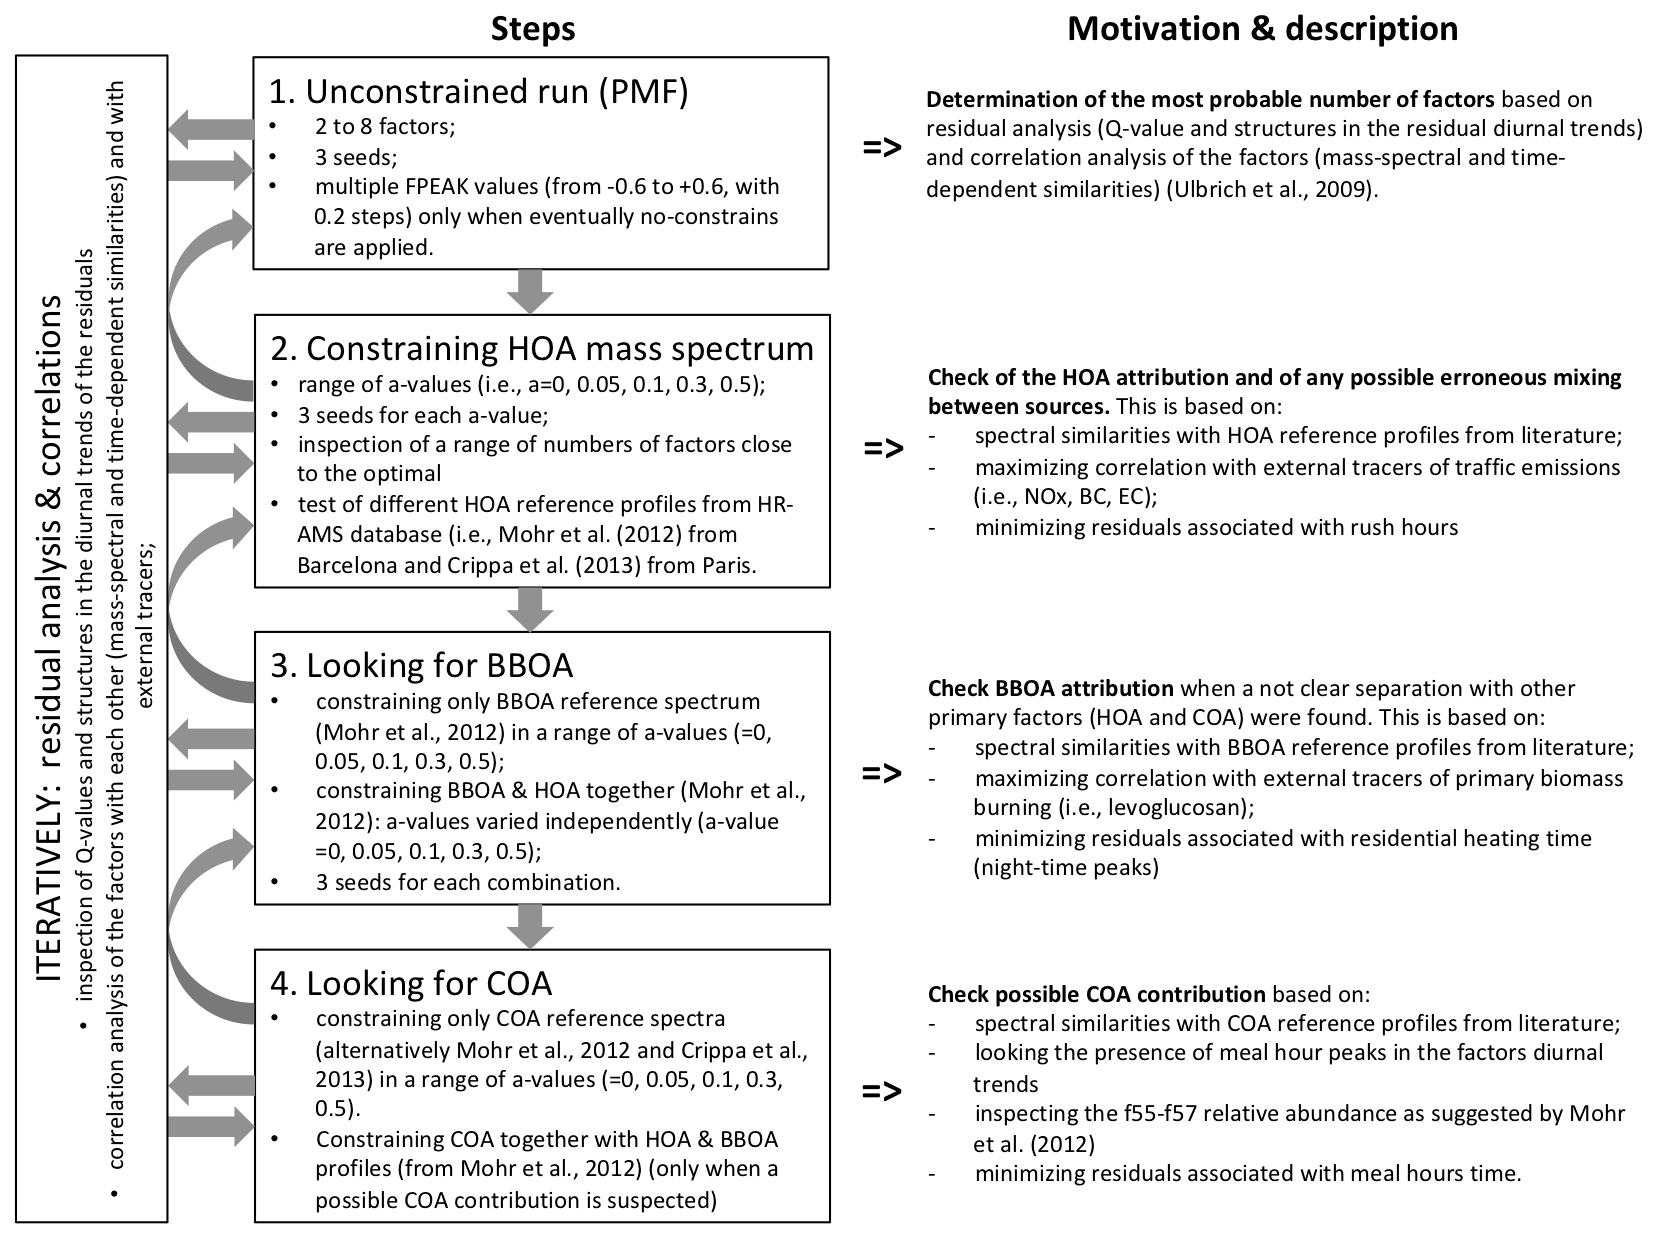
The standardized source apportionment strategy introduced in Crippa et al. (2014) was applied to the 12 individual HR-ToF-AMS datasets (8 from BO and 4 from SPC). The PMF analysis followed the iterative, step-by-step protocol shown in Fig. 2. A comprehensive description of the PMF protocol and of the criteria for identifying the best solutions followed in each campaign, together with specific metrics for every single factor analysis (number of iterations, number of factors chosen, Q, and residual diagnostic plots, constrained factor profiles and a-values if applied, etc.), are reported in Supplement Sect. S2.
The interpretation of the retrieved source apportionment factors as organic aerosol sources is based on the comparison of their mass spectral profiles with reference ones (Tables S5, S6 and S7), on the correlations with external data (see Table S8) and on the investigation of their diurnal trends (Ulbrich et al., 2015).
2.3 Additional measurements and analytical techniques
Additional measurements from the routine daily program of the Supersito project are used in this study as ancillary data. PM2.5 daily samples were collected by a low-volume sampler (Skypost PM, TCR TECORA Instruments, operating at the standard flow rate of 38.3 L min−1) on quartz-fiber filters (PALL Tissu Quartz 2500 QAO-UP 2500 filters, 47 mm) during all of the project periods for the analysis of the carbonaceous fractions (total carbon, TC; organic carbon, OC; and elemental carbon, EC) by thermo-optical transmittance (Sunset, Laboratory Inc., Oregon, USA, using the EUSAAR2 thermal protocol, Cavalli et al., 2010; Ricciardelli et al., 2017) and of polar organic compounds (anhydrosugars and acids) by GC/MS analysis (Pietrogrande et al., 2014). Due to the elevated PM loading during the first experiment in fall 2011, the discrimination between OC and EC was not possible for the filters collected, and only TC data are available for that specific campaign.
Black carbon (BC) was calculated from aerosol absorption coefficient measurements (when available) by single-wavelength (573 nm) and multi-wavelength (467, 530, and 660 nm) Particle Soot Absorption Photometers, PSAPs (Bond et al., 1999), as previously described (Gilardoni et al., 2011, 2016; Costabile et al., 2017).
Size-segregated aerosol particles were also sampled by a Berner impactor (flow rate 80 L min−1) (Matta et al., 2003). The Berner impactor collects particles in five stages, corresponding to the following particle aerodynamic diameter cutoffs: 0.14, 0.42, 1.2, 3.5, and 10 µm. Sampling was performed continuously during the intensive campaigns. Each day we collected two samples: a daytime sample (from ≈ 09:00 to 17:00 LT during fall–winter and from ≈ 09:00 to 21:00 LT during spring–summer) and a night-time one (from 17:00 to 09:00 LT during fall–winter and from 21:00 to 09:00 during spring–summer). Particles collected were extracted in water and analyzed by means of evolved gas analysis and ion chromatography for quantification of the water-soluble total carbon (TC) and the inorganic ions. Elemental and chromatographic analyses of the filter samples are used to validate the AMS data for the main aerosol components (Org, , , and Cl−) and PMF factors, as reported in the Supplement (Tables S2 and S8).
Submicron particles were also sampled on prewashed and prebaked quartz-fiber filters (PALL, 9 cm size) using HiVol samplers (a dichotomous sampler Universal Air Sampler, model 310, MSP Corporation, at a constant nominal flow of 300 L min−1 or, alternatively, a TECORA eco-highvol equipped with a Digitel PM1 sampling inlet, nominal flow 500 L min−1) located at ground level. Typically, two filters were collected every day in parallel with the Berner impactor sampling time. The HiVol quartz-fiber samples were analyzed to identify organic molecular tracers (e.g., levoglucosan, hydroxymethansulfonate (HMSA) and low-molecular weight amines) using proton nuclear magnetic resonance (1H-NMR) spectroscopy according to Decesari et al. (2006). The concentrations of the organic tracers identified by NMR are correlated with the PMF factors identified by the AMS, trying to detail their chemical features and infer their sources and atmospheric processing (especially for the OOAs).
Meteorological data are provided by the Hydro-Meteo-Climate Service of the Regional Environmental Protection Agency of Emilia Romagna (ARPAE). In addition, aerosol liquid water content that is associated with the aerosol inorganic species (K+, , , , Na+, , , Cl−) was predicted by the ISORROPIA-II model used in reverse mode (Fountoukis and Nenes, 2007).

Figure 3Mass spectral variability for the main retrieved OA sources. Mean values are represented with circles and the ± standard deviation with error bars. COA from the BO spring 2014 campaign is represented in red color over-imposed on the COA reference spectrum from Crippa et al. (2013a).
3.1 Organic aerosol source apportionment
The source apportionment procedure allowed the identification of various components tracing the contributions of primary and secondary organic aerosol sources: hydrocarbon-like organic aerosol (HOA) resulting from the combustion of fossil fuels (e.g., vehicular traffic); BBOA (biomass burning organic aerosol) resulting from biomass combustion, mainly associated with wood combustion for domestic heating; and COA (cooking organic aerosol) associated with specific food cooking practices. The latter is found just as a minor component of OM and only in one campaign at BO (spring 2014). The rest of the mass of sub-micrometer organic aerosol consists of OOAs, representative of secondary formation and/or aging processes in the atmosphere. Factor analysis extracted different types of OOAs with distinct time trends and/or spectral features. In this section, we will consider the OOA factors as a whole, while in Sect. 4 we will discuss a source attribution for the individual factors.
Figure 3 shows the average mass spectra of all the identified HOA (n=12), BBOA (n=10) and OOA (n=12) (reduced from high resolution, HR, to unit mass resolution, UMR, for better readability) together with their standard deviation. The comparison between our profiles from the Po Valley and reference profiles is reported in Sect. S2.1 in terms of the theta angle (θ) between the spectra (Kostenidou et al., 2009). The theta angle is a metric for the similarity between two spectra ( good; partial; bad similarity).
The HOA profile is characterized by peaks corresponding to aliphatic hydrocarbons including m∕z 27, 41, 43, 55, 57, 69, 71, etc. (Canagaratna et al., 2004). The median HOA profile in our study shows a good overlap (mostly ) with almost all the reference spectra compared, as expected for this type of source, which is quite reproducible in terms of AMS spectral characteristics (Crippa et al., 2014). Among the HOA profiles found for the individual campaigns, only one (SPC fall 2011) shows low correlations with the others from this study and with the references. Such a discrepancy must be due to the peculiar conditions during the campaign, as the numerous fog events strongly impacted the OA time trends and, in turn, also the ability of PMF to resolve source profiles. The aerosol observations during the SPC fall 2011 campaign have already been thoroughly described by Gilardoni et al. (2014) and will be summarized later in the discussion.
Unlike the HOA, the BBOA profiles are more variable, in agreement with earlier findings (Grieshop et al., 2009; Heringa et al., 2011) showing that the biomass burning aerosol mass spectrum is strongly affected by burning conditions and types of wood/biomass. Nonetheless, the deconvolved BBOA profiles show good similarities to many reference spectra from previous studies, with their characteristic peaks at m∕z 29 (CHO+), 60 () and 73 (), which are associated with fragmentation of anhydrosugars such as levoglucosan (Alfarra et al., 2007; Aiken et al., 2009).
The COA factor was identified without any constraint only during the BO spring 2014 campaign. Its spectral profile exhibits good similarities to the correspondent reference spectra (Mohr et al., 2012; Crippa et al., 2013a). The presence of this COA factor reduced sensibly the model residuals in the central part of the day, and it is therefore considered in the final solution.
The more oxidized factors (OOAs) differ from each other for the fractional abundance of m∕z 43 and 44 and for the intensity of other fragments such as 29, 60 and 73. The spectral characteristics of the specific OOA factors are discussed in Sect. 4.
The correlation parameters between the time trends of AMS organic factors and of atmospheric tracer compounds are shown in Table S8. The time series of HOA correlates with that of elemental carbon (EC) or black carbon (BC) and with that of NOx. The correlation with NOx points to major sources of HOA from traffic. The trend of BBOA concentrations instead correlates with the trend for levoglucosan (measured by offline techniques: GC/MS or 1H-NMR) and with the organic fragments at m∕z 60 and 73, which have been previously shown to be good markers for biomass burning (Alfarra et al., 2007; De Carlo et al., 2008; Aiken et al., 2009). The concentration ratios between POA factors and tracer compounds (HOA ∕ BC, HOA ∕ NOx, BBOA ∕ levoglucosan, etc.) are shown in Table S9 and compared with literature ranges. The overall good agreement between these source-specific ratios and the literature ranges confirms our apportionment of POA components. The time trends of the OOA concentrations are contrasted with those of secondary inorganic species (i.e., , and ) and with the organic fragments at m∕z 43 (Org_43 = C2H3O+) and 44 (Org_44 = ) generally exhibiting good correlations.
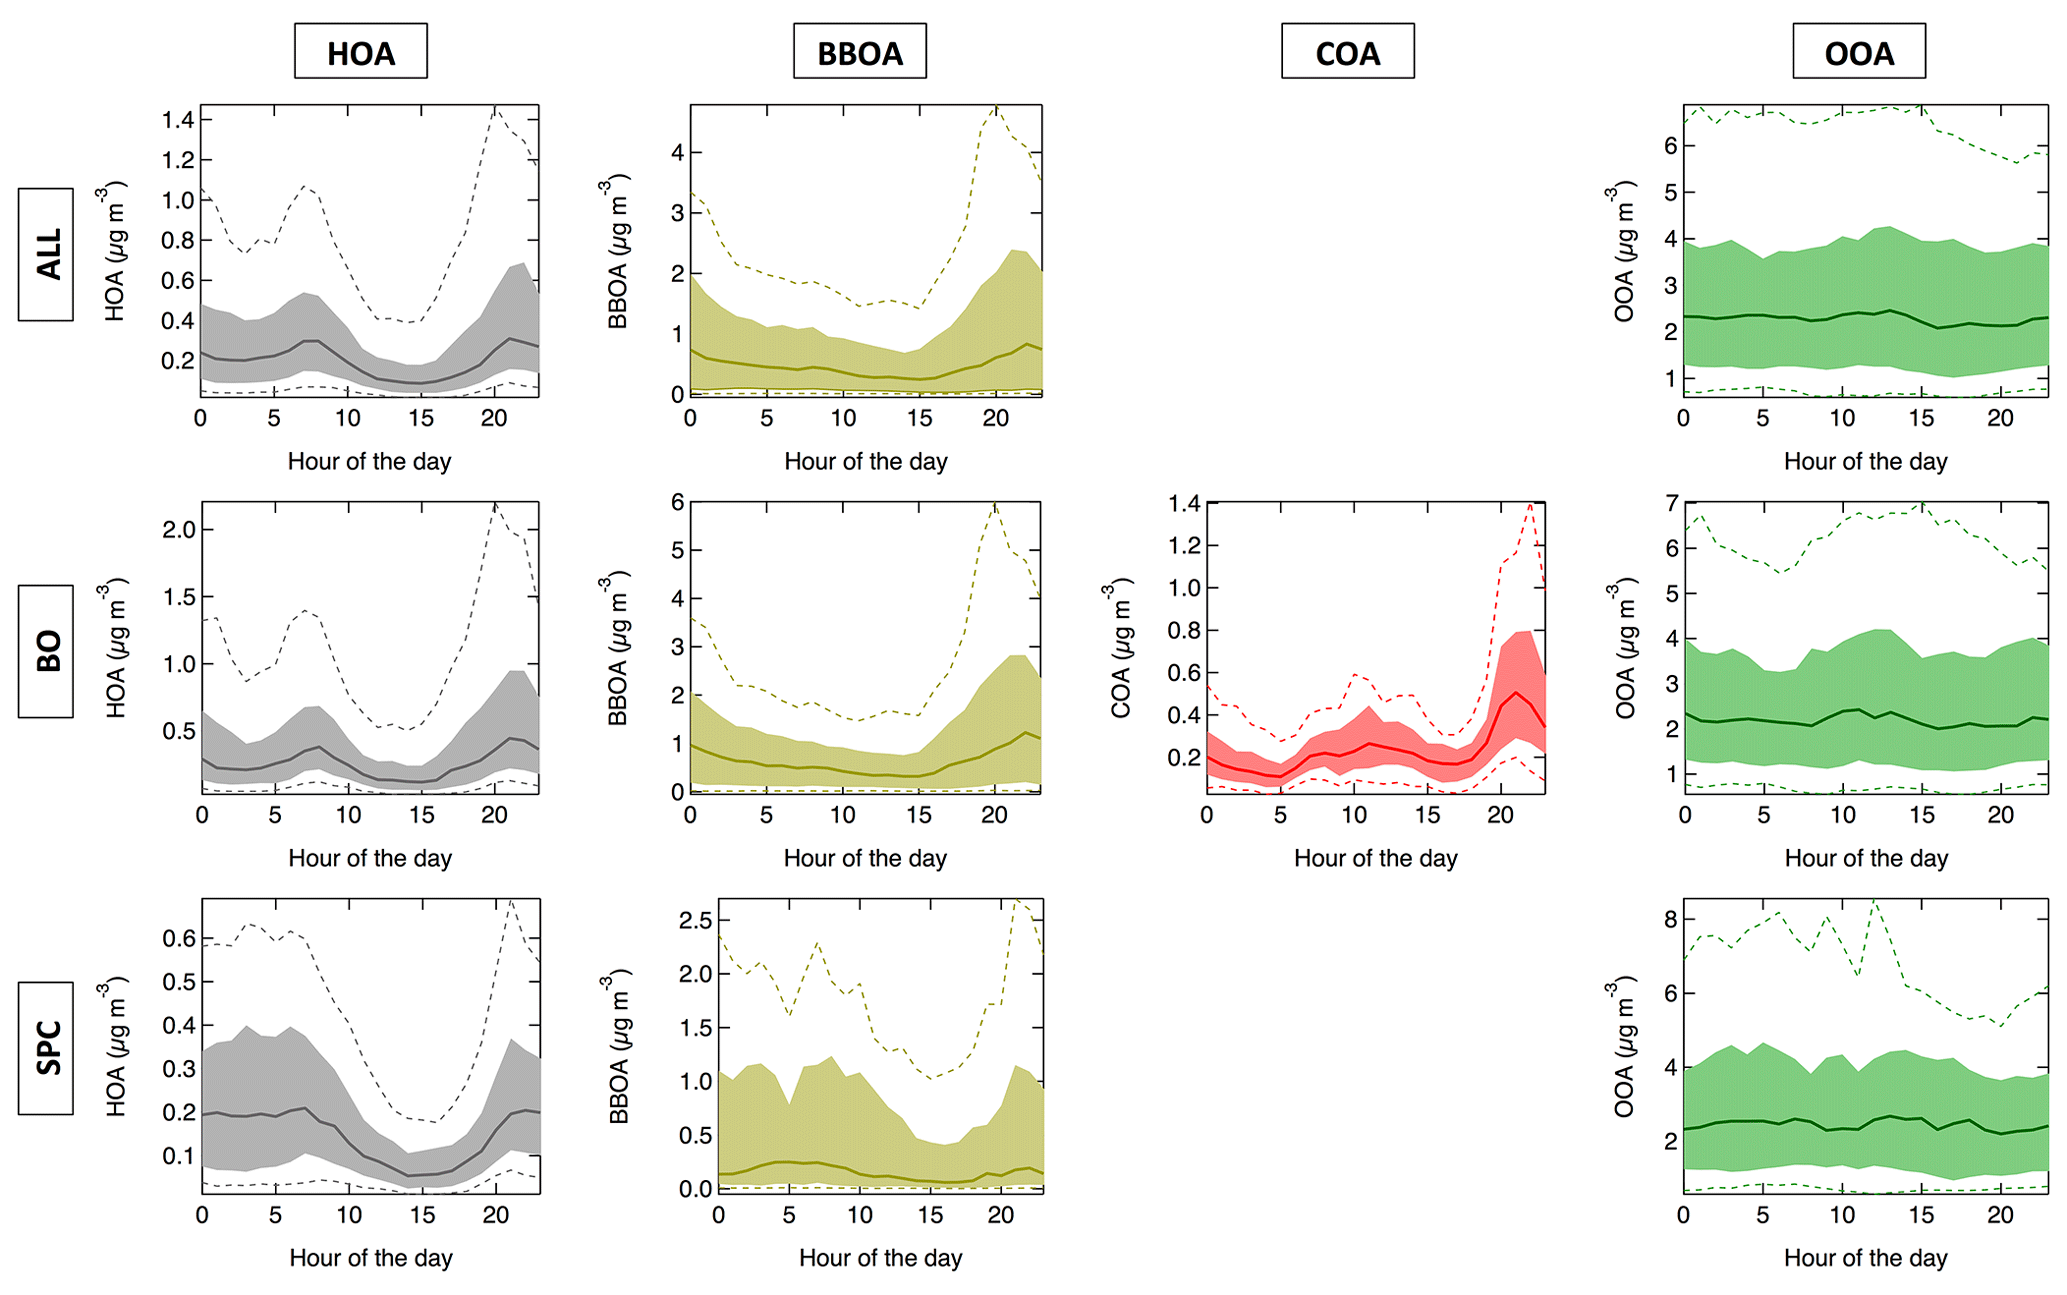
Figure 4Daily trends of the factors identified (HOA, BBOA, COA and SOA). Median diurnal patterns are shown together with the 10th, 25th, 75th and 90th percentiles for each source, for all the Supersito campaigns together and separately for Bologna (BO) and San Pietro Capofiume (SPC).
The identified factors' daily trends (HOA, BBOA, COA and OOA) are shown in Fig. 4. Median diurnal patterns are shown together with the 10th, 25th, 75th and 90th percentiles for each factor, for the lumped datasets from all Supersito campaigns and separately for Bologna (BO) and San Pietro Capofiume (SPC).
The daily trends of each organic component exhibit consistent characteristics during all the campaigns. HOA presents a diurnal cycle characterized by two maxima corresponding to the rush hours (impacted by the greatest vehicular traffic) between 8–9 and 18–20, in agreement with the attribution of this fraction to traffic sources. This is especially evident at the urban site of Bologna compared to the rural one, at which the concentrations of HOA are lower and rush hour signatures are weak, as expected for a rural background site. BBOA is characterized by a daily cycle with a midday minimum and a night-time maximum. This behavior reflects the combination of two factors: the influence of the mixing-layer height – which favors pollutant accumulation near the ground at nighttime – and the daily pattern of the emissions from domestic heating, increasing in the evening/night hours. The concentrations of COA exhibit a characteristic daily trend with two maxima corresponding to the hours of main meals, one in the central hours of the day (12–14) and the other in the evening (20–21, more pronounced due to the shallow boundary layer after the sunset). Finally, OOA exhibits an almost flat daily trend, reflecting its regional nature or the influence of multiple secondary formation processes. Therefore, the weak diurnal trends of OOA were not informative of potential sources of SOA in this region.
Table 2Relative (%) and absolute mass contributions (µg m−3) of the main organic aerosol components HOA, BBOA, COA and OOA for all the considered campaigns. BO: Bologna; SPC: San Pietro Capofiume.
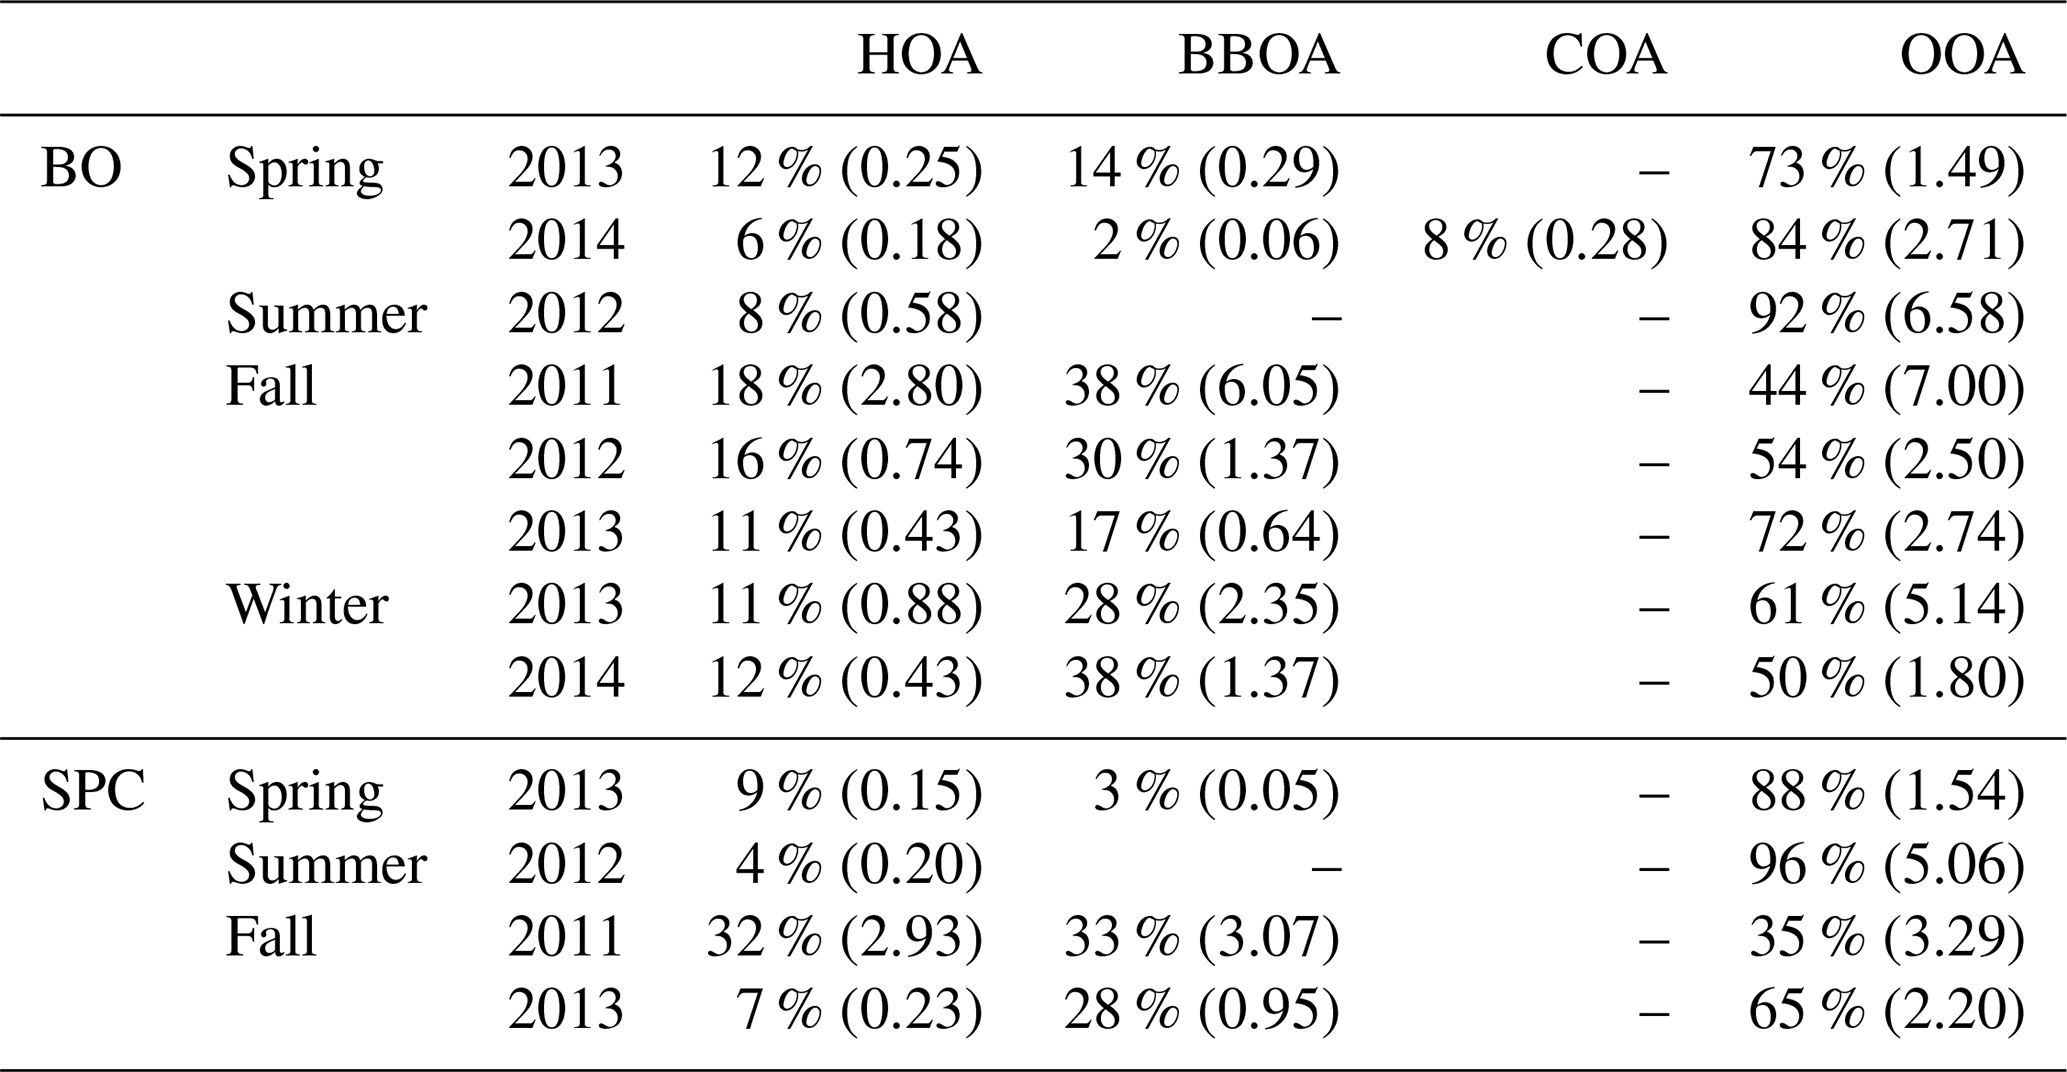
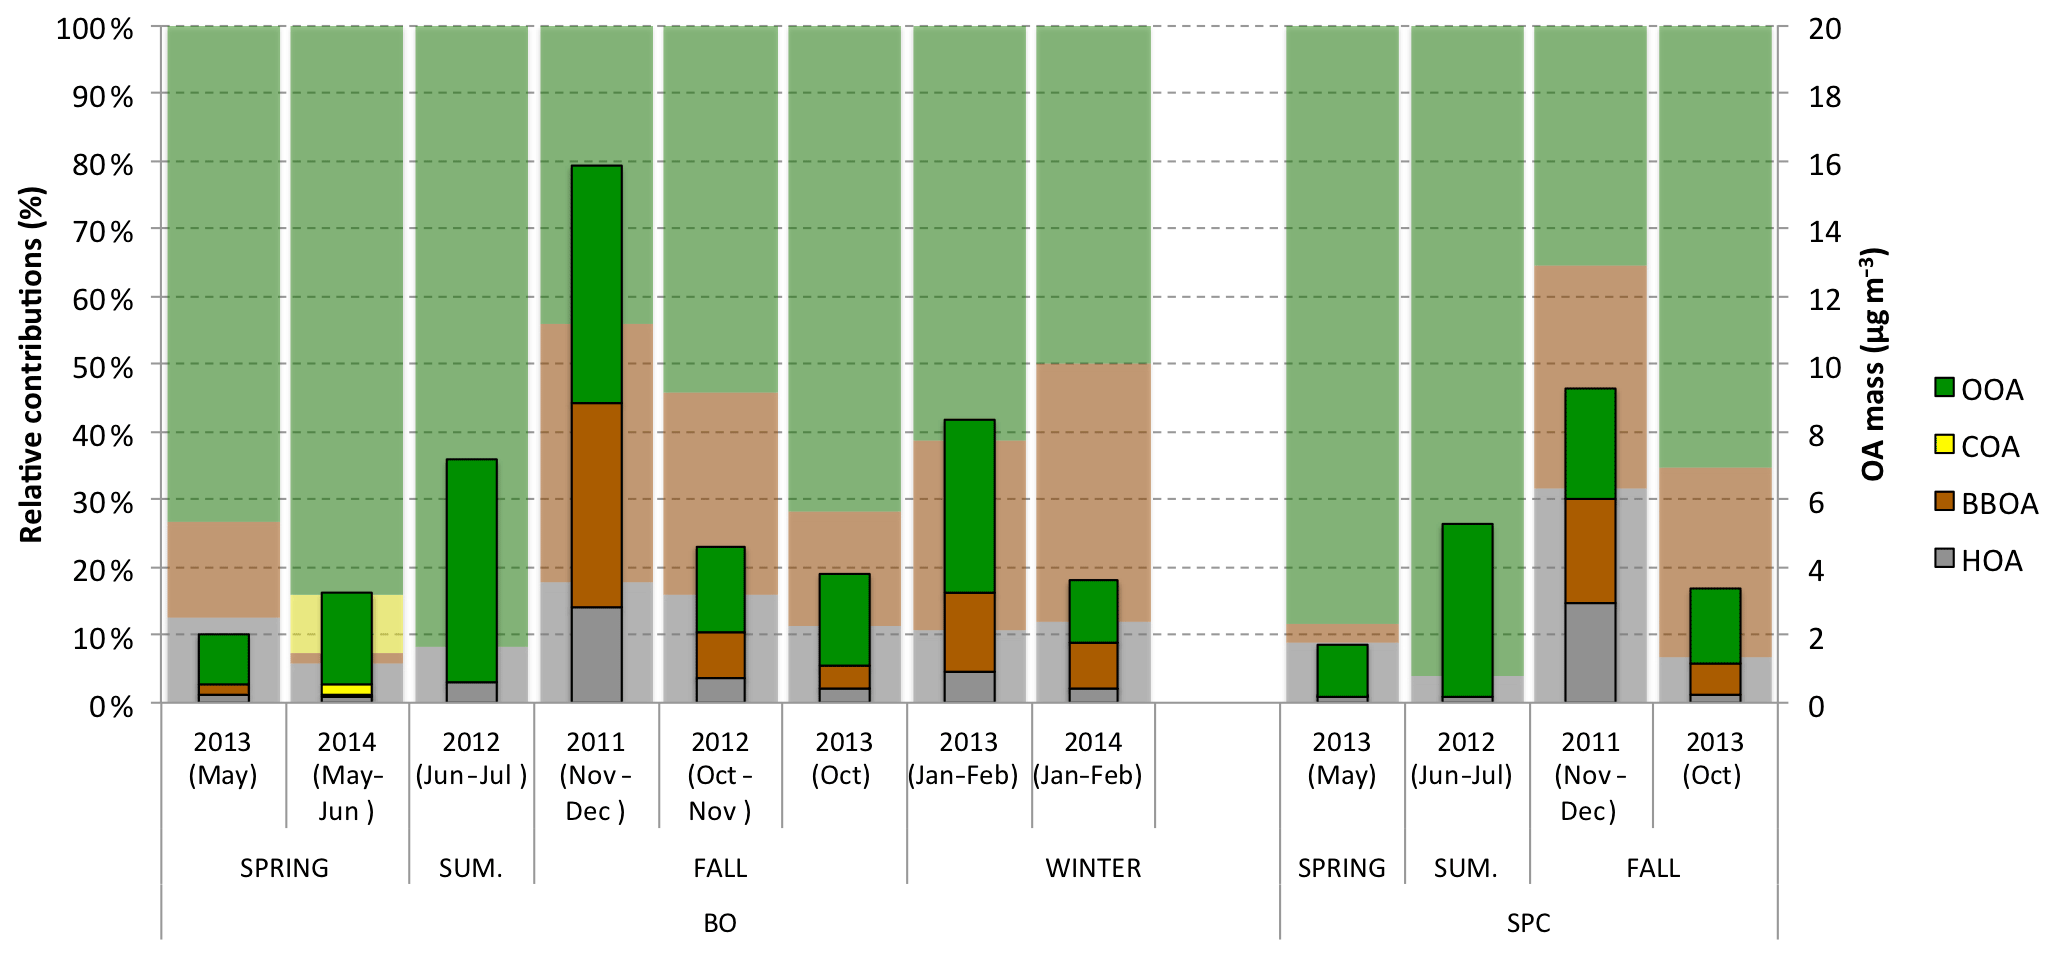
Figure 5Organic aerosol source contributions for each site and each Supersito campaign. Relative contributions are shown as shaded histograms (referring to the left axis) in the background of the absolute ones (referring to the right axis).
3.2 POA and SOA contributions, seasonality and spatial variability
Table 2 summarizes the site-specific and campaign-specific contributions of OA components determined by AMS factor analysis (see also Fig. 5). A few clear seasonal patterns can be identified, especially for the Bologna urban site, for which a higher number of measurements are available (Fig. 5).
In Bologna, HOA contributes 11 %–18 % of the mass of sub-micrometric OA in fall–winter and 6 %–12 % in spring–summer. The slightly lower average HOA contribution during the warmer season likely reflects the combination of two aspects: the reduction of work and school activities in summertime nearby the sampling areas, leading to a reduction of traffic emissions, and a possible meteorological effect due to the higher mixing layer, resulting in an enhanced dilution of the primary pollutants locally emitted.
The contribution of BBOA varies instead from 17 % to 38 % in the fall–winter campaigns to 0 %–14 % in summer–spring. In particular, the contribution of BBOA has not been detected in the summer period. Biomass burning therefore dominates over fossil fuel combustion as a source of primary organic aerosols at the urban site during the cold season. At the same site, OOA contributes 44 %–68 % of the mass of sub-micrometric OA in fall and winter, while its contribution in the spring and summer period increases to 74 %–92 %. The higher relative contribution of OOA in the warm period is expected given the reduction in residential combustion and the increased photochemistry. However, the OOA fraction in the cold season is still quite high, considering the latitude and climate of Bologna, where sunshine duration in winter is less than 3 h per day (in contrast to the almost 9 h in the summer). A discussion about SOA formation mechanisms alternative to gas-phase photochemistry is presented later in Sect. 4.2.

Figure 6Seasonal relative contribution of the main OA sources at both the urban and rural sites. The pie-chart area is proportional to the total average concentration of OA (shown on the upper-left side of each box in terms of µg m−3) and the individual portions are the averages between the different campaigns made at the sites in one season.
At the rural site of San Pietro Capofiume, as expected, the dominant contribution to POA in the cold periods is provided by BBOA (varying between 28 % and 33 % of the total OA mass during the 2013 and 2011 fall campaigns, respectively), and the contribution of OOA to total OA is larger than at the urban site (35 %–65 % in fall, and reaching 96 % in summer). Peculiar results were found for the SPC fall 2011 campaign, during which very large contributions of POA were recorded: the HOA fraction reached 32 % of the OA mass, somewhat strange for a rural site. Gilardoni et al. (2014) specifically studied this campaign, suggesting that these high HOA relative contributions are likely due to the occurrence of persistent fogs, which scavenge the most water-soluble OA components and leave the interstitial aerosol enriched in its most hydrophobic organic components (i.e., HOA) (Gilardoni et al., 2014).
A summary of the seasonality of OA fractions at the two Po Valley sites is shown in Fig. 6. The COA fraction, which was determined only at BO during one individual campaign and in small amounts, was not considered here to simplify the comparison between the other components. The SPC fall 2011 campaign was also not included in this statistic since the aerosol composition and concentrations for this experiment referred to a mixture of total OA and interstitial OA in fog conditions, as mentioned above and better described in Gilardoni et al. (2014).
Table S10 shows the correlation coefficients between the PMF factors discussed so far and the main chemical species constituting the sub-micrometric aerosol masses measured by the HR-ToF-AMS. The highest correlations are observed between OOA and secondary inorganic species, nitrate and ammonium sulfate, confirming the secondary nature of this fraction of OA. In particular, it can be noticed that OOA correlates better with ammonium nitrate in winter and fall, and with ammonium sulfate in summer and late spring, in agreement with previous results (Zhang et al., 2011; Canonaco et al., 2015). This behavior likely reflects the differences in temperature and relative humidity between winter and summer, which shift the partitioning of nitrate toward the gas phase (due to its volatility) during the warm season. In addition, the different correlation suggests the possibility of different oxidation pathways in secondary species formation between the cold and warm seasons: a pathway characterized by cold temperature and high relative humidity (correlating with nitrate) and another one related to higher temperature and photochemical activity (correlating more with sulfate). The latter hypothesis will be better developed in the following sections.
Table 3Urban increment, calculated as the ratio between the campaign average concentration at the urban and rural sites, for each season and OA fraction considered.
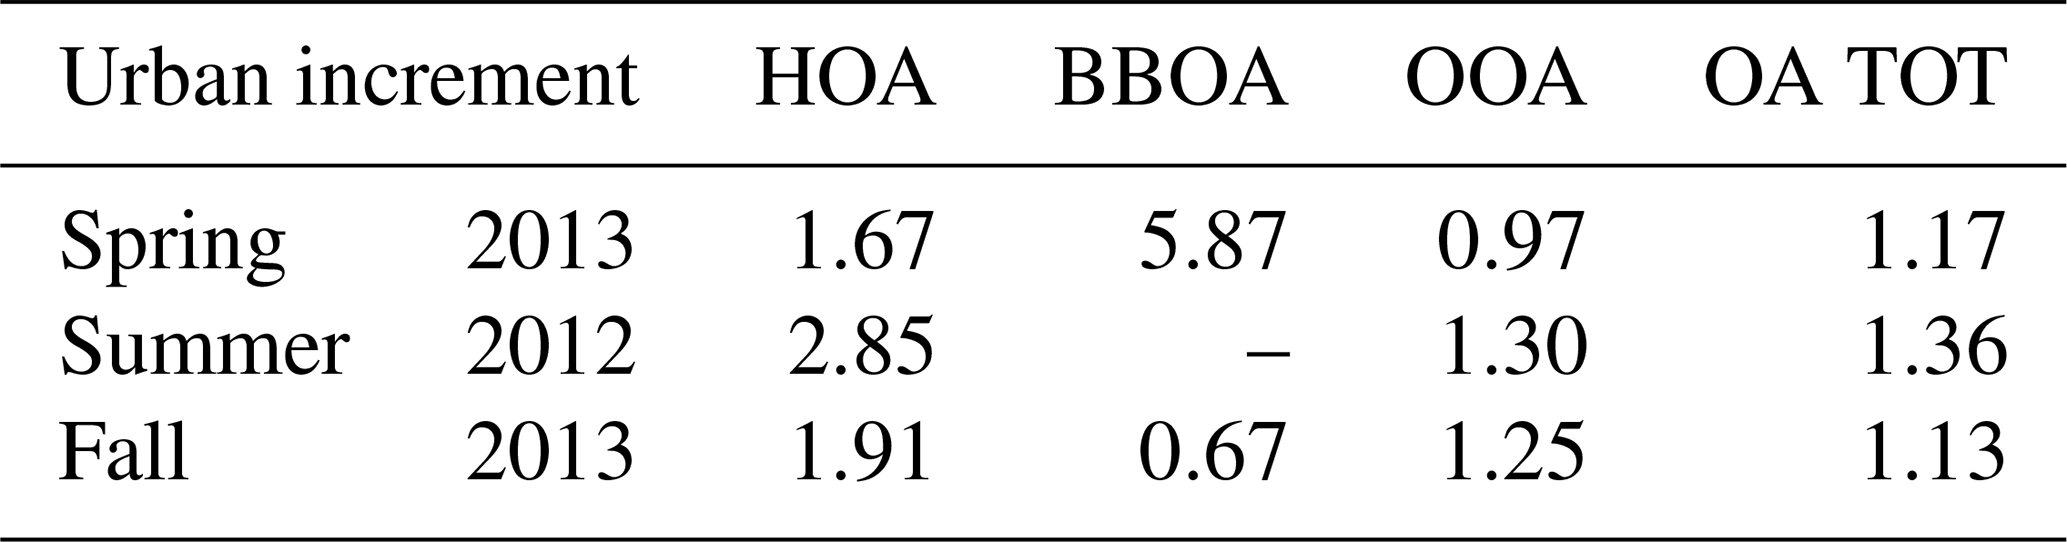
For the campaigns carried out in parallel at the urban and rural sites (summer 2012, spring 2013 and fall 2013), we estimated an “urban increment”, i.e., the increase in OA-type concentrations in urban areas with respect to the regional background. We expressed the increment as the ratio between the campaign average concentrations at the urban vs. rural sites, according to the season and the specific OA fraction considered (see Table 3). For total organic aerosol (OA) and for its OOA fraction, the ratios are quite constant throughout the seasons, varying between 1.13 and 1.36 and 0.97 and 1.30, respectively. By contrast, higher values were found for HOA (1.67, 1.91 and 2.85 in spring, fall and summer, respectively), in agreement with a major HOA source from urban traffic. The urban increment of BBOA is less clear: it varies a lot between spring (in which its value is very high, i.e., 5.87) and fall (with 0.67). Nevertheless, the spring value is affected by the low and intermittent high BBOA levels, likely indicating very local sources. The fall value seems more representative and suggests a higher contribution of BBOA in the rural areas, probably due to the more spread use of fire places and wood stoves for domestic heating and to additional possible sources such as agricultural burning.
In the previous section we presented OOA as one single component; however, the HR-ToF-AMS statistical analysis identified various OOA types that may indicate different formation (sources) and transformation processes (aging) of SOA in the aerosol. The number of OOA categories identified during the Supersito campaigns ranged from one (for the SPC fall 2011 campaign) to four (for the SPC summer 2012 campaign). Most of the IOPs (7 out of 12) allowed the identification of three OOA factors.
The spectral profiles of the individual OOAs are distinguishable based on minor mass fragments and other parameters. Among the most common parameters used in the literature for the distinction and interpretation of the various OOA factors are elemental ratios (OM : OC, O : C and H : C), the carbon oxidation state (OSc) and the fractional abundance f (where the f no. is the ratio between the abundance of a specific ion and the total organic spectrum) of specific fragments in their spectral profiles ( at m∕z 44 (f44); C2H3O+ at m∕z 43 (f43); at m∕z 60 (f60); etc.). The elemental ratios and the relative proportion between f43 and f44 generally indicate the degree of oxidation and therefore the extent of aging of a single factor (normally the less oxidized components exhibit higher H : C, lower O : C and less f43 and f44, while OOAs have O : C and f44 increasing with their degree of oxidation and aging in the atmosphere, largely due to the formation of carboxylic acids during this process) (Ng et al., 2010; Duplissy et al., 2011).
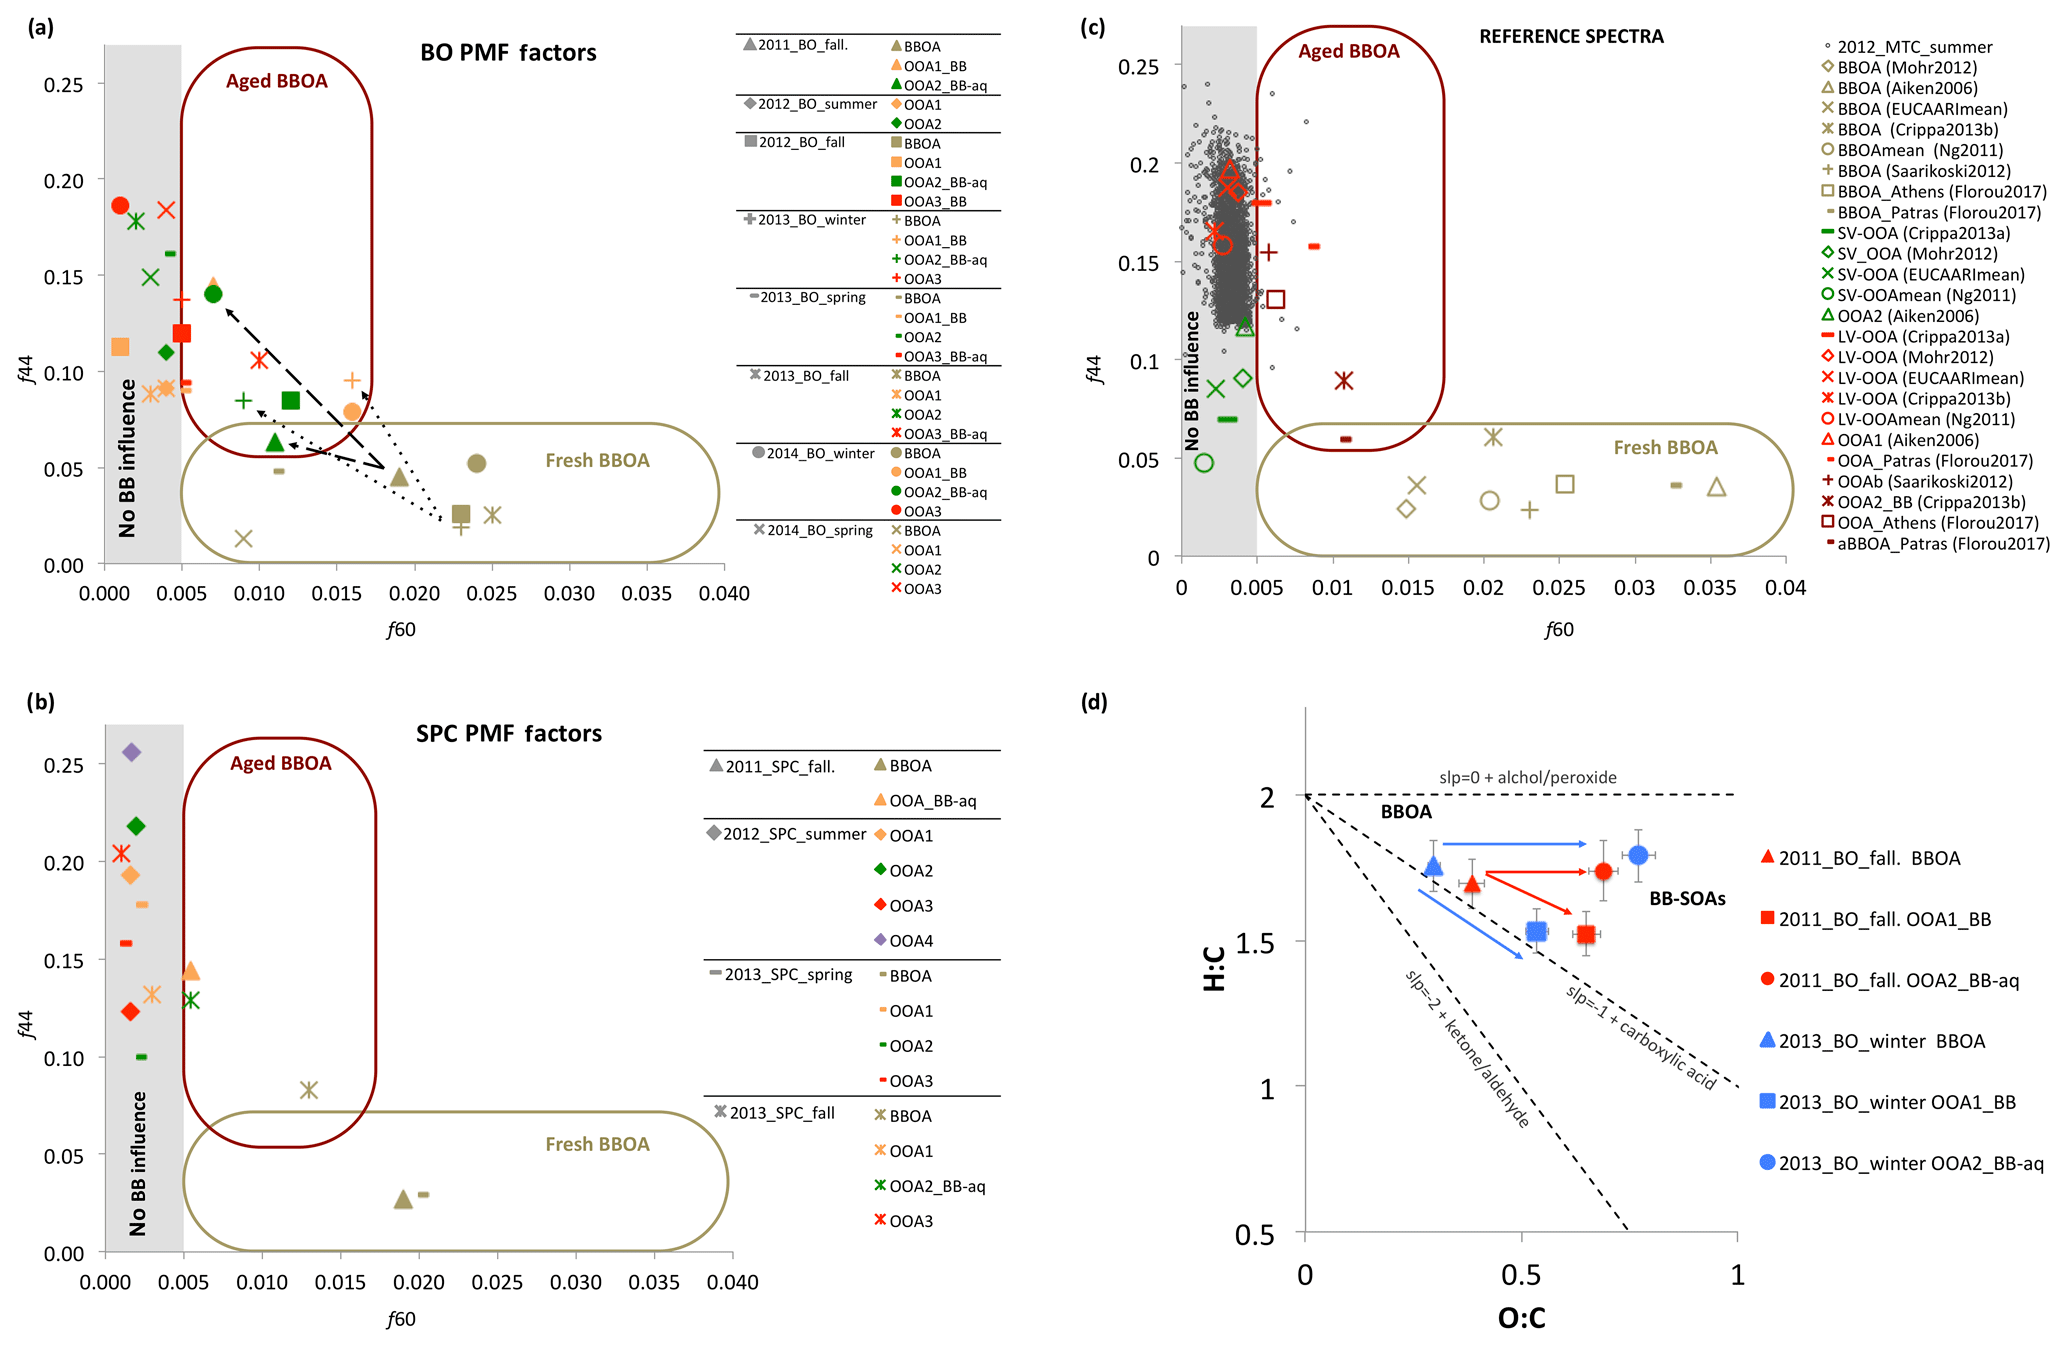
Figure 7Influence of biomass burning emissions on SOA and their evolution processes. The plots in panels (a), (b) and (c) show f44 (the normalized mass spectrum at m∕z 44), which is a proxy of the OA oxygenation degree, vs. f60 (the normalized mass spectrum signal at m∕z 60), which is a proxy of anhydrosugars. Different shapes of the markers identify different Supersito campaigns (a, b) or different reference spectra (c). Different colors represent the different kinds of PMF factors: gold–green identifies BBOA primary factors, yellow, green and red the OOAs numerically ordered based on their O : C ratios. Black dots in (c) represent the measurements taken as the background level of no influence of biomass burning. Grey areas correspond to f60 0.003±0.002 representing the Cubison et al. (2010) threshold of BB influence. (d) shows a van Krevelen (VK) diagram of the BBOA and OOA-BB PMF factors obtained from the HR-ToF-AMS data analysis for both BO fall 2011 (red markers) and winter 2013 (blue markers). The line connecting BBOA and OOA-BB has different slopes, indicating different chemistry processing leading to different SOA types.
Tables S12 and S13 show a summary of the parameters for the analysis and interpretation of all the factors identified by the PMF statistical analysis (including the different OOAs listed in order of their O : C ratios) during the campaigns of the Supersito project. We focus on two aspects: the influence of biomass burning emissions on OOA components and the importance of the aqueous-phase processing in their formation and evolution. A more comprehensive analysis of the OOA features of particular IOPs is the object of specific publications (Gilardoni et al., 2014, 2016; Sullivan et al., 2016).
4.1 Biomass burning influence on SOA
The products of cellulose pyrolysis, such as levoglucosan and similar species (mannosan, galactosan, etc., collectively called hereinafter “anhydrosugars”), generate mass spectra with an enhanced signal at m∕z 60 and 73 due to the ions and , which are therefore considered good tracers of wood combustion (Schneider et al., 2006; Alfarra et al., 2007). So, the parameter f60 (the ratio of the integrated signal at m∕z 60 to the total signal of the OA mass spectrum) is used as a marker to evaluate the influence of biomass burning emissions on the OA components (Cubison et al., 2011).
Fresh biomass burning emissions (BBOA factors) exhibit the highest content of anhydrosugars (f60). During atmospheric aging, the relative intensity of the anhydrosugar signal decreases because of degradation and oxidation reactions. At the same time, atmospheric aging leads to the oxidation of the molecules, which corresponds to the increase in oxygenated fragments in the mass spectrum, the most intense of which is at m∕z 44 (, f44).
The contribution of f60 to the different OA components of each campaign is represented in Fig. 7 by points in the f44 vs. f60 space (Cubison et al., 2011) together with those of some references from previous studies (Aiken et al., 2009; Ng et al., 2011; Mohr et al., 2012; Saarikoski et al., 2012; Crippa et al., 2014; Florou et al., 2017). The background level indicating no influence of biomass burning is represented in Fig. 7a–c by a grey shaded area. As an additional reference of OA not influenced by biomass combustion, we also report the measurements carried out during the summer 2012 parallel campaign at the high-altitude background station of Monte Cimone (Rinaldi et al., 2015).
Figure 7a–c show that the spectral features of the OOA factors from several campaigns are those typical of aged OA (large f44), but they also indicate the presence of anhydrosugars above the background level. This suggests a variable influence of biomass combustion on the OOA factors.
Such OOA factors influenced by biomass burning (OOAx_BB) represent a substantial mass fraction of the total OA during the fall–winter period (17 %–61 % at the Bologna site and 14 %–35 % at SPC). In the spring season, the biomass burning impact on OOA composition is much less evident (f60 closer to the background levels), but still represents 37 % of the total OA, more than twice the contribution of POA at BO during the spring 2013 campaign.
Additional tests and details on the determination of the biomass burning influence on OOA components are discussed in Sect. S2.2.3.
4.2 Biomass burning oxidation pathways
The vertical axis in Fig. 7 is controlled by the oxidation of the bulk OA, and the horizontal axis by the anhydrosugars loss. Thus, depending on the relative rates of these processes, the slopes of the virtual lines connecting the primary factors (BBOAs) and the corresponding aged PMF factors (OOAx_BB) are expected to be different. We do see indeed that the slopes vary in different campaigns. We also see that two OOA_BB factors detected during the BO fall 2011 and winter 2013 campaigns are connected to the primary BBOA with different slopes in the f60 vs. f44 space (as shown by the arrows in Fig. 7a). This variability could suggest that the two OOA_BB components, observed during the same experiment, are formed through different oxidation rates and pathways due to the variable environmental conditions.
In order to test this hypothesis, the evolution of the BBOA into OOAs is further analyzed for BO fall 2011 and BO winter 2013 in Fig. 7d using the O : C and hydrogen-to-carbon (H : C) ratios of the BBOA and OOAx_BB factors in the van Krevelen (VK) diagram. The VK diagram is typically used to investigate the OA evolution during field and laboratory experiments (Heald et al., 2010; Ng et al., 2011). The plot allows us to remove the effect of physical mixing between secondary and primary aerosols, providing a clearer interpretation of the results. Aerosol aging has the overall effect of increasing O : C ratios. In the VK plot the H : C vs. O : C slope of 0 is equivalent to the replacement of a hydrogen atom with an OH moiety, whereas a slope of −1 indicates the formation of carboxylic acid groups (Ng et al., 2011). O : C and H : C values are reported for BBOA (triangles) and OOA_BB factors (squares and circles). The slope of the line that links BBOA to the circles (i.e., OOAx_BB-aq) is close to zero, while the line linking BBOA to the squares (i.e., OOAx_BB) is between −0.5 and −1, suggesting possible different oxidation pathways. The negative slope indicates that OOAx_BB likely formed from BBOA through formation of carboxylic acid moieties, suggesting photochemical oxidation processes driven by OH radicals which might take place both in the gas and aqueous phases (Ng et al., 2011; Timonen et al., 2013; McNeill, 2015). Conversely, OOAx_BB-aq formation (slope 0) is consistent with the hydroxyl group formation possibly taking place in aerosol water (i.e., wet aerosol) through dark chemistry (Lim et al., 2010; Gilardoni et al., 2016; Ervens et al., 2011), a hypothesis better assessed in the next paragraph.
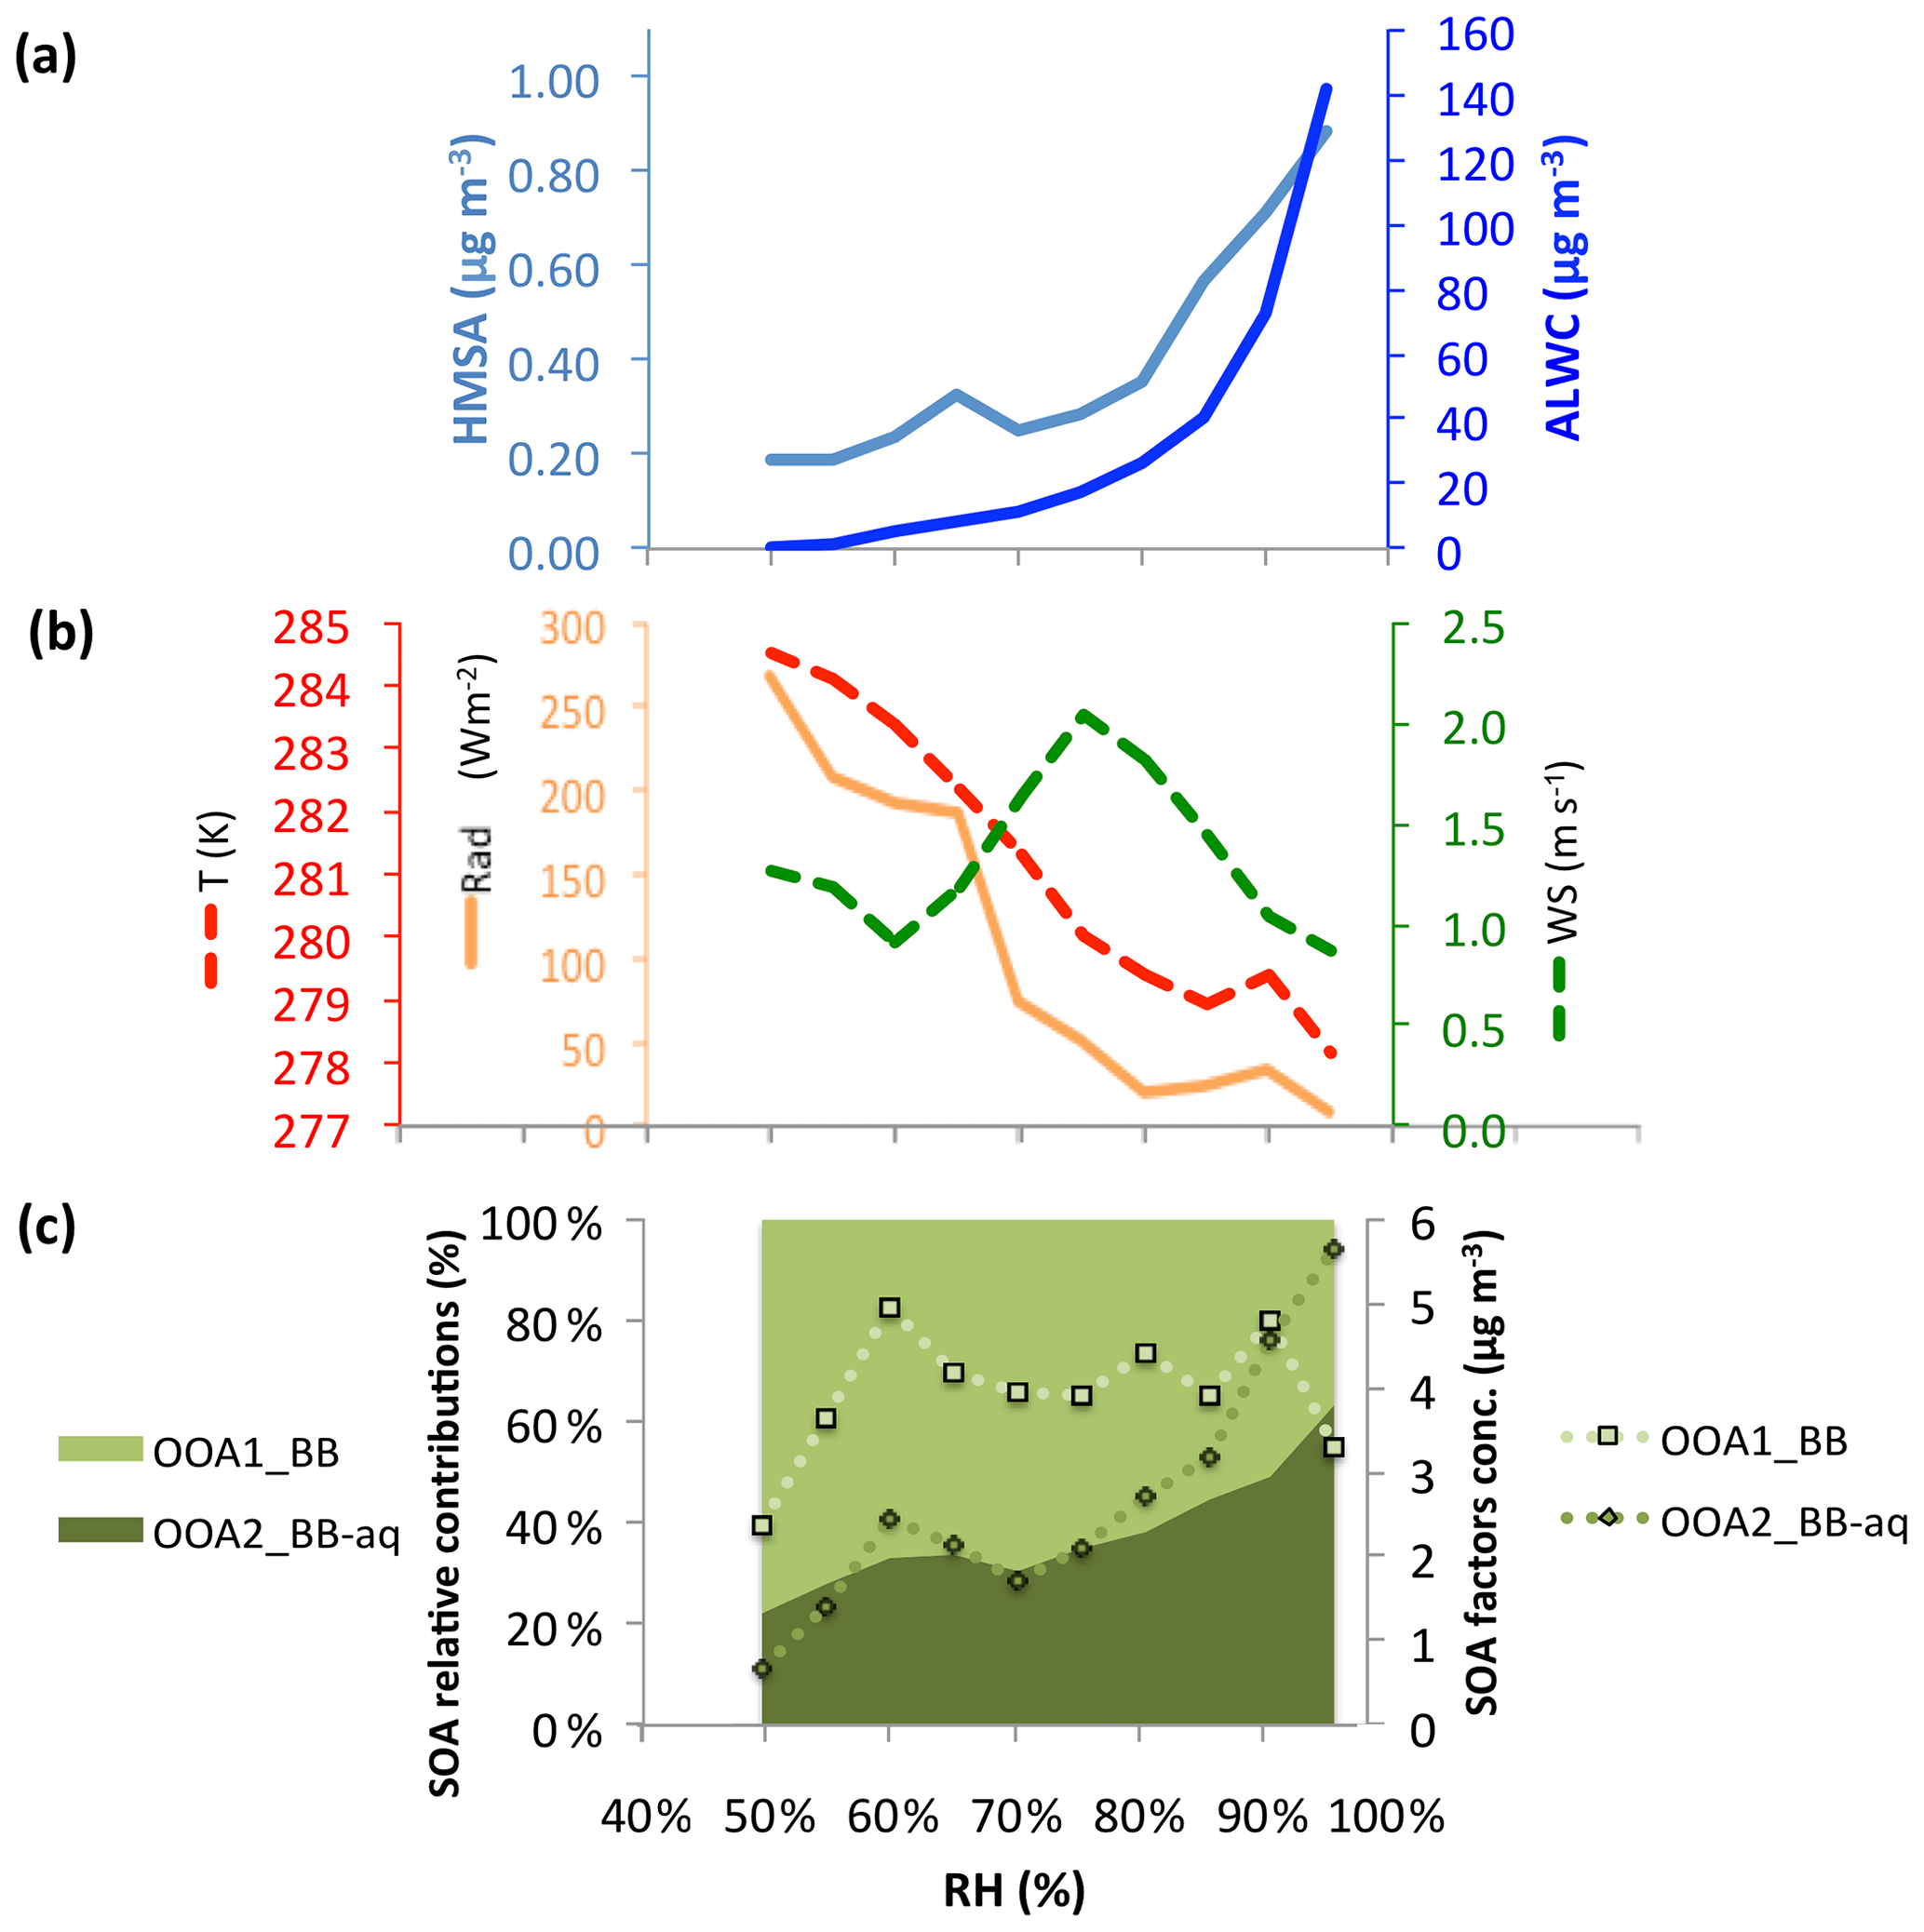
Figure 8Variations of meteorological and chemical parameters as a function of RH during the BO fall 2011 campaign. The data were binned according to the RH (5 % increment), and mean values are shown for each bin. (a) Aerosol liquid water content (ALWC) and hydroximethansulfonic acid (HMSA). (b) Air temperature together with solar radiation and wind speed (WS) measured at ground level. (c) Variations in the contributions of the two BB-influenced OOA factors identified (OOA1_BB and OOA2_BB-aq) in both absolute (µg m−3) and relative (% of OOA) terms.
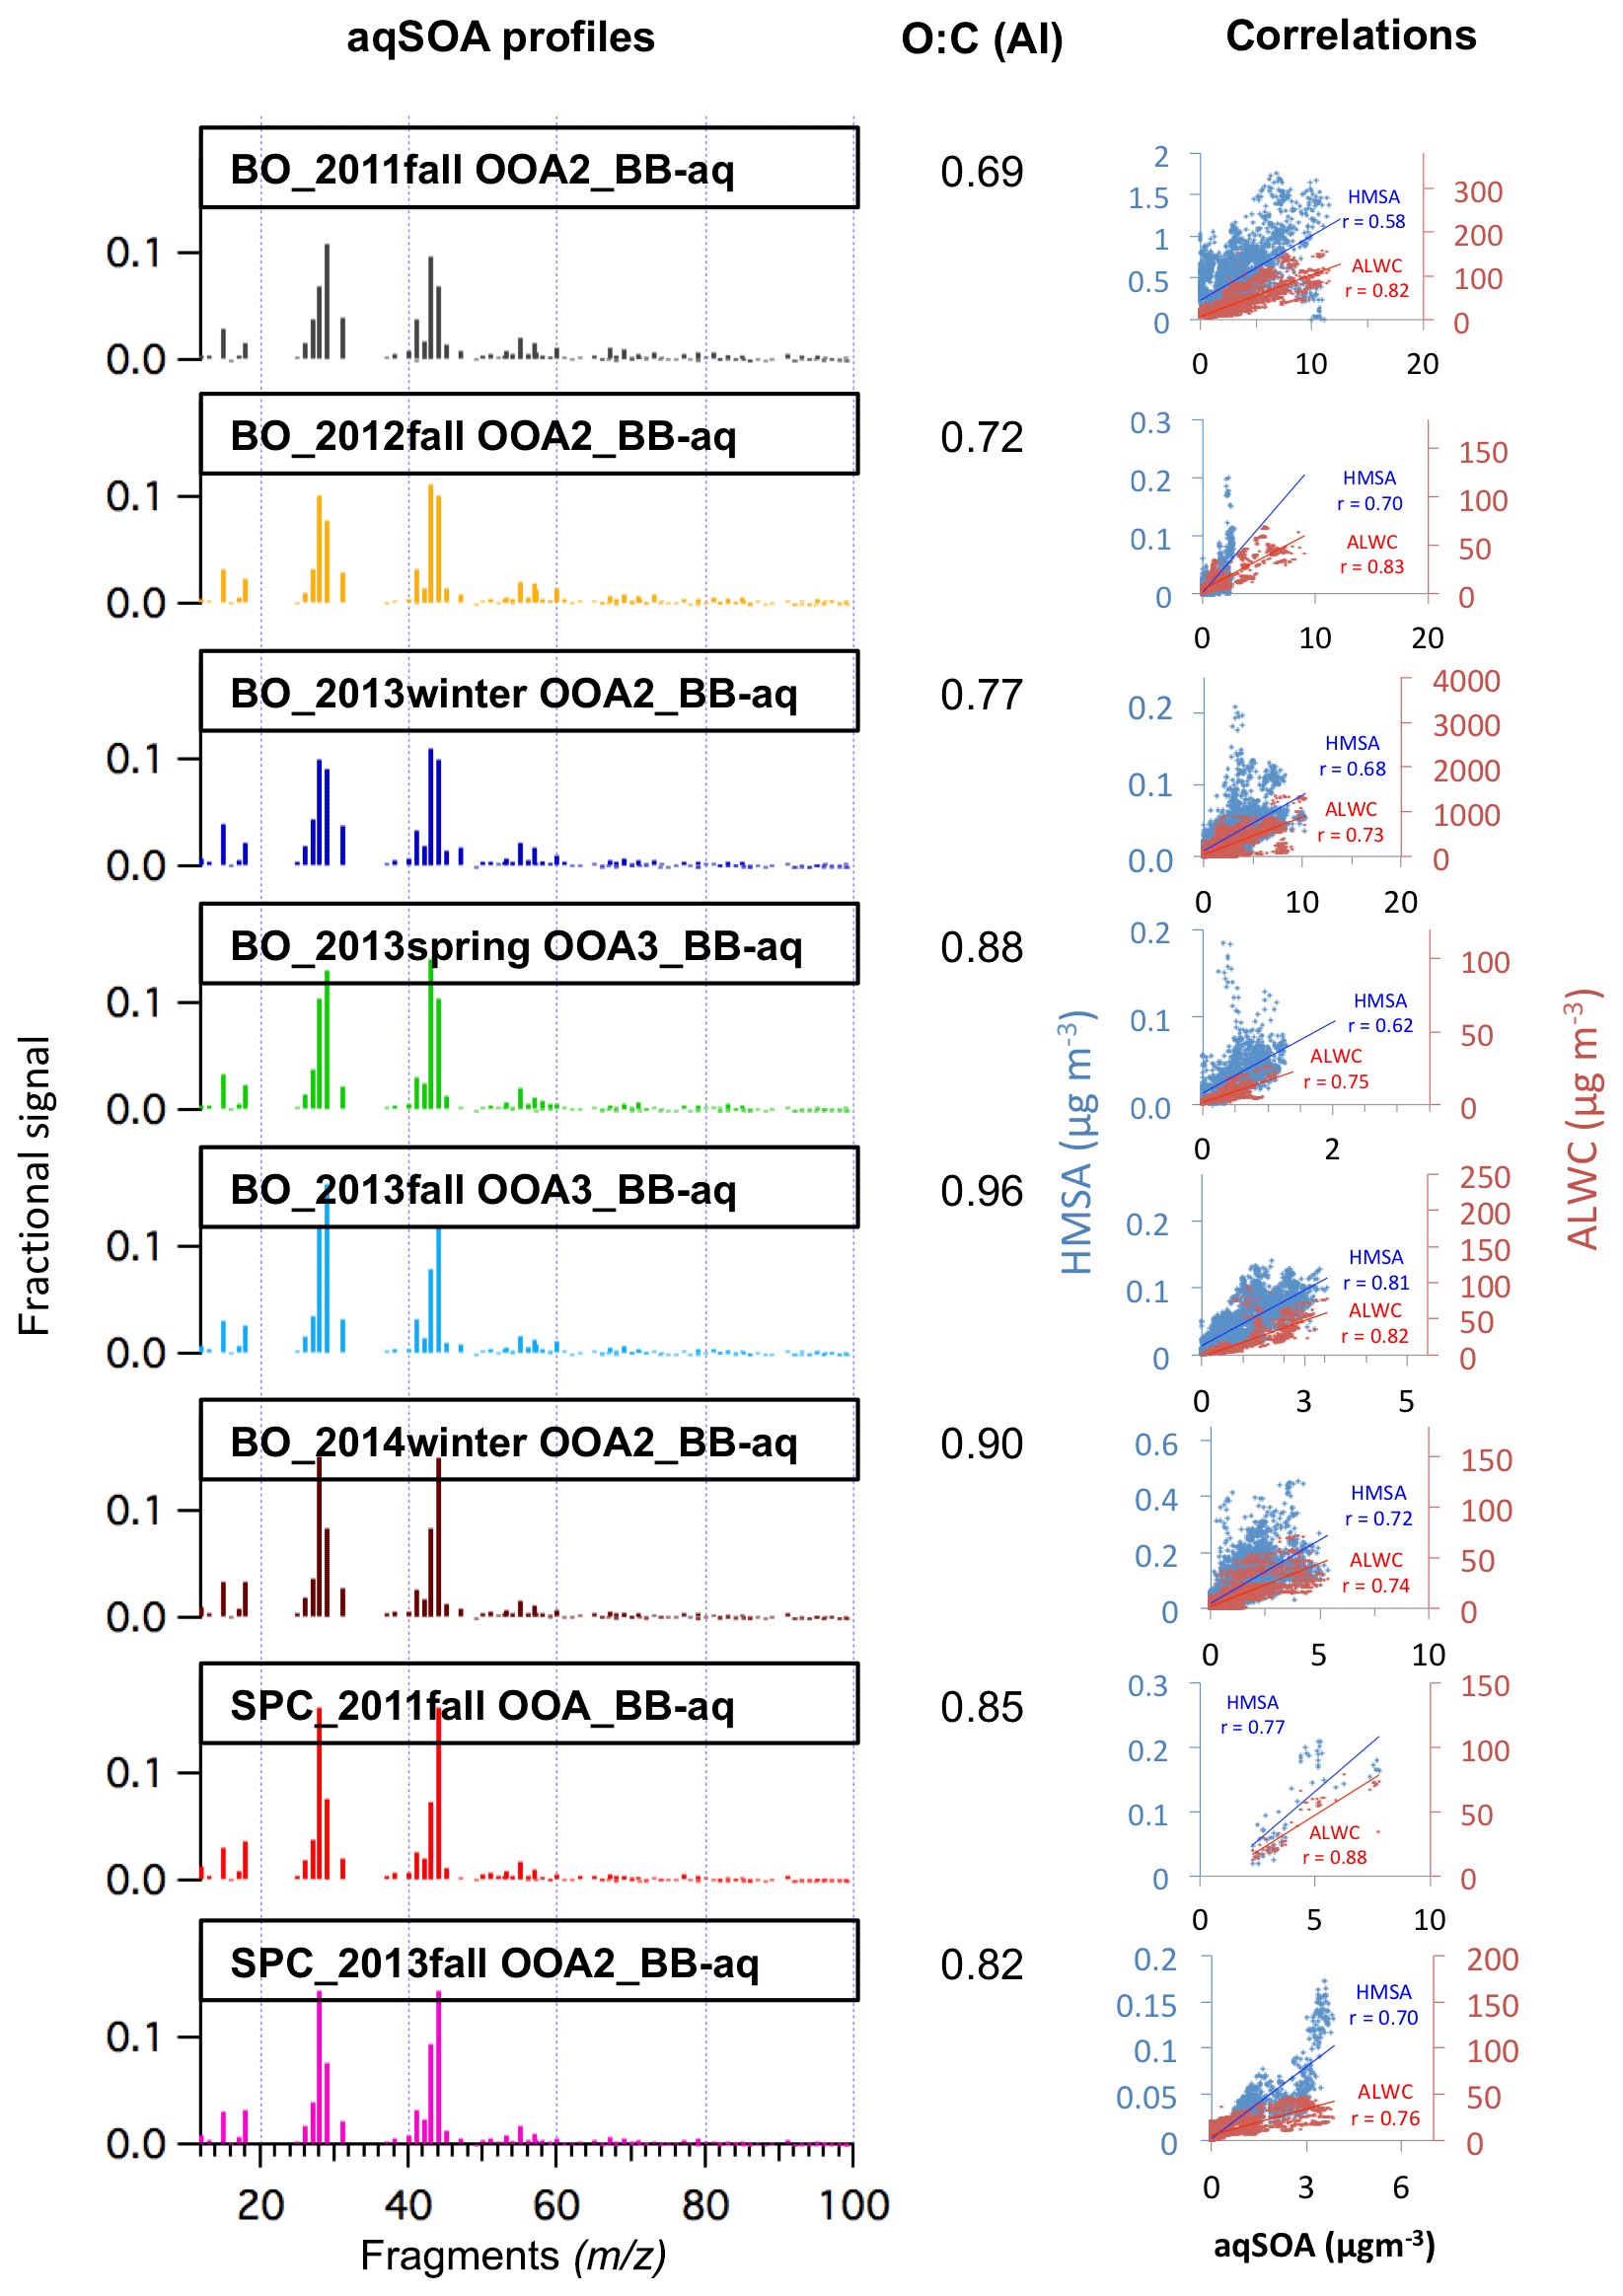
Figure 9OOAx_BB-aq main features: the left column shows the mass spectral profile of each BB-aqSOA component identified during the Supersito campaigns; the OOA factors are numerically ordered for each campaign based on their O : C ratios; the central column shows the O : C elemental ratios of the same factors; the right column illustrates the correlation between their concentration time series and the HMSA (in blue) and the ALWC (in red).
4.3 Aqueous-phase chemistry in SOA formation
Figure 8 shows the variations in contributions of the two BB-influenced OOA factors identified during the BO fall 2011 campaign as a function of RH, together with some other meteorological and chemical parameters. The aerosol liquid water content (ALWC), as calculated by the ISORROPIA-II model, and the hydroxymethanesulfonate (HMSA) were used to trace the effects of aqueous-phase SOA formation. In fact, HMSA is formed by the reaction of sulfite and bisulfite with dissolved formaldehyde in droplets and deliquesced aerosols and is oxidized by ozone at concentrations as low as 10 ppb (Kok et al., 1986; Facchini et al., 1992; Whiteaker and Prather, 2003). We suggest here that formaldehyde (as well as a number of other gaseous compounds including ketones, aldehydes, and small carboxylic acids in the BB plumes, Schauer et al, 2001; Andreae, 2019) would preferentially partition into particles at high ALWC and would react to form HMSA (and/or other products). Then the products of these aqueous-phase reactions (such as HMSA) remain in the particle phase after water evaporation, changing the chemical composition of the organic aerosol. For this reason, considering also that HMSA formation is inhibited by photochemistry (due to its fast reaction with ozone) and that the analyzed aerosol was dried before sampling, the correlation of some factors with HMSA can be considered reliable evidence of the aqueous-phase formation pathway of some OA fractions. HMSA was detected by the HR-ToF-AMS (following the estimation method presented by Ge et al., 2012) during all the campaigns, and its presence and concentration were confirmed by offline H-NMR analysis of filter samples. ALWC and HMSA exhibit a strong increase as a function of RH during the campaign, confirming the influence of aqueous-phase processing at high RH levels (Fig. 8a). At the same time, temperature and solar radiation (Fig. 8b) decrease as a function of RH, suggesting a reduction of photochemical activity.
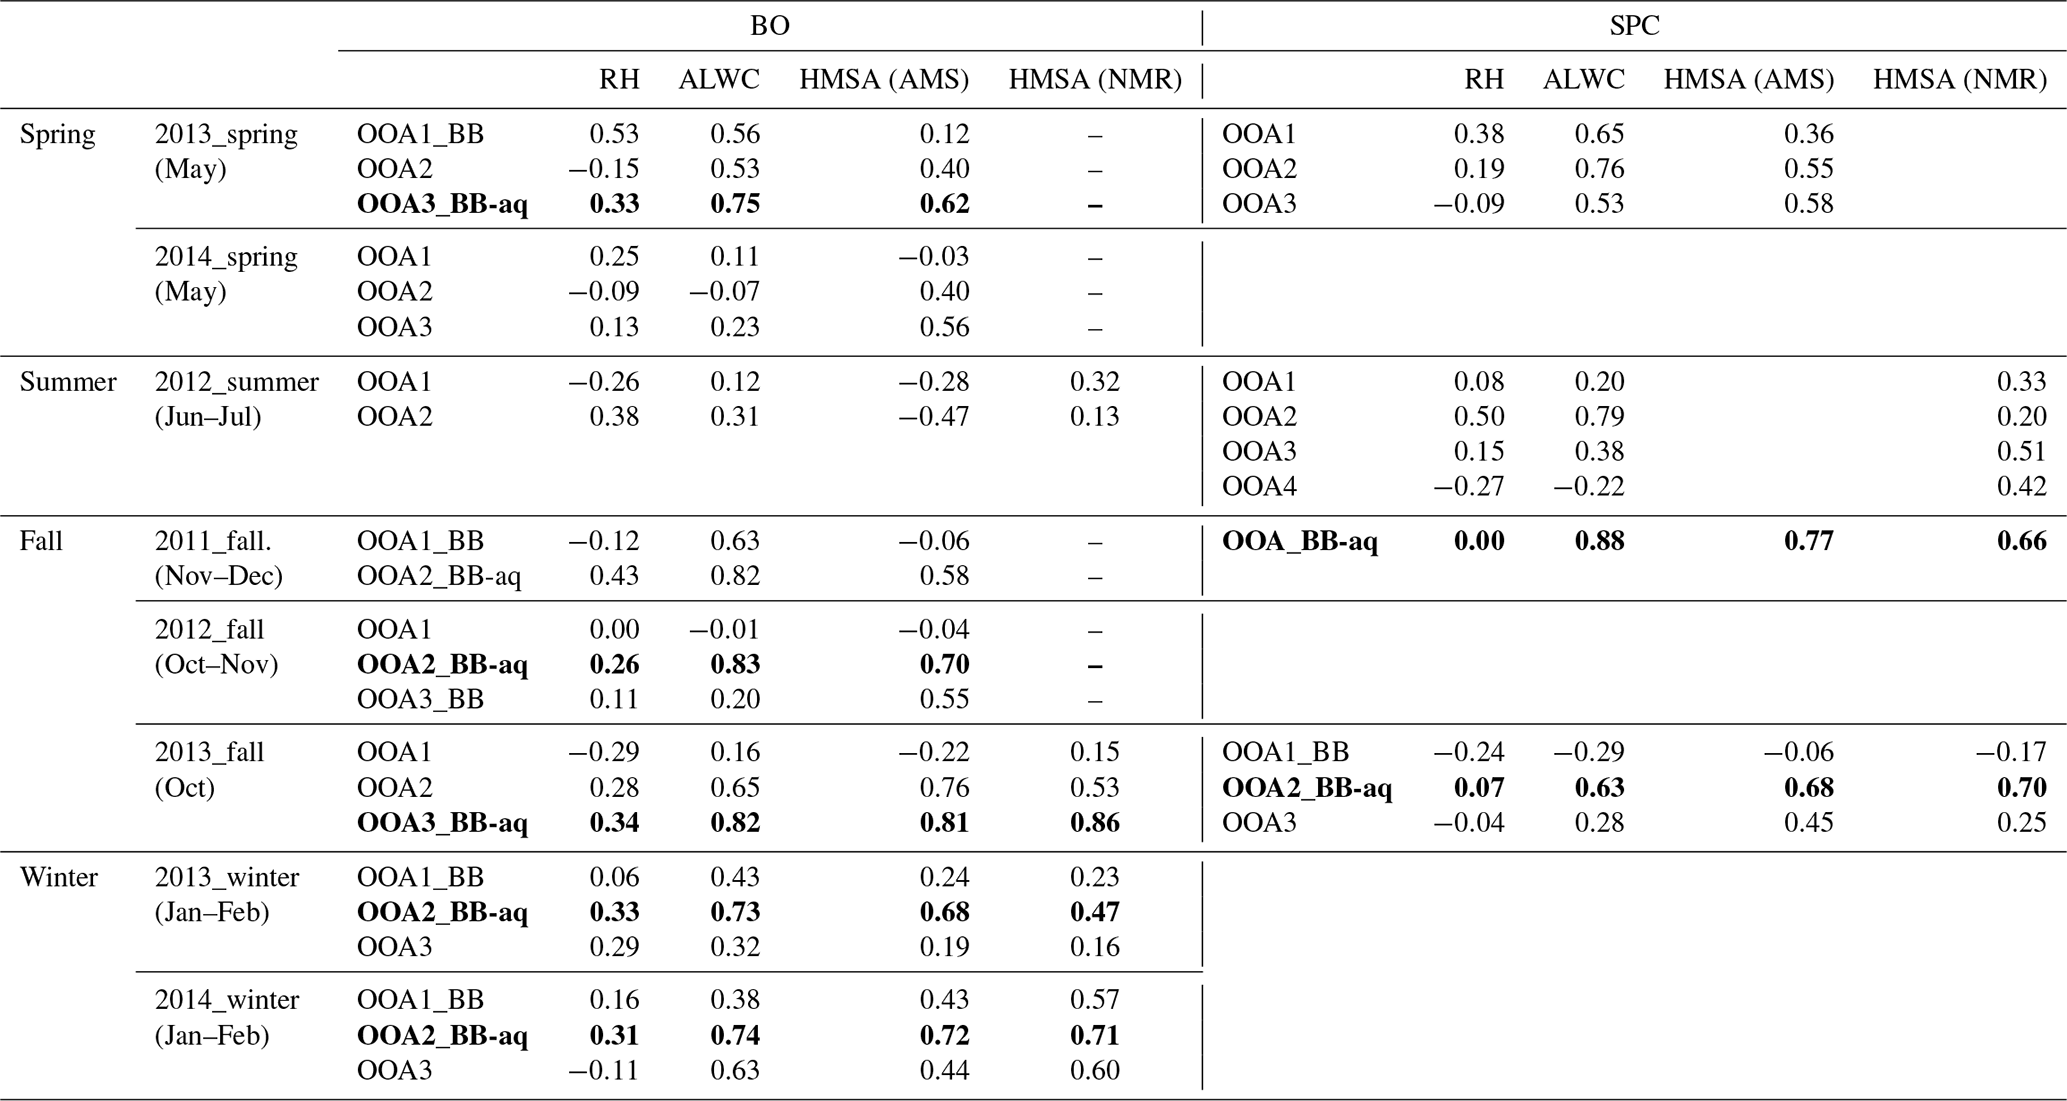
Table 4Correlation (Pearson coefficients, R) between OOA components identified by PMF/ME-2 and some variables linked to the aqueous phase: relative humidity (RH) of the air; aerosol liquid water content (ALWC) calculated by the ISORROPIA II model; hydroxymethanesulfonate (HMSA) estimated by AMS and (when available) NMR measurements. Bold fonts highlight the identified aqSOA factors.
These ambient conditions result in a large increase in the contribution of OOA2_BB-aq, whereas the OOA1_BB concentration remained relatively constant (Fig. 8c).
Extending this analysis to all the campaigns (see also Fig. S5), we identified at least one OOA factor originating from biomass burning through aqueous-phase processing (OOAx_BB-aq) in 8 out of the 12 datasets (all fall and winter campaigns plus spring 2013). The correlations of all the OOAs with the aerosol liquid water content (ALWC) and the hydroxymethanesulfonate (HMSA) are summarized in Table 4 (and also shown in Fig. 9 for the OOAx_BB-aq factors).
The spectral profiles of these OOA_BB-aq factors originating from aqueous-phase processing (shown in Fig. 9) are characterized by higher signals at m∕z 29 (CHO+) and m∕z 58 () in addition to the more common m∕z 43 (C2H3O+), m∕z 44 () and m∕z 60 () that also characterized the other BB-influenced secondary components. The OOAx_BB-aq factors' spectra also have good similarities (4<θ angle < 29; see Table S15) between each other and to the OOA spectra recorded after fog dissipation at SPC during fall 2011 (Gilardoni et al., 2016).
The conclusion that these components are affected by aqueous-phase processing is further supported by the correlations between the OOAx_BB-aq factors and some specific fragment ions. As shown in Table S16 all the aqSOAs identified during Supersito campaigns are well correlated with , and , which are typical fragments of methylglyoxal and glyoxal that are precursors of SOA via cloud processing (Carlton et al., 2007; Altieri et al., 2008). We further stress the link between biomass burning and these aqSOAs by looking at the correlations of these components with specific fragment ions of aqueous-phase products of phenol and guaiacol emitted during the biomass burning (namely PhOH-OH, , m∕z 110.037; PhOH-2OH, at m∕z 126.032; GUA-OH, at m∕z 140.047; GUA-2OH, at m∕z 156.042) already identified in previous laboratory studies (Yu et al., 2014). Moreover, considering the elemental composition of the OOAx_BB-aq (Tables S12–S13 and Fig. 9), we notice that their O : C ratios, calculated following the ambient improved (AI) method (Canagaratna et al., 2015), are similar (on average 0.82±0.09) to the AI O : C ratios obtained from laboratory oxidation of phenolic compounds (0.89±0.10, Sun et al., 2010; 1.03±0.17, Yu et al., 2014) and from the laboratory-generated SOA from the photo-oxidation of organic precursors in the aqueous phase (0.89±0.13, Lee et al., 2011, 2012).
In conclusion, BB-influenced SOA formed by aqueous-phase processing (bb-aqSOA) identified during the Supersito campaigns represents a substantial mass fraction of the total OA during the fall–winter months (14 %–28 % at the Bologna site and 14 %–35 % at SPC). This component is often more than half of the total SOA influenced by BB emissions, while the other half undergoes photochemical oxidation pathways leading to OOAx_BB. Overall, our results support the importance in the Po Valley of SOA formation by aqueous-phase processing of wood combustion reported by Gilardoni et al. (2016), extending the ambient observations of these phenomena to a larger dataset (Fig. 10).
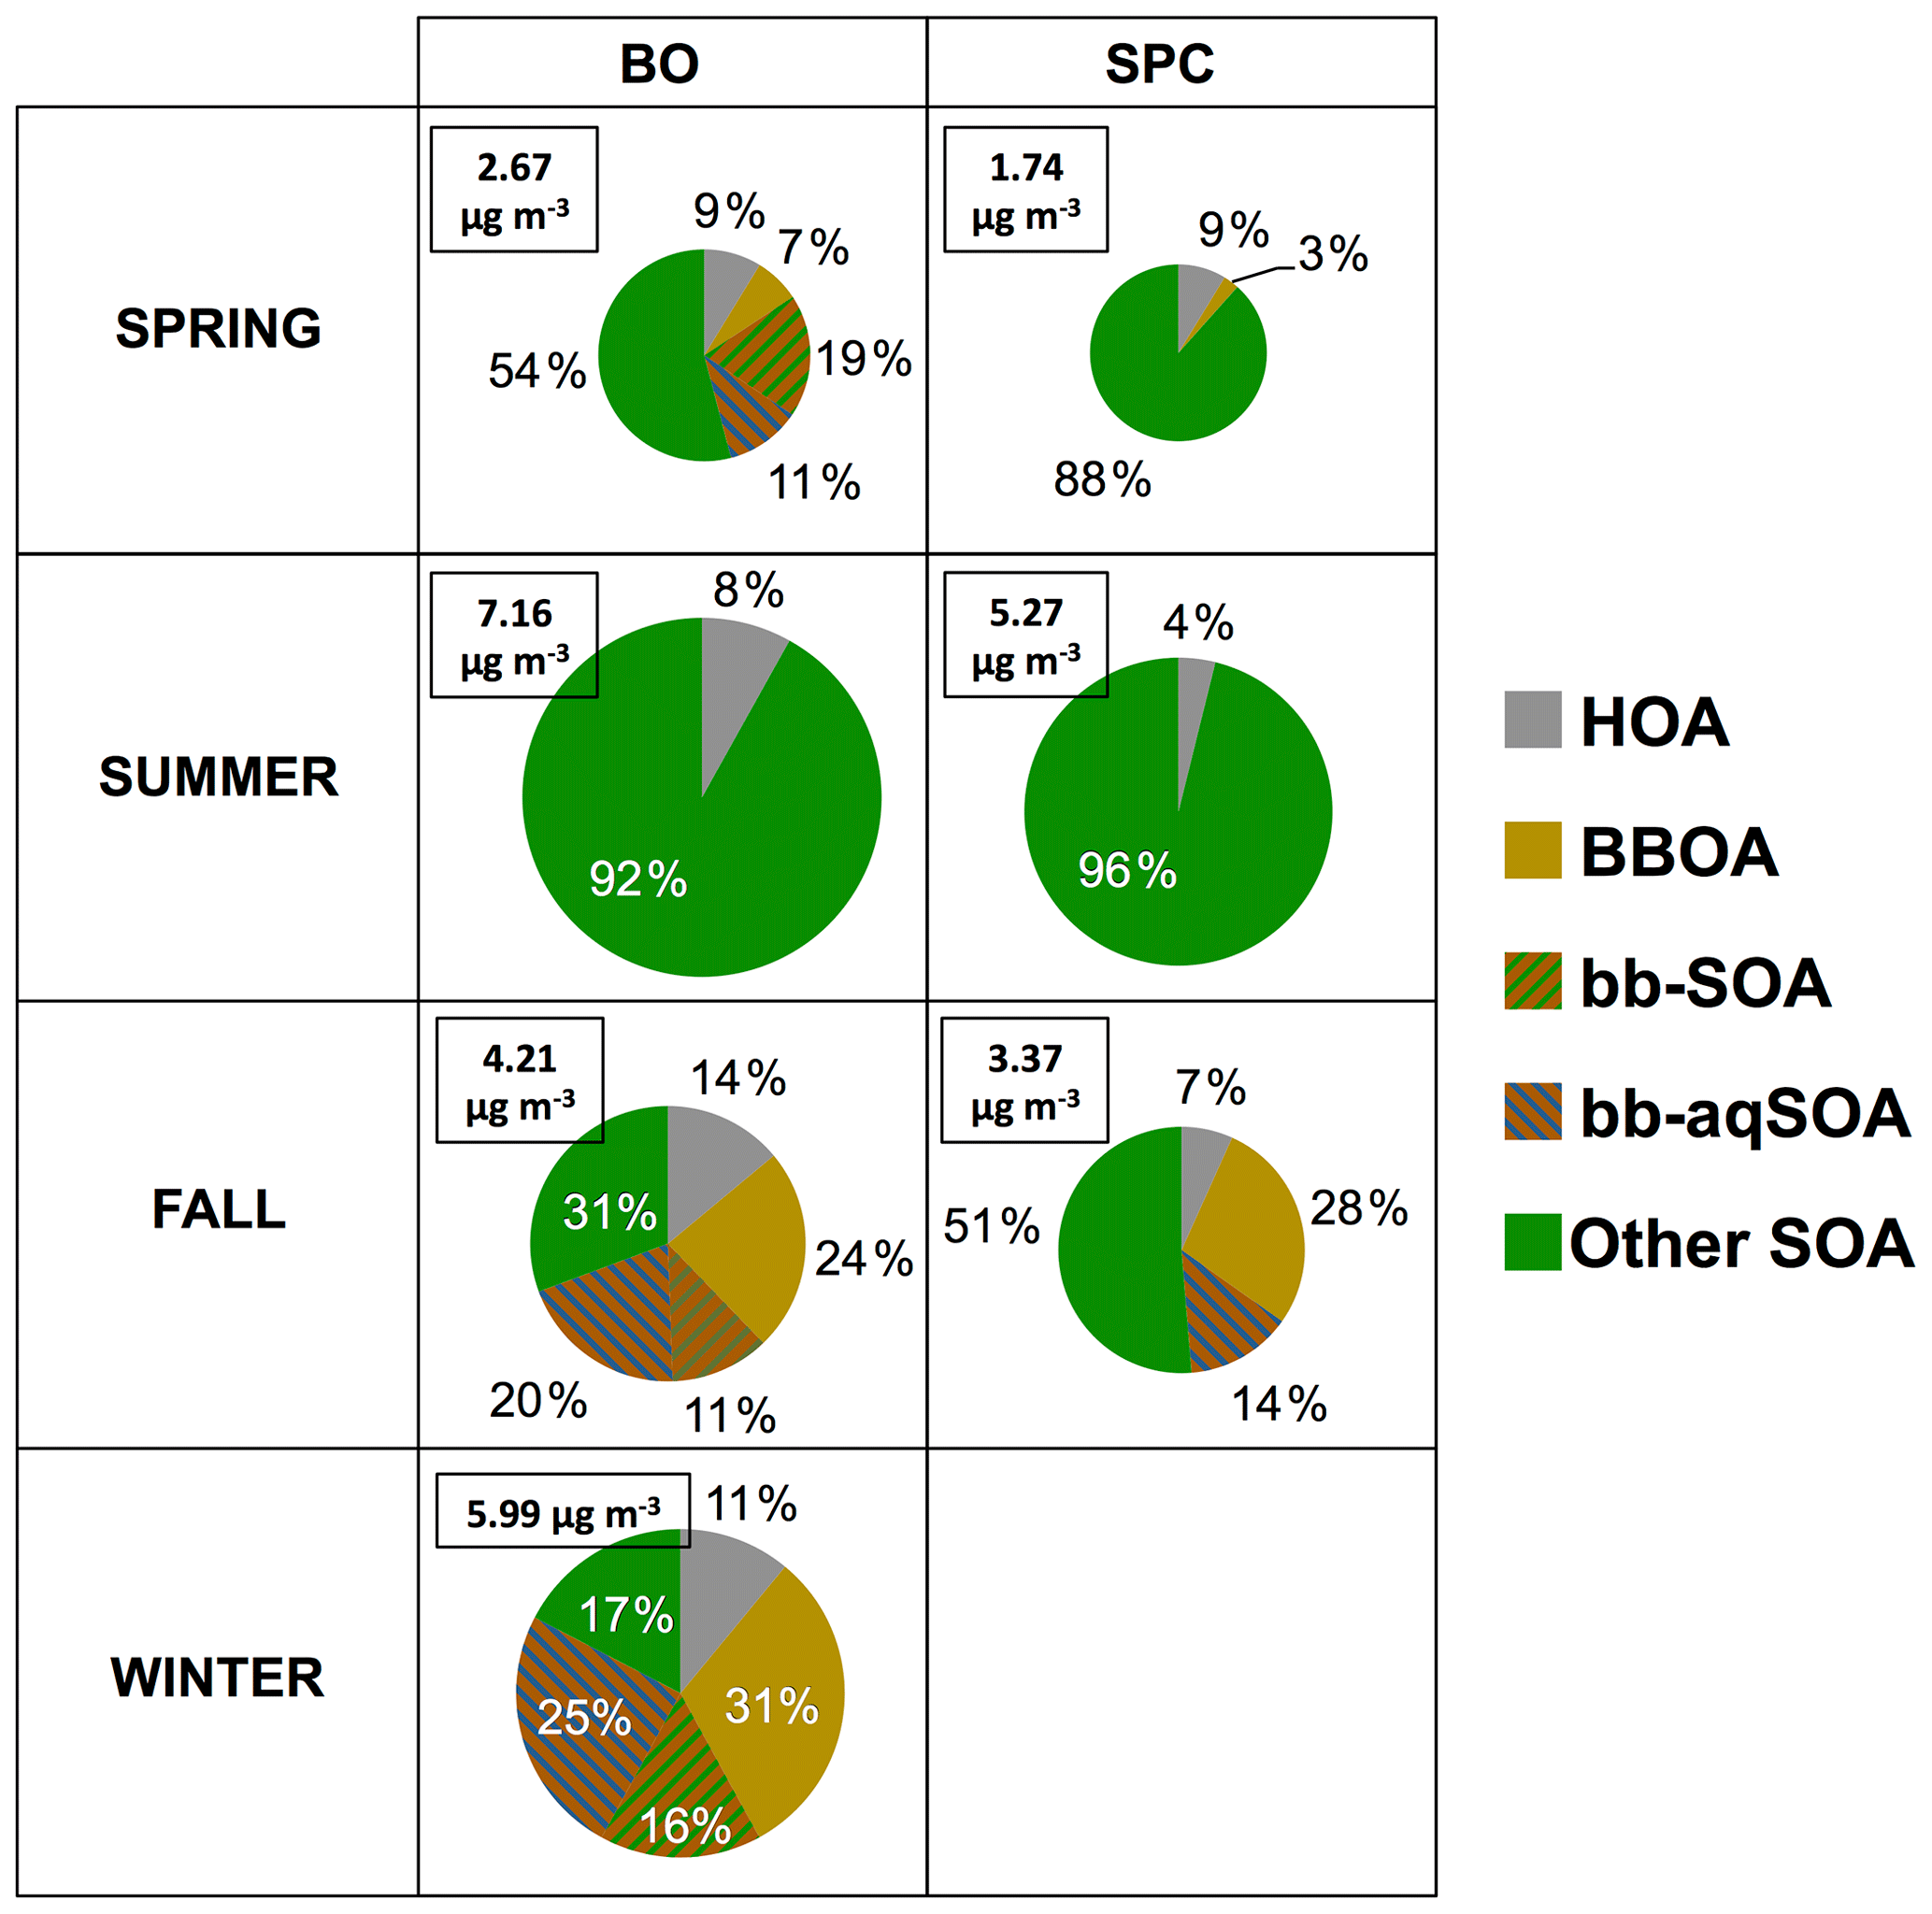
Figure 10Seasonal relative contribution of the main OA sources at both the urban and rural sites with explicit separation also of the SOA (OOA) components. The pie-chart area is proportional to the total average concentration of OA (shown on the upper-left side of each box in terms of µg m−3) and the individual portions are the averages between the different campaigns made at the site in one season. OOA factors influenced by biomass burning (characterized by a brown background color) are divided into the two categories, “bb-SOA” and “bb-aqSOA”, representing the OOAx_BB and OOAx_BB-aq described in the text. “Other SOA” is the sum of the other OOA factors whose source has not been unequivocally identified.
The Supersito project constitutes the first extensive (multi-site and multi-year) time-resolved aerosol chemical experiment in the Po Valley. Eight intensive observation periods (IOPs) were carried out over the 4 years of the project (from 2011 to 2014) at two different sites (Bologna, urban background, and San Pietro Capofiume, rural background) using a High Resolution Aerosol Mass Spectrometer (HR-AMS). The source apportionment of the OA allowed improvement of our understanding of aerosol sources, their chemical features and the spatial–temporal variability in the region, one of the most important pollution hotspots in Europe. Considering the special focus of the project on the cold season (three campaigns in fall and two in winter, out of eight in total), it was especially possible to investigate the wintertime SOA formation pathways, which are the less characterized and, for this reason, one of the most important missing processes in atmospheric chemistry and air quality models (Tsimpidi et al., 2016).
The possibility of comparing the organic factors identified by the HR-AMS with additional chemical tracers measured in parallel by other advanced spectroscopic techniques (i.e., NMR) and more traditional ones (IC, GC ∕ MS, OC ∕ EC, etc.) provided new insights into the detailed chemical structure and especially into the formation and aging mechanisms of SOA.
On the multi-year basis of the project, OA represents on average 45±8 % (33 %–58 %) and 46±7 % (36 %–50 %) of the total non-refractory submicron particles (PM1-NR) at the urban and rural sites, respectively, within the range reported in the literature for other European sites (Crippa et al., 2014) and the Asian regions (Hu et al., 2017; Li et al., 2015; Wu et al., 2018, for China and East Asia; Chakraborty et al., 2018, for India), and slightly less than the values reported for the southeastern US (50 %–75 %, Xu et al., 2015; Budisulistiorini et al., 2016). Among this fraction, primary sources (POA) are dominated by biomass burning (23±13 %), especially at the rural site (SPC), whereas the fossil fuel combustion (12±7 %) is higher at the urban background site (Bologna), where it also presents a marked seasonality. However, the biomass burning contribution to POA remains the most important source of POA also at the urban site during the cold fall/winter seasons. The BBOA contribution ranging from 17 % to 38 % at Bologna during the fall/winter seasons is not far from the values reported for other European cities (10 %–40 % in Paris, Crippa et al., 2013b; 5 %–27 % from the EUCAARI multi-site study, Crippa et al., 2014) and United States areas (e.g., 15 %–33 % for the southeastern US, Budisulistiorini et al., 2016), and slightly higher than that of other highly populated and polluted cities/regions of Asia (11 %–14 % at Beijing, China, Sun et al., 2018; 10 %–20 % at Kunpur, India, Chakraborty et al., 2018), where, however, other combustion sources (i.e., coal) contribute to the POA fraction.
The contributions of OOA (used as a proxy for SOA) were found to be much higher than the primary ones, regardless of site and season, with multi-year averages of 66 % (44 %–92 %; standard deviation SD = 16 %) and 71 % (35 %–96 %; SD = 27 %) of the total OA mass, at the urban and rural sites, respectively. The SOA dominance is also observed during winter at the urban site, where the SOA represents on average 56 % (50 %–61 %; SD = 8 %) of the total OA mass. Within this SOA, the measurements highlight the dominant presence of biomass burning secondary components, even in the urban background. The HR-AMS data indicate that the OA mass contributions of this SOA factor influenced by wood combustion were on the order of 14 %–44 %, which translates into biomass burning emissions representing the 31 %–82 % of the OM mass in the Po Valley during cold months (fall and winter). Significant contribution of aged BB emissions on the OA mass loadings has already been suggested by previous studies regarding the Po Valley (Saarikoski et al., 2012) and different European (Paris, France, Crippa et al., 2013b; eastern Mediterranean, Bougiatioti et al., 2014; Athens, Greece, Stavroulas et al., 2019), Asian (Beijing, China, Hu et al., 2017; Sun et al., 2018; Kunpur, India, Chakraborty et al., 2018) and American sites (southeastern US, Xu et al., 2015; Budisulistiorini et al., 2016). However, studies reporting the identification and quantification in ambient air of specific BB-influenced OOA factors are still very limited (Gilardoni et al., 2016; Xu et al., 2017).
Our study also identified and quantified a particularly relevant role of the aqueous-phase processing in the formation and transformation of primary biomass burning emissions. Aqueous SOA (aqSOA) factors identified as OOAx_BB-aq represent on average 21 % (14 %–28 %) and 25 % (14 %–35 %) of the total OA mass at the urban and rural sites, respectively, highlighting the importance of aqueous-phase processing for SOA formation and transformation. Considering the widespread wintertime occurrence of fog, low-level clouds and wet aerosols at many other highly populated sites enclosed in orographic basins (Benelux and Ruhr district, Paris and London basins, Cermak et al., 2009; Californian Central Valley, Baldocchi et al., 2014; Yangtze River corridor, Niu et al., 2010; and Indo-Gangetic Plain, Saraf et al., 2011), this study strongly suggests that aqueous processing can be a major driver for secondary aerosol formation in wintertime at all these sites, with important consequences for air quality policy at the global level.
These results suggest the importance of a continuous monitoring system for better characterization of biomass burning-driven pollution in the Po Valley area, using complementary measurements both routinely and through intensive campaigns in order to explore the importance of biomass burning for air quality and climate.
The data of this study are available upon request to the authors.
The supplement related to this article is available online at: https://doi.org/10.5194/acp-20-1233-2020-supplement.
MP, SG, SD, SF, and MCF designed the research; VP, SG, SD, and MCF organized the field campaigns; MP, SG, MR, LP, PM, and CC carried out the experiments and processed AMS data; MP, SG, LP, and PM performed the AMS PMF; LP, FC, and ASHP contributed to the PMF discussion and correction; MP, SG, NZ, SS, LG, DB, SF, FS, and AT collected and analyzed the aerosol samples; MP, SG, MR, and SD wrote the paper; HH, AW, and SF contributed the scientific discussion and paper correction.
The authors declare that they have no conflict of interest.
The authors acknowledge COST Action CA16109 COLOSSAL. The authors are grateful to all the ARPAE Emilia-Romagna co-workers for their support and collaboration in the realization of the field campaigns. ISAC-CNR is particularly grateful to Leone Tarozzi, Francescopiero Calzolari and all the other colleagues who collaborated in the preparation of the campaigns, the functioning of the instruments and the aerosol sampling in the field.
This research has been supported by the Regione Emilia-Romagna (grant nos. DRG 428/10 and DGR 1971/2013) and the European Commission (project PEGASOS, grant no. 265148, and project BACCHUS, grant no. 603445).
This paper was edited by Kimitaka Kawamura and reviewed by three anonymous referees.
Aiken, A. C., Salcedo, D., Cubison, M. J., Huffman, J. A., DeCarlo, P. F., Ulbrich, I. M., Docherty, K. S., Sueper, D., Kimmel, J. R., Worsnop, D. R., Trimborn, A., Northway, M., Stone, E. A., Schauer, J. J., Volkamer, R. M., Fortner, E., de Foy, B., Wang, J., Laskin, A., Shutthanandan, V., Zheng, J., Zhang, R., Gaffney, J., Marley, N. A., Paredes-Miranda, G., Arnott, W. P., Molina, L. T., Sosa, G., and Jimenez, J. L.: Mexico City aerosol analysis during MILAGRO using high resolution aerosol mass spectrometry at the urban supersite (T0) – Part 1: Fine particle composition and organic source apportionment, Atmos. Chem. Phys., 9, 6633–6653, https://doi.org/10.5194/acp-9-6633-2009, 2009.
Alfarra, M. R., Prevot, A. S. H., Szidat, S., Sandradewi, J., Weimer, S., Lanz, V. A., Schreiber, D., Mohr, M., and Baltensperger, U.: Identification of the mass spectral signature of organic aerosols from wood burning emissions, Environ. Sci. Technol., 41, 5770–5777, 2007.
Altieri, K. E., Seitzinger, S. P., Carlton, A. G., Turpin, B. J., Klein, G. C., and Marshall, A. G.: Oligomers formed through in-cloud methylglyoxal reactions: Chemical composition, properties, and mechanisms investigated by ultra-high resolution FT-ICR mass spectrometry. Atmos. Environ., 42, 1476–1490, 2008.
Andreae, M. O.: Emission of trace gases and aerosols from biomass burning – an updated assessment, Atmos. Chem. Phys., 19, 8523–8546, https://doi.org/10.5194/acp-19-8523-2019, 2019.
Baldocchi, D. and Waller, R.: Winter fog is decreasing in the fruit growing region of the Central Valley of California, Geophys. Res. Lett., 41, 3251–3256, 2014.
Belis, C. A., Karagulian, F., Larsen, B. R., and Hopke, P. K.: Critical review and meta-analysis of ambient particulate matter source apportionment using receptor models in Europe, Atmos. Environ., 69, 94–108, https://doi.org/10.1016/j.atmosenv.2012.11.009, 2013.
Bond, T. C., Anderson, T. L., and Campbell, D.: Calibration and Intercomparison of Filter-Based Measurements of Visible Light Absorption by Aerosols, Aerosol Sci. Technol. 30, 582–600, https://doi.org/10.1080/027868299304435, 1999.
Bougiatioti, A., Stavroulas, I., Kostenidou, E., Zarmpas, P., Theodosi, C., Kouvarakis, G., Canonaco, F., Prévôt, A. S. H., Nenes, A., Pandis, S. N., and Mihalopoulos, N.: Processing of biomass-burning aerosol in the eastern Mediterranean during summertime, Atmos. Chem. Phys., 14, 4793–4807, https://doi.org/10.5194/acp-14-4793-2014, 2014.
Bressi, M., Sciare, J., Ghersi, V., Bonnaire, N., Nicolas, J. B., Petit, J.-E., Moukhtar, S., Rosso, A., Mihalopoulos, N., and Féron, A.: A one-year comprehensive chemical characterisation of fine aerosol (PM2.5) at urban, suburban and rural background sites in the region of Paris (France), Atmos. Chem. Phys., 13, 7825–7844, https://doi.org/10.5194/acp-13-7825-2013, 2013.
Bressi, M., Cavalli, F., Belis, C. A., Putaud, J.-P., Fröhlich, R., Martins dos Santos, S., Petralia, E., Prévôt, A. S. H., Berico, M., Malaguti, A., and Canonaco, F.: Variations in the chemical composition of the submicron aerosol and in the sources of the organic fraction at a regional background site of the Po Valley (Italy), Atmos. Chem. Phys., 16, 12875–12896, https://doi.org/10.5194/acp-16-12875-2016, 2016.
Budisulistiorini, S. H., Baumann, K., Edgerton, E. S., Bairai, S. T., Mueller, S., Shaw, S. L., Knipping, E. M., Gold, A., and Surratt, J. D.: Seasonal characterization of submicron aerosol chemical composition and organic aerosol sources in the southeastern United States: Atlanta, Georgia,and Look Rock, Tennessee, Atmos. Chem. Phys., 16, 5171–5189, https://doi.org/10.5194/acp-16-5171-2016, 2016.
Canagaratna, M. R., Jayne, J. T., Ghertner, D. A., Herndon, S., Shi, Q., Jimenez, J. L., Silva, P. J., Williams, P., Lanni, T., Drewnick, F., Demerjian, K. L., Kolb, C. E., and Worsnop, D. R.: Chase studies of particulate emissions from in-use New York City vehicles, Aerosol Sci. Technol., 38, 555–573, 2004.
Canagaratna, M. R., Jayne, J. T., Jimenez, J. L., Allan, J. D., Alfarra, M. R., Zhang, Q., Onasch, T. B., Drewnick, F., Coe, H., Middlebrook, A., Delia, A., Williams, L. R., Trimborn, A. M., Northway, M. J., DeCarlo, P. F., Kolb, C. E., Davidovits, P., and Worsnop, D. R.: Chemical and microphysical characterization of ambient aerosols with the Aerodyne aerosol mass spectrometer, Mass Spectrom. Rev., 26, 185–222, https://doi.org/10.1002/mas.20115, 2007.
Canagaratna, M. R., Jimenez, J. L., Kroll, J. H., Chen, Q., Kessler, S. H., Massoli, P., Hildebrandt Ruiz, L., Fortner, E., Williams, L. R., Wilson, K. R., Surratt, J. D., Donahue, N. M., Jayne, J. T., and Worsnop, D. R.: Elemental ratio measurements of organic compounds using aerosol mass spectrometry: characterization, improved calibration, and implications, Atmos. Chem. Phys., 15, 253–272, https://doi.org/10.5194/acp-15-253-2015, 2015.
Canonaco, F., Crippa, M., Slowik, J. G., Baltensperger, U., and Prévôt, A. S. H.: SoFi, an IGOR-based interface for the efficient use of the generalized multilinear engine (ME-2) for the source apportionment: ME-2 application to aerosol mass spectrometer data, Atmos. Meas. Tech., 6, 3649–3661, https://doi.org/10.5194/amt-6-3649-2013, 2013.
Canonaco, F., Slowik, J. G., Baltensperger, U., and Prévôt, A. S. H.: Seasonal differences in oxygenated organic aerosol composition: implications for emissions sources and factor analysis, Atmos. Chem. Phys., 15, 6993–7002, https://doi.org/10.5194/acp-15-6993-2015, 2015.
Carbone, C., Decesari, S., Paglione, M., Giulianelli, L., Rinaldi, M., Marinoni, A., Cristofanelli, P., Didiodato, A., Bonasoni, P., Fuzzi, S., and Facchini, M. C.: 3-year chemical composition of free tropospheric PM1 at the Mt. Cimone GAW global station – South Europe – 2165 m a.s.l., Atmos. Environ., 87, 218–227, https://doi.org/10.1016/j.atmosenv.2014.01.048, 2014.
Carlton, A. G., Turpin, B. J., Altieri, K. E., Seitzinger, S., Reff, A., Lim, H.-J., and Ervens, B.: Atmospheric oxalic acid and SOA production from glyoxal: Results of aqueous photooxidation experiments. Atmos. Environ., 41, 7588–7602, 2007.
Cavalli, F., Viana, M., Yttri, K. E., Genberg, J., and Putaud, J.-P.: Toward a standardised thermal-optical protocol for measuring atmospheric organic and elemental carbon: the EUSAAR protocol, Atmos. Meas. Tech., 3, 79–89, https://doi.org/10.5194/amt-3-79-2010, 2010.
Cermak, J., Eastman, R. M., Bendix, J., and Warren S. G.: European climatology of fog and low stratus based on geostationary satellite observations, Q. J. Roy. Meteor. Soc., 135, 2125–2130, 2009.
Chakraborty, A., Mandariya, A. K., Chakraborti, R., Gupta, T., and Tripathi, S. N.: Realtime chemical characterization of post monsoon organic aerosols in a polluted urban city: Sources, composition, and comparison with other seasons, Environ Pollut., 232, 310–321, https://doi.org/10.1016/j.envpol.2017.09.079, 2018.
Chen, Q., Liu, Y. J., Donahue, N. M., Shilling, J. E., and Martin, S. T.: Particle-phase chemistry of secondary organic material: modeled compared to measured O:C and H : C elemental ratios provide constraints, Environ. Sci. Technol., 45, 4763, https://doi.org/10.1021/es104398s, 2011.
Costabile, F., Gilardoni, S., Barnaba, F., Di Ianni, A., Di Liberto, L., Dionisi, D., Manigrasso, M., Paglione, M., Poluzzi, V., Rinaldi, M., Facchini, M. C., and Gobbi, G. P.: Characteristics of brown carbon in the urban Po Valley atmosphere, Atmos. Chem. Phys., 17, 313–326, https://doi.org/10.5194/acp-17-313-2017, 2017.
Crippa, M., Haddad, I. E., Slowik, J. G., Decarlo, P. F., Mohr, C., Heringa, M. F., Chirico, R., Marchand, N., Sciare, J., Baltensperger, U., and Prevot, A. S. H.: Identification of marine and continental aerosol sources in Paris using high resolution aerosol mass spectrometry, J. Geophys. Res.-Atmos., 118, 1950–1963, https://doi.org/10.1002/jgrd.50151, 2013a.
Crippa, M., DeCarlo, P. F., Slowik, J. G., Mohr, C., Heringa, M. F., Chirico, R., Poulain, L., Freutel, F., Sciare, J., Cozic, J., Di Marco, C. F., Elsasser, M., Nicolas, J. B., Marchand, N., Abidi, E., Wiedensohler, A., Drewnick, F., Schneider, J., Borrmann, S., Nemitz, E., Zimmermann, R., Jaffrezo, J.-L., Prévôt, A. S. H., and Baltensperger, U.: Wintertime aerosol chemical composition and source apportionment of the organic fraction in the metropolitan area of Paris, Atmos. Chem. Phys., 13, 961–981, https://doi.org/10.5194/acp-13-961-2013, 2013b.
Crippa, M., Canonaco, F., Lanz, V. A., Äijälä, M., Allan, J. D., Carbone, S., Capes, G., Ceburnis, D., Dall'Osto, M., Day, D. A., DeCarlo, P. F., Ehn, M., Eriksson, A., Freney, E., Hildebrandt Ruiz, L., Hillamo, R., Jimenez, J. L., Junninen, H., Kiendler-Scharr, A., Kortelainen, A.-M., Kulmala, M., Laaksonen, A., Mensah, A. A., Mohr, C., Nemitz, E., O'Dowd, C., Ovadnevaite, J., Pandis, S. N., Petäjä, T., Poulain, L., Saarikoski, S., Sellegri, K., Swietlicki, E., Tiitta, P., Worsnop, D. R., Baltensperger, U., and Prévôt, A. S. H.: Organic aerosol components derived from 25 AMS data sets across Europe using a consistent ME-2 based source apportionment approach, Atmos. Chem. Phys., 14, 6159–6176, https://doi.org/10.5194/acp-14-6159-2014, 2014.
Cubison, M. J., Ortega, A. M., Hayes, P. L., Farmer, D. K., Day, D., Lechner, M. J., Brune, W. H., Apel, E., Diskin, G. S., Fisher, J. A., Fuelberg, H. E., Hecobian, A., Knapp, D. J., Mikoviny, T., Riemer, D., Sachse, G. W., Sessions, W., Weber, R. J., Weinheimer, A. J., Wisthaler, A., and Jimenez, J. L.: Effects of aging on organic aerosol from open biomass burning smoke in aircraft and laboratory studies, Atmos. Chem. Phys., 11, 12049–12064, https://doi.org/10.5194/acp-11-12049-2011, 2011.
Dall'Osto, M., Paglione, M., Decesari, S., Facchini, M. C., O'Dowd, C., Plass-Duellmer, C., and Harrison, R. M.: On the Origin of AMS “Cooking Organic Aerosol” at a Rural Site, Environ. Sci. Technol., 49, 13964–13972, https://doi.org/10.1021/acs.est.5b02922, 2015.
DeCarlo, P. F., Kimmel, J. R., Trimborn, A., Northway, M. J., Jayne, J. T., Aiken, A. C., Gonin, M., Fuhrer, K., Horvath, T., Docherty, K. S., Worsnop, D. R., and Jimenez, J. L.: Field-Deployable, High-Resolution, Time-of-Flight Aerosol Mass Spectrometer, Anal. Chem., 78, 8281–8289, https://doi.org/10.1021/ac061249n, 2006.
DeCarlo, P. F., Dunlea, E. J., Kimmel, J. R., Aiken, A. C., Sueper, D., Crounse, J., Wennberg, P. O., Emmons, L., Shinozuka, Y., Clarke, A., Zhou, J., Tomlinson, J., Collins, D. R., Knapp, D., Weinheimer, A. J., Montzka, D. D., Campos, T., and Jimenez, J. L.: Fast airborne aerosol size and chemistry measurements above Mexico City and Central Mexico during the MILAGRO campaign, Atmos. Chem. Phys., 8, 4027–4048, https://doi.org/10.5194/acp-8-4027-2008, 2008.
Decesari, S., Fuzzi, S., Facchini, M. C., Mircea, M., Emblico, L., Cavalli, F., Maenhaut, W., Chi, X., Schkolnik, G., Falkovich, A., Rudich, Y., Claeys, M., Pashynska, V., Vas, G., Kourtchev, I., Vermeylen, R., Hoffer, A., Andreae, M. O., Tagliavini, E., Moretti, F., and Artaxo, P.: Characterization of the organic composition of aerosols from Rondônia, Brazil, during the LBA-SMOCC 2002 experiment and its representation through model compounds, Atmos. Chem. Phys., 6, 375–402, https://doi.org/10.5194/acp-6-375-2006, 2006.
Decesari, S., Allan, J., Plass-Duelmer, C., Williams, B. J., Paglione, M., Facchini, M. C., O'Dowd, C., Harrison, R. M., Gietl, J. K., Coe, H., Giulianelli, L., Gobbi, G. P., Lanconelli, C., Carbone, C., Worsnop, D., Lambe, A. T., Ahern, A. T., Moretti, F., Tagliavini, E., Elste, T., Gilge, S., Zhang, Y., and Dall'Osto, M.: Measurements of the aerosol chemical composition and mixing state in the Po Valley using multiple spectroscopic techniques, Atmos. Chem. Phys., 14, 12109–12132, https://doi.org/10.5194/acp-14-12109-2014, 2014.
Duplissy, J., DeCarlo, P. F., Dommen, J., Alfarra, M. R., Metzger, A., Barmpadimos, I., Prevot, A. S. H., Weingartner, E., Tritscher, T., Gysel, M., Aiken, A. C., Jimenez, J. L., Canagaratna, M. R., Worsnop, D. R., Collins, D. R., Tomlinson, J., and Baltensperger, U.: Relating hygroscopicity and composition of organic aerosol particulate matter, Atmos. Chem. Phys., 11, 1155–1165, https://doi.org/10.5194/acp-11-1155-2011, 2011.
EEA: Air Quality in Europe d 2016 Report, EEA Report No 28/2016, https://www.eea.europa.eu/publications/air-quality-in-europe-2016 (last access: 14 December 2019), 2016.
Ervens, B., Turpin, B. J., and Weber, R. J.: Secondary organic aerosol formation in cloud droplets and aqueous particles (aqSOA): a review of laboratory, field and model studies, Atmos. Chem. Phys., 11, 11069–11102, https://doi.org/10.5194/acp-11-11069-2011, 2011.
Facchini, M. C., Fuzzi, S., Kessel, M., Wobrock, W., Jaeschke, W., Arends, B. G., Mols, J. J., Berner, A., Solly, I., Kruisz, C., Reischl, G., Pahl, S., Hallberg, A., Ogren, J. A., Fierlinger-Oberlinninger, H., Marzorati, A., and Schell, D.: The chemistry of sulfur and nitrogen species in a fog system. A multiphase approach, Tellus B, 44, 505–521, 1992.
Florou, K., Papanastasiou, D. K., Pikridas, M., Kaltsonoudis, C., Louvaris, E., Gkatzelis, G. I., Patoulias, D., Mihalopoulos, N., and Pandis, S. N.: The contribution of wood burning and other pollution sources to wintertime organic aerosol levels in two Greek cities, Atmos. Chem. Phys., 17, 3145–3163, https://doi.org/10.5194/acp-17-3145-2017, 2017.
Fountoukis, C. and Nenes, A.: ISORROPIA II: a computationally efficient thermodynamic equilibrium model for K+–Ca2+–Mg2+–NH4+–Na+–SO–NO–Cl−–H2O aerosols, Atmos. Chem. Phys., 7, 4639–4659, https://doi.org/10.5194/acp-7-4639-2007, 2007.
Ge, X., Zhang, Q., Sun, Y., Ruehl, C. R., and Setyan, A.: Effect of aqueous-phase processing on aerosol chemistry and size distributions in Fresno, California, during wintertime, Environ. Chem., 9, 221–235, 2012.
Gilardoni, S., Vignati, E., Cavalli, F., Putaud, J. P., Larsen, B. R., Karl, M., Stenström, K., Genberg, J., Henne, S., and Dentener, F.: Better constraints on sources of carbonaceous aerosols using a combined 14C – macro tracer analysis in a European rural background site, Atmos. Chem. Phys., 11, 5685–5700, https://doi.org/10.5194/acp-11-5685-2011, 2011.
Gilardoni, S., Massoli, P., Giulianelli, L., Rinaldi, M., Paglione, M., Pollini, F., Lanconelli, C., Poluzzi, V., Carbone, S., Hillamo, R., Russell, L. M., Facchini, M. C., and Fuzzi, S.: Fog scavenging of organic and inorganic aerosol in the Po Valley, Atmos. Chem. Phys., 14, 6967–6981, https://doi.org/10.5194/acp-14-6967-2014, 2014.
Gilardoni, S., Massoli, P., Paglione, M., Giulianelli, L., Carbone, C., Rinaldi, M., Decesari, S., Sandrini, S., Costabile, F., Gobbi, G. P., Pietrogrande, M. C., Visentin, M., Scotto, F., Fuzzi, S., and Facchini, M. C.: Direct observation of aqueous secondary organic aerosol from biomass burning emissions, P. Natl. Acad. Sci. USA, 113, 10013–10018, 2016.
Giulianelli, L., Gilardoni, S., Tarozzi, L., Rinaldi, M., Decesari, S., Carbone, C., Facchini, M. C., and Fuzzi, S.: Fog occurrence and chemical composition in the Po valley over the last twenty years, Atmos. Environ., 98, 394e401, 2014.
Grieshop, A. P., Donahue, N. M., and Robinson, A. L.: Laboratory investigation of photochemical oxidation of organic aerosol from wood fires 2: analysis of aerosol mass spectrometer data, Atmos. Chem. Phys., 9, 2227–2240, https://doi.org/10.5194/acp-9-2227-2009, 2009.
Hallquist, M., Wenger, J. C., Baltensperger, U., Rudich, Y., Simpson, D., Claeys, M., Dommen, J., Donahue, N. M., George, C., Goldstein, A. H., Hamilton, J. F., Herrmann, H., Hoffmann, T., Iinuma, Y., Jang, M., Jenkin, M. E., Jimenez, J. L., Kiendler-Scharr, A., Maenhaut, W., McFiggans, G., Mentel, Th. F., Monod, A., Prévôt, A. S. H., Seinfeld, J. H., Surratt, J. D., Szmigielski, R., and Wildt, J.: The formation, properties and impact of secondary organic aerosol: current and emerging issues, Atmos. Chem. Phys., 9, 5155–5236, https://doi.org/10.5194/acp-9-5155-2009, 2009.
Heald, C. L., Kroll, J. H., Jimenez, J. L., Docherty, K. S., DeCarlo, P. F., Aiken, A. C., Chen, Q., Martin, S. T., Farmer, D. K., and Artaxo, P.: A simplified description of the evolution of organic aerosol composition in the atmosphere, Geophys. Res. Lett., 37, L08803, https://doi.org/10.1029/2010gl042737, 2010.
Heringa, M. F., DeCarlo, P. F., Chirico, R., Tritscher, T., Dommen, J., Weingartner, E., Richter, R., Wehrle, G., Prévôt, A. S. H., and Baltensperger, U.: Investigations of primary and secondary particulate matter of different wood combustion appliances with a high-resolution time-of-flight aerosol mass spectrometer, Atmos. Chem. Phys., 11, 5945–5957, https://doi.org/10.5194/acp-11-5945-2011, 2011.
Hu, W., Hu, M., Hu, W.-W., Zheng, J., Chen, C., Wu, Y., and Guo, S.: Seasonal variations in high time-resolved chemical compositions, sources, and evolution of atmospheric submicron aerosols in the megacity Beijing, Atmos. Chem. Phys., 17, 9979–10000, https://doi.org/10.5194/acp-17-9979-2017, 2017.
Jayne, J. T., Leard, D. C., Zhang, X., Davidovits, P., Smith, K. A., Kolb, C. E., and Worsnop, D. R.: Development of an aerosol mass spectrometer for size and composition analysis of submicron particles, Aerosol Sci. Technol., 33, 49–70, 2000.
Jimenez, J. L., Jayne, J. T., Shi, Q., Kolb, C. E., Worsnop, D. R., Yourshaw, I., Seinfeld, J. H., Flagan, R. C., Zhang, X. F., Smith, K. A., Morris, J. W., and Davidovits, P.: Ambient aerosol sampling using the aerodyne aerosol mass spectrometer, J. Geophys. Res.-Atmos., 108, 447–457, https://doi.org/10.1029/2001JD001213, 2003.
Jimenez, J. L., Canagaratna, M. R., Donahue, N. M., Prevot, A. S. H., Zhang, Q., Kroll, J. H., DeCarlo, P. F., Allan, J. D., Coe, H., Ng, N. L., Aiken, A. C., Docherty, K. S., Ulbrich, I. M., Grieshop, A. P., Robinson, A. L., Duplissy, J., Smith, J. D., Wilson, K. R., Lanz, V. A., Hueglin, C., Sun, Y. L., Tian, J., Laaksonen, A., Raatikainen, T., Rautiainen, J., Vaattovaara, P., Ehn, M., Kulmala, M., Tomlinson, J. M., Collins, D. R., Cubison, M. J., Dunlea, J., Huffman, J. A., Onasch, T. B., Alfarra, M. R., Williams, P. I., Bower, K., Kondo, Y., Schneider, J., Drewnick, F., Borrmann, S., Weimer, S., Demerjian, K., Salcedo, D., Cottrell, L., Griffin, R., Takami, A., Miyoshi, T., Hatakeyama, S., Shimono, A., Sun, J. Y., Zhang, Y. M., Dzepina, K., Kimmel, J. R., Sueper, D., Jayne, J. T., Herndon, S. C., Trimborn, A. M., Williams, L. R., Wood, E. C., Middlebrook, A. M., Kolb, C. E., Baltensperger, U., and Worsnop, D. R.: Evolution of organic aerosols in the atmosphere, Science, 326, 1525–1529, https://doi.org/10.1126/science.1180353, 2009.
Kleinman, L. I., Springston, S. R., Daum, P. H., Lee, Y.-N., Nunnermacker, L. J., Senum, G. I., Wang, J., Weinstein-Lloyd, J., Alexander, M. L., Hubbe, J., Ortega, J., Canagaratna, M. R., and Jayne, J.: The time evolution of aerosol composition over the Mexico City plateau, Atmos. Chem. Phys., 8, 1559–1575, https://doi.org/10.5194/acp-8-1559-2008, 2008.
Kok, G. L., Gitlin, S. N., and Lazrus, A. L.: Kinetics of the formation and decomposition of hydroxymethanesulfonate, J. Geophys. Res.-Atmos., 91, 2801–2804, 1986.
Kostenidou, E., Lee, B.-H., Engelhart, G. J., Pierce, J. R., and Pandis, S. N.: Mass spectra deconvolution of low, medium and high volatility biogenic Secondary Organic Aerosol, Environ. Sci. Technol., 43, 4884–4889, 2009.
Lanz, V. A., Alfarra, M. R., Baltensperger, U., Buchmann, B., Hueglin, C., and Prévôt, A. S. H.: Source apportionment of submicron organic aerosols at an urban site by factor analytical modelling of aerosol mass spectra, Atmos. Chem. Phys., 7, 1503–1522, https://doi.org/10.5194/acp-7-1503-2007, 2007.
Larsen, B. R., Gilardoni, S., Stenström, K., Niedzialek, J., Jimenez, J., and Belis, C. A.: Sources for PM air pollution in the Po Plain, Italy: II. Probabilistic uncertainty characterization and sensitivity analysis of secondary and primary sources, Atmos. Environ., 50, 203–213, https://doi.org/10.1016/j.atmosenv.2011.12.038, 2012.
Lee, A. K. Y., Herckes, P., Leaitch, W. R., Macdonald, A. M., and Abbatt, J. P. D.: Aqueous OH oxidation of ambient organic aerosol and cloud water organics: Formation of highly oxidized products, Geophys. Res. Lett., 38, L11805, https://doi.org/10.1029/2011GL047439, 2011.
Lee, A. K. Y., Hayden, K. L., Herckes, P., Leaitch, W. R., Liggio, J., Macdonald, A. M., and Abbatt, J. P. D.: Characterization of aerosol and cloud water at a mountain site during WACS 2010: secondary organic aerosol formation through oxidative cloud processing, Atmos. Chem. Phys., 12, 7103–7116, https://doi.org/10.5194/acp-12-7103-2012, 2012.
Li, Y. J., Huang, D. D., Cheung, H. Y., Lee, A. K. Y., and Chan, C. K.: Aqueous-phase photochemical oxidation and direct photolysis of vanillin – a model compound of methoxy phenols from biomass burning, Atmos. Chem. Phys., 14, 2871–2885, https://doi.org/10.5194/acp-14-2871-2014, 2014.
Li, Y. J., Lee, B. P., Su, L., Fung, J. C. H., and Chan, C. K.: Seasonal characteristics of fine particulate matter (PM) based on high-resolution time-of-flight aerosol mass spectrometric (HR-ToF-AMS) measurements at the HKUST Supersite in Hong Kong, Atmos. Chem. Phys., 15, 37–53, https://doi.org/10.5194/acp-15-37-2015, 2015.
Lim, Y. B., Tan, Y., Perri, M. J., Seitzinger, S. P., and Turpin, B. J.: Aqueous chemistry and its role in secondary organic aerosol (SOA) formation, Atmos. Chem. Phys., 10, 10521–10539, https://doi.org/10.5194/acp-10-10521-2010, 2010.
Matsui, H., Koike, M., Takegawa, N., Kondo, Y., Griffin, R. J., Miyazaki, Y., Yokouchi, Y., and Ohara, T.: Secondary Organic Aerosol Formation in Urban Air: Temporal Variations and Possible Contributions from Unidentified Hydrocarbons, J. Geophys. Res., 114, D04201, https://doi.org/10.1029/2008JD010164, 2009.
Matta, E., Facchini, M. C., Decesari, S., Mircea, M., Cavalli, F., Fuzzi, S., Putaud, J.-P., and Dell’Acqua, A.: Mass closure on the chemical species in size-segregated atmospheric aerosol collected in an urban area of the Po Valley, Italy, Atmos. Chem. Phys., 3, 623–637, https://doi.org/10.5194/acp-3-623-2003, 2003.
McNeill, V. F.: Aqueous Organic Chemistry in the Atmosphere: Sources and Chemical Processing of Organic Aerosols, Environ. Sci. Technol., 49, 1237–1244, https://doi.org/10.1021/es5043707, 2015.
Middlebrook, A. M., Bahreini, R., Jimenez, J. L., and Canagaratna, M. R.: Evaluation of composition-dependent collection efficiencies for the Aerodyne aerosol mass spectrometer using field data, Aerosol Sci. Technol., 46, 258–271, https://doi.org/10.1080/02786826.2011.620041, 2012.
Mohr, C., DeCarlo, P. F., Heringa, M. F., Chirico, R., Slowik, J. G., Richter, R., Reche, C., Alastuey, A., Querol, X., Seco, R., Peñuelas, J., Jiménez, J. L., Crippa, M., Zimmermann, R., Baltensperger, U., and Prévôt, A. S. H.: Identification and quantification of organic aerosol from cooking and other sources in Barcelona using aerosol mass spectrometer data, Atmos. Chem. Phys., 12, 1649–1665, https://doi.org/10.5194/acp-12-1649-2012, 2012.
Montero-Martínez, G., Rinaldi, M., Gilardoni, S., Giulianelli, L., Paglione, M., Decesari, S., Fuzzi, S., and Facchini, M. C.: On the water-soluble organic nitrogen concentration and mass size distribution during the fog season in the Po Valley, Italy, Sci. Total Environ., 485-486, 103–109, 2014.
Ng, N. L., Canagaratna, M. R., Zhang, Q., Jimenez, J. L., Tian, J., Ulbrich, I. M., Kroll, J. H., Docherty, K. S., Chhabra, P. S., Bahreini, R., Murphy, S. M., Seinfeld, J. H., Hildebrandt, L., Donahue, N. M., DeCarlo, P. F., Lanz, V. A., Prévôt, A. S. H., Dinar, E., Rudich, Y., and Worsnop, D. R.: Organic aerosol components observed in Northern Hemispheric datasets from Aerosol Mass Spectrometry, Atmos. Chem. Phys., 10, 4625–4641, https://doi.org/10.5194/acp-10-4625-2010, 2010.
Ng, N. L., Canagaratna, M. R., Jimenez, J. L., Zhang, Q., Ulbrich, I. M., and Worsnop, D. R.: Real-time methods for estimating organic component mass concentrations from aerosol mass spectrometer data, Environ. Sci. Technol., 45, 910–916, 2011.
Niu, F., Li, Z., Li, C., Lee, K.-H., and Wang, M.: Increase of wintertime fog in China: Potential impacts of weakening of the Eastern Asian monsoon circulation and increasing aerosol loading J. Geophys. Res., 115, D00K20, https://doi.org/10.1029/2009JD013484, 2010.
Paatero, P. and Tapper, U.: Positive matrix factorization – a nonnegative factor model with optimal utilization of error-estimates of data values, Environmetrics, 5, 111–126, https://doi.org/10.1002/env.3170050203, 1994.
Paatero, P.: The multilinear engine – A table-driven, least squares program for solving multilinear problems, including the n-way parallel factor analysis model, J. Comput. Graph. Stat., 8, 854–888, https://doi.org/10.2307/1390831, 1999.
Paatero, P.: User's guide for the multilinear engine program “ME2” for fitting multilinear and quasimultilinear models, University of Helsinki, Finland, 2000.
Paglione, M., Saarikoski, S., Carbone, S., Hillamo, R., Facchini, M. C., Finessi, E., Giulianelli, L., Carbone, C., Fuzzi, S., Moretti, F., Tagliavini, E., Swietlicki, E., Eriksson Stenström, K., Prévôt, A. S. H., Massoli, P., Canaragatna, M., Worsnop, D., and Decesari, S.: Primary and secondary biomass burning aerosols determined by proton nuclear magnetic resonance (1H-NMR) spectroscopy during the 2008 EUCAARI campaign in the Po Valley (Italy), Atmos. Chem. Phys., 14, 5089–5110, https://doi.org/10.5194/acp-14-5089-2014, 2014.
Perrone, M. G., Larsen, B. R., Ferrero, L., Sangiorgi, G., De Gennaro, G., Udisti, R., Zangrando, R., Gambaro, A., and Bolzacchini, E.: Sources of high PM2.5 concentrations in Milan, northern Italy: molecular marker data and CMB modelling, Sci. Total Environ., 414, 343–355, https://doi.org/10.1016/j.scitotenv.2011.11.026, 2012.
Pieber, S. El Haddad, I., Slowik, J. G, Canagaratna, M. R., Jayne, J. T., Platt, S. M., Bozzetti, C., Daellenbach, K. R., Fröhlich, R., Vlachou, A., Klein, F., Dommen, J., Miljevic, B., Jiménez, J. L., Worsnop, D. R., Baltensperger, U., and Prévôt, A. S. H.: Inorganic salt interference on CO in aerodyne AMS and ACSM organic aerosol composition studies, Environ. Sci. Technol., 50, 10494–10503, 2016.
Pietrogrande, M. C., Bacco, D., Visentin, M., Ferrari, S., and Poluzzi, V.: Polar organic marker compounds in atmospheric aerosol in the Po Valley during the Supersito campaigns – Part 1: low molecular weight carboxylic acids in cold seasons, Atmos. Environ., 86, 164–175, 2014.
Putaud, J. P., Van Dingenen, R., and Raes, F.: Submicron aerosol mass balance at urban and semirural sites in the Milan area (Italy), J. Geophys. Res.-Atmos., 107, 8198, https://doi.org/10.1029/2000JD000111, 2002.
Putaud, J. P., Van Dingenen, R., Alastuey, A., Bauer, H., Birmili,W., Cyrys, J., Flentje, H., Fuzzi, S., Gehrig, R., Hansson, H. C., Harrison, R. M., Herrmann, H., Hitzenberger, R., Hueglin, C., Jones, A. M., Kasper-Giebl, A., Kiss, G., Kousa, A., Kuhlbusch, T. A. J., Loeschau, G., Maenhaut, W., Molnar, A., Moreno, T., Pekkanen, J., Perrino, C., Pitz, M., Puxbaum, H., Querol, X., Rodriguez, S., Salma, I., Schwarz, J., Smolik, J., Schneider, J., Spindler, G., ten Brink, H., Tursic, J., Viana, M., Wiedensohler, A., and Raes, F.: A European aerosol phenomenology-3: Physical and chemical characteristics of particulate matter from 60 rural, urban, and kerbside sites across Europe, Atmos. Environ., 44, 1308–1320, 2010.
Ricciardelli, I., Bacco, D., Rinaldi, M., Bonafe, G., Scotto, F., Trentini, A., Bertacci, G., Ugolini, P., Zigola, C., Rovere, F., Maccone, C., Pironi, C., and Poluzzi, V.: A three-year investigation of daily PM2.5 main chemical components in four sites: the routine measurement program of the Super-sito Project (Po Valley, Italy), Atmos. Environ., 152, 418–430, https://doi.org/10.1016/j.atmosenv.2016.12.052, 2017.
Rinaldi, M., Gilardoni, S., Paglione, M., Sandrini, S., Fuzzi, S., Massoli, P., Bonasoni, P., Cristofanelli, P., Marinoni, A., Poluzzi, V., and Decesari, S.: Organic aerosol evolution and transport observed at Mt. Cimone (2165 m a.s.l.), Italy, during the PEGASOS campaign, Atmos. Chem. Phys., 15, 11327–11340, https://doi.org/10.5194/acp-15-11327-2015, 2015.
Saarikoski, S., Carbone, S., Decesari, S., Giulianelli, L., Angelini, F., Canagaratna, M., Ng, N. L., Trimborn, A., Facchini, M. C., Fuzzi, S., Hillamo, R., and Worsnop, D.: Chemical characterization of springtime submicrometer aerosol in Po Valley, Italy, Atmos. Chem. Phys., 12, 8401–8421, https://doi.org/10.5194/acp-12-8401-2012, 2012.
Sandrini, S., van Pinxteren, D., Giulianelli, L., Herrmann, H., Poulain, L., Facchini, M. C., Gilardoni, S., Rinaldi, M., Paglione, M., Turpin, B. J., Pollini, F., Bucci, S., Zanca, N., and Decesari, S.: Size-resolved aerosol composition at an urban and a rural site in the Po Valley in summertime: implications for secondary aerosol formation, Atmos. Chem. Phys., 16, 10879–10897, https://doi.org/10.5194/acp-16-10879-2016, 2016.
Saraf, A. K., Bora, A. K., Das, J., Rawat, V., Sharma, K., and Jain, S. K.: Winter fog over the Indo-Gangetic Plains: Mapping and modelling using remote sensing and GIS, Nat. Hazards, 58, 199–220, https://doi.org/10.1007/s11069-010-9660-0, 2011.
Schauer, J. J., Kleeman, M. J., Cass, G. R., and Simoneit, B. R. T.: Measurement of emissions from air pollution sources, 3. C1-C29 organic compounds from fireplace combustion of wood, Environ. Sci. Technol., 35, 1716–1728, 2001.
Schneider, J., Weimer, S., Drewnick, F., Borrmann, S., Helas, G., Gwaze, P., Schmid, O., Andreae, M. O., and Kirchner, U.: Mass spectrometric analysis and aerodynamic properties of various types of combustion-related aerosol particles, Int. J. Mass. Spec., 258, 37–49, 2006.
Stanier, C., Singh, A., Adamski, W., Baek, J., Caughey, M., Carmichael, G., Edgerton, E., Kenski, D., Koerber, M., Oleson, J., Rohlf, T., Lee, S. R., Riemer, N., Shaw, S., Sousan, S., and Spak, S. N.: Overview of the LADCO winter nitrate study: hourly ammonia, nitric acid and PM2.5 composition at an urban and rural site pair during PM2.5 episodes in the US Great Lakes region, Atmos. Chem. Phys., 12, 11037–11056, https://doi.org/10.5194/acp-12-11037-2012, 2012.
Stavroulas, I., Bougiatioti, A., Grivas, G., Paraskevopoulou, D., Tsagkaraki, M., Zarmpas, P., Liakakou, E., Gerasopoulos, E., and Mihalopoulos, N.: Sources and processes that control the submicron organic aerosol composition in an urban Mediterranean environment (Athens): a high temporal-resolution chemical composition measurement study, Atmos. Chem. Phys., 19, 901–919, https://doi.org/10.5194/acp-19-901-2019, 2019.
Sullivan, A. P., Hodas, N., Turpin, B. J., Skog, K., Keutsch, F. N., Gilardoni, S., Paglione, M., Rinaldi, M., Decesari, S., Facchini, M. C., Poulain, L., Herrmann, H., Wiedensohler, A., Nemitz, E., Twigg, M. M., and Collett Jr., J. L.: Evidence for ambient dark aqueous SOA formation in the Po Valley, Italy, Atmos. Chem. Phys., 16, 8095–8108, https://doi.org/10.5194/acp-16-8095-2016, 2016.
Sun, Y. L., Zhang, Q., Anastasio, C., and Sun, J.: Insights into secondary organic aerosol formed via aqueous-phase reactions of phenolic compounds based on high resolution mass spectrometry, Atmos. Chem. Phys., 10, 4809–4822, https://doi.org/10.5194/acp-10-4809-2010, 2010.
Sun, Y., Xu, W., Zhang, Q., Jiang, Q., Canonaco, F., Prévôt, A. S. H., Fu, P., Li, J., Jayne, J., Worsnop, D. R., and Wang, Z.: Source apportionment of organic aerosol from 2-year highly time-resolved measurements by an aerosol chemical speciation monitor in Beijing, China, Atmos. Chem. Phys., 18, 8469–8489, https://doi.org/10.5194/acp-18-8469-2018, 2018.
Timonen, H., Carbone, S., Aurela, M., Saarnio, K., Saarikoski, S., Ng, N. L., Canagaratna, M. R., Kulmala, M., Kerminen, V.-M., Worsnop, D. R., and Hillamo, R.: Characteristics, sources and water-solubility of ambient submicron organic aerosol in springtime in Helsinki, Finland, J. Aerosol Sci., 56, 61–77, https://doi.org/10.1016/j.jaerosci.2012.06.005, 2013.
Tsimpidi, A. P., Karydis, V. A., Pandis, S. N., and Lelieveld, J.: Global combustion sources of organic aerosols: model comparison with 84 AMS factor-analysis data sets, Atmos. Chem. Phys., 16, 8939–8962, https://doi.org/10.5194/acp-16-8939-2016, 2016.
Ulbrich, I. M., Canagaratna, M. R., Zhang, Q., Worsnop, D. R., and Jimenez, J. L.: Interpretation of organic components from Positive Matrix Factorization of aerosol mass spectrometric data, Atmos. Chem. Phys., 9, 2891–2918, https://doi.org/10.5194/acp-9-2891-2009, 2009.
Ulbrich, I. M., Lechner, M., and Jimenez, J. L.: AMS Spectral Database, available at: http://cires.colorado.edu/jimenez-group/AMSsd/, last access: 7 October 2015.
Whiteaker, J. R. and Prather K. A.: Hydroxymethanesulfonate as a tracer for fog processing of individual aerosol particles, Atmos. Environ., 37, 1033–1043, 2003.
WHO: European Detailed Mortality Database, Update July 2016, WHO Regional Office for Europe, Copenhagen, available at: http://data.euro.who.int/dmdb/ (last access: April 2019), 2016.
Wu, X., Vu, T. V., Shi, Z., Harrison, R. M., Liu, D., and Cen, K.: Characterization and source apportionment of carbonaceous PM2.5 particles in China – a review, Atmos. Environ., 189, 187–212, 2018.
Xu, L., Suresh, S., Guo, H., Weber, R. J., and Ng, N. L.: Aerosol characterization over the southeastern United States using high-resolution aerosol mass spectrometry: spatial and seasonal variation of aerosol composition and sources with a focus on organic nitrates, Atmos. Chem. Phys., 15, 7307–7336, https://doi.org/10.5194/acp-15-7307-2015, 2015.
Xu, W., Han, T., Du, W., Wang, Q., Chen, C., Zhao, J., Zhang, Y., Li, J., Fu, P., Wang, Z., Worsnop, D. R., and Sun, Y.: Effects of Aqueous-Phase and Photochemical Processing on Secondary Organic Aerosol Formation and Evolution in Beijing, China, Environ. Sci. Technol., 51, 762–770, https://doi.org/10.1021/acs.est.6b04498, 2017.
Yu, L., Smith, J., Laskin, A., Anastasio, C., Laskin, J., and Zhang, Q.: Chemical characterization of SOA formed from aqueous-phase reactions of phenols with the triplet excited state of carbonyl and hydroxyl radical, Atmos. Chem. Phys., 14, 13801–13816, https://doi.org/10.5194/acp-14-13801-2014, 2014.
Zhang, Q., Jimenez, J. L., Canagaratna, M. R., Allan, J. D., Coe, H., Ulbrich, I., Alfarra, M. R., Takami, A., Middlebrook, A. M., Sun, Y. L., Dzepina, K., Dunlea, E., Docherty, K., DeCarlo, P. F., Salcedo, D., Onasch, T., Jayne, J. T., Miyoshi, T., Shimono, A., Hatakeyama, S., Takegawa, N., Kondo, Y., Schneider, J., Drewnick, F., Borrmann, S., Weimer, S., Demerjian, K., Williams, P., Bower, K., Bahreini, R., Cottrell, L., Griffin, R. J., Rautiainen, J., Sun, J. Y., Zhang, Y. M., and Worsnop, D. R.: Ubiquity and dominance of oxygenated species in organic aerosols in anthropogenically-influenced Northern Hemisphere midlatitudes, Geophys. Res. Lett., 34, L13801, https://doi.org/10.1029/2007GL029979, 2007.
Zhang, Q., Jimenez, J. L., Canagaratna, M. R., Ulbrich, I. M., Ng, N. L., Worsnop, D. R., and Sun, Y.: Understanding atmospheric organic aerosols via factor analysis of aerosol mass spectrometry: a review, Anal. Bioanal. Chem., 401, 3045–3067, https://doi.org/10.1007/s00216-011-5355-y, 2011.