the Creative Commons Attribution 4.0 License.
the Creative Commons Attribution 4.0 License.
 | 28 Oct 2020
Decennial time trends and diurnal patterns of particle number concentrations in a central European city between 2008 and 2018
Zoltán Németh
Veronika Varga
Tamás Weidinger
Ville Leinonen
Taina Yli-Juuti
Multiple atmospheric properties were measured semi-continuously in the Budapest platform for Aerosol Research and Training laboratory, which represents the urban background for the time interval of 2008–2018. Data of 6 full measurement years during a decennial time interval were subjected to statistical time trend analyses by an advanced dynamic linear model and a generalized linear mixed model. The main interest in the analysed data set was on particle number concentrations in the diameter ranges from 6 to 1000 nm (N6−1000), from 6 to 100 nm (N6−100, ultrafine particles), from 25 to 100 nm (N25−100) and from 100 to 1000 nm (N100−1000). These data were supported by concentrations of SO2, CO, NO, NOx, O3, PM10 mass, as well as air temperature, relative humidity, wind speed, atmospheric pressure, global solar radiation, condensation sink, gas-phase H2SO4 proxy, classes of new aerosol particle formation (NPF), and growth events and meteorological macro-circulation patterns. The trend of the particle number concentrations derived as a change in the statistical properties of background state of the data set decreased in all size fractions over the years. Most particle number concentrations showed decreasing decennial statistical trends. The estimated annual mean decline of N6−1000 was (4–5) % during the 10-year measurement interval, which corresponds to a mean absolute change of −590 cm−3 in a year. This was interpreted as a consequence of the decreased anthropogenic emissions at least partly from road traffic alongside household heating and industry. Similar trends were not observed for the air pollutant gases. Diurnal statistical patterns of particle number concentrations showed tendentious variations, which were associated with a typical diurnal activity–time pattern of inhabitants in cities, particularly of vehicular road traffic. The trend patterns for NPF event days contained a huge peak from late morning to late afternoon, which is unambiguously caused by NPF and growth processes. These peaks were rather similar to each other in the position, shape and area on workdays and holidays, which implies that the dynamic and timing properties of NPF events are not substantially influenced by anthropogenic activities in central Budapest. The diurnal pattern for N25−100 exhibited the largest relative changes, which were related to particle emissions from high-temperature sources. The diurnal pattern for N100−1000 – which represents chemically and physically aged particles of larger spatial scale – were different from the diurnal patterns for the other size fractions.
- Article
(280 KB) - Full-text XML
-
Supplement
(172 KB) - BibTeX
- EndNote


Atmospheric aerosol can be characterized by various properties. There are several important phenomena and processes in which individual particles play a role. In these cases, particle number concentrations or particle number size distributions are the relevant metrics. Number concentrations of (insoluble) particles produce adverse effects on human health (Oberdörster et al., 2005; Rich et al., 2012; Cassee et al., 2013; Braakhuis et al., 2014; Ostro et al., 2015; Schmid and Stoeger, 2016; Ohlwein et al., 2019). Individual particles and their properties are also important in cloud formation processes and, therefore, in indirect aerosol climate forcing (Makkonen et al., 2009; Merikanto et al., 2009; Sihto et al., 2011; Kerminen et al., 2012; Carslaw et al., 2013; Gordon et al., 2016). Particle numbers and associated size distributions are relevant properties in several optical interactions in the atmosphere (e.g. Moosmuller et al., 2009) and in various surface-controlled chemical reactions (e.g. Pöschl et al., 2007).
In the global troposphere, it is the new aerosol particle formation (NPF) and consecutive growth process that is the dominant source of particle numbers (Spracklen et al., 2006; Yu et al., 2010; Kulmala et al., 2013; Dunne et al., 2016). This source type occurs in various atmospheric environments around the world and produces secondary particles (Kerminen et al., 2018, and references therein). The major anthropogenic source of (primary) particles is combustion. It includes traffic exhaust mainly from diesel engines, fuel or waste burning in industrial and domestic installations, and residential heating and cooking (Paasonen et al., 2016; Masiol et al., 2018). Nanotechnology and its products can have importance in some limited or occupational environments. In large cities and in longer time intervals, primary particles often prevail over secondary particles (Brines et al., 2015; Salma et al., 2017; Saha et al., 2018).
Ultrafine (UF) particles (with a diameter d<100 nm) account for most of the particle number concentrations but have usually negligible contribution to particulate matter (PM) mass. This implies that particle numbers are not covered by legislative regulations on the ambient air quality, which are ordinary based on the PM mass. Particle number concentrations have not been promulgated among the air quality standards yet. There are, however, mitigation policies and control regulations which intend to reduce their ambient levels as part of an overall air-quality improvement strategy since the 1990s. The legislations, for instance in the EU including Hungary, focuses on the particle emissions from diesel engines (Giechaskiel et al., 2018). There were some important changes in the car emissions during the time interval under investigation in this study. These included the introduction of Euro 5 and Euro 6 regulations for light-duty vehicles in January 2011 and Euro VI regulations for heavy-duty vehicles in September 2015 (the number of emitted particles with diameters >23 nm should be <6 × 10¹¹ km−1 for type approval). A prerequisite for the efficient operation of exhaust after treatment devices is having fuel with low sulfur content. The reduction of sulfur in diesel fuel for on-road transport was decreased after several previous phases to <10 ppm in January 2009 (Directive 2009/30/EC, 2009). Sulfur content in fuels for mobile non-road diesel vehicles – including mobile machinery, agricultural and forestry tractors, inland waterway vessels, and recreational crafts – was limited at a level of 1000 ppm from 2008 and at 10 ppm from 2011. Unsuitable and dangerous fuel types for domestic heating are also listed, their emission factors are determined, and the accumulated information is disseminated among potential users. As far as secondary particles are concerned, it is not straightforward to reduce their concentration levels, because the effects of gaseous and aerosol species on NPF are complex and uncertain due to the non-linear relationship and feedbacks in their related processes.
It is relevant to investigate the potential changes, namely overall and diurnal tendencies of particle number concentrations from different sources, on longer timescales because of their role in both health risks and climate change issues. The major source types of particle numbers can be separated by measuring their size distributions. Atmospheric NPF events produce particles of the nucleation mode, which occurs intermittently, and which gradually merges into the larger Aitken mode. High-temperature emission sources ordinarily produce Aitken-mode particles, while transformation processes (physical and chemical ageing) of existing particles in the atmosphere give rise to the accumulation mode. An important property of the nucleation- and Aitken-mode particles is that their residence time is limited to several hours (Raes et al., 2000; Salma et al., 2011, 2016b). This is different from accumulation-mode particles, which reside in the air up to 7 d. This means that the particles of the former two modes are present in the air until their sources are active, and their concentrations can change substantially and rapidly over a day (e.g. Mikkonen et al., 2011a; Salma et al., 2014, 2017; Paasonen et al., 2016). This is advantageous when source types are to be identified or quantified. At the same time, the relatively short residence time is not beneficial when time trends are to be studied and derived. The limited residence time can cause additional, substantial and sudden variability in time with or without time patterns, which can complicate the evaluation.
Particle number concentrations or particle number size distributions in the relevant diameter range (i.e. from a few nanometres to ca. 1 µm) are measured for various purposes. They include fundamental studies on atmospheric nucleation and particle growth phenomena, which usually require semi-continuous long-term measurements. The related experimental data sets have been accumulating gradually (Wehner and Wiedensohler, 2003; Asmi et al., 2013; Kerminen et al., 2018; Nieminen et al., 2018). They can also be exploited for time trend analysis by using appropriate statistical models. At present, however, knowledge on time trends particularly in various size fractions and over several years is largely lacking with few recent exceptions (Masiol et al., 2018; Saha et al., 2018; Sun et al., 2020).
Research activities dedicated to NPF and growth events in Budapest have been going on since November 2008. Measurements for 6 full years were realized in the city centre at a single fixed location. Semi-continuous and critically evaluated data sets consisting of particle number size distributions, concentrations of criteria air pollutants and meteorological data were available for the study. They were combined into a coherent set, which was utilized in two statistical models developed specifically to determine the time trends for particle number concentrations in several important size fractions from 2008 to 2018. The main objectives of this study are to present and discuss the statistical models, to interpret their results on time trends and diurnal variability, to quantify the change rates, and to relate the temporal tendencies to different atmospheric sources, processes, and environmental circumstances.
2.1 Measurements
Most experimental data in the present study were obtained at a single urban site, namely at the Budapest platform for Aerosol Research and Training (BpART) laboratory (47∘28′29.9′′ N, 19∘3′44.6′′ E; 115 m above mean sea level). This location represents a well-mixed average atmospheric environment for the city centre of Budapest due to its geographical and meteorological conditions (Salma et al., 2016a); thus, it can be regarded as an urban background site. The local emissions include diffuse urban traffic exhaust, household or residential emissions, and limited industrial sources together with some off-road transport (diesel rail, shipping and aeroplane emissions). Experimental data for six full-year-long time intervals, i.e. from 3 November 2008 to 2 November 2009, from 13 November 2013 to 12 November 2014, from 13 November 2014 to 12 November 2015, from 13 November 2015 to 12 November 2016, from 28 January 2017 to 27 January 2018 and from 28 January 2018 to 27 January 2019, were available for this single site. A decennial time interval from 3 November 2008 to 2 November 2018 was considered in the statistical analysis. Local time (LT = UTC+1 or daylight-saving time, UTC+2) was chosen as the time base of the data processing, because the ordinary daily activities of inhabitants substantially influence the atmospheric concentrations and several processes in cities (Salma et al., 2014).
The major aerosol measuring system was a flow-switching-type differential mobility particle sizer (DMPS; Aalto et al., 2001). It records particle number concentrations in an electrical mobility diameter range from 6 to 1000 nm in the dry state of particles (with a relative humidity RH <30 %) in 30 channels (Salma et al., 2011). The measuring system was updated twice: in spring 2013 and winter 2016. However, its major parts including a differential mobility analyser (DMA, Hauke-type analyser with a length of 28 cm) and a condensation particle counter (CPC, TSI model 3775) remained unchanged; they were cleaned and serviced. The diameter resolution of the DMA was also calibrated during the updates. Several data validation or comparative exercises were realized over the years; the most extensive inter-comparison was realized in summer 2015 and autumn 2019. First, the measured data by the CPC deployed in the DMPS system were compared to those of an identical stand-alone CPC operated in parallel. The agreement between the instruments was in accordance with the nominal specification of CPCs. As the next step, the integrated concentrations obtained from the size-resolved DMPS data were compared to the concentrations measured directly by the stand-alone CPC. The two instruments were again operated in parallel. The median CPC/DMPS ratio was utilized as correction factor for particle diffusion losses in the DMPS system (Salma et al., 2016a). The time resolution of the DMPS measurements was approximately 10 min in the year 2008–2009, and it was 8 min from 13 November 2013 on. The sampling inlet was installed at a height of 12.5 m above the street level. There was no upper-size cut-off inlet applied to the sampling line, and a rain shield and insect net were only adopted. The measurements were performed according to the international technical standard (Wiedensohler et al., 2012).
Meteorological data for air temperature (T), relative humidity (RH), wind speed (WS), wind direction and atmospheric pressure (p) were obtained from a measurement station of the Hungarian Meteorological Service (HMS), which was operated at a distance of ca. 70 m from the BpART laboratory by standardized methods (Vaisala HMP45D humidity and temperature probe, Vaisala WAV15A anemometer and Vaisala pressure, all from Finland) with a time resolution of 10 min. Global solar radiation (GRad) data were measured by a CMP11 pyranometer (Kipp & Zonen, the Netherlands) at another station of the HMS situated 10 km in the eastern direction with a time resolution of 1 h. Concentrations of pollutants SO2, CO, NO, NOx, O3 and PM10 mass were acquired from a measurement station of the National Air Quality Network in Budapest in Széna Square, which is located in the prevailing upwind direction at a distance of 4.5 km from the BpART laboratory. This station ordinarily measures the smallest levels of the criteria air pollutants among the four monitoring stations located in the city centre. It can, therefore, be considered to represent the air pollution in between the urban background and street level or kerbside site. They are measured by UV fluorescence (Ysselbach 43C), IR absorption (Ysselbach 48C), chemiluminescence (Thermo 42C), UV absorption (Ysselbach 49C) and beta-ray attenuation (Thermo 5014I) methods with a time resolution of 1 h.
The availability percentages of the DMPS data over the six 1-year time intervals were 95 %, 99 %, 95 %, 73 %, 99 % and 90 %. The meteorological data were accessible in >90 % of the time in each year, while the concentration data for key pollutants were available in >85 % of the yearly time intervals.
2.2 Data treatment
Particle number concentrations in the diameter ranges (1) from 6 to 1000 nm (N6−1000), (2) from 6 to 100 nm (N6−100), (3) from 25 to 100 nm (N25−100) and (4) from 100 to 1000 nm (N100−1000) were calculated from the measured and inverted DMPS data. The size ranges were selected to represent (1) the total particles, (2) UF particles, (3) UF particles emitted mainly from incomplete combustion (and partially grown by condensation; this size range is dominated by primary particles in cities most of the time) and (4) physically and chemically aged particles which usually represent a larger spatial extent, respectively (Salma et al., 2014, 2017).
Condensation sink (CS) for vapour molecules onto the surface of existing aerosol particles was calculated for discrete size distributions (Kulmala et al., 2001, 2012; Dal Maso et al., 2002, 2005). Dry particle diameters were considered in the calculations and condensing vapour was assumed to have sulfuric acid properties.
One of the key components for NPF events is the gas-phase H2SO4 (Sipilä et al., 2010; Sihto et al., 2011). It is challenging to measure its atmospheric concentration; therefore, the experimental data for long time intervals are rare. The relative effects of gas-phase H2SO4 are, however, often estimated by deriving its proxy value. In this study, the H2SO4 proxy was calculated according to Mikkonen et al. (2011b), where the best proxy was based on GRad, SO2 concentration, RH and CS. The proxy is defined for GRad >10 W m−2. Another widely used proxy was introduced by Petäjä et al. (2009), but that was created for a clean boreal forest environment. The most recent proxy from Dada et al. (2020) for urban areas was based on global radiation, SO2 concentration and CS but a somewhat different equation formulation. All experimental data were used with their maximum time resolution.
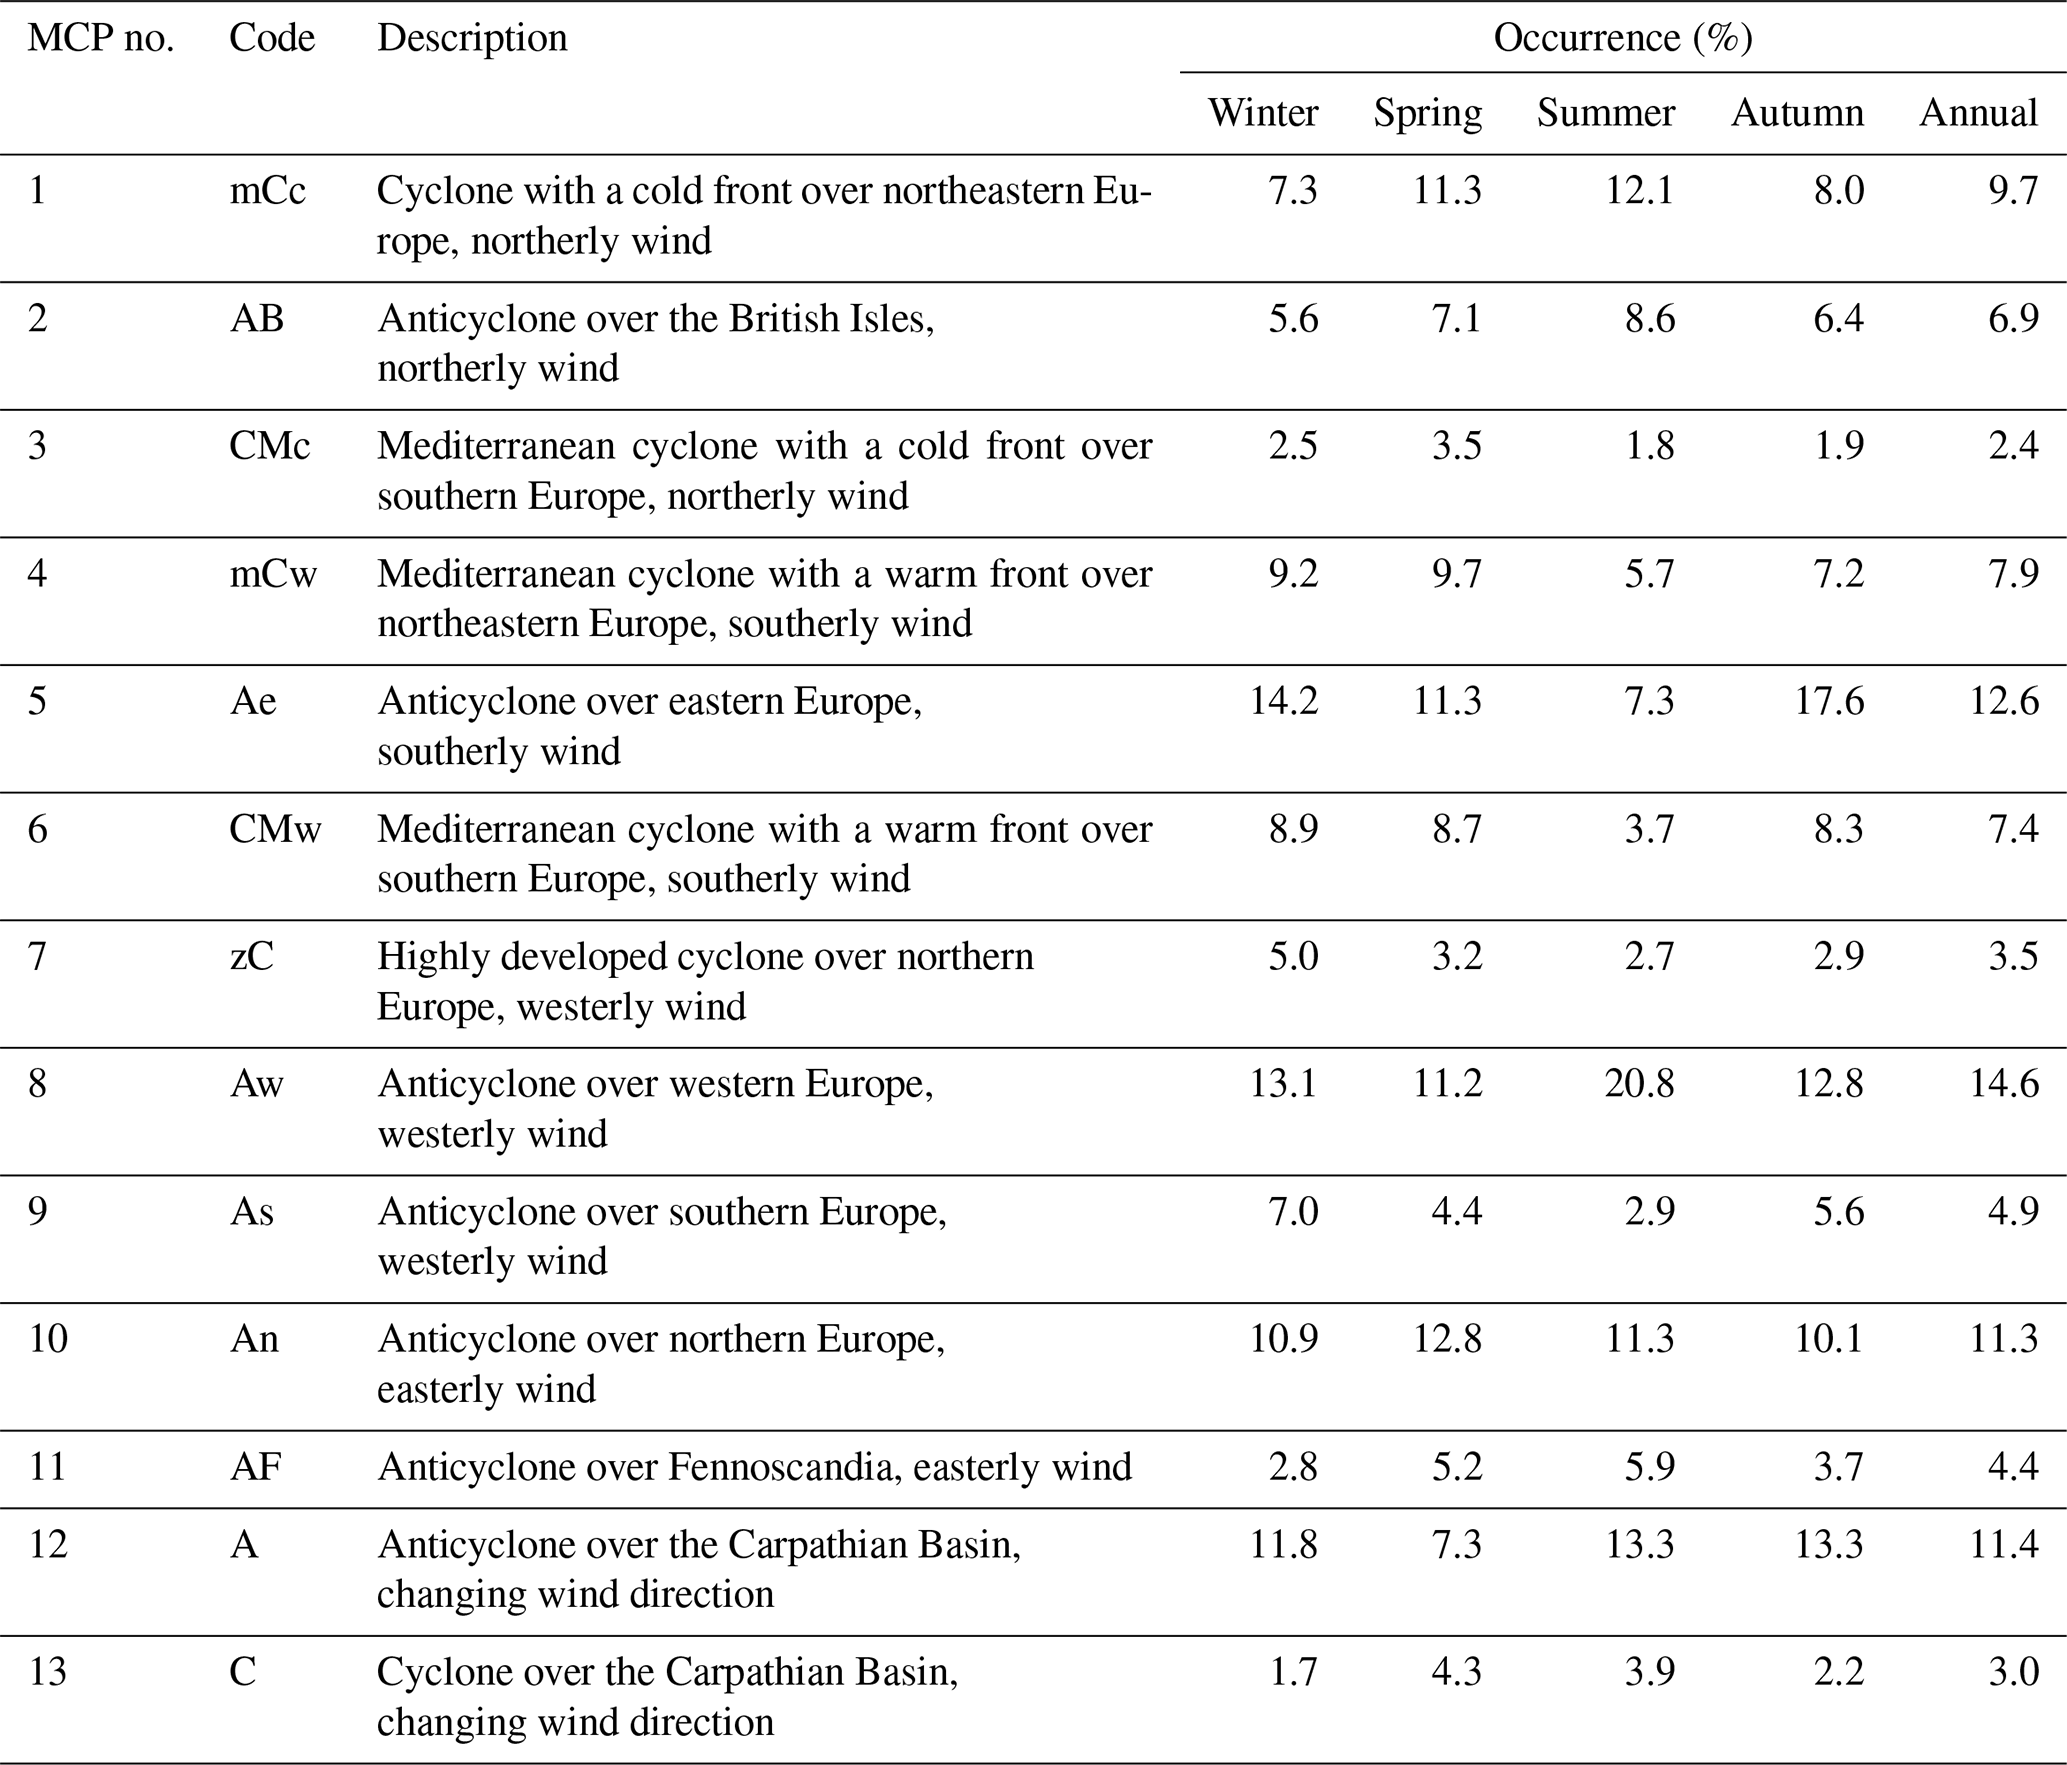
The influence of large-scale weather types was considered on a daily basis by including codes for macro-circulation patterns (MCPs), which were invented specifically for the Carpathian Basin (Péczely, 1957; Károssy, 2016). The classification is based on the extension and development of cyclones and anticyclones relative to the Carpathian Basin via the daily sea-level pressure maps constructed for 00:00 UTC in the North Atlantic–Europe region. Thus defined MCPs were assigned to the following day in the data. Basic information on the MCPs is summarized in Table 1.
Table 1Macro-circulation patterns (MCPs, Péczely codes) and their seasonal and annual occurrences in the Carpathian Basin for years 1958–2010 (Maheras et al., 2018).
Each data line, containing the date and time, concentrations, CS, H2SO4 proxy, meteorological data, and MCP codes, was further labelled by several indices on a daily basis. These labels served to differentiate between various environmental conditions, which can lead to substantial changes in some variables (Salma et al., 2014). The workdays were marked by label WD, while the holidays were denoted by label HD. Varying classes of NPF event days were also labelled differently. The classification was accomplished via the particle number size distribution surface plots (Dal Maso et al., 2005; refined in Németh et al., 2018, for urban sites) on a daily basis. The main classes were NPF event days (marked by label NPF), non-event days (label NE), days with undefined character and days with missing data. The earliest estimated time of the beginning of a nucleation (t1) was also derived (Németh and Salma, 2014) and was added to the data record as a parameter. Finally, the data lines were labelled according to the actual technical status of the DMPS system. The data obtained from the beginning of the measurements to the first update were labelled as S1, the data derived between the first and second updates were labelled as S2, and the data obtained after the second update were labelled S3.
2.3 Statistical modelling
Atmospheric data are usually not normally distributed; therefore, non-parametric methods are often used to detect their long-term trends (Asmi et al., 2013; Masiol et al., 2018). The coherent data set prepared as described in Sect. 2.2 was analysed in two ways. First, time trends for concentrations of particles and air pollutants were estimated by using a dynamic linear model (DLM) method. Secondly, the factors affecting the changes in particle concentrations were detected with a generalized linear mixed model (GLMM).
2.3.1 Dynamic linear model
Dynamic linear models (Durbin and Koopman, 2012; Petris et al., 2009; Laine, 2020) are state-of-the-art tools for time trend detection. The trend is seen as a statistical change in the properties of the background state of the system. Although changes in aerosol concentrations have previously been approximated with linear trends (e.g. Sun et al., 2020), this is not always the most suitable method since the processes affecting the concentrations are continuously evolving over time. Additionally, time series of atmospheric measurements can include multiple time-dependent cycles (e.g. seasonal and diurnal cycles) which are typically non-stationary – meaning that their distributional properties change over time. The DLM approach effectively decomposes the data series into basic components such as level, trend, seasonality and effect of external forcing by describing statistically the underlying structure of the process that generated the measured data. All these components are defined by Gaussian distributions, and they are allowed to vary in time; the significance and magnitude of this variation can also be modelled and estimated. In the basic setup of the DLM, the sign or the magnitude of the trend is not defined in advance by the model formulation but estimated from the data. The method can detect and quantify trends, but the explanations for the observed changes is provided by the user. Nevertheless, it determines if the observations are consistent with the selected model. We used the DLM to explain variability in the particle concentration time series using the following components: locally linear mean level, trend, seasonal effect, autoregressive component and noise. The autoregressive component is added to the model in order to take account of the autocorrelation in the data, i.e. the correlation between subsequent observations. Here it refers to a first-order autoregressive model (AR(1)). The evolution of the investigated concentrations – after the seasonal and noise components were filtered out – is modelled by using the smoothed mean level. Here, the change in the mean level is the trend of the variable. The statistical model can be described by the following equations (Mikkonen et al., 2015):
where yt is the investigated concentration at time t; μt is the mean level and αt is the change in the level from time t−1 to time t; γt is the seasonal component; ηt is an autoregressive error component; and ρ is the coefficient for autoregressive component (here fixed to ρ=0.6). Here, this latter level is fixed. The Gaussian stochastic ε terms are used for the observation uncertainty and for random dynamics of the level and the trend. The seasonal component γt contains dummy variables for each month, so it has a different value for each month with a condition that 12 consecutive months sum to zero. A more detailed description of how the model is written through the state space equation can be found in Mikkonen et al. (2015).
2.3.2 Generalized linear mixed model
Linear mixed models (McCulloch et al., 2008) belong to the family of models that combine several different kinds of models used in multivariate analysis when the data do not fulfil the standard independency and homogeneity assumptions. This is the normal case with measured atmospheric and climatological variables (e.g. Mikkonen et al., 2011a). The main goal of the mixed models is to estimate not only the mean of the measured response variable but also the variance–covariance structure of the data, which makes the model more valid for complex atmospheric data. In addition, modelling the (co)variances of the variables reduces the bias of the estimates and prevents autocorrelation of the residuals. The model is constructed from a general linear model, written in matrix format as , by adding a so-called random component (denoted Zu) to the model; thus, the model is given by . Here, if we let n be equal to the number of observations, p be equal to the number of fixed parameters and q be equal to the number of random parameters in the model, then y is the (n × 1) vector of measurements of the variable of interest, β denotes the unknown (p × 1) vector of intercept and slope estimates of the model, X is the (n × p) matrix of observations from predictor variables, and ε contains the residuals of the model. In the random part, Z is the (n × q) design matrix for the (q × 1) vector of random covariates u with a q-dimensional normal distribution. With adequate choices of the matrix Z, different covariance structures, Cov(u) =G and Cov(ε)=R, can be defined and fitted. Successful modelling of variances and covariances of the observations provides valid statistical inference for the fixed effects, β, of the mixed model. In contrast to general linear models, the error terms, ε, can be correlated, which makes the modelling more robust. It follows from this that the distribution of observations can be described by a normal distribution with the expectation of Xβ and covariance matrix V, which is given by . With GLMM, it is possible to reliably detect the factors which affect particle number concentrations or which act as indicators for their different sources. The model can be expressed in a mathematical form as in Mikkonen et al. (2011a):
where NDi is the number concentration in selected size range in time i; β0 is a model intercept; βsetup is a correction term for changes in the measurement system due to two major upgrades; um is vector of random intercepts different for each month; αd is average change of NDi per day (i.e. slope of trend); βwd and βE are coefficients for workday and NPF event day, respectively; and XTi is the corresponding vector showing the type of the day (in both means: WD/HD and E/NE) in time i; β1 to β5 are fixed coefficients for SO2, NO2, O3, GRad, and RH, respectively; β6 is the (13 × 1) vector of coefficients for different macro-circular patterns (MCPs) indicating the characteristic level of number concentration during each MCP type, which are treated here as categorical variable; and vm represents the random month-specific slopes for SO2, NO2, O3, and GRad. The coefficients of the model can be interpreted in a similar manner as multivariate regression or general linear models: just with an addition of month-specific effects for given variables.
Annual insolation (Q), which expresses the total energy density at a receptor site, was derived from the individual hourly-mean GRadi,i data, where index i represents the hour of day (from 0 to 23) and index j stands for the day of year (from 1 to 365) as . The units of the individual GRadi,j data and Q are watt per square metre (W m−2) and gigajoule per square metre per year (GJ m−2 yr−1), respectively. The few randomly missing data points were interpolated linearly. Since the major sources of particles in cities include road vehicles and atmospheric nucleation, we added some indicative data on these specific sources as well. The median particle number concentrations are basically in line with many other comparable cities in the world (e.g. Kerminen et al., 2018; Masiol et al., 2018). They indicate a decreasing change (except for N100−1000) over the years 2008–2018. At the same time, the annual averages of the other concentrations, meteorological data and auxiliary variables did not change substantially. Annual mean relative occurrence frequency of NPF events stayed almost constant with a mean and SD of (20 ± 4) %, except for the measurement year 2015–2016 when it was unusually small. It is worth adding that NPF increases the existing particle number concentrations in Budapest by a factor of approximately 2 on event days (Salma et al., 2017). The annual medians for the particle formation rate and particle growth rate also stayed constant and seemingly varied only as fluctuations within ca. ± 20 % and ± 8 %, respectively. The number of passenger cars that was registered in Budapest remained constant within ± 5 %, while the share of the diesel-powered passenger cars increased modestly by a rate of approximately 12 % from 2008 to 2018 (KSH, 2019). The number (ca. 4000) of buses registered in Budapest and the share (98 %) of diesel-powered buses in the national bus fleet remained constant.
Table 2Annual medians of particle number concentrations in the diameter ranges from 6 to 1000 nm (N6−1000), from 6 to 100 nm (N6−100), from 25 to 100 nm (N25−100), and from 100 to 1000 nm (N100−1000); concentrations of SO2, CO, NO, NOx, O3, and PM10 mass; annual means of air temperature (T), relative humidity (RH), wind speed (WS), atmospheric pressure (P), and annual insolation (Q); annual mean relative occurrence frequency of nucleation (fNPF); annual median formation rate of particles with a diameter of 6 nm (J6); annual median growth rate of particles with a diameter of 10 nm (GR10 – for the rates, see Salma and Németh, 2019); number of passenger cars registered in Budapest (Cars); the mean age of vehicles (Age); and the share of diesel-powered vehicles (Diesel) separately for the 1-year measurement time intervals.
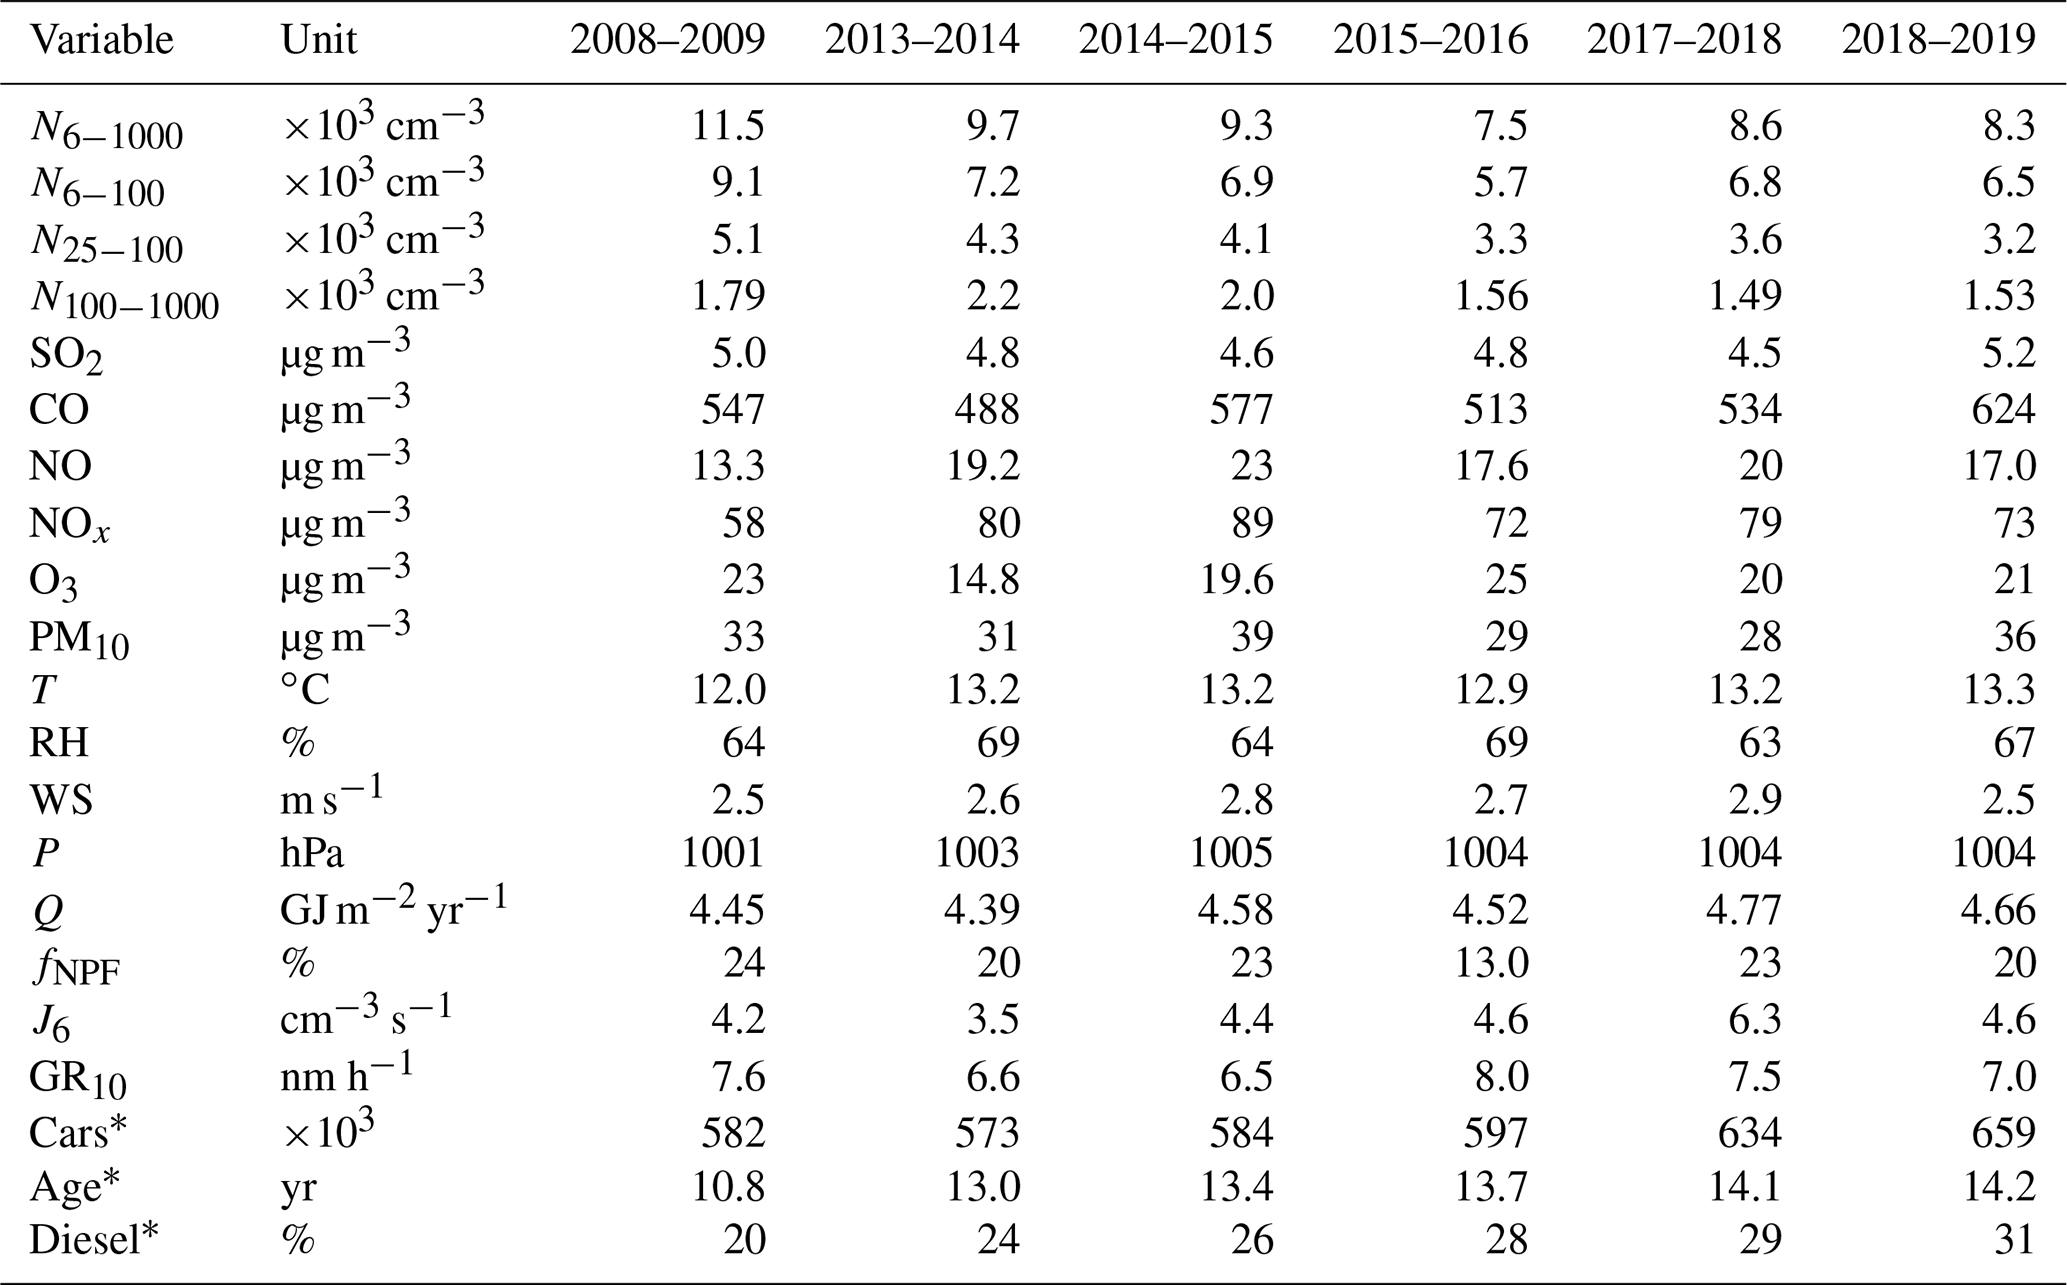
∗ Status at the end of years 2009, 2013, 2014, 2015, 2017 and 2018, respectively.
3.1 Decennial timescale
Overall statistical time trends for particle number concentrations in various size fractions obtained by the DLM are displayed in Fig. 1. The curves confirm that N6−1000, N6−100 and N25−100 indeed decreased in Budapest between 2008 and 2018, while the change in N100−1000 was not significant. The decline mostly took place in a monotonic manner except for perhaps the interval of summer 2016 to spring 2017, when some partial/local increase could be realized for N6−1000 and N6−100.
There are several important sources, sinks and atmospheric transformation processes including environmental conditions which can influence the atmospheric concentrations. The major sources include both high-temperature emissions and NPF events as discussed in Sect. 1. The latter source is affected by concentrations of precursor and other trace gases, meteorological properties for photochemical reactions, and the interactions among gas-phase chemical species of different origin or type with respect to the formation yield of condensing vapours (Kulmala et al., 2014; McFiggans et al., 2019). The air pollutants listed in Table 2 and gas-phase H2SO4 proxy – which are known or expected to affect particle number concentrations – did not exhibit decreasing statistical trends between 2008 and 2018 (Fig. 2). On the one hand, this decoupling suggests that the causes of the decrease in particle number concentrations are not primarily related to meteorological conditions, because they would jointly affect the gas concentrations as well (if their sources are more-or-less constant over a certain time interval). On the other hand, the constant gas concentrations suggest that the decreasing trend in particles does not seem to be related to the major precursors or interacting gaseous chemical species (such as SO2, H2SO4 or NO2).
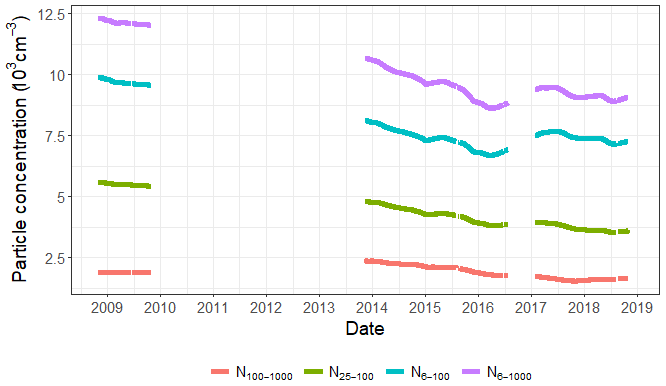
Figure 1Statistical time trends of particle number concentrations in the diameter ranges from 6 to 1000 nm (N6−1000), from 6 to 100 nm (N6−100), from 25 to 100 nm (N25−100) and from 100 to 1000 nm (N100−1000) derived by DLM over a decennial interval.

Figure 2Statistical time trends of gas-phase H2SO4 proxy, SO2, O3 and NO2 derived by DLM over the decennial interval.
As far as the meteorological conditions are concerned, some of them such as WS, atmospheric boundary mixing layer height and T have previously been shown to influence the temporal variation of aerosol particles (e.g. Birmili et al., 2001; Mikkonen et al., 2011a). The annual means of possibly relevant properties and parameters in Table 2 – except for the particle number concentrations (which are under investigation) and the fraction of diesel cars – did not show any obvious dependency; they virtually stayed constant over the years of interest. The possible effect of different weather conditions on the concentrations are studied separately by the GLMM and are discussed in Sect. 3.2.2. There were also no substantial or extensive urban constructions in the area (which could influence the urban air flow) nor larger systematic changes in the traffic circulation around the sampling site in the time interval considered. Therefore, the decline in the particle number concentrations can likely be interpreted as a consequence of the decreased anthropogenic particulate emissions in Budapest. The related source sectors can include vehicular road traffic and household heating or cooking. The decline happened at an increasing share of the diesel passenger cars and straitened emission control on (diesel) vehicles; for example, Platt et al. (2017) and Wihersaari et al. (2020) showed that modern diesel engines have lower particle emissions than gasoline engines.
The average decrease rates of particle number concentrations as derived from both the DLM and GLMM statistical approaches are summarized in Table 3. The rates are shown as obtained from the models and scaled for the 10-year measurement interval to ensure the comparability of the slopes. The relative mean changes (in per cent per year) were expressed with respect to the starting value (mean of the first year). There are some differences between the corresponding results of the two models, which were caused by standardizing the concentrations with the predictors in the models and by handling the upgrades of measurement setup differently. The changes in all size fractions were on the same level and only minor differences could be seen. As the estimates always contain some uncertainty, these differences are not considered statistically significant. The largest difference between the two models was observed for N100−1000 (which had the lowest absolute concentrations). One possible cause for this might be that GLMM standardizes the results for variables indicating anthropogenic emissions; thus, the size fraction that is the most sensitive for the emissions has the strongest effect. Considering all these, the rates from the two statistical models agree well. Furthermore, the rates for N6−1000 and N6−100 were identical. This is explained by the fact that these two size fractions are strongly connected; the typical mean ratio in central Budapest is 75 %–80 % (Salma and Németh, 2019). A small difference was also seen for N25−100. In urban areas, this size fraction is mainly composed of particles from high-temperature emission sources. The source types responsible for the observed decline are further discussed in Sect. 3.2.1.
Table 3Decrease rates of particle number concentrations in the diameter ranges from 6 to 1000 nm, from 6 to 100 nm, from 25 to 100 nm and from 100 to 1000 nm obtained by the dynamic linear model and generalized linear mixed model as a mean absolute change per year during the 10-year measurement interval and as a relative mean change per year with respect to the mean value of the first year.

Our results concerning the decennial change rates (and our conclusions with regard to their causes mainly discussed in Sect. 3.2.1) are comparable and are in line with some other very recent studies. Sun et al. (2020) investigated the statistical concentration trends in particle numbers (and equivalent black carbon mass) at multiple urban, rural or background sites within the German Ultrafine Aerosol Network. Decreasing annual slopes of (−7.0 to −1.7) % were obtained for several size fractions (which are different from our intervals), and the most likely factors for the decreasing trends were assigned to declining anthropogenic emissions due to emission mitigation policies of the EU. Masiol et al. (2018) evaluated statistical time trends of particle number concentrations in various size fractions (which are different again from the previous and present studies) in Rochester, NY, USA, and obtained a typical decline rate of −4.6 % yr−1 for total particles. These outcomes and our data as well seem to be different from the results obtained by Saha et al. (2018) in the urban Pittsburgh, PA, USA, by comparing two intervals of 2001–2002 and 2016–2017. It should be mentioned that in the latter research, the experimental setup for measuring particle number size distributions had a lower diameter limit of detection at 11 nm; some methodological approaches (e.g. classification of events) were different from ours, and the time trend was not derived by statistical modelling. The authors concluded that both the frequency of NPF events and their dynamic properties were reduced by (40–50) % over the past 15 years, resulting in ca. 48 % reduction of UF concentrations. The changes were attributed to dramatic reductions in SO2 emissions in the larger region.
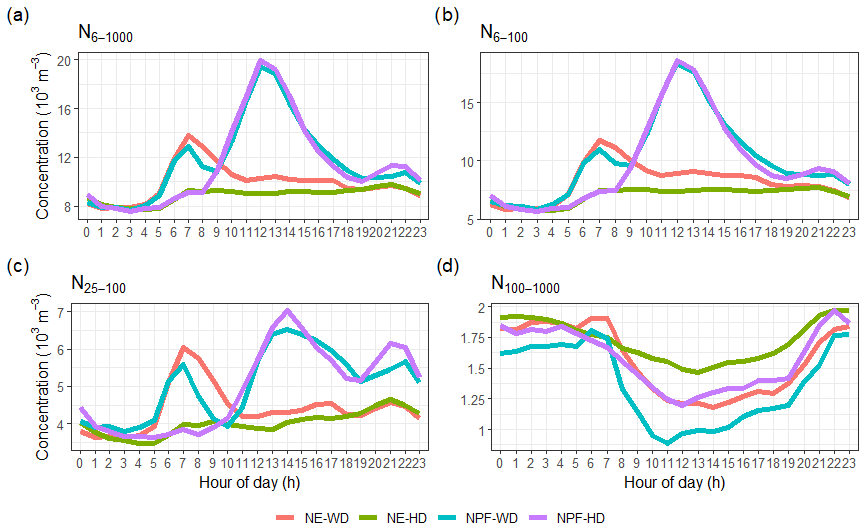
Figure 3Diurnal patterns of particle number concentrations in the diameter ranges from 6 to 1000 nm (N6−1000), from 6 to 100 nm (N6−100), from 25 to 100 nm (N25−100) and from 100 to 1000 nm (N100−1000) (with factor and unit of ×103 cm−3). Red: non-event on workdays, green: non-event on holidays, cyan: event on workdays, purple: event on holidays.
3.2 Diurnal timescale
Diurnal statistical patterns of the particle number concentrations in different size fractions were predicted by the GLMM considering the following variables: GRad; RH; concentrations of SO2, NO2, and O3; and labels for workdays and holidays, NPF event days and non-event days, and for MCP codes. The initial screening for possible prediction variables was done in earlier papers. Studies such as Hyvönen et al. (2005), Mikkonen et al. (2006) and Nieminen et al. (2014) suggested that meteorological and trace gas variables affect NPF. Furthermore, Mikkonen et al. (2011a), Guo et al. (2012) and Zaidan et al. (2018) studied the factors which influence the growth of freshly formed particles as well as the concentrations of particles in larger size fractions and specified the possible predictors. All variables found in these screenings and measured at our site were tested one-by-one in the GLMM model in a stepwise manner. In each step, the significance of the added or removed variable was investigated by a likelihood ratio test (e.g. Pinheiro and Bates, 2000) until the final model shown in Eq. (4) was formed. The effect of the H2SO4 proxy was also tested, and the results for the daytime concentrations were similar to those obtained with the selection of variables above. However, the modelling results for night-time were biased since the proxy is defined for GRad >10 W m−2; therefore, we decided not to include the proxy in the final model.
3.2.1 Diurnal statistical patterns
Modelled diurnal pattern of particle number concentrations for event days on workdays, event days on holidays, non-event days on workdays and non-event days on holidays separately for different size fractions are shown in Fig. 3. The curves in Fig. 3a–c resemble tendentious variations, which can be associated with typical diurnal activity–time patterns of inhabitants in cities, particularly with road traffic. They are also perfectly in line with the mean diurnal tendencies of experimentally determined concentrations in central Budapest (Salma et al., 2014, 2017) and are consistent with the time variations in many other European cities (Hussein et al., 2004; Aalto et al., 2005; Moore et al., 2007; Avino et al., 2011; Dall'Osto et al., 2013).
In the statistical diurnal patterns of UF particles (Fig. 3b), there is a huge peak from late morning to late afternoon on event days. This is unambiguously caused by NPF and growth processes. The peaks on workdays and holidays are rather similar to each other in the position, shape and magnitude (area), which means that the dynamics and timing of NPF events in general are not substantially influenced by anthropogenic activities, which are more intensive on workdays than on holidays. It is worth mentioning that the overall contribution of NPF to particle number concentrations is less than what is seemingly indicated by the diurnal patterns alone since NPF events occur on approximately 20 % of days (Table 2). Emissions from vehicular road traffic are represented by a notable peak during the morning rush hours (between 05:30 and 08:30 LT) on workdays. It is noted that the boundary layer mixing height is usually increased during this interval because of the increasing solar radiation intensity and mixing intensity. Another peak occurred around 21:00 LT and thus later than the afternoon rush, which usually happens between 16:30 and 18:30 LT. Under strong anticyclonic conditions, the evolution of the boundary layer mixing height and mixing intensity can decrease the concentration levels in the afternoons until sunset, and this can compensate the increased intensity of emissions. This all means that the afternoon peak is realized in a fuzzy manner since it is more influenced by local meteorology than by vehicular emissions. The effect of residential heating and combustion activities during evenings can also play a role. It is worth noting that the early-morning rush-hour peak on event days was smaller than on non-event days, which agrees with our earlier observation derived directly from experimental data (Salma et al., 2017) and is in line with the overall picture on urban NPF events (Zhang et al., 2015; Kulmala et al., 2017). On holidays, the modelled diurnal variation for non-event days contained an increasing part in the morning to a modest concentration level, which remains fairly constant over the daytime. This is explained by the differences in daily activities of citizens on workdays and holidays as far as both their intensity and timing are concerned.
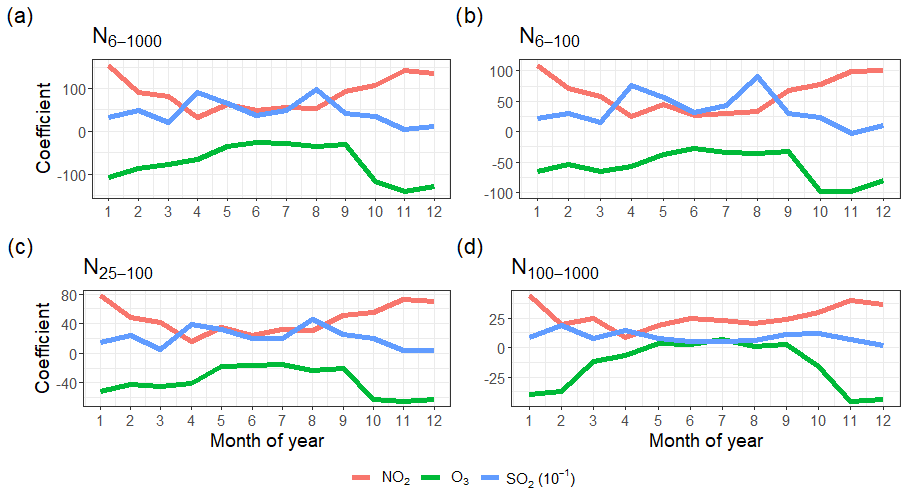
Figure 4Distribution of monthly-mean coefficients (which are proportional to the partial effects) for NO2, O3 and SO2 on particle number concentrations separately in the diameter ranges from 6 to 1000 nm (N6−1000), from 6 to 100 nm (N6−100), from 25 to 100 nm (N25−100) and from 100 to 1000 nm (N100−1000).
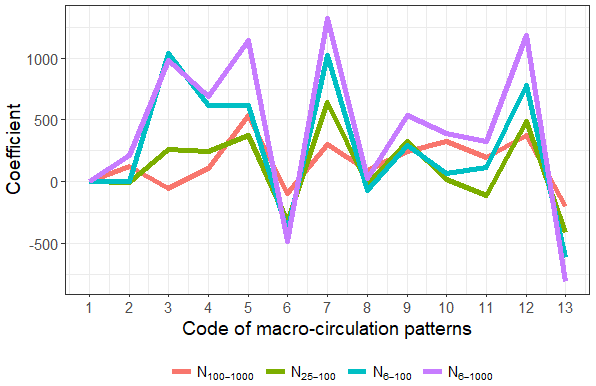
Figure 5Distribution of monthly-mean coefficients (which are proportional to the partial effects) for macro-circulation patterns (Péczely codes) on particle number concentrations separately in the diameter ranges from 100 to 1000 nm (N100−1000), from 25 to 100 nm (N25−100), from 6 to 100 nm (N6−100) and from 6 to 1000 nm (N6−1000).
The statistical diurnal patterns of N6−1000 trends (Fig. 3a) were very similar or analogous to those of N6−100. These two size fractions are strongly connected with each other as explained in Sect. 3.1. The diurnal curves for N25−100 (Fig. 3c) were also similar to the previous corresponding curves as far as the character and shape are concerned, while there were also evident differences between their relative structures. The peaks for the early-morning and late-afternoon rush hours were relatively larger than in the trends of 6–100 or 6–1000 nm size fractions due to the higher contribution of primary particles from high-temperature sources in this size fraction. New particle formation generally occurs on days when N25−100 particles are smaller before the event onset (between 08:00 and 11:00 LT). The maximum of the peaks associated with NPF events in Fig. 3a and b – which is between 12:00 and 13:00 LT – was also shifted to later, i.e. to ca. 14:00 LT in Fig. 3c. This can be explained by the time needed for freshly nucleated particles to reach the diameter range >25 nm.
The statistical diurnal patterns for N100−1000 seem very different from the smaller size ranges. First, their time variations were rather small in comparison to the other size fractions. On workdays, they only showed a modest elevation from 06:00 to 08:00 LT (morning rush hours), which is mainly caused by resuspension of road or surface dust particles by moving vehicles or by emissions of coarse particles from material wear. This morning peak was even missing on holidays, but another small and broad elevation showed up from 21:00 to 22:00 LT. This and the overall changes during the daylight time are primarily related to the daily cycling of local meteorological conditions, in particular boundary layer mixing height under stable anticyclonic weather conditions, which were outlined above.
3.2.2 Effects of variables
Monthly-mean coefficients (mean vm slopes in Eq. 4) of NO2, O3 and SO2 derived by GLMM, which express their partial effects on particle number concentrations, are shown in Fig. 4 for different size fractions.
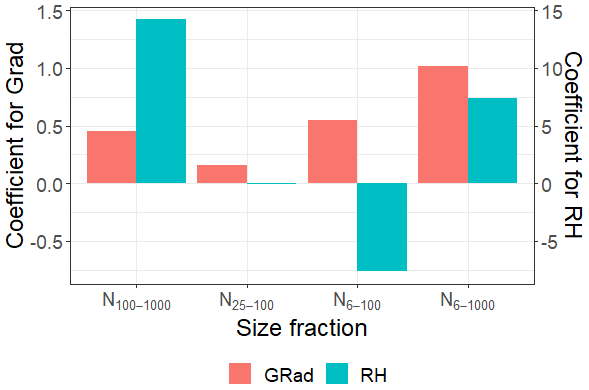
Figure 6Coefficients (which are proportional to the partial effects) for global radiation (GRad) and relative humidity (RH) separately in the diameter ranges from 100 to 1000 nm (N100−1000), from 25 to 100 nm (N25−100), from 6 to 100 nm (N6−100) and from 6 to 1000 nm (N6−1000).
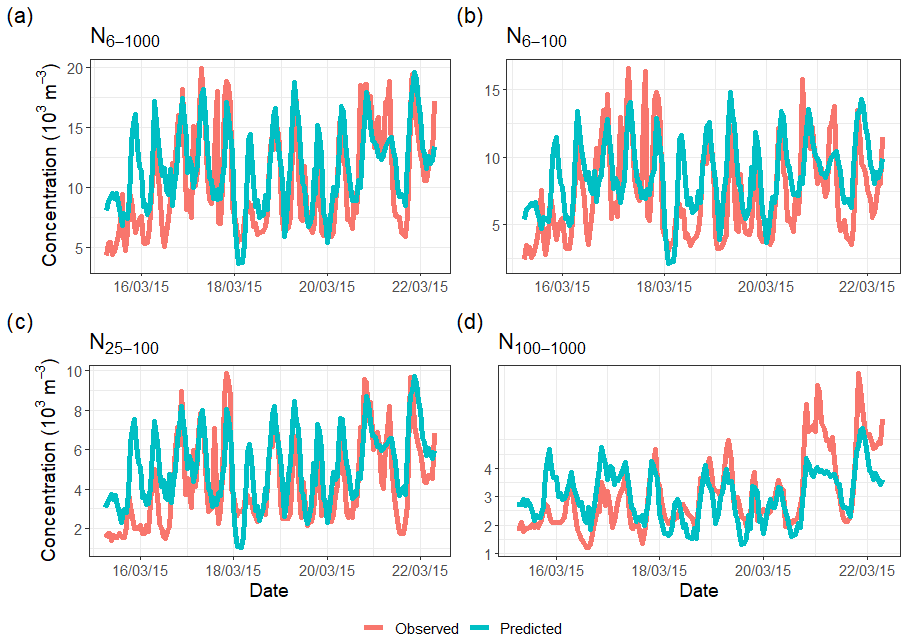
Figure 7Observed (red line) and predicted (cyan line) time series for an illustrative example period separately in the size fractions of 6–1000, 6–100, 25–100 and 100–1000 nm.
The coefficients of SO2 and NO2 are positive, while O3 seems to have a decreasing effect on particle number concentrations. The coefficients all have seasonal patterns, which means that the magnitude of their effect on particle concentrations are of different magnitude in different months. This means, for example, that 1 µg m−3 increase in NO2 concentration increases N6−1000 concentration in January by 154 m−3 but in June by 50 m−3. This could, however, be partly caused by annual changes in boundary layer mixing height or some other variable affecting particle concentrations (and correlating with these) but not measured at the site. The boundary layer mixing height tends to be smaller in Budapest in winter than in the other seasons (Salma et al., 2011), which ordinarily results in higher atmospheric concentrations at steady-state absolute amounts of chemical species. The coefficients of NO2 on N6−1000, N6−100 and N25−100 were higher in winter. This may indicate that large fractions of particles in these three size fractions originate from residential heating, and NO2 acts as an indicator for this source. Another major source of NO2 and primary particles is the road traffic, but this does not show seasonal variation in Budapest. The seasonal effect of NO2 on chemically aged regional-type particles (N100−1000) may not be significant.
The partial effect of O3 on N6−1000, N6−100 and N25−100 was weaker in summer, late spring and early autumn. These time intervals coincide with relatively large O3 concentrations in the area. Ozone has a strong seasonal variation (as shown in Fig. S1 in the Supplement). The negative correlation between O3 concentration and its effect on particle concentrations needs further clarification since O3 participates in a large variety of complex atmospheric processes and also serves as a marker for photochemical processes which influence secondary particle formation. The influence of O3 on N100−1000 was virtually negligible, likely due to the regional character of these particles (which are usually chemically aged and often represent a larger spatial scale due to their longer atmospheric residence time) similarly to NO2. In addition, O3 might act as an indicator of particulate pollution from traffic, power plants and other anthropogenic sources. Then, more ozone would indicate higher numbers of larger particles and, due to coagulation, fewer smaller particles.
The partial effects of SO2 on the particle number concentrations were the largest of the three gases considered. In N6−1000, N6−100 and N25−100, two peaks appeared: one in spring and another one in late summer. This shape is in line with the average distribution of the monthly-mean relative NPF occurrence frequency in Budapest (Salma and Németh, 2019). The latter distribution consists of absolute and local minima in January (with a monthly-mean occurrence frequency of 5.9 %) and August (17.0 %), respectively, and absolute and local maxima in April (41 %) and September (26 %), respectively. The distribution of the SO2 coefficient suggests and confirms that SO2, via NPF events, contributes (to a substantial extent) to the particle number concentrations in cities. The influence of SO2 on N100−1000 was virtually negligible, likely due to the regional character of these particles similarly to the other two gases included in the model.
Figure 5 summarizes the effect of macro-circulation patterns on particle number concentrations in the different size fractions. It is seen that the larger regional-type particles are less affected by the MCPs than the smaller particles. The weather conditions favouring NPF events can be identified from the curves by looking at the largest coefficients for the size fraction of 6–100 nm.
It seems that the MCP nos. 3 (Mediterranean cyclone with a cold front over southern Europe, northerly wind), 7 (highly developed cyclone over northern Europe, westerly wind) and 12 (anticyclone over the Carpathian Basin, changing wind direction) can represent favourable conditions for NPF events than the other MCPs. Under these conditions, the weather in the area is typically windy, with average solar radiation (expect for MCP no. 3 in summer when it shows low daily values), with strong planetary bounding layer evolution; consequently, the pollutants concentrations are below the average (expect for the winter inversions in MCP no. 12). The air pollution situations are better separated by MCP codes in summer than in winter. The weather type classified as no. 6 (Mediterranean cyclone with a warm front over southern Europe, southerly wind) does not favour the events. Under these conditions, the weather is typically cloudy and rainy with lower-than-average solar radiation. This situation is often associated with polluted air in Budapest. Proportions for NPF days for different MCP codes, which are shown Table S1 in the Supplement, also confirm these conclusions. In order to see if the decreasing concentrations are due to changes in meteorological patterns, we investigated separately the occurrence of the MCP patterns during the measurement period. We found no significant changes in the occurrence of the patterns and thus the decreasing particle concentrations are due to something else than the meteorological patterns.
The coefficients for GRad and RH for different size fractions are shown in Fig. 6. It was found that these variables do not have seasonal dependency; i.e. they contribute with equal strength to particle concentrations throughout the year. Effect of GRad is positive for all size fractions, but it is weaker for larger (regional-type or already chemically aged or processed) particles. The latter contribution could be related to the bias in meteorological properties as well. The RH has a negligible effect on the size fraction of 25–100 nm. It strongly and positively affects the largest particles, which means that the particles are larger within higher humidity. This might be related to local meteorology, as higher RH probably means more clouds and more clouds probably means less radiation and lower boundary layer, and this could cause higher particle concentration. In contrast, the effect of RH on the smallest particles was negative, which is probably caused by high RH values, which limit NPF (e.g. Hamed et al., 2011).
3.2.3 Goodness-of-fit evaluation for GLMM
In order to estimate the uncertainty of the models for different size fractions, we calculated the mean absolute errors relative to the dependent variable mean, given by Willmott et al. (2009):
where n is the number of observations, yi represents the observed particle number concentrations, represents the predicted values given by the GLMM and is the mean of the observed values. In addition, we calculated Spearman's rank correlation coefficients between the observed and predicted values for all size fractions. Both goodness-of-fit estimates are shown in Table 4. As the relative errors for different size fractions are within a range of 0.30–0.34 and the correlations are higher than 0.70, it can be concluded that the model fitted the data with this size and measurement uncertainty well.
Table 4Goodness-of-fit estimates for GLMM as expressed by the mean absolute error relative to the dependent variable mean and by Spearman's rank correlation coefficient separately in the size fractions of 6–1000, 6–100, 25–100 and 100–1000 nm.
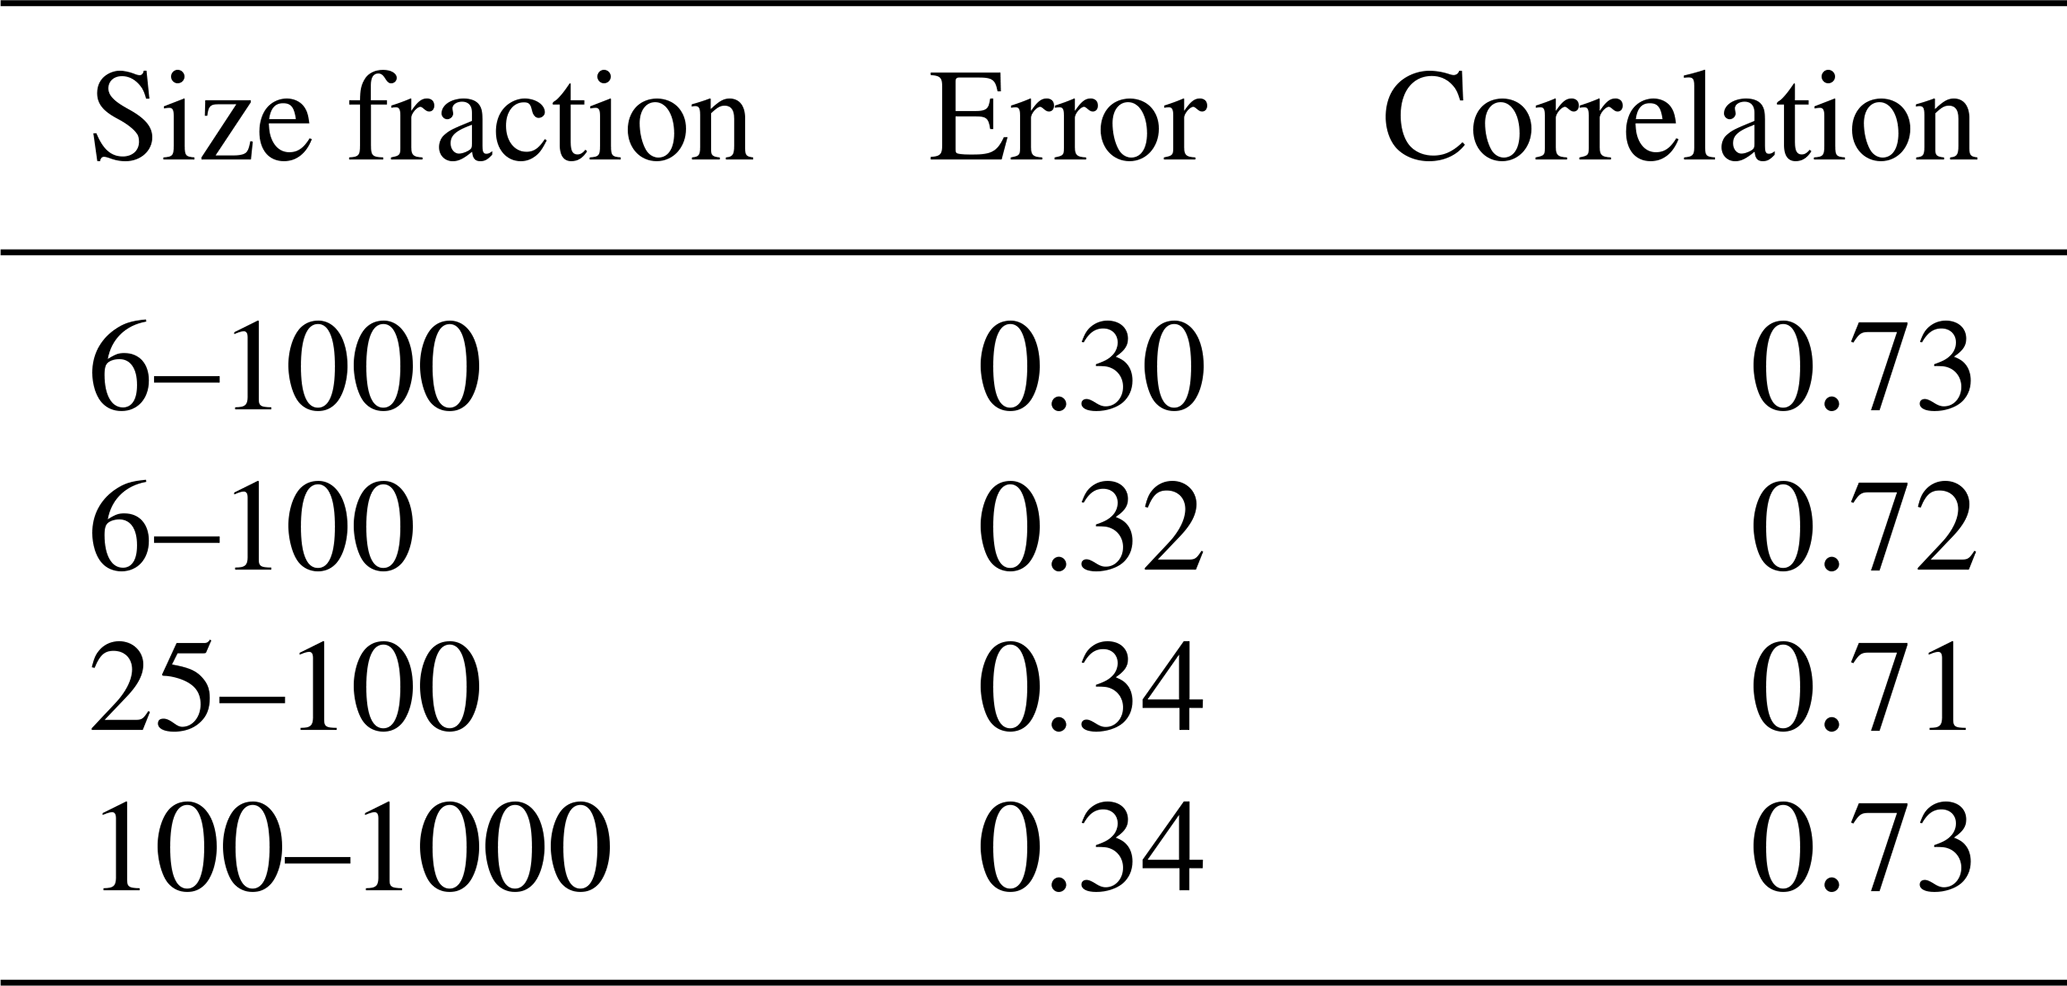
Figure 7 illustrates how well the GLMM model predicts the observations in all size fractions within a randomly selected period of 1 week in March 2015. The figure shows that the predicted values follow the observations fairly well in all size fractions. Overall, the statistical model finds the peaks of the concentration, but it slightly underestimates the highest peaks and fastest fluctuations and, in some cases, overestimates the lowest concentrations.
In the present study, we determined decennial statistical time trends and diurnal statistical patterns of atmospheric particle number concentrations in various relevant size fractions in the city centre of Budapest in an interval of 2008–2018. The decennial statistical trends showed a decreasing character in all applied size fractions of particle concentrations. The mean overall decrease rate was approximately −5 % when scaled for the 10-year measurement interval. One of the likely explanations of the decline is due to the decreased anthropogenic emissions in the city. The diurnal statistical patterns suggested that reduced traffic emissions were most likely an important factor in causing the observed changes. It is expected that traffic intensity changed in a modest manner in the city centre during the time interval of interest, so our results indicate that the reductions are most likely related to lower emission factors. This appears to follow some changes of sulfur content in fuels and control measures on emissions for on-road heavy-duty diesel vehicles. Introduction of better particle filters in diesel cars, cleaner fuel and more sophisticated diesel engines could also contribute. Modernized technologies in residential and household heating could also contribute. The magnitude of the traffic emission reduction cannot be completely conclusive in all aspects for the moment, and further investigations are planned on the basis of the present results. The changes appear to have responded to both the policy on urban air quality and the influence of economic circumstances of inhabitants. Excitingly, the mean ages of passenger cars and busses in Hungary increased during the years under investigation. The exact explanation and confirmation of the decrease require continuation of the related measurements with independent experimental systems and further dedicated studies. The present results can be also used for evaluating the effectiveness of present and prospective mitigation policies.
The diurnal statistical patterns can be also utilized in interpreting some properties of NPF events in urban environments and in explaining time evolution of particle number concentration. As a result of the GLMM, we could, for instance, give a parametrization for predicting particle concentrations in different size fractions. Models similar to those developed in the present study could be used for other particle sizes or locations as well. The same parameterization could be used at least in areas with similar concentration levels of particles and pollutants, while the extrapolation of the results to cleaner or more polluted environments needs to be confirmed before use. Conjugate or linked parameterizations to be developed for varying environments can be implemented as a part of atmospheric models to predict the concentrations of climatically active particles in order to reduce their extensive computational times. In addition, this could also contribute to solving some current uncertain issues in the theoretical description of NPF and growth processes, particularly when predicting cloud condensation nuclei concentrations.
The observational data used in this paper are available on request from the corresponding author Imre Salma (salma@chem.elte.hu).
The supplement related to this article is available online at: https://doi.org/10.5194/acp-20-12247-2020-supplement.
IS and SM formulated the original concept; ZN, VV, TW and IS collected and processed the experimental data; SM, VL and TY were responsible for the statistical data analyses and their physical basis; SM and IS interpreted the results; IS and SM wrote the article with contributions from all co-authors.
The authors declare that they have no conflict of interest.
The research was supported by the National Research, Development and Innovation Office, Hungary (contracts K116788, PD124283 and K132254), by the János Bolyai Research Scholarship of the Hungarian Academy of Sciences (ZN), by the European Regional Development Fund and the Hungarian government (GINOP-2.3.2-15-2016-00028), by the Nessling Foundation, by the Academy of Finland Centre of Excellence (grant no. 307331), and by the Academy of Finland competitive funding to strengthen university research profiles (PROFI) for the University of Eastern Finland (grant no. 325022) and Academy of Finland project (grant no. 299544).
This paper was edited by Andreas Petzold and reviewed by two anonymous referees.
Aalto, P., Hämeri, K., Becker, E., Weber, R., Salm, J., Mäkelä, J., Hoell, C., O'Dowd, C., Karlsson, H., Väkevä, M., Koponen, I. K., Buzorius, G., and Kulmala, M.: Physical characterization of aerosol particles during nucleation events, Tellus B, 53, 344–358, 2001.
Aalto, P., Hämeri, K., Paatero, P., Kulmala, M., Bellander, T., Berglind, N., Bouso, L., Castaño-Vinyals, G., Sunyer, J., Cattani, G., Marconi, A., Cyrys, J., von Klot, S., Peters, A., Zetzsche, K., Lanki, T., Pekkanen, J., Nyberg, F., Sjövall, B., and Forastiere, F.: Aerosol particle number concentration measurements in five European cities using TSI-3022 condensation particle counter over a three-year period during health effects of air pollution on susceptible subpopulations, J. Air Waste Manage. Assoc., 55, 1064–1076, 2005.
Asmi, A., Collaud Coen, M., Ogren, J. A., Andrews, E., Sheridan, P., Jefferson, A., Weingartner, E., Baltensperger, U., Bukowiecki, N., Lihavainen, H., Kivekäs, N., Asmi, E., Aalto, P. P., Kulmala, M., Wiedensohler, A., Birmili, W., Hamed, A., O'Dowd, C., G Jennings, S., Weller, R., Flentje, H., Fjaeraa, A. M., Fiebig, M., Myhre, C. L., Hallar, A. G., Swietlicki, E., Kristensson, A., and Laj, P.: Aerosol decadal trends – Part 2: In-situ aerosol particle number concentrations at GAW and ACTRIS stations, Atmos. Chem. Phys., 13, 895–916, https://doi.org/10.5194/acp-13-895-2013, 2013.
Avino, P., Casciardi, S., Fanizza, C., and Manigrasso, M.: Deep investigation of ultrafine particles in urban air, Aerosol Air Qual. Res., 11, 654–663, 2011.
Birmili, W., Wiedensohler, A., Heintzenberg, J., and Lehmann, K.: Atmospheric particle number size distribution in central Europe: Statistical relations to air masses and meteorology, J. Geophys. Res.-Atmos., 106, 32005-18, 2001.
Braakhuis, H. M., Park, M. V., Gosens, I., De Jong, W. H., and Cassee, F. R.: Physicochemical characteristics of nanomaterials that affect pulmonary inflammation, Part. Fibre Toxicol., 11, 18, https://doi.org/10.1186/1743-8977-11-18, 2014.
Brines, M., Dall'Osto, M., Beddows, D. C. S., Harrison, R. M., Gómez-Moreno, F., Núñez, L., Artíñano, B., Costabile, F., Gobbi, G. P., Salimi, F., Morawska, L., Sioutas, C., and Querol, X.: Traffic and nucleation events as main sources of ultrafine particles in high-insolation developed world cities, Atmos. Chem. Phys., 15, 5929–5945, https://doi.org/10.5194/acp-15-5929-2015, 2015.
Cassee, F. R., Héroux, M.-E., Gerlofs-Nijland, M. E., and Kelly, F. J.: Particulate matter beyond mass: recent health evidence on the role of fractions, chemical constituents and sources of emission, Inhal. Toxicol. 25, 802–812, 2013.
Carslaw, K. S., Lee, L. A., Reddington, C. L., Pringle, K. J., Rap, A., Forster, P. M., Mann, G. W., Spracklen, D. V., Woodhouse, M. T., Regayre, L. A., and Pierce, J. R: Large contribution of natural aerosols to uncertainty in indirect forcing, Nature, 503, 67–71, 2013.
Dada, L., Ylivinkka, I., Baalbaki, R., Li, C., Guo, Y., Yan, C., Yao, L., Sarnela, N., Jokinen, T., Daellenbach, K. R., Yin, R., Deng, C., Chu, B., Nieminen, T., Wang, Y., Lin, Z., Thakur, R. C., Kontkanen, J., Stolzenburg, D., Sipilä, M., Hussein, T., Paasonen, P., Bianchi, F., Salma, I., Weidinger, T., Pikridas, M., Sciare, J., Jiang, J., Liu, Y., Petäjä, T., Kerminen, V.-M., and Kulmala, M.: Sources and sinks driving sulfuric acid concentrations in contrasting environments: implications on proxy calculations, Atmos. Chem. Phys., 20, 11747–11766, https://doi.org/10.5194/acp-20-11747-2020, 2020.
Dal Maso, M., Kulmala, M., Lehtinen, K. E. J., Mäkelä, J. M., Aalto, P. P., and O'Dowd, C.: Condensation and coagulation sinks and formation of nucleation mode particles in coastal and boreal forest boundary layers, J. Geophys. Res., 107, 8097, https://doi.org/10.1029/2001jd001053, 2002.
Dal Maso, M., Kulmala, M., Riipinen, I., Wagner, R., Hussein, T., Aalto, P. P., and Lehtinen, K. E. J.: Formation and growth of fresh atmospheric aerosols: eight years of aerosol size distribution data from SMEAR II, Hyytiälä, Finland, Boreal Environ. Res., 10, 323–336, 2005.
Dall'Osto, M., Querol, X., Alastuey, A., O'Dowd, C., Harrison, R. M., Wenger, J., and Gómez-Moreno, F. J.: On the spatial distribution and evolution of ultrafine particles in Barcelona, Atmos. Chem. Phys., 13, 741–759, https://doi.org/10.5194/acp-13-741-2013, 2013.
Directive 2009/30/EC: Official Journal of the European Union, L 140, EN, 88–113, 2009.
Dunne, E. M., Gordon, H., Kürten, A., Almeida, J., Duplissy, J., Williamson, C., Ortega, I. K., Pringle, K. J., Adamov, A., Baltensperger, U., Barmet, P., Benduhn, F., Bianchi, F., Breitenlechner, M., Clarke, A., Curtius, J., Dommen, J., Donahue, N. M., Ehrhart, S., Flagan, R. C., Franchin, A., Guida, R., Hakala, J., Hansel, A., Heinritzi, M., Jokinen, T., Kangasluoma, J., Kirkby, J., Kulmala, M., Kupc, A., Lawler, M. J., Lehtipalo, K., Makhmutov, V., Mann, G., Mathot, S., Merikanto, J., Miettinen, P., Nenes, A., Onnela, A., Rap, A., Reddington, C. L. S., Riccobono, F., Richards, N. A. D., Rissanen, M. P., Rondo, L., Sarnela, N., Schobesberger, S., Sengupta, K., Simon, M., Sipilä, M., Smith, J. N., Stozkhov, Y., Tomé, A., Tröstl, J., Wagner, P. E., Wimmer, D., Winkler, P. M., Worsnop, D. R., and Carslaw, K. S.: Global atmospheric particle formation from CERN CLOUD measurements, Science, 354, 1119–1124, 2016.
Durbin, J. and Koopman, S. J.: Time series analysis by state space methods, Oxford University Press, Oxford, 2012.
Giechaskiel, B., Lahde, T., Suarez-Bertoa, R., Clairotte, M., Grigoratos, T., Zardini, A., Perujo, A., and Martini, G.: Particle number measurements in the European legislation and future JRC activities, Combustion Engines, 174, 3–16, 2018.
Gordon, H., Sengupta, K., Rap, A., Duplissy, J., Frege, C., Williamson, C., Heinritzi, M., Simon, M., Yan, C., Almeida, J., Tröstl, J., Nieminen, T., Ortega, I. K., Wagner, R., Dunne, E. M., Adamov, A., Amorim, A., Bernhammer, A. K., Bianchi, F., Breitenlechner, M., Brilke, S., Chen, X., Craven, J. S., Dias, A., Ehrhart, S., Fischer, L., Flagan, R. C., Franchin, A., Fuchs, C., Guida, R., Hakala, J., Hoyle, C. R., Jokinen, T., Junninen, H., Kangasluoma, J., Kim, J., Kirkby, J., Krapf, M., Kürten, A., Laaksonen, A., Lehtipalo, K., Makhmutov, V., Mathot, S., Molteni, U., Monks, S. A., Onnela, A., Peräkylä, O., Piel, F., Petäjä, T., Praplan, A. P., Pringle, K. J., Richards, N. A. D., Rissanen, M. P., Rondo, L., Sarnela, N., Schobesberger, S., Scott, C. E., Seinfeld, J. H., Sharma, S., Sipilä, M., Steiner, G., Stozhkov, Y., Stratmann, F., Tomé, A., Virtanen, A., Vogel, A. L., Wagner, A. C., Wagner, P. E., Weingartner, E., Wimmer, D., Winkler, P. M., Ye, P., Zhang, X., Hansel, A., Dommen, J., Donahue, N. M., Worsnop, D. R., Baltensperger, U., Kulmala, M., Curtius, J., and Carslaw, K. S.: Reduced anthropogenic aerosol radiative forcing caused by biogenic new particle formation, P. Natl. Acad. Sci. USA, 113, 12053–12058, 2016.
Guo, H., Wang, D. W., Cheung, K., Ling, Z. H., Chan, C. K., and Yao, X. H.: Observation of aerosol size distribution and new particle formation at a mountain site in subtropical Hong Kong, Atmos. Chem. Phys., 12, 9923–9939, https://doi.org/10.5194/acp-12-9923-2012, 2012.
Hamed, A., Korhonen, H., Sihto, S.-L., Joutsensaari, J., Järvinen, H., Petäjä, T., Arnold, F., Nieminen, T., Kulmala, M., Smith, J. N., Lehtinen, K. E. J., and Laaksonen, A.: The role of relative humidity in continental new particle formation, J. Geophys. Res., 116, D03202, https://doi.org/10.1029/2010JD014186, 2011.
Hussein, T., Puustinen, A., Aalto, P. P., Mäkelä, J. M., Hämeri, K., and Kulmala, M.: Urban aerosol number size distributions, Atmos. Chem. Phys., 4, 391–411, https://doi.org/10.5194/acp-4-391-2004, 2004.
Hyvönen, S., Junninen, H., Laakso, L., Dal Maso, M., Grönholm, T., Bonn, B., Keronen, P., Aalto, P., Hiltunen, V., Pohja, T., Launiainen, S., Hari, P., Mannila, H., and Kulmala, M.: A look at aerosol formation using data mining techniques, Atmos. Chem. Phys., 5, 3345–3356, https://doi.org/10.5194/acp-5-3345-2005, 2005.
Károssy, C.: A Kárpát-medence Péczely-féle makroszinoptikus időjárási helyzeteinek katalógusa 1881–2015 (Catalogue of the Péczely macrosynoptic weather types for the Carpathian Basin 1881–2015, in Hungarian), OSKAR Kiadó, Budapest, 2016.
Kerminen, V.-M., Paramonov, M., Anttila, T., Riipinen, I., Fountoukis, C., Korhonen, H., Asmi, E., Laakso, L., Lihavainen, H., Swietlicki, E., Svenningsson, B., Asmi, A., Pandis, S. N., Kulmala, M., and Petäjä, T.: Cloud condensation nuclei production associated with atmospheric nucleation: a synthesis based on existing literature and new results, Atmos. Chem. Phys., 12, 12037–12059, https://doi.org/10.5194/acp-12-12037-2012, 2012.
Kerminen, V.-M., Chen, X., Vakkari, V., Petäjä, T., Kulmala, M., and Bianchi, F.: Atmospheric new particle formation and growth: review of field observations, Environ. Res. Lett., 13, 103003, https://doi.org/10.1088/1748-9326/aadf3c, 2018.
KSH: National register of road vehicles (in Hungarian), Hungarian Central Statistical Office, Budapest, 2019.
Kulmala, M., Dal Maso, M., Mäkelä, J. M., Pirjola, L., Väkevä, M., Aalto, P., Miikkulainen, P., Hämeri, K., and O'Dowd, C. D.: On the formation, growth and composition of nucleation mode particles, Tellus B, 53, 479–490, 2001.
Kulmala, M., Petäjä, T., Nieminen, T., Sipilä, M., Manninen, H. E., Lehtipalo, K., Dal Maso, M., Aalto, P. P., Junninen, H., Paasonen, P., Riipinen, I., Lehtinen, K. E. J., Laaksonen, A., and Kerminen, V.-M.: Measurement of the nucleation of atmospheric aerosol particles, Nat. Protoc., 7, 1651–1667, https://doi.org/10.1038/nprot.2012.091, 2012.
Kulmala, M., Kontkanen, J., Junninen, H., Lehtipalo, K., Manninen, H. E., Nieminen, T., Petäjä, T., Sipilä, M., Schobesberger, S., Rantala, P., Franchin, A., Jokinen, T., Järvinen, E., Äijälä, M., Kangasluoma, J., Hakala, J., Aalto, P. P., Paasonen, P., Mikkilä, J., Vanhanen, J., Aalto, J., Hakola, H., Makkonen, U., Ruuskanen, T., Mauldin, R. L. III, Duplissy, J., Vehkamäki, H., Bäck, J., Kortelainen, A., Riipinen, I., Kurtén, T., Johnston, M. V., Smith, J. N., Ehn, M., Mentel, T. F., Lehtinen, K. E. J., Laaksonen, A., Kerminen, V.-M., and Worsnop, D. R.: Direct observations of atmospheric aerosol nucleation, Science, 339, 943–946, 2013.
Kulmala, M., Petäjä, T., Ehn, M., Thornton, J., Sipilä, M., Worsnop, D. R., and Kerminen, V.-M.: Chemistry of atmospheric nucleation: On the recent advances on precursor characterization and atmospheric cluster composition in connection with atmospheric new particle formation, Annu. Rev. Phys. Chem., 65, 21–37, 2014.
Kulmala, M., Kerminen, V. M., Petäjä, T., Ding, A. J., and Wang, L.: Atmospheric gas-to-particle conversion: why NPF events are observed in megacities, Faraday Discuss., 200, 271–288, https://doi.org/10.1039/C6FD00257A, 2017.
Laine, M.: Introduction to Dynamic Linear Models for Time Series Analysis, in: Geodetic Time Series Analysis in Earth Sciences, edirted by: Montillet, J. P. and Bos, M., Springer, 139–156, 2020.
Maheras, P., Tolika, K., Tegoulias, I., Anagnostopoulou, Ch., Szpirosz, K. Károssy, Cs., and Makra, L.: Comparison of an automated classification system with an empirical classification of circulation patterns over the Pannonian basin, Central Europe, Meteorol. Atmos. Phys., 131, 739–751, https://doi.org/10.1007/s00703-018-0601-x, 2018.
Makkonen, R., Asmi, A., Korhonen, H., Kokkola, H., Järvenoja, S., Räisänen, P., Lehtinen, K. E. J., Laaksonen, A., Kerminen, V.-M., Järvinen, H., Lohmann, U., Bennartz, R., Feichter, J., and Kulmala, M.: Sensitivity of aerosol concentrations and cloud properties to nucleation and secondary organic distribution in ECHAM5-HAM global circulation model, Atmos. Chem. Phys., 9, 1747–1766, https://doi.org/10.5194/acp-9-1747-2009, 2009.
Masiol, M., Squizzato, S., Chalupa, D., Utell, M. J., Rich, D. Q., and Hopke, P. K.: Long-term trends in submicron particle concentrations in a metropolitan area of the northeastern United States, Sci. Total Environ., 633, 59–70, 2018.
McCulloch, C. E., Searle, S. R., and Neuhaus, J. M.: Generalized, linear, and mixed models, 2nd ed., Wiley, New York, 2008.
McFiggans, G., Mentel, T. F., Wildt, J., Pullinen, I., Kang, S., Kleist, E., Schmitt, S., Springer, M., Tillmann, R., Wu, C., Zhao, D., Hallquist, M., Faxon, C., Le Breton, M., Hallquist, A. M., Simpson, D., Bergstroem, R., Jenkin, M. E., Ehn, M., Thornton, J. A., Alfarra, M. R., Bannan, T. J., Percival, C. J., Priestley, M., Topping, D., and Kiendler-Scharr, A.: Secondary organic aerosol reduced by mixture of atmospheric vapours, Nature, 565, 587–593, 2019.
Merikanto, J., Spracklen, D. V., Mann, G. W., Pickering, S. J., and Carslaw, K. S.: Impact of nucleation on global CCN, Atmos. Chem. Phys., 9, 8601–8616, https://doi.org/10.5194/acp-9-8601-2009, 2009.
Mikkonen, S., Lehtinen, K. E. J., Hamed, A., Joutsensaari, J., Facchini, M. C., and Laaksonen, A.: Using discriminant analysis as a nucleation event classification method, Atmos. Chem. Phys., 6, 5549–5557, https://doi.org/10.5194/acp-6-5549-2006, 2006.
Mikkonen, S., Korhonen, H., Romakkaniemi, S., Smith, J. N., Joutsensaari, J., Lehtinen, K. E. J., Hamed, A., Breider, T. J., Birmili, W., Spindler, G., Plass-Duelmer, C., Facchini, M. C., and Laaksonen, A.: Meteorological and trace gas factors affecting the number concentration of atmospheric Aitken (Dp=50 nm) particles in the continental boundary layer: parameterization using a multivariate mixed effects model, Geosci. Model Dev., 4, 1–13, https://doi.org/10.5194/gmd-4-1-2011, 2011a.
Mikkonen, S., Romakkaniemi, S., Smith, J. N., Korhonen, H., Petäjä, T., Plass-Duelmer, C., Boy, M., McMurry, P. H., Lehtinen, K. E. J., Joutsensaari, J., Hamed, A., Mauldin III, R. L., Birmili, W., Spindler, G., Arnold, F., Kulmala, M., and Laaksonen, A.: A statistical proxy for sulphuric acid concentration, Atmos. Chem. Phys., 11 11319–11334, https://doi.org/10.5194/acp-11-11319-2011, 2011b.
Mikkonen, S., Laine, M., Mäkelä, H. M., Gregow, H., Tuomenvirta, H., Lahtinen, M., and Laaksonen, A.: Trends in the average temperature in Finland, 1847-2013, Stoch. Environ. Res. Risk Ass., 29, 1521–1529, 2015.
Moore, K. F., Ning, Z., Ntziachristos, L., Schauer, J. J., and Sioutas, C.: Daily variation in the properties of urban ultrafine aerosol – Part I: Physical characterization and volatility, Atmos. Environ., 41, 8633–8646, 2007.
Moosmuller, H., Chakrabarty, R. K., and Arnott, W: Aerosol light absorption and its measurement: A review, J. Quant. Sp. Radiat. Transf., 110, 844–878, 2009.
Németh, Z. and Salma, I.: Spatial extension of nucleating air masses in the Carpathian Basin, Atmos. Chem. Phys., 14, 8841–8848, https://doi.org/10.5194/acp-14-8841-2014, 2014.
Németh, Z., Rosati, B., Zíková, N., Salma, I., Bozó, L., Dameto de España, C., Schwarz, J., Ždímal, V., and Wonaschütz, A.: Comparison of atmospheric new particle formation and growth events in three Central European cities, Atmos. Environ., 178, 191–197, 2018.
Nieminen, T., Asmi, A., Dal Maso, M., P. Aalto, P., Keronen, P., Petäjä, T., Kulmala, M., and Kerminen, V.-M.: Trends in atmospheric new-particle formation: 16 years of observations in a boreal-forest environment, Boreal Env. Res., 19, 191–214, 2014.
Nieminen, T., Kerminen, V.-M., Petäjä, T., Aalto, P. P., Arshinov, M., Asmi, E., Baltensperger, U., Beddows, D. C. S., Beukes, J. P., Collins, D., Ding, A., Harrison, R. M., Henzing, B., Hooda, R., Hu, M., Hõrrak, U., Kivekäs, N., Komsaare, K., Krejci, R., Kristensson, A., Laakso, L., Laaksonen, A., Leaitch, W. R., Lihavainen, H., Mihalopoulos, N., Németh, Z., Nie, W., O'Dowd, C., Salma, I., Sellegri, K., Svenningsson, B., Swietlicki, E., Tunved, P., Ulevicius, V., Vakkari, V., Vana, M., Wiedensohler, A., Wu, Z., Virtanen, A., and Kulmala, M.: Global analysis of continental boundary layer new particle formation based on long-term measurements, Atmos. Chem. Phys., 18, 14737–14756, https://doi.org/10.5194/acp-18-14737-2018, 2018.
Oberdörster, G., Oberdörster, E., and Oberdörster, J.: Nanotoxicology: an emerging discipline evolving from studies of ultrafine particles, Environ. Health Perspect., 113, 823–839, 2005.
Ohlwein, S., Kappeler, R., Joss, M. K., Künzli, N., and Hoffmann, B.: Health effects of ultrafine particles: a systematic literature review update of epidemiological evidence, Int. J. Public Health, 685, 547–559, 2019.
Ostro, B., Hu, J., Goldberg, D., Reynolds, P., Hertz, A., Bernstein, L., and Kleeman, M. J.: Associations of mortality with long-term exposures to fine and ultrafine particles, species and sources: results from the California teachers study cohort, Environ. Health Perspect., 123, 549–556, 2015.
Paasonen, P., Kupiainen, K., Klimont, Z., Visschedijk, A., Denier van der Gon, H. A. C., and Amann, M.: Continental anthropogenic primary particle number emissions, Atmos. Chem. Phys., 16, 6823–6840, https://doi.org/10.5194/acp-16-6823-2016, 2016.
Péczely, G.: Grosswetterlagen in Ungarn (Large-scale weather situations in Hungary, in German), Publication of the Hungarian Meteorological Institute, 30, Budapest, 86, pp., 1957.
Petäjä, T., Mauldin, III, R. L., Kosciuch, E., McGrath, J., Nieminen, T., Paasonen, P., Boy, M., Adamov, A., Kotiaho, T., and Kulmala, M.: Sulfuric acid and OH concentrations in a boreal forest site, Atmos. Chem. Phys., 9, 7435–7448, https://doi.org/10.5194/acp-9-7435-2009, 2009.
Petris, G., Petrone, S., and Campagnoli, P.: Dynamic linear models, Springer, New York, 2009.
Pinheiro, J. C. and Bates, D. M.: Mixed-Effects Models in S and S-PLUS, Springer, 2000.
Platt, S. M., El Haddad, I., Pieber, S. M., Zardini, A. A., Suarez-Bertoa, R., Clairotte, M., Daellenbach, K. R., Huang, R.-J., Slowik, J. G., Hellebust, S., Temime-Roussel, B., Marchand, N., de Gouw, J., Jimenez, J. L., Hayes, P. L., Robinson, A. L., Baltensperger, U., Astorga, C., and Prévôt, A. S. H.: Gasoline cars produce more carbonaceous particulate matter than modern filter-equipped diesel cars, Sci. Rep., 7, 4926, https://doi.org/10.1038/s41598-017-03714-9, 2017.
Pöschl, U., Rudich, Y., and Ammann, M.: Kinetic model framework for aerosol and cloud surface chemistry and gas-particle interactions – Part 1: General equations, parameters, and terminology, Atmos. Chem. Phys., 7, 5989–6023, https://doi.org/10.5194/acp-7-5989-2007, 2007.
Raes, F., Van Dingenen, R., Vignati, E., Wilson, J., Putaud, J. P., Seinfeld, J. H., and Adams, P.: Formation and cycling of aerosol in the global troposphere, Atmos. Environ., 34, 4215–4240, 2000.
Rich, D. Q., Zareba, W., Beckett, W., Hopke, P. K., Oakes, D., Frampton, M. W., Bisognano, J., Chalupa, D., Bausch, J., O'Shea, K., Wang, Y., and Utell, M. J.: Are ambient ultrafine, accumulation mode, and fine particles associatedwith adverse cardiac responses in patients undergoing cardiac rehabilitation?, Environ. Health Perspect., 120, 1162–1169, 2012.
Saha, P. K., Robinson, E. S., Shah, R. U., Zimmerman, N., Apte, J. S., Robinson, A. L., and Presto, A. A.: Reduced ultrafine particle concentration in urban air: changes in nucleation and anthropogenic emissions, Environ. Sci. Technol., 52, 6798–6806, 2018.
Salma, I., Borsós, T., Weidinger, T., Aalto, P., Hussein, T., Dal Maso, M., and Kulmala, M.: Production, growth and properties of ultrafine atmospheric aerosol particles in an urban environment, Atmos. Chem. Phys., 11, 1339–1353, https://doi.org/10.5194/acp-11-1339-2011, 2011.
Salma, I., Borsós, T., Németh, Z., Weidinger, T., Aalto, T., and Kulmala, M.: Comparative study of ultrafine atmospheric aerosol within a city, Atmos. Environ., 92, 154–161, 2014.
Salma, I., Németh, Z., Weidinger, T., Kovács, B., and Kristóf, G.: Measurement, growth types and shrinkage of newly formed aerosol particles at an urban research platform, Atmos. Chem. Phys., 16, 7837–7851, https://doi.org/10.5194/acp-16-7837-2016, 2016a.
Salma, I., Németh, Z., Kerminen, V.-M., Aalto, P., Nieminen, T., Weidinger, T., Molnár, Á., Imre, K., and Kulmala, M.: Regional effect on urban atmospheric nucleation, Atmos. Chem. Phys., 16, 8715–8728, https://doi.org/10.5194/acp-16-8715-2016, 2016b.
Salma, I., Varga, V., and Németh, Z.: Quantification of an atmospheric nucleation and growth process as a single source of aerosol particles in a city, Atmos. Chem. Phys., 17, 15007–15017, https://doi.org/10.5194/acp-17-15007-2017, 2017.
Salma, I. and Németh, Z.: Dynamic and timing properties of new aerosol particle formation and consecutive growth events, Atmos. Chem. Phys., 19, 5835–5852, https://doi.org/10.5194/acp-19-5835-2019, 2019.
Schmid, O. and Stoeger, T.: Surface area is the biologically most effective dose metric for acute nanoparticle toxicity in the lung, J. Aerosol Sci., 99, 133–143, 2016.
Sihto, S.-L., Mikkilä, J., Vanhanen, J., Ehn, M., Liao, L., Lehtipalo, K., Aalto, P. P., Duplissy, J., Petäjä, T., Kerminen, V.-M., Boy, M., and Kulmala, M.: Seasonal variation of CCN concentrations and aerosol activation properties in boreal forest, Atmos. Chem. Phys., 11, 13269–13285, https://doi.org/10.5194/acp-11-13269-2011, 2011.
Sipilä, M., Berndt, T., Petäjä, T., Brus, D., Vanhanen, J., Stratmann, F., Patokoski, J., Mauldin, R. L., Hyvärinen, A. P., Lihavainen, H., and Kulmala, M.: The role of sulfuric acid in atmospheric nucleation, Science, 327, 1243, https://doi.org/10.1126/science.1180315, 2010.
Spracklen, D. V., Carslaw, K. S., Kulmala, M., Kerminen, V.-M., Mann, G. W., and Sihto, S.-L.: The contribution of boundary layer nucleation events to total particle concentrations on regional and global scales, Atmos. Chem. Phys., 6, 5631–5648, https://doi.org/10.5194/acp-6-5631-2006, 2006.
Sun, J., Birmili, W., Hermann, M., Tuch, T., Weinhold, K., Merkel, M., Rasch, F., Müller, T., Schladitz, A., Bastian, S., Löschau, G., Cyrys, J., Gu, J., Flentje, H., Briel, B., Asbach, C., Kaminski, H., Ries, L., Sohmer, R., Gerwig, H., Wirtz, K., Meinhardt, F., Schwerin, A., Bath, O., Ma, N., and Wiedensohler, A.: Decreasing trends of particle number and black carbon mass concentrations at 16 observational sites in Germany from 2009 to 2018, Atmos. Chem. Phys., 20, 7049–7068, https://doi.org/10.5194/acp-20-7049-2020, 2020.
Wehner, B. and Wiedensohler, A.: Long term measurements of submicrometer urban aerosols: statistical analysis for correlations with meteorological conditions and trace gases, Atmos. Chem. Phys., 3, 867–879, https://doi.org/10.5194/acp-3-867-2003, 2003.
Wihersaari, H., Pirjola, L., Karjalainen, P., Saukko, E., Kuuluvainen, H., Kulmala, K., Keskinen, J., and Rönkkö, T.: Particulate emissions of a modern diesel passenger car under laboratory and real-world transient driving conditions, Environ. Pollut., 265, 114948, https://doi.org/10.1016/j.envpol.2020.114948, 2020.
Wiedensohler, A., Birmili, W., Nowak, A., Sonntag, A., Weinhold, K., Merkel, M., Wehner, B., Tuch, T., Pfeifer, S., Fiebig, M., Fjäraa, A. M., Asmi, E., Sellegri, K., Depuy, R., Venzac, H., Villani, P., Laj, P., Aalto, P., Ogren, J. A., Swietlicki, E., Williams, P., Roldin, P., Quincey, P., Hüglin, C., Fierz-Schmidhauser, R., Gysel, M., Weingartner, E., Riccobono, F., Santos, S., Grüning, C., Faloon, K., Beddows, D., Harrison, R., Monahan, C., Jennings, S. G., O'Dowd, C. D., Marinoni, A., Horn, H.-G., Keck, L., Jiang, J., Scheckman, J., McMurry, P. H., Deng, Z., Zhao, C. S., Moerman, M., Henzing, B., de Leeuw, G., Löschau, G., and Bastian, S.: Mobility particle size spectrometers: harmonization of technical standards and data structure to facilitate high quality long-term observations of atmospheric particle number size distributions, Atmos. Meas. Tech., 5, 657–685, https://doi.org/10.5194/amt-5-657-2012, 2012.
Willmott, C. J., Matsuura, K., and Robeson, S. M.: Ambiguities inherent in sums-of-squares-based error statistics, Atmos. Environ., 43, 749–752, https://doi.org/10.1016/j.atmosenv.2008.10.005, 2009.
Yu, F., Luo, G., Bates, T. S., Anderson, B., Clarke, A., Kapustin, V., Yantosca, R. M., Wang, Y., and Wu, S.: Spatial distributions of particle number concentrations in the global troposphere: simulations, observations, and implications for nucleation mechanisms, J. Geophys. Res., 115, D17205, https://doi.org/10.1029/2009JD013473, 2010.
Zaidan, M. A., Haapasilta, V., Relan, R., Paasonen, P., Kerminen, V.-M., Junninen, H., Kulmala, M., and Foster, A. S.: Exploring non-linear associations between atmospheric new-particle formation and ambient variables: a mutual information approach, Atmos. Chem. Phys., 18, 12699–12714, https://doi.org/10.5194/acp-18-12699-2018, 2018.
Zhang, R., Wang, G., Guo, S., Zamora, M. L., Ying, Q., Lin, Y., Wang, W., Hu, M., and Wang, Y.: Formation of urban fine particulate matter, Chem. Rev., 115, 3803–3855, 2015.