the Creative Commons Attribution 4.0 License.
the Creative Commons Attribution 4.0 License.
 | 26 Oct 2020
Accelerated increases in global and Asian summer monsoon precipitation from future aerosol reductions
Bjørn H. Samset
Ed Hawkins
Marianne T. Lund
Kalle Nordling
Sabine Undorf
Massimo Bollasina
Annica M. L. Ekman
Srinath Krishnan
Joonas Merikanto
Andrew G. Turner
There is a large range of future aerosol emissions scenarios explored in the Shared Socioeconomic Pathways (SSPs), with plausible pathways spanning a range of possibilities from large global reductions in emissions by 2050 to moderate global increases over the same period. Diversity in emissions across the pathways is particularly large over Asia. Rapid reductions in anthropogenic aerosol and precursor emissions between the present day and the 2050s lead to enhanced increases in global and Asian summer monsoon precipitation relative to scenarios with weak air quality policies. However, the effects of aerosol reductions do not persist to the end of the 21st century for precipitation, when instead the response to greenhouse gases dominates differences across the SSPs. The relative magnitude and spatial distribution of aerosol changes are particularly important for South Asian summer monsoon precipitation changes. Precipitation increases here are initially suppressed in SSPs 2-4.5, 3-7.0, and 5-8.5 relative to SSP1-1.9 when the impact of remote emission decreases is counteracted by continued increases in South Asian emissions.
- Article
(13347 KB) - Full-text XML
-
Supplement
(79064 KB) - BibTeX
- EndNote


Anthropogenic aerosols can affect climate either by scattering or absorbing solar radiation or by changing cloud properties (Boucher et al., 2013). Overall, aerosols have a global-mean cooling effect, manifested, for example, in a slower rate of global warming in the mid-20th century concurrent with rapid increases in aerosol burden (Wilcox et al., 2013; Jones et al., 2013; Hegerl et al., 2019). This has raised the question of whether the warming associated with present-day and future reductions in anthropogenic aerosol might exacerbate the climate impacts brought about by continued increases in greenhouse gas (GHG) emissions.
Many studies have demonstrated the potential for an enhanced future warming from aerosol reductions in global climate models driven by plausible reductions in the emissions of anthropogenic aerosol and their precursors (e.g. Chalmers et al., 2012; Levy et al., 2013; Rotstayn et al., 2013; Acosta Navarro et al., 2017). In recent years, emission scenarios have typically been taken from either the Representative Concentration Pathways (RCPs; Moss et al., 2010; van Vuuren et al., 2011) used in the 5th Coupled Model Intercomparison Project (CMIP5; Taylor et al., 2012) or the more diverse ECLIPSE (Klimont et al., 2017) aerosol pathways: CLE (Current LEgislation) and MFR (Maximum Feasible Reduction). Estimates based on transient simulations with CMIP5 generation models suggest that future aerosol reductions may result in warming of up to 1.1 K in addition to any GHG-driven warming (e.g. Rotstayn et al., 2013; Levy et al., 2013; Acosta Navarro et al., 2017). This indicates that reduced anthropogenic aerosol emissions may account for up to half of the total warming by 2100 in scenarios with moderate GHG increases. Similar magnitudes are also seen in studies using equilibrium experiments (Kloster et al., 2010), studies using reduced complexity models (Hienola et al., 2018), and studies assuming a complete removal of anthropogenic aerosol (Samset et al., 2018; Nordling et al., 2019).
The important role of anthropogenic aerosol in driving precipitation changes has also been documented, including the possible contribution to the spin-down in the global water cycle in the mid-20th century (Liepert et al., 2004; Wilcox et al., 2013; Wu et al., 2013). A greater response of global mean precipitation to anthropogenic aerosol changes compared to GHGs is expected since aerosol has a stronger effect on atmospheric shortwave transmissivity and thus a stronger influence on radiative energy imbalance (e.g. Liepert et al., 2009; Andrews et al., 2010; Rotstayn et al., 2013; Samset et al., 2016; Liu et al., 2018). The apparent hydrological sensitivity (percent change in precipitation divided by absolute change in temperature; Fläschner et al., 2016) for anthropogenic aerosol is twice that for GHGs (Kloster et al., 2010; Salzmann, 2016; Samset et al., 2016). This enhanced sensitivity means that anthropogenic aerosol reductions might be expected to play a relatively more important role in future increases in global precipitation for a given temperature change. Several studies using CMIP5 models estimate an increase in global-mean precipitation between 0.09 and 0.16 mm d−1 by 2100 from aerosol reductions (e.g. Levy et al., 2013; Rotstayn et al., 2013; Westervelt et al., 2015).
The effects of future aerosol reductions are likely to be felt more strongly at regional rather than global scales due to their heterogeneous forcing distribution and strong influence on circulation patterns. Previous work has identified relatively large temperature increases over Europe (Sillmann et al., 2013), the Arctic (Acosta Navarro et al., 2016), and East Asia (Westervelt et al., 2015), compared to the global-mean response. For precipitation, the regional response is particularly pronounced for the Asian summer monsoon (Levy et al., 2013; Westervelt et al., 2015; Acosta Navarro et al., 2017; Bartlett et al., 2018; Samset et al., 2018). Here, precipitation is sensitive to changes in remote aerosol through its control on the interhemispheric temperature gradient and intertropical convergence zone (ITCZ) location and the atmospheric wave pattern over Eurasia and to local aerosol changes, which further modify the local monsoon circulation (Polson et al., 2014; Dong et al., 2016; Guo et al., 2016; Shawki et al., 2018; Undorf et al., 2018). A number of studies have suggested that historical aerosol increases are a key driver of the observed decrease in Asian summer monsoon precipitation (Lau and Kim, 2010; Bollasina et al., 2011; Song et al., 2014; Li et al., 2015; Liu et al., 2019), and projected increases in precipitation due to aerosol reductions are consistent with this. Importantly, Asia will undergo the largest anticipated future changes in aerosol amounts worldwide (Lund et al., 2019; Scannell et al., 2019) and is thus a region likely to see an anthropogenic aerosol influence on near-future precipitation trends.
Despite evidence that anthropogenic aerosols influence temperature and precipitation, quantification of the associated changes is hindered by several compounding uncertainties. The degree by which anthropogenic aerosol reductions enhance future climate change is model-dependent. Models with weaker historical aerosol forcing generally have weaker positive radiative forcing from future aerosol reductions and therefore predict relatively moderate global-mean warming (Gillett and Von Salzen, 2013; Westervelt et al., 2015) and moderate precipitation increases due to future aerosol reductions (Rotstayn et al., 2015), compared to models with larger aerosol forcing. The uncertainty in aerosol radiative forcing itself is currently the largest source of uncertainty in estimates of the magnitude of the total anthropogenic forcing on climate, with the most recent estimate producing a 68 % confidence interval from −1.60 to −0.65 W m−2 (Bellouin et al., 2019). This is comparable to the range simulated by CMIP5 models: −1.55 to −0.68 W m−2 (Zelinka et al., 2014). The effect of this uncertainty on regional climate projections may be further enhanced by feedbacks from atmospheric circulation changes (Nordling et al., 2019). The compensating effects from the response to different near-term climate forcers also increases the uncertainty in multi-decadal projections, with future changes in methane and nitrate aerosol having the potential to moderate future temperature enhancements from decreases in anthropogenic aerosol (Bellouin et al., 2011; Shindell et al., 2012; Pietikäinen et al., 2015). At regional scales, changes in land use may also play an important role (Singh et al., 2019b).
In opposition to the CMIP5 generation findings summarised above, Shindell and Smith (2019) recently dismissed the possibility that future aerosol reductions might lead to rapid increases in the magnitude or rate of global-mean warming, even in scenarios with aggressive clean air policies, based on simulations with a reduced-complexity impulse response model (Smith et al., 2018). Yet, this conclusion may not hold when using a fully coupled global climate model (GCM) and when investigating changes beyond global mean temperature. Even if the short atmospheric residence time of anthropogenic aerosol potentially makes their effects negligible on centennial timescales, they are likely important for regional and global climate over the next few decades. This is especially the case for Asia where large aerosol emission changes are anticipated and where aerosol has played an important role in historical changes, in particular for precipitation. In this study, we examine state-of-the-art models and scenarios in CMIP6 and make the case for a potential enhancement of increases in global and Asian temperature and precipitation on a 20–30-year time horizon due to removal of anthropogenic aerosol. Such an effect is an important consideration for adaptation and mitigation strategies.
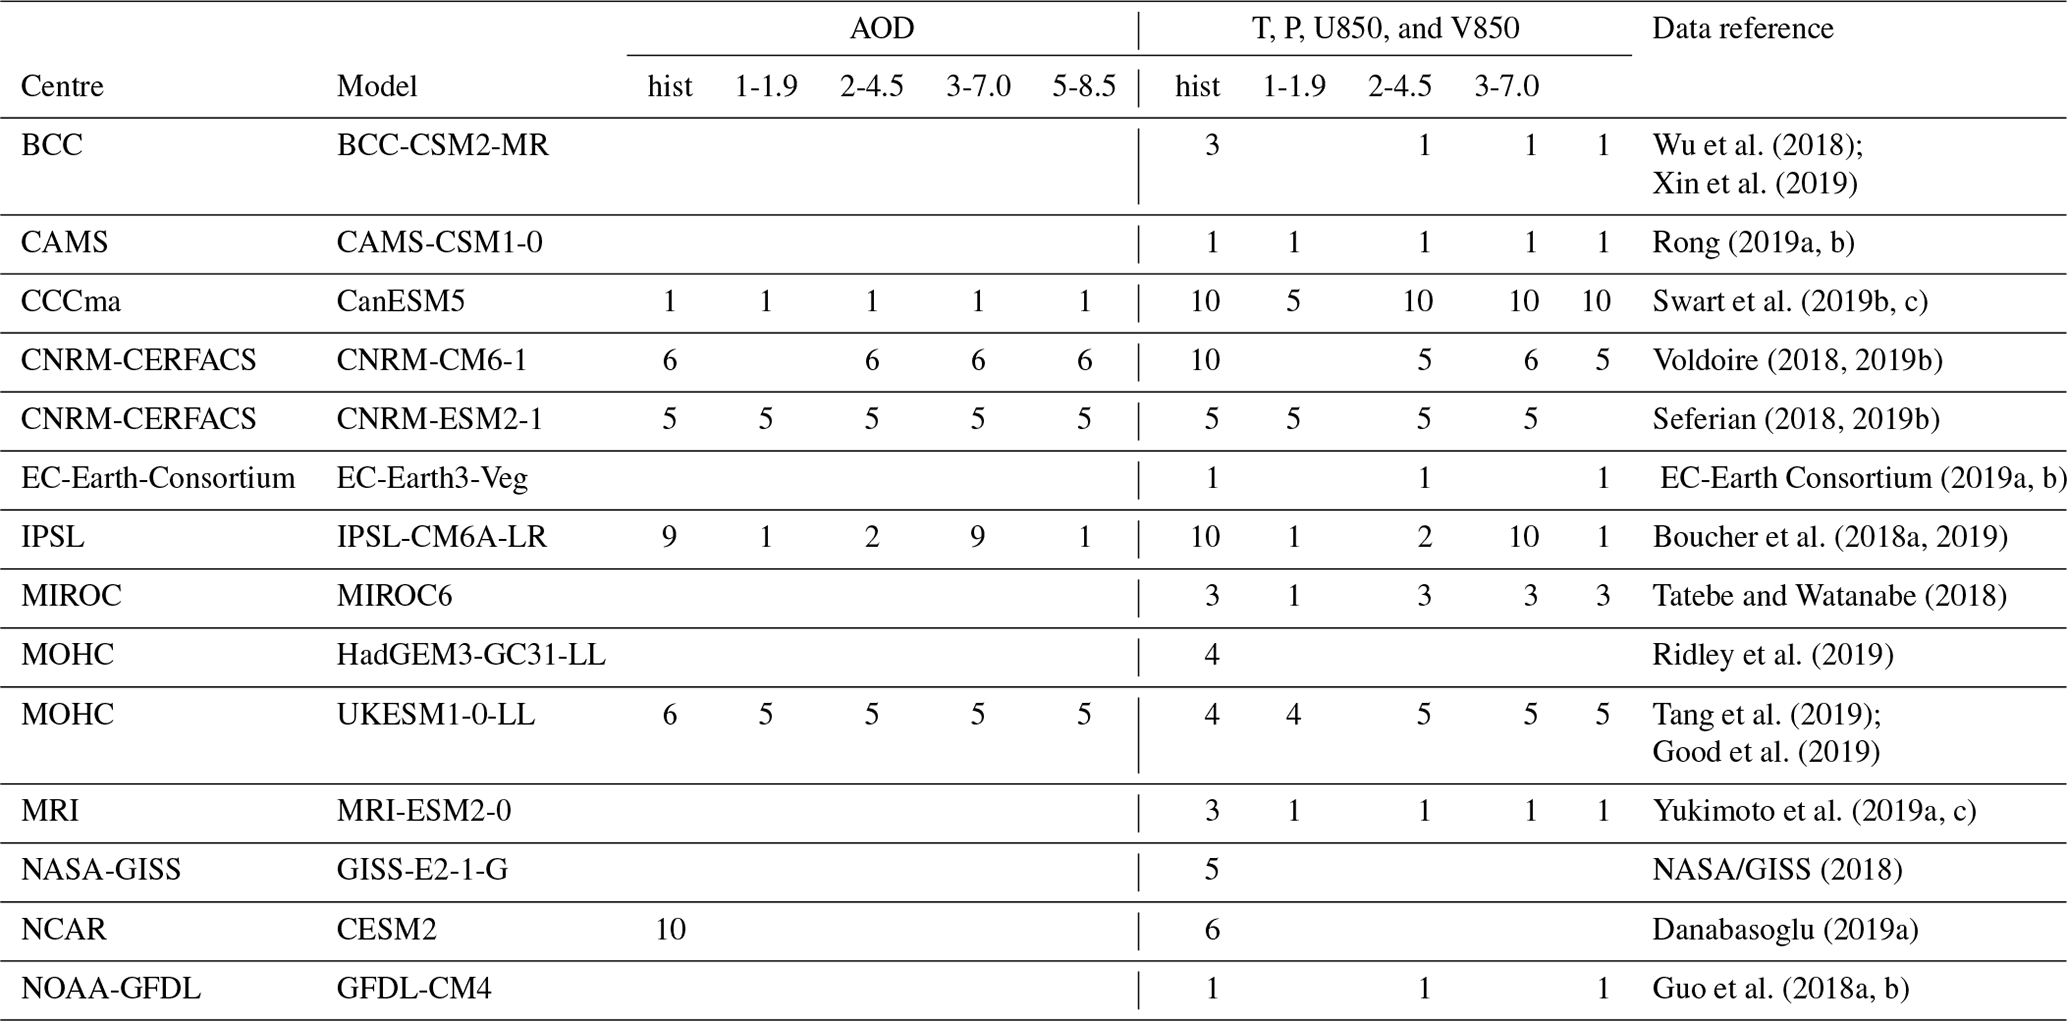
Wu et al. (2018)Xin et al. (2019)Rong (2019a, b)Swart et al. (2019b, c)Voldoire (2018, 2019b)Seferian (2018, 2019b)EC-Earth Consortium (2019a, b)Boucher et al. (2018a, 2019)Tatebe and Watanabe (2018)Ridley et al. (2019)Tang et al. (2019)Good et al. (2019)Yukimoto et al. (2019a, c)NASA/GISS (2018)Danabasoglu (2019a)Guo et al. (2018a, b)Table 1CMIP6 models and the number of ensemble members for each used in this work.
2.1 Models and experiments
We use data from the CMIP6 (Eyring et al., 2016) historical experiment (1850–2014) and four future scenarios following Shared Socioeconomic Pathways (SSPs) 1-1.9, 2-4.5, 3-7.0, and 5-8.5 (O'Neill et al., 2016; Rao et al., 2017; Riahi et al., 2017), which sample a range of aerosol pathways. At the time of writing, data were only available for between 6 and 14 models for the variables and experiments we consider. The data used in this study are summarised in Table 1. All available data are used for each experiment, and model means are used in multi-model comparisons, except where otherwise stated. Many CMIP6 models include improved representation of aerosol microphysics and aerosol–cloud interactions compared to CMIP5, such as internal mixing and heterogeneous ice nucleation (e.g. Bellouin et al., 2013; Mulcahy et al., 2018; Kirkevåg et al., 2018; Wyser et al., 2020), and all models we consider include at least the first aerosol indirect effect (Twomey et al., 1984).
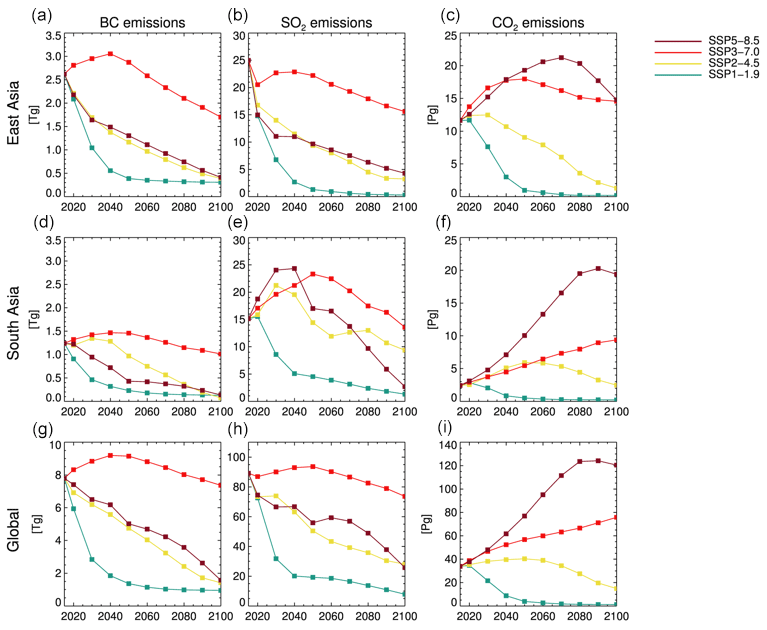
Figure 1(a) Black carbon (Tg), (b) sulfur dioxide (Tg), and (c) carbon dioxide emissions (Pg) over East Asia for SSPs 1-1.9, 2-4.5, 3-7.0, and 5-8.5. (d–f) Emissions over South Asia. (g–i) Global total emissions. East Asia is the region 20–40∘ N and 100–120∘ E. South Asia is the region 5–25∘ N and 55–95∘ E.
The SSPs used in CMIP6 sample a far greater range of uncertainty in future aerosol and precursor emissions than the RCPs used in CMIP5 (Lund et al., 2019; Scannell et al., 2019). Partanen et al. (2018) highlighted the importance of uncertainty in aerosol emission pathways for the potential enhancement of global temperature increases from anthropogenic aerosol reductions. The CMIP5 RCPs 2.6–8.5 sampled only a limited range of this emission uncertainty, with an associated difference in global-mean temperature of no more than 0.18 K throughout the 21st century. Contrasting aerosol pathways spanning a wider range of emission uncertainty resulted in a difference of up to 0.86 K (in 2061). The SSPs span most of this wider range of emissions pathways explored by Partanen et al. (2018). They include large, rapid reductions in aerosol and precursor emissions in SSP1-1.9, more moderate reductions (comparable to the RCPs) in SSP2-4.5 and SSP5-8.5, and continued increases in the coming decades in SSP3-7.0 (see Fig. 1). Much of the spread in global emission pathways comes from diversity over Asia and North Africa (Lund et al., 2019).
In our analysis, we compare future decadal-mean climate changes to the present day (1980–2014) across SSPs 1-1.9, 2-4.5, 3-7.0, and 5-8.5. We focus on the period up to the 2050s, when aerosol emission uncertainty is largest, but the full range of uncertainty in greenhouse gas (GHG) emissions has yet to emerge (Fig. 1). However, the changes in GHG emissions in this period are not negligible, and the emerging modelled climate responses we show include the effects of changes in both anthropogenic aerosols and greenhouse gases. The SSPs also consider a range of land use scenarios, with extensive and moderate deforestation in SSP3-7.0 and SSP5-8.5, respectively, little change in forest cover in SSP2-4.5 before 2050, and large-scale afforestation in SSP1-1.9 (O'Neill et al., 2016). Where data are available, we have provided the global-mean annual-mean effective radiative forcings (ERFs) due to historical changes in anthropogenic aerosols, GHGs, and land use changes in Table 2, as an indicator of the relative importance of these changes on centennial timescales. Typically GHG forcing over the historical period is 2–3 times larger than aerosol forcing, which is in turn an order of magnitude greater than land use forcing. When considering the Asian summer monsoon, the regional pattern of forcing is also important (e.g. Dong et al., 2019). The CMIP6 mean ERF over the Asian region is shown in Fig. 2 for anthropogenic aerosols, GHGs, land use and land cover change, and total anthropogenic drivers (ERF from individual models is shown in Figs. S1–S4 in the Supplement for each driver). Anthropogenic aerosols and GHGs are the main contributors to historical anthropogenic forcing over Asia (Fig. 2).
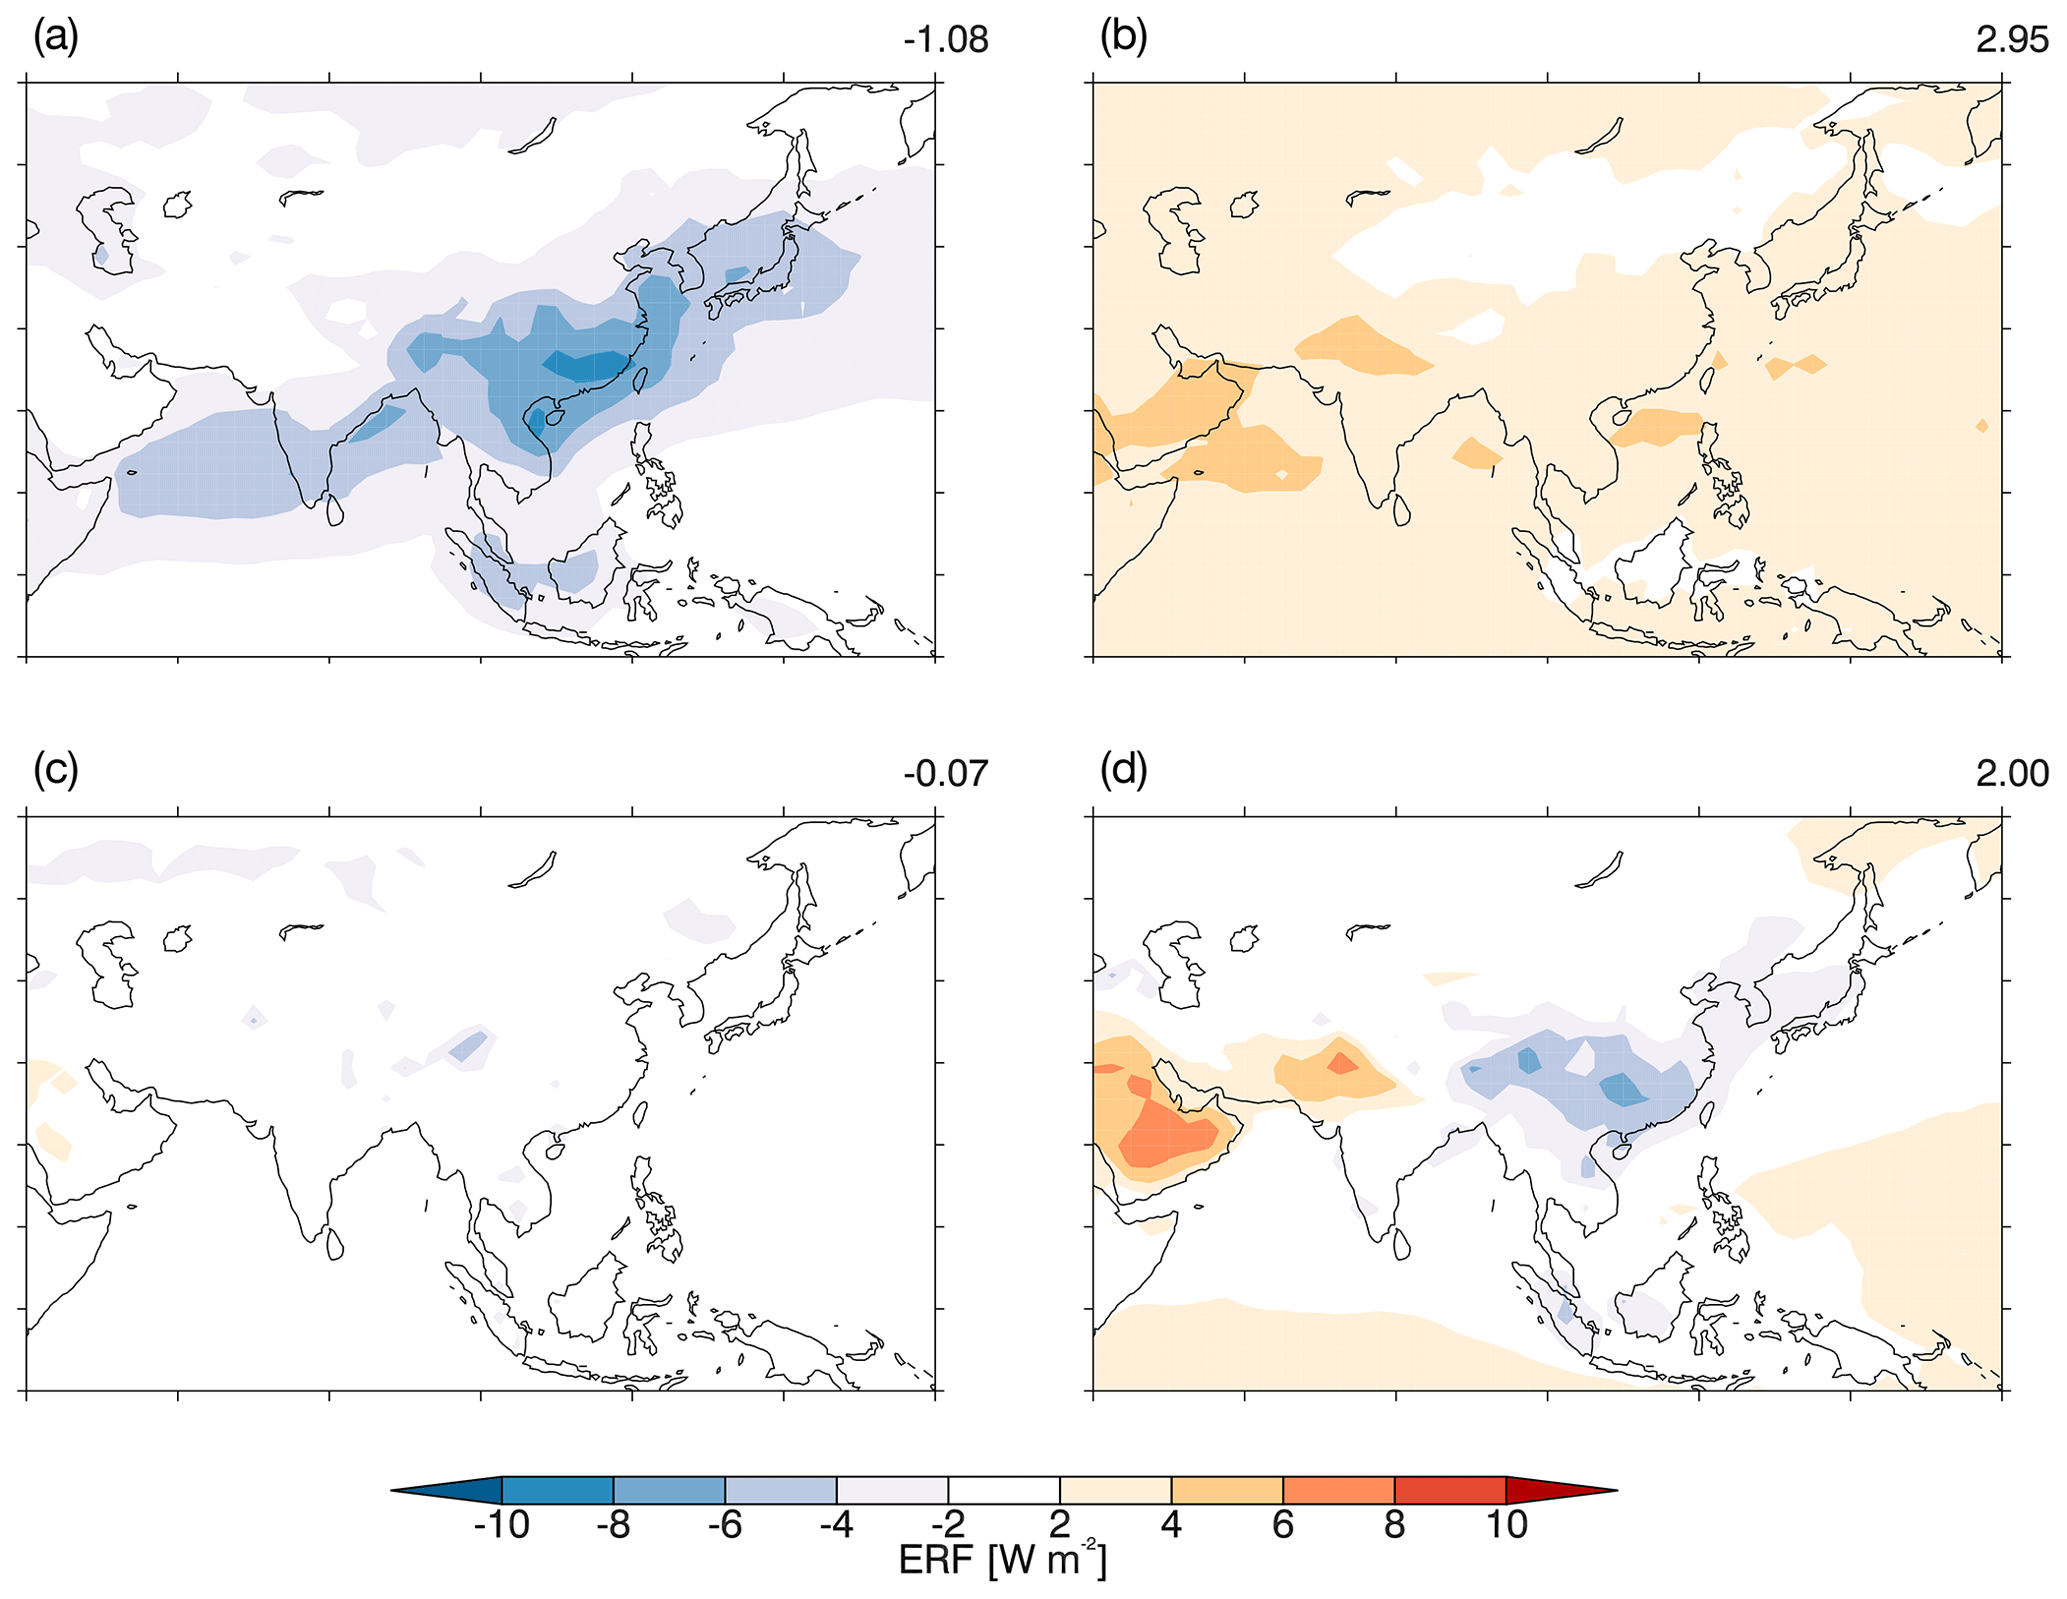
Figure 2CMIP6 historical (2014 vs. 1850) effective radiative forcing due to (a) anthropogenic aerosols, (b) greenhouse gases, (c) land use and land cover changes, and (d) all anthropogenic drivers, calculated based on the models highlighted in Table 2. The number in the top right of each panel shows the global-mean value (W m−2).
Table 2Historical effective radiative forcing (ERF), calculated from RFMIP sstclim experiments, and equilibrium climate sensitivity (ECS) from Zelinka et al. (2020).
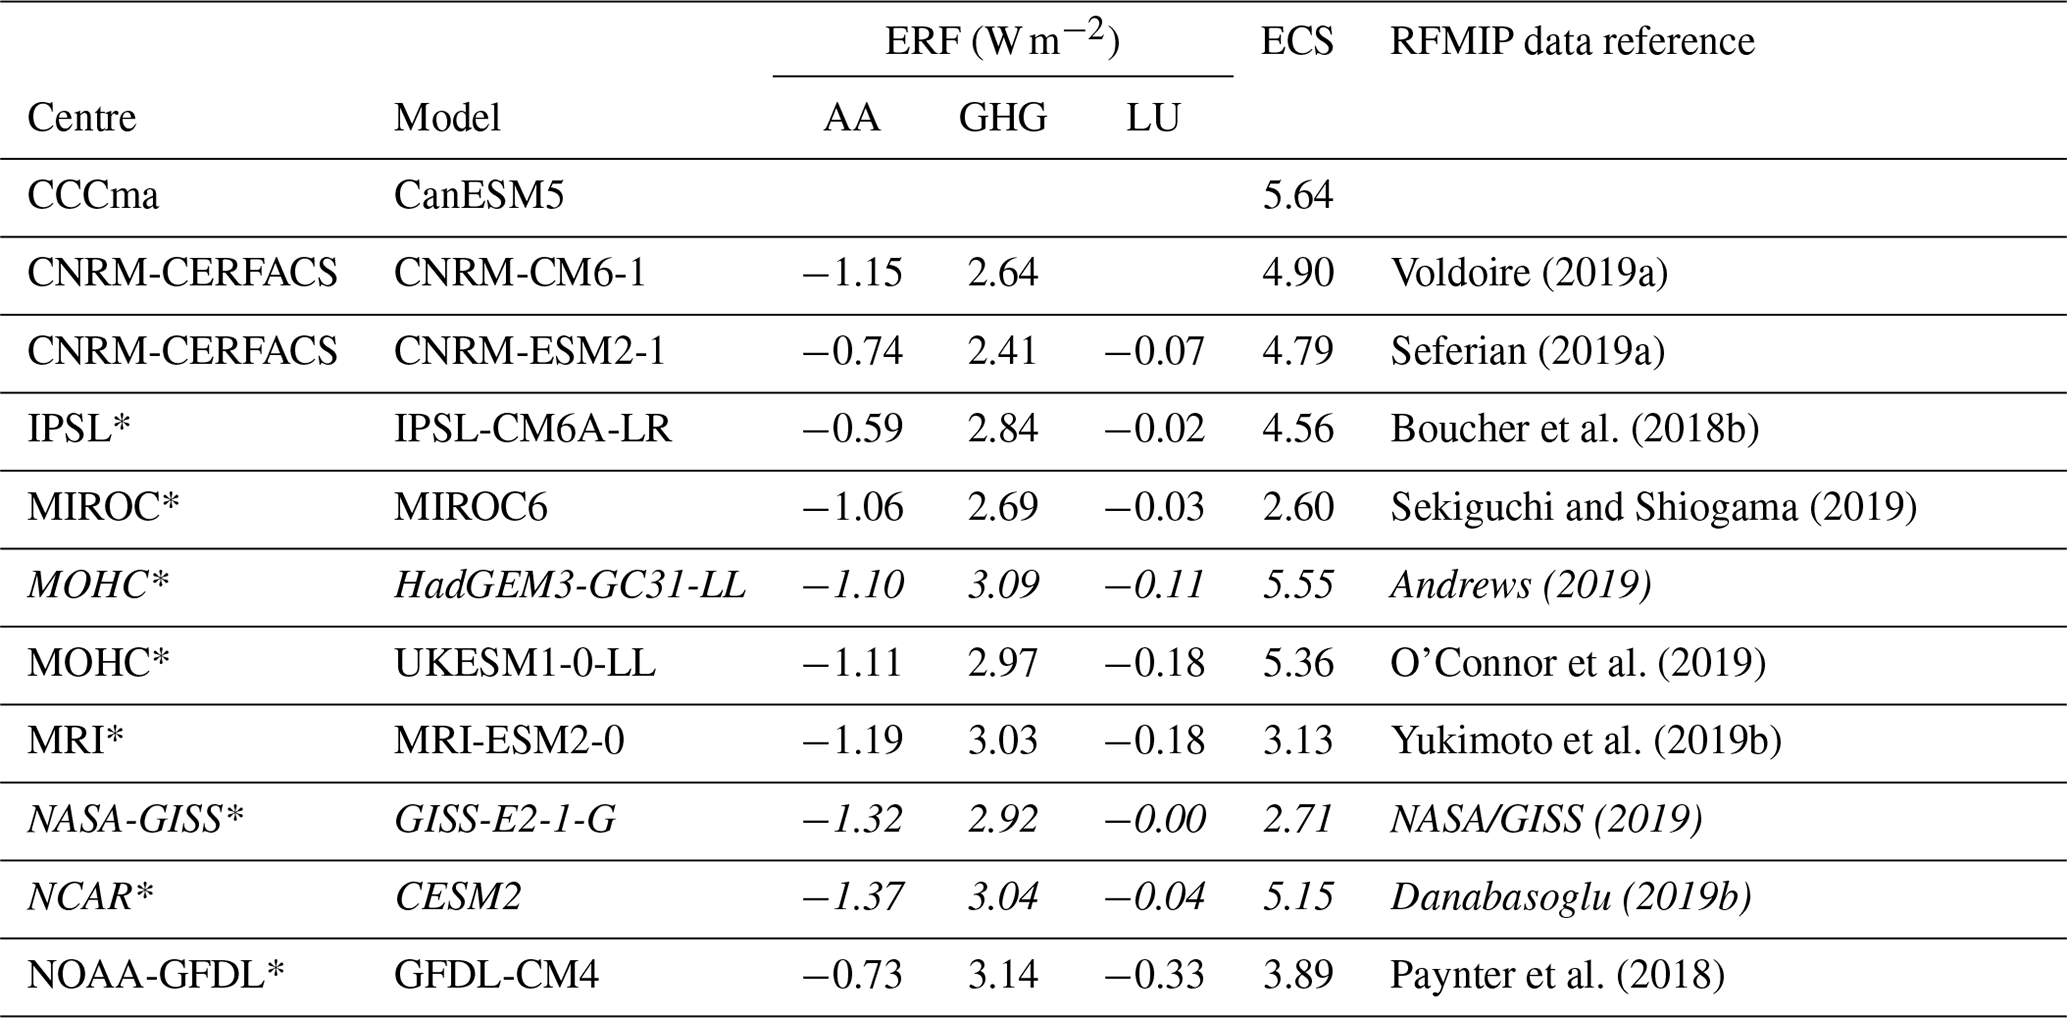
Historical ERF can only be a first-order indicator of the potential relative importance of each driver in future changes, as the distribution and magnitude of future changes may differ, especially for non-GHG forcing. However, comparison of the extreme SSPs for anthropogenic aerosol and land use and land cover changes in 2050 shows that the magnitude of changes between the present day and 2050 is roughly comparable to the changes over Asia between 1850 and 2014 (Fig. S5). This suggests that the historical ERFs are a good indicator of the relative magnitude of these forcings in future and that GHG and anthropogenic aerosol changes are likely to remain the main drivers of Asian summer monsoon trends in the future. Thus, we focus on the effects of anthropogenic aerosol and GHGs in our analysis.
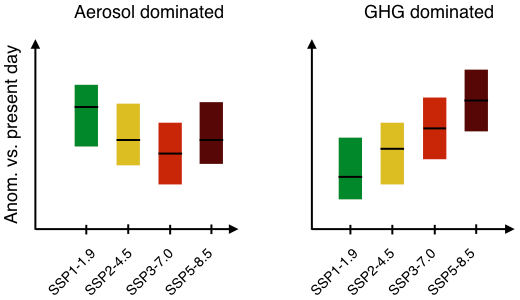
Figure 3Schematics showing the anticipated pattern of anomalies relative to 1980–2014 across the SSPs in cases where the differences are aerosol-dominated and GHG-dominated, based on the global emission pathways shown in Fig. 1c. Boxes show the interquartile range of CMIP6 models; black lines show the median. Significant differences between the SSPs are seen when the median from one SSP falls outside the interquartile range of another. Significant differences between SSPs are not a condition for identification of the respective patterns but may be observed between the extreme scenarios in each case.
Since multiple forcing agents vary simultaneously in the SSPs, it is not possible to quantify the respective effects of aerosol and GHG changes, although the main driver of an anomaly can still be identified. Consider the global emission changes shown in Fig. 1. SSP1-1.9 has the largest aerosol and GHG emission reduction, while SSP3-7.0 has a moderate increase in aerosol emissions (reverse climate response to SSP1-1.9) and moderate increase in GHG emission (enhanced climate response to SSP1-1.9). If the magnitude of the climate response to these changes decreases monotonically from SSP1-1.9 to SSP3-7.0 (Fig. 3), this indicates that aerosol changes are the main driver of the climate response. Further confirmation of aerosol as the main driver is gained from the comparison of the anomalies in SSP2-4.5 and SSP5-8.5, which have similar aerosol pathways but very different greenhouse gas pathways (Figs. 1 and 3). If the climate response in these two scenarios is similar, then the greenhouse gas influence has yet to emerge over the aerosol signal. As the differences in greenhouse gas emissions between the two scenarios increase, a larger response is expected in SSP5-8.5, which has large increases in global GHG emissions compared to very moderate increases in SSP2-4.5 (Fig. 1). In cases where GHGs are the main driver of the response, the magnitude will increase monotonically from SSP1-1.9 to SSP5-8.5 (Fig. 3).
In Sect. 4.1, we use an additional DAMIP (Detection and Attribution Model Intercomparison Project; Gillett et al., 2016) experiment, SSP2-4.5-aer. This differs from the companion SSP2-4.5 in that only aerosol emissions are evolving, while all other forcings are held constant at their 1850 levels. This scenario allows the response to anthropogenic aerosols to be seen in isolation from the response to greenhouse gas changes and may thus provide support to any conclusion drawn from the analysis of the SSP2-4.5 experiment. Data for this experiment are so far only available for two models, CanESM5 and MIROC6 (Shiogama, 2019; Swart et al., 2019a). In this analysis, decadal-mean anomalies are again presented relative to the present day (1980–2014). However, in this case, the present day is necessarily defined based on the historical-aer simulation (a historical simulation where only anthropogenic aerosol and precursor emissions are transient, also included in DAMIP).
2.2 Present-day model evaluation
Here, we use a number of observation and reanalysis datasets to present a broad evaluation of the performance of CMIP6 models in reproducing present-day (1980–2014) climatologies and linear trends in global temperature and precipitation, the interhemispheric temperature gradient, and the Asian summer monsoon. Global temperature observations are taken from GISTEMP v4 (Hansen et al., 2010; Lenssen et al., 2019), the Goddard Institute for Space Studies gridded dataset, which is based on GHCN v4 over land (Global Historical Climatology Network; Menne et al., 2018) and ERSST v5 over ocean (Extended Reconstructed Sea Surface Temperature; Huang et al., 2017). GISTEMP is provided as anomalies relative to 1951–1980 on a 2 grid. For global precipitation, data from the Global Precipitation Climatology Project (GPCP; Adler et al., 2003) are used on a 2.5 grid. GPCP combines gauge- and satellite-based observations over land with satellite observations over ocean. Since there can be large discrepancies between precipitation observations from different sources (Collins et al., 2013; Sperber et al., 2013; Prakash et al., 2015), we use a number of datasets in our evaluation of the Asian summer monsoon. Precipitation observations over land are also taken from APHRODITE (Asian Precipitation – Highly-Resolved Observational Data Integration Towards Evaluation; Yatagai et al., 2012) and the Global Precipitation Climatology Centre (GPCC; Schneider et al., 2014). APHRODITE contains data from a dense network of rain gauges and is used at 0.25 resolution, within the domain bounded by 60∘ E, 150∘ E, 15∘ S, and 55∘ N. GPCC also provides gauge-based data but at a reduced horizontal resolution (0.5) compared to APHRODITE. We also show precipitation from CMAP (Climate Prediction Centre Merged Analysis of Precipitation; Xie et al., 1996, 1997), which blends satellite- and gauge-based estimates with NCEP/NCAR reanalysis precipitation. The atmospheric circulation plays an important role in the distribution of Asian summer monsoon precipitation, so we also compare upper and lower tropospheric winds from CMIP6 models to ERA-Interim (Dee et al., 2011).
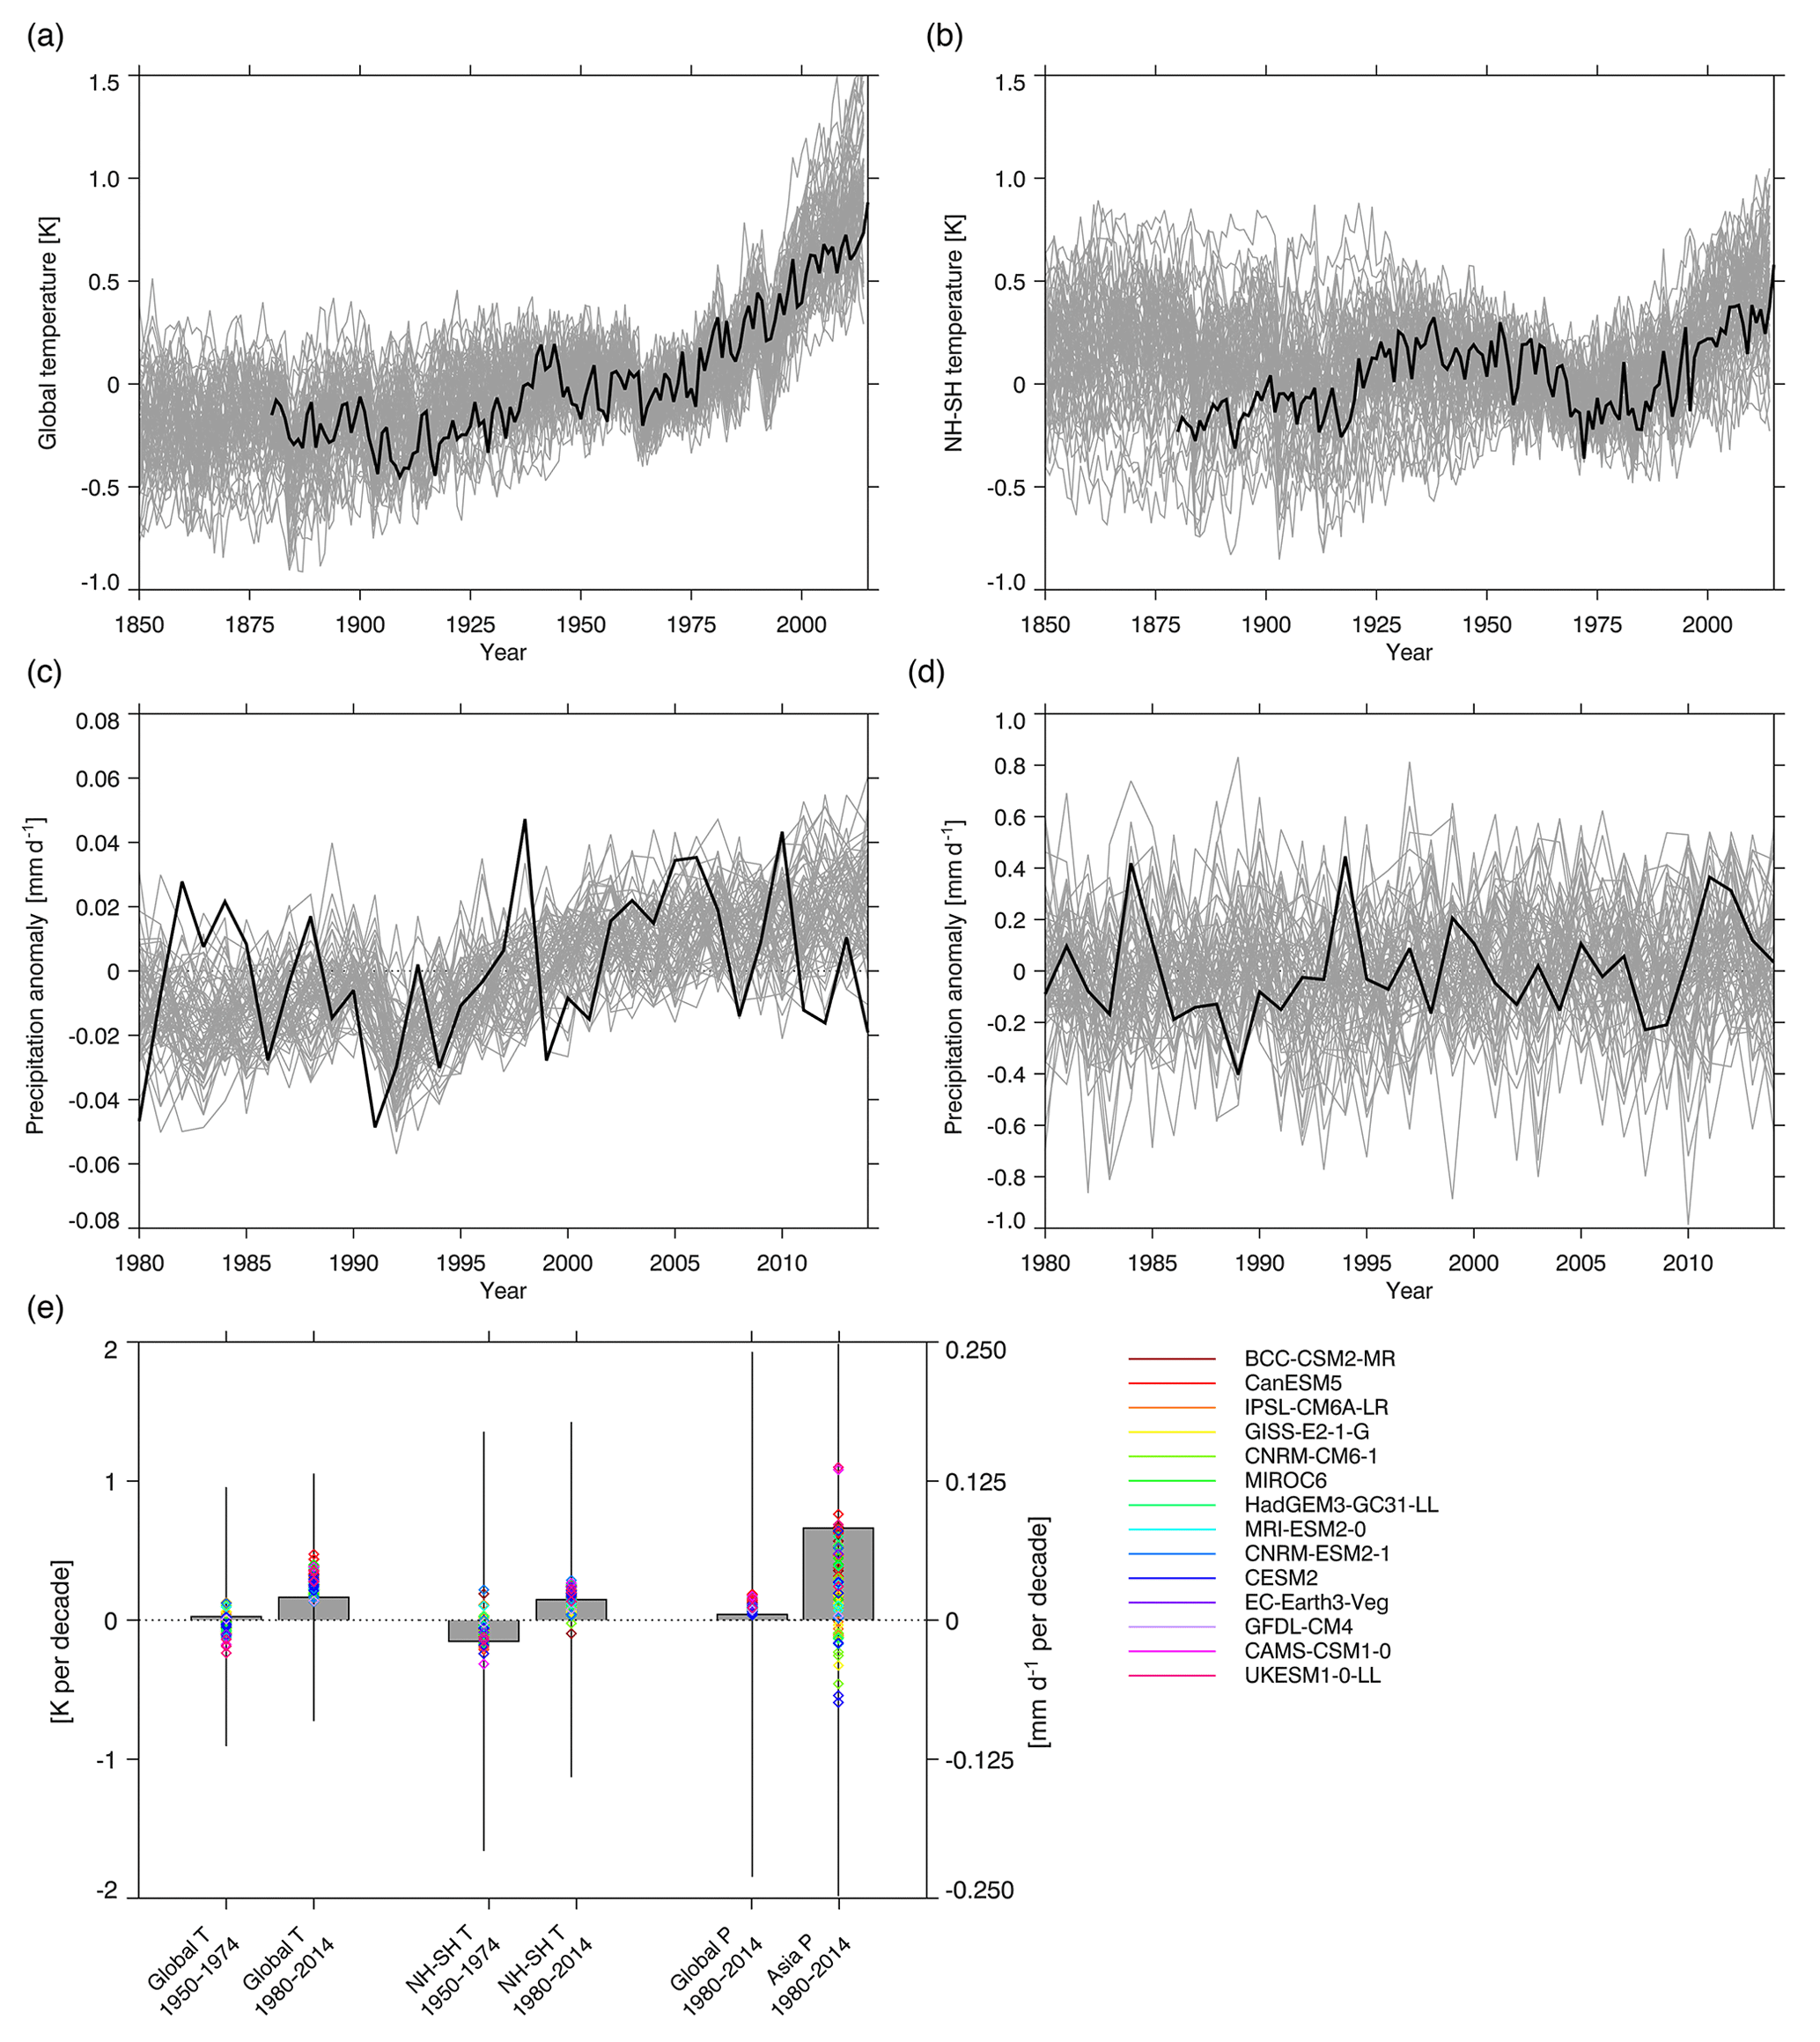
Figure 4(a) Global-mean annual-mean temperature anomaly relative to 1951–1980 from CMIP6 (grey lines show individual members) and GISTEMP (black). (b) Annual-mean interhemispheric temperature gradient anomaly relative to 1951–1980 from CMIP6 (grey) and GISTEMP. (c) Annual-mean global-mean precipitation anomaly relative to 1980–2014 from CMIP6 (grey) and GPCP (black). (d) JJA-mean Asia-mean precipitation anomaly relative to 1980–2014 from CMIP6 (grey) and GPCP (black). Asia is the region from 5–47.5∘ N and 67.5–145∘ E. (e) Linear trends in annual-mean global-mean temperature and JJA-mean interhemispheric temperature gradient from CMIP6 (coloured diamonds) and GISTEMP (grey bars) for 1950–1974 and 1980–2014 and linear trends in annual-mean global-mean precipitation and JJA-mean Asia-mean precipitation for 1980–2014 (grey bars are GPCP). Error bars show ±1 SE (standard error) on the observed trend. Note that for Asian precipitation this extends beyond the range of the plot and is an order of magnitude larger than the trend.
The global-mean annual-mean temperature anomaly from GISTEMP falls within the range of the CMIP6 ensemble during the historical period (Fig. 4a). However, most models overestimate the rate of recent warming (Fig. 4a, e). The interhemispheric temperature gradient (Northern Hemisphere–Southern Hemisphere) anomalies are also consistent in GISTEMP and CMIP6 (Fig. 4b), although the models generally have anomalies that are more positive than seen in the observations. Most models reproduce the negative trend in the interhemispheric temperature gradient in 1950–1974 (Fig. 4e), which is associated with a global increase in anthropogenic aerosol and a weakening of the global monsoon (e.g. Polson et al., 2014). Most models also capture the positive trend in interhemispheric temperature gradient since 1980–2014 when rates of change in the global aerosol burden were relatively small (Fig. 4e).
All models simulate an increase in global-mean annual-mean precipitation since 1980, and most model members simulate larger trends than observations (Fig. 4c, e). The observed trend in Asian (67.5–145∘ E, 5–47.5∘ N) summer (June–August, JJA) precipitation is small compared to interannual variability, and this is reflected in large uncertainty in the sign of the modelled trend (Fig. 4d, e).
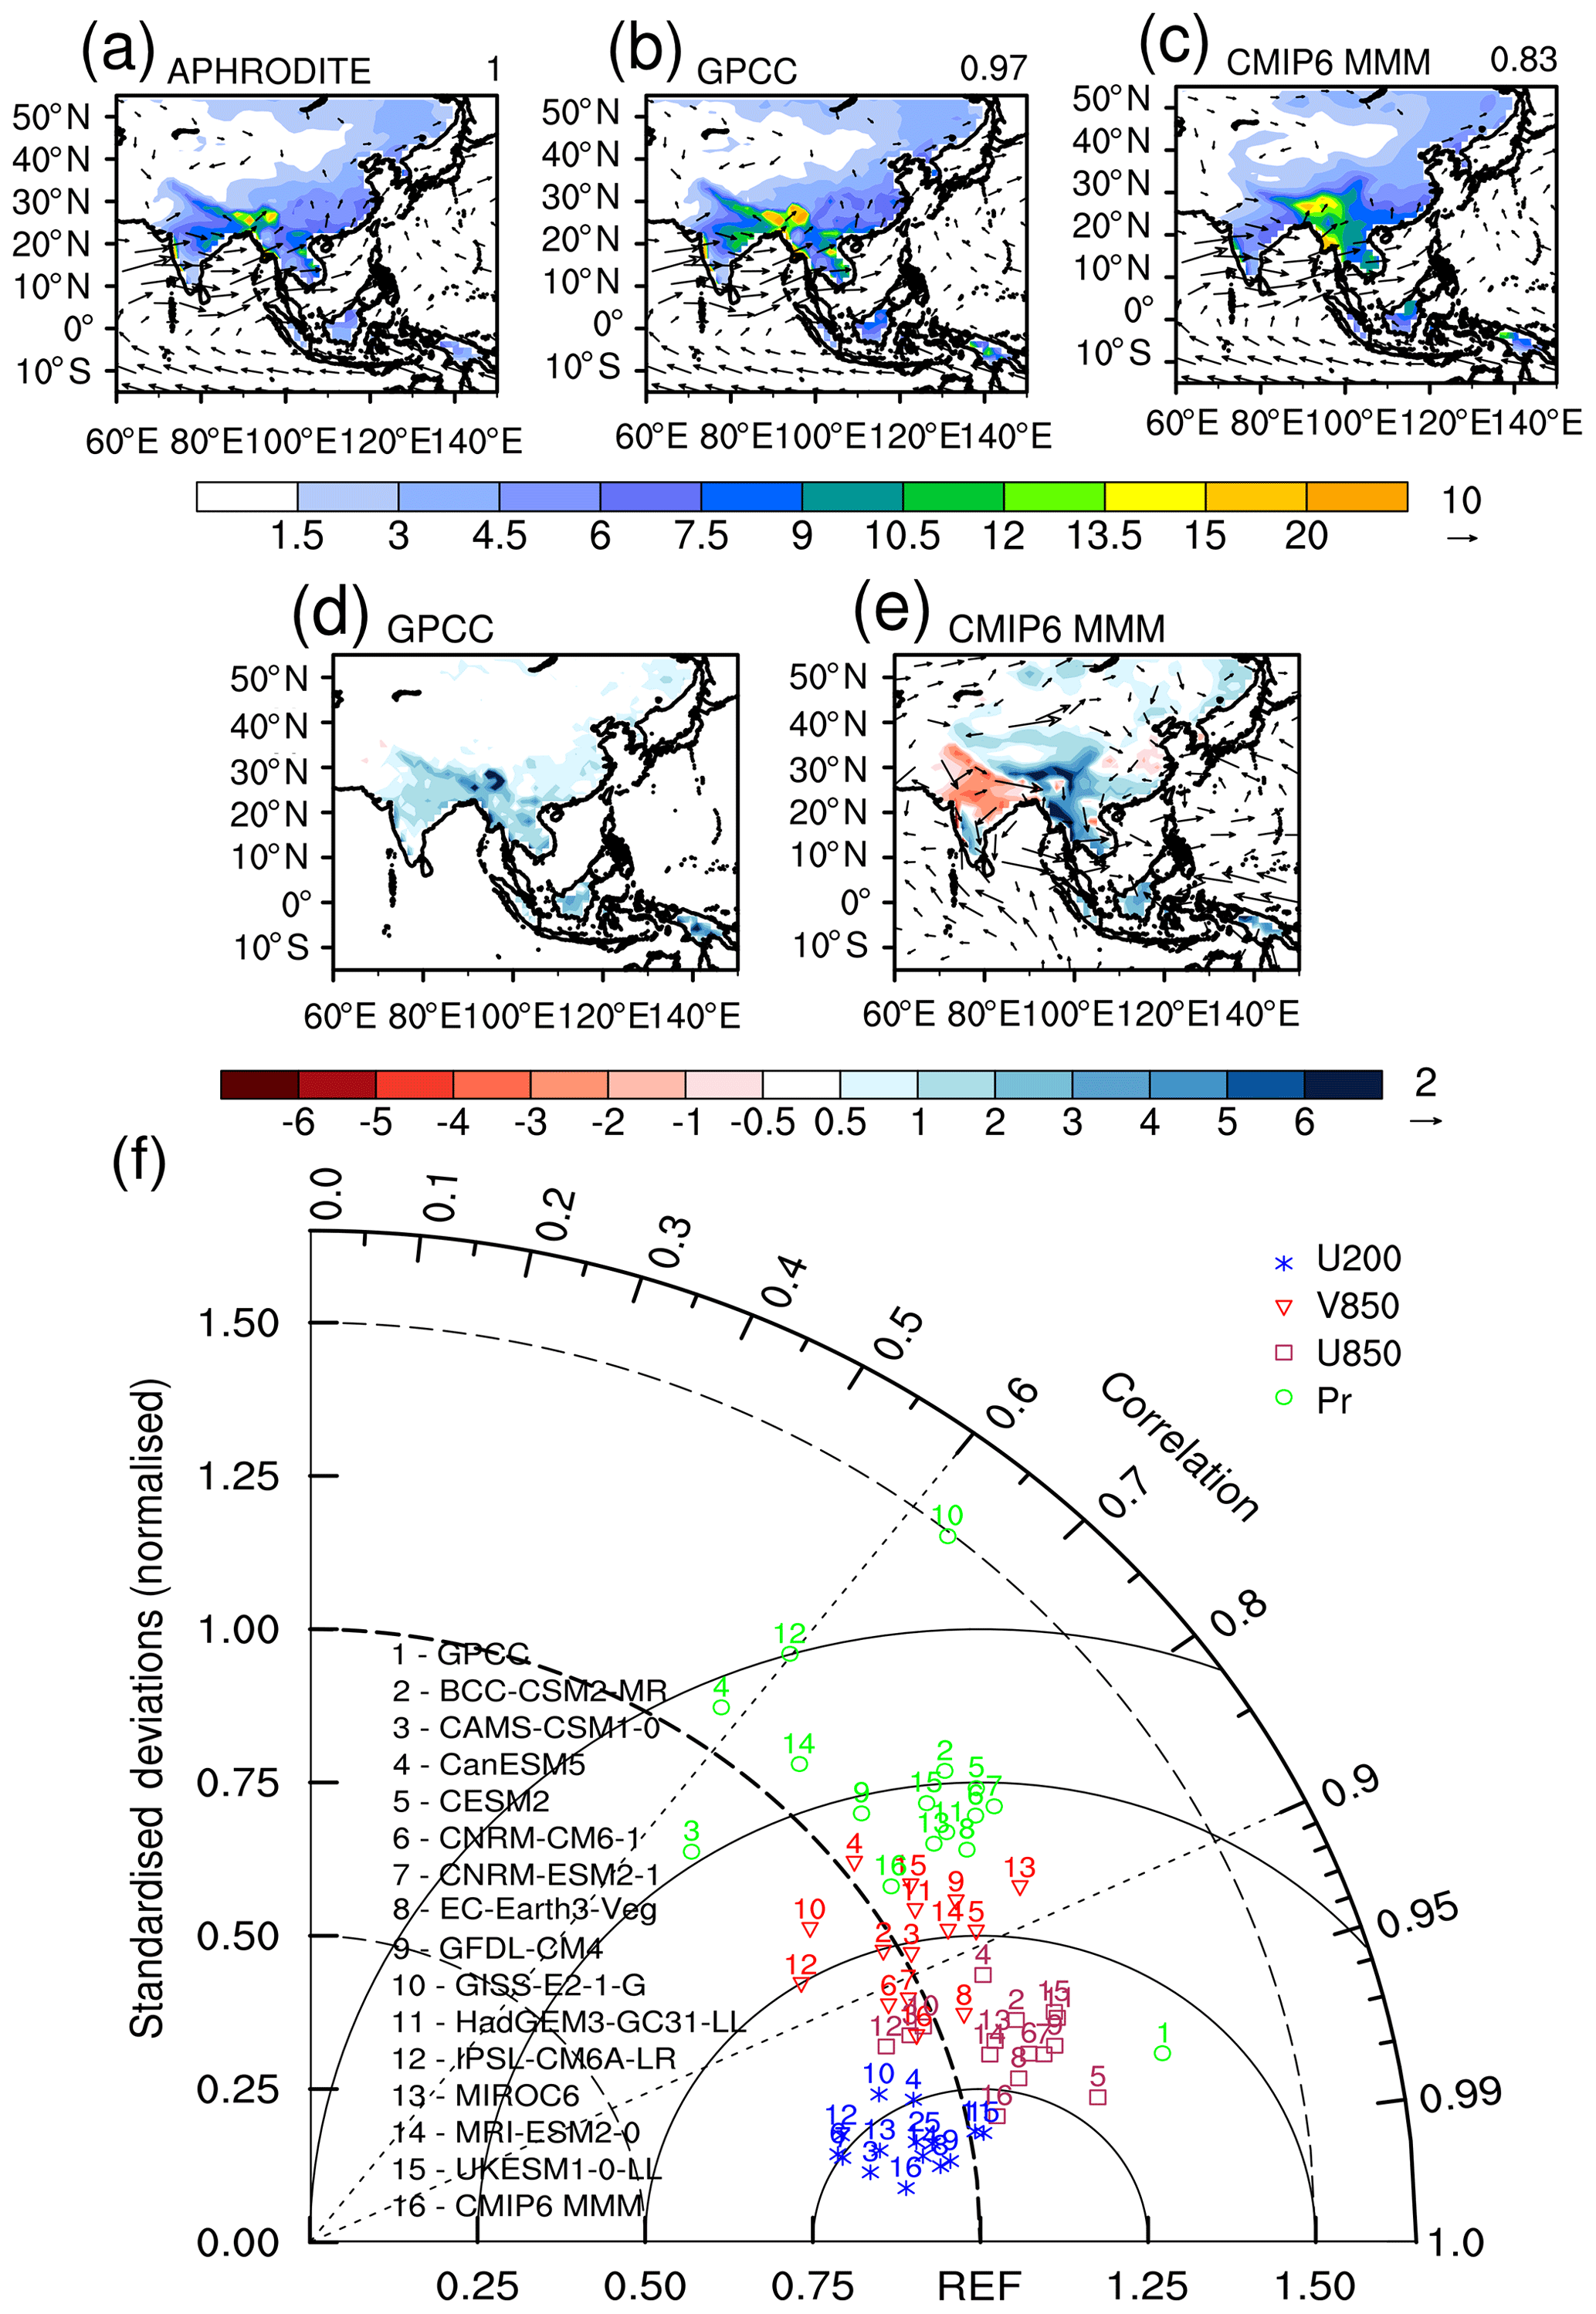
Figure 5JJA-mean 1980–2014 mean precipitation over land (mm d−1) overlaid with 850 hPa wind (m s−1) from (a) APHRODITE and ERA-Interim, (b) GPCC and ERA-Interim, and (c) CMIP6 (multi-model mean). Values in the top right corner of (a–c) show the pattern correlation with APHRODITE precipitation. (d) Precipitation bias in GPCC relative to APHRODITE. (e) CMIP6 precipitation relative to APHRODITE and CMIP6 850 hPa winds relative to ERA-Interim. (f) Taylor diagram showing the relationship between individual CMIP6 models, the CMIP6 multi-model mean (point 16), GPCC (point 1), and APHRODITE precipitation and ERA-Interim winds.
Compared to APHRODITE, the CMIP6 ensemble mean underestimates summer monsoon precipitation amount over India and overestimates it over the Tibetan Plateau and the Indochina peninsula (Fig. 5a, c, e). The magnitude of the bias between the CMIP6 multi-model mean and APHRODITE is comparable to the magnitude of the difference between observational datasets over north-east China and India, but the model biases over the Tibetan Plateau and the Indochina peninsula are relatively large (Fig. 5d, e). The modelled meridional component of the monsoon circulation at 850 hPa is too strong over the Equatorial Indian Ocean, while the flow over the Bay of Bengal and the extension of the circulation into China are too weak (Fig. 5e). This pattern is seen in almost all models and is highlighted in the comparison of the zonal and meridional components of the 850 hPa wind in CMIP6 and ERA-Interim in Fig. 5f. This weak extension of the summer monsoon into eastern China, with an anomalously strong extension into the subtropical west Pacific (Fig. 5e), is consistent with the pattern of differences between CMIP5 models and observations (Sperber et al., 2013). Nevertheless, the CMIP6 models are more skilful in their representation of the Indian summer monsoon compared to CMIP5 (Gusain et al., 2020).
While aspects of the CMIP6 multi-model mean summer monsoon compare well with observations, and the multi-model mean performs better than the individual models, there is a large inter-model diversity in the monsoon precipitation and atmospheric circulation (summarised in Fig. 5f; maps of present-day means, and anomalies compared to both APHRODITE and GPCP are shown for individual models Figs. S6–S10). Of the models we will consider on an individual basis in Sect. 4.1, CanESM5 has a small regional mean precipitation bias but a weak pattern correlation compared to APHRODITE. It has a particularly large dry bias over India, with less than 3 mm d−1 in the seasonal mean and a relatively large excess of precipitation over the Tibetan Plateau and into China. MIROC6 performs relatively well over land but has excessive precipitation west of India (Figs. S6, S7, S9 and S10). Such biases may affect the pattern of the precipitation anomaly in the SSPs relative to the present day (Wilcox et al., 2015).
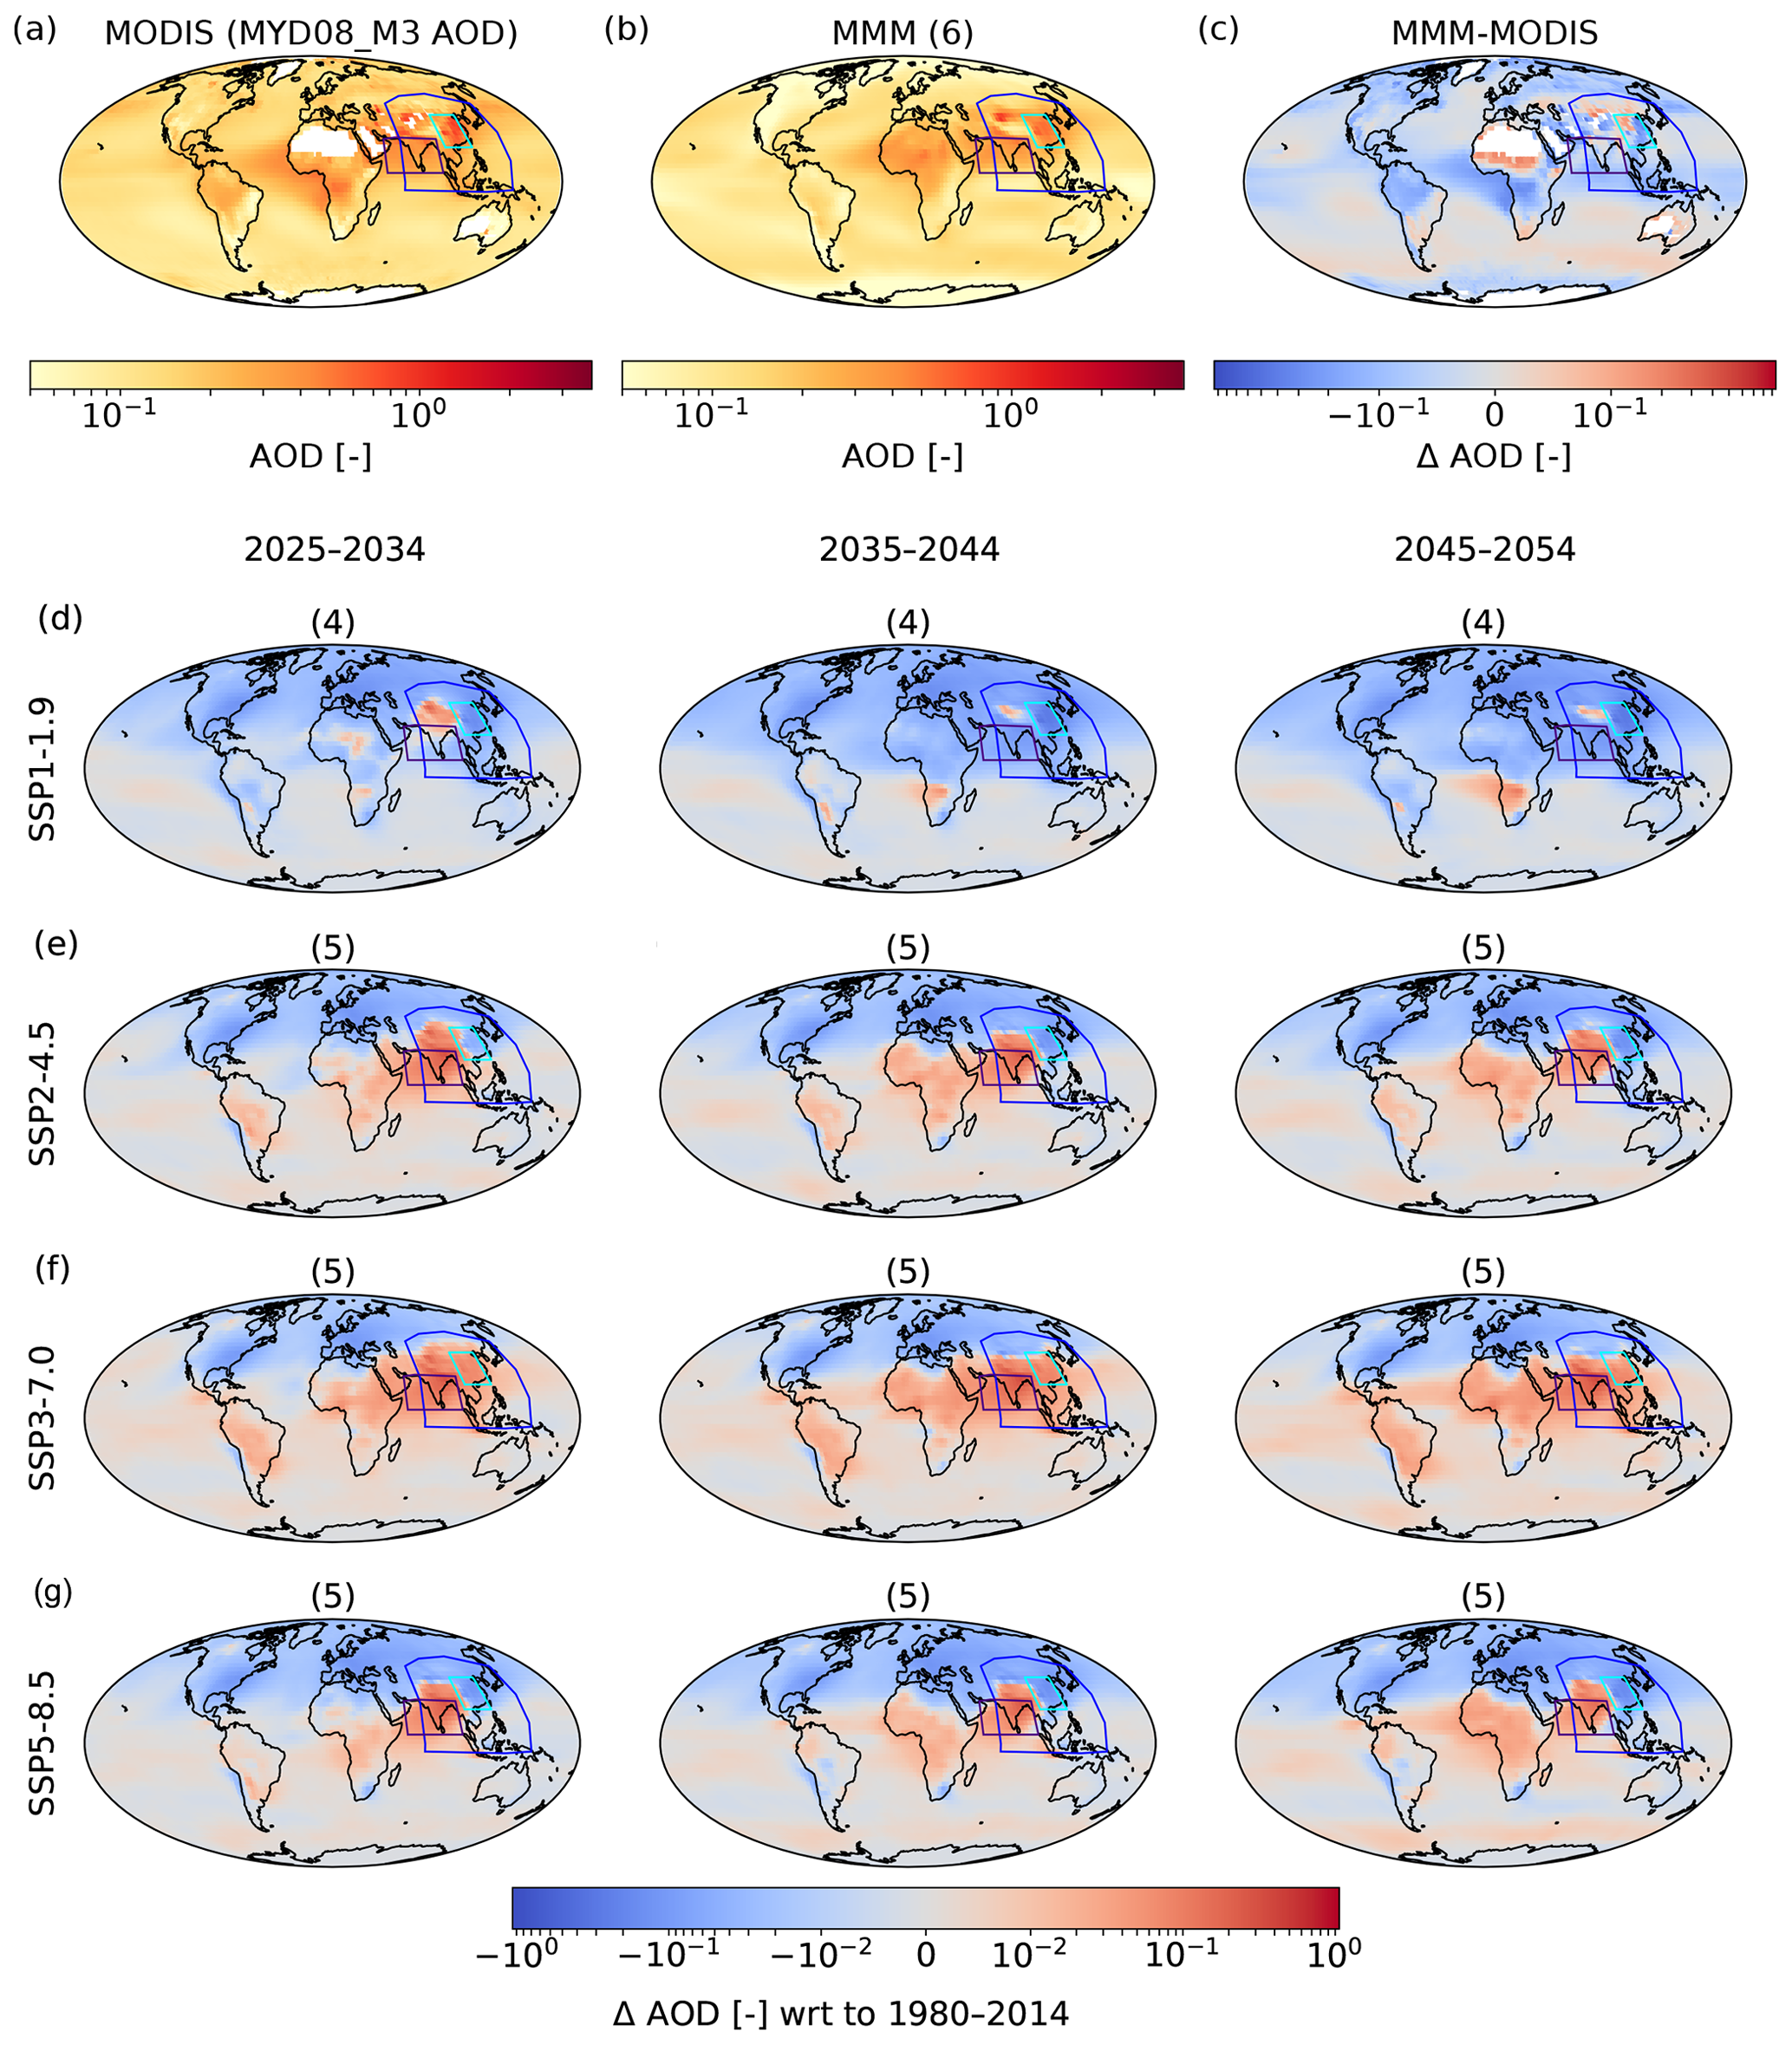
Figure 6(a) 2002–2014 mean aerosol optical depth at 550 nm from MODIS. (b) 2002–2014 mean CMIP6 multi-model mean aerosol optical depth at 550 nm (based on six models; see Table 1). (c) CMIP6 bias relative to MODIS. CMIP6 AOD anomalies for 2025–2034, 2035–2044, and 2045–2054 vs. 1980–2014 for (d) SSP1-1.9, (e) SSP2-4.5, (f) SSP3-7.0, and (g) SSP5-8.5. For SSP1-1.9 the anomalies are based on four models. For all other panels, five models are used (Table 1). Blue, purple, and turquoise boxes show the “Asia”, “South Asia”, and “East Asia” regions used in later analysis. Asia is the region bounded by 5–47.5∘ N, 67.5–145∘ E, East Asia is the region bounded by 20–40∘ N and 100–120∘ E, and South Asia is the region bounded by 5–25∘ N and 55–95∘ E.
Aerosol optical depth (AOD) is a measure of the extinction of solar radiation due to scattering and absorption by an aerosol layer. Comparison of 550 nm AOD from CMIP6 and MODIS (Remer et al., 2008; Platnick, 2015) for the common 2002–2014 period shows that models underestimate AOD over much of the Northern Hemisphere (NH) outside Asia and overestimate it in the Southern Hemisphere (SH) mid-latitudes (Fig. 6a–c). This pattern is common across models, with some exceptions over Asia (Fig. S11 shows the comparison between AOD from individual models and MODIS). CanESM5 overestimates AOD over Eurasia, and northern China in particular, compared to MODIS. UKESM1-0-LL and IPSL-CM6A-LR have more moderate overestimates of AOD over parts of Asia. However, both models underestimate AOD over eastern China, where very high AOD is seen in MODIS.
2.3 Future anthropogenic aerosol changes
In all SSPs the largest AOD changes are over Asia (Fig. 6d–o), consistent with the changes in aerosol and precursor emissions (Fig. 1). Future changes in AOD are characterised by global decreases in SSP1-1.9, with the exception of an initial increase over South Asia, and positive anomalies relative to 1980–2014 over the Tibetan Plateau and southern Africa, which may have a dust component (Fig. 6d–f). AOD changes are characterised by regional contrasts in SSP2-4.5 and SSP5-8.5, with an overall decrease in the NH contrasted with an increase in the SH, and large decreases over East Asia against large increases over South Asia until the 2030s (Fig. 6g–i, m–o). This Asian dipole pattern is persistent in SSP2-4.5 and SSP5-8.5 and strengthens from the present until the 2040s. In these pathways, aerosol and precursor emission are similar, with the large increases in South Asian AOD predominantly driven by increases in SO2 emissions (Fig. 1). Emissions of black carbon in South Asia do follow different trajectories in the two pathways, but black carbon accounts for a smaller proportion of the total emission (Fig. 1) and thus the total AOD. The final scenario we consider, SSP3-7.0, again contrasts widespread decreases in NH AOD against increases in the SH (Fig. 6j–l). However, this scenario also includes large aerosol and precursor emission and AOD increases over East Asia and particularly South Asia. These increases are driven predominantly by SO2 over South Asia but have a BC contribution over East Asia (Fig. 1). As East Asian SO2 is roughly constant between 2014 and 2050 in SSP3-7.0, much of the large positive anomaly there is a reflection of the large positive trend in AOD between 1980 and 2014. The AOD pattern in SSP3-7.0 persists through the three periods shown in Fig. 6, but the East Asian increase starts to weaken by 2050 (Fig. 1).
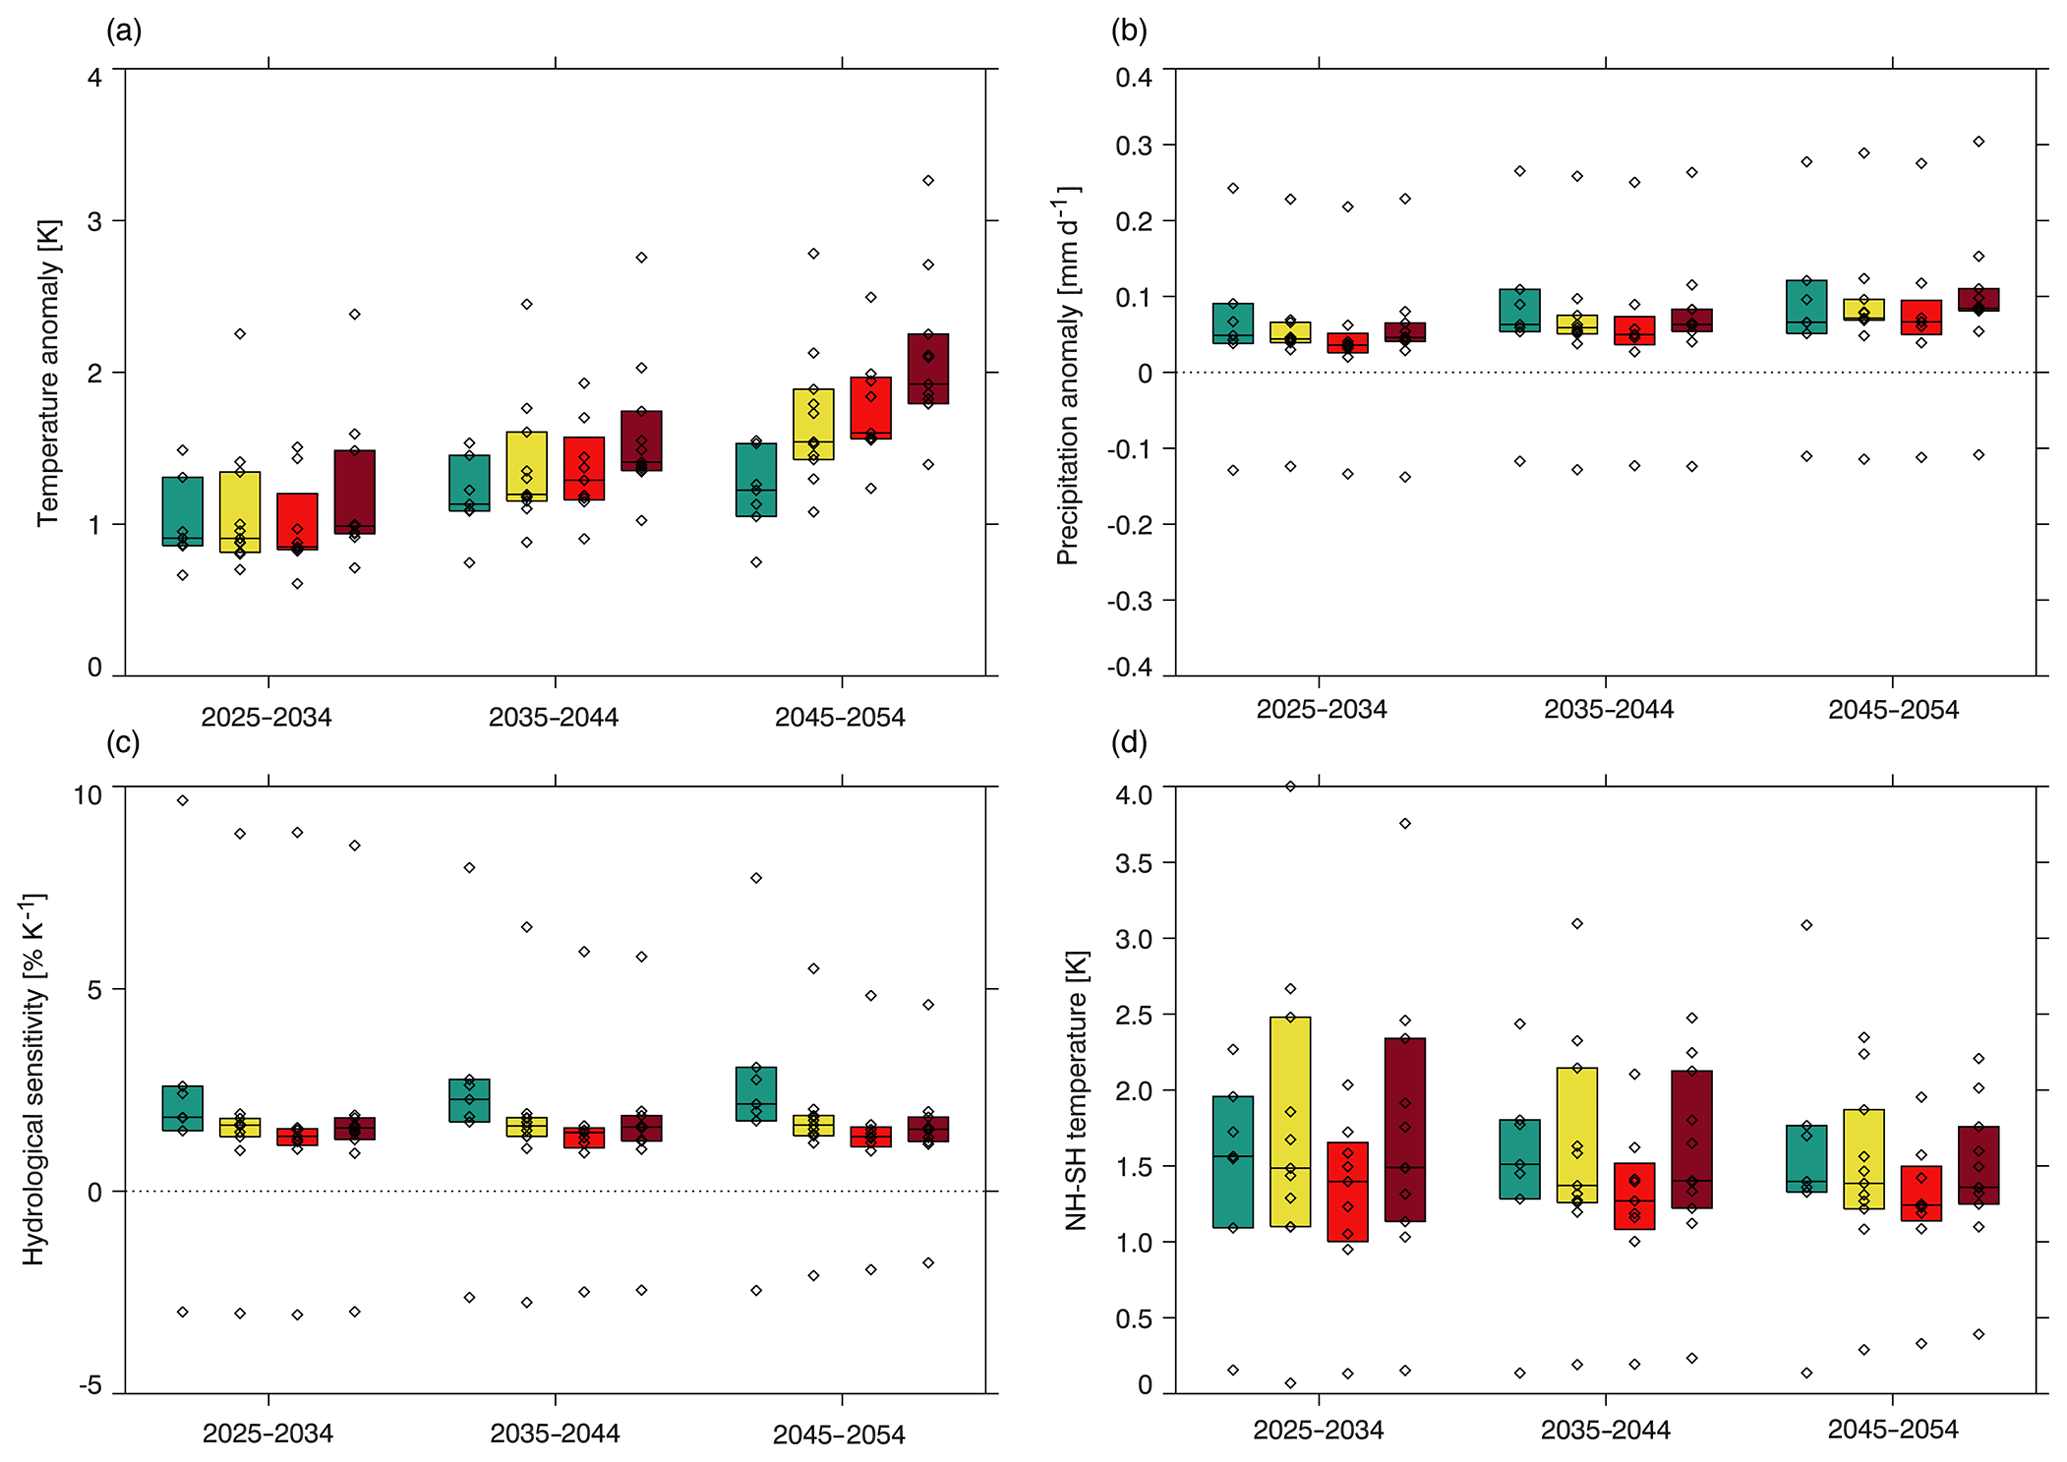
Figure 7Global-mean annual-mean anomalies in (a) near-surface temperature (K), (b) precipitation (mm d−1), and (c) hydrological sensitivity (% K−1) relative to 1980–2014. (d) Annual-mean anomalies in interhemispheric temperature gradient (K) relative to 1980–2014. Coloured bars show the interquartile range, and the horizontal bar within this shows the median. Diamonds show values from each model listed in Table 1 as having data availability for a given SSP. Where multiple ensemble members are available, the model mean is used.
Global-mean annual-mean temperature, precipitation, interhemispheric temperature gradient, and hydrological sensitivity anomalies for 2025–2034, 2035–2044, and 2045–2054 relative to 1980–2014 are shown in Fig. 7. The boxes show the interquartile range, based on the mean response from each individual model. Individual model responses are overlaid as black diamonds, and the horizontal bar shows the multi-model median. The 95 % confidence interval (95 % CI) about a median can be found from the empirical relationship:
where IQR is the interquartile range, and n is the number of points (McGill et al., 1978). For the sample size used in this work (n=11), , so we use the interquartile range to determine significance, rather than assuming that the confidence interval is symmetric about the median. Significant differences between anomalies from different SSPs are identified when the median anomaly from one SSP lies outside the interquartile range of another and give additional support for the qualitative aerosol- and GHG-driven patterns sketched in Fig. 3.
For each period shown in Fig. 7a, the global-mean temperature anomalies are broadly ordered according to their GHG pathway and diverge with time in a similar fashion to GHG emissions (Figs. 1c and 3). By 2045–2054, SSP2-4.5, 3-7.0, and 5-8.5 anomalies relative to 1980–2014 are significantly larger than those for SSP1-1.9. The anomaly from SSP5-8.5 is also significantly larger than that from SSP2-4.5. This suggests that anthropogenic aerosol plays a limited role in the evolution of global mean near-surface temperature on these timescales, supporting the conclusions of Shindell and Smith (2019). However, as will be discussed in Sect. 4, anthropogenic aerosol does play a role in the pattern and magnitude of regional temperature change. Importantly, anthropogenic aerosol is the main driver of trends in the interhemispheric temperature gradient until 2050 (Figs. 3 and 7d), which has a strong control on ITCZ position and the global monsoon and thus regional precipitation. There is a large spread in interhemispheric temperature gradient anomalies across models, consistent with the large uncertainty in historical trends (Fig. 4e), but a monotonic increase in the magnitude of the median anomaly from SSP3-7.0 to SSP1-1.9, consistent with an aerosol-driven response, is present in all three future periods. In 2035–2044 and 2045–2054 the SSP3-7.0 anomaly is significantly smaller than the SSP1-1.9 anomaly. The dominant role of anthropogenic aerosol is further supported by the comparable magnitude of anomalies in SSP2-4.5 and SSP5-8.5 (Figs. 3 and 7d).
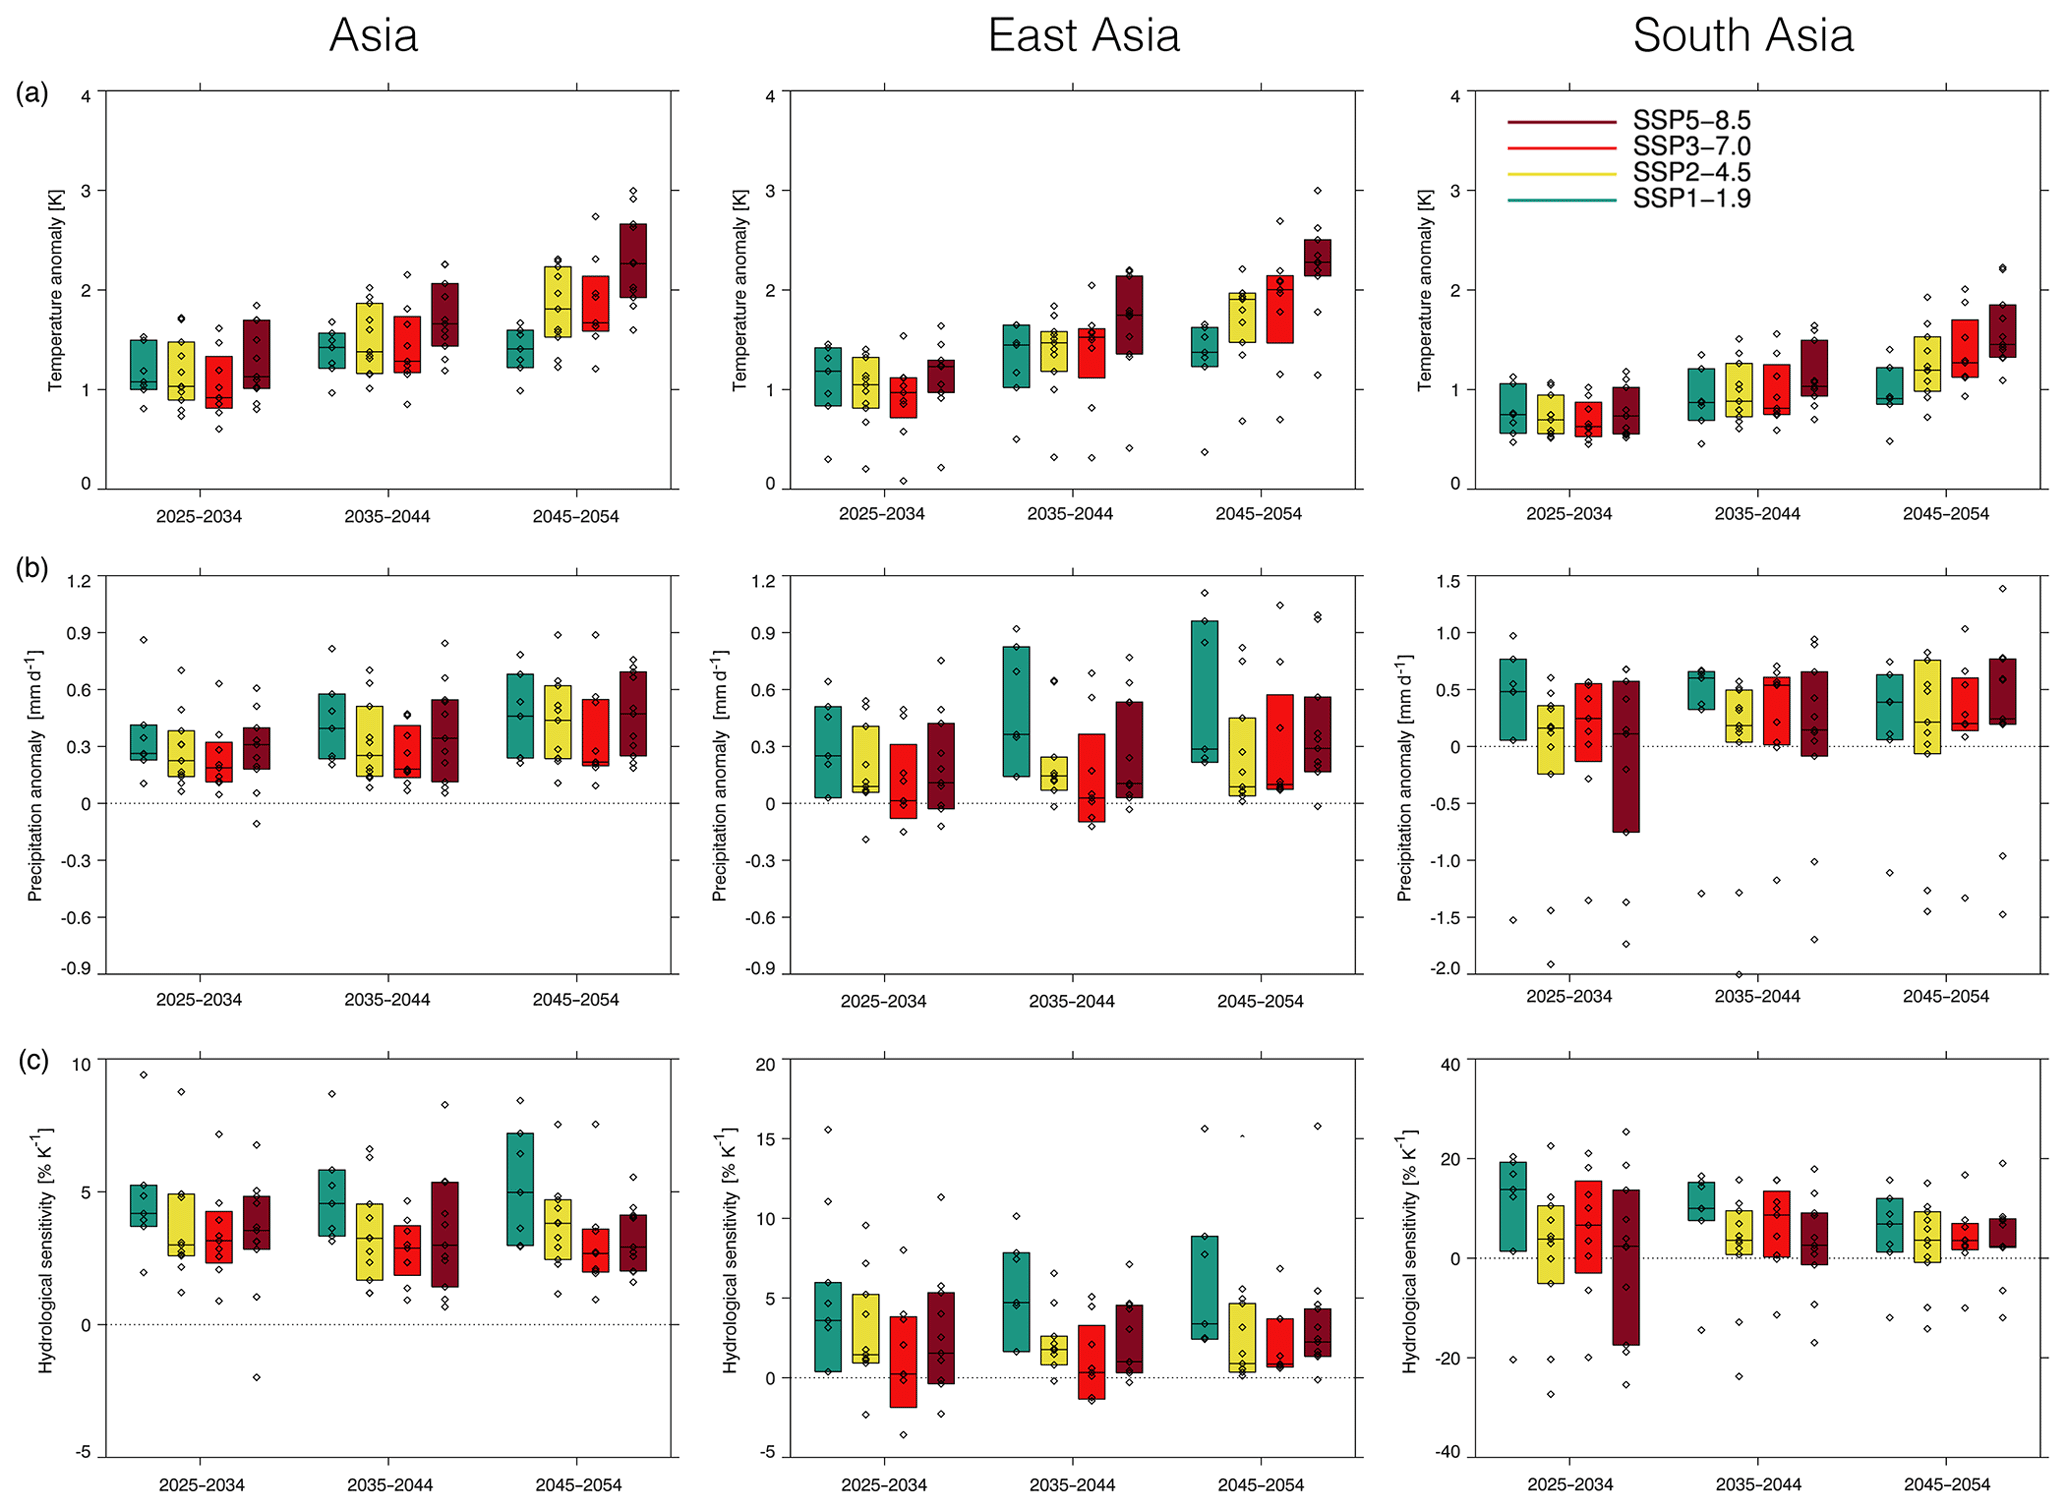
Figure 8Regional-mean JJA-mean (a) temperature (K), (b) precipitation (mm d−1), and (c) hydrological sensitivity (% K−1) anomalies relative to 1980–2014 for Asia, East Asia, and South Asia. The three regions are indicated by the boxes in Fig. 6. Coloured bars show the interquartile range, and the horizontal bar within this shows the median. Diamonds show values from each model listed in Table 1 as having data availability for a given SSP. Where multiple ensemble members are available, the model mean is used. Note that different y ranges are used for each region in (b) and (c).
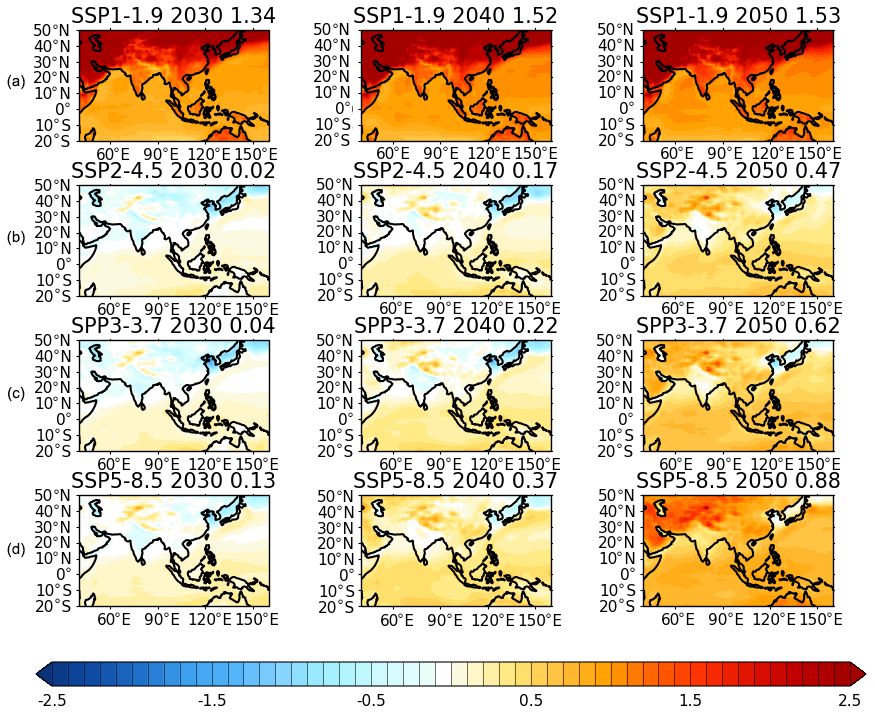
Figure 9(a) CMIP6-mean JJA-mean near-surface temperature anomaly (K) for 2025–2034, 2035–2044, and 2045–2054 vs. 1980–2014 from SSP1-1.9. Relative anomalies for (b) SSP2-4.5, (c) SSP3-7.0, and (d) SSP5-8.5 vs. SSP1-1.9. The numbers shown at the top right of each panel are the Asian mean, where Asia is the region bounded by 5–47.5∘ N, 67.5–145∘ E.

Figure 10Asia-mean JJA-mean precipitation anomaly (%) relative to 1980–2014 in scenario and model means and individual ensemble members for 2021–2040, 2041–2060, and 2081–2100 from SSP1-1.9, SSP2-4.5, and SSP3-7.0.
There is a clear aerosol-driven signal in future increases in global mean precipitation and hydrological sensitivity (Figs. 3 and 7b, c), with a significantly larger median anomaly in SSP1-1.9 compared to SSP3-7.0 in 2025–2034 and 2035–2044. There is the suggestion of the beginning of a shift towards GHGs as the dominant driver of precipitation increases in 2050, where the median SSP1-1.9 anomaly is marginally smaller than in SSP2-4.5, and the median anomaly in SSP5-8.5 is marginally larger than that in SSP2-4.5. GHGs are the main driver of global precipitation change by the end of the 21st century (not shown). The aerosol signal in hydrological sensitivity is larger and more persistent. SSP1-1.9 has significantly larger median hydrological sensitivity anomalies relative to 1980–2014 than SSP3-7.0 in 2025–2034 and significantly larger median anomalies than all other SSPs in 2035–2044 and 2045–2054. SSP1-1.9 anomalies remain larger throughout the 21st century (not shown).
A number of prominent outliers can be seen in Fig. 7. These points are not indicators of uncertainty in the response to anthropogenic aerosol emissions in the SSPs or in the relative differences in the anomalies compared to 1980–2014 from each SSP: for each variable the outlying model is the same for each period; and for precipitation and hydrological sensitivity the high outliers can be seen to show the same aerosol-driven pattern across the periods as the multi-model median response. The outliers are likely reflections of differing climate sensitivities in the models (Table 2). As shown in Fig. 4e, there are large positive trends in both global-mean temperature and precipitation between 1980 and 2014, which contribute to the magnitude of the anomalies shown in Fig. 7. Models in Fig. 7 with large temperature anomalies are CanESM5 and UKESM1-0-LL. MIROC6 has the smallest anomalies. These models are also those with the highest and lowest equilibrium climate sensitivities in our ensemble (Table 2). For precipitation, the large outlier is UKESM1-0-LL, and the small outlier is CAMS-CSM1-0. The precipitation climatologies and patterns of future changes for these models are not unusual compared to other models, as can be seen in Figs. S6–S10 and S16.
The decrease in Asian monsoon precipitation observed in the second half of the 20th century has been largely attributed to the global increase in anthropogenic aerosols (Bollasina et al., 2011; Song et al., 2014; Polson et al., 2014). The hemispheric asymmetry in aerosol forcing leads to an energy imbalance between the hemispheres, which in turn causes a slowdown of the meridional overturning circulation, and a weakening of the monsoon circulation (Bollasina et al., 2011; Song et al., 2014; Lau et al., 2017; Undorf et al., 2018). Local aerosol emissions further modify monsoon circulation and precipitation (Cowan and Cai, 2011; Guo et al., 2015; Undorf et al., 2018). In contrast to anthropogenic aerosols, where circulation changes are an important component of the response to forcing, GHGs mainly affect (increase) monsoon precipitation by enhancing tropospheric water vapour and thus increasing moisture transport toward India (Li et al., 2015).
Global aerosol reductions in SSP1-1.9 briefly cause faster warming over all Asian regions than the other scenarios considered, with SSP1-1.9 warming significantly more than SSP3-7.0, but this effect does not persist beyond the 2040s (Fig. 8a). However, anthropogenic aerosol does affect the regional pattern of warming (Fig. 9), with slower increases in land temperature in many areas, and India in particular, in SSP2-4.5, 3-7.0, and 5-8.5 compared to SSP1-1.9. This pattern is robust across models (Fig. S12). The growing influence of GHGs with time can also be seen in Figs. 8a and 9 as greater warming in SSP5-8.5 compared to SSP2-4.5 in the 2040s. The GHG-driven pattern is established by 2045–2054, when all SSPs warm significantly more than SSP1-1.9. Continued increases in anthropogenic aerosol emissions in SSP3-7.0 appear to moderate land warming compared to other SSPs, despite large GHG increases (Figs. 8a and 9).
The influence of aerosol is more clearly seen, and more persistent in time, in regional mean precipitation than regional mean temperature (Figs. 3 and 8a, b), as for the global-mean case (Fig. 7b). Over Asia, the largest model-median precipitation increase relative to 1980–2014 occurs in SSP1-1.9 for 2025–2034 and 2035–2044 (significantly larger than SSP2-4.5 in 2025–2034 and significantly larger than SSP3-7.0 in all periods shown). The smallest precipitation increases are seen in SSP3-7.0 during these periods. Increases in SSP2-4.5 lie between those in SSP3-7.0 and SSP1-1.9. The same pattern is seen over East Asia. There is some indication that precipitation anomalies relative to 1980–2014 are slightly larger in SSP5-8.5 compared to SSP2-4.5, but the growing difference between the two scenarios that was seen for temperature is not seen here. By 2100, GHGs are the dominant influence on the relative magnitude of the future increases in Asian summer monsoon precipitation across the SSPs, but the timing of the transition is model-dependent, as illustrated in Fig. 10.
Over Asia and East Asia, precipitation increases relative to 1980–2014 are significantly smaller in SSP3-7.0 compared to SSP1-1.9 until the mid-21st century (Fig. 8b). Over East Asia, JJA mean precipitation is not significantly larger than in 1980–2014 in SSP3-7.0 until 2045–2054. A similar pattern of aerosol-dominated differences between the SSPs is seen in hydrological sensitivity over Asia and East Asia (Figs. 3 and 8c). The beginnings of the GHG influence are seen in hydrological sensitivity over East Asia in 2045–2054, when the SSP5-8.5 anomaly is slightly larger than that from SSP2-4.5. However, the clear GHG-dominated pattern seen for temperature (Fig. 8a) is not seen here.
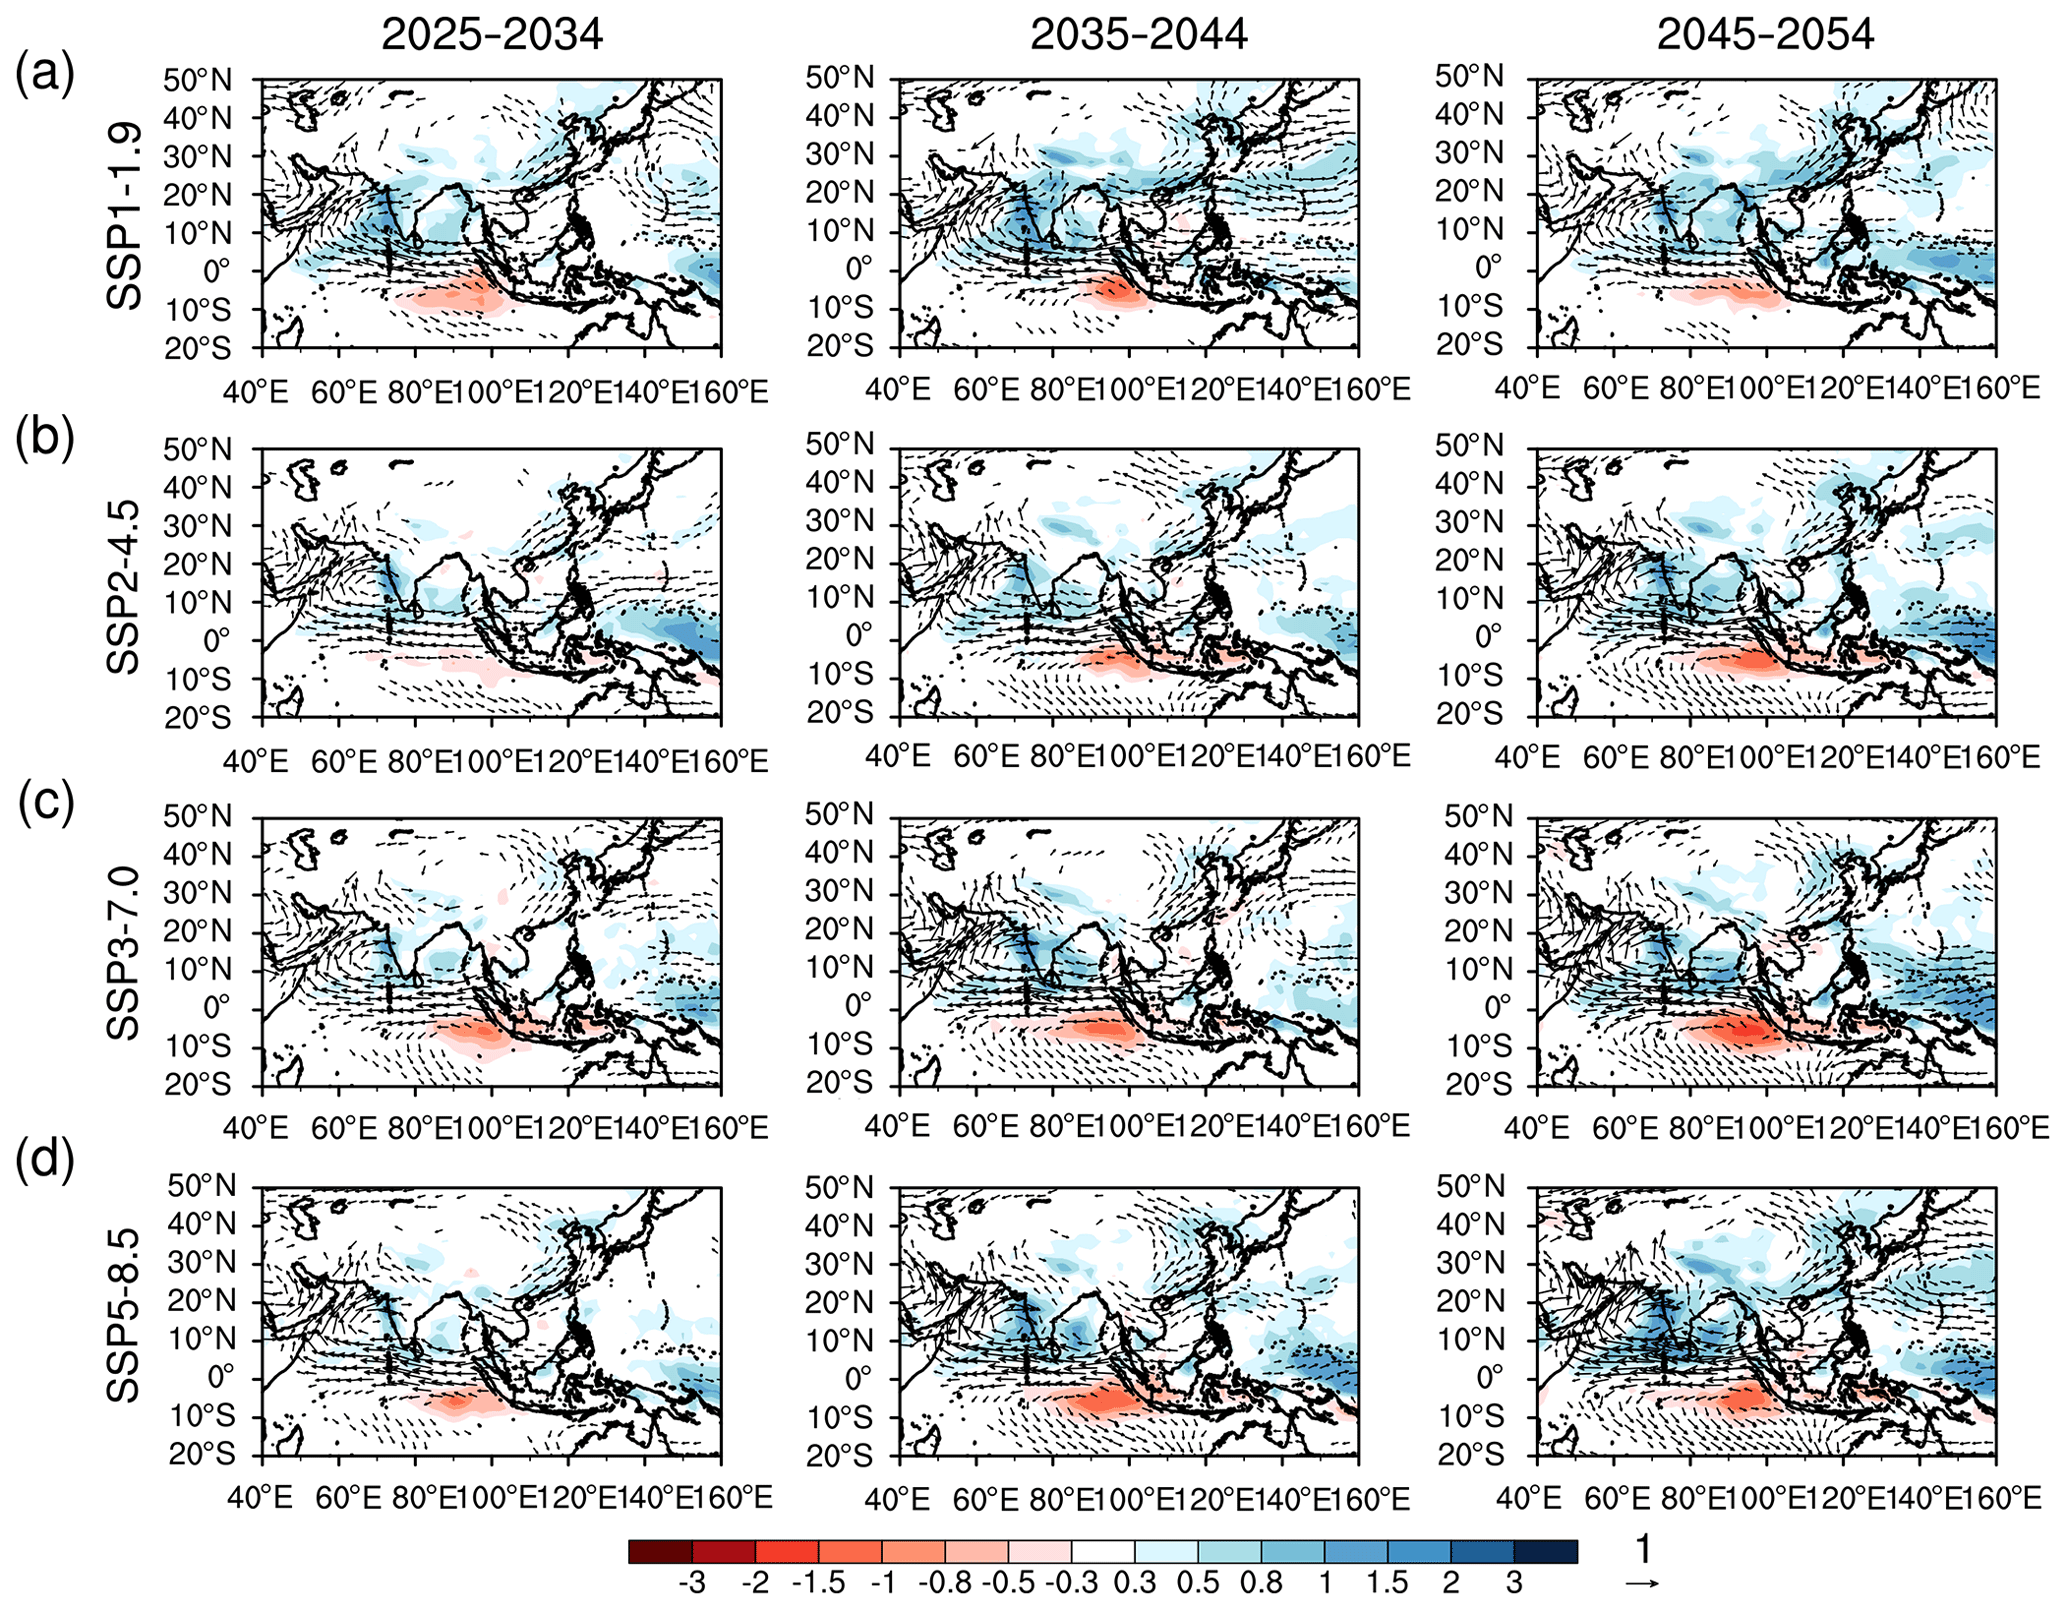
Figure 11CMIP6-mean JJA-mean precipitation (mm d−1) and 850 hPa wind anomalies (m s−1) for 2025–2034, 2035–2044, and 2045–2054 vs. 1980–2014 from (a) SSP1-1.9, (b) SSP2-4.5, (c) SSP3-7.0, and (d) SSP5-8.5.
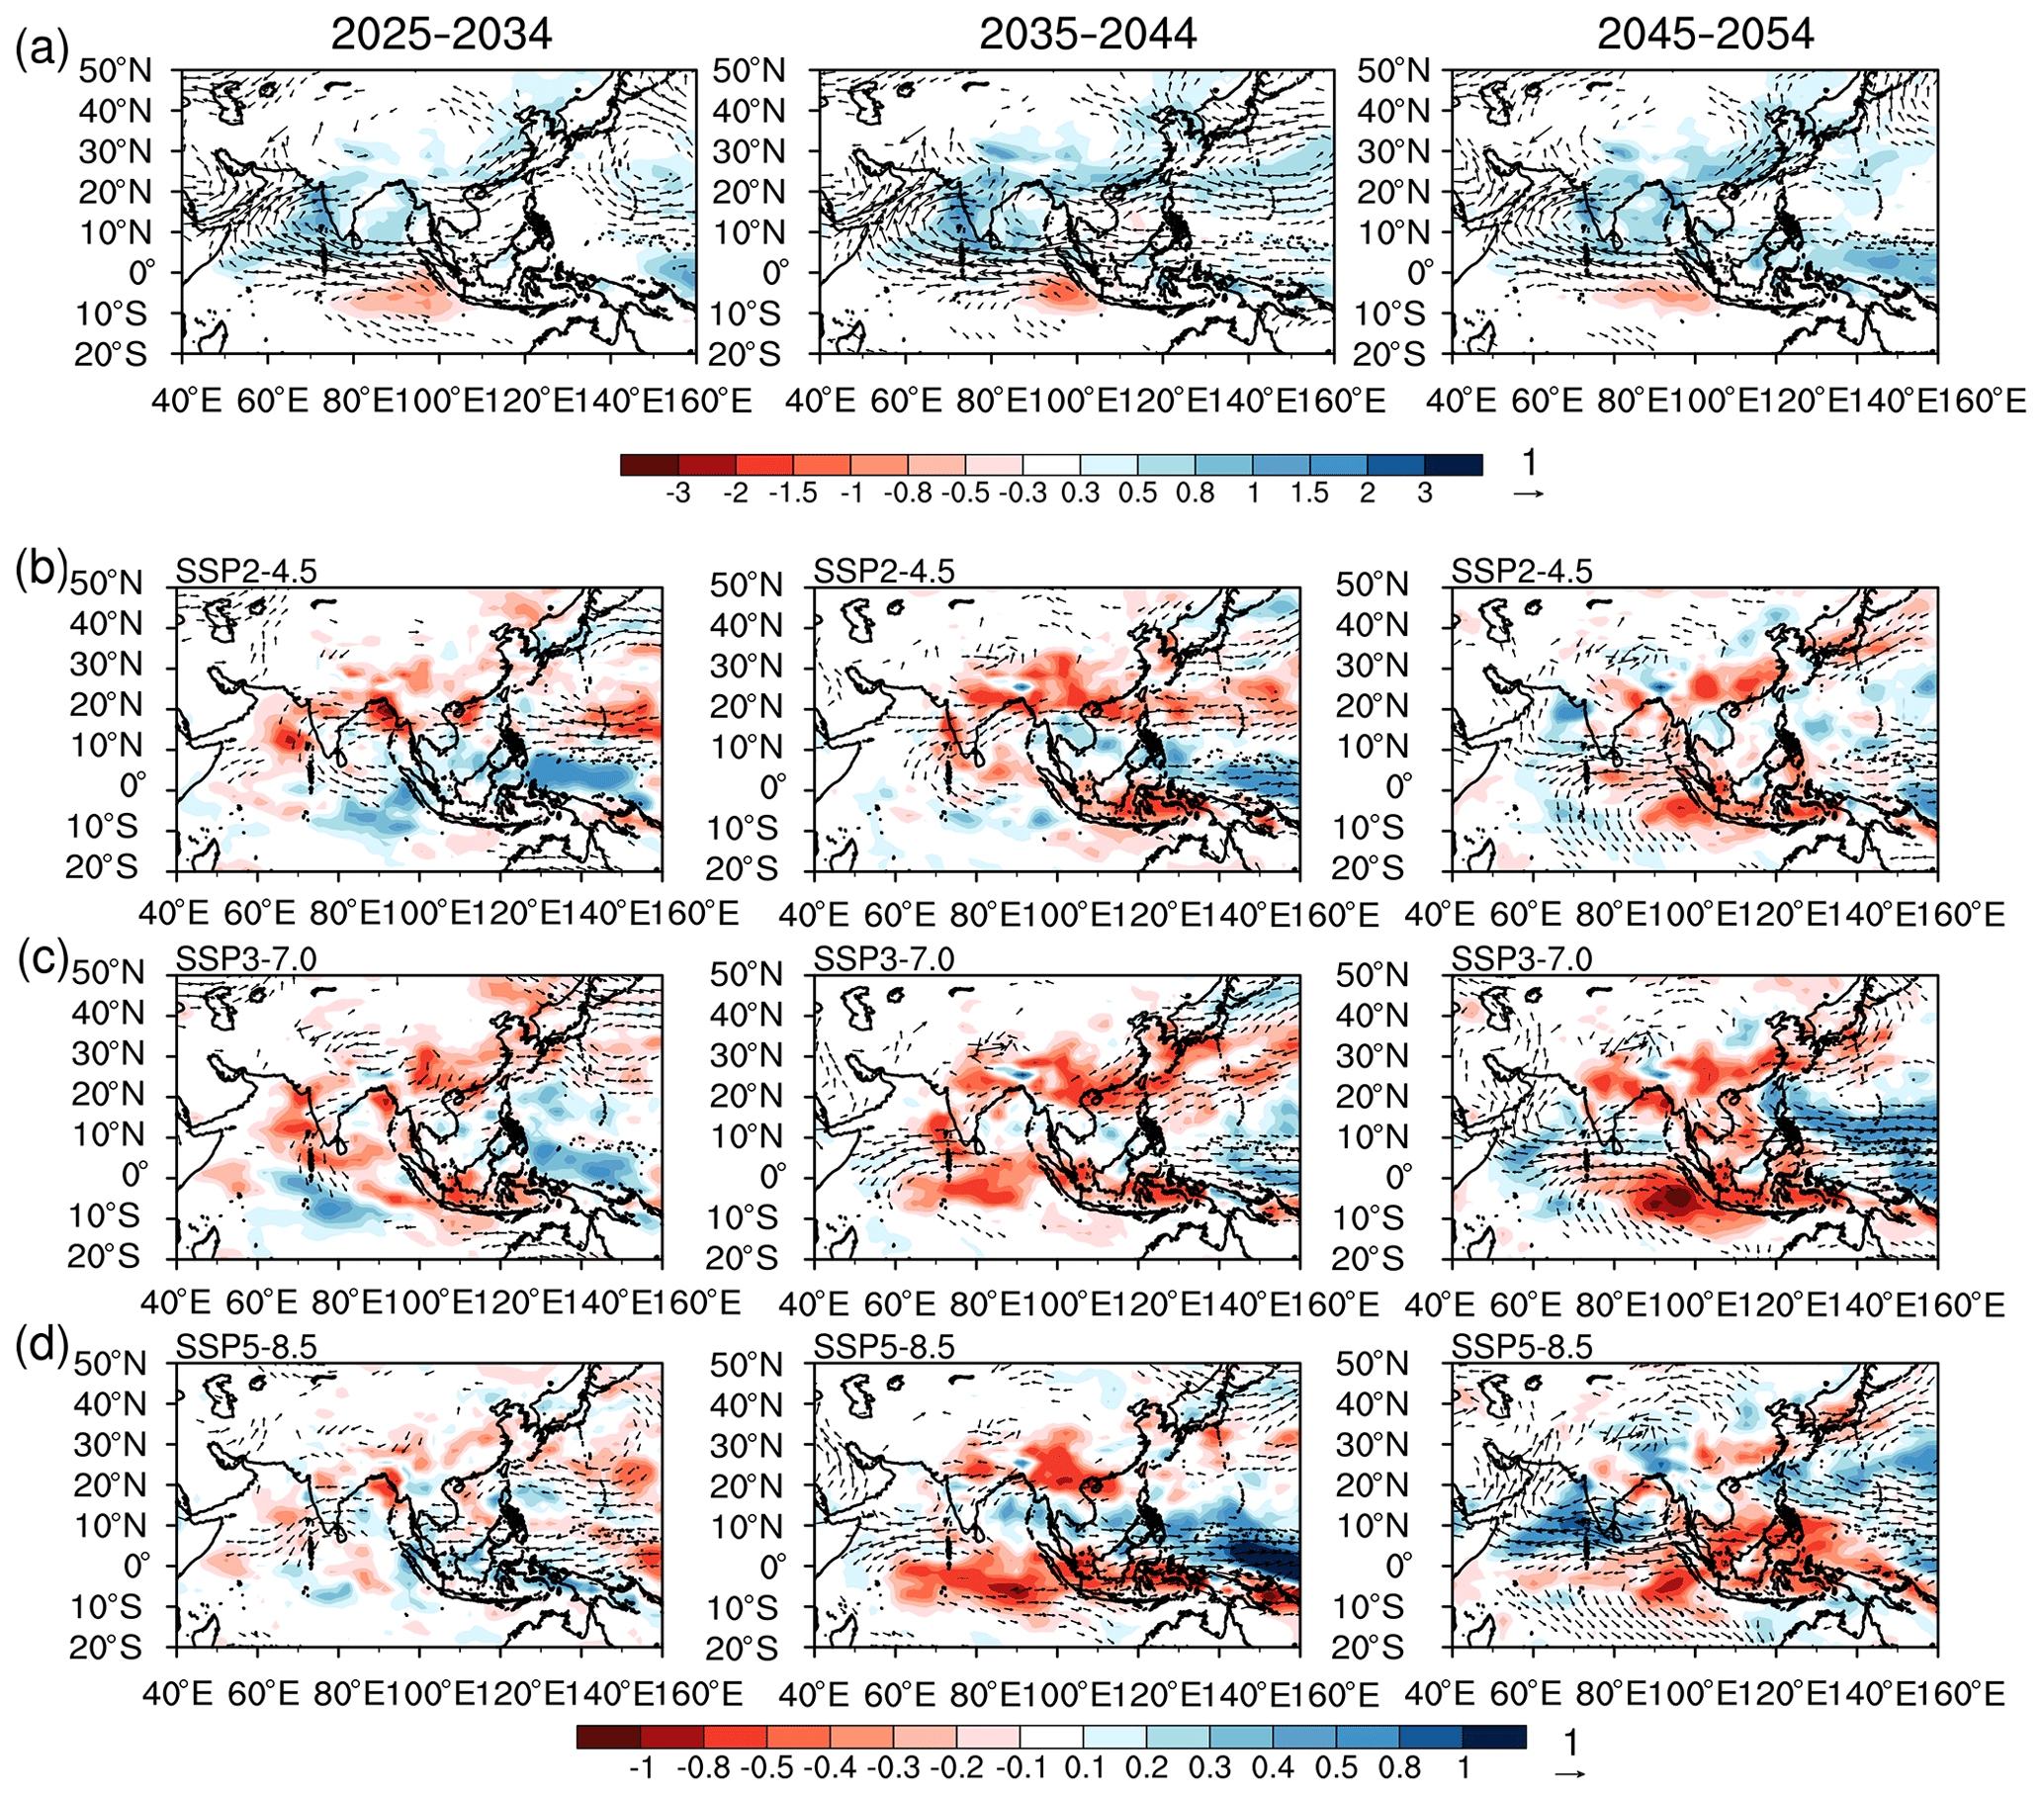
Figure 12(a) JJA-mean precipitation (mm d−1) and 850 hPa wind anomalies (m s−1) for 2025–2034, 2035–2044, and 2045–2054 vs. 1980–2014 from SSP1-1.9. Anomalies from (b) SSP2-4.5, (c) SSP3-7.0, and (d) SSP5-8.5 relative to the anomalies from SSP1-1.9. To enable a fair comparison of the precipitation patterns, only models with data availability for all scenarios are used (see Table 1).
Figures 11 and 12 show that the pattern of Asian precipitation changes is similar, regardless of the emission pathway that is followed, but that the magnitude of the changes is pathway-dependent, as summarised in Fig. 8. Figure 11 shows the absolute anomaly compared to 1980–2014, while Fig. 12 shows the anomaly relative to the SSP1-1.9 response. In Fig. 12, the influence of GHGs can be seen, with greater GHG emissions driving greater drying over the Equatorial Indian Ocean and further increases in precipitation over India (particularly in the comparison between SSP2-4.5 and SSP5-8.5 and in SSP3-7.0 in the 2050s), as for temperature (Fig. 9). Precipitation increases are smaller in SSP2-4.5, SSP3-7.0, and SSP5-8.5 compared to SSP1-1.9 (Figs. 8 and 11), mainly due to differences over northern India, Bangladesh, and the Bay of Bengal (Fig. 12). The pattern seen in the model-mean anomaly (Fig. 12) is robust across models (Fig. S13).
The pattern of precipitation anomalies relative to 1980–2014 across the SSPs is different over South Asia compared to East Asia and Asia (Figs. 3 and 8). This suggests that the continued increases in local aerosol emissions may be relatively more important here than the remote decreases. All precipitation anomalies are positive, although many are not significantly different to zero. In 2025–2034 and 2035–2044 precipitation and hydrological sensitivity anomalies in SSP2-4.5 and SSP5-8.5 are smaller than those in SSP1-1.9 and SSP3-7.0, following neither the pattern expected from global and East Asian aerosol pathways, nor the GHG pathways (Fig. 3). This similarity between SSP2-4.5 and SSP5-8.5, which is seen in all three periods for South Asia, suggests that the dipole in aerosol and precursor emissions and AOD anomalies between East Asia and South Asia in these scenarios (Figs. 1 and 6) may be further suppressing future increases in precipitation over South Asia due to feedback between the East and South Asian monsoon system responses to forcing (Ha et al., 2018; Singh et al., 2019a). Overall, there is much more uncertainty in the South Asian precipitation changes compared to East Asia, as evidenced by the larger inter-model spread (Fig. 8). Land use changes may also contribute to scenario uncertainty in South Asian precipitation changes (Singh et al., 2019b), although they are likely to be very model-dependent and influence smaller spatial scales than those we consider here (Figs. 2 and S3).
4.1 Aerosol only SSP2-4.5
The deviation of the South Asian precipitation response from the GHG- and aerosol-driven patterns sketched in Fig. 3 suggests that the response to local aerosol changes, which have a different time evolution to those over East Asia and in the global mean (Fig. 1), may be competing with the response to remote aerosols emission changes. Such behaviour is consistent with the findings in earlier investigations of precipitation changes over South Asia, which have shown that both regional and local changes in anthropogenic aerosol are required to reproduce historical trends (e.g. Guo et al., 2016; Undorf et al., 2018). The suppressed precipitation increase in SSP2-4.5 and SSP5-8.5 relative to SSP1-1.9 and SSP3-7.0 is a fingerprint of the Asian dipole in AOD trends seen in these scenarios until the mid-21st century and in current observations (Fig. 6; Samset et al., 2019).
Analysis of SSP2-4.5-aer, in which only anthropogenic aerosol emissions are varying with time following the SSP2-4.5 pathway, allows the response to aerosol changes in this pathway to be isolated from that due to GHG increases. In this case, a dipole in temperature anomalies, with cooling over India and warming over East Asia, and in sea-level pressure, with a positive anomaly over India, the Bay of Bengal, and the Indochina peninsula, and a negative anomaly over the rest of Asia, can clearly be seen in both MIROC6 (Fig. 13) and CanESM5 (Fig. S14). This feature matches the dipole pattern in AOD changes (Fig. 6) and is apparent in the SSP2-4.5 response up to 2050 as a moderated GHG-induced warming over South Asian relative to East Asia (Figs. 9 and 14). Comparing the SSP2-4.5-aer and SSP2-4.5 responses (Figs. 13 vs. 14 for MIROC6; Figs. S14 vs. S15 for CanESM5) shows that aerosol largely acts to offset the GHG-driven response, rather than determining the overall pattern of the response.
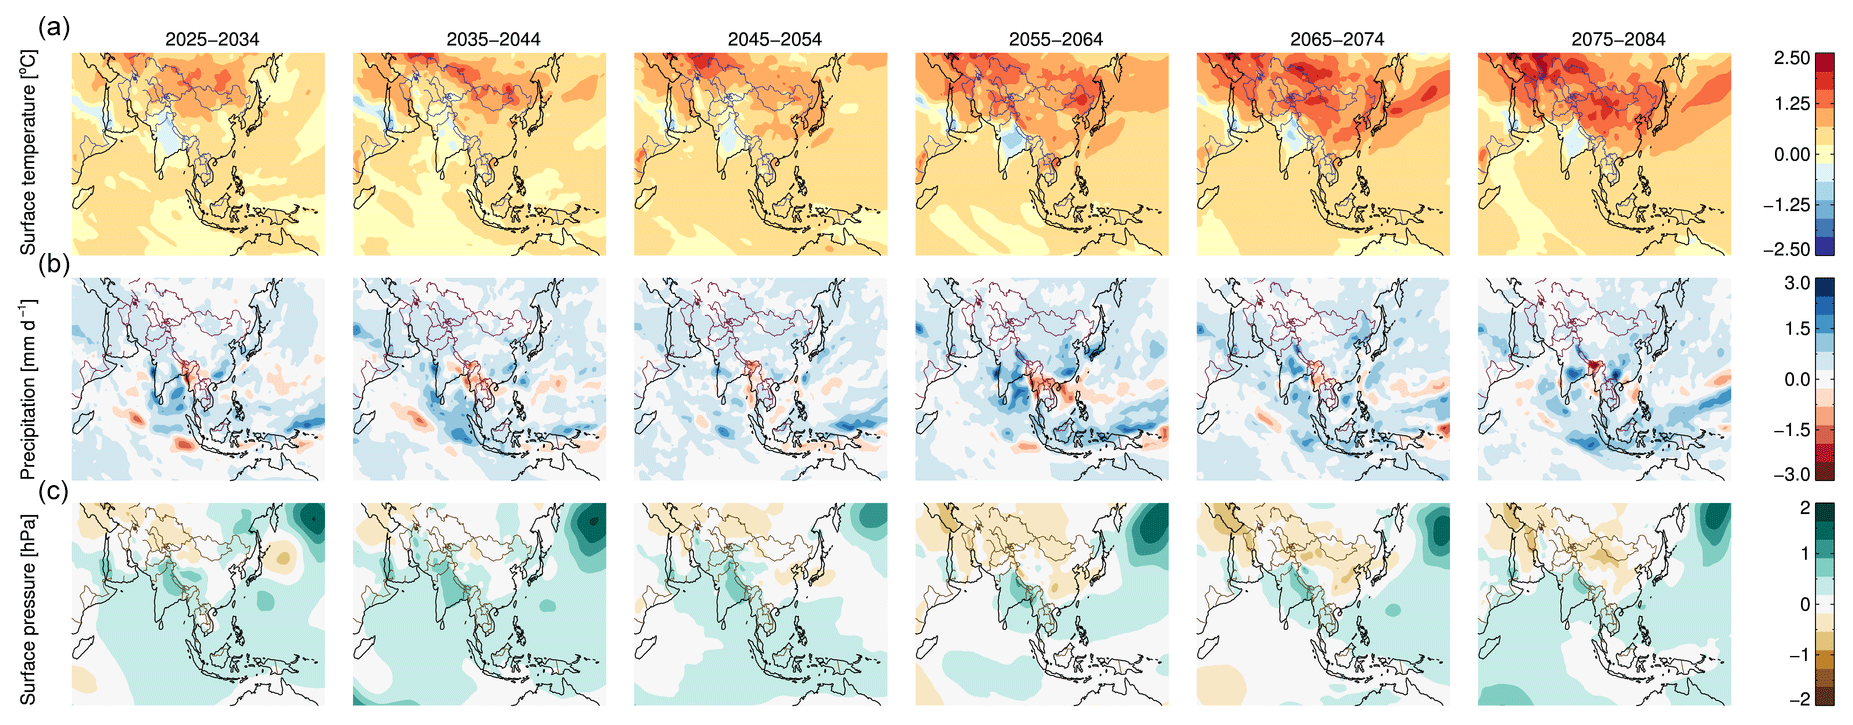
Figure 13JJA-mean (a) near-surface temperature (K), (b) precipitation (mm d−1), and (c) sea level pressure (hPa) anomalies for 10-year periods vs. 1980–2014 from an anthropogenic aerosol only version of SSP2-4.5 (SSP2-4.5-aer) with MIROC6.
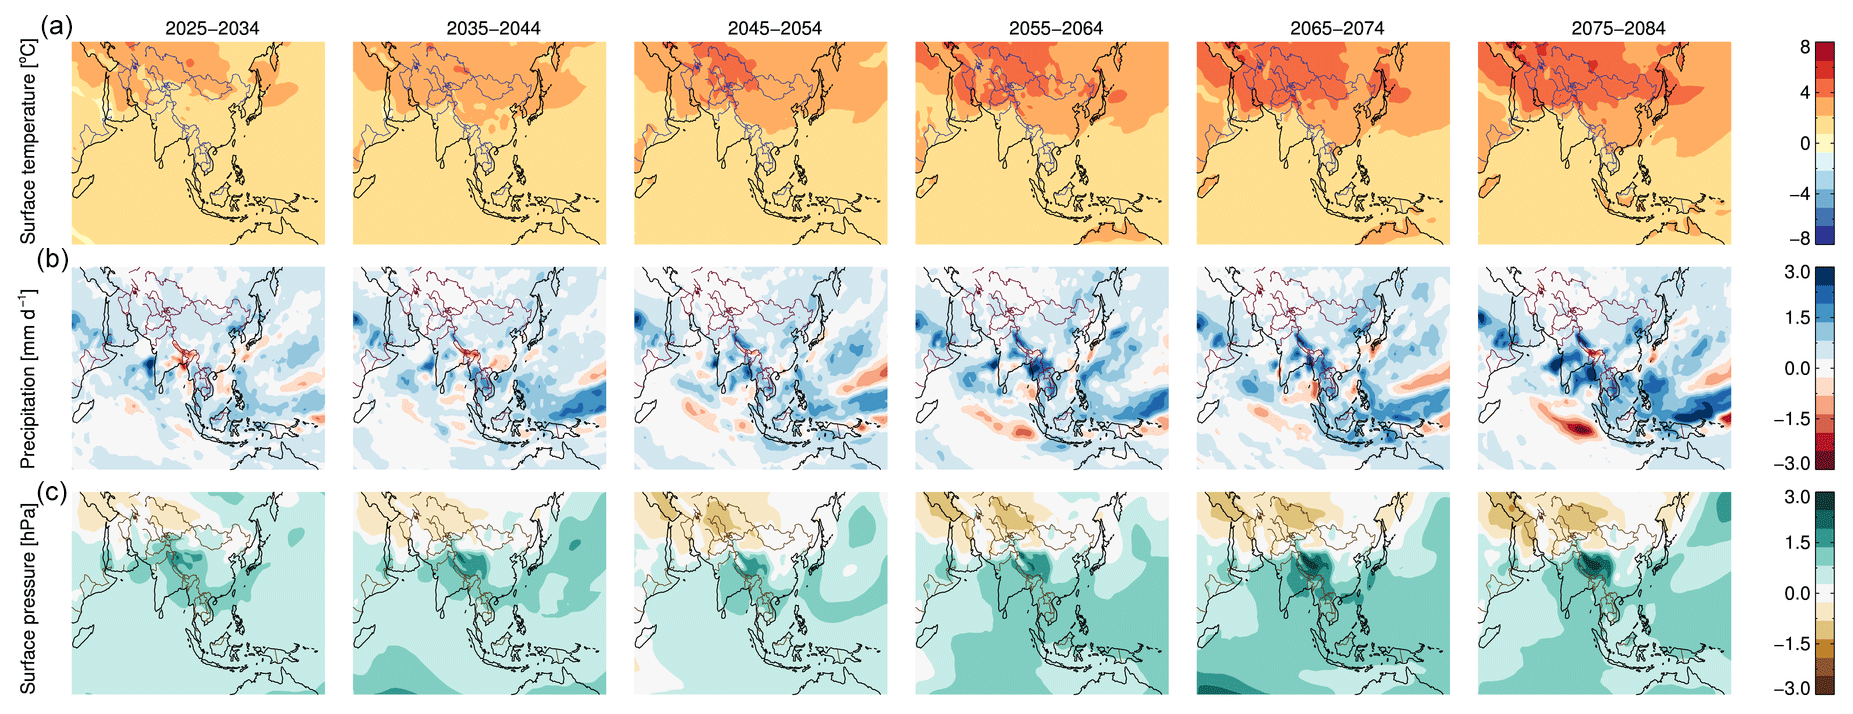
Figure 14JJA-mean (a) near-surface temperature (K), (b) precipitation (mm d−1), and (c) sea level pressure (hPa) anomalies for 10-year periods vs. 1980–2014 from SSP2-4.5 in MIROC6.
Differences in the character of the precipitation anomaly can be seen when comparing the anomalies pre- and post-2050. In the earlier period, when South Asian aerosol emissions continue to increase, precipitation anomalies are either weakly positive or negative over India, the Bay of Bengal, and the Indochina peninsula. Post-2050, when anthropogenic aerosols are decreasing throughout Asia, precipitation increases are larger relative to 1980–2014. There are also suggestions of this structure in the CMIP6 mean SSP2-4.5 response, where increases in precipitation are weak over India and the Bay of Bengal compared to the SSP1-1.9 response (Figs. 11 and 12), but it is not as clear. This is likely partly due to the influence of GHG increases and partly due to the effects of taking the mean response over models with large differences in their mean precipitation field (Fig. 5). However, a number of the individual models do simulate a similar tripolar pattern in precipitation change in SSP2-4. 5 to those in MIROC6 (Figs. 11, 12 and S9). Further study into the precipitation responses to the Asian aerosol dipole is needed to understand the mechanisms underlying this response.
There is large uncertainty in future anthropogenic aerosol emission pathways. This is likely to be of limited importance for global-mean temperature, but anthropogenic aerosol does play an important role in changes in regional temperature and global and regional precipitation until 2050 under the Shared Socioeconomic Pathways. Rapid reductions in anthropogenic aerosol and precursor emissions in SSP1-1.9 lead to larger increases in global and Asian summer monsoon precipitation compared to SSP2-4.5, 3-7.0, and 5-8.5 over East Asia and South Asia, despite the large decrease in greenhouse gases in SSP1-1.9.
In SSP2-4.5, 3.-7.0, and 5-8.5, anthropogenic aerosol emissions continue to increase until the mid-21st century over South Asia. This leads to weaker future increases in regional precipitation until 2050, compared to SSP1-1.9, particularly over northern India. In SSP2-4.5 and 5-8.5 continued increases in South Asian aerosol optical depth occur, while it decreases over East Asia. This may further suppress the precipitation increases in northern India compared to SSP1-1.9. However, there is large inter-model uncertainty in the South Asian precipitation changes.
A dipole in aerosol optical depth trends over Asia has been observed since 2010 (Samset et al., 2019), suggesting that SSP2-4.5, SSP5-8.5 (where the current AOD dipole pattern persists), or SSP1-1.9 (where anthropogenic aerosol is reduced in both regions) is more likely to be followed in the real world than SSP3-7.0 (where anthropogenic aerosol increases in both regions). This presents the possibility of large uncertainty in South Asian summer monsoon precipitation on a 30–50-year time horizon due to uncertainty in local aerosol emission pathways.
All data used in this work are freely available for research purposes.
The supplement related to this article is available online at: https://doi.org/10.5194/acp-20-11955-2020-supplement.
All authors designed the analysis and wrote the paper. LJW, ZL, BHS, EH, MTL, KN, and SU performed the analysis.
The authors declare that they have no conflict of interest.
This article is part of the special issue “The Aerosol Chemistry Model Intercomparison Project (AerChemMIP)”. It is not associated with a conference.
This work and its contributors Laura Wilcox, Zhen Liu, and Massimo Bollasina were supported by the UK-China Research and Innovation Partnership Fund through the Met Office Climate Science for Service Partnership (CSSP) China as part of the Newton Fund. Laura Wilcox received additional support from the Natural Environment Research Council (NERC; grant NE/S004890/1, EMERGENCE) and the International Meteorological Institute (IMI) visiting scientist program. Marianne T. Lund and Bjørn H. Samset acknowledge funding by the Research Council of Norway through grant no. 248834 (QUISARC). Kalle Nordling and Joonas Merikanto acknowledge support from the Academy of Finland project RECIA (grant no. 287440) and European Research Council project ECLAIR (grant no. 646857).
We acknowledge the World Climate Research Programme, which, through its Working Group on Coupled Modelling, coordinated and promoted CMIP6. We thank the climate modelling groups for producing and making available their model output, the Earth System Grid Federation (ESGF) for archiving the data and providing access, and the multiple funding agencies who support CMIP6 and ESGF. APHRODITE precipitation data are available from http://www.chikyu.ac.jp/precip. GISTEMP temperature data and CMAP, GPCC, and GPCP precipitation data were provided by the NOAA/OAR/ESRL PSD, Boulder, Colorado, USA, from their website at https://www.esrl.noaa.gov/psd/. We also acknowledge the use of ERA-Interim data produced by ECMWF and provided by the British Atmospheric Data Centre and the National Centre for Atmospheric Science. The analysis in this work was performed on the JASMIN super-data-cluster (Lawrence et al., 2012). JASMIN is managed and delivered by the UK Science and Technology Facilities Council (STFC) Centre for Environmental Data Archival (CEDA).
This research has been supported by the Newton Fund (CSSP China), the Natural Environment Research Council (grant no. NE/S004890/1), the Research Council of Norway (grant no. 248834), the Academy of Finland (grant no. 287440), and the European Research Council (grant no. 646857).
This paper was edited by Hailong Wang and reviewed by Fengfei Song and one anonymous referee.
Acosta Navarro, J. C., Varma, V., Riipinen, I., Seland, Ø., Kirkevåg, A., Struthers, H., Iversen, T., Hansson, H. C., and Ekman, A. M. L.: Amplification of Arctic warming by past air pollution reductions in Europe, Nat. Geosci., 9, 277–281, https://doi.org/10.1038/ngeo2673, 2016. a
Acosta Navarro, J. C., Ekman, A. M. L., Pausata, F. S. R., Lewinschal, A., Varma, V., Seland, Ø., Gauss, M., Iversen, T., Kirkevåg, A., Riipinen, I., and Hansson, H. C.: Future Response of Temperature and Precipitation to Reduced Aerosol Emissions as Compared with Increased Greenhouse Gas Concentrations, J. Climate, 30, 939–954, https://doi.org/10.1175/JCLI-D-16-0466.1, 2017. a, b, c
Adler, R. F., Huffman, G. J., Chang, A., Ferraro, R., Xie, P.-P., Janowiak, J., Rudolf, B., Schneider, U., Curtis, S., Bolvin, D., Gruber, A., Susskind, J., Arkin, P., Nelkin, E., Adler, R. F., Huffman, G. J., Chang, A., Ferraro, R., Xie, P.-P., Janowiak, J., Rudolf, B., Schneider, U., Curtis, S., Bolvin, D., Gruber, A., Susskind, J., Arkin, P., and Nelkin, E.: The Version-2 Global Precipitation Climatology Project (GPCP) Monthly Precipitation Analysis (1979–Present), J. Hydrometeorol., 4, 1147–1167, https://doi.org/10.1175/1525-7541(2003)004<1147:TVGPCP>2.0.CO;2, 2003. a
Andrews, T.: MOHC HadGEM3-GC31-LL model output prepared for CMIP6 RFMIP, Earth System Grid Federation, https://doi.org/10.22033/ESGF/CMIP6.475, 2019. a
Andrews, T., Forster, P. M., Boucher, O., Bellouin, N., and Jones, A.: Precipitation, radiative forcing and global temperature change, Geophys. Res. Lett., 37, L14701, https://doi.org/10.1029/2010GL043991, 2010. a
Bartlett, R. E., Bollasina, M. A., Booth, B. B. B., Dunstone, N. J., Marenco, F., Messori, G., and Bernie, D. J.: Do differences in future sulfate emission pathways matter for near-term climate? A case study for the Asian monsoon, Clim. Dynam., 50, 1863–1880, https://doi.org/10.1007/s00382-017-3726-6, 2018. a
Bellouin, N., Rae, J., Jones, A., Johnson, C., Haywood, J., and Boucher, O.: Aerosol forcing in the Climate Model Intercomparison Project (CMIP5) simulations by HadGEM2-ES and the role of ammonium nitrate, J. Geophys. Res., 116, D20206, https://doi.org/10.1029/2011JD016074, 2011. a
Bellouin, N., Mann, G. W., Woodhouse, M. T., Johnson, C., Carslaw, K. S., and Dalvi, M.: Impact of the modal aerosol scheme GLOMAP-mode on aerosol forcing in the Hadley Centre Global Environmental Model, Atmos. Chem. Phys., 13, 3027–3044, https://doi.org/10.5194/acp-13-3027-2013, 2013. a
Bellouin, N., Quaas, J., Gryspeerdt, E., Kinne, S., Stier, P., Watson Parris, D., Boucher, O., Carslaw, K., Christensen, M., Daniau, A., Dufresne, J., Feingold, G., Fiedler, S., Forster, P., Gettelman, A., Haywood, J., Lohmann, U., Malavelle, F., Mauritsen, T., McCoy, D., Myhre, G., Mülmenstädt, J., Neubauer, D., Possner, A., Rugenstein, M., Sato, Y., Schulz, M., Schwartz, S., Sourdeval, O., Storelvmo, T., Toll, V., Winker, D., and Stevens, B.: Bounding global aerosol radiative forcing of climate change, Rev. Geophys., 58, 2019RG000660, https://doi.org/10.1029/2019RG000660, 2019. a
Bollasina, M. A., Ming, Y., and Ramaswamy, V.: Anthropogenic aerosols and the weakening of the South Asian summer monsoon, Science, 334, 502–505, https://doi.org/10.1126/science.1204994, 2011. a, b, c
Boucher, O., Randall, D., Artaxo, P., Bretherton, C., Feingold, G., Forster, P., Kerminen, V.-M., Kondo, Y., Liao, H., Lohmann, U., Rasch, P., Satheesh, S., Sherwood, S., Stevens, B., and Zhang, X.-Y.: Clouds and Aerosols, in: Climate Change 2013: The Physical Science Basis. Contribution of Working Group I to the Fifth Assessment Report of the Intergovernmental Panel on Climate Change, edited by: Stocker, T. F., Qin, D., Plattner, G.-K., Tignor, M., Allen, S. K., Boschung, J., Nauels, A., Xia, Y., Bex, V., and Midgley, P. M., Cambridge University Press, Cambridge, UK and New York, NY, USA, 571–657, 2013. a
Boucher, O., Denvil, S., Caubel, A., and Foujols, M. A.: IPSL IPSL-CM6A-LR model output prepared for CMIP6 CMIP historical, https://doi.org/10.22033/ESGF/CMIP6.5195, Earth System Grid Federation, 2018a. a
Boucher, O., Denvil, S., Caubel, A., and Foujols, M. A.: IPSL IPSL-CM6A-LR model output prepared for CMIP6 RFMIP, Earth System Grid Federation, https://doi.org/10.22033/ESGF/CMIP6.1531, 2018b. a
Boucher, O., Denvil, S., Caubel, A., and Foujols, M. A.: IPSL IPSL-CM6A-LR model output prepared for CMIP6 ScenarioMIP, Earth System Grid Federation, https://doi.org/10.22033/ESGF/CMIP6.1532, 2019. a
Chalmers, N., Highwood, E. J., Hawkins, E., Sutton, R., and Wilcox, L. J.: Aerosol contribution to the rapid warming of near-term climate under RCP 2.6, Geophys. Res. Lett., 39, L18709, https://doi.org/10.1029/2012GL052848, 2012. a
Collins, M., AchutaRao, K., Ashok, K., Bhandari, S., Mitra, A. K., Prakash, S., Srivastava, R., and Turner, A.: Observational challenges in evaluating climate models, Nat. Clim. Change, 3, 940–941, https://doi.org/10.1038/nclimate2012, 2013. a
Cowan, T. and Cai, W.: The impact of Asian and non-Asian anthropogenic aerosols on 20th century Asian summer monsoon, Geophys. Res. Lett., 38, L11703, https://doi.org/10.1029/2011GL047268, 2011. a
Danabasoglu, G.: NCAR CESM2 model output prepared for CMIP6 CMIP historical, Earth System Grid Federation, https://doi.org/10.22033/ESGF/CMIP6.7627, 2019a. a
Danabasoglu, G.: NCAR CESM2 model output prepared for CMIP6 RFMIP, Earth System Grid Federation, https://doi.org/10.22033/ESGF/CMIP6.2199, 2019b. a
Dee, D. P., Uppala, S. M., Simmons, A. J., Berrisford, P., Poli, P., Kobayashi, S., Andrae, U., Balmaseda, M. A., Balsamo, G., Bauer, P., Bechtold, P., Beljaars, A. C. M., van de Berg, L., Bidlot, J., Bormann, N., Delsol, C., Dragani, R., Fuentes, M., Geer, A. J., Haimberger, L., Healy, S. B., Hersbach, H., Hólm, E. V., Isaksen, L., Kållberg, P., Köhler, M., Matricardi, M., McNally, A. P., Monge-Sanz, B. M., Morcrette, J.-J., Park, B.-K., Peubey, C., de Rosnay, P., Tavolato, C., Thépaut, J.-N., and Vitart, F.: The ERA-Interim reanalysis: configuration and performance of the data assimilation system, Q. J. Roy. Meteorol. Soc., 137, 553–597, https://doi.org/10.1002/qj.828, 2011. a
Dong, B., Sutton, R., Highwood, E., and Wilcox, L.: Preferred response of the East Asian summer monsoon to local and non-local anthropogenic sulphur dioxide emissions, Clim. Dynam., 46, 1733–1751, https://doi.org/10.1007/s00382-015-2671-5, 2016. a
Dong, B., Wilcox, L. J., Highwood, E. J., and Sutton, R. T.: Impacts of recent decadal changes in Asian aerosols on the East Asian summer monsoon: roles of aerosol–radiation and aerosol–cloud interactions, Clim. Dynam., 53, 3235–3256, https://doi.org/10.1007/s00382-019-04698-0, 2019. a
EC-Earth Consortium (EC-Earth): EC-Earth-Consortium EC-Earth3-Veg model output prepared for CMIP6 CMIP historical, Earth System Grid Federation, https://doi.org/10.22033/ESGF/CMIP6.4706, 2019a. a
EC-Earth Consortium (EC-Earth): EC-Earth-Consortium EC-Earth3-Veg model output prepared for CMIP6 ScenarioMIP, Earth System Grid Federation, https://doi.org/10.22033/ESGF/CMIP6.727, 2019b. a
Eyring, V., Bony, S., Meehl, G. A., Senior, C. A., Stevens, B., Stouffer, R. J., and Taylor, K. E.: Overview of the Coupled Model Intercomparison Project Phase 6 (CMIP6) experimental design and organization, Geosci. Model Dev., 9, 1937–1958, https://doi.org/10.5194/gmd-9-1937-2016, 2016. a
Fläschner, D., Mauritsen, T., Stevens, B., Fläschner, D., Mauritsen, T., and Stevens, B.: Understanding the Intermodel Spread in Global-Mean Hydrological Sensitivity, J. Climate, 29, 801–817, https://doi.org/10.1175/JCLI-D-15-0351.1, 2016. a
Gillett, N. P. and Von Salzen, K.: The role of reduced aerosol precursor emissions in driving near-term warming, Environ. Res. Lett., 8, 034008, https://doi.org/10.1088/1748-9326/8/3/034008, 2013. a
Gillett, N. P., Shiogama, H., Funke, B., Hegerl, G., Knutti, R., Matthes, K., Santer, B. D., Stone, D., and Tebaldi, C.: The Detection and Attribution Model Intercomparison Project (DAMIP v1.0) contribution to CMIP6, Geosci. Model Dev., 9, 3685–3697, https://doi.org/10.5194/gmd-9-3685-2016, 2016. a
Good, P., Sellar, A., Tang, Y., Rumbold, S., Ellis, R., Kelley, D., Kuhlbrodt, T., and Walton, J.: MOHC UKESM1.0-LL model output prepared for CMIP6 ScenarioMIP, Earth System Grid Federation, https://doi.org/10.22033/ESGF/CMIP6.1567, 2019. a
Guo, H., John, J. G., Blanton, C., McHugh, C., Nikonov, S., Radhakrishnan, A., Zadeh, N. T., Balaji, V., Durachta, J., Dupuis, C., Menzel, R., Robinson, T., Underwood, S., Vahlenkamp, H., Dunne, K. A., Gauthier, P. P. G., Ginoux, P., Griffies, S. M., Hallberg, R., Harrison, M., Hurlin, W., Malyshev, S., Naik, V., Paulot, F., Paynter, D. J., Ploshay, J., Schwarzkopf, D. M., Seman, C. J., Shao, A., Silvers, L., Wyman, B., Zeng, Y., Adcroft, A., Dunne, J. P., Held, I. M., Krasting, J. P., Horowitz, L. W., Milly, P. C. D., Shevliakova, E., Winton, M., and Zhao, M.: NOAA-GFDL GFDL-CM4 model output prepared for CMIP6 CMIP historical, Earth System Grid Federation, https://doi.org/10.22033/ESGF/CMIP6.8594, 2018a. a
Guo, H., John, J. G., Blanton, C., McHugh, C., Nikonov, S., Radhakrishnan, A., Zadeh, N. T., Balaji, V., Durachta, J., Dupuis, C., Menzel, R., Robinson, T., Underwood, S., Vahlenkamp, H., Dunne, K. A., Gauthier, P. P. G., Ginoux, P., Griffies, S. M., Hallberg, R., Harrison, M., Hurlin, W., Lin, P., Malyshev, S., Naik, V., Paulot, F., Paynter, D. J., Ploshay, J., Schwarzkopf, D. M., Seman, C. J., Shao, A., Silvers, L., Wyman, B., Yan, X., Zeng, Y., Adcroft, A., Dunne, J. P., Held, I. M., Krasting, J. P., Horowitz, L. W., Milly, C., Shevliakova, E., Winton, M., Zhao, M., and Zhang, R.: NOAA-GFDL GFDL-CM4 model output prepared for CMIP6 ScenarioMIP, Earth System Grid Federation, https://doi.org/10.22033/ESGF/CMIP6.9242, 2018b. a
Guo, L., Turner, A. G., and Highwood, E. J.: Impacts of 20th century aerosol emissions on the South Asian monsoon in the CMIP5 models, Atmos. Chem. Phys., 15, 6367–6378, https://doi.org/10.5194/acp-15-6367-2015, 2015. a
Guo, L., Turner, A. G., and Highwood, E. J.: Local and remote impacts of aerosol species on indian summer monsoon rainfall in a GCM, J. Climate, 29, 6937–6955, https://doi.org/10.1175/JCLI-D-15-0728.1, 2016. a, b
Gusain, A., Ghosh, S., and Karmakar, S.: Added value of CMIP6 over CMIP5 models in simulating Indian summer monsoon rainfall, Atmos. Res., 232, 104680, https://doi.org/10.1016/J.ATMOSRES.2019.104680, 2020. a
Ha, K.-J., Seo, Y.-W., Lee, J.-Y., Kripalani, R. H., and Yun, K.-S.: Linkages between the South and East Asian summer monsoons: a review and revisit, Clim. Dynam., 51, 4207–4227, https://doi.org/10.1007/s00382-017-3773-z, 2018. a
Hansen, J., Ruedy, R., Sato, M., and Lo, K.: Global surface temperature change, Rev. Geophys., 48, RG4004, https://doi.org/10.1029/2010RG000345, 2010. a
Hegerl, G. C., Brönnimann, S., Cowan, T., Friedman, A. R., Hawkins, E., Iles, C., Müller, W., Schurer, A., and Undorf, S.: Causes of climate change over the historical record, Environ. Res. Lett., 14, 123006, https://doi.org/10.1088/1748-9326/ab4557, 2019. a
Hienola, A., Partanen, A.-I., Pietikäinen, J.-P., O'Donnell, D., Korhonen, H., Matthews, H. D., and Laaksonen, A.: The impact of aerosol emissions on the 1.5 ∘C pathways, Environ. Res. Lett., 13, 044011, https://doi.org/10.1088/1748-9326/aab1b2, 2018. a
Huang, B., Thorne, P. W., Banzon, V. F., Boyer, T., Chepurin, G., Lawrimore, J. H., Menne, M. J., Smith, T. M., Vose, R. S., and Zhang, H.-M.: Extended Reconstructed Sea Surface Temperature, Version 5 (ERSSTv5): Upgrades, Validations, and Intercomparisons, J. Climate, 30, 8179–8205, https://doi.org/10.1175/JCLI-D-16-0836.1, 2017. a
Jones, G. S., Stott, P. A., and Christidis, N.: Attribution of observed historical near-surface temperature variations to anthropogenic and natural causes using CMIP5 simulations, J. Geophys. Res.-Atmos., 118, 4001–4024, https://doi.org/10.1002/jgrd.50239, 2013. a
Kirkevåg, A., Grini, A., Olivié, D., Seland, Ø., Alterskjær, K., Hummel, M., Karset, I. H. H., Lewinschal, A., Liu, X., Makkonen, R., Bethke, I., Griesfeller, J., Schulz, M., and Iversen, T.: A production-tagged aerosol module for Earth system models, OsloAero5.3 – extensions and updates for CAM5.3-Oslo, Geosci. Model Dev., 11, 3945–3982, https://doi.org/10.5194/gmd-11-3945-2018, 2018. a
Klimont, Z., Kupiainen, K., Heyes, C., Purohit, P., Cofala, J., Rafaj, P., Borken-Kleefeld, J., and Schöpp, W.: Global anthropogenic emissions of particulate matter including black carbon, Atmos. Chem. Phys., 17, 8681–8723, https://doi.org/10.5194/acp-17-8681-2017, 2017. a
Kloster, S., Dentener, F., Feichter, J., Raes, F., Lohmann, U., Roeckner, E., and Fischer-Bruns, I.: A GCM study of future climate response to aerosol pollution reductions, Clim. Dynam., 34, 1177–1194, https://doi.org/10.1007/s00382-009-0573-0, 2010. a, b
Lau, W. K., Kim, K. M., and Ruby Leung, L.: Changing circulation structure and precipitation characteristics in Asian monsoon regions: greenhouse warming vs. aerosol effects, Geosci. Lett., 4, 28, https://doi.org/10.1186/s40562-017-0094-3, 2017. a
Lau, W. K. M. and Kim, K.-M.: Fingerprinting the impacts of aerosols on long-term trends of the Indian summer monsoon regional rainfall, Geophys. Res. Lett., 37, L16705, https://doi.org/10.1029/2010GL043255, 2010. a
Lawrence, B., Bennett, V. L., Churchill, J., Juckes, M., Kershaw, P., Oliver, P., Pritchard, M., and Stephens, A.: The JASMIN super-data-cluster, arXiv preprint arXiv:1204.3553, available at: https://www.academia.edu/2871931/The_JASMIN_super-data-cluster (last access: 16 October 2020), 2012. a
Lenssen, N. J. L., Schmidt, G. A., Hansen, J. E., Menne, M. J., Persin, A., Ruedy, R., and Zyss, D.: Improvements in the GISTEMP Uncertainty Model, J. Geophys. Res.-Atmos., 124, 6307–6326, https://doi.org/10.1029/2018JD029522, 2019. a
Levy, H., Horowitz, L. W., Schwarzkopf, M. D., Ming, Y., Golaz, J.-C., Naik, V., and Ramaswamy, V.: The roles of aerosol direct and indirect effects in past and future climate change, J. Geophys. Res.-Atmos., 118, 4521–4532, https://doi.org/10.1002/jgrd.50192, 2013. a, b, c, d
Li, X., Ting, M., Li, C., and Henderson, N.: Mechanisms of Asian Summer Monsoon Changes in Response to Anthropogenic Forcing in CMIP5 Models, J. Climate, 28, 4107–4125, https://doi.org/10.1175/jcli-d-14-00559.1, 2015. a, b
Liepert, B. G., Feichter, J., Lohmann, U., and Roeckner, E.: Can aerosols spin down the water cycle in a warmer and moister world?, Geophys. Res. Lett., 31, L06207, https://doi.org/10.1029/2003GL019060, 2004. a
Liepert, B. G., Previdi, M., Liepert, B. G., and Previdi, M.: Do Models and Observations Disagree on the Rainfall Response to Global Warming?, J. Climate, 22, 3156–3166, https://doi.org/10.1175/2008JCLI2472.1, 2009. a
Liu, L., Shawki, D., Voulgarakis, A., Kasoar, M., Samset, B. H., Myhre, G., Forster, P. M., Hodnebrog, Ø., Sillmann, J., Aalbergsjø, S. G., Boucher, O., Faluvegi, G., Iversen, T., Kirkevåg, A., Lamarque, J.-F., Olivié, D., Richardson, T., Shindell, D., Takemura, T., Liu, L., Shawki, D., Voulgarakis, A., Kasoar, M., Samset, B. H., Myhre, G., Forster, P. M., Hodnebrog, Ø., Sillmann, J., Aalbergsjø, S. G., Boucher, O., Faluvegi, G., Iversen, T., Kirkevåg, A., Lamarque, J.-F., Olivié, D., Richardson, T., Shindell, D., and Takemura, T.: A PDRMIP Multimodel Study on the Impacts of Regional Aerosol Forcings on Global and Regional Precipitation, J. Climate, 31, 4429–4447, https://doi.org/10.1175/JCLI-D-17-0439.1, 2018. a
Liu, Y., Cai, W., Sun, C., Song, H., Cobb, K. M., Li, J., Leavitt, S. W., Wu, L., Cai, Q., Liu, R., Ng, B., Cherubini, P., Büntgen, U., Song, Y., Wang, G., Lei, Y., Yan, L., Li, Q., Ma, Y., Fang, C., Sun, J., Li, X., Chen, D., and Linderholm, H. W.: Anthropogenic Aerosols Cause Recent Pronounced Weakening of Asian Summer Monsoon Relative to Last Four Centuries, Geophys. Res. Lett., 46, 5469–5479, https://doi.org/10.1029/2019GL082497, 2019. a
Lund, M. T., Myhre, G., and Samset, B. H.: Anthropogenic aerosol forcing under the Shared Socioeconomic Pathways, Atmos. Chem. Phys., 19, 13827–13839, https://doi.org/10.5194/acp-19-13827-2019, 2019. a, b, c
McGill, R., Tukey, J. W., and Larsen, W. A.: Variations of box plots, Am. Stat., 32, 12–16, https://doi.org/10.1080/00031305.1978.10479236, 1978. a
Menne, M. J., Williams, C. N., Gleason, B. E., Rennie, J. J., and Lawrimore, J. H.: The Global Historical Climatology Network Monthly Temperature Dataset, Version 4, J. Climate, 31, 9835–9854, https://doi.org/10.1175/JCLI-D-18-0094.1, 2018. a
Moss, R. H., Edmonds, J. A., Hibbard, K. A., Manning, M. R., Rose, S. K., van Vuuren, D. P., Carter, T. R., Emori, S., Kainuma, M., Kram, T., Meehl, G. A., Mitchell, J. F. B., Nakicenovic, N., Riahi, K., Smith, S. J., Stouffer, R. J., Thomson, A. M., Weyant, J. P., and Wilbanks, T. J.: The next generation of scenarios for climate change research and assessment, Nature, 463, 747–756, https://doi.org/10.1038/nature08823, 2010. a
Mulcahy, J. P., Jones, C., Sellar, A., Johnson, B., Boutle, I. A., Jones, A., Andrews, T., Rumbold, S. T., Mollard, J., Bellouin, N., Johnson, C. E., Williams, K. D., Grosvenor, D. P., and McCoy, D. T.: Improved Aerosol Processes and Effective Radiative Forcing in HadGEM3 and UKESM1, J. Adv. Model. Earth Syst., 10, 2786–2805, https://doi.org/10.1029/2018MS001464, 2018. a
NASA/GISS – NASA Goddard Institute for Space Studies : NASA-GISS GISS-E2.1G model output prepared for CMIP6 CMIP historical, Earth System Grid Federation, https://doi.org/10.22033/ESGF/CMIP6.7127, 2018. a
NASA/GISS – NASA Goddard Institute for Space Studies (NASA/GISS): NASA-GISS GISS-E2.1G model output prepared for CMIP6 RFMIP, Earth System Grid Federation, https://doi.org/10.22033/ESGF/CMIP6.2072, 2019. a
Nordling, K., Korhonen, H., Räisänen, P., Alper, M. E., Uotila, P., O'Donnell, D., and Merikanto, J.: Role of climate model dynamics in estimated climate responses to anthropogenic aerosols, Atmos. Chem. Phys., 19, 9969–9987, https://doi.org/10.5194/acp-19-9969-2019, 2019. a, b
O'Connor, F., Dalvi, M., Kahana, R., Johnson, B., Mulcahy, J., Robertson, E., Shim, S., and Wiltshire, A.: MOHC UKESM1.0-LL model output prepared for CMIP6 RFMIP, Earth System Grid Federation, https://doi.org/10.22033/ESGF/CMIP6.11061, 2019. a
O'Neill, B. C., Tebaldi, C., van Vuuren, D. P., Eyring, V., Friedlingstein, P., Hurtt, G., Knutti, R., Kriegler, E., Lamarque, J.-F., Lowe, J., Meehl, G. A., Moss, R., Riahi, K., and Sanderson, B. M.: The Scenario Model Intercomparison Project (ScenarioMIP) for CMIP6, Geosci. Model Dev., 9, 3461–3482, https://doi.org/10.5194/gmd-9-3461-2016, 2016. a, b
Partanen, A.-I., Landry, J.-S., and Matthews, H. D.: Climate and health implications of future aerosol emission scenarios, Environ. Res. Lett., 13, 024028, https://doi.org/10.1088/1748-9326/aaa511, 2018. a, b
Paynter, D. J., Menzel, R., Jones, A., Schwarzkopf, D. M., Freidenreich, S., Wyman, B., Blanton, C., McHugh, C., Radhakrishnan, A., Vahlenkamp, H., Rand, K., Silvers, L., Guo, H., John, J. G., Ploshay, J., Balaji, V., and Wilson, C.: NOAA-GFDL GFDL-CM4 model output prepared for CMIP6 RFMIP, Earth System Grid Federation, https://doi.org/10.22033/ESGF/CMIP6.1643, 2018 a
Pietikäinen, J.-P., Kupiainen, K., Klimont, Z., Makkonen, R., Korhonen, H., Karinkanta, R., Hyvärinen, A.-P., Karvosenoja, N., Laaksonen, A., Lihavainen, H., and Kerminen, V.-M.: Impacts of emission reductions on aerosol radiative effects, Atmos. Chem. Phys., 15, 5501–5519, https://doi.org/10.5194/acp-15-5501-2015, 2015. a
Platnick, S.: MODIS Atmosphere L3 Monthly Product, NASA MODIS Adaptive Processing System, Earth System Grid Federation, https://doi.org/10.5067/MODIS/MYD08_M3.006, 2015. a
Polson, D., Bollasina, M., Hegerl, G. C., and Wilcox, L. J.: Decreased monsoon precipitation in the Northern Hemisphere due to anthropogenic aerosols, Geophys. Res. Lett., 41, 6023–6029, https://doi.org/10.1002/2014GL060811, 2014. a, b, c
Prakash, S., Mitra, A. K., Momin, I. M., Rajagopal, E. N., Basu, S., Collins, M., Turner, A. G., Achuta Rao, K., and Ashok, K.: Seasonal intercomparison of observational rainfall datasets over India during the southwest monsoon season, Int. J. Climatol., 35, 2326–2338, https://doi.org/10.1002/joc.4129, 2015. a
Rao, S., Klimont, Z., Smith, S. J., Van Dingenen, R., Dentener, F., Bouwman, L., Riahi, K., Amann, M., Bodirsky, B. L., van Vuuren, D. P., Aleluia Reis, L., Calvin, K., Drouet, L., Fricko, O., Fujimori, S., Gernaat, D., Havlik, P., Harmsen, M., Hasegawa, T., Heyes, C., Hilaire, J., Luderer, G., Masui, T., Stehfest, E., Strefler, J., van der Sluis, S., and Tavoni, M.: Future air pollution in the Shared Socio-economic Pathways, Global Environ. Change, 42, 346–358, https://doi.org/10.1016/J.GLOENVCHA.2016.05.012, 2017. a
Remer, L. A., Kleidman, R. G., Levy, R. C., Kaufman, Y. J., Tanré, D., Mattoo, S., Martins, J. V., Ichoku, C., Koren, I., Yu, H., and Holben, B. N.: Global aerosol climatology from the MODIS satellite sensors, J. Geophys. Res., 113, D14S07, https://doi.org/10.1029/2007JD009661, 2008. a
Riahi, K., van Vuuren, D. P., Kriegler, E., Edmonds, J., O'Neill, B. C., Fujimori, S., Bauer, N., Calvin, K., Dellink, R., Fricko, O., Lutz, W., Popp, A., Cuaresma, J. C., KC, S., Leimbach, M., Jiang, L., Kram, T., Rao, S., Emmerling, J., Ebi, K., Hasegawa, T., Havlik, P., Humpenöder, F., Da Silva, L. A., Smith, S., Stehfest, E., Bosetti, V., Eom, J., Gernaat, D., Masui, T., Rogelj, J., Strefler, J., Drouet, L., Krey, V., Luderer, G., Harmsen, M., Takahashi, K., Baumstark, L., Doelman, J. C., Kainuma, M., Klimont, Z., Marangoni, G., Lotze-Campen, H., Obersteiner, M., Tabeau, A., and Tavoni, M.: The Shared Socioeconomic Pathways and their energy, land use, and greenhouse gas emissions implications: An overview, Global Environ. Change, 42, 153–168, https://doi.org/10.1016/J.GLOENVCHA.2016.05.009, 2017. a
Ridley, J., Menary, M., Kuhlbrodt, T., Andrews, M., and Andrews, T.: MOHC HadGEM3-GC31-LL model output prepared for CMIP6 CMIP historical, Earth System Grid Federation, https://doi.org/10.22033/ESGF/CMIP6.6109, 2019. a
Rong, X.: CAMS CAMS CSM1.0 model output prepared for CMIP6 CMIP historical, Earth System Grid Federation, https://doi.org/10.22033/ESGF/CMIP6.9754, 2019a. a
Rong, X.: CAMS CAMS-CSM1.0 model output prepared for CMIP6 ScenarioMIP, Earth System Grid Federation, https://doi.org/10.22033/ESGF/CMIP6.11004, 2019b. a
Rotstayn, L. D., Collier, M. A., Chrastansky, A., Jeffrey, S. J., and Luo, J.-J.: Projected effects of declining aerosols in RCP4.5: unmasking global warming?, Atmos. Chem. Phys., 13, 10883–10905, https://doi.org/10.5194/acp-13-10883-2013, 2013. a, b, c, d
Rotstayn, L. D., Collier, M. A., and Luo, J.-J.: Effects of declining aerosols on projections of zonally averaged tropical precipitation, Environ. Res. Lett., 10, 044018, https://doi.org/10.1088/1748-9326/10/4/044018, 2015. a
Salzmann, M.: Global warming without global mean precipitation increase?, Sci. Adv., 2, e1501572, https://doi.org/10.1126/sciadv.1501572, 2016. a
Samset, B. H., Myhre, G., Forster, P. M., Hodnebrog, Ø., Andrews, T., Faluvegi, G., Fläschner, D., Kasoar, M., Kharin, V., Kirkevåg, A., Lamarque, J., Olivié, D., Richardson, T., Shindell, D., Shine, K. P., Takemura, T., and Voulgarakis, A.: Fast and slow precipitation responses to individual climate forcers: A PDRMIP multimodel study, Geophys. Res. Lett., 43, 2782–2791, https://doi.org/10.1002/2016GL068064, 2016. a, b
Samset, B. H., Sand, M., Smith, C. J., Bauer, S. E., Forster, P. M., Fuglestvedt, J. S., Osprey, S., and Schleussner, C.-F.: Climate Impacts From a Removal of Anthropogenic Aerosol Emissions, Geophys. Res. Lett., 45, 1020–1029, https://doi.org/10.1002/2017GL076079, 2018. a, b
Samset, B. H., Lund, M. T., Bollasina, M., Myhre, G., and Wilcox, L.: Emerging Asian aerosol patterns, Nat. Geosci., 12, 582–584, https://doi.org/10.1038/s41561-019-0424-5, 2019. a, b
Scannell, C., Booth, B. B. B., Dunstone, N. J., Rowell, D. P., Bernie, D. J., Kasoar, M., Voulgarakis, A., Wilcox, L. J., Acosta Navarro, J. C., Seland, Ø., and Paynter, D. J.: The Influence of Remote Aerosol Forcing from Industrialized Economies on the Future Evolution of East and West African Rainfall, J. Climate, 32, 8335–8354, https://doi.org/10.1175/JCLI-D-18-0716.1, 2019. a, b
Schneider, U., Becker, A., Finger, P., Meyer-Christoffer, A., Ziese, M., and Rudolf, B.: GPCC's new land surface precipitation climatology based on quality-controlled in situ data and its role in quantifying the global water cycle, Theor. Appl. Climatol., 115, 15–40, https://doi.org/10.1007/s00704-013-0860-x, 2014. a
Seferian, R.: CNRM-CERFACS CNRM-ESM2-1 model output prepared for CMIP6 CMIP historical, Earth System Grid Federation, https://doi.org/10.22033/ESGF/CMIP6.4068, 2018. a
Seferian, R.: CNRM-CERFACS CNRM-ESM2-1 model output prepared for CMIP6 RFMIP, Earth System Grid Federation, https://doi.org/10.22033/ESGF/CMIP6.9565, 2019a. a
Seferian, R.: CNRM-CERFACS CNRM-ESM2-1 model output prepared for CMIP6 ScenarioMIP, Earth System Grid Federation, https://doi.org/10.22033/ESGF/CMIP6.1395, 2019b. a
Sekiguchi, M. and Shiogama, H.: MIROC MIROC6 model output prepared for CMIP6 RFMIP, Earth System Grid Federation, https://doi.org/10.22033/ESGF/CMIP6.895, 2019. a
Shawki, D., Voulgarakis, A., Chakraborty, A., Kasoar, M., and Srinivasan, J.: The South Asian Monsoon Response to Remote Aerosols: Global and Regional Mechanisms, J. Geophys. Res.-Atmos., 123, 11585–11601, https://doi.org/10.1029/2018JD028623, 2018. a
Shindell, D. and Smith, C. J.: Climate and air-quality benefits of a realistic phase-out of fossil fuels, Nature, 573, 408–411, https://doi.org/10.1038/s41586-019-1554-z, 2019. a, b
Shindell, D., Kuylenstierna, J. C. I., Vignati, E., van Dingenen, R., Amann, M., Klimont, Z., Anenberg, S. C., Muller, N., Janssens-Maenhout, G., Raes, F., Schwartz, J., Faluvegi, G., Pozzoli, L., Kupiainen, K., Höglund-Isaksson, L., Emberson, L., Streets, D., Ramanathan, V., Hicks, K., Oanh, N. T. K., Milly, G., Williams, M., Demkine, V., and Fowler, D.: Simultaneously mitigating near-term climate change and improving human health and food security, Science, 335, 183–189, https://doi.org/10.1126/science.1210026, 2012. a
Shiogama, H.: MIROC MIROC6 model output prepared for CMIP6 DAMIP, Earth System Grid Federation, https://doi.org/10.22033/ESGF/CMIP6.894, 2019. a
Sillmann, J., Pozzoli, L., Vignati, E., Kloster, S., and Feichter, J.: Aerosol effect on climate extremes in Europe under different future scenarios, Geophys. Res. Lett., 40, 2290–2295, https://doi.org/10.1002/grl.50459, 2013. a
Singh, D., Bollasina, M., Ting, M., and Diffenbaugh, N. S.: Disentangling the influence of local and remote anthropogenic aerosols on South Asian monsoon daily rainfall characteristics, Clim. Dynam., 52, 6301–6320, https://doi.org/10.1007/s00382-018-4512-9, 2019a. a
Singh, D., Ghosh, S., Roxy, M. K., and McDermid, S.: Indian summer monsoon: Extreme events, historical changes, and role of anthropogenic forcings, Wires Clim. Change, 10, e571, https://doi.org/10.1002/wcc.571, 2019b. a, b
Smith, C. J., Forster, P. M., Allen, M., Leach, N., Millar, R. J., Passerello, G. A., and Regayre, L. A.: FAIR v1.3: a simple emissions-based impulse response and carbon cycle model, Geosci. Model Dev., 11, 2273–2297, https://doi.org/10.5194/gmd-11-2273-2018, 2018. a
Song, F., Zhou, T., and Qian, Y.: Responses of East Asian summer monsoon to natural and anthropogenic forcings in the 17 latest CMIP5 models, Geophys. Res. Lett., 41, 596–603, https://doi.org/10.1002/2013GL058705, 2014. a, b, c
Sperber, K. R., Annamalai, H., Kang, I.-S., Kitoh, A., Moise, A., Turner, A., Wang, B., and Zhou, T.: The Asian summer monsoon: an intercomparison of CMIP5 vs. CMIP3 simulations of the late 20th century, Clim. Dynam., 41, 2711–2744, https://doi.org/10.1007/s00382-012-1607-6, 2013. a, b
Swart, N. C., Cole, J. N. S., Kharin, V. V., Lazare, M., Scinocca, J. F., Gillett, N. P., Anstey, J., Arora, V., Christian, J. R., Jiao, Y., Lee, W. G., Majaess, F., Saenko, O. A., Seiler, C., Seinen, C., Shao, A., Solheim, L., von Salzen, K., Yang, D., Winter, B., and Sigmond, M.: CCCma CanESM5 model output prepared for CMIP6 DAMIP, Earth System Grid Federation, https://doi.org/10.22033/ESGF/CMIP6.1305, 2019a. a
Swart, N. C., Cole, J. N. S., Kharin, V. V., Lazare, M., Scinocca, J. F., Gillett, N. P., Anstey, J., Arora, V., Christian, J. R., Jiao, Y., Lee, W. G., Majaess, F., Saenko, O. A., Seiler, C., Seinen, C., Shao, A., Solheim, L., von Salzen, K., Yang, D., Winter, B., and Sigmond, M.: CCCma CanESM5 model output prepared for CMIP6 CMIP historical, Earth System Grid Federation, https://doi.org/10.22033/ESGF/CMIP6.3610, 2019b. a
Swart, N. C., Cole, J. N. S., Kharin, V. V., Lazare, M., Scinocca, J. F., Gillett, N. P., Anstey, J., Arora, V., Christian, J. R., Jiao, Y., Lee, W. G., Majaess, F., Saenko, O. A., Seiler, C., Seinen, C., Shao, A., Solheim, L., von Salzen, K., Yang, D., Winter, B., and Sigmond, M.: CCCma CanESM5 model output prepared for CMIP6 ScenarioMIP, Earth System Grid Federation, https://doi.org/10.22033/ESGF/CMIP6.1317, 2019c. a
Tang, Y., Rumbold, S., Ellis, R., Kelley, D., Mulcahy, J., Sellar, A., Walton, J., and Jones, C.: MOHC UKESM1.0-LL model output prepared for CMIP6 CMIP historical, Earth System Grid Federation, https://doi.org/10.22033/ESGF/CMIP6.6113, 2019. a
Tatebe, H. and Watanabe, M.: MIROC MIROC6 model output prepared for CMIP6 CMIP historical, Earth System Grid Federation, https://doi.org/10.22033/ESGF/CMIP6.5603, 2018. a
Taylor, K. E., Stouffer, R. J., and Meehl, G. A.: An Overview of CMIP5 and the Experiment Design, B. Am. Meteorol. Soc., 93, 485–498, https://doi.org/10.1175/BAMS-D-11-00094.1, https://doi.org/10.1175/BAMS-D-11-00094.1, 2012. a
Twomey, S. A., Piepgrass, M., and Wolfe, T. L.: An assessment of the impact of pollution on global cloud albedo, Tellus B, 36, 356–366, https://doi.org/10.1111/j.1600-0889.1984.tb00254.x, 1984. a
Undorf, S., Polson, D., Bollasina, M. A., Ming, Y., Schurer, A., and Hegerl, G. C.: Detectable Impact of Local and Remote Anthropogenic Aerosols on the 20th Century Changes of West African and South Asian Monsoon Precipitation, J. Geophys. Res.-Atmos., 123, 4871–4889, https://doi.org/10.1029/2017JD027711, 2018. a, b, c, d
van Vuuren, D. P., Edmonds, J., Kainuma, M., Riahi, K., Thomson, A., Hibbard, K., Hurtt, G. C., Kram, T., Krey, V., Lamarque, J. F., Masui, T., Meinshausen, M., Nakicenovic, N., Smith, S. J., and Rose, S. K.: The representative concentration pathways: An overview, Climatic Change, 109, 5–31, 2011. a
Voldoire, A.: CMIP6 simulations of the CNRM-CERFACS based on CNRM-CM6-1 model for CMIP experiment historical, Earth System Grid Federation, https://doi.org/10.22033/ESGF/CMIP6.4066, 2018. a
Voldoire, A.: CNRM-CERFACS CNRM-CM6-1 model output prepared for CMIP6 RFMIP, Earth System Grid Federation, https://doi.org/10.22033/ESGF/CMIP6.1383, 2019a. a
Voldoire, A.: CNRM-CERFACS CNRM-CM6-1 model output prepared for CMIP6 ScenarioMIP, Earth System Grid Federation, https://doi.org/10.22033/ESGF/CMIP6.1384, 2019b. a
Westervelt, D. M., Horowitz, L. W., Naik, V., Golaz, J.-C., and Mauzerall, D. L.: Radiative forcing and climate response to projected 21st century aerosol decreases, Atmos. Chem. Phys., 15, 12681–12703, https://doi.org/10.5194/acp-15-12681-2015, 2015. a, b, c, d
Wilcox, L. J., Highwood, E. J., and Dunstone, N. J.: The influence of anthropogenic aerosol on multi-decadal variations of historical global climate, Environ. Res. Lett., 8, 24033, https://doi.org/10.1088/1748-9326/8/2/024033, 2013. a, b
Wilcox, L., Dong, B., Sutton, R., and Highwood, E.: The 2014 hot, dry summer in Northeast Asia, B. Am. Meteorol. Soc., 96, S105–S110, https://doi.org/10.1175/BAMS-D-15-00123.1, 2015. a
Wu, P., Christidis, N., and Stott, P.: Anthropogenic impact on Earth's hydrological cycle, Nat. Clim. Change, 3, 807–810, https://doi.org/10.1038/nclimate1932, 2013. a
Wu, T., Chu, M., Dong, M., Fang, Y., Jie, W., Li, J., Li, W., Liu, Q., Shi, X., Xin, X., Yan, J., Zhang, F., Zhang, J., Zhang, L., and Zhang, Y.: BCC BCC-CSM2MR model output prepared for CMIP6 CMIP historical, Earth System Grid Federation, https://doi.org/10.22033/ESGF/CMIP6.2948, 2018. a
Wyser, K., van Noije, T., Yang, S., von Hardenberg, J., O'Donnell, D., and Döscher, R.: On the increased climate sensitivity in the EC-Earth model from CMIP5 to CMIP6, Geosci. Model Dev., 13, 3465–3474, https://doi.org/10.5194/gmd-13-3465-2020, 2020. a
Xie, P., Arkin, P. A., Xie, P., and Arkin, P. A.: Analyses of Global Monthly Precipitation Using Gauge Observations, Satellite Estimates, and Numerical Model Predictions, J. Climate, 9, 840–858, https://doi.org/10.1175/1520-0442(1996)009<0840:AOGMPU>2.0.CO;2, 1996. a
Xie, P., Arkin, P. A., Xie, P., and Arkin, P. A.: Global Precipitation: A 17-Year Monthly Analysis Based on Gauge Observations, Satellite Estimates, and Numerical Model Outputs, B. Am. Meteorol. Soc., 78, 2539–2558, https://doi.org/10.1175/1520-0477(1997)078<2539:GPAYMA>2.0.CO;2, 1997. a
Xin, X., Wu, T., Shi, X., Zhang, F., Li, J., Chu, M., Liu, Q., Yan, J., Ma, Q., and Wei, M.: BCC BCC-CSM2MR model output prepared for CMIP6 ScenarioMIP, Earth System Grid Federation, https://doi.org/10.22033/ESGF/CMIP6.1732, 2019. a
Yatagai, A., Kamiguchi, K., Arakawa, O., Hamada, A., Yasutomi, N., Kitoh, A., Yatagai, A., Kamiguchi, K., Arakawa, O., Hamada, A., Yasutomi, N., and Kitoh, A.: APHRODITE: Constructing a Long-Term Daily Gridded Precipitation Dataset for Asia Based on a Dense Network of Rain Gauges, B. Am. Meteorol. Soc., 93, 1401–1415, https://doi.org/10.1175/BAMS-D-11-00122.1, 2012. a
Yukimoto, S., Koshiro, T., Kawai, H., Oshima, N., Yoshida, K., Urakawa, S., Tsujino, H., Deushi, M., Tanaka, T., Hosaka, M., Yoshimura, H., Shindo, E., Mizuta, R., Ishii, M., Obata, A., and Adachi, Y.: MRI MRI-ESM2.0 model output prepared for CMIP6 CMIP historical, Earth System Grid Federation, https://doi.org/10.22033/ESGF/CMIP6.6842, 2019a. a
Yukimoto, S., Koshiro, T., Kawai, H., Oshima, N., Yoshida, K., Urakawa, S., Tsujino, H., Deushi, M., Tanaka, T., Hosaka, M., Yoshimura, H., Shindo, E., Mizuta, R., Ishii, M., Obata, A., and Adachi, Y.: MRI MRI-ESM2.0 model output prepared for CMIP6 RFMIP, Earth System Grid Federation, https://doi.org/10.22033/ESGF/CMIP6.635, 2019b. a
Yukimoto, S., Koshiro, T., Kawai, H., Oshima, N., Yoshida, K., Urakawa, S., Tsujino, H., Deushi, M., Tanaka, T., Hosaka, M., Yoshimura, H., Shindo, E., Mizuta, R., Ishii, M., Obata, A., and Adachi, Y.: MRI MRI-ESM2.0 model output prepared for CMIP6 ScenarioMIP, Earth System Grid Federation, https://doi.org/10.22033/ESGF/CMIP6.638, 2019c. a
Zelinka, M. D., Andrews, T., Forster, P. M., and Taylor, K. E.: Quantifying Components of Aerosol-Cloud-Radiation Interactions in Climate Models, J. Geophys. Res.-Atmos., 119, 7599–7615, https://doi.org/10.1002/2014JD021710, 2014. a
Zelinka, M. D., Myers, T. A., McCoy, D. T., Po-Chedley, S., Caldwell, P. M., Ceppi, P., Klein, S. A., and Taylor, K. E.: Causes of Higher Climate Sensitivity in CMIP6 Models, Geophys. Res. Lett., 47, e2019GL085782, https://doi.org/10.1029/2019GL085782, 2020. a