the Creative Commons Attribution 4.0 License.
the Creative Commons Attribution 4.0 License.
 | 21 Oct 2020
Distinct responses of Asian summer monsoon to black carbon aerosols and greenhouse gases
Gunnar Myhre
Xiaodong Liu
Xinzhou Li
Zhengguo Shi
Hongli Wang
Alf Kirkevåg
Jean-Francois Lamarque
Drew Shindell
Toshihiko Takemura
Yangang Liu
Black carbon (BC) aerosols emitted from natural and anthropogenic sources induce positive radiative forcing and global warming, which in turn significantly affect the Asian summer monsoon (ASM). However, many aspects of the BC effect on the ASM remain elusive and largely inconsistent among previous studies, which is strongly dependent on different low-level thermal feedbacks over the Asian continent and the surrounding ocean. This study examines the response of the ASM to BC forcing in comparison with the effect of doubled greenhouse gases (GHGs) by analyzing the Precipitation Driver Response Model Intercomparison Project (PDRMIP) simulations under an extremely high BC level (10 times modern global BC emissions or concentrations, labeled BC×10) from nine global climate models (GCMs). The results show that although BC and GHGs both enhance the ASM precipitation minus evaporation (P−E; a 13.6 % increase for BC forcing and 12.1 % for GHGs from the nine-model ensemble, respectively), there exists a much larger uncertainty in changes in ASM P−E induced by BC than by GHGs. The summer P−E is increased by 7.7 % to 15.3 % due to these two forcings over three subregions, including East Asian, South Asian and western North Pacific monsoon regions. Further analysis of moisture budget reveals distinct mechanisms controlling the increases in ASM P−E induced by BC and GHGs. The change in ASM P−E by BC is dominated by the dynamic effect due to the enhanced large-scale monsoon circulation, whereas the GHG-induced change is dominated by the thermodynamic effect through increasing atmospheric water vapor. Radiative forcing of BC significantly increases the upper-level atmospheric temperature over the Asian region to enhance the upper-level meridional land–sea thermal gradient (MLOTG), resulting in a northward shift of the upper-level subtropical westerly jet and an enhancement of the low-level monsoon circulation, whereas radiative forcing of GHGs significantly increases the tropical upper-level temperature, which reduces the upper-level MLOTG and suppresses the low-level monsoonal circulation. Hence, our results indicate a different mechanism of BC climate effects under the extremely high BC level: that BC forcing significantly enhances the upper-level atmospheric temperature over the Asian region, determining ASM changes, instead of low-level thermal feedbacks as indicated by previous studies.
- Article
(15972 KB) - Full-text XML
-
Supplement
(3674 KB) - BibTeX
- EndNote


Black carbon (BC) aerosols emitted from natural and anthropogenic sources absorb and scatter shortwave radiation, heat the air, and act as the second largest contributor to the current global warming after greenhouse gases (Hansen et al., 2000; Jacobson, 2001; Forster et al., 2007; Ramanathan and Carmichael, 2008; Mahajan et al., 2013; Bond et al., 2013). In recent decades, with the explosive economic development and rapid population growth in India and China, large amounts of BC aerosols have been emitted to the atmosphere and have significantly affected the global and regional energy balance as well as climate, especially over South Asia and East Asia (Ramanathan and Carmichael, 2008; Boucher et al., 2013; Bond et al., 2013; Li et al., 2016).
Many global climate model (GCM) investigations have indicated that BC aerosols can significantly influence the Asian summer monsoon (ASM), including South Asian summer monsoon (SASM) and East Asian summer monsoon (EASM). However, the effects of BC forcing on the ASM remain elusive and largely inconsistent in previous studies as they are strongly dependent on different low-level thermal feedbacks over the Asian continent and the surrounding ocean (e.g., Menon et al., 2002; Ramanathan and Carmichael, 2008; Bond et al., 2013; Boucher et al., 2013; Wu et al., 2015; Li et al., 2016). For the SASM, Lau et al. (2006) showed that BC aerosols combined with natural dusts can increase precipitation over northern India and the Himalayan foothills through an elevated heat pump (EHP) effect during the premonsoon season. The EHP hypothesis was corroborated by other modeling studies (Meehl et al., 2008). In summer, BC aerosols cause an increased cooling over the land surface relative to the adjacent ocean, decreasing the land–sea thermal gradient, weakening the SASM circulation and decreasing the associated precipitation over the Indian subcontinent (Lau and Kim, 2007). On the other hand, other GCM studies do not support the monsoon weakening; instead they show that BC aerosols can enhance the atmospheric meridional heating gradient by increasing the low-level atmospheric temperature over South Asia, strengthening the monsoonal circulation with a stronger moisture flux into South Asia and an increase in the monsoonal rainfall (Wang, 2004; Ramanathan et al., 2005; Chung and Ramanathan, 2006). Studies with coupled GCMs with an interactive ocean showed that the BC-induced sea surface temperature (SST) change over the Indian Ocean also has significant influences on the SASM (Ramanathan et al., 2005; Chung and Ramanathan, 2006; Meehl et al., 2008). The decreased evaporation due to the cooling of the northern Indian Ocean owing to BC dimming can decrease the water moisture and the monsoonal inflow into South Asia as well as the monsoonal precipitation (Ramanathan et al., 2005; Meehl et al., 2008). This BC-induced dimming over the northern Indian Ocean can yield a decrease in meridional SST gradient, which acts to weaken the monsoonal circulation and reduce the summer precipitation, as shown by numerous studies (Ramanathan et al., 2005; Chung and Ramanathan, 2006). Additionally, there exist inconsistent results of the EASM changes induced by BC aerosols, as reviewed by Wu et al. (2015) and Li et al. (2016). Menon et al. (2002) claimed, based on the GCM results with a high proportion of BC aerosols (the single-scattering albedo, SSA, is given as a constant of 0.85), that anthropogenic aerosols can enhance the summer floods in southern China and increase the summer droughts over northern China (southern flood–northern drought, labeled SFND). However, the results cannot be reproduced with the higher and more realistic SSA of 0.9 as derived from the satellite and surface observations (Lee et al., 2007). By considering both the BC semidirect effect and indirect effect, BC aerosols have been shown to result in a reduction in clouds and precipitation in southern China and an enhancement in rainfall in northern China by enhancing the western Pacific subtropical high (Zhang et al., 2009), which is opposite to the SFND pattern. In general, the effects of BC forcing on both the SASM and EASM remain largely inconsistent due to their strong dependency on differences in land or sea low-level thermal feedbacks to BC.
Furthermore, the comprehensive assessment including the vast majority of current GCMs shows that GCMs substantially underestimate the surface BC mass concentration and its scattering and absorption optical thickness (by a factor of 2 to 4 over South Asia and East Asia) and thus severely underestimate the atmospheric heating and surface dimming of BC forcing, mainly due to low biases of the regional emission inventory and inaccurate parameterizations of aerosol processes (Bond et al., 2013; Shindell et al., 2013; Pan et al., 2015; Fan et al., 2018). The underestimated BC concentration in GCMs may be an important factor responsible for inconsistent feedbacks of the ASM mentioned above. Therefore, it is essential to investigate the feedbacks of the ASM induced by BC using high BC concentration.
Therefore, the purpose of the present paper is to determine the effects on the ASM of BC forcing under the extremely high BC level in comparison with the effect of a doubling of CO2 concentration by analyzing the simulations of multiple GCMs in the Precipitation Driver Response Model Intercomparison Project (PDRMIP). PDRMIP provides the climate responses to individual forcers, including extremely high BC level with 10 times the modern global BC emissions or concentrations (Myhre et al., 2017). Previous studies (Samset et al., 2016; Stjern et al., 2017) have shown the importance of the globally averaged temperature and precipitation responses to BC forcing. Another objective is to use the PDRMIP data to see whether or not BC-induced changes in the ASM result from a distinct mechanism different from the abovementioned one about low-level thermally dominated feedbacks of BC forcing.
The rest of this paper is structured as follows. Section 2 provides a brief description of the PDRMIP models, model setups and experiments, data, and the definition of the Asian monsoon domain. Section 3 shows results on the evaluation of the PDRMIP multimodel mean results and changes in the ASM due to the BC and greenhouse gas (GHG) forcings, respectively. In Sect. 4, the physical mechanisms of changes in the ASM induced by BC and GHGs are discussed, including their effective radiative forcing (ERF) and atmospheric temperature changes at the surface and at higher altitudes. Further discussions are shown in Sect. 5, and the summary and conclusions are provided in Sect. 6.
2.1 Model description and PDRMIP data
In the PDRMIP project, global climate models coupled with ocean have run several numerical simulations with similar model configurations and forcing baselines as well as perturbations with five climate drivers (Myhre et al., 2017). These GCMs have simulated a baseline experiment with modern aerosol emissions or concentrations and greenhouse gases with the year 2000 (denoted BASE). The numerical experiments of five perturbations were performed: a doubling of CO2 concentrations (hereafter referred to CO2×2), 3 times the CH4 concentrations (CH4×3), an increase in solar insolation of 2 % (Solar +2 %), 10 times the modern global BC emissions or concentrations (BC×10), and 5 times the modern global sulfate emissions or concentrations (SO4×5). The nine GCMs with BASE and the perturbation experiments are CanESM2, GISS-E2, HadGEM2, HadGEM3-GA4, IPSL-CM5A, MIROC-SPRINTARS, NCAR-CESM1-CAM4, NCAR-CESM1-CAM5 and NorESM1 for analyses, described by Myhre et al. (2017). Table S1 in the Supplement detailedly shows the model information about horizontal and vertical resolutions as well as aerosol emissions for the nine GCMs. Additionally, several GCMs in PDRMIP from Liu et al. (2018) also simulated regional aerosol perturbation experiments, e.g., 10 times the modern BC or SO4 concentrations over the Asian region (labeled BC×10ASIA and SO4×10ASIA, respectively).
Here, we analyze the PDRMIP data from BASE and the two climate perturbations including CO2×2 and BC×10 based on the nine GCMs. In terms of the BASE and other experiments with each perturbation, two kinds of numerical simulations were performed: one using fixed SST (hereafter referred to as fSST) and the other one using a fully coupled ocean or a slab ocean (denoted coupled). The fSST experiments of at least 15 years and the coupled experiments of at least 100 years were run in these GCMs. In the following, the effective radiative forcing (hereafter ERF) is calculated as the net radiative fluxes changes (including shortwave and longwave radiative fluxes) at the top of the atmosphere (TOA) between perturbation experiments and BASE from the last 10 years of fSST experiments (Forster et al., 2016). The feedback response of climate, including the ASM, was diagnosed as the difference between the perturbation simulations and BASE based on the last 50 years of the coupled experiments. All modeled climate data, including temperature, precipitation and wind fields, as well as other physical variables were regridded into horizonal resolution for use in the present analysis in our study.
2.2 Definition of Asian monsoon domain
Based on the definition of the reference from Wang et al. (2012), the monsoon domain was defined as the region where the differences between summer and winter rainfall are larger than 2 mm d−1, and the local summer rainfall exceeds 55 % of the total annual amount. In the Northern Hemisphere, the local summer is defined as May–September (MJJAS), and the winter is November–March (NDJFM) and vice versa for the Southern Hemisphere. According to the above definition of monsoon domain, Figure 1 shows the spatial distribution of the Asian monsoon region based on the observed precipitation from 1979 to 2011 of the Climate Prediction Center (CPC) merged analysis of precipitation (hereafter referred to CMAP) according to Xie and Arkin (1997). The defined Asian monsoon region is further divided into three subregions, including East Asian monsoon (25–42.5∘ N, 105–160∘ E), South Asian monsoon (0–25∘ N, 60–105∘ E) and western North Pacific monsoon (0–25∘ N, 105–160∘ E). We utilize the above-defined Asian monsoon region and the subregions to calculate the regional average in the following analyses.
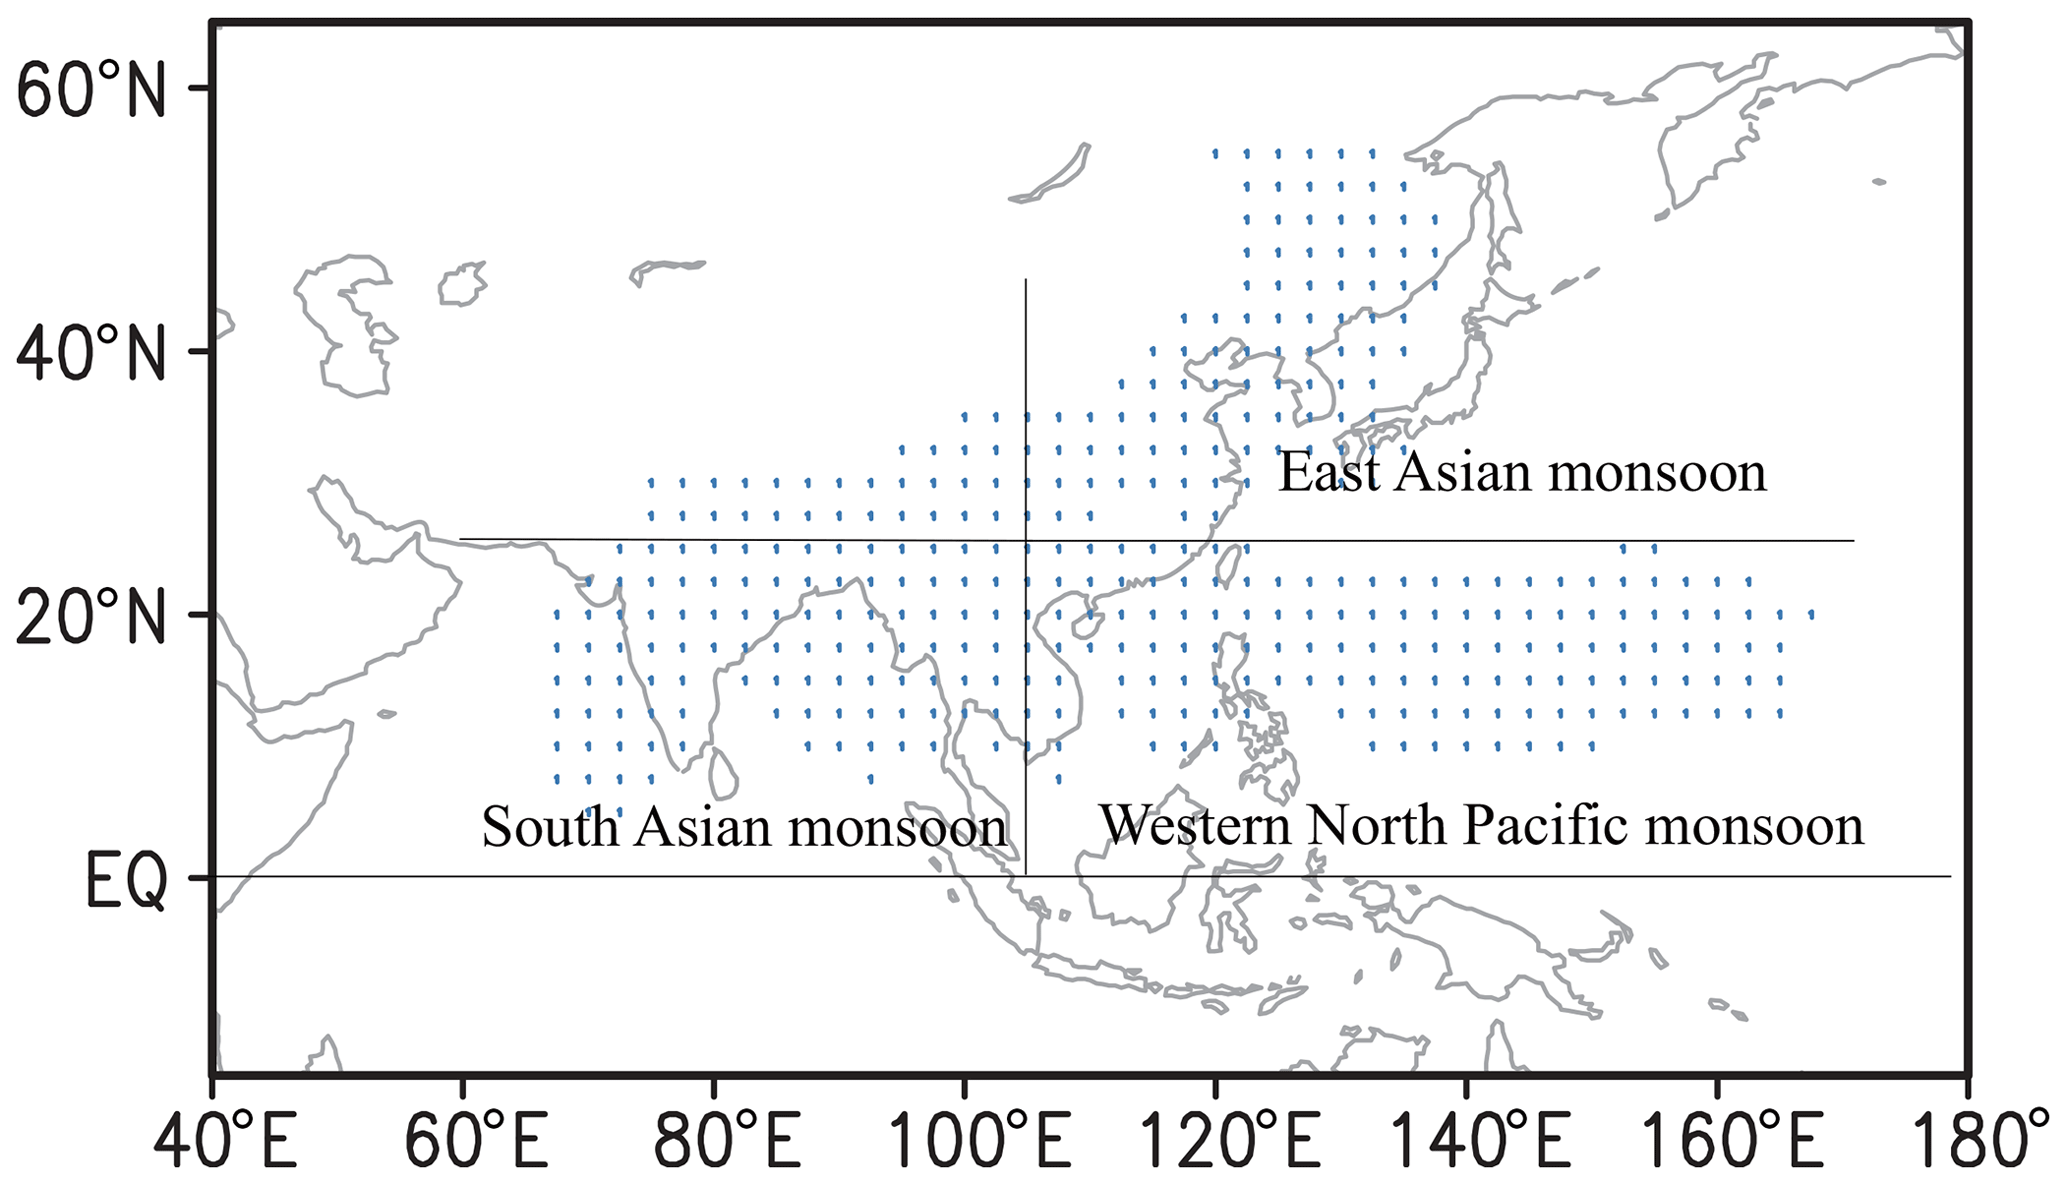
Figure 1Spatial distribution of the Asian monsoon region (stippled, blue) including East Asian, South Asian and western North Pacific monsoon regions based on the CMAP data from 1979 to 2011.
3.1 Evaluation of multimodel results
In this subsection, we first examine the veracity of the simulated ASM by multiple models using the sea level pressure (SLP), the low-level large-scale circulation, and the associated precipitation from the NCEP-DOE Reanalysis 2 (labeled NCEP2; Kanamitsu et al., 2002) and the CPC Merged Analysis of Precipitation (CMAP) for 1979–2011 (Xie and Arkin, 1997). Figure 2 compares the summer (MJJAS) SLP, wind fields at 850 hPa, and the precipitation from observations and the multimodel mean (MMM) of the BASE experiment. The summer SLP field features higher pressure over the low-latitude ocean and the western North Pacific Ocean, and it has relatively lower pressure over the Asian continent (Fig. 2a and b), which leads to north–south and east–west land–sea pressure gradients. This spatial pattern of SLP induces a cross-equatorial flow at 850 hPa over low latitudes near the Equator and a southwesterly flow over the Indian subcontinent, the northern Bay of Bengal and the Arabian Sea as well as southerly winds over eastern China (Fig. 2c and d). Figure 2e and f show larger precipitation over the coast of the Asian maritime continent and weaker precipitation over the Asian inland. Note that the MMM of these simulations produces excessive rainfall over the southern slope of the Tibetan Plateau compared to the CMAP precipitation, mainly due to a relatively coarse horizontal resolution of the models in Fig. 2f, as noted by Li et al. (2015). They also show that spatial distribution of precipitation over and around the Tibetan Plateau and high-altitude mountains becomes more realistic for the higher resolutions (Li et al., 2015). Therefore, the MMM of the BASE experiment can mainly capture the most prominent features of the ASM in terms of the summer SLP, the 850 hPa large-scale circulation and the precipitation in Fig. 2.

Figure 2Comparison of the climatological MJJAS sea level pressure (SLP; unit: hPa), the wind field at 850 hPa (UV850; unit: m s−1) and precipitation (P; unit: mm d−1) between (a, c, e) observations from 1979 to 2011 (NCEP2 wind field and CMAP precipitation) and (b, d, f) multimodel mean of the BASE experiments.
Figure 3 shows the upper-level (200 hPa) geopotential height, wind fields and westerly wind speeds from NCEP2 for 1979–2011 and the MMM of the BASE experiment. Figure 3a shows the South Asian High near 30∘ N (or Tibetan High) in the upper level at 200 hPa, producing a continental-scale anticyclonic outflow toward the low latitudes and the ocean and driving the westerly upper-level jet near 40∘ N in NCEP2 (Fig. 3c). This spatial pattern of the South Asian High and the upper-level subtropical westerly jet is also depicted realistically in MMM of the BASE experiment, although the center of the South Asian High is stronger than that in NCEP2 (Fig. 3b), and the intensity of the westerly jet is somewhat weaker (Fig. 3d). In general, the MMM of the BASE run can capture most monsoon features, including the low-level and high-level thermal structures and the large-scale circulation associated with the monsoon as well as the monsoonal precipitation as shown in Figs. 2 and 3.
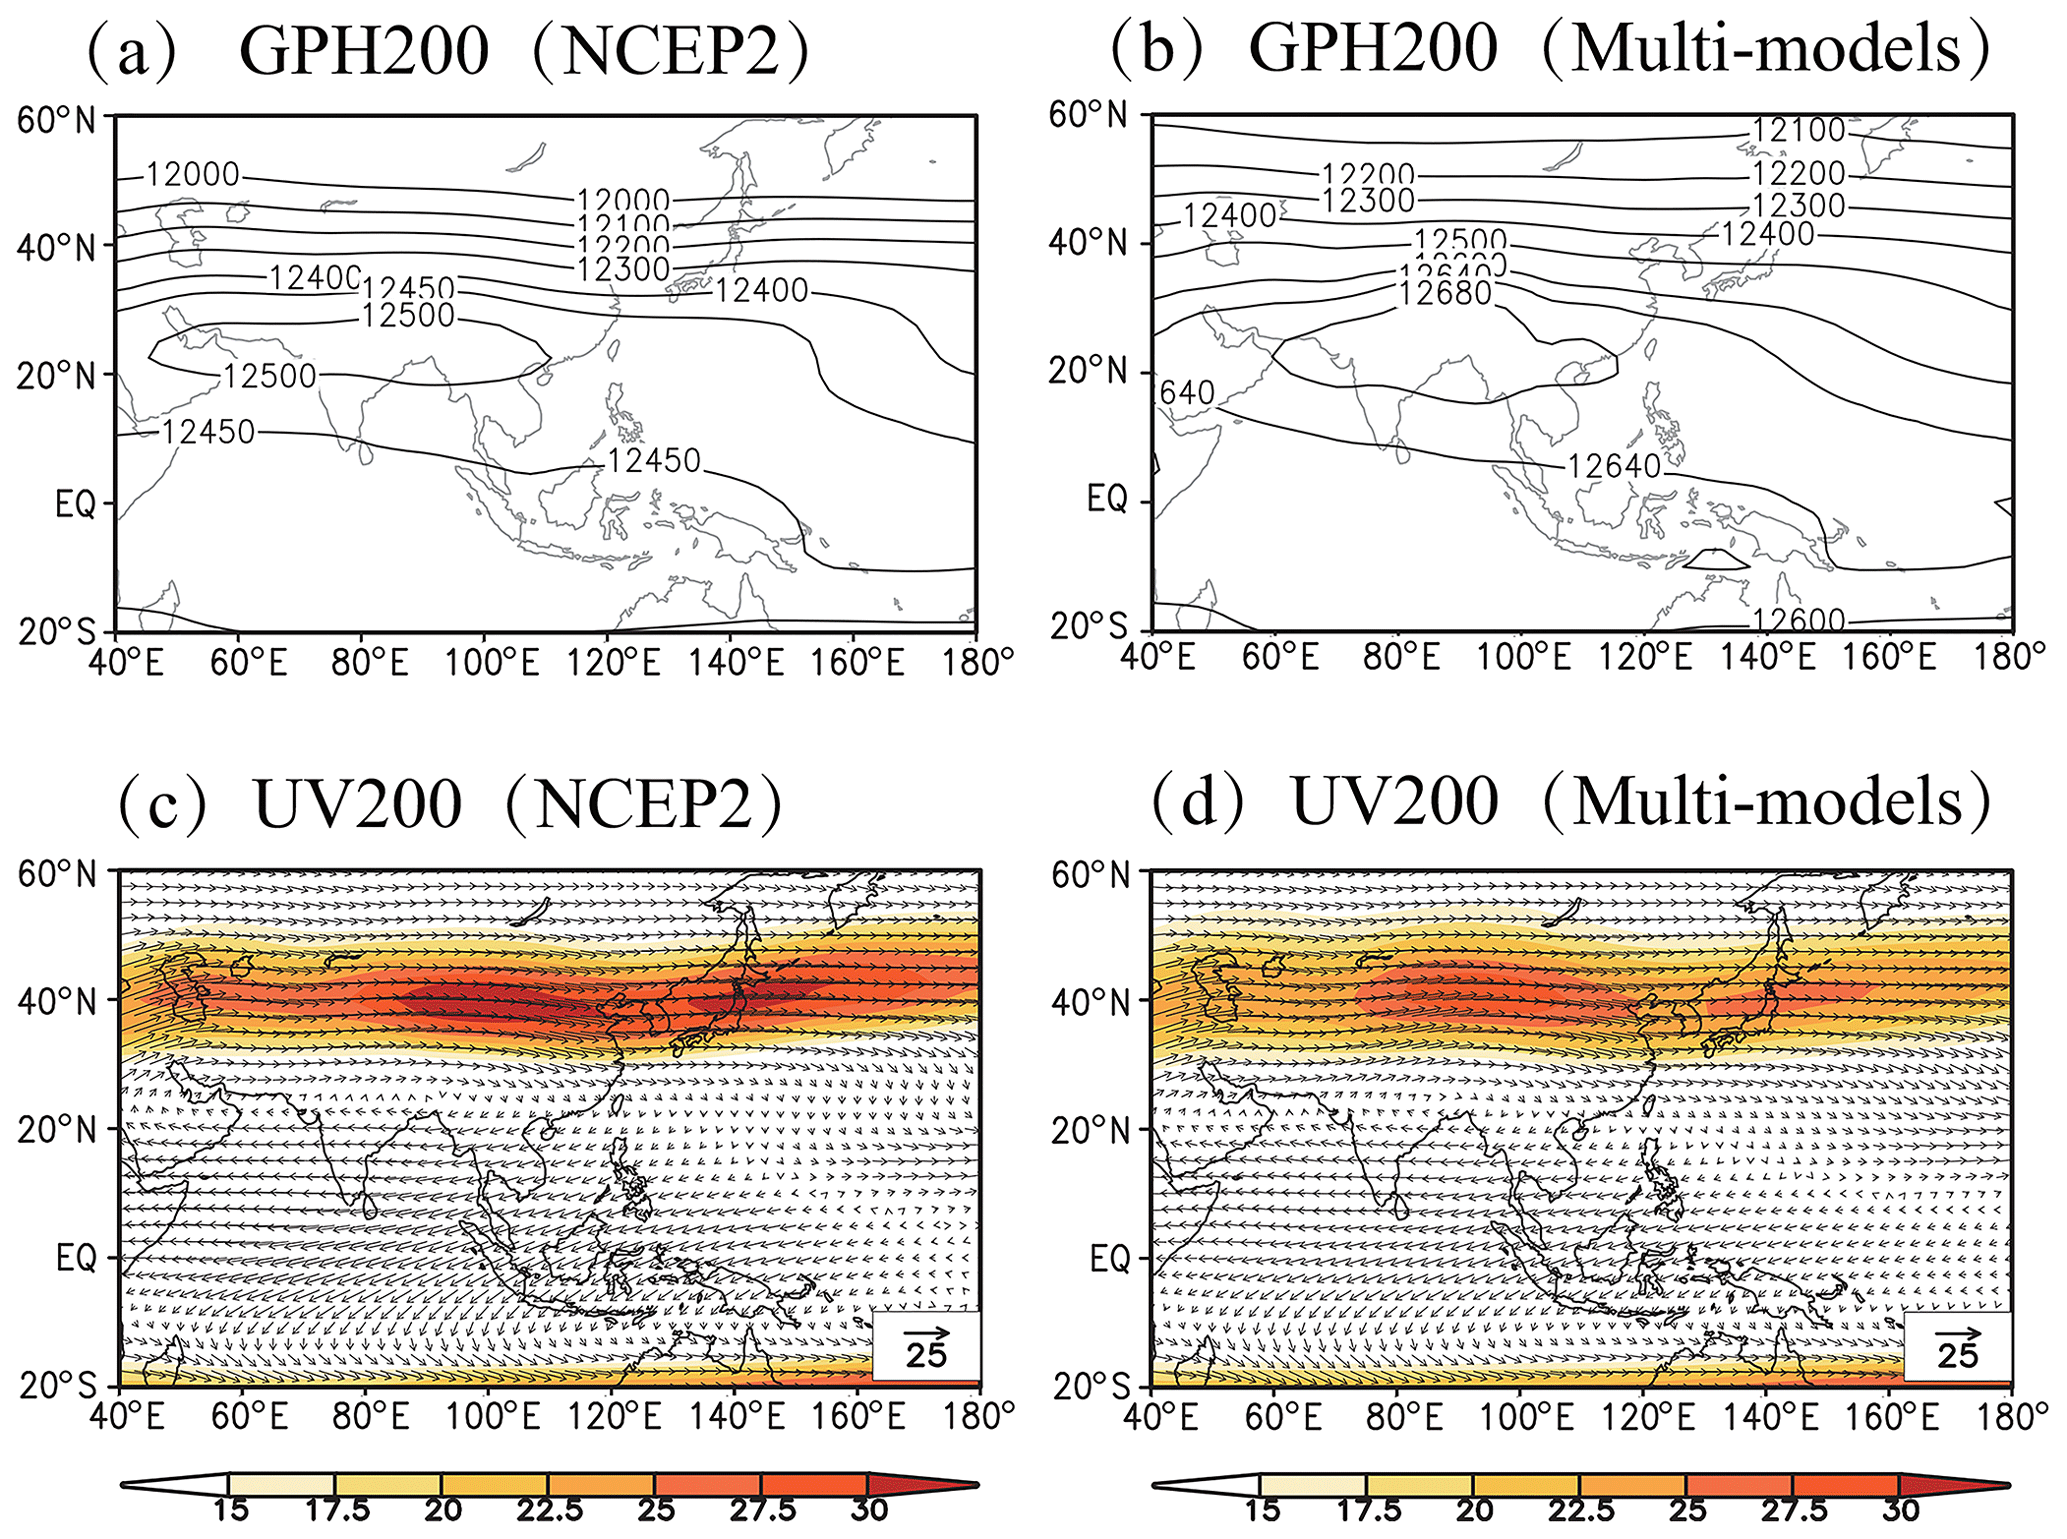
Figure 3Comparison of the climatological MJJAS mean of 200 hPa geopotential height (GPH200; unit: geopotential meters, gpm), 200 hPa wind field (UV200; unit: m s−1) and westerly wind speed (shaded; unit: m s−1) between (a, c) observations from 1979 to 2011 and (b, d) multimodel mean of the BASE experiments.
3.2 Comparison of ASM changes induced by BC and GHGs
Figure 4 shows the domain-averaged value and spatial distribution of changes in MJJAS precipitation minus evaporation (hereafter denoted P−E; unit: mm d−1) for BC and GHG forcings over the Asian monsoon region. Evidently, both BC and GHGs cause a substantial wetting over the Asian monsoon region with an increase in MMM of 0.37±0.28 mm d−1 from BC forcing and 0.29±0.13 mm d−1 from GHGs. There is a 13.6 % increase for BC×10 and a 12.1 % increase for CO2×2 in this region (Table 1). Moreover, the increase in summer P−E due to BC forcing has a wider range, from 0.01 (IPSL-CM5A) to 0.88 mm d−1 (HadGEM2), for the individual GCMs, whereas it has a narrower range, between 0.10 (IPSL-CM5A) and 0.47 mm d−1 (NCAR-CESM1-CAM4), for GHGs. Therefore, the BC-induced changes in summer P−E have larger uncertainty in these models than that from GHGs according to the standard deviation of the MMM and the range of P−E changes from the nine GCMs. This larger uncertainty is mainly due to large uncertainty in BC-induced ERF as discussed in the next section. The spatial distribution of BC- and GHG-induced changes in MMM P−E shows that the summer P−E values are all significantly increased over the three subregions, including the East Asian, South Asian and western North Pacific monsoon regions in Fig. 4c and d. Domain-averaged calculated values in Table 1 indicate an increase in MMM P−E from 0.16 mm d−1 (7.7 %) to 0.48 mm d−1 (15.3 %), induced by these two forcings over these three subregions.
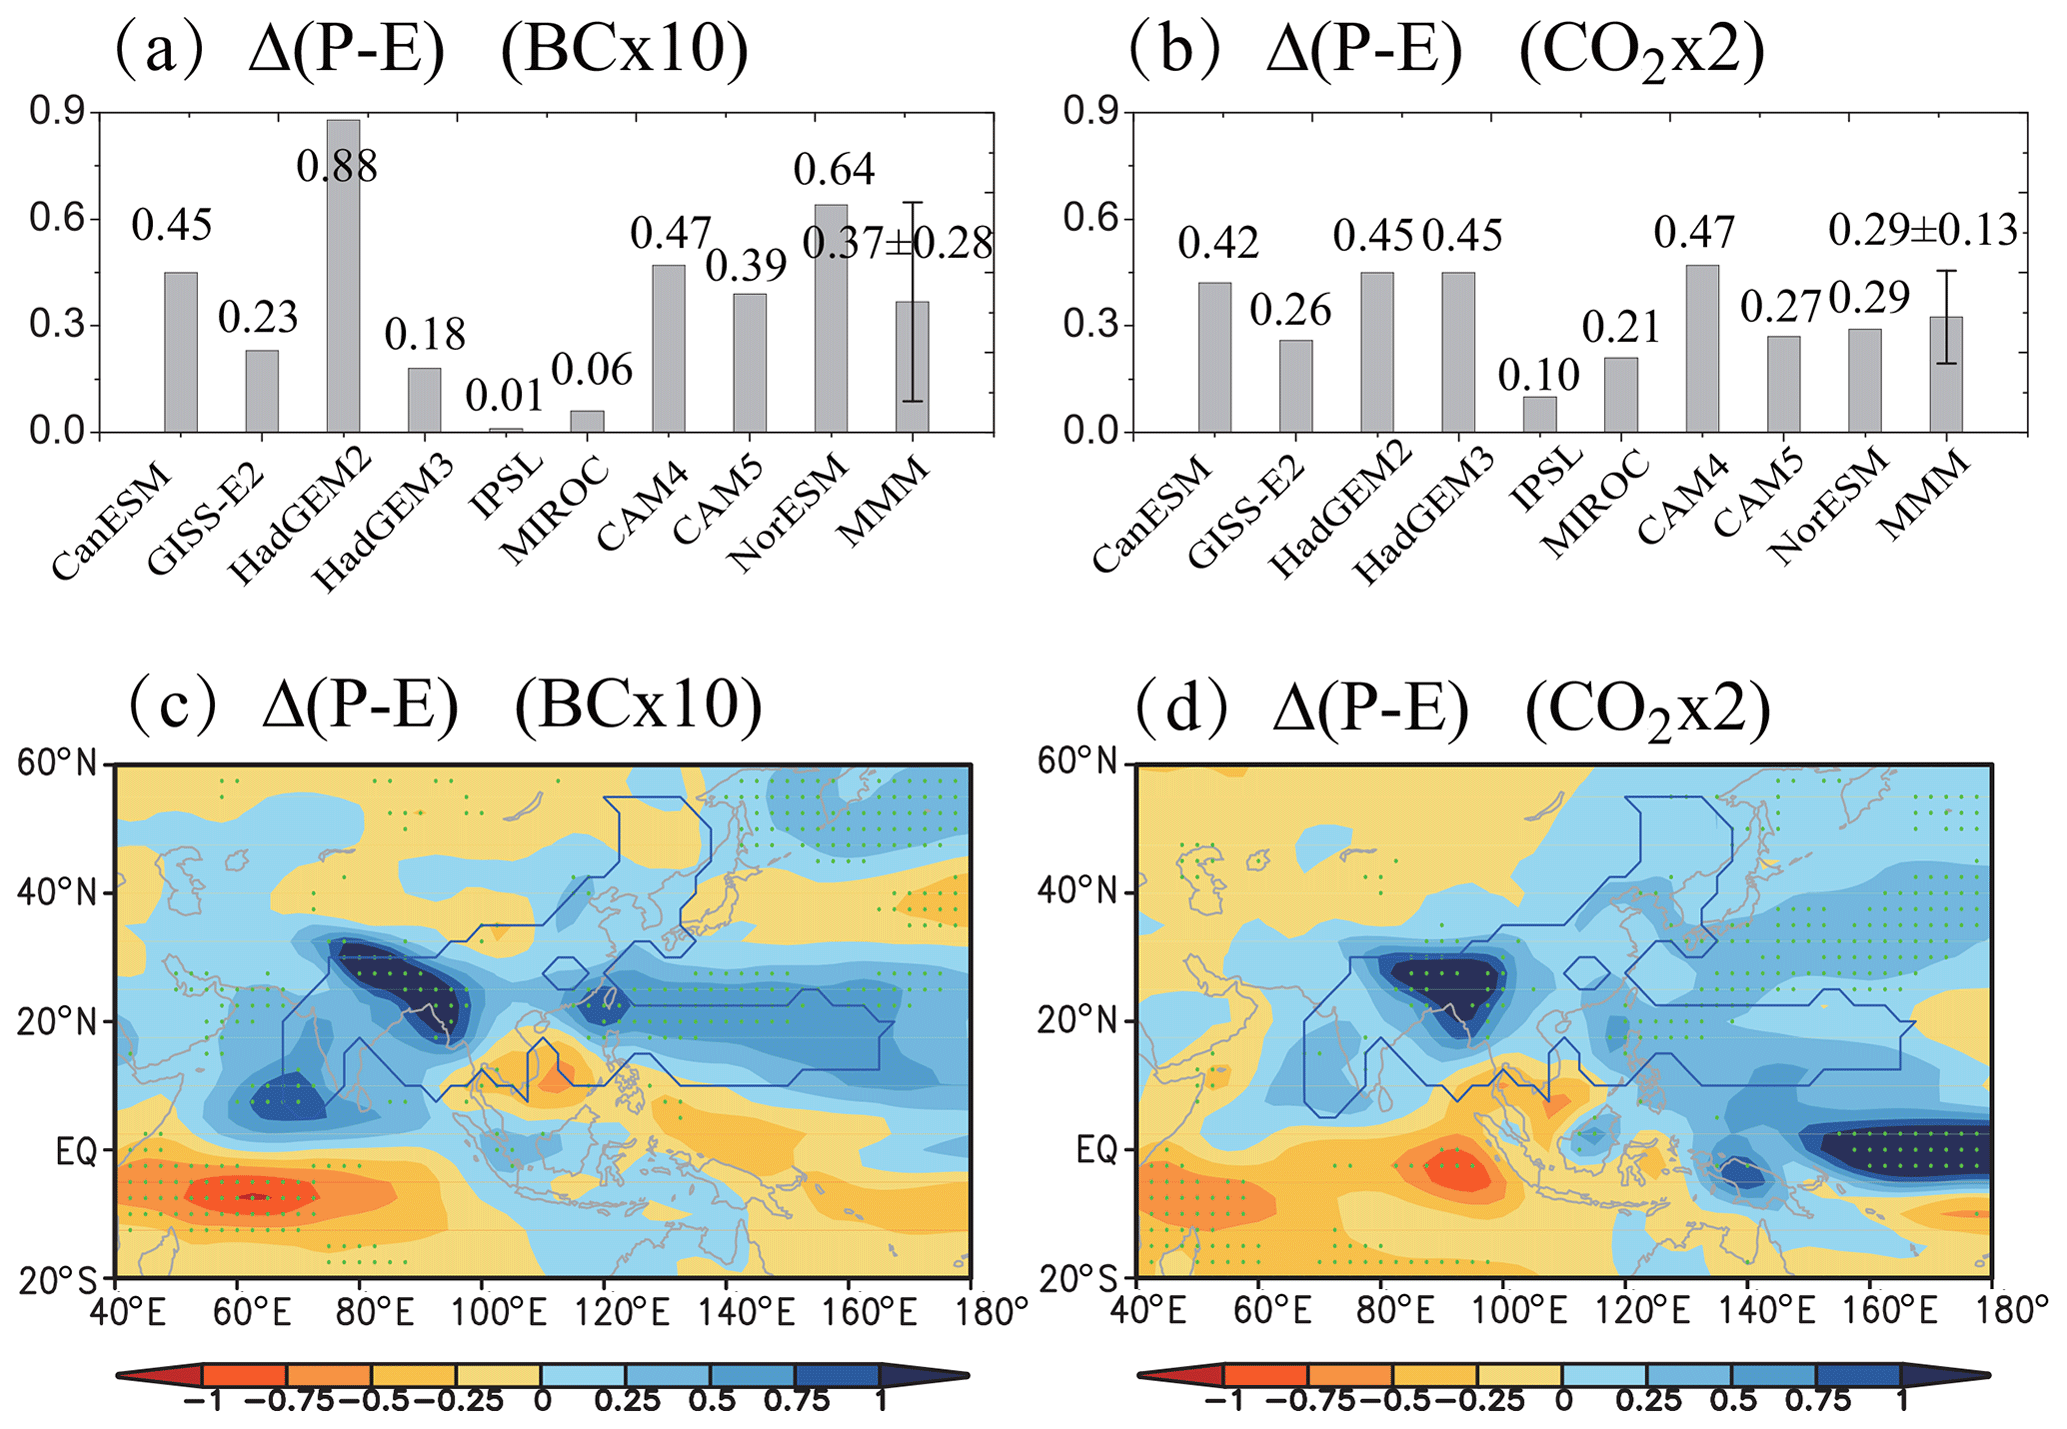
Figure 4Changes in the MJJAS precipitation minus evaporation (Δ(P−E); unit: mm d−1) under (a, c) increasing BC and (b, d) GHGs. (a, b) Domain-averaged value over the Asian monsoon region and (c, d) spatial pattern of the multimodel mean (MMM). Error bars (a, b) of the MMM represent the standard deviation. Dotted regions (c, d) indicate where the MMM is more than 1 standard deviation away from 0. The areas within the blue line represent the Asian monsoon region.
Table 1Multimodel mean of the MJJAS precipitation minus evaporation (P−E; unit: mm d−1) in the Asian monsoon region (AM) and the subregions, including the East Asian monsoon (EAM), the South Asian monsoon (SAM) and the western North Pacific monsoon (WPM) for BASE, BC×10 and CO2×2 experiments as well as corresponding differences between BC×10 (or CO2×2) and the BASE experiment.

In order to investigate the mechanism governing the summer P−E responses for BC and GHG forcings, we have diagnosed a moisture budget analysis assuming the linearized formulation as follows (Seager et al., 2010; Seager and Naik, 2012):
In the above equation, Δ(P−E) represents the term in terms of P−E changes between the sensitivity (perturbation) and control (BASE) experiments. The thermodynamic term ΔTH and the dynamic term ΔDY are the vertical integration from the surface to the top of the atmosphere. ΔTH is influenced only by changes in specific humidity, with fixed large-scale circulations, whereas ΔDY involves changes in the large-scale circulation assuming no changes in specific humidity. The residual term ΔRes includes transient eddy fluxes, surface quantities and nonlinear terms (Seager et al., 2010; Seager and Naik, 2012). Figure 5 shows the domain-averaged terms in the MMM and the spatial distribution of each term in the moisture budget (Eq. 1) during the summer season over the Asian monsoon domain. For BC forcing, the regional wetting is dominated by the dynamic term in Fig. 5a, whereas the thermodynamic term contributes to the increase in ASM P−E slightly. From the spatial distribution of the thermodynamic and dynamic terms in Fig. 5b and d, one can see a high and statistically significant increase in the dynamic term but a low and insignificant increase in the thermodynamic term over the Asian monsoon region, which also indicates that the P−E change due to BC is dominated by the dynamic term. For GHG forcing, the increase in ASM P−E is controlled by the thermodynamic term, whereas the dynamic term has a negative value (Fig. 5a). Figure 5c and e also show a significant increase in the thermodynamic term over the Asian monsoon region and an insignificant decrease in the dynamic term over most of the Asian monsoon region. Therefore, the moisture budget analysis indicates that the ASM P−E increases due to BC and GHGs are dominated by distinct dynamic and thermodynamic terms, respectively.
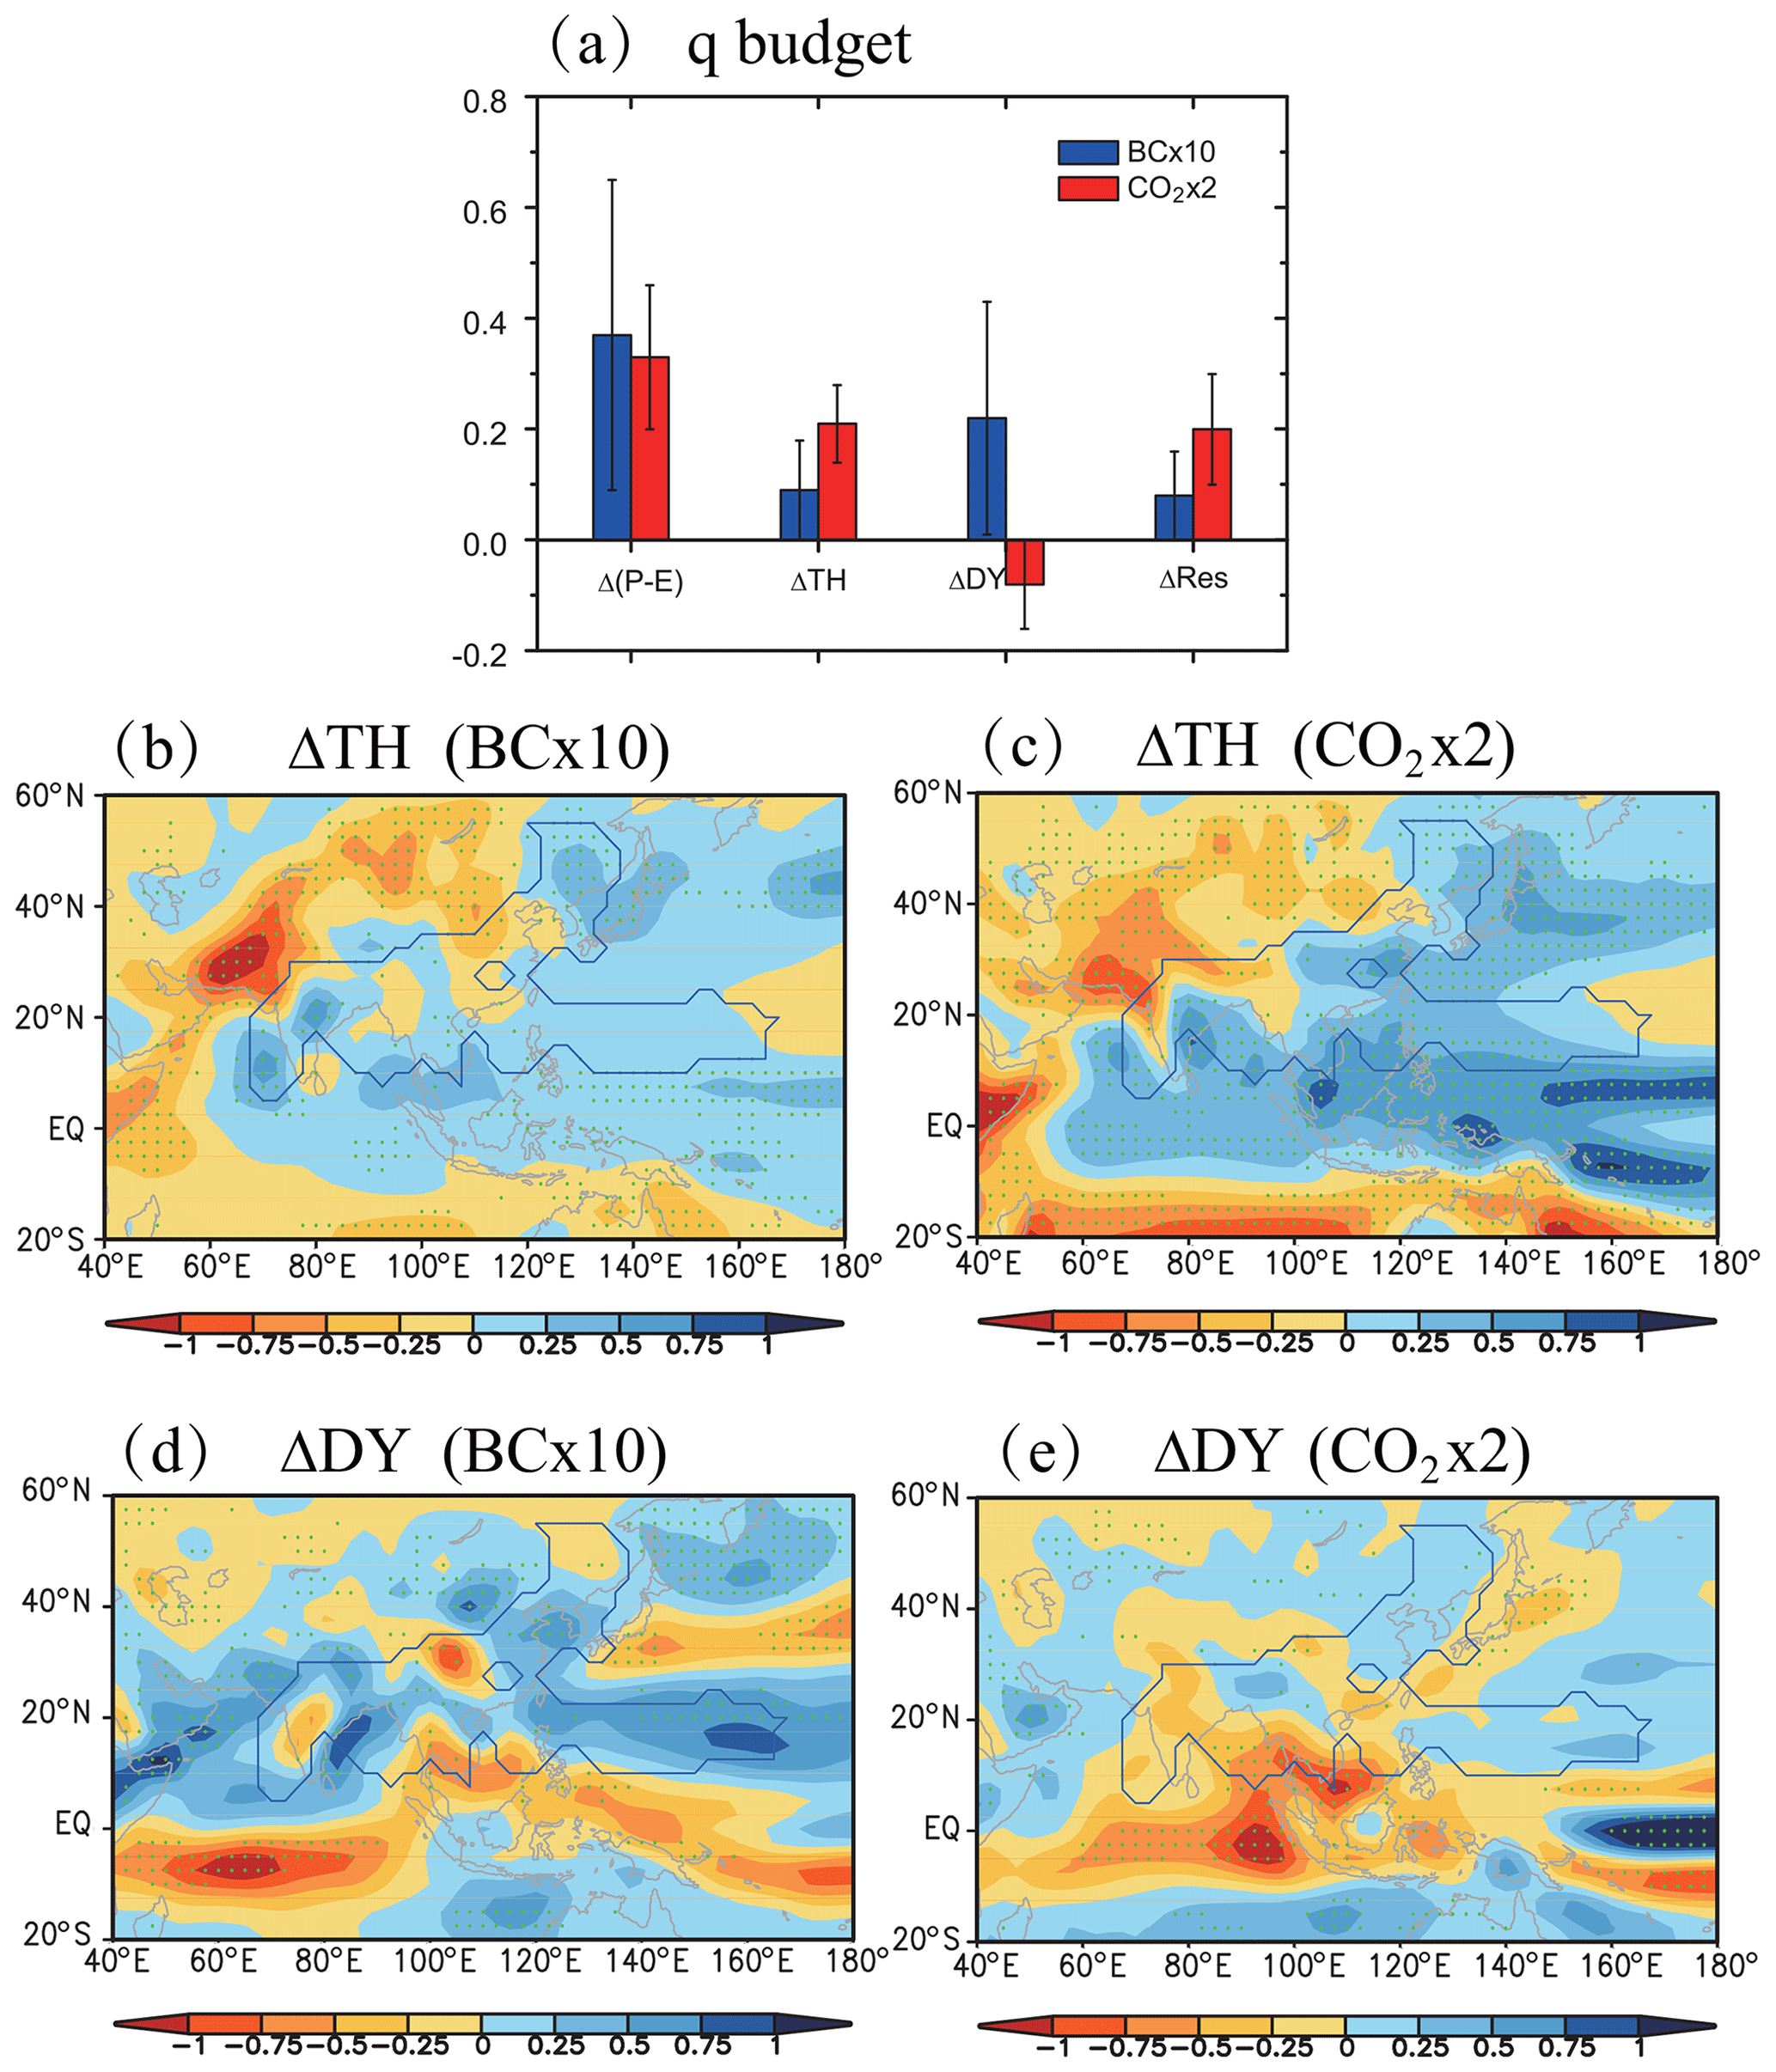
Figure 5(a) MJJAS domain-averaged changes (unit: mm d−1) in the multimodel mean (MMM) precipitation minus evaporation (Δ(P−E)), the thermodynamic term (ΔTH), the dynamic term (ΔDY) and residual term (ΔRes) of the moisture budget equation under increasing BC and GHGs. (b, c) Spatial distribution of the MMM MJJAS ΔTH, (d, e) ΔDY under increasing BC and GHGs. Error bars (a) of the MMM represent the standard deviation. Dotted regions (b, c, d, e) indicate where the MMM is more than 1 standard deviation away from 0, and the areas within the blue line represent the Asian monsoon region.
Due to the absolute differences in the above moisture budget analysis between the BC and GHG forcings, we further analyze the BC- and GHG-induced changes in the large-scale circulation (Fig. 6) and specific humidity (Fig. 7). It can be seen that BC forcing induces much more significant changes in the large-scale circulation compared to GHG forcing, including low-level and high-level horizontal wind fields and vertical velocity. Figure 6a shows that BC forcing significantly increases the southwesterly flow over the Arabian Sea and India and enhances the southerly winds over eastern China. It shows a significant increase in the upward vertical velocity at 500 hPa induced by BC over the Asian monsoon region (Fig. 6c). These results indicate the significant enhancement of the large-scale ASM circulation induced by BC forcing. Additionally, changes in the large-scale circulation due to BC forcing are also evident in the spatial pattern of the upper-level westerly wind in Fig. 6e. It shows a significant decrease in westerly wind speed over the regions between 20 and 40∘ N and an increase at higher latitudes, illustrating that BC forcing induces a northward movement of the upper-level subtropical westerly jet. This northward movement of the subtropical westerly jet is absolutely consistent with the low-level ASM circulation enhancement (Fig. 6a). Figure 6b, d and f show insignificant changes due to GHGs in low-level and high-level wind fields and the vertical velocity at 500 hPa. Furthermore, Fig. 7 shows the changes in MMM of MJJAS vertically integrated water vapor due to the BC and GHG forcings. This figure shows that both BC and GHGs induce statistically significant increases in vertically integrated water vapor due to BC- and GHG-induced atmospheric warming. However, the change in vertically integrated water vapor due to GHGs is much larger than that due to BC forcing. Therefore, BC yields a significant enhancement of large-scale ASM circulation and a relatively smaller increase in water vapor, implying that the dynamic term dominates the ASM P−E increase, and the thermodynamic term compensates its increase. However, GHGs induce a larger increase in water vapor and insignificant changes in the large-scale circulation, which suggests that the increase in ASM P−E due to GHGs is dominated by the thermodynamic term. These results indicate that the changes in the large-scale circulation and the water vapor due to BC and GHG forcings are consistent with the above moisture budget analysis.
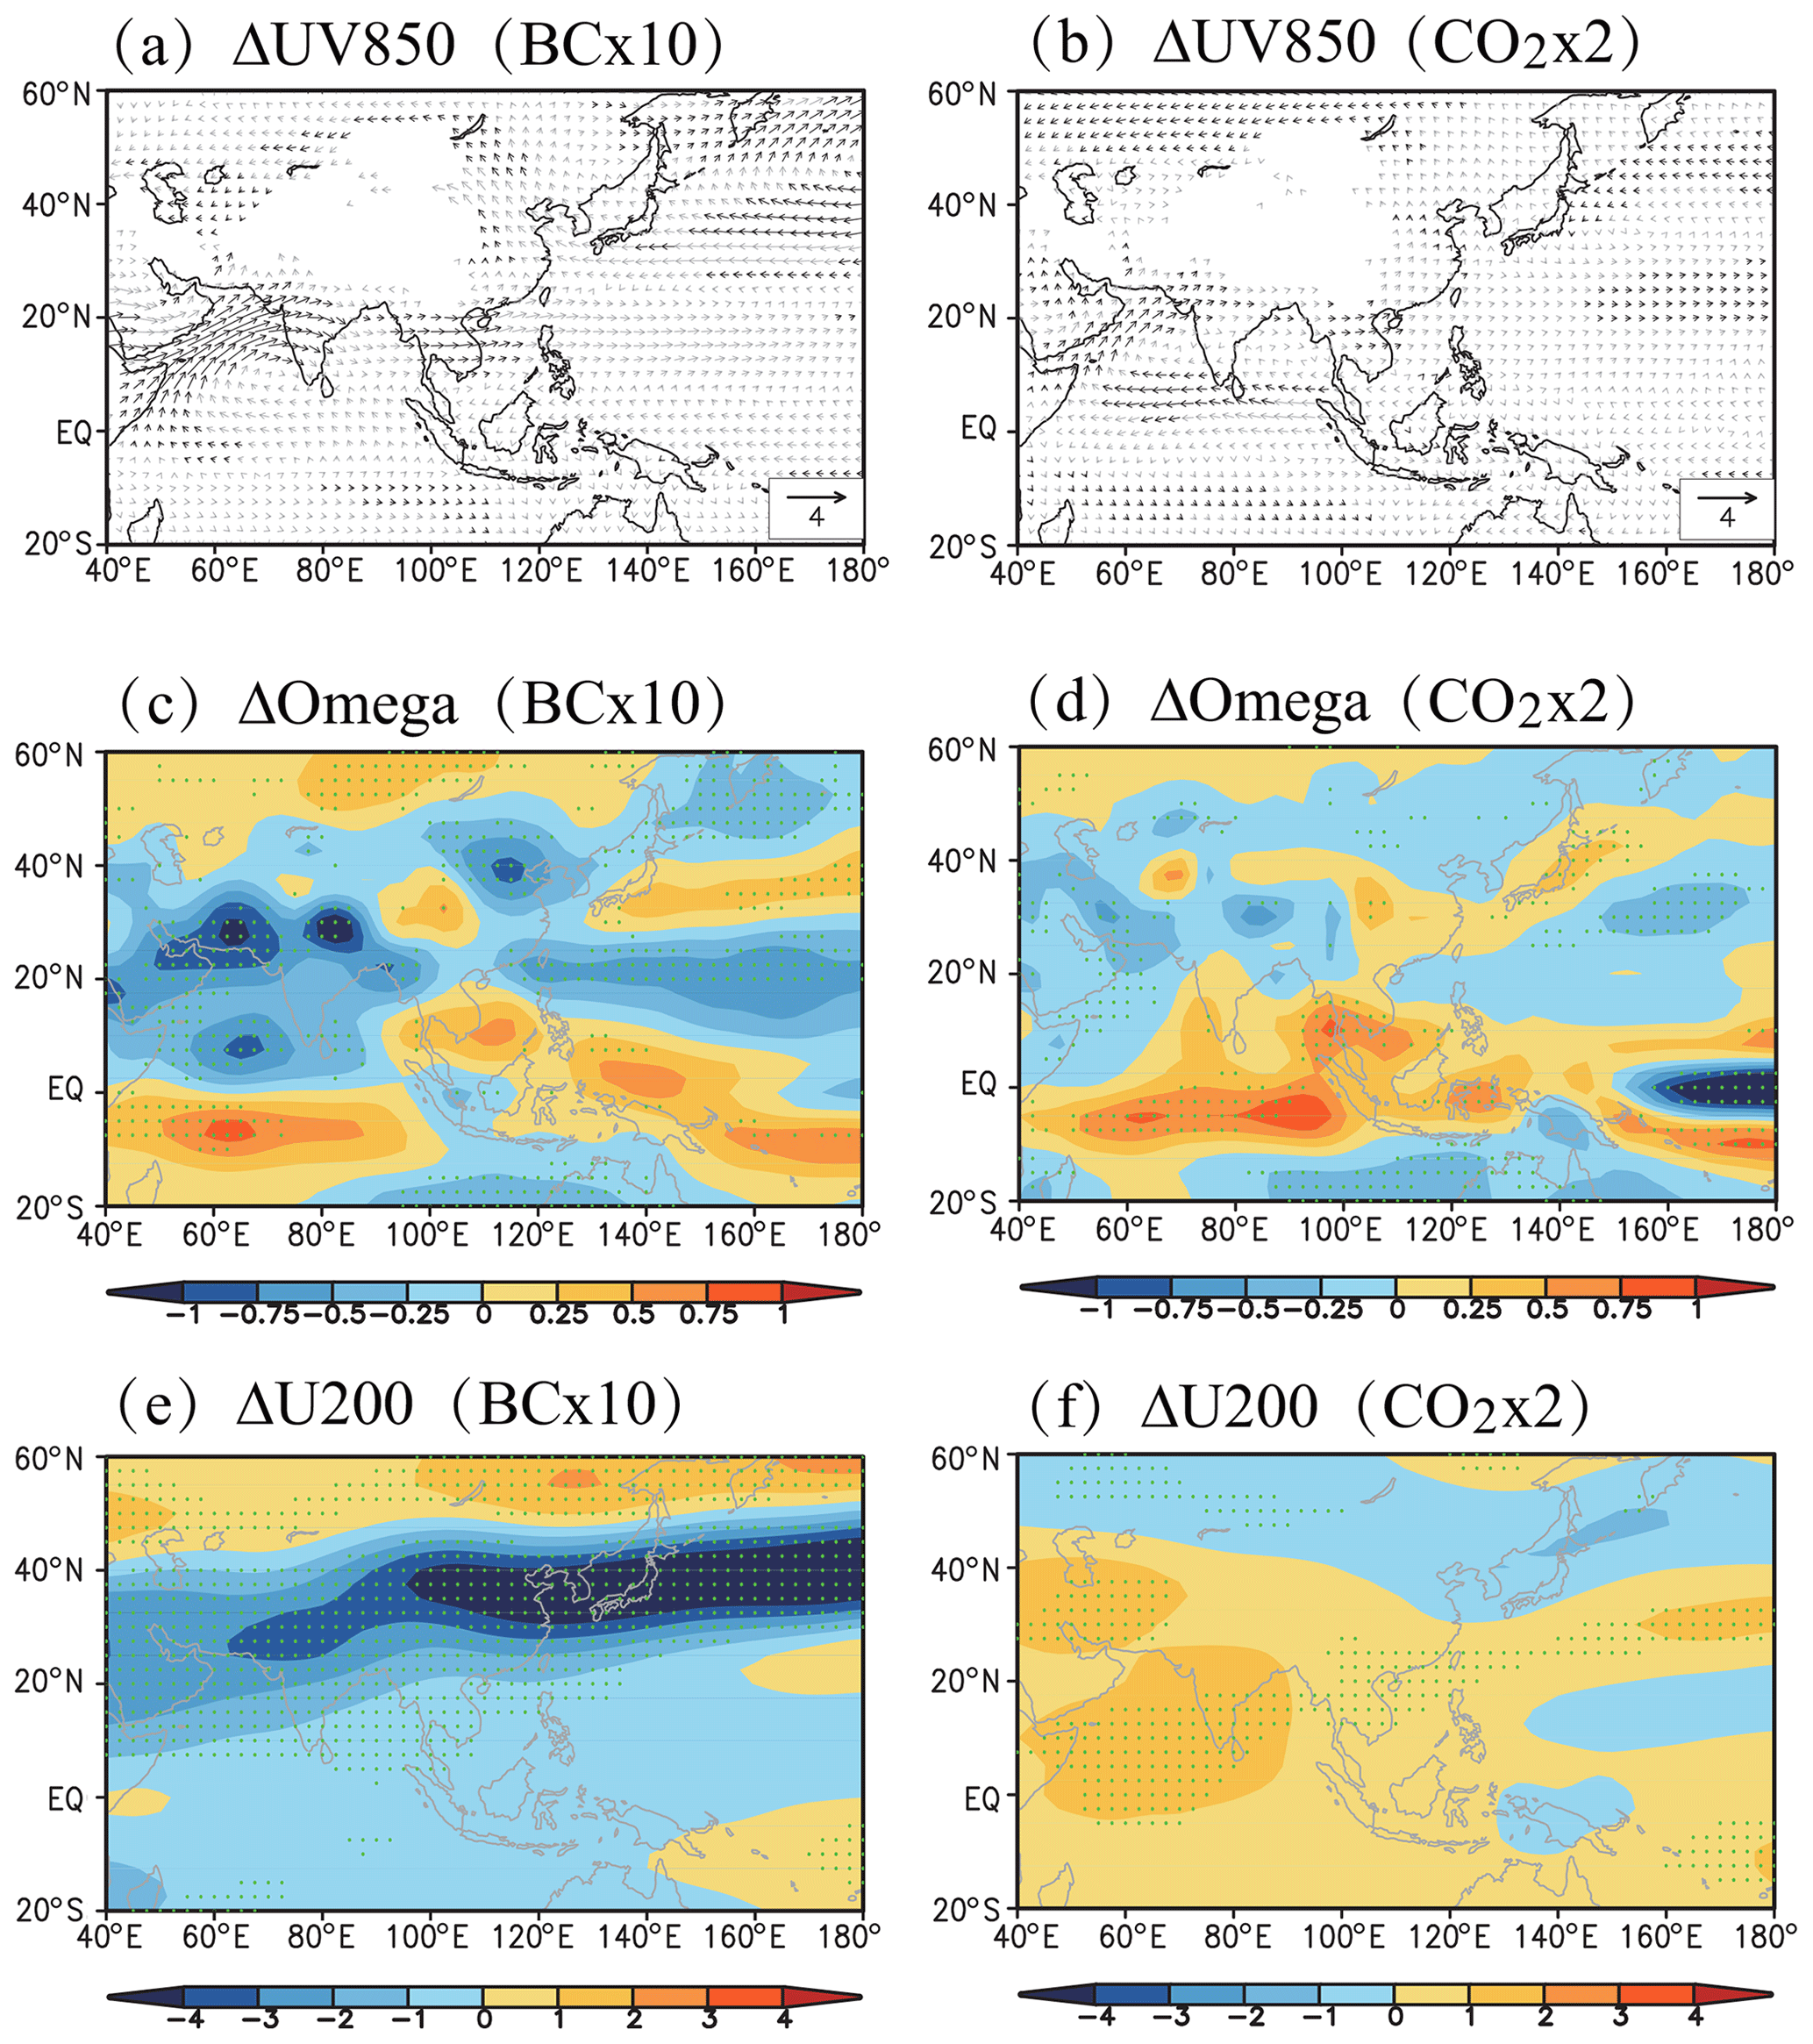
Figure 6Changes in (a, b) multimodel mean (MMM) of the MJJAS 850 hPa wind field (ΔUV850; unit: m s−1), (c, d) 500 hPa vertical velocity (ΔOmega; unit: 0.01× Pa s−1) and (e, f) 200 hPa westerly wind speed (ΔU200; unit: m s−1) under increasing BC and GHGs. Black arrows (a, b) and dotted regions (c, d, e, f) indicate where the MMM is more than 1 standard deviation away from 0.
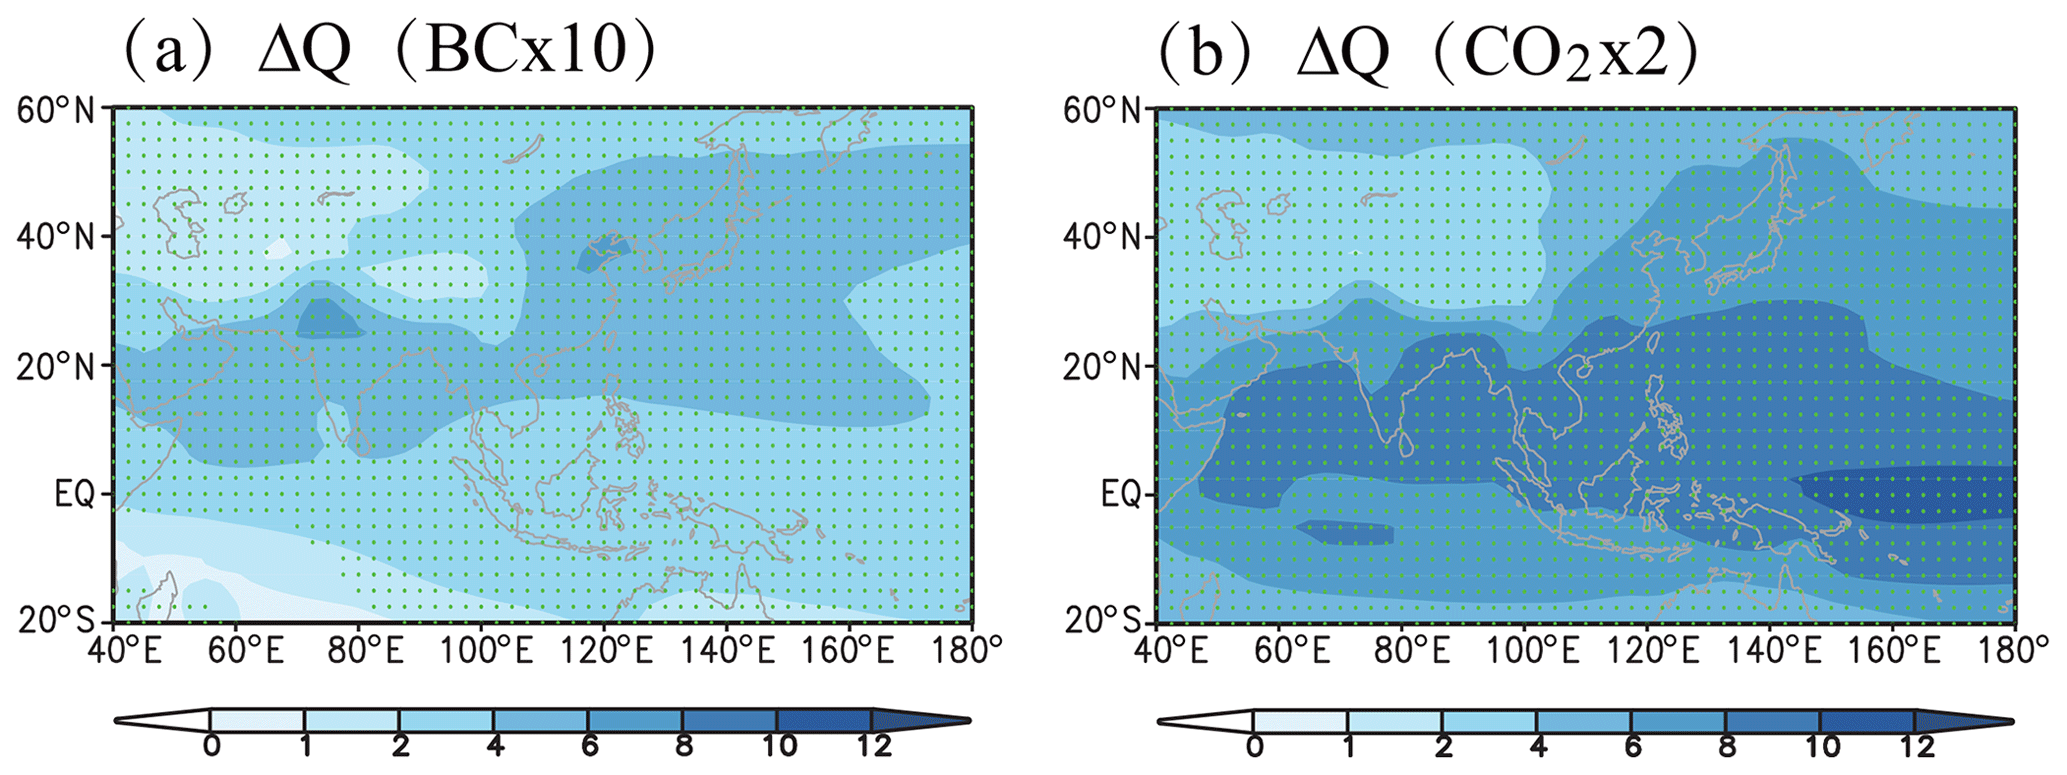
Figure 7Changes in multimodel mean (MMM) of the MJJAS vertically integrated water vapor (ΔQ; unit: g m−2) under (a) increasing BC and (b) GHGs. Dotted regions indicate where the MMM is more than 1 standard deviation away from 0.
To seek physical mechanisms underlying the distinct responses of the ASM to BC and GHGs, Fig. 8 shows the spatial distribution of MMM values of the MJJAS ERF (W m−2) induced by BC (Fig. 8a) and GHGs (Fig. 8b) over the Asian region, according to the corresponding fSST experiments in PDRMIP. The BC-induced ERF yields a significant positive value over the Asian continent, whereas it has an insignificant change over the surrounding oceans, including the Indian Ocean and Pacific Ocean (Fig. 8a). The much larger positive forcings, particularly over the Indian subcontinent (larger than +5 W m−2) and over eastern China (exceeding +10 W m−2), are mainly due to the existence of high BC burden over these two regions (Fig. S1 in the Supplement in reference to Stjern et al., 2017). In contrast, GHG-induced ERF is significantly positive and uniform (below +7.5 m−2) over the Asian continent and the surrounding oceans (Fig. 8b), mainly because GHGs are well mixed on a global scale. Our analysis suggests that there are obvious differences in the spatial distribution between BC- and GHG-induced ERF, although both of them induce positive radiative forcings at the TOA.
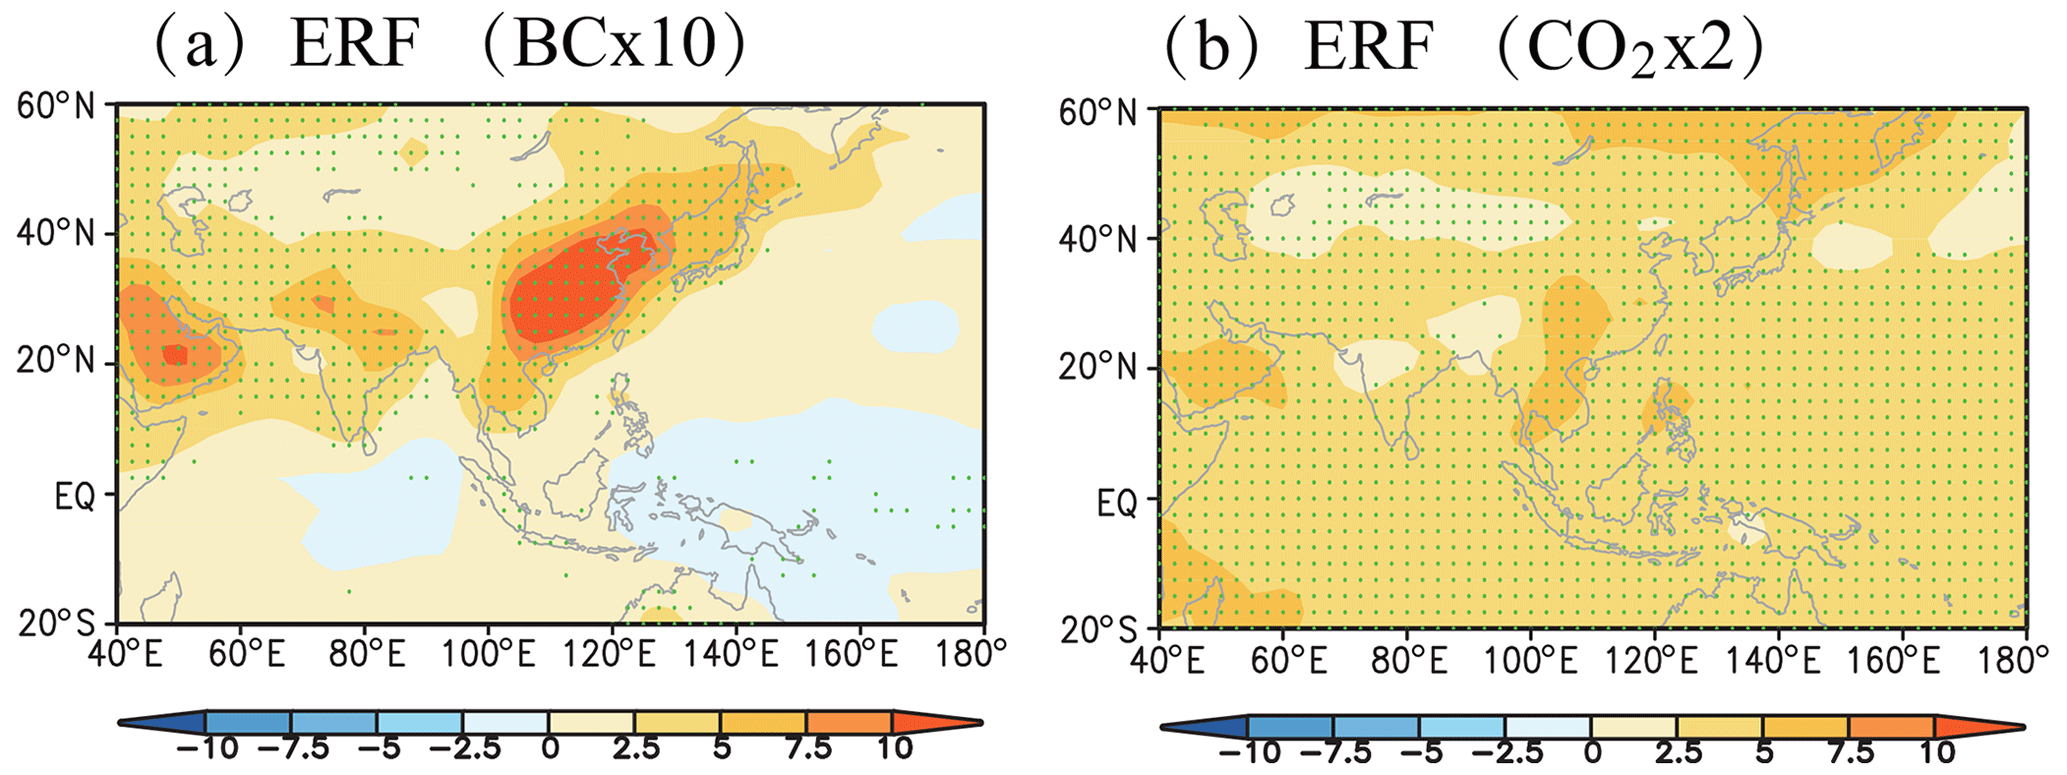
Figure 8Multimodel mean (MMM) of the MJJAS effective radiative forcing (ERF; unit: W m−2) under (a) increasing BC and (b) GHGs. Dotted regions indicate where the MMM is more than 1 standard deviation away from 0.
Figure 9 shows the BC- and GHG-induced changes in MMM of MJJAS surface atmospheric temperature and SLP. It can be seen that BC induces a greater surface warming over the Eurasian continent at middle and high latitudes and a smaller surface warming over low-latitude ocean regions (Fig. 9a). The increases in surface temperature are mainly due to positive ERF in Fig. 8a in the coupled experiments (Gregory et al., 2004; Myhre, 2013). Note that the MMM surface temperature has insignificant decreases over the Indian subcontinent and increases with a smaller amplitude over eastern China. However, there also exists a different sign (increase or decrease) in surface temperature changes due to BC over both these two regions under the extremely high BC level for the individual models (Fig. S1 in the Supplement), consistent with the previous PDRMIP study by Stjern et al. (2017). These results are also consistent with previous results based on present-day BC concentration level (Bond et al., 2013; Wu et al., 2015; Li et al., 2016). Hence, there are intermodel differences in low-level temperature feedbacks due to BC over South Asia and East Asia under not only present-day but also extremely high BC concentration levels. Figure 9c shows that a significant decrease in SLP exists over the Eurasian continent at middle and high latitudes due to the BC-induced surface warming over this region. However, the changes in SLP are small and insignificant over the Indian subcontinent and eastern China because of smaller changes in surface temperature. Hence, the BC-induced increases in the surface thermal and pressure gradients between land and ocean are insignificant (Fig. 9a and c). GHGs induce a surface global warming with a greater warming over the whole continent and a lesser warming over ocean in Fig. 9b due to different heat capacity of land and ocean (Lambert and Chiang, 2007; Lambert et al., 2011). Figure 9d shows a significant decrease in SLP over the Eurasian continent and a significant increase over the surrounding ocean, indicating increased land–sea thermal and pressure gradients due to GHG forcing at the surface.
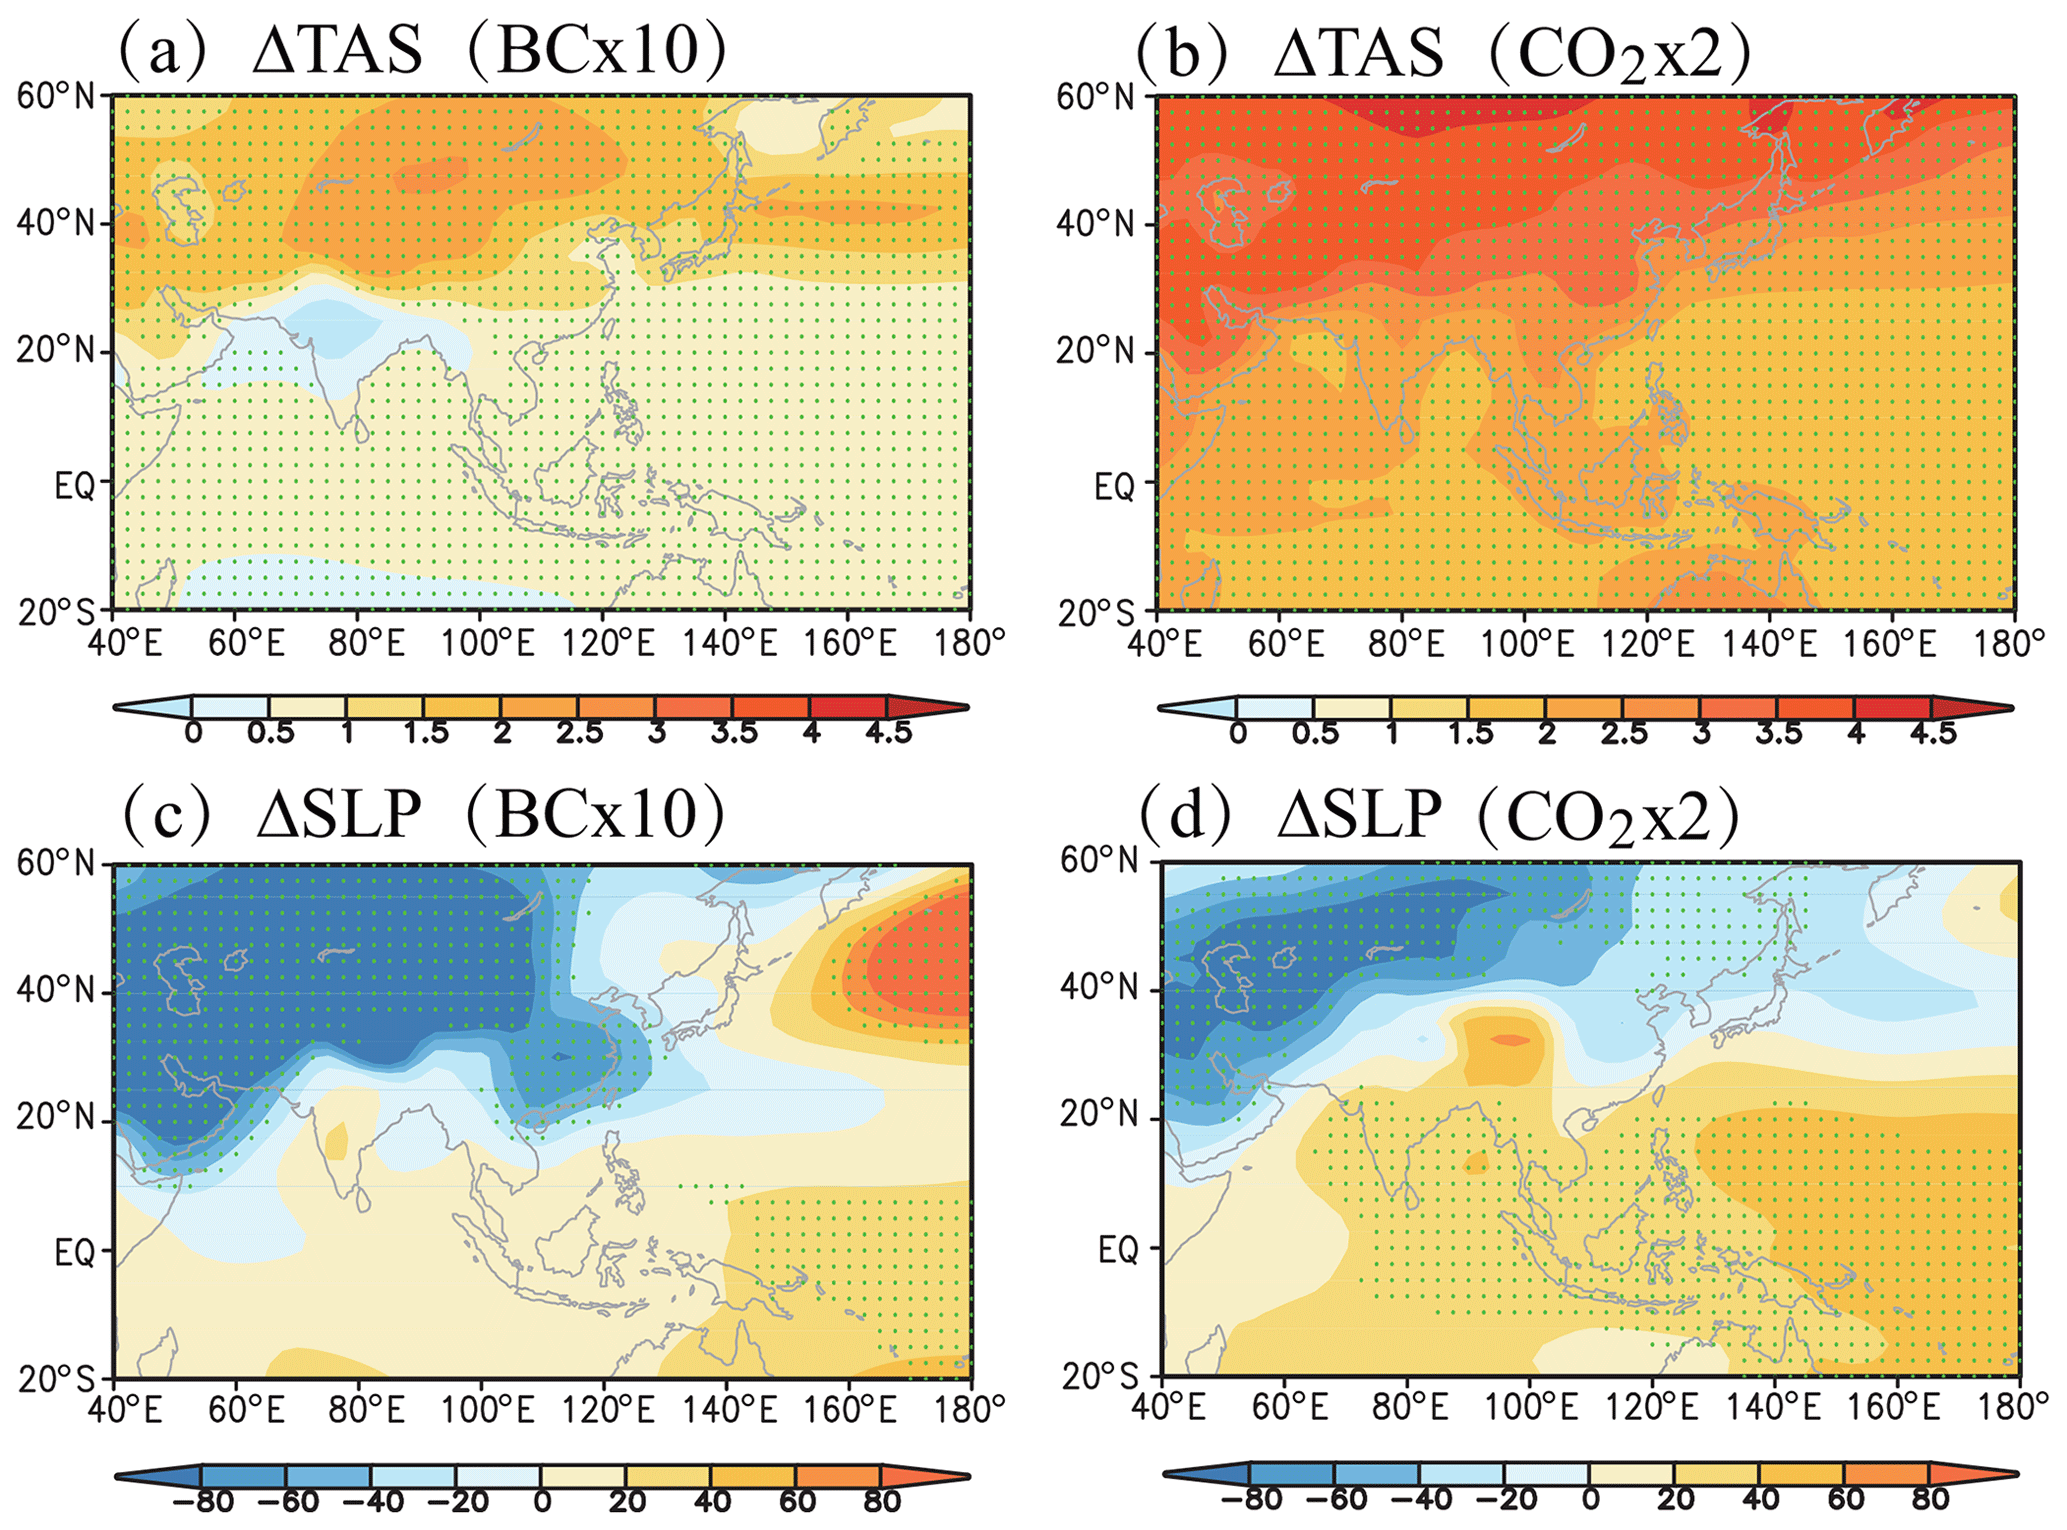
Figure 9Changes in (a, b) multimodel mean (MMM) of the MJJAS surface atmospheric temperature (ΔTAS; unit: ∘C) and (c, d) sea level pressure (ΔSLP; unit: hPa) under increasing BC and GHGs. Dotted regions indicate where the MMM is more than 1 standard deviation away from 0.
In order to compare with the low-level thermal feedbacks, Fig. 10 shows the BC- and GHG-induced upper-level changes in MMM of MJJAS atmospheric temperature (Fig. 10a, b) and geopotential height at 200 hPa (Fig. 10c, d). Figure 10a shows that BC induces the significant increase in the atmospheric temperature at 200 hPa over land and ocean. However, the upper-level atmospheric temperature increases are much larger over the Asian continent (especially over midlatitude regions) compared to the tropics. The change in upper-level atmospheric temperature leads to a significant increase in 200 hPa geopotential height, especially at middle latitudes over the Asian continent (Fig. 10c). The significant increases in upper-level temperature and geopotential height over the Asian continent result in the increase in the upper-level meridional land–ocean thermal gradient (MLOTG), which makes the northward movement of the upper-level subtropical westerly jet (Fig. 6e) and enhances the low-level ASM circulation (Fig. 6a and c). GHGs indicate a more significant increase in 200 hPa atmospheric temperature over the tropics in Fig. 10b, resulting in a much larger increase in 200 hPa geopotential height in Fig. 10d. This spatial pattern of changes in atmospheric temperature and geopotential height at 200 hPa induced by GHGs decreases the upper-level MLOTG, leading to insignificant changes in the low-level ASM circulation and the upper-level westerlies (Fig. 6b, d and f). Pronounced warming in the tropical upper troposphere has been found from observational evidence (Fu et al., 2004; Santer et al., 2005) and GCMs (Solomon et al., 2007) with global warming, leading to decreases in the upper-level MLOTG and the low-level ASM circulation (Ueda et al., 2006; Endo et al., 2014). These changes in the temperature of the tropical upper troposphere and ASM circulation due to GHGs are the same as with our results.
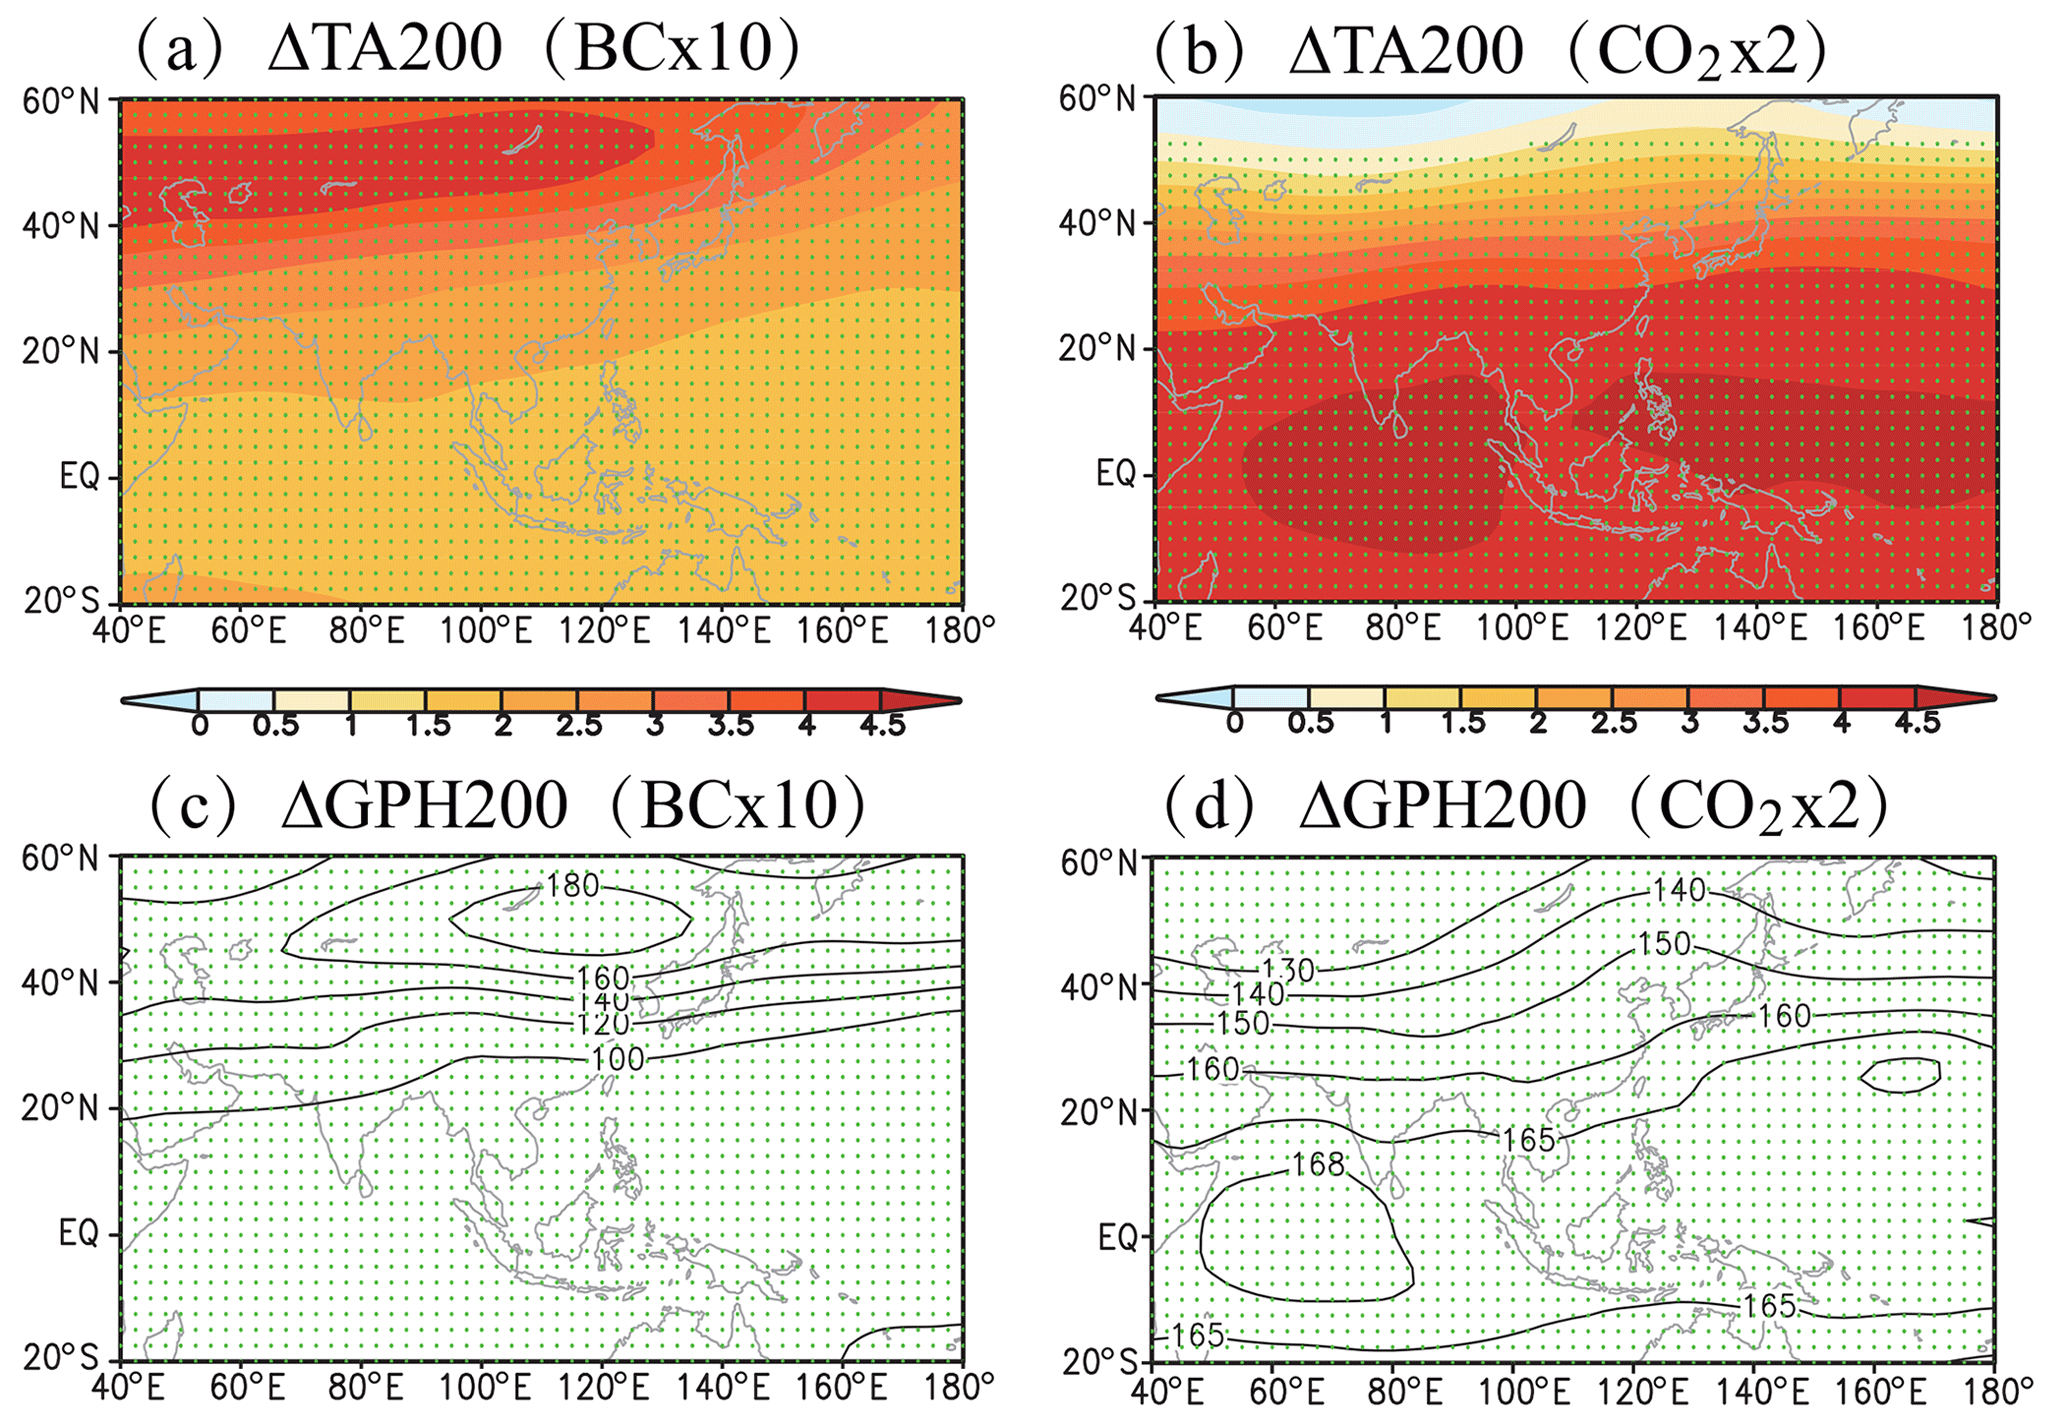
Figure 10Changes in (a, b) multimodel mean (MMM) of the MJJAS 200 hPa atmospheric temperature (ΔTA200; unit: ∘C) and (c, d) 200 hPa geopotential height (ΔGPH200; unit: gpm) under increasing BC and GHGs. Dotted regions indicate where the MMM is more than 1 standard deviation away from 0.
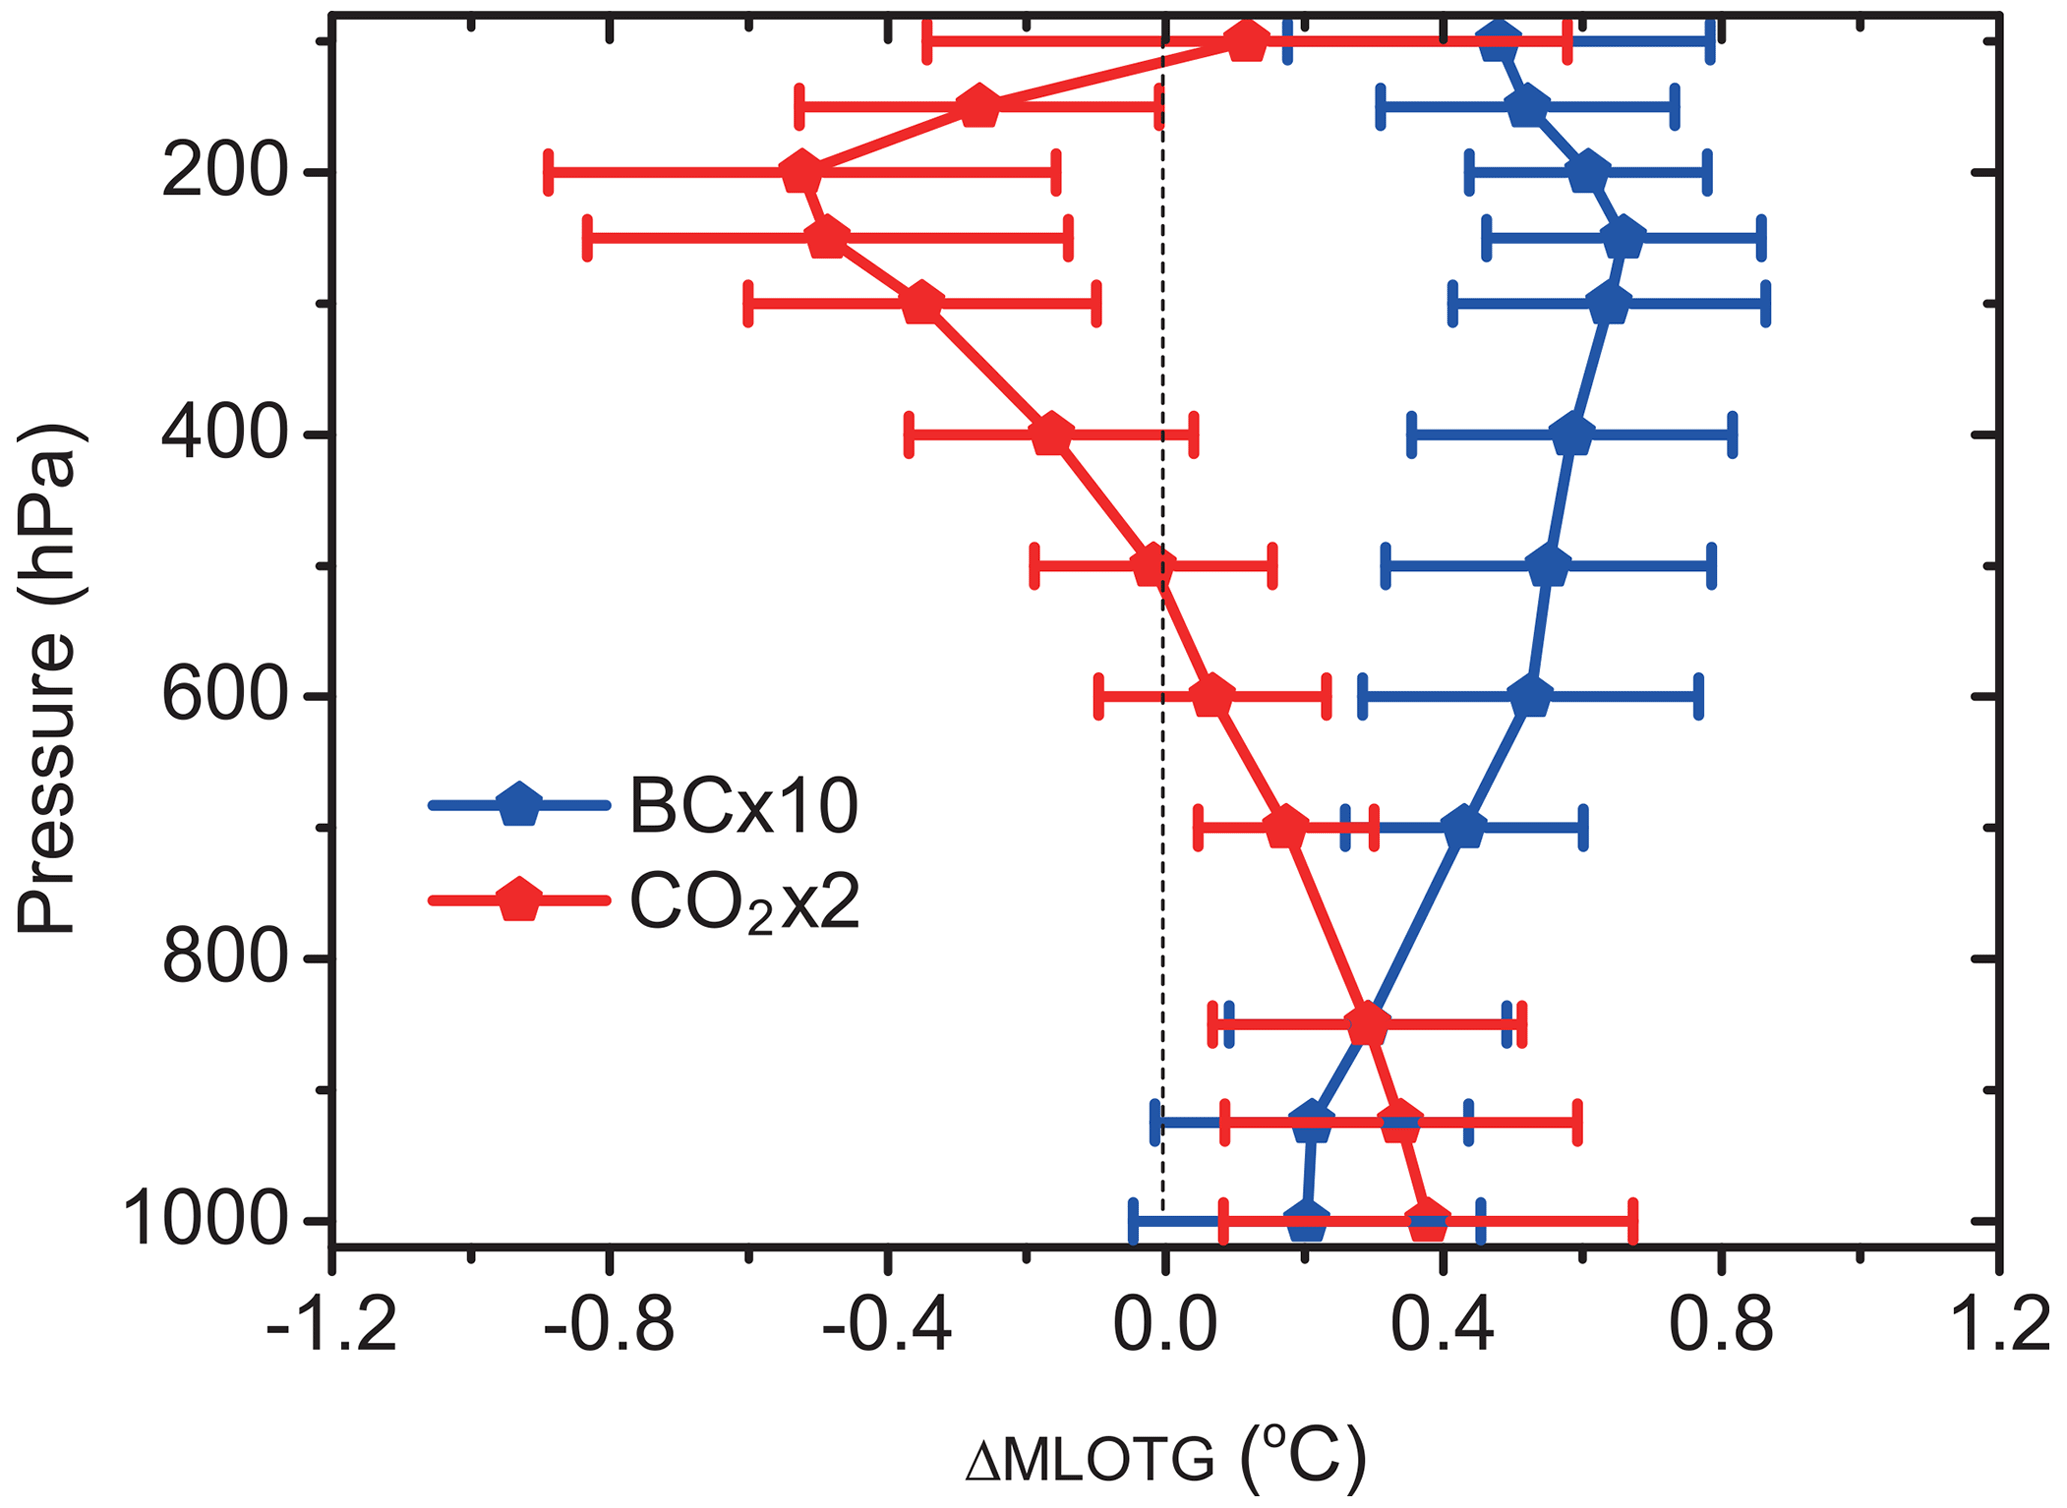
Figure 11Changes in multimodel mean (MMM) of the MJJAS meridional land–ocean thermal gradient (ΔMLOTG; unit: ∘C) under increasing BC and GHGs. The MLOTG is defined as the difference between the Asian region (10–42.5∘ N, 60–125∘ E) and ocean (−10–10∘ N, 60–125∘ E). Error bars of the MMM indicate the standard deviation.
Additionally, we also show the vertical profile of BC- and GHG-induced changes in MMM of MJJAS MLOTG in Fig. 11. MLOTG is defined as the difference between the Asian region (10–42.5∘ N, 60–125∘ E) and low latitudes of ocean (−10–10∘ N, 60–125∘ E). The MLOTG values have insignificant changes due to BC forcing at the low levels and notable increases with height and have a maximum at 200 to 300 hPa. The significant upper-level MLOTG increase due to BC forcing determines changes in the upper-level and low-level large-scale circulation over the Asian monsoon region. However, the GHG-induced MLOTG increase is evident at the low levels, whereas it decreases with height and has a minimum with negative values at 200 hPa. The decrease in upper-level MLOTG induced by GHG forcing suppresses the large-scale ASM circulation. Therefore, these changes in the vertical profile of MLOTG due to BC and GHGs are absolutely consistent with the above results at the surface and upper level as shown in Figs. 9 and 10.
The PDRMIP project also conducted the global sulfate perturbation experiments (hereafter referred to SO4×5) and the Asian aerosol perturbation experiments, including BC×10ASIA and SO4×10ASIA (Myhre et al., 2017; Liu et al., 2018). Figure 12 shows the domain-averaged value and spatial distribution of changes in the summer P−E over the Asian monsoon region due to increasing Asian BC (Fig. 12a, d), global SO4 (Fig. 12b, e) and Asian SO4 (Fig.12 c, f). Figure 12a and d show that the Asian BC significantly increases ASM P−E MMM by 0.18±0.13 mm d−1, with a large range from 0.06 (IPSL-CM5A) to 0.37 mm d−1 (NCAR-CESM1-CAM5). The moisture budget analysis shows that the dynamic term dominates the increase in ASM P−E for increasing Asian BC, whereas the thermodynamic term almost has nothing to contribute to the increase in Fig. S3a, b and c. The Asian BC significantly enhances the low-level monsoon circulation (Fig. S3d and e) and makes a northward shift of upper-level subtropical westerly jet (Fig. S3f). Hence, the trends in the ASM P−E and low-level and upper-level circulations due to the increasing Asian BC are very similar to the response from global BC in Figs. 4 and 6. Note that the increase in ASM P−E due to the Asian BC is much lower than that from the global BC (0.37±0.28 mm d−1). That is mainly because the thermodynamic term has no insignificant increases induced by Asian BC due to smaller increases in atmospheric water vapor (Fig. S3g) compared to that of global BC (Fig. 7a). Additionally, the increasing global (Fig. 12b and e) and Asian SO4 (Fig. 12c and f) both significantly reduce the ASM P−E MMM by and mm d−1, which have the opposite sign as BC and GHGs (Fig. 4). The increasing SO4 yields a significant negative ERF over the Asian region (Fig. S4b and c), which is reverse to that of BC (Figs. 8a and S4a). The negative ERF due to SO4 remarkably decreases the surface temperature over the Asian region, which results in a reduction in the land–sea thermal gradient and thus reduces the Asian summer monsoonal circulations and the associated precipitation (Liu et al., 2011; Xie et al., 2016). The decrease in MMM of the ASM P−E due to the increasing Asian SO4 is larger than that of the global SO4, which is mainly because PDRMIP runs the Asian sulfate perturbation experiment with 10 times the modern SO4 over Asia and the global sulfate perturbation experiment only with 5 times the modern global SO4.
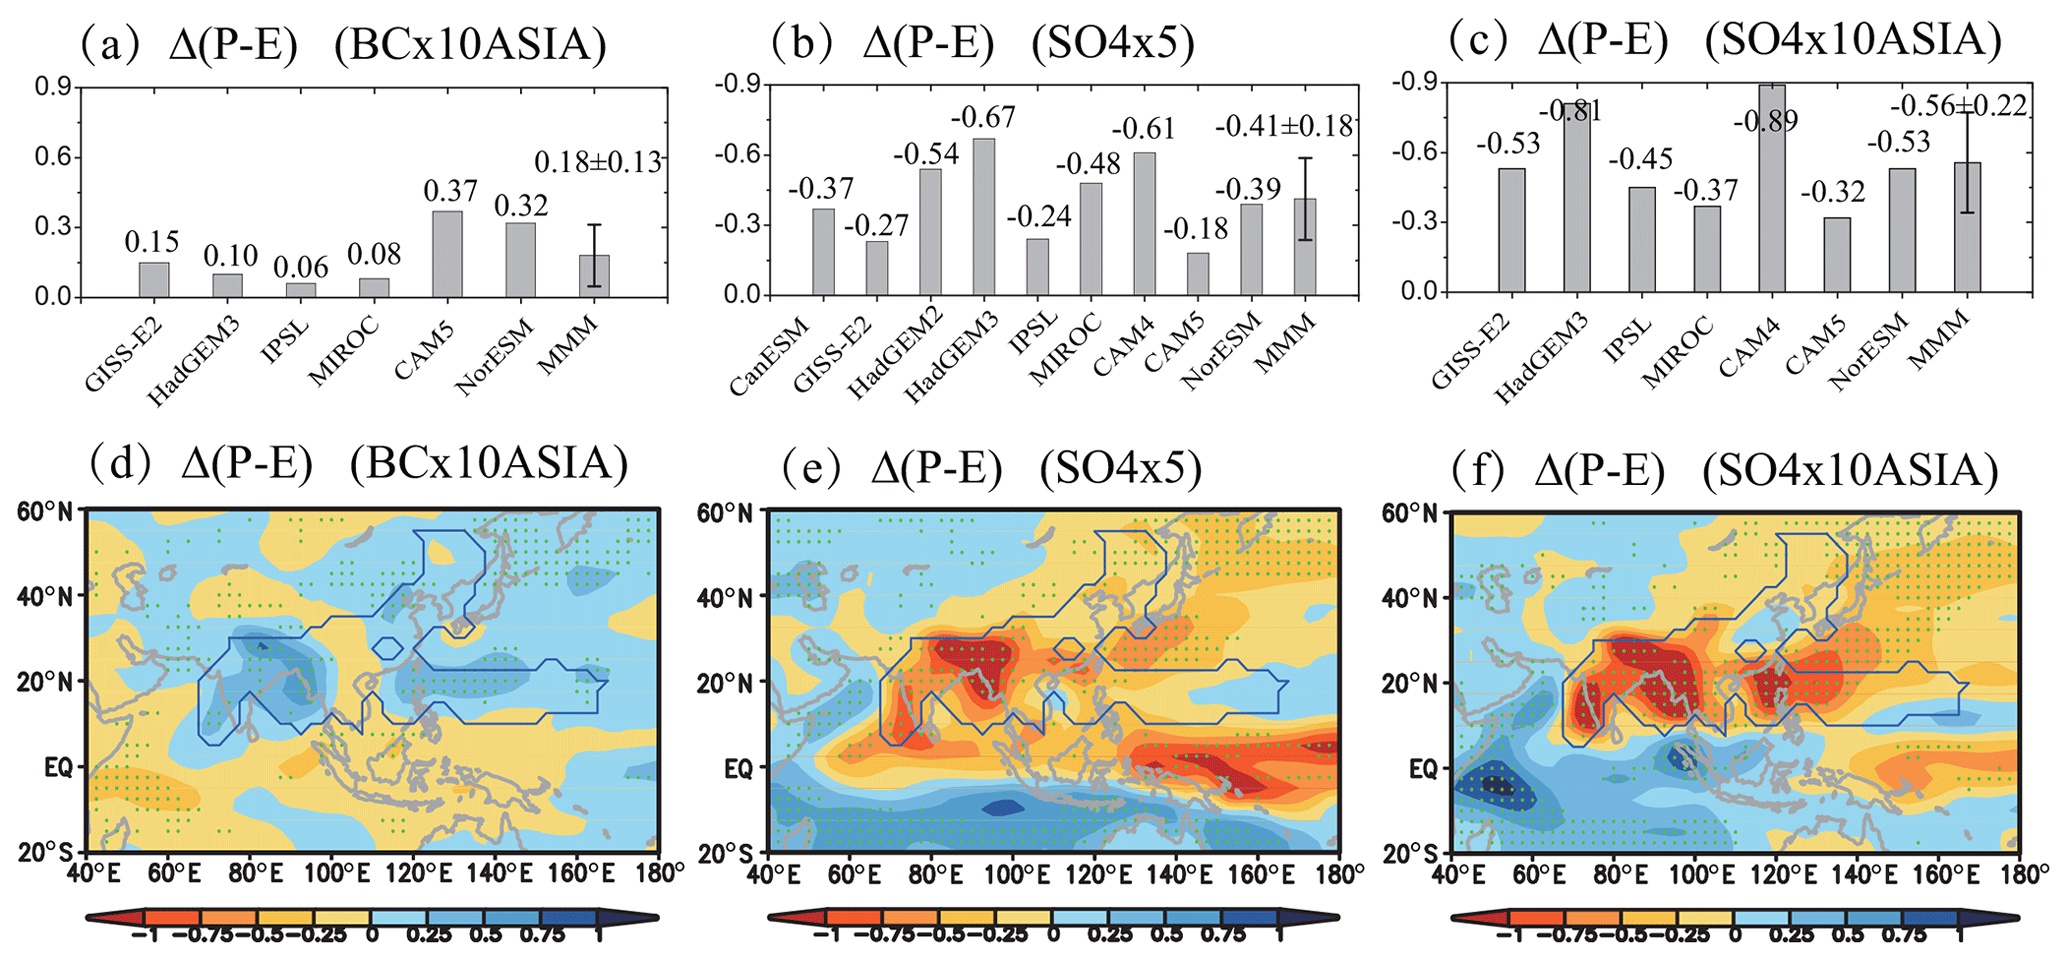
Figure 12Changes in the MJJAS precipitation minus evaporation (Δ(P−E); unit: mm d−1) under (a, d) increasing Asian BC, (b, e) global SO4 and (c, f) Asian SO4. (a, b, c) Domain-averaged value over the Asian monsoon region and (d, e, f) spatial pattern of the multimodel mean (MMM). Error bars (a, b, c) of the MMM represent the standard deviation. Dotted regions (d, e, f) indicate where the MMM is more than 1 standard deviation away from 0. The areas within the blue line represent the Asian monsoon region.
Relative to GHGs shown in Fig. 4b, the modeled BC-induced change in MJJAS P−E has a much larger uncertainty over the Asian monsoon region for the individual GCMs (Figs. 4a and 12a), more likely due to intermodel differences in the regional ERF. Figure 13 shows the global and Asian BC-induced MJJAS domain-averaged ERF over the Asian region for individual models and the MMM and regression of the domain-averaged change in ASM P−E versus ERF, also including that of the global and Asian SO4. Figure 13a shows that the MMM of ERF over the Asian region is 5.00±1.71 and 4.75±2.31 W m−2 for the global and Asian BC and and W m−2 for the global and Asian SO4, respectively. Further analysis in Fig. 13b illustrates that there exists a significant positive correlation between ASM P−E change and the regional ERF for global (R2=0.83) and regional aerosols, including BC and SO4 (R2=0.90), respectively. This positive correlation indicates that the aerosol-induced ERF over the Asian region mainly dominates the ASM P−E changes for the individual GCMs, where larger positive (negative) ERF increases (decreases) the ASM P−E more substantially. The corresponding main reason is that larger positive ERF due to BC over the Asian region more significantly heats the regional atmosphere and increases land–ocean thermal gradient, leading to the ASM circulation enhancement and the monsoonal P−E increase, and larger negative ERF induced by SO4 has reverse results. Note that the slope of the regression line for global aerosols is larger (0.058 mm d−1 per W m−2) than that of regional aerosols (0.042 mm d−1 per W m−2), mainly because the thermodynamic term compensates the ASM P−E changes for the increasing global aerosols. Additionally, we also check the relationship between the ASM P−E and the regional ERF over Asia (or the global ERF) for GHGs, indicating that there are no positive correlations between them (not shown). In general, accurate descriptions of physical and radiative processes associated with BC climate forcing will reduce the uncertainty of BC-induced ERF and ASM precipitation changes (Bond et al., 2013).
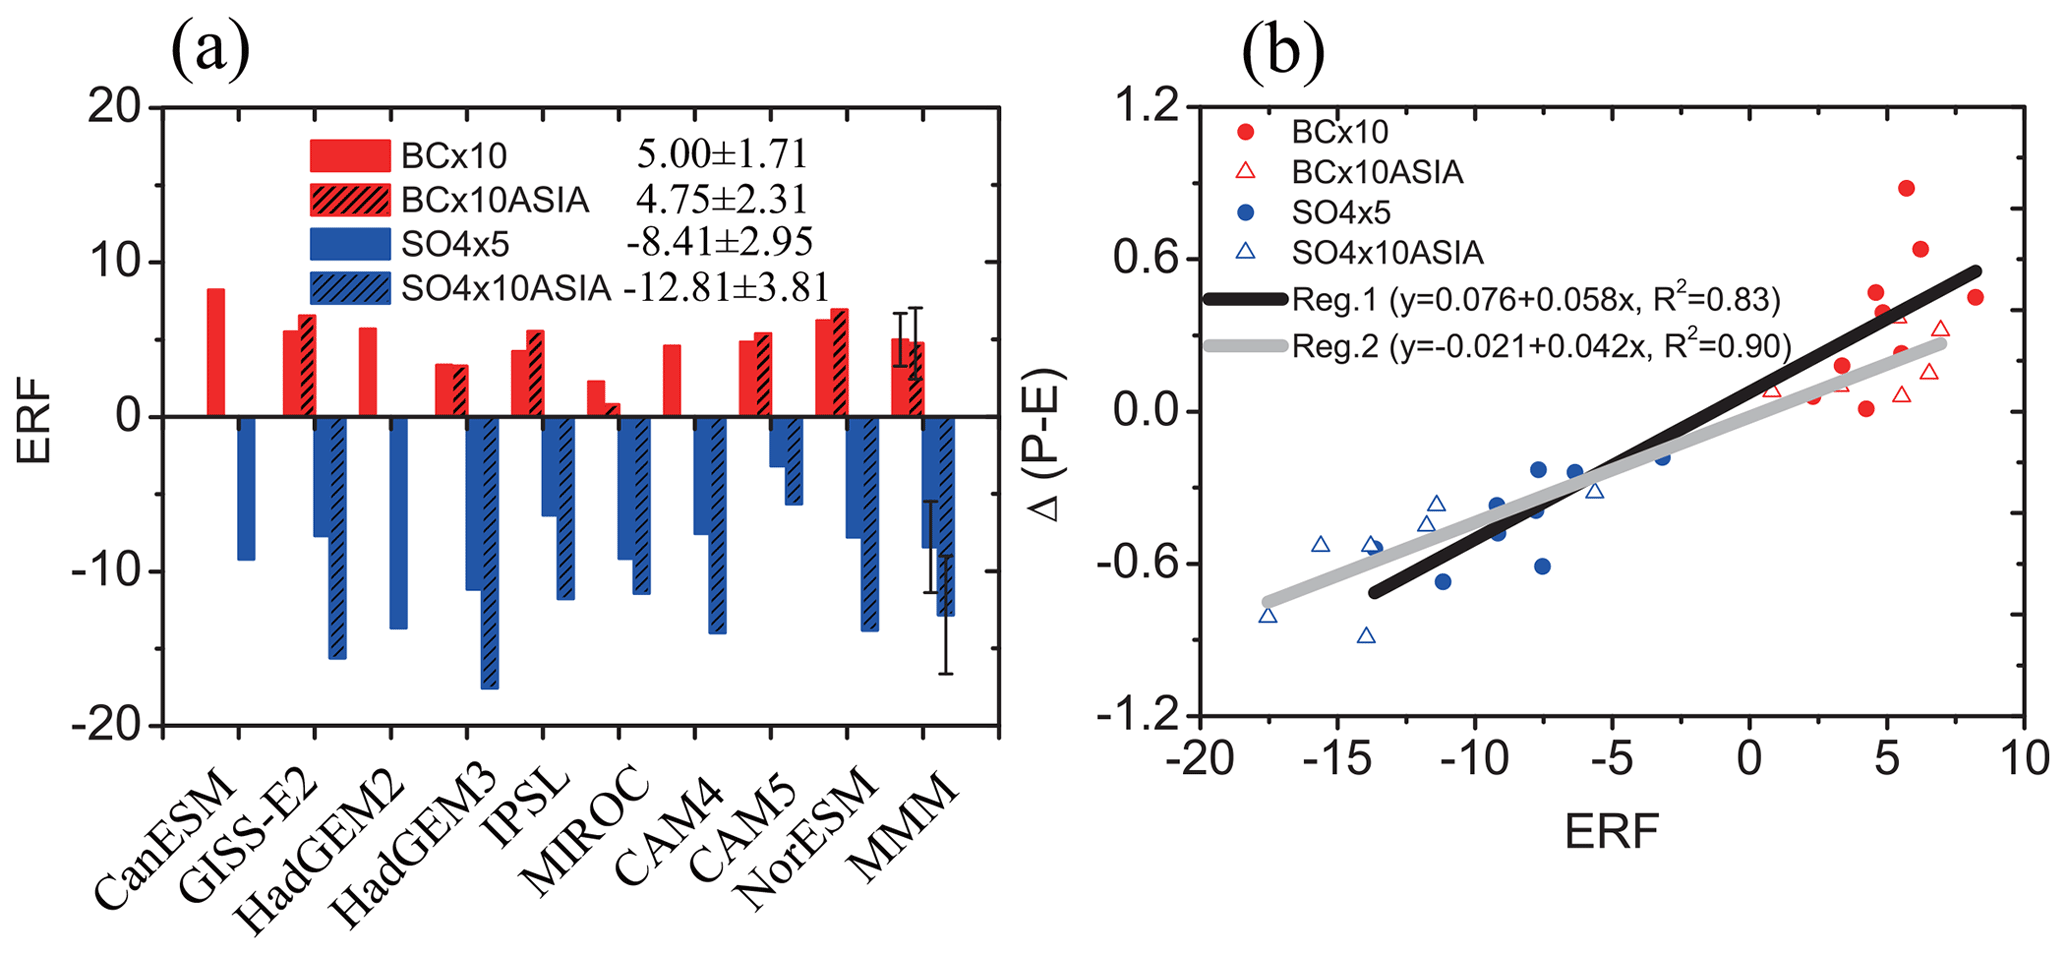
Figure 13(a) MJJAS domain-averaged effective radiative forcing over the Asian region with 10–42.5∘ N and 60–125∘ E (ERF; unit: W m−2) under increasing global (BC×10 and SO4×5) and Asian aerosols (BC×10ASIA and SO4×10ASIA), where error bars of multimodel mean (MMM) represent the standard deviation. (b) Regression of the domain-averaged change in MJJAS precipitation minus evaporation over the Asian monsoon region (Δ(P−E); unit: mm d−1) versus the regional ERF for global aerosols (Reg.1) and for Asian aerosols (Reg.2).
Menon et al. (2002) reported that BC forcing can induce the SFND pattern over eastern China from GCMs, while other GCM simulations do not support this spatial pattern of summer precipitation changes (e.g., Lee et al., 2007; Zhang et al., 2009; Wang et al., 2017). In Fig. 14, we also show the spatial distribution of MMM MJJAS precipitation changes due to the global (BC×10) and regional BC (BC×10ASIA), which indicates a similar spatial pattern for these two forcings. The results of the MMM show a tripole pattern of precipitation changes over eastern China: increase over northern China, southern China and the adjacent ocean and a decrease over the middle and lower reaches of the Yangtze River. This tripole pattern of precipitation changes over eastern China is mainly caused by the enhancement of the low-level ASM circulation and the northward movement of the upper-level westerly jet. Similar patterns have been shown to take place in modern climate and paleoclimate based on observations and models (Chiang et al., 2015, 2017; Kong et al., 2017).

Figure 14Changes in multimodel mean (MMM) of the MJJAS precipitation (ΔP; unit: mm d−1) under (a) increasing global (BC×10) and (b) Asian BC (BC×10ASIA). Dotted regions indicate where the MMM is more than 1 standard deviation away from zero.
Additionally, Fig. S1 shows the changes induced by BC forcing in the MJJAS surface atmospheric temperature at 2 m for the individual models. BC forcing produces an increase or a decrease in the surface temperature based on the nine GCMs over both the Indian subcontinent and eastern China. The GCMs of MIROC-SPRINTARS, NCAR-CESM1-CAM4, NCAR-CESM1-CAM5 and NorESM1 indicate a significant decrease in surface temperature over the Indian subcontinent, whereas other GCMs show an insignificant reduction or increase in the surface temperature. The GISS-E2, HadGEM2 and MIROC-SPRINTARS show a reduction in the surface temperature over eastern China, and other GCMs show an increase in surface temperature, including CanESM2, HadGEM3, IPSL-CM5A, NCAR-CESM1-CAM4, NCAR-CESM1-CAM5 and NorESM1. Hence, the sign of changes in surface temperature due to BC forcing is strongly dependent on different GCMs over South Asia and East Asia, which is absolutely consistent with previous investigations (Menon et al., 2002; Ramanathan and Carmichael, 2008; Boucher et al., 2013; Bond et al., 2013). It indicates the complexity of low-level temperature feedbacks due to BC over these two regions, which can lead to distinct responses of the ASM (Bond et al., 2013; Wu et al., 2015; Li et al., 2016). However, under this extremely high BC level, it shows a more significant and larger increase in the high-level atmospheric temperature over the Asian continent compared to the surrounding ocean, which is true for all the nine models (Fig. S2). These upper-level thermal feedbacks due to BC forcing result in a northward shift of upper-level subtropical westerly jet and an enhancement of low-level monsoon circulations in the individual GCMs (not shown), which is very similar to the MMM results as shown in Fig. 6. Hence, under even more extremely high BC levels, the ASM changes induced by BC forcing would be more consistent between the individual GCMs due to pronounced high-level heating of BC over the Asian continent.
This study examines the response of the ASM due to BC forcing under the extremely high BC level (BC×10) from the nine GCMs based on the PDRMIP project compared to GHGs with CO2×2. Our analyses show that BC and GHGs enhance the ASM P−E by 0.37±0.28 mm d−1 (13.6 %) and 0.29±0.13 mm d−1 (12.1 %) from the nine-model ensemble, respectively. These results show that there exists a larger uncertainty in changes in ASM P−E induced by BC than by GHGs. The summer P−E values are all increased, with a range between 7.7 % and 15.3 %, induced by these two forcings over the three subregions, including East Asian, South Asian and western North Pacific monsoon regions. It shows that distinct mechanisms determine the changes in ASM P−E induced by BC and GHGs. The change in P−E by BC is dominated by the dynamic effect due to the enhanced large-scale monsoon circulation, whereas the thermodynamic effect mainly determines the change by GHGs through the increased atmospheric water vapor. BC forcing significantly increases the upper-level temperature over the Asian region to enhance the upper-level MLOTG, leading to a northward shift of upper-level subtropical westerly jet and an enhancement of low-level monsoon circulations, whereas radiative forcing of GHGs significantly increases the upper-level temperature over the low-latitude ocean, which reduces the upper-level MLOTG and suppresses the ASM circulation. Hence, our results reveal a new mechanism of BC climate effects: under the extremely high BC level, BC forcing significantly heats the upper-level atmosphere and thus increases the upper-level temperature over the Asian region, which determines changes in the upper-level westerlies and the ASM circulation and associated precipitation. Additionally, further analysis shows that there exists a significant positive correlation between ASM P−E change and aerosol-induced ERF from the individual models, indicating that the aerosol-induced ERF mainly dominates the changes in ASM P−E. Therefore, accurate descriptions of the associated physical and radiative processes of BC climate forcing will reduce the uncertainty of BC-induced ERF and ASM changes (Bond et al., 2013).
Two points are noteworthy. First, the impact of snow darkening by deposition of BC and dust aerosols on snow cover over the Tibetan Plateau (TP) indicates a significant positive radiative forcing and regional surface warming (Flanner et al., 2007; Qian et al., 2015), which then will enhance TP thermal effects and affect the ASM circulation and precipitation (Qian et al., 2011, 2015; Xie et al., 2018a, b; Shi et al., 2019). In the PDRMIP project, there are two types of GCMs, including the emission-driven models (CanESM2, HadGEM2, MIROC-SPRINTARS and NCAR-CESM1-CAM5) and the concentration-driven models (GISS-E2, HadGEM3-GA4 IPSL-CM5A, NCAR-CESM1-CAM4 and NorESM1) in the experiments of BC×10 (Samset et al., 2016; Myhre et al., 2007; Stjern et al., 2017). However, we cannot isolate the effects of BC-induced snow darkening over the TP on the ASM from the total effects under this extreme BC level based on both the concentration-driven and emission-driven models. Hence, additional experiments considering BC direct and snow-darkening effects separately are needed to solve this problem in the future. Second, BC can serve as ice nuclei (INs) and thus significantly affects the global and regional climate via the interactions of BC with snow and ice, although it accounts for a relatively small percentage of aerosol mass in the atmosphere. However, there exists a larger uncertainty in the aerosol indirect effect associated with aerosol–cloud interactions (Bond et al., 2013). It is essential to accurately parameterize these aerosol–cloud processes in GCMs for further assessment of the BC climate effects, although some GCMs (MIROC-SPRINTARS, NCAR-CESM-CAM5 and NorESM1) in PDRMIP include effects of BC on snow and ice (Stjern et al., 2017).
All the data about the PDRMIP project used for our paper can be derived from the Norwegian NORSTORE data storage facility for the public at http://www.cicero.uio.no/en/PDRMIP/PDRMIP-data-access (last access: 16 June 2019; Myhre et al., 2017).
The supplement related to this article is available online at: https://doi.org/10.5194/acp-20-11823-2020-supplement.
The authors declare that they have no conflict of interest.
The authors would like to thank the editor, Jianzhong Ma, and the two anonymous reviewers for their constructive suggestions to improve the paper.
This research has been supported by the National Natural Science Foundation of China (grant no. 41991254), the Strategic Priority Research Program of the Chinese Academy of Sciences (grant nos. XDB40030100 and XDA20070103), the National Key Research and Development Program of China (grant no. 2016YFA0601904), and the CAS “Light of West China” program (grant no. XAB2019A02). Alf Kirkevåg was supported by the Research Council of Norway (grant nos. 229771, 285003 and 285013) and the Notur/NorStore (grant nos. NN2345K and NS2345K). Yangang Liu was supported by the US Department of Energy’s Atmospheric System Research (ASR) program.
This paper was edited by Jianzhong Ma and reviewed by two anonymous referees.
Bond, T. C., Doherty, S. J., Fahey, D., Forster, P., Berntsen, T., DeAngelo, B., Flanner, M., Ghan, S., Kächer, B., Koch, D., Kinne, S., Kondo, Y., Quinn, P. K., Sarofim, M. C., Schultz, M. G., Schulz, M., Venkataraman, C., Zhang, H., Zhang, S., Bellouin, N., Guttikunda, S. K., Hopke, P. K., Jacobson, M. Z., Kaiser, J. W., Klimont, Z., Lohmann, U., Schwarz, J. P., Shindell, D., Storelvmo, T., Warren, S. G., and Zender, C. S.: Bounding the role of black carbon in the climate system: A scientific assessment, J. Geophys. Res.-Atmos., 118, 5380–552, 2013.
Boucher, O., Randall, D., Artaxo, P., Bretherton, C., Feingold, G., Forster, P., Kerminen, V.-M., Kondo, Y., Liao, H., Lohmann, U., Rasch, P., Satheesh, S. K., Sherwood, S., Stevens, B., and Zhang, X. Y.: Clouds and aerosols, in: Climate change 2013: the physical science basis, Contribution of Working Group I to the Fifth Assessment Report of the Intergovernmental Panel on Climate Change, edited by: Stoker, T. F., Qin, D., Plattner, G.-K., Tignor, M., Allen, S. K., Boschung, J., Nauels, A., Xia, Y., Bex, V., and Midgley, P. M., Cambridge University Press, Cambridge, UK, and New York, USA, 571–657, https://doi.org/10.1017/CBO9781107415324.016, 2013.
Chiang, J. C. H., Fung, I. Y., Wu, C. H., Cai, Y. H., Edman, J. P., Liu, Y. W., Day, J. A., Bhattacharya, T., Mondal, Y., and Labrousse, C. A.: Role of seasonal transitions and westerly jets in East Asian paleoclimate, Quaternary Sci. Rev., 108, 111–129, https://doi.org/10.1016/j.quascirev.2014.11.009, 2015.
Chiang, J. C. H., Swenson, L. M., and Kong, W.: Role of seasonal transitions and the westerlies in the interannual variability of the East Asian summer monsoon precipitation, Geophys. Res. Lett., 44, 3788–3795, https://doi.org/10.1002/2017GL072739, 2017.
Chung, C. and Ramanathan, V.: Weakening of N. Indian SST gradients and the monsoon rainfall in India and the Sahel, J. Climate, 19, 2036–2045, 2006.
Endo, H. and Kitoh, A.: Thermodynamic and dynamic effects on regional monsoon rainfall changes in a warmer climate, Geophys. Res. Lett., 41, 1704–1710, https://doi.org/10.1002/2013GL059158, 2014.
Fan, T., Liu, X., Ma, P.-L., Zhang, Q., Li, Z., Jiang, Y., Zhang, F., Zhao, C., Yang, X., Wu, F., and Wang, Y.: Emission or atmospheric processes? An attempt to attribute the source of large bias of aerosols in eastern China simulated by global climate models, Atmos. Chem. Phys., 18, 1395–1417, https://doi.org/10.5194/acp-18-1395-2018, 2018.
Flanner, M. G., Zender, C. S., Randerson, J. T., and Rasch, P. J.: Present day climate forcing and response from black carbon in snow, J. Geophys. Res., 112, D11202, https://doi.org/10.1029/2006JD008003, 2007.
Forster, P., Ramaswamy, V., Artaxo, P., Berntsen, T., Betts, R., Fahey, D. W., Haywood, J., Lean, J., Lowe, D. C., Myhre, G., Nganga, J., Prinn, R., Raga, G., Schulz, M., and Van Dorland, R.: Changes in Atmospheric Constituents and in Radiative Forcing, in: Climate Change 2007: The Physical Science Basis. Contribution of Working Group I to the Fourth Assessment Report of the Intergovernmental Panel on Climate Change, edited by: Solomon, S., Qin, D., Manning, M., Chen, Z., Marquis, M., Averyt, K. B., Tignor, M., and Miller, H. L., Cambridge University Press, Cambridge, UK, and New York, NY, USA, 129–234, 2007.
Forster, P. M., Richardson, T., Maycock, A. C., Smith, C. J., Samset, B. H., Myhre, G., Andrews, T., Pincus, R., and Schulz, M.: Recommendations for diagnosing effective radiative forcing from climate models for CMIP6, J. Geophys. Res.-Atmos., 121, 12460–12475, https://doi.org/10.1002/2016JD025320, 2016.
Fu, Q., Johanson, C. M., Warren, S. G., and Seidel, D. J.: Contribution of stratospheric cooling to satellite-inferred tropospheric temperature trends, Nature, 429, 55–58, https://doi.org/10.1038/nature02524, 2004.
Gregory, J. M., Ingram, W. J., Palmer, M. A., Jones, G. S., Stott, P. A., Thorpe, R. B., Lowe, J. A., Johns, T. C., and Williams, K. D.: A new method for diagnosing radiative forcing and climate sensitivity, Geophys. Res. Lett., 31, L03205, https://doi.org/10.1029/2003GL018747, 2004.
Hansen, J. E., Sato, M., Ruedy, R., Lacis, A., and Oinas, V.: Global warming in the twenty-first century: An alternative scenario, P. Natl. Acad. Sci. USA, 97(18), 9875–9880, 2000.
Jacobson, M. Z.: Strong radiative heating due to the mixing state of black carbon in atmospheric aerosols, Nature, 409, 695–697, 2001.
Kanamitsu, M., Ebisuzaki, W., Woollen, J., Yang, S. K., Hnilo, J. J., Fiorino, M., and Potter, G. L.: NCEP-DOE AMIP-II reanalysis (R-2), B. Am. Meteorol. Soc., 83, 1631–1643, 2002.
Kong, W., Swenson, L., and Chiang, J.: Seasonal transitions and the westerly jet in the Holocene East Asian summer monsoon, J. Climate, 30, 3343–3365, https://doi.org/10.1175/JCLI-D-16-0087.1, 2017.
Lambert, F. H. and Chiang, J. C. H.: Control of land-ocean temperature contrast by ocean heat uptake, Geophys. Res. Lett., 34, L13704, https://doi.org/10.1029/2007GL029755, 2007.
Lambert, F. H., Webb, M. J., and Joshi, M.: The relationship between land-ocean surface temperature contrast and radiative forcing, J. Climate, 24(13), 3239–3256, https://doi.org/10.1175/2011JCLI3893.1, 2011.
Lau, K. M., Kim, M. K., and Kim, K. M.:. Asian monsoon anomalies induced by aerosol direct forcing: the role of the Tibetan Plateau, Clim. Dynam., 26, 855–664, 2006.
Lau, K. M. and Kim, K. M.: Does aerosol strengthen or weaken the Asianmonsoon? in Mountains: Witnesses of Global Change, edited by: Baudo, R., Tartari, G., and Vuillermoz, E., Elsevier, Amsterdam, the Netherlands, 2007.
Lee, K. H., Li, Z., Wong, M. S., Xin, J., Wang, Y., Hao, W.-M., and Zhao, F.: Aerosol single scattering albedo estimated across China from a combination of ground and satellite measurements, J. Geophys. Res., 112, D22S15, https://doi.org/10.1029/2007JD009077, 2007.
Li, J., Yu, R., Yuan, W., Chen, H., Sun, W., and Zhang, Y.: Precipitation over East Asia simulated by NCAR CAM5 at different horizontal resolutions, J. Adv. Model. Earth Sy., 7, 774–790, https://doi.org/10.1002/2014MS000414, 2015.
Li, Z., Lau, W. K., Ramanathan, V., Wu, G., Ding, Y., Manoj, M. G., Liu, J., Qian, Y., Li, J., Zhou, T., Fan, J., Rosenfeld, D., Ming, Y., Wang, Y., Huang, J., Wang, B., Xu, X., Lee, S. S., Cribb, M., Zhang, F., Yang, X., Takemura, T., Wang, K., Xia, X., Yin, Y., Zhang, H., Guo, J., Zhai, P. M., Sugimoto, N., Babu, S. S., and Brasseur, G. P.: Aerosol and Monsoon Climate Interactions over Asia, Rev. Geophys., 54, 866–929, https://doi.org/10.1002/2015rg000500, 2016.
Liu, L., Shawki, D., Voulgarakis, A., Kasoar, M., Samset, B. H., Myhre, G., Forster, P. M., Hodnebrog, Ø, Sillmann, J., Aalbergsjø, S. G., Boucher, O., Faluvegi, G., Iversen, T., Kirkevåg, A., Lamarque, J., Olivié, D., Richardson, T., Shindell, D., and Takemura, T.: A PDRMIP Multimodel Study on the Impacts of Regional Aerosol Forcings on Global and Regional Precipitation, J. Climate, 31, 4429–4447, https://doi.org/10.1175/JCLI-D-17-0439.1, 2018.
Liu, X. D., Xie, X. N., Yin, Z.-Y., Liu, C. H., and Gettelman, A.: A modeling study of the effects of aerosols on clouds and precipitation over East Asia, Theor. Appl. Climatol., 106, 343–354, https://doi.org/10.1007/s00704-011-0436-6, 2011.
Mahajan, S., Evans, K. J., Hack, J. J., and Truesdale, J. E.: Linearity of climate response to increases in black carbon aerosols, J. Climate, 26(20), 8223–8237, https://doi.org/10.1175/jcli-d-12-00715.1, 2013.
Menon, S., Hansen, J., Nazarenko, L., and Luo, Y.: Climate effects of black carbon aerosols in China and India, Science, 297, 2250–2253, 2002.
Meehl, G. A., Arblaster, J. M., and Collins, W. D.: Effects of black carbon aerosols on the Indian monsoon, J. Climate, 21, 2869–2882, https://doi.org/10.1175/2007JCLI1777.1, 2008.
Myhre, G., Shindell, D., Bron, F.-M., Collins, W., Fuglestvedt, J., Huang, J., Koch, D., Lamarque, J.-F., Lee, D., Mendoza, B., Nakajima, T., Robock, A., Stephens, G., Takemura, T., and Zhang, H.: Anthropogenic and natural radiative forcing, in: Climate change 2013: The Physical Science Basis, Contribution of Working Group I to the Fifth Assessment Report of the Intergovernmental Panel on Climate Change, edited by: Stoker, T. F., Qin, D., Plattner, G.-K., Tignor, M., Allen, S. K., Boschung, J., Nauels, A., Xia, Y., Bex, V., and Midgley, P. M., Cambridge University Press, Cambridge, UK, and New York, USA, 659–740, https://doi.org/10.1017/CBO9781107415324.018, 2013.
Myhre, G., Forster, P., Samset, B., Hodnebrog, Ø, Sillmann, J., Aalbergsjø, S. G., Andrews, T., Boucher, O., Faluvegi, G., and Flächner, D.: PDRMIP: A precipitation driver and response model intercomparison project, protocol and preliminary results, B. Am. Meteorol. Soc., 98, 1185–1198, https://doi.org/10.1175/BAMS-D-16-0019.1, 2017.
Pan, X., Chin, M., Gautam, R., Bian, H., Kim, D., Colarco, P. R., Diehl, T. L., Takemura, T., Pozzoli, L., Tsigaridis, K., Bauer, S., and Bellouin, N.: A multi-model evaluation of aerosols over South Asia: common problems and possible causes, Atmos. Chem. Phys., 15, 5903–5928, https://doi.org/10.5194/acp-15-5903-2015, 2015.
Qian, Y., Flanner, M. G., Leung, L. R., and Wang, W.: Sensitivity studies on the impacts of Tibetan Plateau snowpack pollution on the Asian hydrological cycle and monsoon climate, Atmos. Chem. Phys., 11, 1929–1948, https://doi.org/10.5194/acp-11-1929-2011, 2011.
Qian, Y., Yasunari, T. J., Doherty, S. J., Flanner, M. G., Lau, W. K. M., Jing, M., Wang, H., Wang, M., Warren, S. G., and Zhang, R.: Light-absorbing Particles in Snow and Ice: Measurement and Modeling of Climatic and Hydrological impact, Adv. Atmos. Sci., 32, 64–91, https://doi.org/10.1007/s00376-014-0010-0, 2015.
Ramanathan, V., Chung, C., Kim, D., Bettge, T., Buja, L., Kiehl, J. T., Washington, W. M., Fu, Q., Sikka, D. R., and Wild, M.: Atmospheric brown clouds: Impacts on South Asian climate and hydrological cycle, P. Natl. Acad. Sci. USA, 102, 5326–5333, https://doi.org/10.1073/pnas.0500656102, 2005.
Ramanathan, V. and Carmichael, G.: Global and regional climate changes due to black carbon, Nat. Geosci., 1(4), 221–227, https://doi.org/10.1038/ngeo156, 2008.
Samset, B., Myhre, G., Forster, P., Hodnebrog, Ø, Andrews, T., Faluvegi, G., Flaeschner, D., Kasoar, M., Kharin, V., and Kirkevåg, A.: Fast and slow precipitation responses to individual climate forcers: A PDRMIP multi-model study, Geophys. Res. Lett., 43, 2782–791, https://doi.org/10.1002/2016GL068064, 2016.
Santer, B. D., Wigley, T. M. L., Mears, C.,Wentz, F. J., Klein, S. A., Seidel, D. J., Taylor, K. E., Thorne, P. W., Wehner, M. F., Gleckler, P. J., Boyle, J. S., Collins, W. D., Dixon, K. W., Doutriaux, C., Free, M., Fu, Q., Hansen, J. E., Jones, G. S., Ruedy, R., Karl, T. R., Lanzante, J. R., Meehl, G. A., Ramaswamy, V., Russell, G., and Schmidt, G. A.: Amplification of surface temperature trends and variability in the tropical atmosphere, Science, 309, 1551–1556, https://doi.org/10.1126/science.1114867, 2005.
Seager, R., Naik, N., and Vecchi, G. A.: Thermodynamic and dynamic mechanisms for large-scale changes in the hydrological cycle in response to global warming, J. Climate, 23, 4651–4668, https://doi.org/10.1175/2010jcli3655.1, 2010.
Seager, R. and Naik, N.: A mechanisms-based approach to detecting recent anthropogenic hydroclimate change, J. Climate, 25, 236–261, https://doi.org/10.1175/jcli-d-11-00056.1, 2012.
Shi, Z., Xie, X., Li, X., Yang, L., Xie, X., Lei, J., Sha, Y., and Liu, X.: Snow-darkening versus direct radiative effects of mineral dust aerosol on the Indian summer monsoon onset: role of temperature change over dust sources, Atmos. Chem. Phys., 19, 1605–1622, https://doi.org/10.5194/acp-19-1605-2019, 2019.
Shindell, D. T., Lamarque, J.-F., Schulz, M., Flanner, M., Jiao, C., Chin, M., Young, P. J., Lee, Y. H., Rotstayn, L., Mahowald, N., Milly, G., Faluvegi, G., Balkanski, Y., Collins, W. J., Conley, A. J., Dalsoren, S., Easter, R., Ghan, S., Horowitz, L., Liu, X., Myhre, G., Nagashima, T., Naik, V., Rumbold, S. T., Skeie, R., Sudo, K., Szopa, S., Takemura, T., Voulgarakis, A., Yoon, J.-H., and Lo, F.: Radiative forcing in the ACCMIP historical and future climate simulations, Atmos. Chem. Phys., 13, 2939–2974, https://doi.org/10.5194/acp-13-2939-2013, 2013.
Solomon, S., Qin, D., Manning, M., Chen, Z., Marquis, M., Averyt, K. B., Tignor, M., and Miller, H. L. (Eds.): IPCC: Climate Change 2007: The Physical Science Basis. Contribution of Working Group I to the Fourth Assessment Report of the Intergrovernmental Panel on Climate Change, Intergovernmental Panel on Climate Change (IPCC), Cambridge Univ. Press, UK, New York, USA, 996, 2007.
Stjern, C. W., Samset, B. H., Myhre, G., Forster, P. M., Hodnebrog, Ø, Andrews, T., Boucher, O., Faluvegi, G., Iversen, T., Kasoar, M., Kharin, V., Kirkevåg, A., Lamarque, J.-F., Olivieì, D., Richardson, T., Shawki, D., Shindell, D., Smith, C., Takemura, T., and Voulgarakis, A.: Rapid adjustments cause weak surface temperature response to increased black carbon concentrations, J. Geophys. Res.-Atmos., 122, 11462–1481, https://doi.org/10.1002/2017JD027326, 2017.
Ueda, H., Iwai, A., Kuwako, K., and Hori, M. E.: Impact of anthropogenic forcing on the Asian summer monsoon as simulated by eight GCMs, Geophys. Res. Lett., 33, L06703, https://doi.org/10.1029/2005GL025336, 2006.
Wang, B., Liu, J., Kim, H.-J., Webster, P., and Yim, S.-Y.: Recent change of the global monsoon precipitation (1979-2008), Clim. Dynam., 39, 1123–1135, https://doi.org/10.1007/s00382-011-1266-z, 2012.
Wang, C.: A modeling study on the climate impacts of black carbon aerosols, J. Geophys. Res., 109, D03106, https://doi.org/10.1029/2003JD004084, 2004.
Wang, Z., Lin, L., Yang, M., Xu, Y., and Li, J.: Disentangling fast and slow responses of the East Asian summer monsoon to reflecting and absorbing aerosol forcings, Atmos. Chem. Phys., 17, 11075–11088, https://doi.org/10.5194/acp-17-11075-2017, 2017.
Wu, G. X., Li, Z. Q., Fu, C. B., Zhang, X. Y., Zhang, R. Y., Zhang, R. H., Zhou T, J., Li, J. P., Li, J. D., Zhou, D. G., Wu, L., Zhou, L. T., He, B., and Huang, R. H.: Advances in studying interactions between aerosols and monsoon in China, Sci. China Earth Sci., 59, 1–16, https://doi.org/10.1007/s11430-015-5198-z, 2015.
Xie, P. and Arkin, P. A.: Global precipitation: A 17-year monthly analysis based on gauge observations, satellite estimates, and numerical model outputs, B. Am. Meteorol. Soc., 78, 2539–2558, https://doi.org/10.1175/1520-0477(1997)078<2539:GPAYMA>2.0.CO;2, 1997.
Xie, X., Wang, H., Liu, X., Li, J., Wang, Z., and Liu, Y.: Distinct effects of anthropogenic aerosols on the East Asian summer monsoon between multidecadal strong and weak monsoon stages, J. Geophys. Res.-Atmos., 121, 7026–7040, https://doi.org/10.1002/2015JD024228, 2016.
Xie, X. N., Liu, X. D., Che, H. Z., Xie, X. X., Wang, H. L., Li, J. D., Shi, Z. G., and Liu, Y.: Modeling East Asian dust and its radiative feedbacks in CAM4-BAM, J. Geophys. Res.-Atmos., 123, 1079–1096, https://doi.org/10.1002/2017JD027343, 2018a.
Xie, X., Liu, X., Che, H., Xie, X., Li, X., Shi, Z., Wang, H., Zhao, T., and Liu, Y.: Radiative feedbacks of dust in snow over eastern Asia in CAM4-BAM, Atmos. Chem. Phys., 18, 12683–12698, https://doi.org/10.5194/acp-18-12683-2018, 2018b.
Zhang, H., Wang, Z., Guo, P., and Wang, Z.: A modeling study of the effects of direct radiative forcing due to carbonaceous aerosol on the climate in East Asia, Adv. Atmos. Sci., 26, 57–66, https://doi.org/10.1007/s00376-009-0057-5, 2009.