the Creative Commons Attribution 4.0 License.
the Creative Commons Attribution 4.0 License.
 | 19 Oct 2020
Possible mechanisms of summer cirrus clouds over the Tibetan Plateau
Feng Zhang
Qiu-Run Yu
Jia-Li Mao
Chen Dan
Yanyu Wang
Qianshan He
Tiantao Cheng
Chunhong Chen
Dongwei Liu
Yanping Gao
The geographical distributions of summertime cirrus with different cloud top heights above the Tibetan Plateau are investigated by using the 2012–2016 Cloud-Aerosol Lidar and Infrared Pathfinder Satellite Observation (CALIPSO) data. The cirrus clouds with different cloud top heights exhibit an obvious difference in their horizontal distribution over the Tibetan Plateau (TP). The maximum occurrence for cirrus with a cloud top height less than 9 km starts over the western plateau and moves up to the northern regions when cirrus is between 9 and 12 km. Above 12 km, the maximum occurrence of cirrus retreats to the southern fringe of the plateau. Three kinds of formation mechanisms – large-scale orographic uplift, ice particle generation caused by temperature fluctuation, and remnants of overflow from deep-convective anvils – dominate the formation of cirrus at less than 9 km, between 9 and 12 km, and above 12 km, respectively.
- Article
(2145 KB) - Full-text XML
- BibTeX
- EndNote


Cirrus is the high-altitude ice cloud identified as one of the most uncertain components in the current understanding of the climate variability (Rossow and Schiffer, 1999; Sassen and Mace, 2002; Solomon et al., 2007). Cirrus clouds can profoundly affect the radiative budget of the earth–atmosphere system. They scatter the incoming solar radiation (albedo effect), prevent the outgoing longwave radiation from leaving (the greenhouse effect), and reemit the infrared radiation into space (infrared effect) (McFarquhar et al., 2000; Zerefos et al., 2003; Corti and Peter, 2009). The optical thickness and temperature of cirrus have the potential to change these radiative effects. Despite influencing the atmospheric heat transport, cirrus also plays an essential role in the stratosphere–troposphere exchange of trace constituents, especially water vapor (Rosenfield et al., 1998). Recently, there has been particular interest in cirrus in the upper troposphere and lower stratosphere (UTLS), a transition region generally recognized to control the entry of troposphere air into the stratosphere (Gettelman et al., 2004; Fueglistaler et al., 2009; Randel and Jensen, 2013).
With the onset of the Asia summer monsoon (ASM), abundant anthropogenic aerosols and their precursors are transported to the Tibetan Plateau (TP) and can be quickly conveyed to the upper troposphere (UT), with the vertical transportation being confined by the upper-level ASM anticyclone (Fu et al., 2006; Park et al., 2009; Randel et al., 2010). By scrutinizing the seasonal variation in moisture and cirrus over the TP, Gao et al. (2003) stated that the mean high cloud reflectance over the TP hit its peak in April and arrived at its minimum in November. Besides, the topographic lifting over a significant barrier can boost the elevation of relatively warm and moist air, which contributes to the substantial number of cirrus clouds from March to May (Zhao et al., 2019; Yang et al., 2020). Apart from the aerosols and water vapor, satellite observations also suggest that cirrus clouds are connected with the outflow from deep convection, which frequently occurs over the TP (Li et al., 2005; Jin, 2006). Therefore, the abundant aerosols and their precursors in the UTLS, the topographic lifting, and the deep convection activities could act together to promote frequent cirrus occurrence over the TP during the ASM period.
Currently, there are two leading mechanisms for cirrus formation: deep-convective detrainment and in situ formation associated with Kelvin or gravity waves as well as synoptic-scale ascent (Jensen et al., 1996; Pfister et al., 2001; Boehm and Lee, 2003; Immler et al., 2008; Fujiwara et al., 2009). It is found that cirrus is directly related to the fallout and decay of the outflow from deep convection (Prabhakara et al., 1993; Wang et al., 1996). Observations show cirrus generally occurs in the vicinity of convectively active areas like the tropical western Pacific or at places with low outgoing longwave radiation (OLR) (Winker and Trepte, 1998; Eguchi et al., 2007). Cirrus clouds are formed when deep convection detrains hydrometeors from the planetary boundary to the upper troposphere (Luo et al., 2011). Moreover, the temperature fluctuations driven by the large-scale vertical uplifting or atmospheric wave activities in the upper troposphere also lead to the in situ formation of cirrus (Riihimaki and McFarlane, 2010). The role of the mechanisms mentioned above in the formation of cirrus over the TP is more complex and less understood. Ground-based radar and lidar observations are adopted to explore the characteristics and potential causes of ice clouds over the plateau (He et al., 2012; Zhao et al., 2016). However, discussions based on cloud top height are relatively sparse due to the cloud contamination from the layer above. Also, these observations are limited to a relatively short time and a fixed site, mainly Naqu (31.5∘ N, 92.1∘ E). Knowledge of the spatial distribution over the whole plateau is not sufficient. Studies of cirrus characteristics with different cloud top heights in a broader region are needed, and knowledge of their possible explanations is critical to understand the thermal and dynamic effects of the TP and to improve climate modeling further.
In this paper, we investigate the variation in cirrus spatial distribution over the TP from the altitude perspective. Our particular interest is to identify the dominant contributors to the formation of cirrus at different heights over the TP and to provide the first insight into the possible mechanisms on a regional scale. In Sect. 2, the descriptions of the data and method are presented. Section 3 provides the geographical distribution of cirrus and discusses its relationship with topographic height, gravity waves, and deep convection. Section 4 contains a summary and brief discussion.
2.1 Definition of CALIPSO cirrus clouds and the NOAA OLR data
The Cloud-Aerosol Lidar and Infrared Pathfinder Satellite Observation (CALIPSO) mission offers comprehensive observations of clouds and aerosols from the troposphere to the stratosphere (Winker et al., 2009; Thorsen et al., 2013), and it has been proved to be highly accurate and reliable in detecting cirrus clouds (Nazaryan et al., 2008). To determine the occurrence number of cirrus clouds at different heights, we use the CALIPSO cloud layer level 2 Version 4.10 data (Vaughan et al., 2009), which are acquired from the NASA Earth Sciences Data Center (ASDC) at: https://earthdata.nasa.gov/, (last access: 25 March 2019). With its spatial resolution of 5 km and vertical resolution of 30 m (0–8.2 km) and 60 m (8.2–20.2 km), CALIPSO provides not only the precise identification of cirrus clouds but also a glimpse into their vertical distribution, which allows us to gain further insight into the formation mechanisms of cirrus. To focus on the characteristics of cirrus occurrence during the ASM period, we collect 5 years of CALIPSO data from June to August (2012–2016). The cloud layer products include the feature classification flags to identify clouds and aerosols and to discriminate between their species further. The CALIPSO cloud subtyping algorithm follows the cloud top pressure thresholds from the International Satellite Cloud Climatology Project (ISCCP) cloud-type classification scheme (Rossow and Shiffer, 1991). In this paper, we only use the data which are verified by the CALIPSO discrimination algorithm as cirrus. (i.e., “Feature Type” parameter equals 2 and “Feature Subtype” parameter equals 6). Moreover, only data with a cloud-and-aerosol discrimination (CAD) score between 70–100 are considered in our analysis to avoid highly uncertain cloud features (Liu et al., 2009).
CALIPSO original orbital daily data are interpolated into grid point data with a latitude-by-longitude resolution of . We select relatively fine latitude grids and coarse longitude grids because observations are available along the given CALIPSO orbit, while the adjacent track is separated by in the longitude. The box strikes a balance between a region small enough to fully depict the variation in an individual grid and large enough to collect enough numbers of observations. In this article, the TP is defined as the area that covers from 25 to 45∘ N and 65 to 105∘ E with an altitude higher than 3000 m (Yan et al., 2016). In the chosen spatial domain, the CALIPSO measurements are grouped into 20 lattices, and the occurrence number of each bin is the average of all orbits passing through the corresponding grid cells.
We also employ the OLR data from the National Oceanic and Atmospheric Administration (NOAA) satellites. OLR is calculated daily as the average of the daytime and nighttime measurements by the Advanced High-Resolution Radiometer with resolution (Liebmann and Smith, 1996). Its value has widely been acknowledged as a proxy for convection intensity (Das et al., 2011). Typically, an OLR value below 200 W m−2 indicates deep convection (Fujiwara et al., 2009), and deep convection represents regions with the extensive lifting of air that may play a role in the formation of cirrus (He et al., 2013).
2.2 Description of reanalysis data
Data used in the paper also include the Japanese 55-year Reanalysis dataset (JRA-55; ; 37 pressure levels) (Kobayashi et al., 2015) and the European Centre for Medium-Range Weather Forecasts Re-Analysis data (ERA5; ; 37 pressure levels) (Hersbach et al., 2011). The study time of all the reanalysis products in this paper is June to August from 2012 to 2016. To ensure the data resolution will not influence our investigation, we interpolate all reanalysis datasets onto the same horizontal resolution as the CALIPSO bin.
Chen et al. (2014) showed that JRA-55 gave the best capture of the diurnal rainfall cycle over the TP and the eastward precipitation propagation to the eastern lees among four reanalysis datasets. Besides, JRA-55 has the smallest root mean square error in the U and V wind throughout the vertical column over the plateau (Cheng et al., 2014). Comparing it with ERA and NCEP, JRA-55 also displays the best correlation in thermal heating with the station data over the plateau (Hu and Duan, 2015).
Profile data, such as temperature and specific humidity from ERA5, are also utilized in this study. The variables are vertically interpolated from 1000 to 1 hPa as 37 pressure levels. By verifying with 3000 high-quality and independent sounding observations, the ERA data are shown to produce a relatively small mean bias in temperature profiles during the TP Experiment (Bao and Zhang, 2013). Other studies also prove the reliability and quality of ERA temperature and geopotential height data over the plateau (Gerlitz et al., 2014).
2.3 Results
Cirrus occurrence number is the total number of profiles identified as cirrus. To better probe the vertical development of cirrus, cirrus occurrence events are further grouped into four types based on the cloud top height: <9; 9–12; 12–15; >15 km. Figure 1 shows the distribution of cirrus occurrence numbers measured by CALIPSO during the 2012–2016 summer. The cirrus top height is below 9 km (Fig. 1a), 9–12 km (Fig. 1b), and above 12 km (Fig. 1c). In Fig. 1a, the inner and outer black curves represent the topographic height of 4500 and 3000 m. This result is consistent with the third Tibetan Plateau Experiment of atmospheric sciences (TIPEX III) campaign from July to August 2014 over Naqu, which states the cirrus clouds were generally observed ranging from 9.7 to 16.5 km (Dai et al., 2019). For a cirrus top altitude of less than 9 km, a large number of cirrus clouds are observed in the central and western part of the TP with peak effective sampling numbers over 1000. It is noteworthy that the large-value region lies within the 4500 m topographic height line (black curve), indicating an extremely close relationship between cirrus occurrence and altitude. Some studies attribute the existence of cirrus to convection produced by surface heating (Yanai et al., 1992; Chen and Liu, 2005). Moreover, this heat pump effect could be further enhanced by the absorption of incoming solar radiation by transporting absorbing aerosols such as black carbon and dust, as indicated by Zhao et al. (2020). The TP performs as an enormous and intense heat source with strong surface diabatic heating in summer since the intensity of radiation cooling is not strong enough to balance the diabatic heating (Wu, 1984). With a shallow cyclonic circulation close to the TP surface and a deep anticyclonic circulation aloft, the moist airflows can be rapidly uplifted to the upper layers, and cirrus formation is simulated. The topmost contribution to the summer TP heating originates from the latent heat, which is almost 3 times as much as the sensible heat. However, the latent heat is almost negligible at high levels over the west flank of the TP (Duan and Wu, 2005).
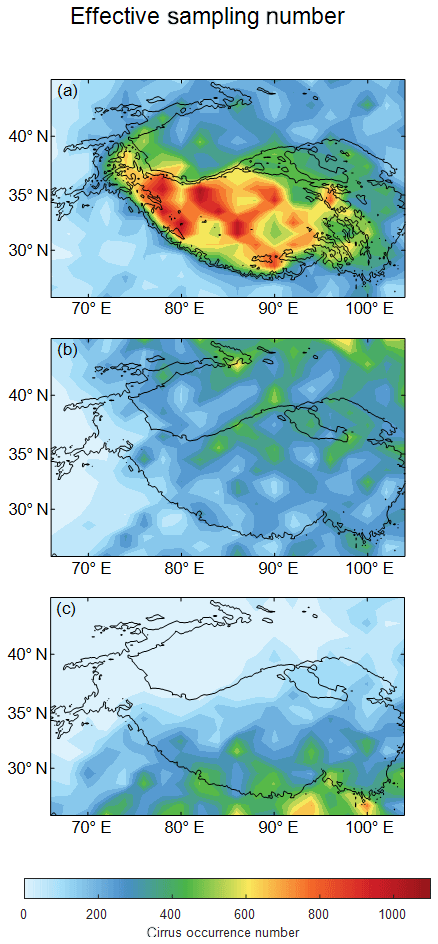
Figure 1Distribution of cirrus occurrence numbers during the June–August period from 2012 to 2016. The cirrus top height is (a) below 9 km, (b) 9 to 12 km (c), and above 12 km. In (a), the inner and outer black curves represent the topographic height of 4500 and 3000 m, respectively. In (b) and (c), the black curves represent the topographic height of 3000 m.
Figure 2 shows the monthly mean surface net thermal radiation, water vapor evaporation, latent heat flux, and sensible heat flux from ERA5 data. Radiative cooling is the net outgoing radiative energy flux (Sun et al., 2017); it can be given as
where Prad (T) is the thermal emission of the radiative cooler with temperature T and Patm (Tamb) is the atmospheric radiation with air temperature Tamb. Here we assume that the atmospheric radiation is the same in our study region; the radiative cooling is determined by the surface thermal emission Prad (T) (Fig. 3a). Mostly, the maximum radiative cooling zone lies in the southwest of the plateau, where the terrain height exceeds 4500 m. Figure 3b and c show the evaporation and surface latent heat flux, respectively. Their patterns are identical. The regions with higher altitude tend to be drier than lower-altitude regions, so evaporation and surface latent heat flux are not the main contributor to the formation of cirrus below 9 km. Figure 3d is the surface sensible heat flux. The higher-altitude region also shows a larger sensible heat flux. However, the magnitude is around 70 W m−2, which is smaller than the magnitude of surface radiative cooling (130 W m−2). Therefore, the combination of surface radiative cooling and surface sensible heat flux caused by terrain height triggered cirrus below 9 km. Figure 3a is the zonal distribution of vertical winds averaged from 80 to 90∘ E. This is the region where the terrain height is larger than 4500 m for most of our area of interest. The contour is the specific humidity. The red rectangle at around 300 hPa indicates weak subsidence above 9 km, limiting the vertical extent of cirrus over these regions. In other words, the radiative cooling and sensible heat due to orography are responsible for cirrus formation. Still, the weak vertical motion above 300 hPa further prohibits the vertical growth of cirrus to a larger height. Therefore, the cirrus over the high topographic-height areas is concentrated below 9 km.
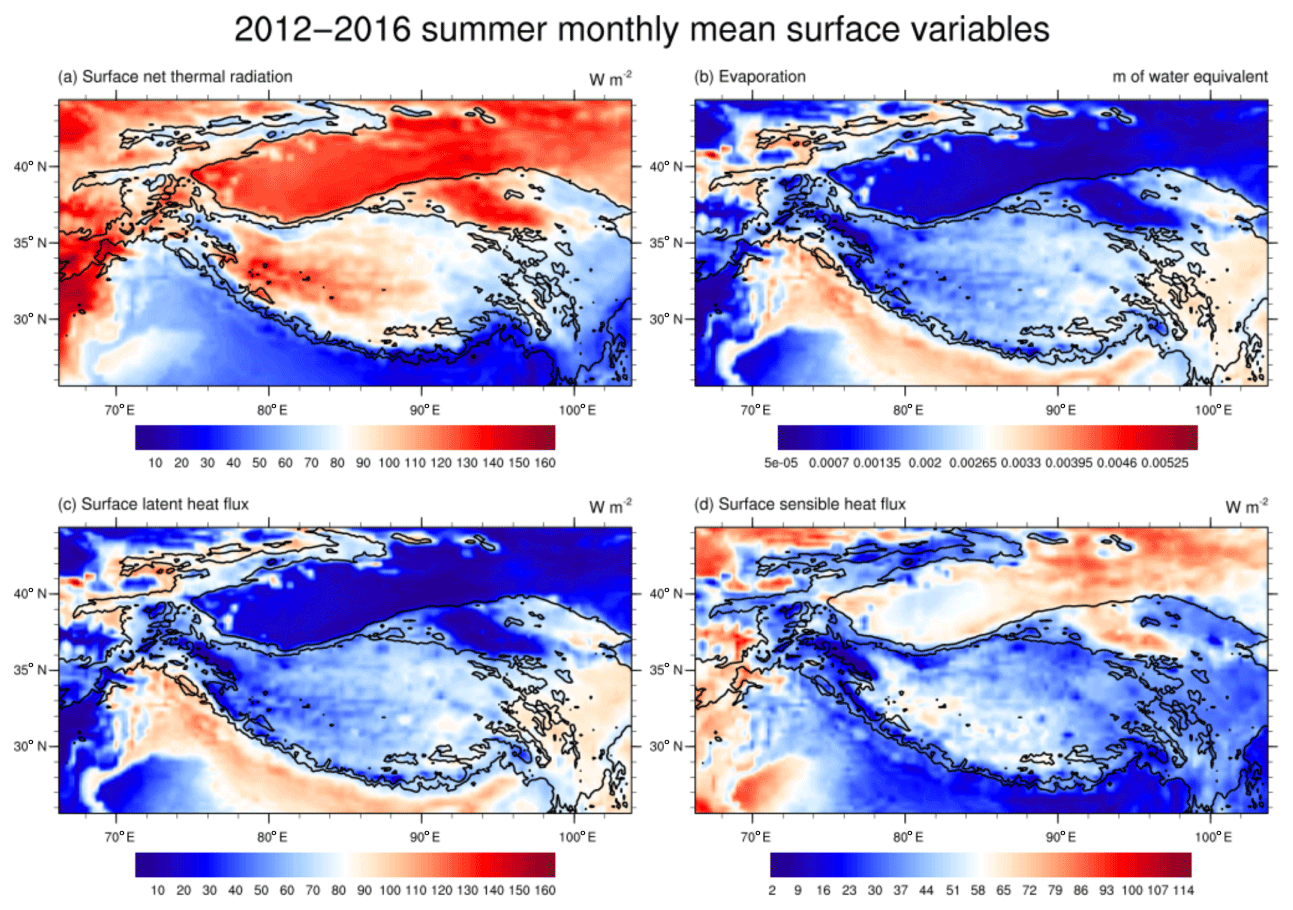
Figure 2Geographical distribution of monthly mean surface (a) radiation cooling, (b) surface evaporation, (c) latent heat flux, and (d) sensible heat flux over the Tibetan Plateau. The study period is June, July, and August from 2012 to 2016.

Figure 3The zonal distribution of vertical winds averaged from (a) 80 to 90∘ E and (b) 85 to 100∘ E for each latitude. The contour is specific humidity.
Figure 1b demonstrates the spatial distribution of cirrus occurrence number with cloud top height between 9 and 12 km from 2012 to 2016 in summer. It is evident that the occurrence number starts to reduce over the highland and expands towards the north and northeast of the plateau. Considering that large values also occur at the north side of the TP, cirrus with a cloud top between 9 and 12 km is generated by external forcing different from orography.
Jensen and Pfister (2004) pointed out that the in situ transient temperature fluctuation can boost the atmospheric dehydration efficiency and produce a more significant number of ice crystals along with smaller ice particle size, consequently creating more cirrus events. Following the classical Lorenz-type decomposition of atmospheric circulation (Lorenz, 1967; Lu et al., 2016), transient temperature fluctuation is calculated to explain the formation of cirrus. Figure 4 shows the geographical distribution of (a) transient temperature fluctuation and (b) 5-year averaged specific humidity at 250 hPa (about 11 to 12 km). There is significant temperature fluctuation at the north side of the Tibet Plateau, with a peak near 79∘ E and 41∘ N. However, the water vapor condition at 250 hPa over the western TP is too poor to form more cirrus clouds, so the cirrus clouds are concentrated in the northeast. Temperature fluctuation includes convection, gravity waves, and other atmospheric activities at different scales. Besides, the convection, the eastward subtropical upper-level jet stream passing over the TP, and its adjacent orography are all likely to trigger gravity waves and intensify temperature fluctuation (Cohen and Boos, 2016). Therefore, the fluctuations in temperature contribute to the formation of cirrus between 9 and 12 km.
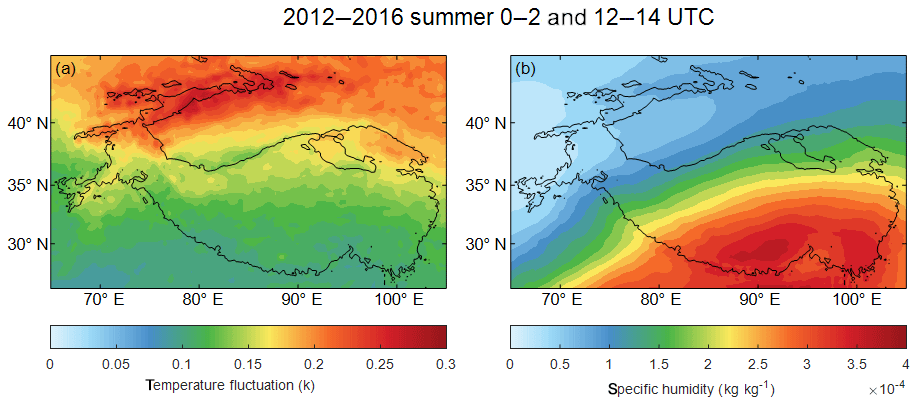
Figure 4Geographical distribution of (a) temperature fluctuation and (b) 5-year averaged specific humidity at 250 hPa (about 11 to 12 km).
The cirrus distribution with the top height between 12 and 15 km is depicted in Fig. 1c. The regions with maxima dramatically shift to the southern fringe of the plateau, suggesting that cirrus above 12 km over the TP is triggered by another formation mechanism. Dai et al. (2018) suggested cirrus that clouds over Naqu are correlated with deep-convective activity over the Tibetan Plateau. Deep convection is widely accepted as a key factor for cirrus formation. In order to probe the connection between the cirrus higher than 12 km and deep convection, the convective overflow height and daily averaged OLR distribution for summers of 2012–2016 are displayed in Fig. 5a and b. The altitude where the smallest potential temperature gradient is located is defined as the maximum convective overflow level, and the cirrus base can be found near or above the convective outflow level (Pandit et al., 2014). The place where the maximum convective outflow level is around 12 km lies in most areas of the eastern TP, and the OLR values in these regions are near 200 W m−2, indicating strong deep convection over these regions. The zonal distribution of vertical winds averaged from 85 to 100∘ E is shown in Fig. 3b. The red rectangle indicates strong vertical motions around 12 km, further confirming that the cirrus at 12–15 km is mainly generated by deep convection. Deep convection, which, at sufficient vertical extent, directly injects particles at the altitude near or below the tropopause, contributes to the predominance of cirrus in low-OLD regions. Apart from direct anvil spreading, deep convection can indirectly involve cirrus formation due to the radiative cooling above the deep-convective clouds and the updrafts caused by pileus clouds (Sassen et al., 2009). As a result, cirrus is formed above 12 km as a remnant of overflow and dissipation from deep-convective anvils.
It should also be mentioned that the timing of the twice-daily CALIPSO overpasses is not in sync with the period of daily OLR data. Meanwhile, the convective outflow level and OLR calculated from reanalysis data still exhibit bias and uncertainty over the TP at a regional scale. Therefore, deep convection only offers a necessary condition for the uplift of cirrus, but it is not sufficient enough to ensure the occurrence of cirrus. The areas of cirrus number maxima may not agree very well with the center of low OLR and high convective overflow height.
The cloud top upper limit for cirrus over the plateau is 18 km, as observed by lidar. However, for cloud top above 15 km, the CALIPSO lidar observations see much less cirrus over the plateau, and there is almost no geographical variation in cirrus numbers over these regions. Therefore, their features and the corresponding mechanisms are not discussed in this paper.
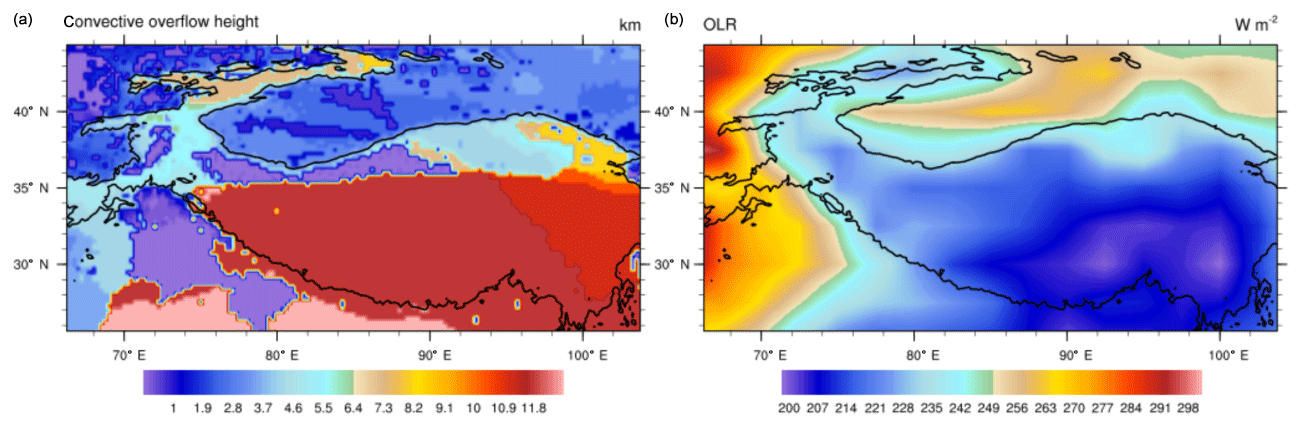
Figure 5Distribution of (a) convective overflow height and (b) OLR.
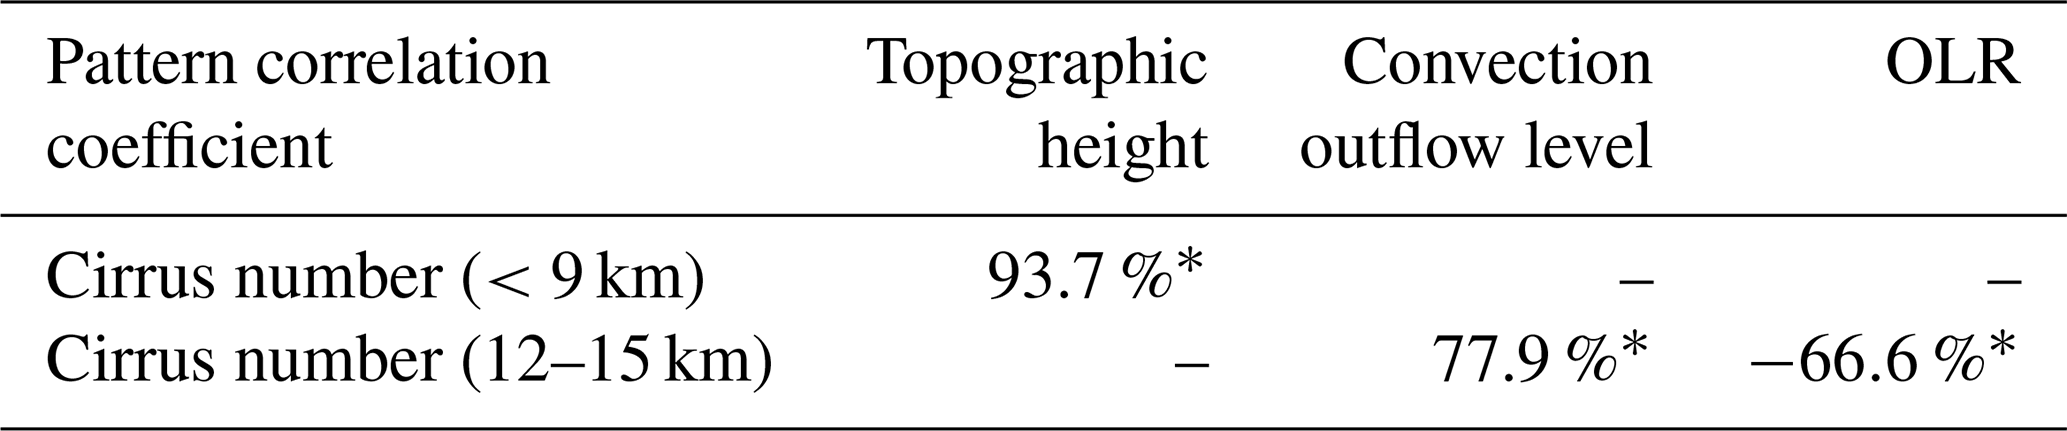
To quantify the impact of the above driving forces on cirrus formation at their corresponding heights, we further calculate their pattern correlation coefficients (Feng et al., 2016). These coefficients reveal the relationship between two variables at corresponding locations. As indicated by Table 1, topographic height determines the distribution of cirrus below 9 km with the pattern correlation coefficient being 93.7 %. For cirrus between 12 and 15 km, both the convective outflow level and OLR contribute to its occurrence with pattern correlation coefficients of 77.9 % and −66.6 %, respectively. Besides, all of these coefficients have passed the t test at the 99 % confidence level. Therefore, two of the three mechanisms mentioned above are supported statistically.
Table 1The pattern correlation coefficients between the two variables. The asterisk represents coefficients passing the t test at the ≥99 % confidence level.
In this paper, we investigated the spatial distribution of cirrus clouds over the TP in the Asia summer monsoon season with 5 years of CALIPSO data (2012–2016). Remarkable differences in the distributions of cirrus occurrence numbers are found at different heights. The cirrus with a cloud top altitude less than 9 km extends over almost the whole western and central part of the plateau, especially over the regions with a topographic height greater than 4500 m. For cirrus with a top height between 9 and 12 km, distinct maxima in occurrence numbers move up to the northeastern plateau and the north side of the TP. For cirrus between 12 and 15 km, the maxima retreat to the southern region. There are three formation mechanisms which determine the cirrus top height over the plateau, and the evidence is discussed in the following.
-
The cirrus with a top height below 9 km is closely tied to orography, with a pattern correlation coefficient between the topographic height and the cirrus occurrence number of 93.7 %. The surface radiative cooling and latent heat brought by the terrain height in summer contribute to the cirrus formation. Still, the weak subsidence in the upper layers prohibits further vertical growth of cirrus over the west flank of the TP.
-
The temperature perturbation induced by convective activities, including gravity waves, is responsible for the cirrus occurrence maxima at the corresponding locations when the cloud top is between 9 and 12 km. The fluctuation can boost the atmospheric dehydration efficiency and influence the ice nucleation process, generating more cirrus particles.
-
The convective blow-off mechanism causes large values of cirrus numbers between 12 and 15 km. The geographical distribution pattern of cirrus is quite similar to that of the convective overflow height and OLR with the pattern correlation coefficient being 77.9 % and −66.6 %. Since OLR is a good proxy for deep convection, cirrus formation involves both the direct and indirect effects of deep convection in low-OLD regions. The direct effect is particles being directly injected to heights near or below the tropopause, while the radiative cooling above the deep-convective clouds and the regional updrafts via a pileus cloud contribute to the indirect effect. Moreover, the convective outflow level determines the cloud base height of cirrus from the thermal perspective.
Our research provides the first detailed analysis of how the distribution of cirrus shifts geographically over the TP from the height perspective over a regional scale. The results help to map out the thermal and dynamical structures of the atmosphere, which determine the vertical extent of cirrus at different geographical locations over the plateau. The unique vertical distribution of cirrus over the TP indicates special features of the connection between cirrus and physical processes, and they are distinct from interactions in other regions like the tropical ocean. Therefore, the phenomena discovered in this article may promote our knowledge of cirrus over the TP and provide useful information for model simulations. Since CALIPSO crosses the Equator at 01:30 and 13:30 LT and the orbit repeats only once in 16 d, our research is limited by the sampling time and the orbiting range-resolved resolution. More precise verification of the cirrus formation mechanisms needs to combine with intensive geostationary and in situ observations to consider the diurnal cycle. Meanwhile, the formation of cirrus requires the joint effort of sufficiently cold and moist atmospheric conditions, favorable convective activities, and a possible condensation nucleus. Other potential mechanisms, such as the Rossby wave (Dai et al., 2019), could also play a role. Our study tends to address the most dominating mechanisms to generate cirrus over the plateau and provides an insight into their physical process. Therefore, other relatively trivial and less significant mechanisms are ignored in this paper. In the future, we will explore other mechanisms more thoroughly by case study if possible.
The datasets can be obtained from the corresponding author upon request.
QH and FZ designed the study. FZ, QH, QRY, JLM, and YW contributed to data analysis, interpretation, and paper writing. TC, DL, CC, and YG did further analysis and interpreted the results. All authors contributed to improving the paper.
The authors declare that they have no conflict of interest.
This article is part of the special issue “Study of ozone, aerosols and radiation over the Tibetan Plateau (SOAR-TP) (ACP/AMT inter-journal SI)”. It is not associated with a conference.
The authors gratefully acknowledge NOAA/OAR/ESRL PSD, Boulder, Colorado, USA, for providing the interpolated OLR data on their website (https://psl.noaa.gov/data/gridded/data.olrcdr.interp.html), (last access: 8 October 2020) and the Japan Meteorological Agency for JRA-55 data at: http://jra.kishou.go.jp/JRA-55/index_en.html, (last access: 8 October 2020) also go to the ECMWF and NASA for providing ERA5 and CALIPSO data.
This study was partially supported by the National Natural Science Foundation of China (NSFC, grant nos. 91637101, 42075125, and 41775129), and the Shanghai Science and Technology Committee Research Special Funds (grant no. 16ZR1431700).
This paper was edited by Wenshou Tian and reviewed by three anonymous referees.
Bao, X. and Zhang, F.: Evaluation of NCEP–CFSR, NCEP–NCAR, ERA-Interim, and ERA-40 reanalysis datasets against independent sounding observations over the Tibetan Plateau, J. Climate, 26, 206–214, 2013.
Boehm, M. T. and Lee, S.: The implications of tropical Rossby waves for tropical tropopause cirrus formation and for the equatorial upwelling of the Brewer–Dobson circulation, J. Atmos. Sci., 60, 247–261, 2003.
Chen, G., Iwasaki, T., Qin, H., and Sha, W.: Evaluation of the warm-season diurnal variability over East Asia in recent reanalyses JRA-55, ERA-Interim, NCEP CFSR, and NASA MERRA, J. Climate, 27, 5517–5537, 2014.
Cohen, N. Y. and Boos, W. R.: Modulation of subtropical stratospheric gravity waves by equatorial rainfall, Geophys. Res. Lett., 43, 466–471, 2016.
Corti, T. and Peter, T.: A simple model for cloud radiative forcing, Atmos. Chem. Phys., 9, 5751–5758, https://doi.org/10.5194/acp-9-5751-2009, 2009.
Dai, G., Wu, S., Song, X., and Liu, L.: Optical and Geometrical Properties of Cirrus Clouds over the Tibetan Plateau Measured by LiDAR and Radiosonde Sounding during the Summertime in 2014, Remote Sensing, 11, 302, https://doi.org/10.3390/rs11030302, 2019.
Das, S. K., Chiang, C. W., and Nee, J. B.: Influence of tropical easterly jet on upper tropical cirrus: An observational study from CALIPSO, Aura-MLS, and NCEP/NCAR data, J. Geophys. Res., 116, D12204, https://doi.org/10.1029/2011JD015923, 2011.
Duan, A. M. and Wu, G. X.: Role of the Tibetan Plateau thermal forcing in the summer climate patterns over subtropical Asia, Clim. Dynam., 24, 793–807, 2005.
Eguchi, N., Yokota, T., and Inoue, G.: Characteristics of cirrus clouds from ICESat/GLAS observations, Geophys. Res. Lett., 34, 29–30, https://doi.org/10.1029/2007GL029529, 2007.
Feng, J., Liao, H., and Li, J.: The impact of monthly variation of the Pacific–North America (PNA) teleconnection pattern on wintertime surface-layer aerosol concentrations in the United States, Atmos. Chem. Phys., 16, 4927–4943, https://doi.org/10.5194/acp-16-4927-2016, 2016.
Fu, R., Hu, Y., Wright, J. S., Jiang, J. H., Dickinson, R. E., Chen, M., and Wu, D. L.: Short circuit of water vapor and polluted air to the global stratosphere by convective transport over the Tibetan Plateau, P. Natl. Acad. Sci. USA., 103, 5664–5669, 2006.
Fueglistaler, S., Dessler, A. E., Dunkerton, T. J., Folkins, I., Fu, Q., and Mote, P. W.: Tropical tropopause layer, Rev. Geophys., 47, RG1004, https://doi.org/10.1029/2008RG000267, 2009.
Fujiwara, M., Iwasaki, S., Shimizu, A., Inai, Y., Shiotani, M., Hasebe, F., and Hamada, A.: Cirrus observations in the tropical tropopause layer over the western Pacific, J. Geophys. Res., 114, D09304, https://doi.org/10.1029/2008JD011040, 2009.
Gao, B. C., Yang, P., Guo, G., Park, S. K., Wiscombe, W. J., and Chen, B.: Measurements of water vapor and high clouds over the Tibetan Plateau with the Terra MODIS instrument, IEEE T. Geosci. Remote Sens., 41, 895–900, 2003.
Gerlitz, L., Conrad, O., Thomas, A., and Böhner, J.: Warming patterns over the Tibetan Plateau and adjacent lowlands derived from elevation-and bias corrected ERA-Interim data, Clim. Res., 58, 235–246, 2014.
Gettelman, A., Kinnison, D. E., Dunkerton, T. J., and Brasseur, G. P.: Impact of monsoon circulations on the upper troposphere and lower stratosphere, J. Geophys. Res., 109, D22101, https://doi.org/10.1029/2004JD004878, 2004.
He, Q. S., Li, C. C., Ma, J. Z., Wang, H. Q., Shi, G. M., Liang, Z. R., and Zhou, X. W.: The properties and formation of cirrus clouds over the Tibetan Plateau based on summertime lidar measurements, J. Atmos. Sci., 70, 901–915, 2013.
Hersbach, H., Bell, B., Berrisford, P., Hirahara, S., Horányi, A., Muñoz‐Sabater, J., and Simmons, A.: The ERA5 global reanalysis, Q. J. Roy. Meteorol. Soc., 146, 1999–2049, 2020.
Hu, J. and Duan, A.: Relative contributions of the Tibetan Plateau thermal forcing and the Indian Ocean Sea surface temperature basin mode to the interannual variability of the East Asian summer monsoon, Clim. Dynam., 45, 2697–2711, 2015.
Immler, F., Krüger, K., Fujiwara, M., Verver, G., Rex, M., and Schrems, O.: Correlation between equatorial Kelvin waves and the occurrence of extremely thin ice clouds at the tropical tropopause, Atmos. Chem. Phys., 8, 4019–4026, https://doi.org/10.5194/acp-8-4019-2008, 2008.
Jensen, E. and Pfister, L.: Transport and freeze-drying in the tropical tropopause layer, J. Geophys. Res., 109, D02027, https://doi.org/10.1029/2003JD004022, 2004.
Jensen, E. J., Toon, O. B., Selkirk, H. B., Spinhirne, J. D., and Schoeberl, M. R.: On the formation and persistence of subvisible cirrus clouds near the tropical tropopause, J. Geophys. Res., 101, 21361–21375, 1996.
Jin, M.: MODIS observed seasonal and interannual variations of atmospheric conditions associated with the hydrological cycle over Tibetan Plateau, Geophys. Res. Lett., 33, 277–305, https://doi.org/10.1029/2006GL026713, 2006.
Kobayashi, S., Ota, Y., Harada, Y., Ebita, A., Moriya, M., Onoda, H., and Miyaoka, K.: The JRA-55 reanalysis: General specifications and basic characteristics, J. Meteorol. Soc. Jpn., 93, 5–48, 2015.
Li, Q., Jiang, J. H., Wu, D. L., Read, W. G., Livesey, N. J., Waters, J. W., and Turquety, S.: Convective outflow of South Asian pollution: A global CTM simulation compared with EOS MLS observations, Geophys. Res. Lett., 32, L14826, https://doi.org/10.1029/2005GL022762, 2005.
Liebmann, B. and Smith, C. A.: Description of a complete (interpolated) outgoing longwave radiation dataset, B. Am. Meteorol. Soc., 77, 1275–1277, 1996.
Liu, Z., Vaughan, M., Winker, D., Kittaka, C., Getzewich, B., Kuehn, R., and Hostetler, C.: The CALIPSO lidar cloud and aerosol discrimination: Version 2 algorithm and initial assessment of performance, J. Atmos. Oceanic Technol., 26, 1198–1213, 2009.
Lorenz, E. N. and Lorenz, F. N.: The nature and theory of the general circulation of the atmosphere, 218, p.31, Geneva, World Meteorological Organization, 1967.
Lu, J., Wang, F., Liu, H., and Lin, P.: Stationary mesoscale eddies, upgradient eddy fluxes, and the anisotropy of eddy diffusivity, Geophys. Res. Lett., 43, 743–751, 2016.
Luo, Y., Zhang, R., Qian, W., Luo, Z., and Hu, X.: Intercomparison of deep convection over the Tibetan Plateau–Asian monsoon region and subtropical North America in boreal summer using CloudSat/CALIPSO data, J. Climate, 24, 2164–2177, 2011.
McFarquhar, G. M., Heymsfield, A. J., Spinhirne, J., and Hart, B.: Thin and subvisual tropopause tropical cirrus: Observations and radiative impacts, J. Atmos. Sci., 57, 1841–1853, 2000.
Nazaryan, H., McCormick, M. P., and Menzel, W. P.: Global characterization of cirrus clouds using CALIPSO data, J. Geophys. Res., 113, D16211, https://doi.org/10.1029/2007JD009481, 2008.
Pandit, A. K., Gadhavi, H., Ratnam, M. V., Jayaraman, A., Raghunath, K., and Rao, S. V. B.: Characteristics of cirrus clouds and tropical tropopause layer: Seasonal variation and long-term trends, J. Atmos. Sol.-Terr. Phy., 121, 248–256, 2014.
Park, M., Randel, W. J., Emmons, L. K., and Livesey, N. J.: Transport pathways of carbon monoxide in the Asian summer monsoon diagnosed from Model of Ozone and Related Tracers (MOZART), J. Geophys. Res., 114, D08303, https://doi.org/10.1029/2007JD009481, 2009.
Pfister, L., Selkirk, H. B., Jensen, E. J., Schoeberl, M. R., Toon, O. B., Browell, E. V., and Hintsa, E.: Aircraft observations of thin cirrus clouds near the tropical tropopause, J. Geophys. Res., 106, 9765–9786, 2001.
Prabhakara, C., Kratz, D. P., Yoo, J. M., Dalu, G., and Vernekar, A.: Optically thin cirrus clouds: Radiative impact on the warm pool, J. Quant. Spectrosc. Ra., 49, 467–483, 1993.
Randel, W. J. and Jensen, E. J.: Physical processes in the tropical tropopause layer and their roles in a changing climate, Nat. Geosci., 6, 169–176, 2013.
Randel, W. J., Park, M., Emmons, L., Kinnison, D., Bernath, P., Walker, K. A., and Pumphrey, H.: Asian monsoon transport of pollution to the stratosphere, Science, 328, 611–613, 2010.
Riihimaki, L. D. and McFarlane, S. A.: Frequency and morphology of tropical tropopause layer cirrus from CALIPSO observations: Are isolated cirrus different from those connected to deep convection?, J. Geophys. Res., 115, D18201, https://doi.org/10.1029/2009JD013133, 2010.
Rosenfield, J. E., Considine, D. B., Schoeberl, M. R., and Browell, E. V.: The impact of subvisible cirrus clouds near the tropical tropopause on stratospheric water vapor, Geophys. Res. Lett., 25, 1883–1886, 1998.
Rossow, W. B. and Schiffer, R. A.: ISCCP cloud data products, B. Am. Meteorol. Soc., 72, 2–20, 1991.
Rossow, W. B. and Schiffer, R. A.: Advances in understanding clouds from ISCCP, B. Am. Meteorol. Soc., 80, 2261–2288, 1999.
Sassen, K. and Mace, G. G.: Ground based remote sensing of cirrus clouds, 168–209, Oxford, New York, NY, 2002.
Sassen, K., Wang, Z., and Liu, D.: Cirrus clouds and deep convection in the tropics: Insights from CALIPSO and CloudSat, J. Geophys. Res., 114, D00H06, https://doi.org/10.1029/2009JD011916, 2009.
Solomon, S., Qin, D., Manning, M., Averyt, K., and Marquis, M. (Eds.): Climate change 2007-the physical science basis: Working group I contribution to the fourth assessment report of the IPCC (Vol. 4), Cambridge University Press, 2007.
Sun, X., Sun, Y., Zhou, Z., Alam, M. A., and Bermel, P.: Radiative sky cooling: fundamental physics, materials, structures, and applications, Nanophotonics, 6, 997–1015, 2017.
Thorsen, T. J., Fu, Q., Comstock, J. M., Sivaraman, C., Vaughan, M. A., Winker, D. M., and Turner, D. D.: Macrophysical properties of tropical cirrus clouds from the CALIPSO satellite and from ground-based micropulse and Raman lidars, J. Geophys. Res., 118, 9209–9220, 2013.
Vaughan, M. A., Powell, K. A., Winker, D. M., Hostetler, C. A., Kuehn, R. E., Hunt, W. H., and McGill, M. J.: Fully automated detection of cloud and aerosol layers in the CALIPSO lidar measurements, J. Atmos. Oceanic Technol., 26, 2034–2050, 2009.
Wang, P. H., Minnis, P., McCormick, M. P., Kent, G. S., and Skeens, K. M.: A 6-year climatology of cloud occurrence frequency from Stratospheric Aerosol and Gas Experiment II observations (1985–1990), J. Geophys. Res., 101, 29407–29429, 1996.
Winker, D. M. and Trepte, C. R.: Laminar cirrus observed near the tropical tropopause by LITE, Geophys. Res. Lett., 25, 3351–3354, 1998.
Winker, D. M., Vaughan, M. A., Omar, A., Hu, Y., Powell, K. A., Liu, Z., and Young, S. A.: Overview of the CALIPSO mission and CALIOP data processing algorithms, J. Atmos. Oceanic Technol., 26, 2310–2323, 2009.
Wu, G. X.: The nonlinear response of the atmosphere to large-scale mechanical and thermal forcing, J. Atmos. Sci., 41, 2456–2476, 1984.
Yan, Y., Liu, Y., and Lu, J.: Cloud vertical structure, precipitation, and cloud radiative effects over Tibetan Plateau and its neighboring regions, J. Geophys. Res., 121, 5864–5877, 2016.
Yanai, M., Li. C., and Song, Z.: Seasonal heating of the Tibetan Plateau and its effects on the evolution of the Asian summer monsoon, J. Meteorol. Soc. Jpn., 70, 319–351, 1992.
Yang, Y., Zhao, C., and Fan, H.: Spatiotemporal distributions of cloud properties over China based on Himawari-8 advanced Himawari imager data, Atmos. Res., 240, 104927, https://doi.org/10.1016/j.atmosres.2020.104927, 2020.
Zerefos, C. S., Eleftheratos, K., Balis, D. S., Zanis, P., Tselioudis, G., and Meleti, C.: Evidence of impact of aviation on cirrus cloud formation, Atmos. Chem. Phys., 3, 1633–1644, https://doi.org/10.5194/acp-3-1633-2003, 2003.
Zhao, C., Liu, L., Wang, Q., Qiu, Y., Wang, W., Wang, Y., and Fan, T.: Toward understanding the properties of high ice clouds at the naqu site on the Tibetan Plateau using ground-based active remote sensing measurements obtained during a short period in July 2014, J. Appl. Meteorol. Clim., 55, 2493–2507, 2016.
Zhao, C., Chen, Y., Li, J., Letu, H., Su, Y., Chen, T., and Wu, X.: Fifteen-year statistical analysis of cloud characteristics over China using Terra and Aqua Moderate Resolution Imaging Spectroradiometer observations, Int. J. Climatol., 39, 2612–2629, 2019.
Zhao, C., Yang, Y., Fan, H., Huang, J., Fu, Y., Zhang, X., and Menenti, M.: Aerosol characteristics and impacts on weather and climate over the Tibetan Plateau, Natl. Sci. Rev., 7, 492–495, 2020.