the Creative Commons Attribution 4.0 License.
the Creative Commons Attribution 4.0 License.
Large contributions of biogenic and anthropogenic sources to fine organic aerosols in Tianjin, North China
Yanbing Fan
Cong-Qiang Liu
Linjie Li
Lujie Ren
Hong Ren
Zhimin Zhang
Qinkai Li
Shuang Wang
Junjun Deng
Libin Wu
Shujun Zhong
Yue Zhao
Chandra Mouli Pavuluri
Xiaodong Li
Xiaole Pan
Zifa Wang
Kimitaka Kawamura
Zongbo Shi
In order to better understand the molecular composition and sources of organic aerosols in Tianjin, a coastal megacity in North China, ambient fine aerosol (PM2.5) samples were collected on a day/night basis from November to December 2016 and from May to June 2017. The organic molecular composition of PM2.5 components, including aliphatic lipids (n-alkanes, fatty acids, and fatty alcohols), sugar compounds, and photooxidation products from isoprene, monoterpene, β-caryophyllene, naphthalene, and toluene, was analysed using gas chromatography–mass spectrometry. Fatty acids, fatty alcohols, and saccharides were identified as the most abundant organic compound classes among all of the tracers detected in this study during both seasons. High concentrations of most organics at night in winter may be attributed to intensive residential activities such as house heating as well as the low nocturnal boundary layer height. Based on tracer methods, the contributions of the sum of primary and secondary organic carbon (POC and SOC respectively) to aerosol organic carbon (OC) were 24.8 % (daytime) and 27.6 % (night-time) in winter and 38.9 % (daytime) and 32.5 % (night-time) in summer. In detail, POC derived from fungal spores, plant debris, and biomass burning accounted for 2.78 %–31.6 % (12.4 %; please note that values displayed in parentheses in the following are average values) of OC during the daytime and 4.72 %–45.9 % (16.3 %) at night in winter, and 1.28 %–9.89 % (5.24 %) during the daytime and 2.08 %–47.2 % (10.6 %) at night in summer. Biomass-burning-derived OC was the predominant source of POC in this study, especially at night (16.0±6.88 % in winter and 9.62±8.73 % in summer). Biogenic SOC from isoprene, α-∕β-pinene, and β-caryophyllene exhibited obvious seasonal and diurnal patterns, contributing 2.23±1.27 % (2.30±1.35 % during the daytime and 2.18±1.19 % at night) and 8.60±4.02 % (8.98±3.67 % and 8.21±4.39 %) to OC in winter and summer respectively. Isoprene and α-∕β-pinene SOC were obviously elevated in summer, especially during the daytime, mainly due to strong photooxidation. Anthropogenic SOC from toluene and naphthalene oxidation showed higher contributions to OC in summer (21.0±18.5 %) than in winter (9.58±3.68 %). In summer, toluene SOC was the dominant contributor to aerosol OC, and biomass burning OC also accounted for a high contribution to OC, especially at night-time; this indicates that land/sea breezes also play an important role in the aerosol chemistry of the coastal city of Tianjin in North China.
- Article
(7238 KB) - Full-text XML
-
Supplement
(904 KB) - BibTeX
- EndNote
The rapid industrialization in China has caused a serious air pollution problem, with fine aerosol (PM2.5 – particles with diameters less than or equal to 2.5 µm) concentrations exceeding the standard in many regions. In particular, the North China Plain (NCP), the Yangtze River Delta (YRD), and the Pearl River Delta (PRD), which are the regions where economic development in China is highest, have been suffering from severe air pollution. In the past decade, atmospheric aerosols have been widely regarded as the major air pollutants in Chinese megacities (Chan and Yao, 2008; Aalto et al., 2001; Yang et al., 2016; Sun et al., 2018). In the lower troposphere, organic aerosols (OAs) account for about 20 %–90 % of fine aerosols (Jimenez et al., 2009; Kanakidou et al., 2005; Y. J. Zhang et al., 2007). The scattering and absorption characteristics of OAs have great influences on regional atmospheric chemistry and radiation forcing. In addition, OAs can interfere with cloud droplet nucleation and ozone formation by breaking the Earth's radiation balance, which may subsequently cause significant climate forcing (Ghan and Schwartz, 2007). OAs can also reduce visibility due to hygroscopicity and threaten human health, causing asthma, bronchitis, heart disease, cancer, and other diseases (Pope et al., 2009). All of the adverse effects mentioned above are closely related to the molecular composition and abundance of atmospheric organic aerosols (Kanakidou et al., 2005). Although organic aerosols in urban and rural regions (Simoneit et al., 1991b; Yang et al., 2016; L. J. Li et al., 2018), in forests (Alves et al., 2001), on mountains (Fu et al., 2008), on islands (Zhu et al., 2015b; Zheng et al., 2018), in coastal areas (Feng et al., 2007; Kang et al., 2017), and over remote oceans (Fu et al., 2011, 2013a; Ding et al., 2013) have been studied based on identification by gas chromatography–mass spectrometry (GC-MS), a comprehensive and profound understanding of OAs in fine aerosols is still limited due to inadequate data on air pollution in East Asia.
The Asian continent is an important source region of atmospheric aerosols that are emitted from biomass burning (BB), dust storms, and fossil fuel combustion, as well as those formed via the photooxidation of biogenic and anthropogenic volatile organic compounds (VOCs). The NCP is considered to be one of the areas with the largest amount of biomass burning and the highest anthropogenic emissions in the world (Andreae and Rosenfeld, 2008). Tianjin (39∘ N, 117∘ E), the largest coastal city in the NCP, is located along the Haihe River and is adjacent to both the Bohai Sea and the East China Sea (Fig. 1). Owing to its location, the city has suffered severe haze pollution along with rapid economic and industrial development over the past few decades. Fine particulate matter in the Tianjin atmosphere is present at high levels; thus, investigation of the chemical composition and seasonal variation of organic molecules is urgently needed.
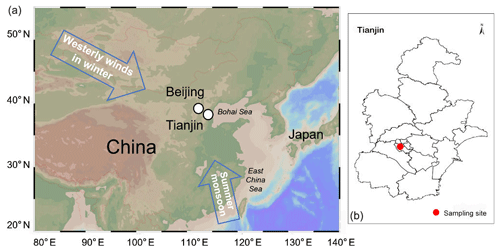
Figure 1Map showing the location of Tianjin city (a) and the sampling site (b) in the Nankai district, Tianjin (the map is from Ocean Data View).
At present, a few studies have investigated the sources of atmospheric aerosols in Tianjin by analysing ionic species, heavy metals, and organic and elemental carbon (Ho et al., 2012; Dong et al., 2013; Wang et al., 2015). Some studies have reported that secondary pollution, fossil fuel combustion, and soil and construction dust are the main sources of PM2.5 in Tianjin, based on chemical mass balance models (Li and Yu, 2010; Wei et al., 2012). Xu et al. (2019) reported that coal combustion, secondary inorganic aerosols, vehicle emissions, soil and road dust, and industrial emissions contributed 10.9 %, 44.4 %, 16.1 %, 13.1 %, and 9.7 % to PM2.5 in Tianjin during the period from 2013 to 2016 respectively. In Tianjin aerosols collected between 2016 and 2017, the contributions of OC and EC to PM2.5 were 17.5±13.5 % and 4.6±3.6 % respectively; during this period southerly wind directions were also dominant, which resulted in the arrival of more humid marine air masses in Tianjin (Ji et al., 2019). However, there have been few studies on organic aerosols in Tianjin at the molecular level. Tianjin is a typical coastal city, where organic aerosols may be influenced by both terrestrial and marine sources under the influence of land/sea breezes (Ding et al., 2004). Therefore, it is necessary to study the molecular composition of atmospheric organic aerosols in this region, in order to develop an in-depth understanding of the pollution characteristics and sources of atmospheric organic aerosols in coastal megacities.
In this study, we collected fine aerosol samples in urban Tianjin during the winter of 2016 and the summer of 2017. A total of 10 organic compound classes (79 organic species) were identified, including aliphatic lipids, sugars compounds, and biogenic and anthropogenic secondary organic aerosol (SOA) tracers. To better understand the primary emission sources and formation via photooxidation, the contributions of different sources to organic aerosols in Tianjin were evaluated using tracer-based methods. The diurnal variations in organic aerosols under the apparent influence of the land/sea breeze circulation were also discussed. Our findings are expected to enrich the database on the chemical characterization of organic aerosols in East China.
2.1 Sample collection
Wintertime sampling was performed on the rooftop (approximately 20 m above ground level) of a teaching building on the Weijinlu Campus of Tianjin University (39.11∘ N, 117.17∘ E) in urban Tianjin (Fig. 1) from 10 November to 23 December 2016. Daytime sampling was undertaken from 08:00 to 20:00 LT (local time), whereas night-time sampling was carried out from 20:00 to 08:00 LT. Summertime sampling was performed from 22 May to 22 June 2017 (07:00 to 19:00 LT for daytime and 19:00 to 07:00 LT for night-time). A high-volume air sampler (Tisch TE-PM2.5 HVP-BL) was used for sampling at a flow rate of 1.0 m3 min−1. Aerosol samples were collected onto quartz fibre filters (Pallflex 2500QAT-UP), which were precombusted (450 ∘C, 6 h) to remove potential contamination from organics. Field blank filters were also collected during both seasons. After collection, the samples were wrapped in precombusted aluminium foil and were stored in the dark at −20 ∘C until analysis. In total, 85 and 60 samples were collected in winter and summer respectively.
2.2 Sample extraction and derivatization
A portion of each filter sample with the diameter of 24 mm was cut and ultrasonically extracted with chloromethane/methanol (2:1, v∕v) for 10 min; this was repeated three times at room temperature. Quartz wool packed into a Pasteur pipette was employed to filter the respective solvent extracts, and was then concentrated using a rotary evaporator and dried using pure nitrogen gas. A mixture of 50 µL of N,O-bis-(trimethylsilyl)trifluoroacetamide (BSTFA) and 1 % trimethylsilyl chloride containing 10 µL of pyridine was then added and reacted with the extracts at 70 ∘C for 3 h in order derivatize polar groups (e.g. COOH and OH) into the corresponding trimethylsilyl (TMS) esters and ethers (Schauer et al., 1996; Simoneit et al., 2004c; Fu et al., 2008). Finally, 40 µL of n-hexane-containing internal standards (C13 n-alkanes, 1.43 ng µL−1) was added prior to gas chromatography–mass spectrometry (GC-MS) analysis. Field and laboratory blank filters were treated as real samples and utilized for quality assurance and quality control.
2.2.1 Gas chromatography–mass spectrometry determination
An Agilent model 7890A GC equipped with a 5975C mass selective detector was applied to identify and quantify organic compound classes. A split/splitless injector and a DB-5MS fused silica capillary column (30 m×0.25 mm i.d. and 0.5 µm film thickness) were equipped. The samples in the fused silica capillary column were analysed using the following GC temperature programme: 50 ∘C for 2 min, increasing to 120 ∘C at 15 ∘C min−1, before increasing to 300 ∘C at 5 ∘C min−1, and finally being held at 300 ∘C for 16 min. The carrier gas was helium. The MS detection was undertaken in electron ionization (EI) mode at 70 eV, scanning from 50 to 650 Da. Most of the recoveries for authentic standards or surrogates were over 80 %. The quality and quantity of a single compound were acquired using the ChemStation software. Moreover, authentic standards were employed to achieve GC-MS response factors. The results in this study were corrected for the field blanks, but not for the recoveries.
2.2.2 OC and EC determination
Concentrations of OC and EC were measured using a thermal/optical carbon analyser (model RT-4, Sunset Laboratory Inc., USA). The analytical errors were detected within ±10 % via a duplicate analysis of each filter. In winter, the blank levels were in the ranges of 1.52–2.84 and 0–0.03 µgC for OC and EC respectively. The summertime ranges of blank levels were 1.17–1.50 and 0 µgC for OC and EC respectively.
2.2.3 Calculated methods of POC and SOC contributions
In this study, the contributions of POC and SOC to total OC were evaluated based on organic tracer method. An experimentally derived factor of 13 pg C per spore was used to calculate the contribution of fungal spores to OC (Bauer et al., 2008). Plant debris was evaluated using the tracer of cellulose and an experimentally derived factor (Puxbaum and Tenze-Kunit, 2003). The tracer mass fraction (fSOC) factors of 0.155±0.039, 0.231±0.111, and 0.023±0.005 for isoprene, α-pinene, and β-caryophyllene respectively were applied to evaluate the contributions of BSOAs to OC (Kleindienst et al., 2007).
3.1 Meteorological conditions and air quality
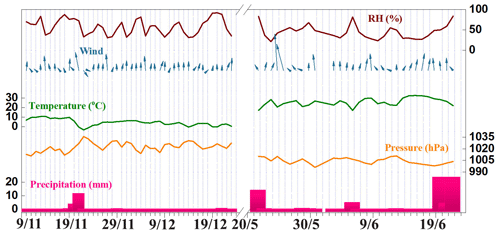
Air quality data including AQI, PM2.5, and quality grade are shown in Table S7 in the Supplement, and are available from the Chinese air quality online monitoring and analysis platform website. The variations in meteorological conditions and the concentrations of ambient PM2.5 during the sampling periods are presented in Fig. 2. Atmospheric pressure (P), temperature (T), and relative humidity (RH) fluctuated obviously in the winter of 2016, whereas they were relatively stable in the summer of 2017. The ambient T ranged from −3.26 to 11.8 ∘C (5.05 ∘C; please note that values displayed in parentheses in the following are average values) at daytime and from −3.56 to 9.12 ∘C (3.53 ∘C) at night in winter, whereas they were 17.3–34.8 ∘C (27.8 ∘C) at daytime and 16.0–30.4 ∘C (23.4 ∘C) at night in summer. The average P values were 1023±6.23 hPa at daytime and 1023±5.51 hPa at night in winter and 1004±4.24 hPa at daytime and 1004±4.18 hPa at night in summer. The wintertime RH values were in the ranges of 19.6 %–89.4 % (53.8 %) at daytime and 34.5 %–96.4 % (60.9 %) at night, whereas the summertime values were 17.4 %–83.7 % (39.0 %) at daytime and 24.8 %–83.9 % (50.2 %) at night. The levels of PM2.5 during the sampling periods were in the ranges of 15–290 µg m−3 (124 µg m−3), which were much higher than the summertime levels of 12–73 µg m−3 (42.9 µg m−3). It is interesting to note that the diurnal variations in RH were similar to the pattern of PM2.5, especially in winter, which may be attributed to the large percentage of secondary inorganic aerosols (SNA; including , , and ) in PM2.5 (Tao et al., 2017). SNAs are hygroscopic components that can cause quick heterogenic reactions under high-RH conditions (Zheng et al., 2015; Xu et al., 2017). The levels of PM2.5 showed high concentrations on 30 November and 4, 12, 18, and 20 December in 2016 and on 27–28 May as well as 14 and 18 June in 2017 (Fig. 2), relative to the sampling concentrations on the surrounding days. The wind direction (WD) at the sampling site was mainly from the south and southeast. Four rainfall events occurred during sampling periods: 20–22 November 2016, 21–22 May 2017, and 5–6 and 20–22 June 2017. The PM2.5 concentrations decreased dramatically during the rain events.
3.2 Molecular compositions of fine organic aerosols and seasonal variations
3.2.1 n-Alkanes
The abundances and seasonal variations of n-alkanes during the two seasons are shown in Fig. 3a. Concentrations of n-alkanes (C18-C35) were 343±227 ng m−3 (daytime) and 499±307 ng m−3 (night-time) in winter, which were roughly 2–3 times higher than the summer average loadings of 141 ng m−3 during both day- and night-time. In general, the molecular distributions of n-alkanes for most samples were characterized by an odd carbon number predominance with a maximum at C23 (Fig. 3b) in winter versus high values at C27 and C29 in summer (Fig. 3c). The carbon preference index (CPI; concentration ratios of odd carbon to even carbon n-alkanes) ratios for C18–C35 n-alkanes of all samples were calculated, which is often used to identify the contributions of anthropogenic and biogenic sources (Simoneit, 1986). In winter, the CPIs were 1.21±0.11 at daytime and 1.19±0.09 at night, which is comparable to those reported in Beijing and other urban aerosols in China (1.0±0.43) (Wang et al., 2006). The average CPIs were 1.39±0.40 at daytime and 1.36±0.44 at night in summer. The CPIs of terrestrial higher plant waxes are usually ∼5–10, whereas CPIs close to unity are attributed to marine sources and/or petroleum residues (Simoneit et al., 1991a; Hsu et al., 2006). Such molecular distributions indicate that aerosols in Tianjin may be mainly derived from the incomplete combustion of fossil fuels/petroleum residue and/or marine sources, which tend to have similar CPIs in both seasons.
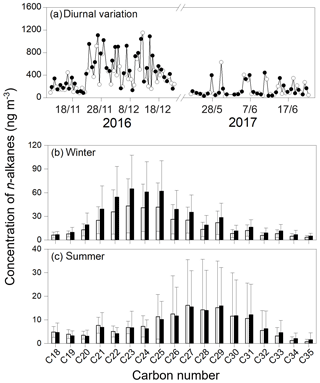
Figure 3Temporal variations (a) and molecular distributions of n-alkanes during both winter (b) and summer (c) in Tianjin (white and black represent day- and night-time respectively).
High-molecular-weight n-alkanes (HMWalk; C25–C36) are mainly derived from terrestrial higher plant waxes, in which C27, C29, and C31 are the dominant species. Low-molecular-weight n-alkanes (LMWalk; <C25) are usually emitted from biomass burning and fossil fuel combustion (Kawamura et al., 2003b; Freeman and Collarusso, 2001). The ratios of low-molecular-weight to high-molecular-weight n-alkanes (LMW ∕ HMWalk) were 1.03±0.30 at daytime and 1.04±0.32 at night in winter and 0.83±0.50 at the daytime and 0.56±0.32 at night in summer, and indicate more important contributions from biomass burning and fossil fuel combustion in winter than in summer. In winter, the concentrations of both LMWalk and HMWalk at night were higher than those during the daytime (Fig. 3b and Table S1 in the Supplement), which may be related to enhanced anthropogenic activities (e.g. house heating) and the lower nocturnal boundary layer height. However, the concentrations of LMWalk were higher at daytime (39.1±14.1 ng m−3) than at night (34.9±23.3 ng m−3) in summer (Fig. 3c, Table S1). A distribution such as this might be due to the significant land/sea breeze circulation, which could bring large amounts of terrestrial higher plant waxes to Tianjin at night and transport marine organic matter to the mainland during the day. The percentage of wax Cn is the contribution of biogenic n-alkane that is derived from high plant waxes (Ren et al., 2016). On average, the plant wax n-alkanes (WNA; C25–C34) accounted for 10.1 % of total homologues during the day and 9.01 % at night in winter, which is similar to those in summer (average contributions of 10.2 % at daytime and 9.91 % at night; Table S2), indicating that higher plant waxes made a minor and stable contribution to n-alkanes in both seasons.
3.3 n-Fatty acids
The atmospheric abundances of and seasonal variations in fatty acids (C12–C32) in Tianjin aerosol samples are shown in Fig. 4a and Table S1, including two unsaturated fatty acids (palmitoleic acid (C16:1) and oleic acid (C18:1)). Molecular distributions of saturated fatty acids showed a strong even carbon number predominance with two maxima at C16:0 and C18:0 in both winter and summer (Fig. 4b, c). A pattern such as this is similar to other urban aerosols in China (Zhao et al., 2014), India (Fu et al., 2010b), and the USA (Schauer et al., 2002), as well as in mountain aerosols (Kawamura et al., 2003b; Fu et al., 2011). The CPI (concentration ratios of even carbon to odd carbon for C20–C30 fatty acids) values ranged from 1.52 to 8.59 (3.09) during the daytime and from 0.29 to 4.11 (on average 2.53) at night in summer (Table S2). The average CPI values were similar to the daytime (2.96) and night-time (2.62) averages in winter. Moreover, the CPIs of the two seasons were slightly lower than or comparable with marine aerosols over the Arctic Ocean (1.9–8.0, 4.4 on average), indicating that biogenic emissions made important contributions in both seasons (Fu et al., 2013b).
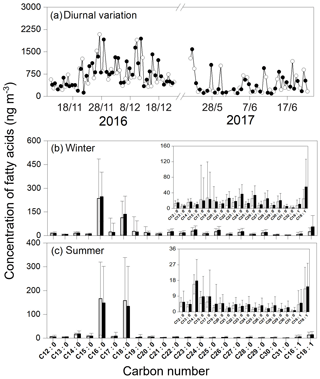
Figure 4Temporal variations (a) and molecular distribution of fatty acids during the wintertime (b) and summertime (c) in Tianjin (white and black represent day- and night-time respectively). The inset figures in (b) and (c) are the molecular distributions of fatty acids excluding C16:0 and C18:0.
In this study, the total concentrations of both saturated and unsaturated fatty acids were 666±418 ng m−3 (daytime) and 778±448 ng m−3 (night-time) in winter, and 410±354 ng m−3 (daytime) and 387±340 ng m−3 (night-time) in summer. High-molecular-weight fatty acids (HMWfat, ) are mainly derived from terrestrial higher plant waxes (Kawamura et al., 2003a), and low-molecular-weight fatty acids (LMWfat, ) have multiple sources such as vascular plants, microbes, cooking emissions, and marine phytoplankton (Fu et al., 2008; Cox et al., 1982). Biomass burning is also a source of fatty acids (X. Y. Zhang et al., 2007; Fu et al., 2012). In winter, the overall concentrations of saturated LMWfat and HMWfat were 442±353 and 191±132 ng m−3 during daytime, which were lower than those (477±283 and 234±156 ng m−3) at night. During the summertime period, the concentration of HMWfat (3.98–64.6, 27.0 ng m−3) during the daytime was lower than that (0.68–198, 35.9 ng m−3) at night, whereas the daytime concentrations of LMWfat (51.0–1260, 366 ng m−3), which were affected by land/sea breeze circulation, were higher than those (77.0–1556, 332 ng m−3) at night. Therefore, the average ratios of LMW ∕ HMW fatty acids are used to evaluate the relative contributions of terrestrial and marine sources to the abundance of fatty acids in ambient aerosols in Tianjin (Table S2). In winter, the average ratios of saturated LMW ∕ HMW fatty acids were 3.35 (daytime) and 2.77 (night-time), whereas the ratios were much higher in summer at 15.2 (daytime) and 19.0 (night-time). Such patterns suggest that the aerosols were largely influenced by marine air masses in summer, and tended to have higher LMW ∕ HMW ratios, whereas the distributions in winter were possibly associated with enhanced anthropogenic activities (e.g. biomass burning) from the mainland and the low nocturnal boundary layer height.
Unsaturated fatty acids are reported to be directly emitted from multiple sources such as the leaf surfaces of plants (Rogge et al., 1993), wood combustion (Fine et al., 2001), meat charbroiling (Nolte et al., 1999), and marine biota (Fu et al., 2013a; Kawamura and Gagosian, 1987). Moreover, unsaturated fatty acids can be rapidly oxidized by ozone, H2O2, or OH radicals (Kawamura and Gagosian, 1987); therefore, they can be used to study the reactivity and ageing processes of atmospheric aerosols (Rudich et al., 2007). In winter, the average ratios were 0.10 at daytime and 0.28 at night-time, and 0.08 and 0.20 in summer. The low daytime levels in both seasons suggest that unsaturated fatty acids undergo photochemical degradation during the daytime, which also implies that the secondary organic aerosols (SOAs) maybe ubiquitous during both winter- and summertime in Tianjin. C16:0 and C18:0 were focused upon as these two species have the most abundant concentrations, and the ratio is a useful tool for source identification of fatty acids. Ratios lower than 0.25 indicate that fatty acids are mainly derived from foliar vegetation combustion, waxy leaf surface abrasions, and wood smoke; ratios ranging from 0.25 to 0.5 infer that fatty acids may come from the car and/or diesel truck exhaust; and those in the range from 0.5 to 1.0 suggest that cooking emissions and paved or unpaved road dust make a contribution to fatty acids (Rogge et al., 2006). In winter, the ratios in aerosols were about 0.55 at both day- and night-time, which are lower than the values in summer (0.77 and 0.78 for day- and night-time respectively); this implies an intense input from anthropogenic activities such as the incomplete combustion of fossil fuels and biomass burning in winter, whereas fatty acids may be largely attributed to the emissions of cooking and/or vehicles as well as road dust in summer.
3.3.1 n-Alcohols
The abundances of and seasonal variations in normal fatty alcohols in organic aerosols are shown in Fig. 5a. n-Alcohols (C12–C31) were detected in the aerosol samples with concentrations of 1310±811 ng m−3 (daytime) and 1520±1010 ng m−3 (night-time) in winter and 621±367 ng m−3 (daytime) and 572±438 ng m−3 (night-time) in summer; these concentrations were apparently higher than the concentrations of n-alkanes and fatty acids. The molecular distributions showed strong even carbon number predominance, particularly at C16 and C18 (Fig. 5b, c). High-molecular-weight (HMWalc, >C19) n-alcohols are mainly derived from higher plant waxes and biomass burning (Wang et al., 2006). Low-molecular-weight (LMWalc, C12-C19) n-alcohols are related to marine and soil microbes (Fu et al., 2008). The total concentrations of LMWalc and HMWalc were in the respective ranges of 223–2830 ng m−3 (850 ng m−3) and 84.8–1400 ng m−3 (455 ng m−3) during the daytime, which were lower than those of 142–2910 ng m−3 (972 ng m−3) and 92.2–1730 ng m−3 (549 ng m−3) at night in winter respectively. In contrast, the concentrations of LMWalc (89.0–1320, 506 ng m−3) and HMWalc (28.7–238, 115 ng m−3) during the daytime were higher than those (139–1627, 467 and 19.2–474 ng m−3, 105 ng m−3 respectively) at night in summer (Fig. 5a, Table S1). Compared with HMWalc, the concentrations of LMWalc were significantly higher during the daytime than those at night, which may be due in part to the more significant sea breezes during the daytime and the land breezes at night. Therefore, we infer that the fatty alcohols in winter may mainly be derived from biomass burning and soil resuspension particles, whereas the contributions of marine/biogenic emission and biomass burning can possibly explain the molecular distribution of fatty alcohols in summertime aerosols.
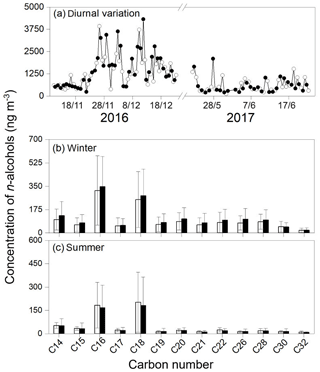
Figure 5Temporal variations (a) and molecular distributions of n-alcohols during wintertime (b) and summertime (c) in Tianjin (white and black represent day- and night-time samples respectively).
The relative abundances (%) of HMWalk, HMWfat, and HMWalc in the Tianjin aerosols are illustrated in a triangular diagram (Fig. 6). The average abundances of HMWalc were 54.5 % (wintertime) and 44.6 % (summertime), and they were the most dominant species among aliphatic lipids. The percentage of HMWalk was lower in winter (22.5 %) than in summer (42.5 %). The relative abundances of HMWalk, HMWfat, and HMWalc in the aerosols collected over the East China Sea (Kang et al., 2017), on Chichi-Jima Island in the northwest Pacific (Kawamura et al., 2003b), at Mt. Tai (Fu et al., 2008), and in urban Beijing (Ren et al., 2016) are plotted as categories A, B, C, and D respectively. It is worth noting that the results from this study overlap with the four other categories, which indicates that the aerosols may have similar source contributions to some extent and also highlights that the coastal city of Tianjin is influenced by a mixture of terrestrial and marine air masses.
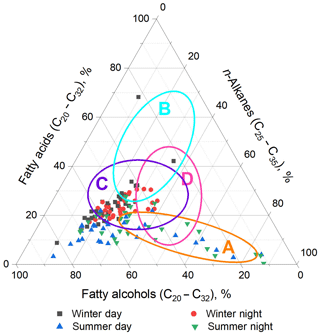
Figure 6Triangular plots of the relative abundances of biomarkers detected in Tianjin aerosols during the wintertime and summertime. Three main terrestrial plant waxes, including n-alkanes (C25-C35), fatty acids (C20-C32), and fatty alcohols (C20-C32), are represented by four different shaped points. Categories A and B are marine aerosols that were collected over the East China Sea (Kang et al., 2017) in summer and on Chichi-Jima Island in the western North Pacific from April 1990 to November 1993 respectively (Kawamura et al., 2003a). Category C represents mountain aerosols from Mt. Tai, China, in summer (Fu et al., 2008), and category D represents urban aerosols from Beijing in winter (Ren et al., 2016).
It was found that most of the wintertime data overlapped with aerosols collected at Mt. Tai (category C), and a fraction of samples also fell into category D that represents the Beijing aerosols. Fu et al. (2008) reported that the field burning of wheat straw largely contributed to the Mt. Tai aerosols, which could be further transported to the Pacific Ocean under the influence of westerly winds from the mainland. The Beijing aerosols in category D were significantly affected by incomplete fossil fuel combustion and biomass burning as well as biogenic emissions (Ren et al., 2016). However, most of the summertime aerosols in Tianjin fell into category A, suggesting that they may share similar sources with aerosols collected over the East China Sea (Kang et al., 2017), which may be significantly influenced by biogenic/marine emissions (under the marine air masses) and BB via long-range transport.
3.3.2 Molecular distributions of sugars and sugar alcohols
A total of 14 sugar compounds including 3 anhydrosugars, 5 primary saccharides, and 6 sugar alcohols identified in this study (Table S1) are water-soluble, and are known to contribute to water-soluble organic carbon (WSOC) (Graham et al., 2003; Elbert et al., 2007; Fu et al., 2008). In addition, they can affect aerosol hygroscopicity (Mochida and Kawamura, 2004; Fu et al., 2008) and regulate climate to some extent (Kanakidou et al., 2005). The average concentrations of total sugars were 371±208 ng m−3 (daytime) and 496±247 ng m−3 (night-time) in winter and 61.2±21.2 ng m−3 (daytime) and 96.9±94.0 ng m−3 (night-time) in summer.
Levoglucosan, a dominant tracer of biomass burning (Graham et al., 2002; Sheesley et al., 2003; Hays et al., 2005; Iinuma et al., 2007; Fu et al., 2008), was the most abundant compound among anhydrosugars and total sugars, with average concentrations of 205±122 ng m−3 (daytime) and 296±153 ng m−3 (night-time) in winter and 12.8±6.97 ng m−3 (daytime) and 34.4±46.0 ng m−3 (night-time) in summer. The contribution of biomass burning was much more significant in winter, especially at night in both summer or winter. Levoglucosan has two isomers, namely galactosan and mannosan, which were detected in all aerosol samples (Fig. 7, Table S1). These anhydrosugars are formed via the pyrolysis of cellulose/hemicellulose in different types of biomass such as grasses (Iinuma et al., 2007), woods (Graham et al., 2002), and agricultural residues including wheat (Fu et al., 2008) and rice straw (Sheesley et al., 2003). These three anhydrosugars showed similar seasonal patterns (Fig. 7a, b, c) with significantly higher wintertime concentrations compared with summer.
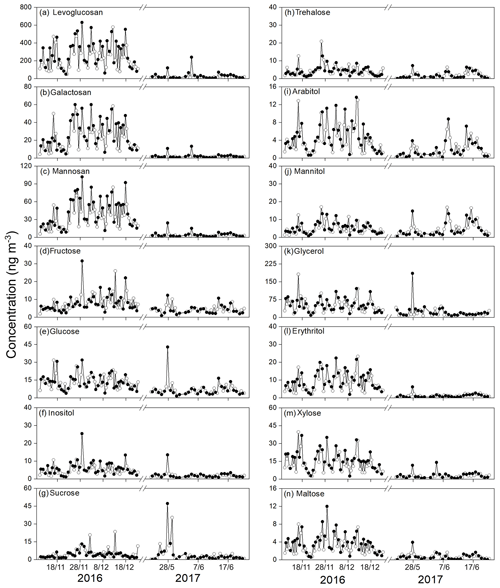
Figure 7Temporal variations in the concentrations of saccharides detected in Tianjin aerosols (white and black represent day- and night-time respectively).
The ratios of levoglucosan to mannosan (L ∕ M) and mannosan to galactosan (M ∕ G) were applied to discriminate between different categories of biomass burning. Figure 8 shows the isomer ratios of crop residues, and soft and hard wood from a number of regions in different countries that have been reported in other literature. All of the values from previous studies were related to PM2.5 aerosol samples. Average L ∕ M ratios were reported to be in the ranges of 3.0–5.80, 12.9–35.4, and 40.0–41.6 for smoke emitted by the burning of softwood, hardwood, and crop residue respectively (Sheesley et al., 2003; Fine et al., 2004; Oros et al., 2006; Engling et al., 2006). In addition, the average ranges of M ∕ G ratios were reported to be 3.60–7.0, 1.2–2.0, and 0.30–0.60 for the burning of softwood, hardwood, and crop residue respectively (Sheesley et al., 2003; Fine et al., 2004; Oros et al., 2006; Engling et al., 2006). The relative contributions of levoglucosan and mannosan in aerosols can be used to indicate the apportionment of cellulose and hemicellulose in biomass fuels. Low M ∕ G values suggest that the smoke may be mainly derived from the burning of biomass briquettes, crop straw, and grasses (Sheesley et al., 2003; Oros et al., 2006; Fu et al., 2008). In this study, L ∕ M ratios (4.88–19.8, 7.38) were high and M ∕ G ratios (1.0–5.51, 1.59) were low in winter, whereas the ranges of summertime aerosols were found to be 2.74–15.8 (5.68) and 1.15–2.84 (2.12) for L ∕ M and M ∕ G respectively. These results suggest that the soft- and hardwood are the main types of biofuels used in both seasons in Tianjin, and that the use of hardwood and/or crop residue was enhanced in winter.
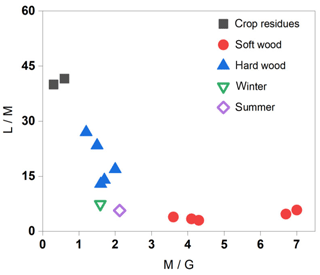
Figure 8Scatter plot of the L ∕ M and M ∕ G ratios of samples during winter- and summertime in this study as well as ratios from different sources, including crop residues, softwood, and hardwood, in existing literature (Sheesley et al., 2003; Fine et al., 2004; Oros et al., 2006; Engling et al., 2006).
Primary saccharides (fructose, glucose, xylose, sucrose, and trehalose) with substantially similar seasonal distributions (Fig. 7d–h) have been widely employed to indicate the sources of the resuspension of surface soils and unpaved road dust containing biological material (Simoneit et al., 2004a; Fu et al., 2008). The total concentrations of primary saccharides were 46.8±20.9 ng m−3 at daytime and 49.9±23.0 ng m−3 at night-time in winter and 20.1±11.1 ng m−3 at daytime and 21.2±21.5 ng m−3 at night-time in summer, showing no obvious diurnal variation. These results imply that the resuspension of surface soils and unpaved road dust containing biological material was quite a stable source of organic aerosols in Tianjin. We also determined six sugar polyols, consisting of arabitol, mannitol, glycerol, erythritol, xylose, and maltose. Glycerol was the most abundant sugar alcohol in both seasons. The average concentrations of glycerol were 49.8±32.0 ng m−3 (daytime) and 52.8±27.1 ng m−3 (night-time) in winter and 14.8±10.8 ng m−3 (daytime) and 25.0±31.9 ng m−3 (night-time) in summer. The levels of glycerol were notably enriched in winter, were higher than the concentrations of primary saccharides, and were positively correlated with levoglucosan (R2=0.73, p<0.01, N=85; Table S3), implying that there were potential emissions from biomass burning contributing to glycerol in winter. In summer, however, the low correlations (R2=0.32, ρ<0.05, N=60; Table S4) reported between glycerol and levoglucosan suggest that most of the glycerol was possibly derived from the metabolism of soil microorganisms (Simoneit et al., 2004b; L. J. Li et al., 2018) and photooxidation. Moreover, arabitol and mannitol were detected with similar seasonal trends (Fig. 7i–j), representing the contribution of fungal spores (Bauer et al., 2008; Zhu et al., 2016), which are prevalent in both land and marine areas (Elbert et al., 2007; Zhu et al., 2015a).
In Fig. 7, it is obvious that the concentrations of levoglucosan (a specific tracer of biomass burning), saccharides, and sugar alcohols were higher in winter than in summer. In addition, saccharides and sugar alcohols showed high levels, especially when the levoglucosan reached peaks in both seasons, implying that they may share similar sources to some extent. To verify the contribution of biomass burning to levoglucosan and sugar alcohols, we downloaded the fire maps for winter and summer during the sampling periods (Fig. S1). It can be clearly seen that there was high anthropogenic activity in winter (Fig. S1b). It is well known that the combustion of fossil fuels and biofuels is widely used for house heating in China in winter. Thus, biomass burning could contribute to levoglucosan and sugar alcohols. In summer, there were relatively dense fire spots distributed across the North China Plain (NCP) and in some southern agricultural provinces, such as Jiangsu, Anhui, Henan, and Shandong (Fig. S1a). Fu et al. (2008) reported that there was large-scale burning of wheat straw across the country during May–June. Meanwhile, the wind direction was mainly southerly during winter- and summertime in Tianjin (Fig. 2). Therefore, in addition to the contribution of local biomass burning, the southern wind carried a large amounts of biomass burning particulate matter from the NCP and the southern agricultural provinces to Tianjin, which could be a source of levoglucosan and sugar alcohols.
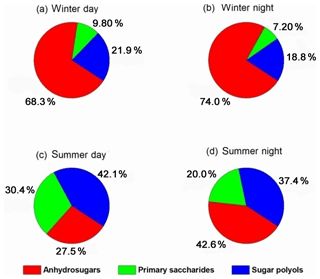
In this study, we also calculated the contributions of different saccharides to total sugars. It was found that the average percentages of anhydrosugars to total sugars (Table S2) were 0.67±0.05 (daytime) and 0.73±0.05 (night-time) in winter, which were roughly 3 times higher than those (0.27±0.08 during the daytime and 0.37±0.15 at night) in summer. In contrast, the percentages of primary saccharides and the two main tracers of fungal spores (arabitol and mannitol) had average ratios of 0.16±0.04 (daytime) and 0.13±0.02 (night-time) in winter, which were about 3 times lower than those of summertime aerosols (0.43±0.14 during the daytime and 0.30±0.11 at night). Meanwhile, the contributions of anhydrosugars were high at night, especially in winter, while a large proportion of primary saccharides and sugar alcohols were identified in summer, especially during the daytime (Figs. 9, 10, Table S2). These results suggest that biomass burning made a significant contribution in winter, accounting for 68.3 % and 74.0 % of total sugar sources for the day- and night-time respectively, whereas the summertime aerosols were apparently influenced by biological sources, especially during the daytime. Primary saccharides and sugar polyols were responsible for 30.4 % and 42.1 % of total sugars during the daytime and 20.0 % and 37.4 % of total sugars during night-time in summer respectively (Fig. 10).
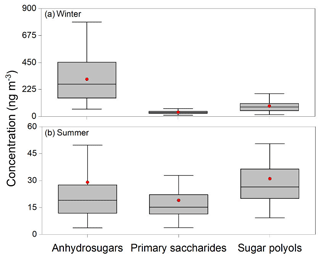
Figure 9Concentrations of sugars including anhydrosugars, primary saccharides, and sugar polyols in Tianjin aerosols. Boxes with error bars represent the 25th and 75th percentiles for each season. The solid lines and the red dots in the boxes represent the median values and average values respectively.
3.3.3 Biogenic SOA tracers
The biosphere–atmosphere hydrocarbon exchange is usually subject to global biogenic emission with an isoprene loading of 600 Tg yr−1 (Sharkey et al., 2007). The reactive double bonds of isoprene can easily be oxidized by oxidants such as OH, NO3, and O3 in the atmosphere. Six molecular markers were identified as isoprene SOA tracers, i.e. 2-methylglyceric acid (2-MGA), C5-alkene triols (cis-2-methyl-1,3,4-trihydroxy-1-butene, trans-2-methyl-1,3,4-trihydroxy-1-butene, and 3-methyl-2,3,4-tri-hydroxy-1-butene), and two 2-methyltetrols (MTLs, 2-methylthreitol and 2-methylerythritol) (Table S1). The wintertime concentrations of total isoprene SOA tracers were 1.03–10.6 ng m−3 (4.13 ng m−3) during daytime and 0.53–11.7 ng m−3 (4.54 ng m−3) at night, which were much lower than the summertime samples that had values of 3.63–83.9 ng m−3 (29.6 ng m−3) at daytime and 5.40–106 ng m−3 (25.3 ng m−3) at night. In winter, 2-MGA was the most abundant species, followed by C5-alkene triols and MTLs. However, the levels of 2-MGA were lower than the concentrations of C5-alkene triols and MTLs in summer.
The average concentrations of MTLs were detected as 0.43±1.17 ng m−3 (daytime) and 0.40±1.03 ng m−3 (night-time) in winter and 12.1±8.70 ng m−3 (daytime) and 10.6±11.2 ng m−3 (night-time) in summer. C5-alkene triols are specific isoprene SOA tracers under low-NOx conditions (Surratt et al., 2010), accompanying similar seasonal variations as 2-methyltetrols in summer (Fig. 11b, c), whereas 2-MGA is a further oxidation product of isoprene under high-NOx conditions (Surratt et al., 2010). The concentrations of 2-MGA were 2.13±1.81 ng m−3 (daytime) and 2.32±2.15 ng m−3 (night-time) in winter and 5.76±3.89 ng m−3 (daytime) and 4.27±3.98 ng m−3 (night-time) in summer. In general, C5-alkene triols are recognized as significant terrestrial tracers (Fu et al., 2014), and they showed a good correlation (R2=0.83, p<0.01, N=60, Table S5) with MTLs in summer, suggesting that they may have similar terrestrial sources such as biomass burning and higher plant waxes. However, there was no correlation in winter (Table S5), implying different sources of these two species in winter. Meanwhile, the average 2-MGA over MTLs (2-MGA/MTLs) ratios were 17.0 at daytime and 22.0 at night-time in winter, which are much higher than those (0.54 and 0.50 for day- and night-time respectively) in summer; the higher values in winter are possibly due to the higher concentrations of NOx and acidity on SOA formation (Surratt et al., 2007), which can also explain the phenomenon that the concentrations of 2-MGA were higher in winter than in summer.
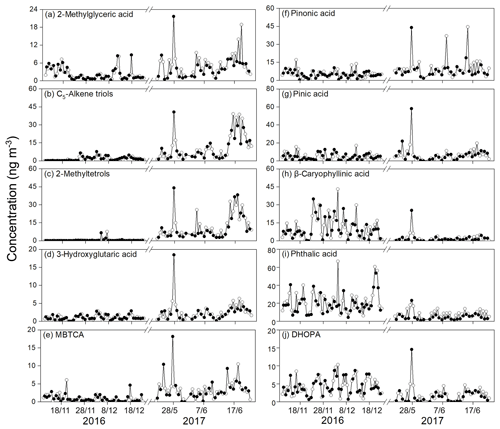
Figure 11Temporal variations in isoprene-, monoterpene-, β-caryophyllene-, naphthalene-, and toluene-SOA tracers in PM2.5 collected at Tianjin (white and black represent day- and night-time respectively).
Four oxidation products of α-∕β-pinene were detected in aerosol samples, including 3-hydroxyglutaric acid (3-HGA), 3-methyl-1,2,3-butanetricarboxylic acid (MBTCA), and pinonic and pinic acids. The total average concentrations of α-∕β-pinene SOA tracers were 12.2±7.69 ng m−3 (daytime) and 11.4±6.02 ng m−3 (night-time) in winter and 23.4±13.6 ng m−3 (daytime) and 22.4±23.7 ng m−3 (night-time) in summer. Positive correlations were found between isoprene and α-∕β-pinene SOA tracers as well as with T in summer (Table S6), whereas correlations in winter were weak, indicating that they may have similar sources or influencing factors such as T and RH in summer and a large number of different origins in winter.
Among the α-∕β-pinene SOA tracers, the most predominant compound was pinonic acid, followed by pinic acid. The concentration of 3-HGA was higher than MBTCA in winter, whereas it was opposite in summer (Table S1). Pinonic and pinic acids are first-generation products of α-∕β-pinene oxidation, which can be further photo-degraded into products such as MBTCA (Claeys et al., 2007). Therefore, the ageing level of α-∕β-pinene could be evaluated using values of pinonic and pinic acids to MBTCA: (pinonic + pinic) ∕ MBTCA (Gómez-González et al., 2012; Ding et al., 2014). In our work, ratios of (pinonic + pinic)/MBTCA were 17.6±15.9 (daytime) and 31.0±51.9 (night-time) in winter, which were much higher than the summertime aerosols (6.8±7.0 at daytime and 7.3±9.7 at night), suggesting that the summertime aerosols were more aged than those in winter due to strong photooxidation in summer.
Isoprene emissions are more susceptible to higher temperature with larger contributions in summer (L. J. Li et al., 2018). The ratio of isoprene tracers to α-∕β-pinene tracers (Riso∕pine) can also be used to evaluate the relative contributions of isoprene and α-∕β-pinene oxidation to biogenic SOA formation. In the present study, the average Riso∕pine ratios were 0.39 (daytime) and 0.52 (night-time) in winter, which were lower than summertime samples (1.85 at daytime and 1.77 at night), suggesting that isoprene oxidant products were more abundant in summer than those in winter. In addition, the ratios were higher than aerosols in Hong Kong (average 0.46) (Hu et al., 2008) during summertime, but lower than those of mountain aerosols at locations such as Mt. Tai, which has reported averages of 4.9 and 6.7 for the day- and night-time in summer (Fu et al., 2010a), and the Changbai Mountain region (3.7 at daytime) (Wang et al., 2008). This is reasonable because mountain aerosols contain more biogenic SOAs than urban aerosols.
β-Caryophyllene is one of the most abundant sesquiterpene compounds and is frequently reported in previous studies due to its high reactivity and relatively low vapour pressure (Fu et al., 2010b); it has been said to be emitted from plants such as pine and birch trees (Helmig et al., 2006; Duhl et al., 2008). β-Caryophyllinic acid is an ozonolysis or photooxidation product of β-caryophyllene (Jaoui et al., 2007), which was detected at concentrations of 10.7±9.33 ng m−3 (daytime) and 10.3±8.41 ng m−3 (night-time) in winter – 5 times higher than summertime aerosols (1.99±1.81 ng m−3 at daytime and 2.21±4.53 ng m−3 at night). Previous studies in Okinawa (Zhu et al., 2016), India (Fu et al., 2010b), and Beijing (L. J. Li et al., 2018) also reported that concentrations of β-caryophyllinic acid peaked in winter. There are large amounts of sesquiterpenes attached to woods and leaves due to their low volatility, which could be emitted from smoke during biomass burning, especially in winter (Zhu et al., 2016). The seasonal variation in the sesquiterpene SOA tracer was likely controlled by air masses from Southeast Asia, which carried more oxidized β-caryophyllinic acid via long-range transport (Fu et al., 2010b; Zhu et al., 2016). It is interesting to note that β-caryophyllinic acid, levoglucosan (a specific tracer of biomass burning), and 2,3-dihydroxy-4-oxopentanoic acid (DHOPA) had similar seasonal variations (Figs. 7a, 11h), with a high concentration peak occurring during a severe haze episode (28 May 2017). Moreover, there were strong positive correlations between these species in both seasons (Tables S5–6), which suggest that elevated β-caryophyllinic acid concentrations could be attributed to biomass burning during the haze periods (Fig. 11h).
3.4 Effects of meteorological conditions on organic tracers
Meteorological conditions play an important role in the temporal variations in organic aerosols. In winter, the wind directions (WD) were variable, with the predominance of southerly and southwesterly winds, and the relative humidity (RH) also changed abruptly. Stagnant meteorological conditions caused the frequent occurrence of haze events in the North China Plain. In general, the concentrations of biogenic SOA tracers were higher during the day than at night due to the high emissions of biogenic VOCs followed by photooxidation during the daytime. Fu et al. (2016) also reported that biogenic SOA tracer levels were higher during the daytime than at night-time during both winter- and summertime in Mumbai, India. In this study, the daytime concentrations of biogenic SOA tracers were also higher than those at night in summer, and universally lower those at night in winter (Fig. 11). Such results might be attributed to the land/sea breeze circulation in the coastal city of Tianjin. At night, land breezes from the Asian continent carry a large amount of terrestrial/anthropogenic organic matter.
A haze episode (Ep1) occurred on 28 May in 2017, when the wind direction changed from south-southwesterly to southeasterly (Fig. 2). Meanwhile, the levels of OC increased rapidly from 3.65 µg m−3 to 6.54 µg m−3 on this day, and then returned to previous levels due to a heavy rainfall event on 29 May. It is interesting to note that most of the organic tracers, especially the biogenic SOA tracers reached higher levels at night-time than during the daytime (Fig. 11). Fu et al. (2008) reported that southerly winds from provinces including Anhui, Jiangsu, Shandong, Henan, and Hebei, which experience agricultural waste burning, may carry more wheat straw combustion product emissions via long-range transport during the May to June period in summer. In contrast, another haze episode (Ep2) occurred on 19 June, when the WD changed from southwesterly to southeasterly (Fig. 2). The significantly high concentrations of most biogenic SOA tracers during the daytime were possibly due to large amounts of biogenic organic matter transported by the sea breezes. In addition, the effects of temperature cannot be ignored in this work. For example, the concentrations of arabitol and mannitol peaked on 9 June (Fig. 7i, j), which was in line with the high temperature on that day, and indicated that the increasing temperature enhanced the biological activity. Likewise, the phthalate esters also reached peaks, suggesting that elevated temperature promotes the evaporation of phthalate esters from plastic products (Fujii et al., 2003; Wang et al., 2006), which will be addressed in future work.
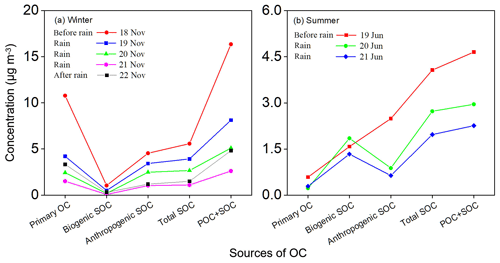
In this study, four rain events were recorded during the sampling periods. It is interesting to note that there were obvious differences between winter- and summertime samples in terms of the contributions of primary and secondary OC to total OC on rainy and fine days (Fig. 12). The concentrations of primary and secondary OC decreased dramatically on rainy days in both seasons, mainly due to the washout effect on pollutants. In winter, the levels of primary OC were higher than those of secondary OC (mainly from anthropogenic VOCs) before the rain events. Although the concentrations of primary and secondary OC decreased on rainy days, the level of primary OC underwent a substantial reduction (Fig. 12a). However, in summer, the concentrations of secondary OC (both biogenic and anthropogenic SOC) were significantly higher than primary OC before the rain event. We found that the summertime rain event had little impact on the levels of primary OC and biogenic SOC, but it decreased the anthropogenic SOC obviously. Such seasonal differences may be attributed to important and persistent sources such as fossil fuel combustion and biomass burning in the local regions in winter and biogenic VOC emissions in summer.
3.5 Source apportionment based on organic molecular markers
3.5.1 Contributions of BB, fungal spores, and plant debris to OC
OC concentrations detected in this study were in the ranges of 5.33–79.8 µg m−3 (23.7 µg m−3) in winter and 1.43–6.64 µg m−3 (3.78 µg m−3) in summer. The Asian summer monsoon may bring clean marine air masses to Tianjin and lower the atmospheric levels of OC in summer (Mao et al., 2017). In detail, the concentrations of BB-derived OC were the most abundant in winter (2.49±1.48 µg m−3 and 3.61±1.86 µg m−3 at day- and night-time respectively), and were significantly higher than those in summer (0.16±0.08 and 0.42±0.56 µg m−3 at day- and night-time respectively) based on the ratio of levoglucosan to OC (L ∕ OC) of 8.2 % (Andreae and Merlet, 2001; X. Y. Zhang et al., 2007). Although, the L ∕ OC ratio was just one of the experimental simulation results, we think it is reasonable in this study. Furthermore, there is plenty of literature that shows that L ∕ OC ratios are variable depending on the sources of biomass (e.g. straw and wood) and burning conditions. On average, the BB contribution to OC was 12.1 % (daytime) and 16.0 % (night-time) in winter and 4.14 % (daytime) and 9.62 % (night-time) in summer, which were roughly comparable to the values of 1.0 %–35 % (9.9 %) reported for a whole year in the nearby megacity of Beijing (Li et al., 2018).
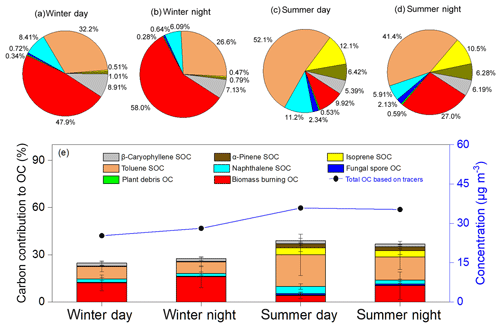
Mannitol and arabitol are generally employed to evaluate the numbers of fungal spores (Elbert et al., 2007; Bauer et al., 2008). This work uses the values of 1.7 pg mannitol per spore and 13 pg OC per spore (Bauer et al., 2008) in order to identify the contributions of fungal-spore-derived OC. Meanwhile, plant-debris-derived OC was estimated based on the relationship of glucose and plant debris as well as the OM ∕ OC ratio of 1.93 (Puxbaum and Tenze-Kunit, 2003). Here, the estimations based on molecular tracers indicate that fungal spores and plant debris have higher contributions to OC during summertime than in wintertime (Figs. 13a–b, 14) due to high biological activity in summer. The contributions of fungal-spore-derived OC were 0.88 % (daytime) and 0.79 % (night-time) in summer, which were lower than the values in Beijing (2.79 % in summer; L. J. Li et al., 2018) and much lower than values found for forest aerosols in Japan (22 % during the daytime and 45 % at night; Zhu et al., 2016) and in tropical rainforest aerosols on Hainan Island (12.1 %; Zhang et al., 2010). Plant-debris-derived OC accounted for the lowest proportion (0.22 %) of primary OC during both the day- and night-time in summer, which was lower than summertime aerosols in Beijing (1.05 %; L. J. Li et al., 2018).
Table 1Abundance of OC from primary sources – BB-derived OC, plant-debris-derived OC, fungal-spore-derived OC (µg m−3), and secondary formation (biogenic SOC and anthropogenic SOC) – and their contributions to OC (%) in the samples.
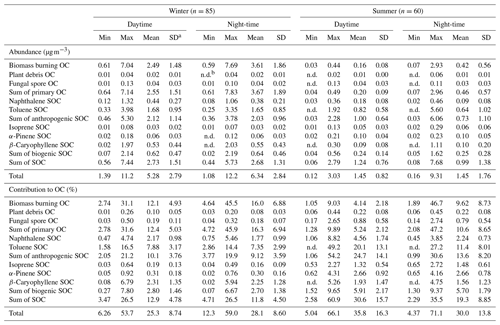
a SD refers to standard deviation.
b n.d. refers to not detectable. We define species below the limit of detection
(LOD) as n.d.; the LODs of the target organic compounds in this study
were
approximately 0.001–0.08 ng m−3.
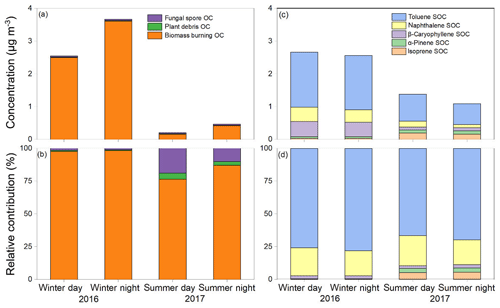
Figure 13(a) Average concentrations of fungal-spore-derived OC, plant-debris-derived OC, and BB-derived OC in PM2.5 from Tianjin. (b) Relative contributions of primary OC detected in this study. (c) Average concentrations of toluene SOC, naphthalene SOC, β-caryophyllene SOC, α-pinene SOC, and isoprene SOC in PM2.5 from Tianjin. (d) Relative contributions of SOC identified in this study.
3.5.2 Contributions of biogenic and anthropogenic VOCs
SOAs formed from biogenic and anthropogenic precursors are important contributors to PM2.5. It has been reported that global SOAs mostly originate from BVOCs, based on atmospheric modelling studies of SOA (Hallquist et al., 2009). Global BVOCs emissions can reach 760 TgC per year, from which isoprene, monoterpenes, and sesquiterpenes account for 70 %, 11 %, and 2.5 % respectively (Sindelarova et al., 2014). Anthropogenic SOCs from toluene and naphthalene were estimated from 2,3-dihydroxy-4-oxopentanoic acid (DHOPA) and phthalic acid respectively, with respective mass fractions of 0.0026 and 0.0199 as well as an OM ∕ OC value of 1.93 (Kleindienst et al., 2007; Fu et al., 2014). Vehicle emissions may be the main sources of toluene in Tianjin, and solvent usage in the electronic and chemical industries are also potential sources (Widiana et al., 2019; Fu et al., 2016). McFiggans et al. (2019) demonstrated that there is a substantial overestimation of SOA production due to the simple linear addition of SOA mass yields from the individual yields of components in a VOC mixture. The measurement uncertainties and personal errors, such as wall losses (Lee et al., 2006), and the accurate determination of the mass of semi-volatile materials should also be considered (Ehn et al., 2014; McFiggans et al., 2019).
For biogenic SOAs, isoprene and α-pinene SOCs were more abundant in summer, whereas β-caryophyllene contributed more to SOCs in winter; this may be related to different sources such as biomass burning and other factors including the volatility of organic compounds (Figs. 13c–d, 14). Similarly, the contributions of SOC derived from isoprene (4.47 % and 3.95 %) and α-pinene (2.56 % and 2.44 %) to OC during daytime and night-time were apparently elevated in summer (Table S1, Fig. 13c–d), whereas their contributions in winter were low (Fig. 14a, b). In contrast, the concentrations of β-caryophyllene SOC were high in winter (averages of 0.47 and 0.45 µg m−3), accounting for 1.89 % and 1.80 % of the OC at day- and night-time respectively, which were comparable values to those (1.95 % and 1.82 %) in summer.
The concentrations of anthropogenic SOCs were 2–5 times higher than those of biogenic SOCs in both seasons. The average concentrations of anthropogenic SOCs were 2.12 µg m−3 (daytime) and 2.03 µg m−3 (night-time) in winter, which were higher than the values of 1.0 µg m−3 (daytime) and 0.73 µg m−3 (night-time) in summer. Toluene SOC was predominant with concentrations of 1.68±0.95 µg m−3 and 1.65±0.85 µg m−3 for day- and night-time in winter respectively, and with low levels of 0.82±0.58 µg m−3 and 0.64±1.02 µg m−3 in summer. In addition, the levels of naphthalene SOCs were 0.44±0.27 µg m−3 (daytime) and 0.38±0.21 µg m−3 (night-time) in winter, and 0.18±0.08 µg m−3 (daytime) and 0.09±0.08 µg m−3 (night-time) in summer. The high anthropogenic SOC concentrations in winter may be attributed to elevated biomass/biofuel combustion. Although the concentrations of summertime aerosols were lower, the contributions of anthropogenic SOCs were higher (Table S1, Fig. 13). Anthropogenic SOCs contributed 10.1 % (daytime) and 9.12 % (night-time) of the total OCs in aerosols in winter, and 24.7 % (daytime) and 13.6 % (night-time) in summer. Anthropogenic SOCs in summer may not only be related to fossil fuel combustion, but also to increased plastic emissions in summer (Fujii et al., 2003; Simoneit et al., 2005; Wang et al., 2006; Kong et al., 2013), which warrants further study.
3.5.3 Total contributions of primary OC and SOC to PM2.5
The total average concentrations of primary OC were 2.55±1.51 µg m−3 (daytime) and 3.67±1.89 µg m−3 (night-time) in winter and 0.20±0.09 µg m−3 (daytime) and 0.46±0.57 µg m−3 (night-time) in summer, corresponding to 12.4 % and 16.3 % of OC for the day- and night-time in winter and 5.24 % and 10.6 % of OC in summer respectively. Additionally, BB-derived OC was detected as the most abundant primary source, followed by fungal spores and plant debris. SOCs including biogenic and anthropogenic sources were estimated to be 2.66±1.52 µg m−3 (daytime) and 2.56±1.26 µg m−3 (night-time) in winter and 1.38±0.81 µg m−3 (daytime) and 1.09±1.51 µg m−3 (night-time) in summer, accounting for 12.4 % and 11.3 % of OC during the day- and night-time in winter and 33.7 % and 21.8 % in summer respectively (Table 1, Fig. 14a–e).
Apparent differences in seasonal characteristics and diurnal variations in organic aerosols were observed between the two seasons in Tianjin. It is worth noting that the contributions of SOC to OAs in summer were roughly twice as high as those in winter, especially for the toluene SOC. Biomass burning OC and β-caryophyllene SOC were more abundant in winter, whereas fungal-spore- and plant-debris-derived OCs, as well as biogenic SOCs contributed more significantly in summer (Fig. 14e). These results are in accordance with previous studies in many megacities in China (Ding et al., 2017), including Beijing (L. J. Li et al., 2018). In total, the average contributions of primary and secondary OCs using the tracer-based methods discussed above were 24.8 % (daytime) and 27.6 % (night-time) in winter and 38.9 % (daytime) and 32.5 % (night-time) in summer. In addition, there are many other species that could contribute to OCs in PM2.5 such as aliphatic lipids, dicarboxylic acids, polycyclic aromatic hydrocarbons, and other complex compounds (e.g. proteins, amino sugars, and organosulfates) in the ambient atmosphere. GC-MS can only detect small molecules, which account for a small proportion of the total organic matter in the aerosols (Rogge et al., 1993). Thus, the realization of the full analysis of fine particles requires a combination of various analytical techniques such as 2D-GC-MS, HPLC-MS, and FT-ICR MS (Nozière et al., 2015), which are summarized in Table S8.
Atmospheric abundances, molecular compositions, and seasonal and diurnal variations in aliphatic lipids (n-alkanes, fatty acids, and fatty alcohols), saccharides, and biogenic and anthropogenic SOA tracers were investigated in fine aerosols collected in urban Tianjin in the winter of 2016 and the summer of 2017. Results demonstrated that biomass burning was the most abundant source in the winter, while anthropogenic origins among the tracers detected in this study were the predominant contributors to OCs in summer. By comparing the diurnal and seasonal patterns of organic tracers in winter and summer, we found that n-alcohols (1310 ng m−3 and 1520 ng m−3 for day- and night-time respectively) and n-fatty acids (average of 666 ng m−3 and 778 ng m−3 for day- and night-time respectively) were important organic molecular classes in winter, and the enhanced levels at night may be attributed to the elevated need for house heating as well as the lower nocturnal boundary layer heights.
Similarly, the dominant species detected in summer were also n-alcohols (average of 621 ng m−3 during the daytime and 572 ng m−3 at night) and fatty acids (410 ng m−3 during the daytime and 387 ng m−3 at night). In contrast to wintertime aerosols, most organic tracers in summer were more abundant during the daytime due to higher contributions from marine/biogenic sources from sea breezes when the east Asian monsoon prevailed in summer. Biogenic SOA tracers from isoprene and α-∕β-pinene oxidants and fungal-spore-derived tracers (arabitol and mannitol) made large contributions to organic aerosols in summer. The contributions of biogenic SOCs to OCs were in the range of 2.94 %–16.2 % (8.98 %) during the daytime and 1.48 %–22.2 % (8.21 %) at night, from which 4.47 % (daytime) and 3.95 % (night-time) were from isoprene, 2.56 % (daytime) and 2.44 % (night-time) were from α-pinene, 1.95 % (daytime), and 1.82 % (night-time) were from β-caryophyllene in summer. Fungal-spore-derived OC contributed 0.88 % and 0.79 % of aerosol OC for day- and night-time in summer respectively. Conversely, anthropogenic sources were abundant during both seasons. The fractions in summer were 24.7 % (daytime) and 13.6 % (night-time), which were roughly twice as high as in wintertime with values of 10.1 % and 9.12 % for the day- and night-time. Our study highlights that local emissions of primary organic aerosols, biogenic and anthropogenic precursors of secondary organic aerosols, and land/sea breezes and East Asian summer monsoon can affect the atmospheric loadings of organic aerosols in coastal regions of North China.
The dataset for this paper is available upon request from the corresponding author (fupingqing@tju.edu.cn).
The supplement related to this article is available online at: https://doi.org/10.5194/acp-20-117-2020-supplement.
PF and CQL designed this research. Laboratory measurements were performed by YF, LL, and SW. The paper was written by YF and PF with consultation from all coauthors.
The authors declare that they have no conflict of interest.
This research has been supported by the National Natural Science Foundation of China (grant no. 41625014).
This paper was edited by Aijun Ding and reviewed by three anonymous referees.
Aalto, P., Hameri, K., Becker, E., Weber, R., Salm, J., Makela, J. M., Hoell, C., O'Dowd, C. D., Karlsson, H., Hansson, H.C., Vakeva, M., Koponen, I. K., Buzorius, G., and Kulmala, M.: Physical characterization of aerosol particles during nucleation events, Tellus B, 53, 344–358, 2001.
Alves, C., Pio, C., and Duarte, A.: Composition of extractable organic matter of air particles from rural and urban Portuguese areas, Atmos. Environ., 35, 5485–5496, 2001.
Andreae, M. O. and Merlet, P.: Emission of trace gases and aerosols from biomass burning, Global Biogeochem. Cy., 15, 955–966, 2001.
Andreae, M. O. and Rosenfeld, D.: Aerosol-cloud-precipitation interactions. Part 1. The nature and sources of cloud-active aerosols, Earth-Sci. Rev., 89, 13–41, 2008.
Bauer, H., Claeys, M., Vermeylen, R., Schueller, E., Weinke, G., Berger, A., and Puxbaum, H.: Arabitol and mannitol as tracers for the quantification of airborne fungal spores, Atmos. Environ., 42, 588–593, 2008.
Chan, C. K. and Yao, X.: Air pollution in mega cities in China, Atmos. Environ., 42, 1–42, https://doi.org/10.1016/j.atmosenv.2007.09.003, 2008.
Claeys, M., Szmigielski, R., Kourtchev, I., van der Veken, P., Vermeylen, R., Maenhaut, W., Jaoui, M., Kleindienst, T. E., Lewandowski, M., Offenberg, J., and Edney, E. O.: Hydroxydicarboxylic acids: Markers for secondary organic aerosol from the photooxidation of α-pinene, Environ. Sci. Technol., 41, 1628–1634, 2007.
Cox, R. E., Mazurek, M. A., and Simoneit, B. R. T.: Lipids in Harmattan aerosols of Nigeria, Nature, 296, 848–849, 1982.
Ding, A., Zhao, W. M., Wang, T., and Li, Z.: Simulation of sea-land breezes and a discussion of their implications on the transport of air pollution during a multi-day ozone episode in the Pearl River Delta of China, Atmos. Environ., 38, 6737–6750, 2004.
Ding, X., Wang, X. M., Xie, Z. Q., Zhang, Z., and Sun, L. G.: Impacts of Siberian biomass burning on organic aerosols over the North Pacific Ocean and the Arctic: Primary and secondary organic tracers, Environ. Sci. Technol., 47, 3149–3157, 2013.
Ding, X., He, Q. F., Shen, R. Q., Yu, Q. Q., and Wang, X. M.: Spatial distributions of secondary organic aerosols from isoprene, monoterpenes, β-caryophyllene, and aromatics over China during summer, J. Geophys. Res.-Atmos., 119, 11877–11891, https://doi.org/10.1002/2014jd021748, 2014.
Ding, X., Zhang, Y. Q., and He, Q.: Significant increase of aromatics-derived secondary organic aerosol during fall to winter in China, Environ. Sci. Technol., 51, 7432–7441, https://doi.org/10.1021/acs.est.6b06408, 2017.
Dong, Z. W., Li, Z. Q., Wang, W. B., Li, K. M., and Zhou, P.: Characteristics of atmospheric dust deposition in snow on Glacier No. 4, Mt Bogeda, China, Environ. Earth Sci., 70, 1423–1433, https://doi.org/10.1007/s12665-013-2228-z, 2013.
Duhl, T. R., Helmig, D., and Guenther, A.: Sesquiterpene emissions from vegetation: a review, Biogeosciences, 5, 761–777, https://doi.org/10.5194/bg-5-761-2008, 2008.
Ehn, M., Thornton, J. A., Lleist, E., Sipilä, M., Junninen, H., Pullinen, I., Springer, M., Rubach, F., TIllmann, R., Lee, B., Lopez-Hilfiker, F., Andres, S., Acir, I.-H., Rissanen, M., Jokinen, T., Schobesberger, S., Kangasluoma, J., Kontkanen, J., Nieminen, T., Kurtén, T., Nielsen, L. B., Jørgensen, S., Kjaergaard, H. G., Canagaratna, M., Dal Maso, M., Berndt, T., Petäjä, T., Wahner, A., Kerminen, V.-M., Kulmala, M., Worsnop, D. R., Wildt, J., and Mentel, T. F.: A large source of low volatility secondary organic aerosol, Nature, 506, 476–479, 2014.
Elbert, W., Taylor, P. E., Andreae, M. O., and Pöschl, U.: Contribution of fungi to primary biogenic aerosols in the atmosphere: wet and dry discharged spores, carbohydrates, and inorganic ions, Atmos. Chem. Phys., 7, 4569–4588, https://doi.org/10.5194/acp-7-4569-2007, 2007.
Engling, G., Carrico, C. M., Kreldenweis, S. M., Collett, J. L., Day, D. E., Malm, W. C., Lincoln, E., Hao, W. M., Iinuma, Y., and Herrmann, H.: Determination of levoglucosan in biomass combustion aerosol by high-performance anion-exchange chromatography with pulsed amperometric detection, Atmos. Environ., 40, S299–S311, 2006.
Feng, Y. R., Wang, A. Y., Wu, D., and Xu, X. D.: The influence of tropical cyclone Melor on PM10 concentrations during an aerosol episode over the Pearl River Delta region of China: Numerical modeling versus observational analysis, Atmos. Environ., 41, 4349–4365, 2007.
Fine, P. M., Cass, G. R., and Simoneit, B. R. T.: Chemical characterization of fine particle emissions from fireplace ncombustion of woods grown in the northeastern United States, Environ. Sci. Technol., 35, 2665–2675, 2001.
Fine, P. M., Cass, G. R., and Simoneit, B. R. T.: Chemical characterization of fine particle emissions from the wood stove combustion of prevalent United States tree species, Environ. Eng. Sci., 21, 705–721, 2004.
Freeman, K. H. and Collarusso, L. A.: Molecular and isotopic records of C-4 grassland expansion in the late Miocene, Geochim. Cosmochim. Ac., 65, 1439–1454, 2001.
Fu, P. Q., Kawamura, K., Okuzawa, K., Aggarwal, S. G., Wang, G. H., Kanaya, Y., and Wang, Z. F.: Organic molecular compositions and temporal variations of summertime mountain aerosols over Mt. Tai, North China Plain, J. Geophys. Res.-Atmos., 113, D19107, https://doi.org/10.1029/2008JD009900, 2008.
Fu, P. Q., Kawamura, K., Kanaya, Y., and Wang, Z. F.: Contributions of biogenic volatile organic compounds to the formation of secondary organic aerosols over Mt. Tai, Central East China, Atmos. Environ., 44, 4817–4826, 2010a.
Fu, P. Q., Kawamura, K., Pavuluri, C. M., Swaminathan, T., and Chen, J.: Molecular characterization of urban organic aerosol in tropical India: contributions of primary emissions and secondary photooxidation, Atmos. Chem. Phys., 10, 2663–2689, https://doi.org/10.5194/acp-10-2663-2010, 2010b.
Fu, P. Q., Kawamura, K., and Miura, K.: Molecular characterization of marine organic aerosols collected during a round-theworld cruise, J. Geophys. Res.-Atmos., 116, D13302, https://doi.org/10.11029/12011JD015604, 2011.
Fu, P. Q., Kawamura, K., Chen, J., Li, J., Sun, Y. L., Liu, Y., Tachibana, E., Aggarwal, S. G., Okuzawa, K., Tanimoto, H., Kanaya, Y., and Wang, Z. F.: Diurnal variations of organic molecular tracers and stable carbon isotopic composition in atmospheric aerosols over Mt. Tai in the North China Plain: an influence of biomass burning, Atmos. Chem. Phys., 12, 8359–8375, https://doi.org/10.5194/acp-12-8359-2012, 2012.
Fu, P. Q., Kawamura, K., Chen, J., Charrière, B., and Sempéré, R.: Organic molecular composition of marine aerosols over the Arctic Ocean in summer: contributions of primary emission and secondary aerosol formation, Biogeosciences, 10, 653–667, https://doi.org/10.5194/bg-10-653-2013, 2013a.
Fu, P. Q., Kawamura, K., Usukura, K., and Miura, K.: Dicarboxylic acids, ketocarboxylic acids and glyoxal in the marine aerosols collected during a round-the-world cruise, Mar. Chem., 148, 22–32, https://doi.org/10.1016/j.marchem.2012.11.002, 2013b.
Fu, P. Q., Aggarwal, S. G., Chen, J., Li, J., Sun, Y. L., Wang, Z. F., Chen, H. S., Liao, H., Ding, A. J., Umarji, G. S., Patil, R. S., Chen, Q., and Kawamura, K.: Molecular markers of secondary organic aerosol in Mumbai, India, Environ. Sci. Technol., 50, 4659–4667, 2016.
Fu, X., Wang, S. X., Cheng, Z., Xing, J., Zhao, B., Wang, J. D., and Hao, J. M.: Source, transport and impacts of a heavy dust event in the Yangtze River Delta, China, in 2011, Atmos. Chem. Phys., 14, 1239–1254, https://doi.org/10.5194/acp-14-1239-2014, 2014.
Fujii, M., Shinohara, N., Lim, A., Otake, T., and Kumagai, K., and Yanagisawa, Y.: A study on emission of phthalate esters from plastic materials using a passive flux sampler, Atmos. Environ., 37, 5495-5504, 2003.
Ghan, S. J. and Schwartz, S. E.: Aerosol Properties and Processes: A Path from Field and Laboratory Measurements to Global Climate Models, B. Am. Meteorol. Soc., 88, 1059–1083, 2007.
Gómez-González, Y., Wang, W., Vermeylen, R., Chi, X., Neirynck, J., Janssens, I. A., Maenhaut, W., and Claeys, M.: Chemical characterisation of atmospheric aerosols during a 2007 summer field campaign at Brasschaat, Belgium: sources and source processes of biogenic secondary organic aerosol, Atmos. Chem. Phys., 12, 125–138, https://doi.org/10.5194/acp-12-125-2012, 2012.
Graham, B., Bracero, O. L. M., Guyon, P., Roberts, G. C., Decesari, S., Facchini, M. C., Artaxo, P., Maenhaut, W., Koll, P., and and Andreae, M. O.: Water-soluble organic compounds in biomass burning aerosols over Amazonia1. Characterization by NMR and GC-MS, J. Geophys. Res., 107, https://doi.org/10.1029/2001JD000336, 2002.
Graham, B., Guyon, P., Taylor, P. E., Artaxo, P., Maenhaut, W., Glovsky, M. M., Flagan, R. C., and Andreae, M. O.: Organic compounds present in the natural Amazonian aerosol: Characterization by gas chromatography-mass spectrometry, J. Geophys. Res.-Atmos., 108, 4766, https://doi.org/10.1029/2003JD003990, 2003.
Hallquist, M., Wenger, J. C., Baltensperger, U., Rudich, Y., Simpson, D., Claeys, M., Dommen, J., Donahue, N. M., George, C., Goldstein, A. H., Hamilton, J. F., Herrmann, H., Hoffmann, T., Iinuma, Y., Jang, M., Jenkin, M. E., Jimenez, J. L., Kiendler-Scharr, A., Maenhaut, W., McFiggans, G., Mentel, Th. F., Monod, A., Prévôt, A. S. H., Seinfeld, J. H., Surratt, J. D., Szmigielski, R., and Wildt, J.: The formation, properties and impact of secondary organic aerosol: current and emerging issues, Atmos. Chem. Phys., 9, 5155–5236, https://doi.org/10.5194/acp-9-5155-2009, 2009.
Hays, M. D., Fine, P. M., Geron, C. D., Kleeman, M. J., and Gullett, B. K.: Open burning of agricultural biomass: Physical and chemical properties of particle-phase emissions, Atmos. Environ., 39, 6747–6764, 2005.
Helmig, D., Ortega, J., Guenther, A., Herrick, J. D., and Geron, C.: Sesquiterpene emissions from loblolly pine and their potential contribution to biogenic aerosol formation in the Southeastern US, Atmos. Environ., 40, 4150–4157, 2006.
Ho, S. S. H., Ho, K. F., Lee, S. C., Cheng, Y., Yu, J. Z., Lam, K. M., Feng, N. S. Y., and Huang, Y.: Carbonyl emissions from vehicular exhausts sources in Hong Kong, J. Air Waste Manage., 62, 221–234, https://doi.org/10.80/10473289.2011.642952, 2012.
Hsu, S. C., Liu, S. C., Jeng, W. L., Chou, C. C. K., Hsu, R. T., Huang, Y. T., and Chen, Y. W.: Lead isotope ratios in ambient aerosols from Taipei, Taiwan: Identifying long-range transport of airborne Pb from the Yangtze Delta, Atmos. Environ., 40, 5393–5404, 2006.
Hu, D., Bian, Q., Li, T. W. Y., Lau, A. K. H., and Yu, J. Z.: Contributions of isoprene, monoterpenes, β-caryophyllene, and toluene to secondary organic aerosols in Hong Kong during the summer of 2006, J. Geophys. Res.-Atmos., 113, D22206, https://doi.org/10.1029/2008JD010437, 2008.
Iinuma, Y., Bruggemann, E., Gnauk, T., Muller, K., Andreae, M. O., Helas, G., Parmar, R., and Herrmann, H.: Source characterization of biomass burning particles: The combustion of selected European conifer, African hardwood, savanna grass, and German and Indonesian peat, J. Geophys. Res.-Atmos., 112, D08209, https://doi.org/10.1029/2006JD007120, 2007.
Jaoui, M., Lewandowski, M., Kleindienst, T. E., Offenberg, J. H., and Edney, E. O.: β-Caryophyllinic acid: An atmospheric tracer for β-caryophyllene secondary organic aerosol, Geophys. Res. Lett., 34, L05816, https://doi.org/10.1029/2006GL028827, 2007.
Ji, D., Gao, M., Maenhaut, W., He, J., Wu, C., Cheng, L., Gao, W., Sun, Y., Sun, J., Xin, J., Wang, L., and Wang, Y.: The carbonaceous aerosol levels still remain a challenge in the BeijingTianjin-Hebei region of China: Insights from continuous high temporal resolution measurements in multiple cities, Environ. Int., 126, 171–183, https://doi.org/10.1016/j.envint.2019.02.034, 2019.
Jimenez, J. L., Canagaratna, M. R., Donahue, N. M., Prevot, A. S. H., Zhang, Q., Kroll, J. H., DeCarlo, P. F., Allan, J. D., Coe, H., Ng, N. L., Aiken, A. C., Docherty, K. S., Ulbrich, I. M., Grieshop, A. P., Robinson, A. L., Duplissy, J., Smith, J. D., Wilson, K. R., Lanz, V. A., Hueglin, C., Sun, Y. L., Tian, J., Laaksonen, A., Raatikainen, T., Rautiainen, J., Vaattovaara, P., Ehn, M., Kulmala, M., Tomlinson, J. M., Collins, D. R., Cubison, M. J., Dunlea, E. J., Huffman, J. A., Onasch, T. B., Alfarra, M. R., Williams, P. I., Bower, K., Kondo, Y., Schneider, J., Drewnick, F., Borrmann, S., Weimer, S., Demerjian, K., Salcedo, D., Cottrell, L., Griffin, R., Takami, A., Miyoshi, T., Hatakeyama, S., Shimono, A., Sun, J. Y., Zhang, Y. M., Dzepina, K., Kimmel, J. R., Sueper, D., Jayne, J. T., Herndon, S. C., Trimborn, A. M., Williams, L. R., Wood, E. C., Middlebrook, A. M., Kolb, C. E., Baltensperger, U., and Worsnop, D. R.: Evolution of organic aerosols in the atmosphere, Science, 326, 1525–1529, 2009.
Kanakidou, M., Seinfeld, J. H., Pandis, S. N., Barnes, I., Dentener, F. J., Facchini, M. C., Van Dingenen, R., Ervens, B., Nenes, A., Nielsen, C. J., Swietlicki, E., Putaud, J. P., Balkanski, Y., Fuzzi, S., Horth, J., Moortgat, G. K., Winterhalter, R., Myhre, C. E. L., Tsigaridis, K., Vignati, E., Stephanou, E. G., and Wilson, J.: Organic aerosol and global climate modelling: a review, Atmos. Chem. Phys., 5, 1053–1123, https://doi.org/10.5194/acp-5-1053-2005, 2005.
Kang, M. J., Yang, F., Ren, H., Zhao, W. Y., Zhao, Y., Li, L. J., Yan, Y., Zhang, Y. J., Lai, S. C., Zhang, Y. Y., Yang, Y., Wang, Z. F., Sun, Y. L., and Fu, P. Q.: Influence of continental organic aerosols to the marine atmosphere over the East China Sea: Insights from lipids, PAHs and phthalates, Sci. Total Environ., 607, 339–350, https://doi.org/10.1016/j.scitotenv.2017.06.214, 2017.
Kawamura, K. and Gagosian, R. B.: Implications of ω-oxocarboxylic acids in the remote marine atmosphere for photooxidation of unsaturated fatty acids, Nature, 325, 330–332, 1987.
Kawamura, K., Ishimura, Y., and Yamazaki, K.: Four years' observations of terrestrial lipid class compounds in marine aerosols from the western North Pacific, Global Biogeochem. Cy., 17, 1003, https://doi.org/10.1029/2001GB001810, 2003a.
Kawamura, K., Umemoto, N., Mochida, M., Bertram, T., Howell, S., and Huebert, B. J.: Water-soluble dicarboxylic acids in the tropospheric aerosols collected over east Asia and western North Pacific by ACE-Asia C-130 aircraft, J. Geophys. Res.-Atmos., 108, 8639, https://doi.org/10.1029/2002jd003256, 2003b.
Kleindienst, T. E., Jaoui, M., Lewandowski, M., Offenberg, J. H., Lewis, C. W., Bhave, P. V., and Edney, E. O.: Estimates of the contributions of biogenic and anthropogenic hydrocarbons to secondary organic aerosol at a southeastern US location, Atmos. Environ., 41, 8288–8300, 2007.
Kong, S., Ji, Y., Liu, L., Chen, L., and Zhao, X.: Spatial and temporal variation of phthalic acid esters (PAEs) in atmospheric PM10 and PM2.5 and the influence of ambient temperature in Tianjin, China, Atmos. Environ., 74, 199–208, 2013.
Lee, A., Goldstein, A. H., Kroll, J. H., Ng, N. L., Varutbangkul, V., Flagan, R. C., and Seinfeld, J. H.: Gas-phase products and secondary aerosol yields from the photooxidation of 16 different terpenes, J. Geophys. Res.-Atmos., 111, D17305, https://doi.org/10.1029/2006jd007050, 2006.
Li, Y. C. and Yu, J. Z.: Composition profile of oxygenated organic compounds and inorganic ions in PM2.5 in Hong Kong, Environ. Chem., 7, 338–349, https://doi.org/10.1071/en09167, 2010.
Li, J. J., Wang, G. H., Wu, C., Cao, C., Ren, Y. Q., Wang, J. Y., Li, J., Cao, J. J., Zeng, L. M., and Zhu, T.: Characterization of isoprene-derived secondary organic aerosols at a rural site in North China Plain with implications for anthropogenic pollution effects, Sci. Rep., 8, 535, https://doi.org/10.1038/s41598-017-18983-7, 2018.
Li, L. J., Ren, L. J., Ren, H., Yue, S. Y., Xie, Q. R., Zhao, W. Y., Kang, M. J., Li, J., Wang, Z. F., Sun, Y. L., and Fu, P. Q.: Molecular Characterization and Seasonal Variation in Primary and Secondary Organic Aerosols in Beijing, China, J. Geophys. Res.-Atmos., 123, 12394–12412, 2018.
Mao, Y.-H., Liao, H., and Chen, H.-S.: Impacts of East Asian summer and winter monsoons on interannual variations of mass concentrations and direct radiative forcing of black carbon over eastern China, Atmos. Chem. Phys., 17, 4799–4816, https://doi.org/10.5194/acp-17-4799-2017, 2017.
McFiggans, G., Mentel, T. F., Wildt, J., Pullinen, I., Kang, S., Kleist, E., Schmitt, S., Springer, M., Tillmann, R., Wu, C., Zhao, D., Hallquist, M., Faxon, C., Le Breton, M., Hallquist, Å. M., Simpson, D., Bergström, R., Jenkin, M. E., Ehn, M., Thornton, J. A., Alfarra, M. R., Bannan, T. J., Percival, C. J., Priestley, M., Topping, D., and Kiendler-Scharr, A.: Secondary organic aerosol reduced by mixture of atmospheric vapours, Nature, 565, 587–593, https://doi.org/10.1038/s41586-018-0871-y, 2019.
Mochida, M. and Kawamura, K.: Hygroscopic properties of levoglucosan and related organic compounds characteristic to biomass burning aerosol particles, J. Geophys. Res.-Atmos., 109, D21202, https://doi.org/10.1029/2004JD004962, 2004.
Nolte, C. G., Schauer, J. J., Cass, G. R., and Simoneit, B. R. T.: Highly polar organic compounds present in meat smoke, Environ. Sci. Technol., 33, 3313–3316, 1999.
Nozière, B., Kaberer, M., Claeys, M., Allan, J., D'Anna, B., Decesari, S., Finessi, E., Glasius, M., Grgic, I., Hamilton, J. F., Hoffmann, T., Iinuma, Y., Jaoui, M., Kahno, A., Kampf, C. J., Kourtchev, I., Maenhaut, W., Marsden, N., Saarikoski, S., Schnelle-Kreis, J., Surratt, J. D., Szidat, S., Szmigielski, R., and Wisthaler, A.: The Molecular Identification of Organic Compounds in the Atmosphere: State of the Art and Challenges, Chem. Rev., 115, 3919–3983, 2015.
Oros, D. R., Abas, M. R. B., Omar, N. Y. M. J., Rahman, N. A., and Simoneit, B. R. T.: Identification and emission factors of molecular tracers in organic aerosols from biomass burning: Part 3. Grasses, Appl. Geochem., 21, 919–940, 2006.
Pope, C. A., Ezzati, M., and Dockery, D. W.: Fine-particulate air pollution and life expectancy in the United States, N. Engl. J. Med., 360, 376–386, 2009.
Puxbaum, H. and Tenze-Kunit, M.: Size distribution and seasonal variation of atmospheric cellulose, Atmos. Environ., 37, 3693–3699, 2003.
Ren, L. J., Fu, P. Q., He, Y., Hou, J. Z., Chen, J., Pavuluri, C. M., Sun, Y. L., and Wang, Z. F.: Molecular distributions and compound-specific stable carbon isotopic compositions of lipids in wintertime aerosols from Beijing, Sci. Rep., 6, 27481, https://doi.org/10.1038/srep27481, 2016.
Rogge, W. F., Hlldemann, L. M., Mazurek, M. A., and Caw, G. R: Sources of Fine Organic Aerosol. 2. Noncatalyst and Catalyst-Equipped Automobiles and Heavy-Duty Diesel Trucks, Environ. Sci. Technol., 27, 636–651, 1993.
Rogge, W. F., Medeiros, P. M., and Simoneit, B. R. T.: Organic marker compounds for surface soil and fugitive dust from open lot dairies and cattle feedlots, Atmos. Environ., 40, 27–49, 2006.
Rudich, Y., Donahue, N. M., and Mentel, T. F.: Aging of organic aerosol: Bridging the gap between laboratory and field studies, Annu. Rev. Phys. Chem., 58, 321–352, 2007.
Schauer, J. J., Rogge, W. F., Hildemann, L. M., Mazurek, M. A., and Cass, G. R.: Source apportionment of airborne particulate matter using organic compounds as tracers, Atmos. Environ., 30, 3837–3855, 1996.
Schauer, J. J., Fraser, M. P., Cass, G. R., and Simoneit, B. R. T.: Source reconciliation of atmospheric gas-phase and particle-phase pollutants during a severe photochemical smog episode, Environ. Sci. Technol., 36, 3806–3814, 2002.
Sharkey, T. D., Wiberley, A. E., and Donohue, A. R.: Isoprene emission from plants: Why and how, Ann. Bot.-London, 101, 5–18, 2007.
Sheesley, R. J., Schauer, J. J., Chowdhury, Z., Cass, G. R., and Simoneit, B. R. T.: Characterization of organic aerosols emitted from the combustion of biomass indigenous to South Asia, J. Geophys. Res.-Atmos., 108, 4285, https://doi.org/10.1029/2002JD002981, 2003.
Simoneit, B. R. T.: Characterization of organic constituents in aerosols in relation to their rigin and transport: a review, Int. J. Environ. An. Ch., 23, 207–237, 1986.
Simoneit, B. R. T., Medeiros, P. M., and Didyk, B. M.: Combustion products of plastics as indicators for refuse burning in the atmosphere, Environ. Sci. Technol., 39, 6961–6970, 2005.
Simoneit, B. R. T., Crisp, P. T., Mazurek, M. A., and Standley, L. J.: Composition of extractable organic matter of aerosols from the Blue Mountains and Southeast Coast of Australia, Environ. Int., 17, 405–419, 1991a.
Simoneit, B. R. T., Sheng, G. Y., Chen, X. J., Fu, J. M., Zhang, J., and Xu, Y. P.: Molecular marker study of extractable organic-matter in aerosols from urban areas of China, Atmos. Environ., 25, 2111–2129, 1991b.
Simoneit, B. R. T., Elias, V. O., Kobayashi, M., Kawamura, K., Rushdi, A. I., Medeiros, P. M., Rogge, W. F., and Didyk, B. M.: Sugars-dominant water-soluble organic compounds in soils and characterization as tracers in atmospheric particulate matter, Environ. Sci. Technol., 38, 5939–5949, 2004a.
Simoneit, B. R. T., Elias, V. R. O., Kobayashi, M., Kawamura, K., Rushdi, A. I., Medeiros, P. M., Rogge, W. F., and and Didyk, B. M.: Sugars-dominant water-soluble organic compounds in soils and characterization as tracers in atmospheric particulate matter, Environ. Sci. Technol., 38, 5939–5949, 2004b.
Simoneit, B. R. T., Kobayashi, M., Mochida, M., Kawamura, K., and Huebert, B. J.: Aerosol particles collected on aircraft flights over the northwestern Pacific region during the ACE-Asia campaign: Composition and major sources of the organic compounds, J. Geophys. Res.-Atmos., 109, D19S09, https://doi.org/10.1029/2004JD004565, 2004c.
Sun, Y., Xu, W., Zhang, Q., Jiang, Q., Canonaco, F., Prévôt, A. S. H., Fu, P., Li, J., Jayne, J., Worsnop, D. R., and Wang, Z.: Source apportionment of organic aerosol from 2-year highly time-resolved measurements by an aerosol chemical speciation monitor in Beijing, China, Atmos. Chem. Phys., 18, 8469–8489, https://doi.org/10.5194/acp-18-8469-2018, 2018.
Surratt, J. D., Lewandowski, M., Offenberg, J. H., Jaoui, M., Kleindienst, T. E., Edney, E. O., and Seinfeld, J. H.: Effect of acidity on secondary organic aerosol formation from isoprene, Environ. Sci. Technol., 41, 5363–5369, 2007.
Surratt, J. D., Chan, A. W. H., Eddingsaas, N. C., Chan, M. N., Loza, C. L., Kwan, A. J., Hersey, S. P., Flagan, R. C., Wennberg, P. O., and Seinfeld, J. H.: Reactive intermediates revealed in secondary organic aerosol formation from isoprene, P. Natl. Acad. Sci. USA, 107, 6640–6645, 2010.
Tao, J., Zhang, L. M., Cao, J. J., and Zhang, R. J.: A review of current knowledge concerning PM2.5 chemical composition, aerosol optical properties and their relationships across China, Atmos. Chem. Phys., 17, 9485–9518, https://doi.org/10.5194/acp-17-9485-2017, 2017.
Wang, H. B., Kawamura, K., and Shooter, D.: Wintertime organic aerosols in Christchurch and Auckland, New Zealand: Contributions of residential wood and coal burning and petroleum utilization, Environ. Sci. Technol., 40, 5257–5262, 2006.
Wang, L. L., Xin, J. Y., Li, X. R., and Wang, Y. S.: The variability of biomass burning and its influence on regional aerosol properties during the wheat harvest season in North China, Atmos. Res., 7, 153–163, https://doi.org/10.1016/j.atmosres.2015.01.009, 2015.
Wang, W., Wu, M. H., Li, L., Zhang, T., Liu, X. D., Feng, J. L., Li, H. J., Wang, Y. J., Sheng, G. Y., Claeys, M., and Fu, J. M.: Polar organic tracers in PM2.5 aerosols from forests in eastern China, Atmos. Chem. Phys., 8, 7507–7518, https://doi.org/10.5194/acp-8-7507-2008, 2008.
Wei, S. L., Huang, B., Liu, M., Bi, X. H., Ren, Z. F., Sheng, G. Y., and Fu, J. M.: Characterization of PM2.5-bound nitrated and oxygenated PAHs in two industrial sites of South China, Atmos. Res., 109, 76–83, https://doi.org/10.1016/j.atmosres.2012.01.009, 2012.
Xu, L., Guo, H. Y., Weber, R. J., and Ng, N. L.: Chemical Characterization of Water-Soluble Organic Aerosol in Contrasting Rural and Urban Environments in the Southeastern United States, Environ. Sci. Technol., 51, 78–88, https://doi.org/10.1021/acs.est.6b05002, 2017.
Widiana, D. R., Wang, Y. C., You, S. J., and Wang, Y. F.: Source apportionment and health risk assessment of ambient volatile organic compounds in primary schools in Northern Taiwan, Int. J. Environ. Sci. Te., 16, 6175–6188, https://doi.org/10.1007/s13762-018-2157-1, 2019.
Xu, H., Xiao, Z., Chen, K., Tang, M., Zheng, N., Li, P., Yang, N., Yang, W., and Deng, X.: Spatial and temporal distribution, chemical characteristics, and sources of ambient particulate matter in the Beijing-Tianjin-Hebei region, Sci. Total Environ., 658, 280–293, 2019.
Yang, F., Kawamura, K., Chen, J., Ho, K. F., Lee, S. C., Gao, Y., Cui, L., Wang, T. G., and Fu, P. Q.: Anthropogenic and biogenic organic compounds in summertime fine aerosols (PM2.5) in Beijing, China, Atmos. Environ., 124, 166–175, 2016.
Zhang, M., Chen, J. M., Wang, T., Cheng, T. T., Lin, L., Bhatia, R. S., and Hanvey, M.: Chemical characterization of aerosols over the Atlantic Ocean and the Pacific Ocean during two cruises in 2007 and 2008, J. Geophys. Res.-Atmos., 115, D22302, https://doi.org/10.1029/2010JD014246, 2010.
Zhang, X. Y., Zhuang, G. S., Guo, J. H., Yin, K. D., and Zhang, P.: Characterization of aerosol over the Northern South China Sea during two cruises in 2003, Atmos. Environ., 41, 7821–7836, 10.1016/j.atmosenv.2007.06.031, 2007.
Zhang, Y. J., Kang, S. C., Qin, D. H., Grigholm, B., and Mayewski, P. A.: Changes in annual accumulation retrieved from Geladaindong ice core and its relationship to atmospheric circulation over the Tibetan Plateau, Chinese Sci. Bull., 52, 3261–3266, https://doi.org/10.1007/s11434-007-0439-y, 2007.
Zhao, Y., Hennigan, C. J., May, A. A., Tkacik, D. S., de Gouw, J. A., Gilman, J. B., Kuster, W. C., Borbon, A., and Robinson, A. L.: Intermediate-volatility organic compounds: a large source of secondary organic aerosol, Environ. Sci. Technol., 48, 13743–13750, 2014.
Zheng, B., Zhang, Q., Zhang, Y., He, K. B., Wang, K., Zheng, G. J., Duan, F. K., Ma, Y. L., and Kimoto, T.: Heterogeneous chemistry: a mechanism missing in current models to explain secondary inorganic aerosol formation during the January 2013 haze episode in North China, Atmos. Chem. Phys., 15, 2031–2049, https://doi.org/10.5194/acp-15-2031-2015, 2015.
Zheng, L. S., Yang, X. Y., Lai, S. C., Ren, H., Yue, S. Y., Zhang, Y. Y., Huang, X., Gao, Y. G., Sun, Y. L., Wang, Z. F., and Fu, P. Q.: Impacts of springtime biomass burning in the northern Southeast Asia on marine organic aerosols over the Gulf of Tonkin, China, Environ. Pollut., 237, 285–297, 2018.
Zhu, C., Kawamura, K., and Kunwar, B.: Effect of biomass burning over the western North Pacific Rim: wintertime maxima of anhydrosugars in ambient aerosols from Okinawa, Atmos. Chem. Phys., 15, 1959–1973, https://doi.org/10.5194/acp-15-1959-2015, 2015a.
Zhu, C., Kawamura, K., and and Kunwar, B.: Organic tracers of primary biological aerosol particles at subtropical Okinawa Island in the western North Pacific Rim, J. Geophys. Res.-Atmos., 120, 5504–5523, 2015b.
Zhu, C. M., Kawamura, K., and Fu, P. Q.: Seasonal variations of biogenic secondary organic aerosol tracers in Cape Hedo, Okinawa, Atmos. Environ., 130, 113–119, https://doi.org/10.1016/j.atmosenv.2015.08.069, 2016.


