the Creative Commons Attribution 4.0 License.
the Creative Commons Attribution 4.0 License.
 | 15 Oct 2020
Pollutant emission reductions deliver decreased PM2.5-caused mortality across China during 2015–2017
Luke Conibear
Carly L. Reddington
Christoph Knote
Steve R. Arnold
Dominick V. Spracklen
Air pollution is a serious environmental issue and leading contributor to disease burden in China. Rapid reductions in fine particulate matter (PM2.5) concentrations and increased ozone concentrations occurred across China during 2015 to 2017. We used measurements of particulate matter with a diameter <2.5 µm (PM2.5) and ozone (O3) from more than 1000 stations across China along with Weather Research and Forecasting model coupled with Chemistry (WRF-Chem) regional air quality simulations, to explore the drivers and impacts of observed trends. The measured nationwide median PM2.5 trend of was well simulated by the model (). With anthropogenic emissions fixed at 2015 levels, the simulated trend was much weaker (), demonstrating that interannual variability in meteorology played a minor role in the observed PM2.5 trend. The model simulated increased ozone concentrations in line with the measurements but underestimated the magnitude of the observed absolute trend by a factor of 2. We combined simulated trends in PM2.5 concentrations with an exposure–response function to estimate that reductions in PM2.5 concentrations over this period have reduced PM2.5-attributable premature mortality across China by 150 000 deaths yr−1.
- Article
(4753 KB) - Full-text XML
-
Supplement
(1835 KB) - BibTeX
- EndNote


Concentrations of particulate matter and ozone across China largely exceed international air quality standards (Reddington et al., 2019; Silver et al., 2018). This poor air quality is estimated to hasten the deaths of 870 000–2 470 000 people across China each year (Apte et al., 2015; Burnett et al., 2018; Cohen et al., 2017; Gu and Yim, 2016; Lelieveld et al., 2015). The Chinese government's efforts to improve air quality began in the 1990s, but emissions of pollutants continued to increase into the 21st century, and air pollution has worsened (Krotkov et al., 2016; Streets et al., 2008; Zhang et al., 2012). In 2013, China experienced episodes of severe particulate matter pollution (Zhang et al., 2016). In response, the Chinese government announced the “Air Pollution Prevention and Control Action Plan”, which focused on the reduction of fine particulate matter (PM2.5) through stringent emission controls during 2012–2017 (Zheng et al., 2017).
1.1 Previous studies of trends in China's air quality
Satellite remote sensing studies have been used to show large changes in air pollution across China in recent decades, with positive trends in nitrogen dioxide (NO2) (van der A et al., 2006), sulfur dioxide (SO2) (Zhang et al., 2017) and PM2.5 (Ma et al., 2016) during the 1990s and early 2000s. Trends in aerosol optical depth have been used to estimate changes in PM2.5, which peaked around 2011 (Ma et al., 2016). NO2 across China peaked around 2011 (De Foy et al., 2016; Irie et al., 2016), although concentrations in the Pearl River Delta (PRD) peaked earlier, and in western regions they may have peaked later (Cui et al., 2016). Several remote sensing studies show that SO2 concentrations in China peaked around 2006 (van der A et al., 2017; Krotkov et al., 2016; Zhang et al., 2017), matching the period of maximum emissions (Duan et al., 2016; M. Li et al., 2017; Zheng et al., 2018). Analysis of measurements from the Acid Deposition Monitoring Network in East Asia (EANET) shows a negative pH trend (i.e. becoming more acidic) from 1999 until a reversal occurred in 2006, matching peak SO2 emissions and concentrations (Duan et al., 2016). Measurements of O3 concentrations at background monitoring sites indicate positive trends in western China during 1994–2013 (Xu et al., 2016) and Taiwan during 1994–2003 (Chang and Lee, 2007), suggesting that O3 has been increasing across China during the past two decades. More recently, measurements at urban sites also showed positive O3 trends during 2005–2011 (Zhang et al., 2014). The establishment of China's air pollution monitoring network, operated by the China National Environmental Monitoring Centre (CNEMC; Wang et al., 2015), which includes measurements from over 1600 locations, has enabled more detailed analysis of recent air pollution changes (Silver et al., 2018; Zhai et al., 2019). Between 2015 and 2017, PM2.5 concentrations across China decreased by 28 % (Silver et al., 2018). Zhai et al. (2019) reported a 30 %–40 % decrease in PM2.5 concentrations during 2013–2017. In contrast O3 concentrations have increased, with median concentration of O3 across 74 key cities increasing from 141 µg m−3 in 2013 to 164 µg m−3 in 2017 (Huang et al., 2018). Silver et al. (2018) found that O3 maximum 8 h mean concentrations (O3MDA8) increased by 4.6 % yr−1 over 2015–2017. Lu et al. (2020) reported positive trends in April–September O3MDA8 at 90 % of sites during 2013 to 2019. Positive regional O3 trends remain even after meteorological variability has been removed (K. Li et al., 2019). Trends in NO2 are more variable, with a negative trend reported in eastern China and positive trends in western areas (Li and Bai, 2019). Silver et al. (2018) found that NO2 had negative trends in Hong Kong and North China Plain regions, positive trends in the Yangtze River Delta (YRD), Sichuan Basin (SCB) and PRD, and no overall trend at the national scale.
1.2 Identifying drivers of recent trends
Changes in the concentrations of air pollutants may be caused by changing emissions or by interannual variability of meteorology. Stringent emission controls have started to reduce emissions of various pollutants across China. Between 2013 and 2017, emissions of PM2.5, SO2 and NOx (NO2 + nitrogen oxide) declined, whereas emissions of ammonia (NH3) and non-methane volatile organic compounds (NMVOCs) remained fairly constant (Zheng et al., 2018). Zheng et al. (2018) also demonstrate that emission reductions were primarily driven by pollution controls, rather than decreasing activity rates. Meteorological variability alters atmospheric mixing, deposition and transport, all of which can influence the concentration of pollutants. Separating the influence of meteorology and emissions on air pollutant concentrations is difficult, due to the interlinked nature of the chemistry–climate system (Jacob and Winner, 2009). However, to assess the efficacy of China's emissions reductions, it is necessary to separate these two factors. There are two commonly used approaches to separate the influences of meteorology and emissions on variability in atmospheric pollutant abundances. The first approach uses statistical models, such as multi-linear regression, to control for the influence of meteorology and to allow the proportion of air pollutant concentration variability that can be explained by meteorological variables to be calculated (Tai et al., 2010). The second approach is to use an atmospheric chemistry transport model to simulate pollutant concentrations (Ansari et al., 2019; Xing et al., 2011).
There are a limited number of modelling studies that attempt to separate the influence of meteorology and emissions changes on recent air quality trends in China. Chen et al. (2019) used the Weather Research and Forecasting model coupled with Chemistry (WRF-Chem) with 2010 emissions to examine the drivers of trends in wintertime PM. Ding et al. (2019) used the Community Multiscale Air Quality (CMAQ) model with meteorological inputs from the WRF model to evaluate the importance of emissions, meteorology and demographic changes to PM2.5-related mortality during 2013–2017. Our paper adds to these previous studies by evaluating the ability of an online coupled model (WRF-Chem) to capture trends in NO2, O3 and SO2 as well as PM, using the most recent emissions and evaluated against a comprehensive measurement dataset. Through a comparison of multiple simulations, where either annual variability in emissions or meteorology is held constant, the relative influence of the two factors can be estimated. Here we analyse measurements and a regional air quality model to explore the role of changing anthropogenic emissions on air pollutant concentrations and human health across China during 2015 to 2017.
2.1 Measurement dataset
We used hourly measurements from the CNEMC monitoring network (Wang et al., 2015) of PM2.5, O3, NO2 and SO2 for the period 2015–2017, which include data from over 1600 monitoring stations across mainland China and are available to download from https://quotsoft.net/ (last access: 6 October 2020). These were combined with data from the Hong Kong Environmental Protection Department (https://cd.epic.epd.gov.hk/EPICDI/air/station/) (last access: 6 October 2020) and Taiwan's Environmental Protection Administration (https://airtw.epa.gov.tw/CHT/Query/His_Data.aspx) (last access: 6 October 2020). We conducted quality control on the measured data following the methods outlined in Silver et al. (2018), which include excluding data with a high proportion of repeated measurements and periods of low variability, which represent periods of missing or invalid data. The cleaned dataset included measurements from 1155 sites.
2.2 WRF-Chem model setup
We used the Weather Research and Forecasting model coupled with Chemistry (WRF-Chem) version 3.7.1 (Grell et al., 2005) to simulate trace gas and particulate pollution over China for 2015 to 2017. The model domain uses a Lambert conformal grid (11–48∘ N, 93–128∘ E) centred on eastern China with a horizontal resolution of 30 km. The model has 33 vertical layers, with the lowest layer ∼29 m above the surface and the highest at 50 hPa (∼19.6 km).
European Centre for Medium-Range Weather Forecasts (ECMWF) ERA-Interim fields were used to provide meteorological boundary and initial conditions, as well as to nudge the model temperature, winds and humidity above the boundary layer every 6 h. Restricting nudging to above the boundary layer allowed a more realistic representation of vertical mixing (Otte et al., 2012). Chemical boundary and initial conditions were provided by global fields from the Model for Ozone and Related Chemical Tracers version 4 (MOZART-4) chemical transport model (Emmons et al., 2010).
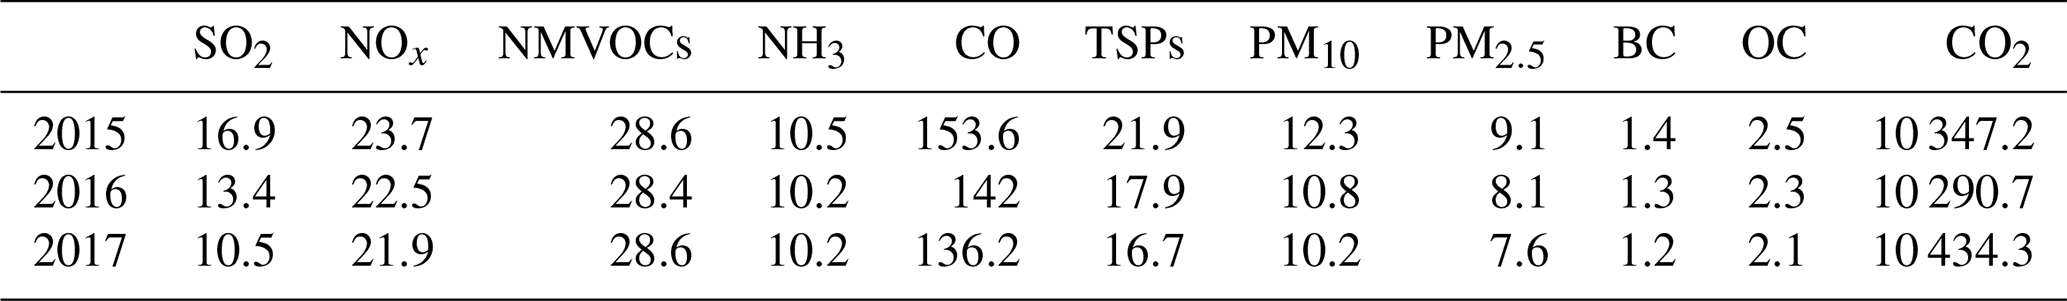
Anthropogenic emissions were from the Multi-resolution Emission Inventory for China (MEIC; http://www.meicmodel.org). (last access: 6 October 2020.) MEIC estimates emissions using a database of activity rates across residential, industrial, electricity generation, transportation and agricultural emission sectors combined with China-specific emission factors (Hong et al., 2017). We used the 2015 MEIC dataset, then used sector-specific and species-specific scaling for 2016 and 2017 based on the emission totals estimated in Zheng et al. (2018). Table 1 shows emission totals for 2015, 2016 and 2017. Over the 2015 to 2017 period, Chinese emissions decreased by 38 % for SO2, 16 % for PM2.5 and 8 % for NOx. For regions outside the MEIC dataset, we used anthropogenic emissions from the EDGAR-HTAP_v2.2 emission inventory for 2010.
Table 1Chinese pollutant emissions (Tg yr−1) during 2015 to 2017 from the MEIC. NMVOCs refer to non-methane volatile organic compounds; TSPs refer to total suspended particles.
Biogenic emissions were generated online by the Model of Emissions of Gases and Aerosol from Nature (MEGAN) (Guenther et al., 2000). Biomass burning emissions were provided by the Fire Inventory from NCAR (FINN) version 1.5 (Wiedinmyer et al., 2011), which uses satellite fire observations of fires and land cover to estimate daily 1 km2 emissions. Dust emissions were generated online using the Georgia Institute of Technology–Goddard Global Ozone Chemistry Aerosol Radiation and Transport (GOCART) model with Air Force Weather Agency (AFWA) modifications (LeGrand et al., 2019).
Gas-phase chemistry is simulated using the MOZART-4 scheme, and aerosol is treated by the Model for Simulating Aerosol Interactions and Chemistry (MOSAIC; Zaveri et al., 2008) scheme, including grid-scale aqueous chemistry and an extended treatment of organic aerosol (Hodzic and Jimenez, 2011; Hodzic and Knote, 2014). Four discrete size bins were used within MOSAIC (0.039–0.156, 0.156–0.625, 0.625–2.5, 2.5–10 µm) to represent the aerosol size distribution.
2.3 Model and measurement trend estimation
To separate the influence of changing anthropogenic emissions from interannual variability in meteorology, we conducted two 3-year simulations, both for 2015–2017. The first simulation (control) included interannual variability in both anthropogenic emissions and meteorology. The second simulation (fixed emissions) included interannual variability in meteorology but with anthropogenic emissions fixed at 2015 levels. Both simulations include interannual variability in biogenic and biomass burning emissions, allowing us to isolate the impacts of changing anthropogenic emissions.
Trends in the model data were calculated using the same method as the measurement data (Silver et al., 2018). The hourly data are averaged to monthly means, which are then deseasonalised using locally weighted scatterplot smoothing. The magnitude and direction of linear trends were calculated using the Theil–Sen estimator, a non-parametric method that is resistant to outliers (Carslaw, 2015). The Mann–Kendall test was used to assess the significance of trends, using a threshold of p<0.05. This stage of the analysis was performed using the R package openair (Carslaw and Ropkins, 2012).
2.4 Health impact estimation
Health impacts are estimated for ambient PM2.5 using the Global Exposure Mortality Model (GEMM; Burnett et al., 2018), which uses cohort studies to estimate health risks integrated over a range of PM2.5 concentrations. GEMM applies a supralinear association between exposure and risk at lower concentrations and then a near-linear association at higher concentrations. We used the GEMM for non-accidental mortality (non-communicable disease, NCD, plus lower respiratory infection, LRI), using parameters including the China cohort (Burnett et al., 2018). For ambient O3, we used the methodology of the Global Burden of Disease (GBD) study for 2017 (GBD 2017 Risk Factor Collaborators, 2018) to estimate the mortality caused by chronic obstructive pulmonary disease, which is based on exposure and risk information from five epidemiological cohorts. It estimates a near-linear relationship between exposure and risk at lower concentrations of O3 and a sub-linear association at higher concentrations. The United Nations-adjusted population count dataset for 2015 at resolution was obtained from the Gridded Population of the World, Version 4, along with population age distribution from GBD2017. Health impacts depend on population count, population age and baseline mortality rates, which have changed over the period studied (Butt et al., 2017). To isolate the impacts of changing air pollution, other variables were kept constant for 2015–2017.
3.1 Model evaluation
For comparison with the measurements, we sampled the model at the station locations using linear interpolation. Over 2015–2017, the model simulated PM2.5 (normalised mean bias (NMB) = 0.45), O3 (NMB = −0.13) and SO2 (NMB=0.07) well, while it overestimated NO2 concentrations by a factor of around 2 (NMB = 1.17). Model biases were similar to previous model studies in China (Supplement Table S1). We also evaluated the model against speciated aerosol measurements from the Surface PARTiculate mAtter Network (SPARTAN; Snider et al., 2015, 2016) site in Beijing (https://www.spartan-network.org/beijing-china, last access: 2 July 2020) (Fig. S4), as well as from Zhou et al. (2019) (Fig. S5) and from across China (Y. J. Li et al., 2017) (Fig. S6). Measurements reported by Y. J. Li et al. (2017) were made from various years spanning 2006 to 2013 and do not match the years simulated by the model. Comparison against these data shows that the model underestimates the sulfate fraction in PM2.5, while it overestimates the nitrate fraction. Underestimation of sulfate in comparison to Y. J. Li et al. (2017) will partly be caused by the large decline in SO2 emissions that has occurred in the last decade (Zheng et al., 2018). Underestimate of sulfate, particularly in winter, and overestimation of nitrate are consistent with previous modelling studies (Shao et al., 2019), including those using WRF-Chem (Zhou et al., 2019). Newly proposed mechanisms to explain the rapid sulfate formation in China's winter haze (Gen et al., 2019; Shao et al., 2019; Xue et al., 2014; Zhang et al., 2019) need to be included and evaluated in models.
3.2 Varying emissions scenario
Figures 1 and 2 compare measured and simulated air quality trends over China during 2015 to 2017. The measurements show widespread decline in PM2.5 and SO2 concentrations, widespread increase in O3MDA8 and spatially variable trends in NO2 concentrations, as reported previously (Silver et al., 2018). The model (control simulation) simulates the widespread decline in PM2.5 concentrations, with the median measured trend across China () well simulated by the model (). However, as the above comparisons with speciated aerosol measurements show, the underlying trends in individual aerosol species may contain inaccuracies that affect the overall PM2.5 trend. In the measurements, 90 % of significant trends are negative, and 10 % of significant trends are positive, with positive trends mostly being in the Fenwei Plain region, Jiangxi and Anhui. No significant positive trends are simulated by the model, possibly due to the coarse resolution of the model and the simplified scaling we apply to emissions for 2016 and 2017.
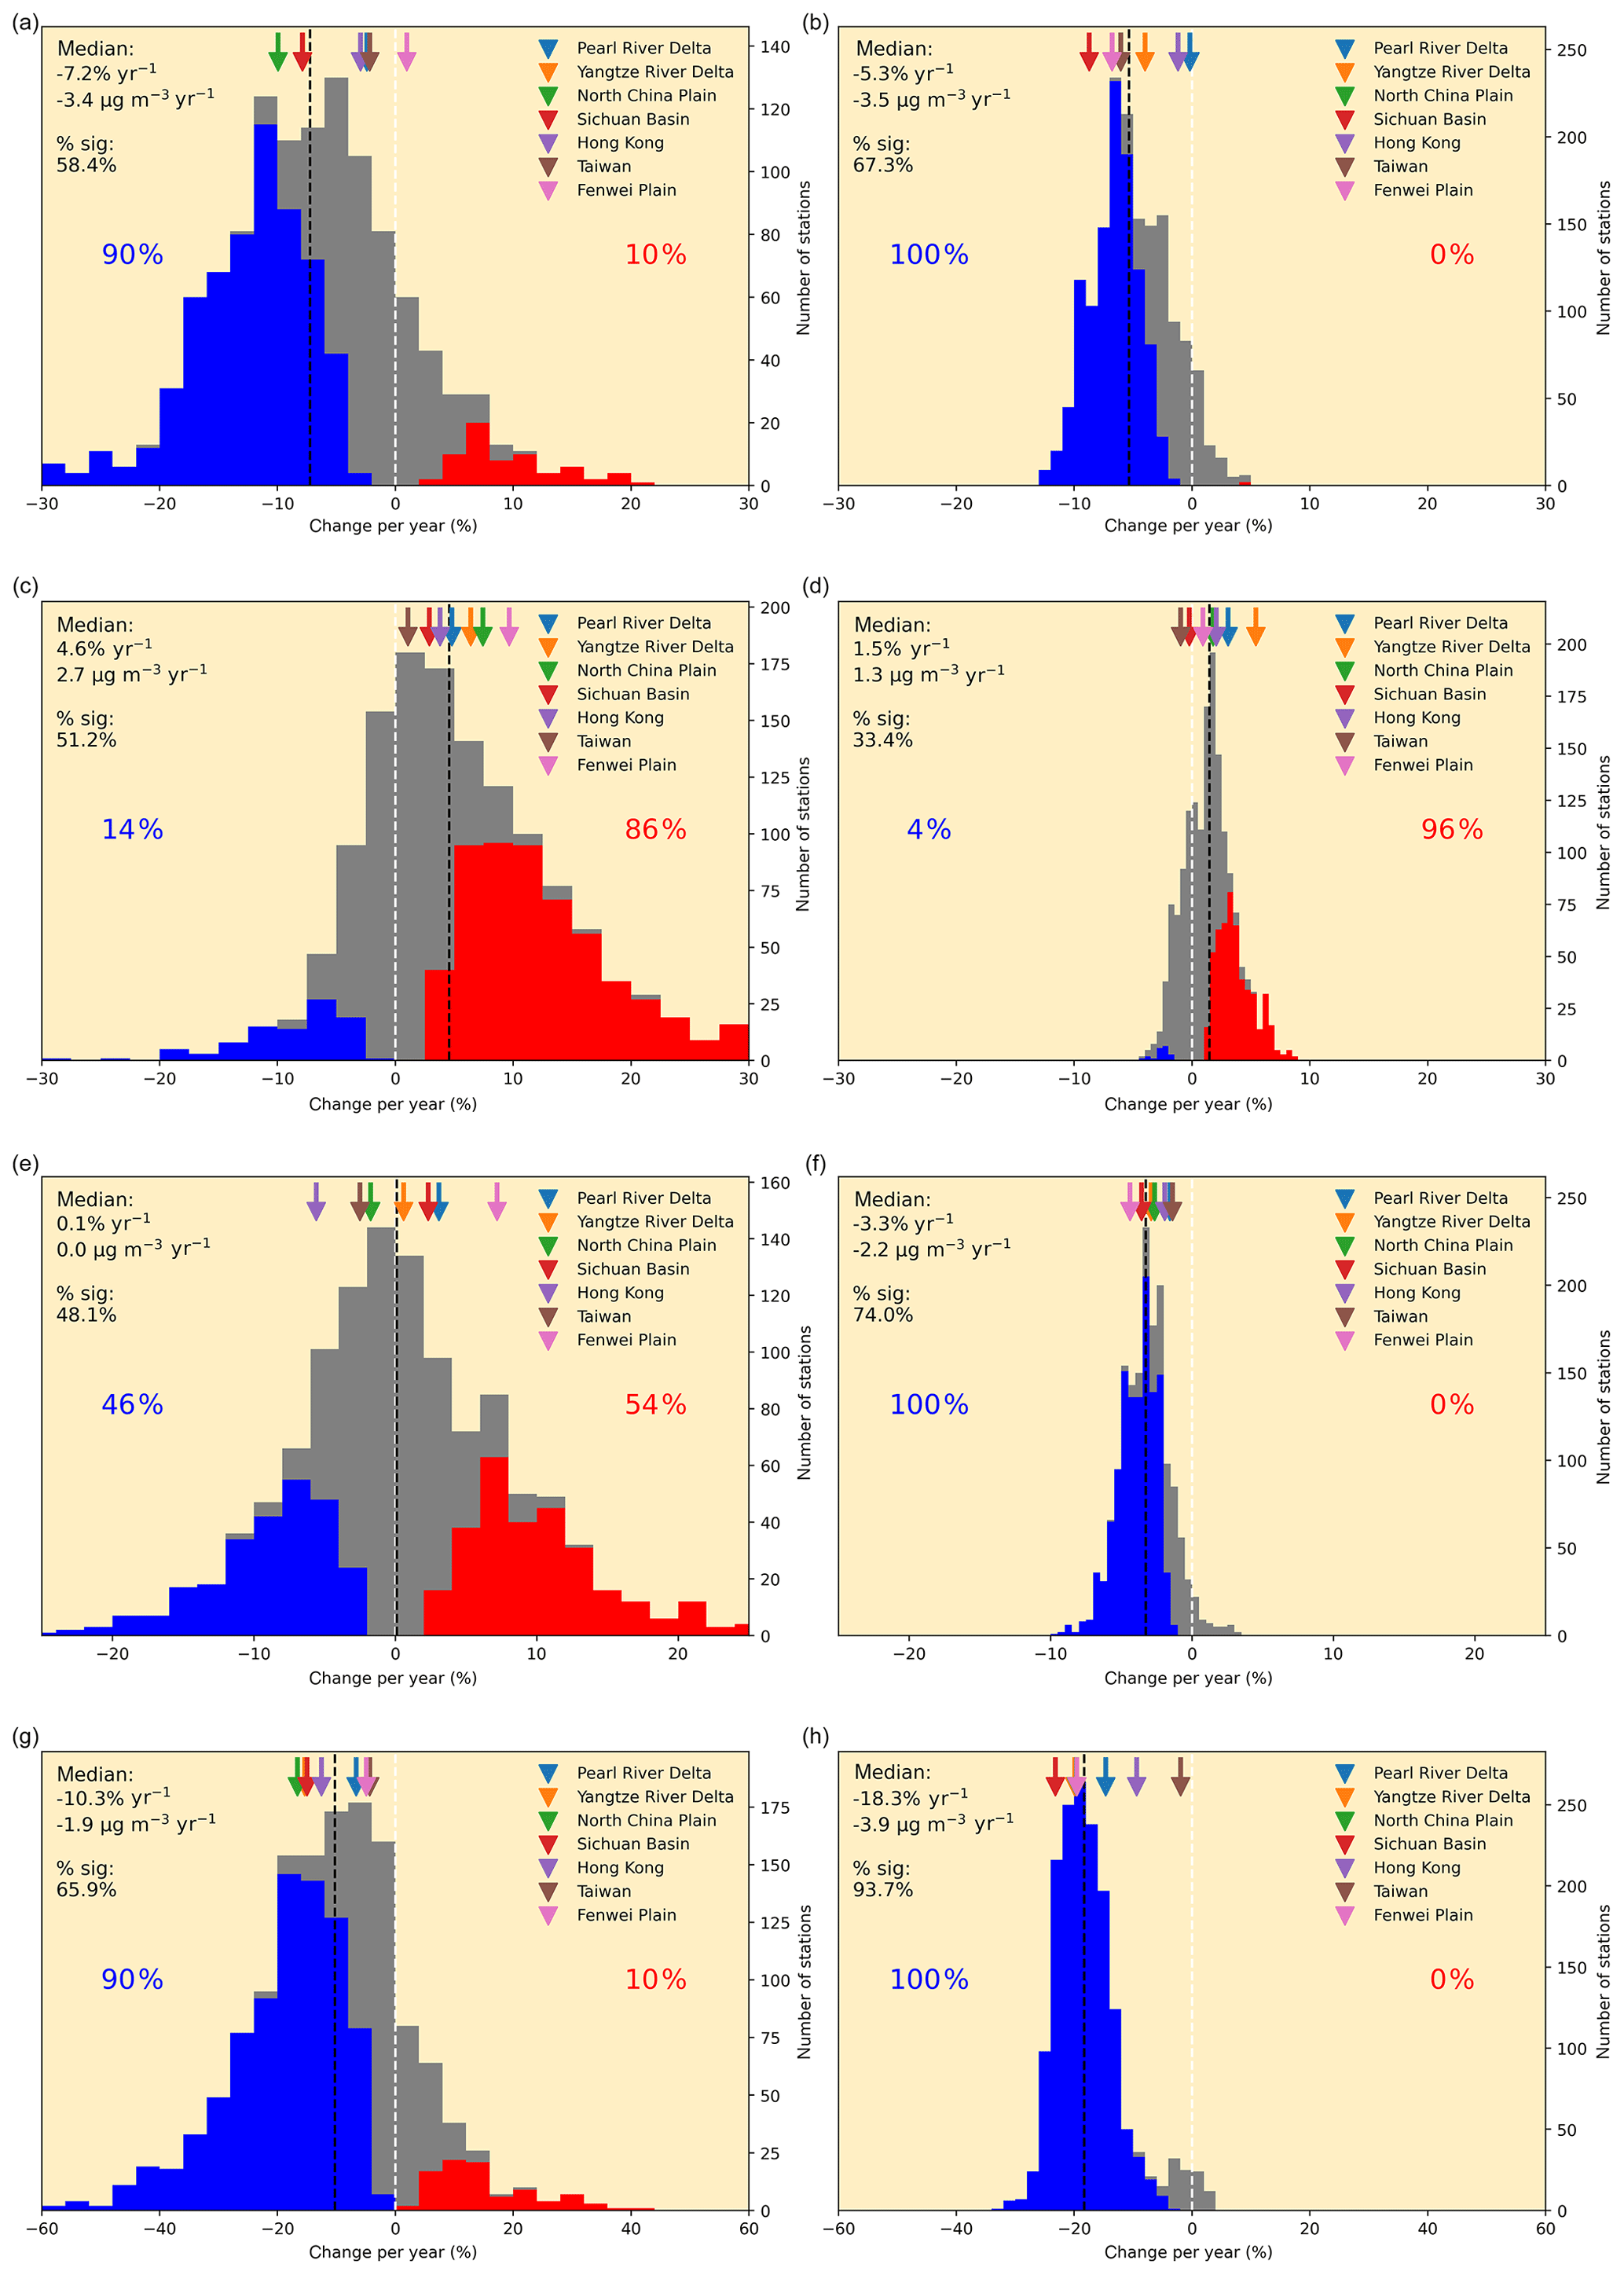
Figure 1Histograms showing the frequency distribution of trends in concentrations of (a, b) PM2.5, (c, d) O3MDA8, (e, f) NO2 and (g, h) SO2 across China and Taiwan during 2015–2017. Measured trends (left-hand panels) are compared to simulated trends (right-hand panels). The median relative and absolute trend as well as the percentage of stations with significant trends are shown in each panel. The percentage of significant trends that are negative (blue) or positive (red) are also shown. The dotted black line shows the median trend across all sites, while the dotted white line shows zero. Arrows show the median trend for the regional domains: Pearl River Delta (PRD), Yangtze River Delta (YRD), North China Plain (NCP), Sichuan Basin (SCB), Hong Kong (HK), Taiwan (TW) and the Fenwei Plain (FWP).

Figure 2Map showing the spatial distribution of trends in concentrations of (a, b) PM2.5, (c, d) O3MDA8, (e, f) NO2 and (g, h) SO2 across China and Taiwan during 2015–2017. Measured trends (left-hand panels) are compared to simulated trends (right-hand panels). Red indicates a significant positive trend, whereas blue indicates a significant negative trend. Light coloured circles indicated a statistically insignificant trend. Coloured boxes show the regional domains: Pearl River Delta (blue), Yangtze River Delta (orange), North China Plain (green), Sichuan Basin (red), Hong Kong (purple), Taiwan (brown) and the Fenwei Plain (pink).
WRF-Chem captures the widespread increase in O3MDA8 but underestimates the magnitude of the trend by a factor of 2 () in the measurements, versus simulated by WRF-Chem. WRF-Chem simulates negative O3MDA8 trends in the Sichuan Basin and Taiwan, whereas in the measured data, all regions have positive median trends.
The measurements show zero overall median trend in NO2 concentrations, with 46 % of sites with significant trends being negative and 54 % positive. In contrast, WRF-Chem simulates widespread reductions in NO2 concentrations, with 100 % of significant sites exhibiting negative trends and a negative nationwide median trend of . The 7.0 % nationwide median decline in simulated NO2 concentrations over 2015–2017 matches the 7.6 % decline in Chinese NOx emissions in the MEIC. The measurements show a widespread decline in SO2 concentrations, with a median nationwide trend of . WRF-Chem captures the direction of the trend, but the magnitude of the trend is overestimated by a factor of 2. The 32.5 % decline in simulated nationwide median SO2 concentrations over 2015–2017 matches the 37.8 % decline in SO2 emissions in the MEIC.
3.3 Fixed emissions scenario
The model simulation where anthropogenic emissions in China were fixed at 2015 levels has a weak negative PM2.5 trend (), a factor of 6 smaller than either the control simulation or the measurements (Fig. 3). This suggests that the measured negative PM2.5 trend has largely been driven by decreased anthropogenic emissions, with limited impact from interannual variability in meteorology. Chen et al. (2019) also concluded that emission reductions were the primary cause of reduced wintertime PM2.5 across China during 2015–2017. Cheng et al. (2019) found that local and regional reductions in anthropogenic emissions were the dominant cause of reduced PM2.5 concentrations in Beijing between 2013 and 2017. The median O3MDA8 trend in the fixed emission simulation is . This suggests that interannual meteorological variation had little influence on O3 trends at the China-wide scale during 2015–2017, which were largely driven by changing emissions. However, meteorological variability did drive regional changes in O3. For example, in Guizhou province, a trend of was calculated in the fixed emissions simulation. H. Li et al. (2019) also report that the positive ozone trend over 2013 to 2017 is due to changes in anthropogenic emissions, and the magnitude of their estimated trend of 1–3 ppbv yr−1 (approximately 2–) is comparable to the trend found in this study. Lu et al. (2019) analysed changes in O3 between 2016 and 2017 and concluded that hotter and drier conditions in 2017 contributed to higher O3 concentrations in that year. Liu and Wang (2020a) reported a complex O3 response during 2013 to 2017, with changing anthropogenic emission increasing O3MDA8 in urban areas and decreasing it in rural areas, whereas meteorological changes drove regionally contrasting changes in O3MDA8 through changes in cloud cover, wind and temperature and through driving changes in biogenic emissions.
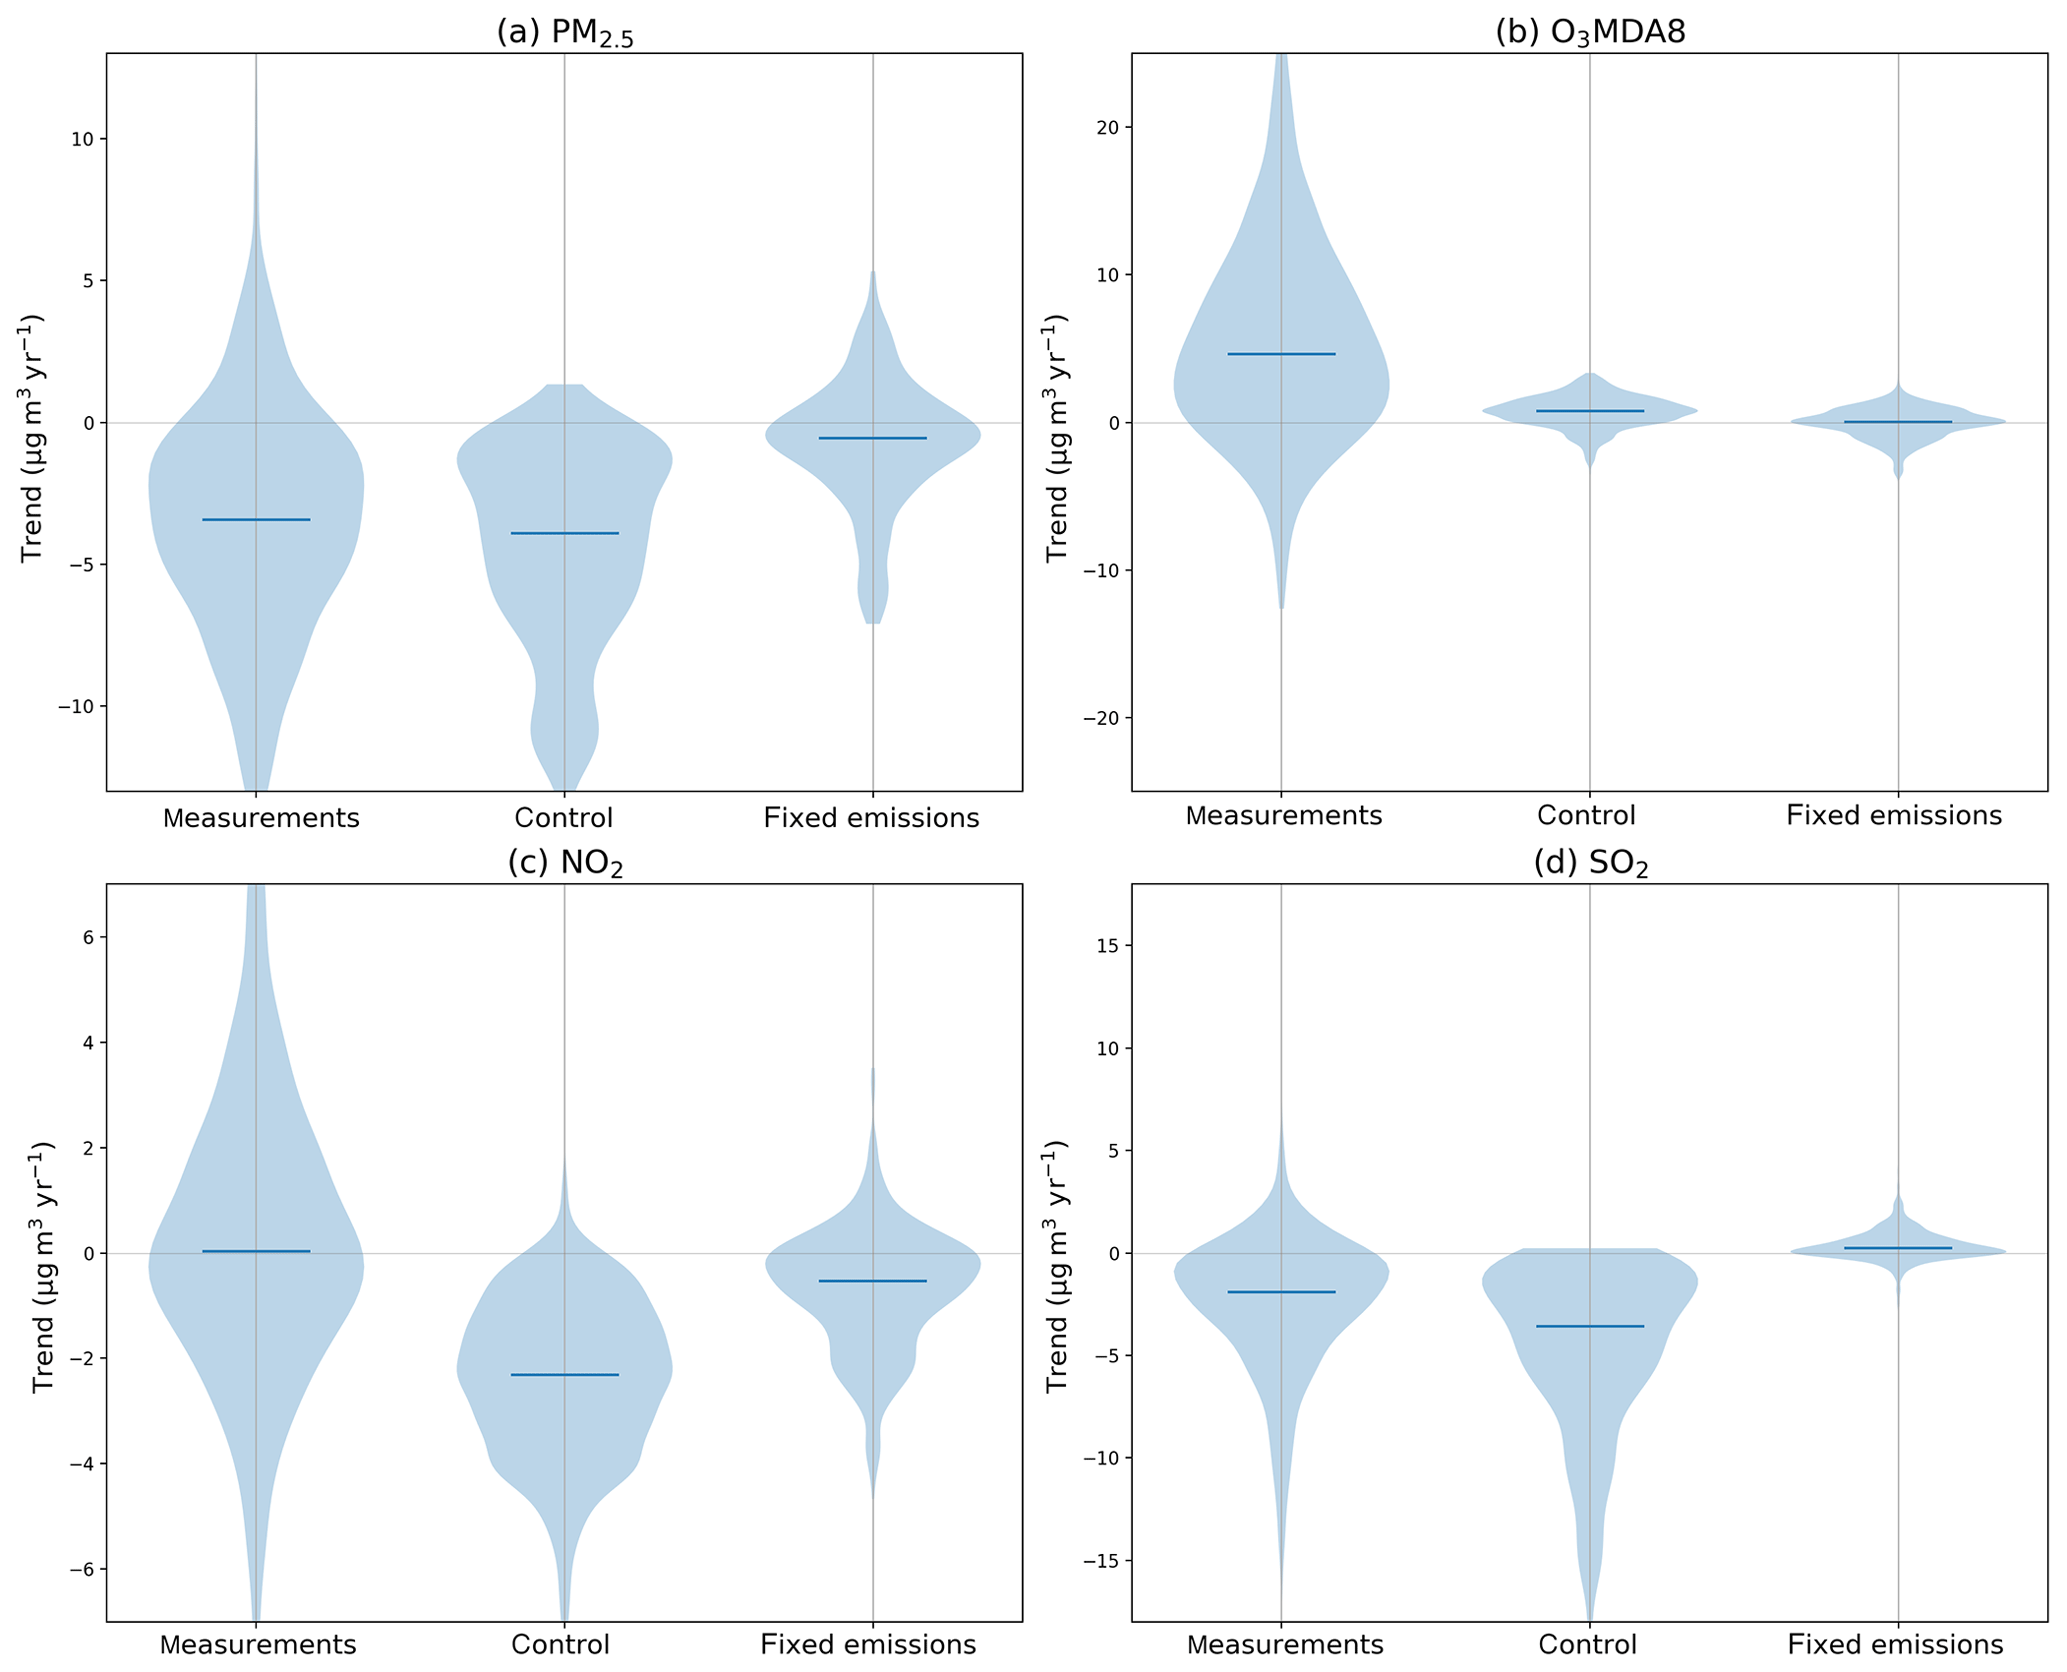
Figure 3Comparison of measured and simulated concentration trends during 2015 to 2017. The left violin plot shows the measured trend, the centre shows the simulated trend with varying emissions and meteorology (control) and the right shows the simulated trends for the fixed emissions simulation. (a) PM2.5, (b) O3MDA8, (c) NO2 and (d) SO2. The solid line shows the median absolute trend, and the shaded area shows a smoothed relative frequency distribution.
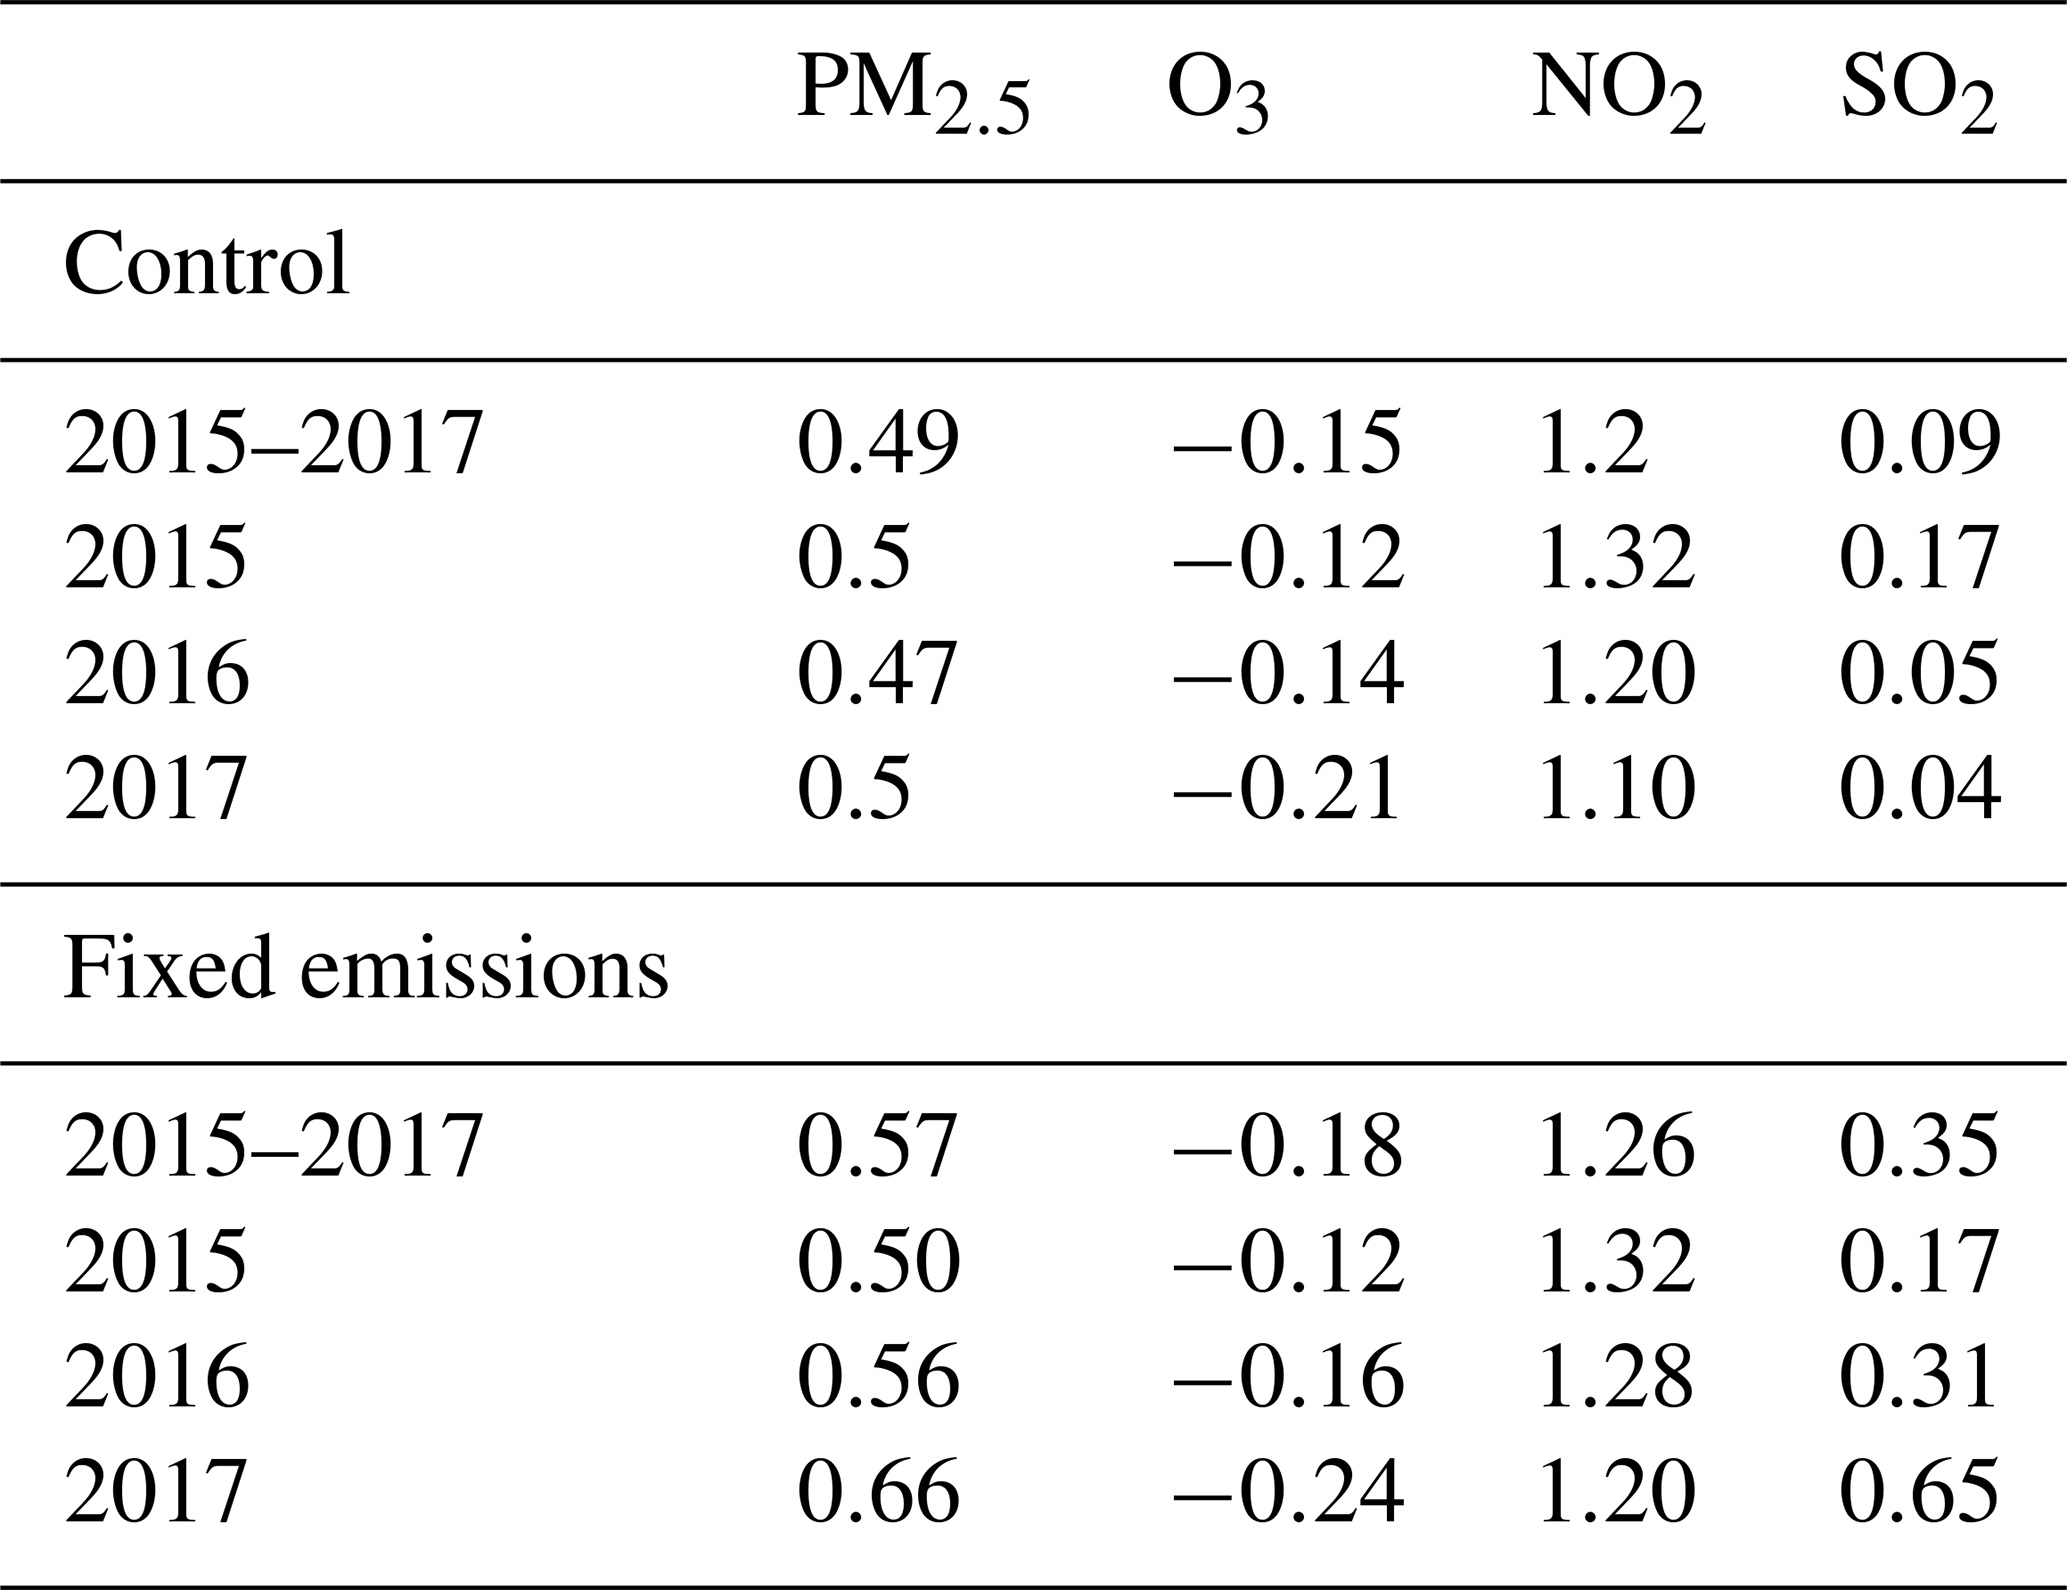
The fixed emission simulation also has a smaller NO2 trend () compared to the control simulation (), demonstrating that emission reductions that are estimated in the MEIC are also the main reason for the negative simulated NO2 trend. However, unlike PM2.5 and O3, the NO2 trend calculated from the fixed emission simulation more closely matches the measured trend. This may suggest that the MEIC has overestimated the NO2 emission reductions during 2015–2017. This suggestion is supported by recent satellite studies which found a slowing down or even reversal of NO2 reductions during 2016–2019 (R. Li et al., 2019), no significant trend in NO2 during 2013–2017 (Huang et al., 2018) and increases in NO2 concentration in the YRD, PRD and Fenwei Plain (FWP) regions during 2015–2017 (Feng et al., 2019). If NOx emissions decline too strongly in the MEIC, this may contribute to the simulated underestimate of the positive observed O3MDA8 trend in areas of China with NOx-limited or mixed ozone regimes that cover the majority of China (Jin and Holloway, 2015). Other work has suggested that increased O3 concentrations are possibly linked to the rapid decline in aerosol (K. Li et al., 2019). Liu and Wang (2020b) found that the reasons for increased O3 concentrations during 2013–2017 were regionally dependent and that anthropogenic volatile organic compound (VOC) emission reductions of 16 %–24 % would have been needed to avoid increased concentrations. Table 2 compares the PM2.5, O3, SO2 and NO2 measurements for the control and fixed emission simulations in 2015, 2016 and 2017. In the control simulation, model biases remain similar during 2015–2017. In the fixed emission simulation, model biases for PM2.5, O3 and SO2 increase between 2015 and 2017. This further suggests that changing anthropogenic emissions during 2015–2017 have been the dominant cause of changing concentrations.
Table 2Model evaluation shown as a normalised mean bias (NMB). Evaluation is shown separately for the control and fixed emission simulations. The NMB for 2015–2017 is compared to individual years.
An important future step is to understand how changing anthropogenic emissions, in terms of emission species or emission sectors, have contributed to observed trends in pollutant concentrations. Residential and industrial emissions are dominant causes of PM2.5 concentrations across much of China (Reddington et al., 2019), but it is not clear which emission sectors have contributed most to observed PM2.5 trends. Cheng et al. (2019) suggest that emission controls in the residential and industrial sectors were the dominant causes for reduced PM2.5 in Beijing between 2014 and 2017. Measurements of aerosol composition (Y. J. Li et al., 2017; Weagle et al., 2018) add confidence to model simulations and can inform our understanding of how aerosol chemistry responds to emission changes. However, except for Beijing, there are insufficient measurement data of how aerosol composition has changed across China in recent years. H. Li et al. (2019) found large declines in wintertime organics and sulfate and smaller declines in nitrate and ammonium in Beijing between 2014 and 2017. Zhou et al. (2019) also analysed aerosol composition data from Beijing and found large declines in all aerosol components except nitrate between the periods 2011–2012 and 2017–2018. Continuous measurements of aerosol composition across China are required to determine how different aerosol components are contributing to the observed PM2.5 trend and to evaluate simulated responses to emission changes.
4.1 PM2.5 health impacts
The control run simulated nationwide population-weighted mean PM2.5 concentration decreased by 12.8 % (10.1 µg m−3), from 79.2 µg m−3 in 2015 to 69.1 µg m−3 in 2017. Greater decreases were simulated in more polluted and highly populated regions such as Beijing (), Tianjin (), Chongqing (province) () and Henan (). Using the methodology of Burnett et al. (2018), we estimate that mortality due to exposure to PM2.5 decreased from 2 800 000 (confidence interval, CI: 2 299 000–3 302 000) premature mortalities in 2015 to 2 650 000 premature mortalities in 2017. The simulated reduction in PM2.5 concentrations therefore reduced the number of premature mortalities attributable to PM2.5 exposure by 150 000 (CI: 129 000–170 000) annual premature mortalities across China. The 12.8 % reduction in PM2.5 exposure only led to a 5 % reduction in attributable mortality due to the non-linearity of the exposure–response function, which is less sensitive at higher exposure ranges (Conibear et al., 2018). The largest absolute reductions in premature mortality occur in Henan (15 000 deaths yr−1), Sichuan, Hebei and Tianjin (11 000 deaths yr−1) (Fig. 4). The decline in PM2.5 exposure also led to reduced morbidity, with the rate of disability-adjusted life years (DALYs) per 100 000 population reduced from 159 to 150, with the largest changes occurring in central provinces such as Hubei (Supplement Fig. S3). Our results are comparable to Zheng et al. (2017), who found that population-weighted annual mean PM2.5 concentrations decreased 21.5 % during 2013–2015, resulting in a premature mortality decrease of 120 000 deaths yr−1. Ding et al. (2019) estimated that during 2013–2017, a nationwide PM2.5 decrease of caused premature mortalities per year to decrease by 287 000, using the methodology from the GBD 2015 study, which estimates health impacts as having a weaker and less linear relationship to PM2.5 concentrations. Yue et al. (2020) estimated that the annual number of mortalities in China attributable to PM2.5 decreased by 64 000 (7 %) from 2013 to 2017. Zhang et al. (2019) reported a 32 % decline in population-weighted PM2.5 concentration during 2013 to 2017, largely due to strengthened industrial emission standards and cleaner residential fuels.
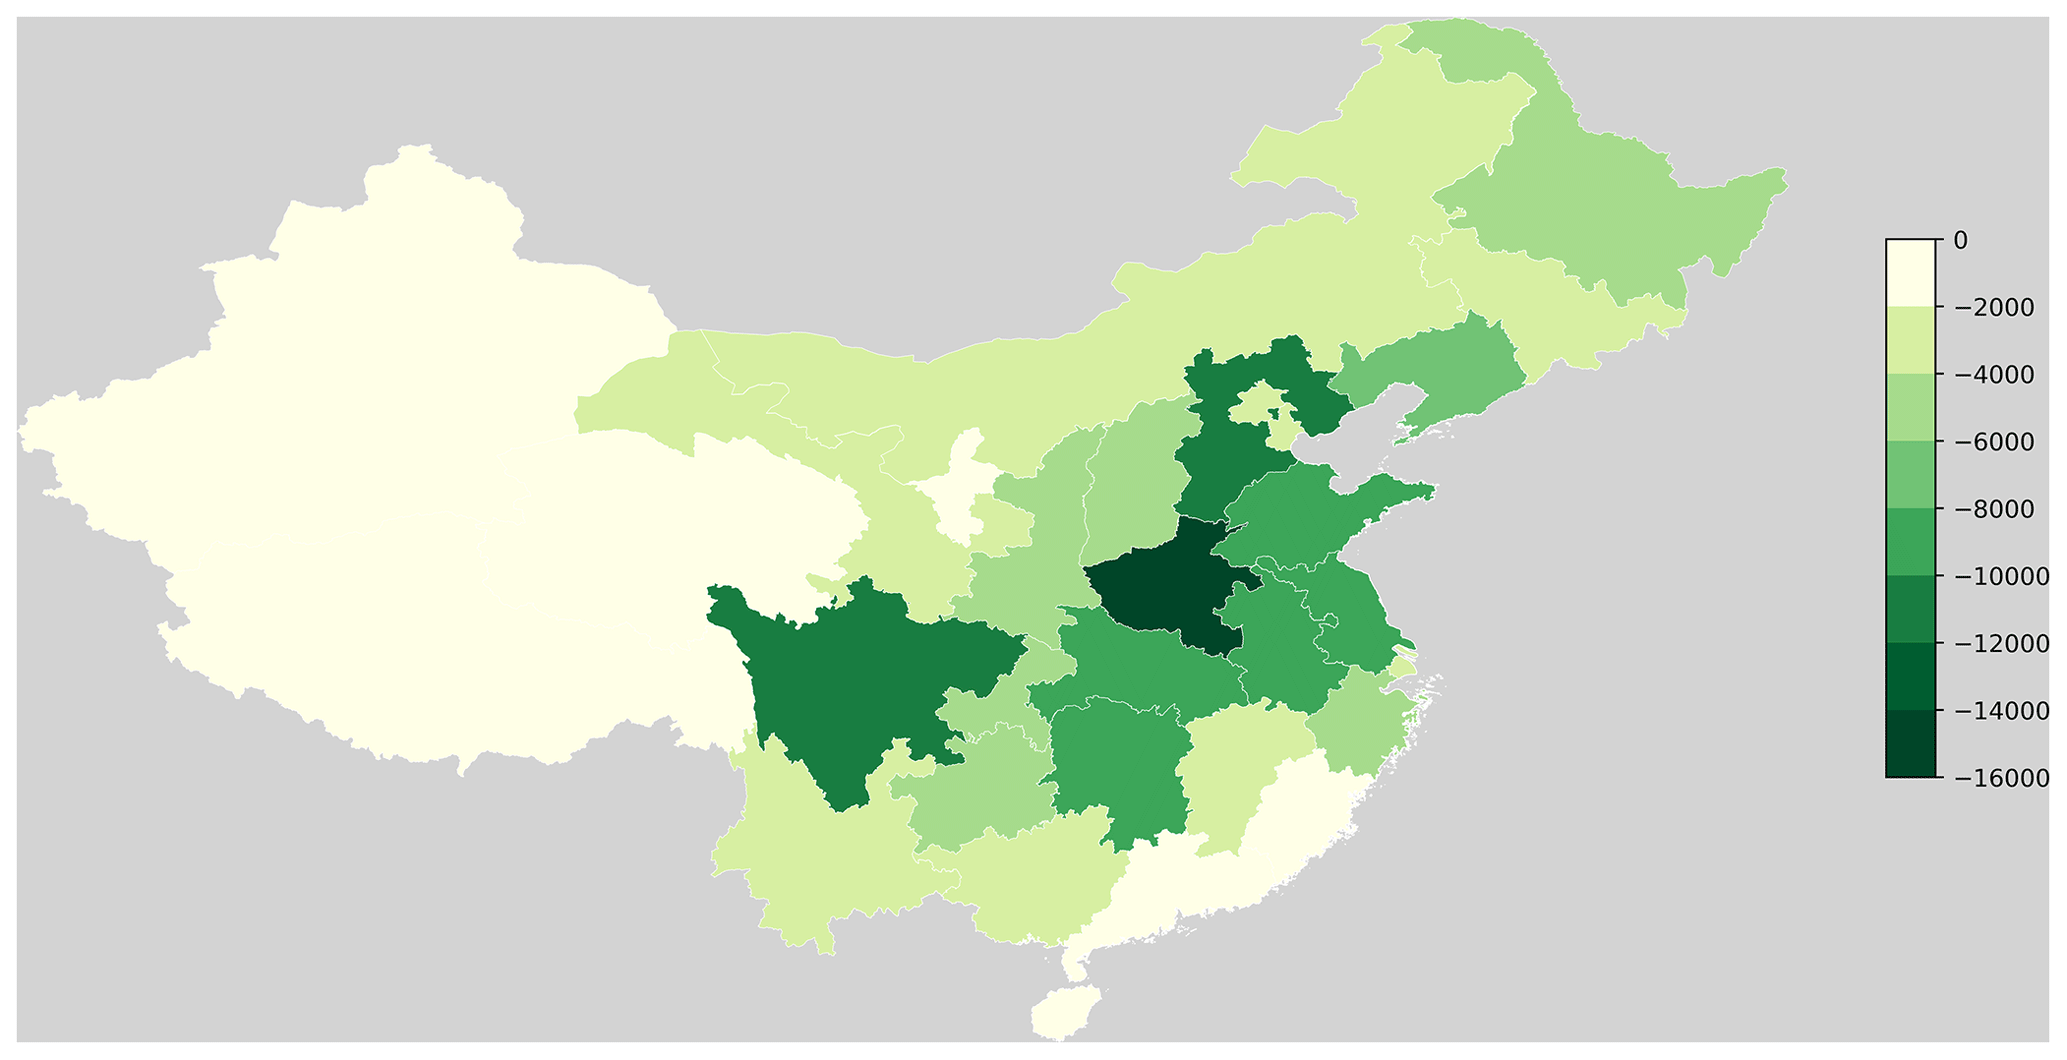
Figure 4Simulated change during 2015–2017 in annual premature mortality per year due to changes in exposure to ambient PM2.5. Results are shown at the province scale.
4.2 O3 health impacts
Increasing O3 concentrations will result in an increase in health impacts that will act to offset some of the health benefits from declining PM2.5 concentrations. WRF-Chem simulated O3 concentrations across China during 2015–2017 to within 15 % (NMB = −0.13), which is consistent with previous studies, but underestimated the magnitude of the observed O3 trend. To provide an estimate of the health impacts due to exposure to O3 we used simulated concentrations to estimate average exposure to O3 over the 2015–2017 period. We estimate that exposure to O3 caused an average of 143 000 (CI: 106 000–193 000) premature mortalities each year over 2015–2017. Applying the simulated change in O3 concentrations would underestimate the change in exposure that has occurred. Instead, we estimated the impacts of increased O3 by multiplying the average health impacts over 2015–2017 by the measured relative change in O3MDA8. Assuming linear behaviour, the 15 % measured increase in O3MDA8 would result in an increase of 21 000 premature mortalities per year. The exposure–outcome function is in reality sub-linear, so this is likely to be an overestimate. Regardless, this is substantially smaller than the 150 000 reduction in annual premature mortality due to reduced PM2.5. We therefore suggest that changes in Chinese air pollution over 2015–2017 have likely had an overall beneficial impact on human health. The dominance of the PM2.5 reduction over the O3 increase on health impacts is also found in Dang and Liao (2019), who reported that a 21 % reduction in PM2.5 and a 12 % increase in O3 concentration between 2012 and 2017 resulted in 268 000 fewer annual mortalities overall.
We used the WRF-Chem model to explore the drivers and impacts of changing air pollution across China during 2015–2017. A simulation with annually updated emissions was able to reproduce the measured negative trends in PM2.5 concentrations over China during 2015–2017 while overestimating the negative trend in SO2 and NO2 and underestimating the positive trend in O3. By comparing this with a simulation where emissions are held constant at 2015 levels, but meteorological forcing was updated, we show that interannual meteorological variation was not the main driver of the substantial trends in air pollutants that were observed across China during 2015–2017. Our work shows that reduced anthropogenic emissions are the main cause of reduced PM2.5 concentrations across China, suggesting that the Chinese government's “Air Pollution Prevention and Control Action Plan” has been effective at starting to control particulate pollution. We estimate that the 12.8 % reduction in population-weighted PM2.5 concentrations that occurred during 2015–2017 has reduced premature mortality due to exposure to PM2.5 by 5.3 %, preventing 150 000 premature mortalities across China annually. Despite these substantial reductions, PM2.5 concentrations still exceed air quality guidelines and cause negative impacts on human health. We estimate that exposure to O3 during 2015–2017 causes on average 143 000 premature mortalities across China each year. Increases in O3 concentration over 2015–2017 may have increased this annual mortality by about 20 000 premature mortalities per year, substantially less than the reduction in premature mortality due to declining particulate pollution. Changes in air pollution across China during 2015–2017 are therefore likely to have led to overall positive benefits to human health, amounting to a ∼5 % reduction of the ambient air pollution disease burden. However, to achieve larger reductions in disease burden, further reductions in PM2.5 concentrations are required, and pollution controls need to be designed that simultaneously reduce PM2.5 and O3 concentrations.
Data associated with this work have been made available at: https://doi.org/10.5518/878 (Silver et al., 2020), including the full trend results and the mainland China air quality stations' measurement dataset. Air quality measurement data from Hong Kong are available from https://cd.epic.epd.gov.hk/EPICDI/air/station/ (Environmental Protection Department of HKSAR, 2020). Air quality monitoring data from Taiwan are available from https://airtw.epa.gov.tw/CHT/Query/His_Data.aspx (Environmental Protection Administration Executive Yuan, R.O.C. (Taiwan), 2020).
The supplement related to this article is available online at: https://doi.org/10.5194/acp-20-11683-2020-supplement.
BS, CLR, DVS and SRA designed the research. BS performed the WRF-Chem model simulations, analysed all the model data and wrote the manuscript. LC performed the health impact calculations. All authors contributed to scientific discussions and to the manuscript.
The authors declare that they have no conflict of interest.
Model simulations were undertaken on ARC3, part of the High Performance Computing facilities at the University of Leeds. We thank Qiang Zhang and Meng Li for providing MEIC data. We acknowledge use of the WRF-Chem preprocessor tools bio_emiss, anthro_emiss, fire_emiss and mozbc provided by the Atmospheric Chemistry Observations and Modeling Lab (ACOM) of the NCAR. MOZART-4 global model output is available at http://www.acom.ucar.edu/wrf-chem/mozart.shtml (last access: 12 December 2018). We thank the SPARTAN project for its effort in establishing and maintaining the site in Beijing. SPARTAN was initiated with funding from the Natural Sciences and Engineering Research Council of Canada.
This research has been supported by the NERC (grant nos. NE/S006680/1 and NE/N006895/1) and the AIA Group Limited.
This paper was edited by Paul Zieger and reviewed by two anonymous referees.
Ansari, T. U., Wild, O., Li, J., Yang, T., Xu, W., Sun, Y., and Wang, Z.: Effectiveness of short-term air quality emission controls: a high-resolution model study of Beijing during the Asia-Pacific Economic Cooperation (APEC) summit period, Atmos. Chem. Phys., 19, 8651–8668, https://doi.org/10.5194/acp-19-8651-2019, 2019.
Apte, J. S., Marshall, J. D., Cohen, A. J., and Brauer, M.: Addressing Global Mortality from Ambient PM2.5, Environ. Sci. Technol., 49, 8057–8066, https://doi.org/10.1021/acs.est.5b01236, 2015.
Burnett, R., Chen, H., Szyszkowicz, M., Fann, N., Hubbell, B., Pope, C. A., Apte, J. S., Brauer, M., Cohen, A., Weichenthal, S., Coggins, J., Di, Q., Brunekreef, B., Frostad, J., Lim, S. S., Kan, H., Walker, K. D., Thurston, G. D., Hayes, R. B., Lim, C. C., Turner, M. C., Jerrett, M., Krewski, D., Gapstur, S. M., Diver, W. R., Ostro, B., Goldberg, D., Crouse, D. L., Martin, R. V, Peters, P., Pinault, L., Tjepkema, M., van Donkelaar, A., Villeneuve, P. J., Miller, A. B., Yin, P., Zhou, M., Wang, L., Janssen, N. A. H., Marra, M., Atkinson, R. W., Tsang, H., Quoc Thach, T., Cannon, J. B., Allen, R. T., Hart, J. E., Laden, F., Cesaroni, G., Forastiere, F., Weinmayr, G., Jaensch, A., Nagel, G., Concin, H., Spadaro, J. V., and Spadaro, J. V.: Global estimates of mortality associated with long-term exposure to outdoor fine particulate matter, P. Natl. Acad. Sci. USA, 115, 9592–9597, https://doi.org/10.1073/pnas.1803222115, 2018.
Butt, E. W., Turnock, S. T., Rigby, R., Reddington, C. L., Yoshioka, M., Johnson, J. S., Regayre, L. A., Pringle, K. J., Mann, G. W., and Spracklen, D. V.: Global and regional trends in particulate air pollution and attributable health burden over the past 50 years, Environ. Res. Lett., 12, 104017, https://doi.org/10.1088/1748-9326/aa87be, 2017.
Carslaw, D.: The openair manual open-source tools for analysing air pollution data, King's Coll. London, (January), 287, available at: https://davidcarslaw.com/files/openairmanual.pdf (last access: 6 October 2020.), 2015
Carslaw, D. C. and Ropkins, K.: openair–Data Analysis Tools for the Air Quality Community, The R Journal, 4, 20–29, 2012.
Chang, S. C. and Lee, C. T.: Evaluation of the trend of air quality in Taipei, Taiwan from 1994 to 2003, Environ. Monit. Assess., 127, 87–96 , https://doi.org/10.1007/s10661-006-9262-1, 2007.
Chen, D., Liu, Z., Ban, J., Zhao, P., and Chen, M.: Retrospective analysis of 2015–2017 wintertime PM2.5 in China: response to emission regulations and the role of meteorology, Atmos. Chem. Phys., 19, 7409–7427, https://doi.org/10.5194/acp-19-7409-2019, 2019.
Cheng, J., Su, J., Cui, T., Li, X., Dong, X., Sun, F., Yang, Y., Tong, D., Zheng, Y., Li, Y., Li, J., Zhang, Q., and He, K.: Dominant role of emission reduction in PM2.5 air quality improvement in Beijing during 2013–2017: a model-based decomposition analysis, Atmos. Chem. Phys., 19, 6125–6146, https://doi.org/10.5194/acp-19-6125-2019, 2019.
Cohen, A. J., Brauer, M., Burnett, R., Anderson, H. R., Frostad, J., Estep, K., Balakrishnan, K., Brunekreef, B., Dandona, L., Dandona, R., Feigin, V., Freedman, G., Hubbell, B., Jobling, A., Kan, H., Knibbs, L., Liu, Y., Martin, R., Morawska, L., Pope, C. A., Shin, H., Straif, K., Shaddick, G., Thomas, M., van Dingenen, R., van Donkelaar, A., Vos, T., Murray, C. J. L., and Forouzanfar, M. H.: Estimates and 25-year trends of the global burden of disease attributable to ambient air pollution: an analysis of data from the Global Burden of Diseases Study 2015, Lancet, 389, 1907–1918, https://doi.org/10.1016/S0140-6736(17)30505-6, 2017.
Conibear, L., Butt, E. W., Knote, C., Arnold, S. R., and Spracklen, D. V.: Residential energy use emissions dominate health impacts from exposure to ambient particulate matter in India, Nat. Commun., 9, 109, https://doi.org/10.1038/s41467-018-02986-7, 2018.
Cui, Y., Lin, J., Song, C., Liu, M., Yan, Y., Xu, Y., and Huang, B.: Rapid growth in nitrogen dioxide pollution over Western China, 2005–2013, Atmos. Chem. Phys., 16, 6207–6221, https://doi.org/10.5194/acp-16-6207-2016, 2016.
Dang, R. and Liao, H.: Radiative Forcing and Health Impact of Aerosols and Ozone in China as the Consequence of Clean Air Actions over 2012–2017, Geophys. Res. Lett., 46, 12511–12519, https://doi.org/10.1029/2019GL084605, 2019.
De Foy, B., Lu, Z., and Streets, D. G.: Satellite NO2 retrievals suggest China has exceeded its NOx reduction goals from the twelfth Five-Year Plan, Sci. Rep., 6, 35912, https://doi.org/10.1038/srep35912, 2016.
Ding, D., Xing, J., Wang, S., Liu, K., and Hao, J.: Estimated Contributions of Emissions Controls, Meteorological Factors, Population Growth, and Changes in Baseline Mortality to Reductions in Ambient PM2.5 and PM2.5-Related Mortality in China, 2013–2017, Environ. Health Perspect., 127, 067009, https://doi.org/10.1289/EHP4157, 2019.
Duan, L., Yu, Q., Zhang, Q., Wang, Z., Pan, Y., Larssen, T., Tang, J., and Mulder, J.: Acid deposition in Asia: Emissions, deposition, and ecosystem effects, Atmos. Environ., 146, 55–69, https://doi.org/10.1016/j.atmosenv.2016.07.018, 2016.
Emmons, L. K., Walters, S., Hess, P. G., Lamarque, J.-F., Pfister, G. G., Fillmore, D., Granier, C., Guenther, A., Kinnison, D., Laepple, T., Orlando, J., Tie, X., Tyndall, G., Wiedinmyer, C., Baughcum, S. L., and Kloster, S.: Description and evaluation of the Model for Ozone and Related chemical Tracers, version 4 (MOZART-4), Geosci. Model Dev., 3, 43–67, https://doi.org/10.5194/gmd-3-43-2010, 2010.
Environmental Protection Administration Executive Yuan, R.O.C. (Taiwan): Air quality Monitoring data, available at: https://airtw.epa.gov.tw/CHT/Query/His_Data.aspx, last access: 6 October 2020.
Environmental Protection Department of HKSAR: Air Quality Monitoring Data, available at: https://cd.epic.epd.gov.hk/EPICDI/air/station/, last access: 6 October 2020.
Feng, Y., Ning, M., Lei, Y., Sun, Y., Liu, W., and Wang, J.: Defending blue sky in China: Effectiveness of the “Air Pollution Prevention and Control Action Plan” on air quality improvements from 2013 to 2017, J. Environ. Manage., 252, 109603, https://doi.org/10.1016/J.JENVMAN.2019.109603, 2019.
GBD 2017 Risk Factor Collaborators (Stanaway, J. D., Afshin, A., Gakidou, E., et al.): Global, regional, and national comparative risk assessment of 84 behavioural, environmental and occupational, and metabolic risks or clusters of risks for 195 countries and territories, 1990–2017: A systematic analysis for the Global Burden of Disease Stu, Lancet, 392, 1923, https://doi.org/10.1016/S0140-6736(18)32225-6, 2018.
Gen, M., Zhang, R., Huang, D. D., Li, Y., and Chan, C. K.: Heterogeneous Oxidation of SO2 in Sulfate Production during Nitrate Photolysis at 300 nm: Effect of pH, Relative Humidity, Irradiation Intensity, and the Presence of Organic Compounds, Environ. Sci. Technol., 53, 8757–8766, https://doi.org/10.1021/acs.est.9b01623, 2019.
Grell, G. A., Peckham, S. E., Schmitz, R., McKeen, S. A., Frost, G., Skamarock, W. C., and Eder, B.: Fully coupled “online” chemistry within the WRF model, Atmos. Environ., 39, 6957–6975, https://doi.org/10.1016/j.atmosenv.2005.04.027, 2005.
Gu, Y. and Yim, S. H. L.: The air quality and health impacts of domestic trans-boundary pollution in various regions of China, Environ. Int., 97, 117–124, https://doi.org/10.1016/j.envint.2016.08.004, 2016.
Guenther, A., Geron, C., Pierce, T., Lamb, B., Harley, P., and Fall, R.: Natural emissions of non-methane volatile organic compounds, carbon monoxide, and oxides of nitrogen from North America, Atmos. Environ., 34, 2205–2230, https://doi.org/10.1016/S1352-2310(99)00465-3, 2000.
Hodzic, A. and Jimenez, J. L.: Modeling anthropogenically controlled secondary organic aerosols in a megacity: a simplified framework for global and climate models, Geosci. Model Dev., 4, 901–917, https://doi.org/10.5194/gmd-4-901-2011, 2011.
Hodzic, A. and Knote, C.: WRF-Chem 3.6.1: MOZART gasphase chemistry with MOSAIC aerosols, Atmos. Chem. Div. (ACD), Natl. Cent. Atmos. Res., 1–9, available at: https://www2.acom.ucar.edu/sites/default/files/wrf-chem/MOZART_MOSAIC_V3.6.readme_dec2016.pdf (last access: 14 October 2020), 2014.
Hong, C., Zhang, Q., He, K., Guan, D., Li, M., Liu, F., and Zheng, B.: Variations of China's emission estimates: response to uncertainties in energy statistics, Atmos. Chem. Phys., 17, 1227–1239, https://doi.org/10.5194/acp-17-1227-2017, 2017.
Huang, J., Pan, X., Guo, X., and Li, G.: Health impact of China's Air Pollution Prevention and Control Action Plan: an analysis of national air quality monitoring and mortality data, Lancet Planet. Heal., 2, e313–e323, https://doi.org/10.1016/S2542-5196(18)30141-4, 2018.
Irie, H., Muto, T., Itahashi, S., Kurokawa, J., and Uno, I.: Turnaround of Tropospheric Nitrogen Dioxide Pollution Trends in China, Japan, and South Korea, Sola, 12, 170–174, https://doi.org/10.2151/sola.2016-035, 2016.
Jacob, D. J. and Winner, D. A.: Effect of climate change on air quality, Atmos. Environ., 43, 51–63, https://doi.org/10.1016/j.atmosenv.2008.09.051, 2009.
Jin, X. and Holloway, T.: Spatial and temporal variability of ozone sensitivity over China observed from the Ozone Monitoring Instrument, J. Geophys. Res., 120, 7229–7246, https://doi.org/10.1002/2015JD023250, 2015.
Krotkov, N. A., McLinden, C. A., Li, C., Lamsal, L. N., Celarier, E. A., Marchenko, S. V., Swartz, W. H., Bucsela, E. J., Joiner, J., Duncan, B. N., Boersma, K. F., Veefkind, J. P., Levelt, P. F., Fioletov, V. E., Dickerson, R. R., He, H., Lu, Z., and Streets, D. G.: Aura OMI observations of regional SO2 and NO2 pollution changes from 2005 to 2015, Atmos. Chem. Phys., 16, 4605–4629, https://doi.org/10.5194/acp-16-4605-2016, 2016.
LeGrand, S. L., Polashenski, C., Letcher, T. W., Creighton, G. A., Peckham, S. E., and Cetola, J. D.: The AFWA dust emission scheme for the GOCART aerosol model in WRF-Chem v3.8.1, Geosci. Model Dev., 12, 131–166, https://doi.org/10.5194/gmd-12-131-2019, 2019.
Lelieveld, J., Evans, J. S., Fnais, M., Giannadaki, D., and Pozzer, A.: The contribution of outdoor air pollution sources to premature mortality on a global scale, Nature, 525, 367–371, https://doi.org/10.1038/nature15371, 2015.
Li, H., Cheng, J., Zhang, Q., Zheng, B., Zhang, Y., Zheng, G., and He, K.: Rapid transition in winter aerosol composition in Beijing from 2014 to 2017: response to clean air actions, Atmos. Chem. Phys., 19, 11485–11499, https://doi.org/10.5194/acp-19-11485-2019, 2019.
Li, K. and Bai, K.: Spatiotemporal Associations between PM2.5 and SO2 as well as NO2 in China from 2015 to 2018, Int. J. Environ. Res. Public Health, 16, 2352, https://doi.org/10.3390/ijerph16132352, 2019.
Li, K., Jacob, D. J., Liao, H., Shen, L., Zhang, Q., and Bates, K. H.: Anthropogenic drivers of 2013–2017 trends in summer surface ozone in China, P. Natl. Acad. Sci. USA, 116, 422–427, https://doi.org/10.1073/pnas.1812168116, 2019.
Li, M., Liu, H., Geng, G., Hong, C., Liu, F., Song, Y., Tong, D., Zheng, B., Cui, H., Man, H., Zhang, Q., and He, K.: Anthropogenic emission inventories in China: A review, Natl. Sci. Rev., 4, 834–866, https://doi.org/10.1093/nsr/nwx150, 2017.
Li, R., Bo, H., and Wang, Y.: Slowing-down reduction and Possible Reversal Trend of Tropospheric NO2 over China during 2016 to 2019, available at: http://arxiv.org/abs/1907.06525 (last access: 23 September 2019), 2019.
Li, Y. J., Sun, Y., Zhang, Q., Li, X., Li, M., Zhou, Z., and Chan, C. K.: Real-time chemical characterization of atmospheric particulate matter in China: A review, Atmos. Environ., 158, 270–304, https://doi.org/10.1016/j.atmosenv.2017.02.027, 2017.
Liu, Y. and Wang, T.: Worsening urban ozone pollution in China from 2013 to 2017 – Part 1: The complex and varying roles of meteorology, Atmos. Chem. Phys., 20, 6305–6321, https://doi.org/10.5194/acp-20-6305-2020, 2020a.
Liu, Y. and Wang, T.: Worsening urban ozone pollution in China from 2013 to 2017 – Part 2: The effects of emission changes and implications for multi-pollutant control, Atmos. Chem. Phys., 20, 6323–6337, https://doi.org/10.5194/acp-20-6323-2020, 2020b.
Lu, X., Zhang, L., Chen, Y., Zhou, M., Zheng, B., Li, K., Liu, Y., Lin, J., Fu, T.-M., and Zhang, Q.: Exploring 2016–2017 surface ozone pollution over China: source contributions and meteorological influences, Atmos. Chem. Phys., 19, 8339–8361, https://doi.org/10.5194/acp-19-8339-2019, 2019.
Lu, X., Zhang, L., Wang, X., Gao, M., Li, K., Zhang, Y., Yue, X., and Zhang, Y.: Rapid Increases in Warm-Season Surface Ozone and Resulting Health Impact in China since 2013, Environ. Sci. Technol. Lett., 7, 240–247, https://doi.org/10.1021/acs.estlett.0c00171, 2020.
Ma, Z., Hu, X., Sayer, A. M., Levy, R., Zhang, Q., Xue, Y., Tong, S., Bi, J., Huang, L., and Liu, Y.: Satellite-based spatiotemporal trends in PM2.5 concentrations: China, 2004–2013, Environ. Health Perspect., 124, 184–192, https://doi.org/10.1289/ehp.1409481, 2016.
Otte, T. L., Nolte, C. G., Otte, M. J., and Bowden, J. H.: Does nudging squelch the extremes in regional climate modeling?, J. Clim., 25, 7046–7066, https://doi.org/10.1175/JCLI-D-12-00048.1, 2012.
Reddington, C. L., Conibear, L., Knote, C., Silver, B. J., Li, Y. J., Chan, C. K., Arnold, S. R., and Spracklen, D. V.: Exploring the impacts of anthropogenic emission sectors onPM2.5 and human health in South and East Asia, Atmos. Chem. Phys., 19, 11887–11910, https://doi.org/10.5194/acp-19-11887-2019, 2019.
Shao, J., Chen, Q., Wang, Y., Lu, X., He, P., Sun, Y., Shah, V., Martin, R. V., Philip, S., Song, S., Zhao, Y., Xie, Z., Zhang, L., and Alexander, B.: Heterogeneous sulfate aerosol formation mechanisms during wintertime Chinese haze events: air quality model assessment using observations of sulfate oxygen isotopes in Beijing, Atmos. Chem. Phys., 19, 6107–6123, https://doi.org/10.5194/acp-19-6107-2019, 2019.
Silver, B., Reddington, C. L., Arnold, S. R., and Spracklen, D. V.: Substantial changes in air pollution across China during 2015–2017, Environ. Res. Lett., 13, 114012, doi:10.1088/1748-9326/aae718, 2018.
Silver, B., Conibear, L., Reddington, C. L., Knote, C., Arnold, S. R., and Spracklen, D. V.: Data for `Pollutant emission reductions deliver decreased PM2.5-caused mortality across China during 2015–2017', University of Leeds, https://doi.org/10.5518/878, 2020.
Snider, G., Weagle, C. L., Martin, R. V., van Donkelaar, A., Conrad, K., Cunningham, D., Gordon, C., Zwicker, M., Akoshile, C., Artaxo, P., Anh, N. X., Brook, J., Dong, J., Garland, R. M., Greenwald, R., Griffith, D., He, K., Holben, B. N., Kahn, R., Koren, I., Lagrosas, N., Lestari, P., Ma, Z., Vanderlei Martins, J., Quel, E. J., Rudich, Y., Salam, A., Tripathi, S. N., Yu, C., Zhang, Q., Zhang, Y., Brauer, M., Cohen, A., Gibson, M. D., and Liu, Y.: SPARTAN: a global network to evaluate and enhance satellite-based estimates of ground-level particulate matter for global health applications, Atmos. Meas. Tech., 8, 505–521, https://doi.org/10.5194/amt-8-505-2015, 2015.
Snider, G., Weagle, C. L., Murdymootoo, K. K., Ring, A., Ritchie, Y., Stone, E., Walsh, A., Akoshile, C., Anh, N. X., Balasubramanian, R., Brook, J., Qonitan, F. D., Dong, J., Griffith, D., He, K., Holben, B. N., Kahn, R., Lagrosas, N., Lestari, P., Ma, Z., Misra, A., Norford, L. K., Quel, E. J., Salam, A., Schichtel, B., Segev, L., Tripathi, S., Wang, C., Yu, C., Zhang, Q., Zhang, Y., Brauer, M., Cohen, A., Gibson, M. D., Liu, Y., Martins, J. V., Rudich, Y., and Martin, R. V.: Variation in global chemical composition of PM2.5: emerging results from SPARTAN, Atmos. Chem. Phys., 16, 9629–9653, https://doi.org/10.5194/acp-16-9629-2016, 2016.
Streets, D. G., Yu, C., Wu, Y., Chin, M., Zhao, Z., Hayasaka, T., and Shi, G.: Aerosol trends over China, 1980–2000, Atmos. Res., 88, 174–182, https://doi.org/10.1016/J.ATMOSRES.2007.10.016, 2008.
Tai, A. P. K., Mickley, L. J., and Jacob, D. J.: Correlations between fine particulate matter (PM2.5) and meteorological variables in the United States: Implications for the sensitivity of PM2.5 to climate change, Atmos. Environ., 44, 3976–3984, https://doi.org/10.1016/j.atmosenv.2010.06.060, 2010.
van der A, R. J., Peters, D. H. M. U., Eskes, H., Boersma, K. F., Van Roozendael, M., De Smedt, I., and Kelder, H. M.: Detection of the trend and seasonal variation in tropospheric NO2 over China, J. Geophys. Res.-Atmos., 111, https://doi.org/10.1029/2005JD006594, 2006.
van der A, R. J., Mijling, B., Ding, J., Koukouli, M. E., Liu, F., Li, Q., Mao, H., and Theys, N.: Cleaning up the air: effectiveness of air quality policy for SO2 and NOx emissions in China, Atmos. Chem. Phys., 17, 1775–1789, https://doi.org/10.5194/acp-17-1775-2017, 2017.
Wang, S., Li, G., Gong, Z., Du, L., Zhou, Q., Meng, X., Xie, S., and Zhou, L.: Spatial distribution, seasonal variation and regionalization of PM2.5 concentrations in China, Sci. China Chem., 58, 1435–1443, https://doi.org/10.1007/s11426-015-5468-9, 2015.
Weagle, C. L., Snider, G., Li, C., Van Donkelaar, A., Philip, S., Bissonnette, P., Burke, J., Jackson, J., Latimer, R., Stone, E., Abboud, I., Akoshile, C., Anh, N. X., Brook, J. R., Cohen, A., Dong, J., Gibson, M. D., Griffith, D., He, K. B., Holben, B. N., Kahn, R., Keller, C. A., Kim, J. S., Lagrosas, N., Lestari, P., Khian, Y. L., Liu, Y., Marais, E. A., Martins, J. V., Misra, A., Muliane, U., Pratiwi, R., Quel, E. J., Salam, A., Segev, L., Tripathi, S. N., Wang, C., Zhang, Q., Brauer, M., Rudich, Y., and Martin, R. V.: Global Sources of Fine Particulate Matter: Interpretation of PM2.5 Chemical Composition Observed by SPARTAN using a Global Chemical Transport Model, Environ. Sci. Technol., 52, 11670–11681, https://doi.org/10.1021/acs.est.8b01658, 2018.
Wiedinmyer, C., Akagi, S. K., Yokelson, R. J., Emmons, L. K., Al-Saadi, J. A., Orlando, J. J., and Soja, A. J.: The Fire INventory from NCAR (FINN): a high resolution global model to estimate the emissions from open burning, Geosci. Model Dev., 4, 625–641, https://doi.org/10.5194/gmd-4-625-2011, 2011.
Xing, J., Zhang, Y., Wang, S., Liu, X., Cheng, S., Zhang, Q., Chen, Y., Streets, D. G., Jang, C., Hao, J., and Wang, W.: Modeling study on the air quality impacts from emission reductions and atypical meteorological conditions during the 2008 Beijing Olympics, Atmos. Environ., 45, 1786–1798, https://doi.org/10.1016/J.ATMOSENV.2011.01.025, 2011.
Xu, W., Lin, W., Xu, X., Tang, J., Huang, J., Wu, H., and Zhang, X.: Long-term trends of surface ozone and its influencing factors at the Mt Waliguan GAW station, China – Part 1: Overall trends and characteristics, Atmos. Chem. Phys., 16, 6191–6205, https://doi.org/10.5194/acp-16-6191-2016, 2016.
Xue, L., Wang, T., Louie, P. K. K., Luk, C. W. Y., Blake, D. R., and Xu, Z.: Increasing External Effects Negate Local Efforts to Control Ozone Air Pollution: A Case Study of Hong Kong and Implications for Other Chinese Cities, Environ. Sci. Technol., 48, 10769–10775, https://doi.org/10.1021/es503278g, 2014.
Yue, H., He, C., Huang, Q., Yin, D., and Bryan, B. A.: Stronger policy required to substantially reduce deaths from PM2.5 pollution in China, Nat. Commun., 11, 1–10, https://doi.org/10.1038/s41467-020-15319-4, 2020.
Zaveri, R. A., Easter, R. C., Fast, J. D., and Peters, L. K.: Model for Simulating Aerosol Interactions and Chemistry (MOSAIC), J. Geophys. Res.-Atmos., 113, https://doi.org/10.1029/2007JD008782, 2008.
Zhai, S., Jacob, D. J., Wang, X., Shen, L., Li, K., Zhang, Y., Gui, K., Zhao, T., and Liao, H.: Fine particulate matter (PM2.5) trends in China, 2013–2018: separating contributions from anthropogenic emissions and meteorology, Atmos. Chem. Phys., 19, 11031–11041, https://doi.org/10.5194/acp-19-11031-2019, 2019.
Zhang, H., Wang, S., Hao, J., Wang, X., Wang, S., Chai, F., and Li, M.: Air pollution and control action in Beijing, J. Clean. Prod., 112, 1519–1527, https://doi.org/10.1016/j.jclepro.2015.04.092, 2016.
Zhang, L., Lee, C. S., Zhang, R., and Chen, L.: Spatial and temporal evaluation of long term trend (2005–2014) of OMI retrieved NO2 and SO2 concentrations in Henan Province, China, Atmos. Environ., 154, 151–166, https://doi.org/10.1016/j.atmosenv.2016.11.067, 2017.
Zhang, Q., Geng, G. N., Wang, S. W., Richter, A., and He, K. Bin: Satellite remote sensing of changes in NOx emissions over China during 1996–2010, Chinese Sci. Bull., 57, 2857–2864, https://doi.org/10.1007/s11434-012-5015-4, 2012.
Zhang, Q., Yuan, B., Shao, M., Wang, X., Lu, S., Lu, K., Wang, M., Chen, L., Chang, C.-C., and Liu, S. C.: Variations of ground-level O3 and its precursors in Beijing in summertime between 2005 and 2011, Atmos. Chem. Phys., 14, 6089–6101, https://doi.org/10.5194/acp-14-6089-2014, 2014.
Zhang, Q., Zheng, Y., Tong, D., Shao, M., Wang, S., Zhang, Y., Xu, X., Wang, J., He, H., Liu, W., Ding, Y., Lei, Y., Li, J., Wang, Z., Zhang, X., Wang, Y., Cheng, J., Liu, Y., Shi, Q., Yan, L., Geng, G., Hong, C., Li, M., Liu, F., Zheng, B., Cao, J., Ding, A., Gao, J., Fu, Q., Huo, J., Liu, B., Liu, Z., Yang, F., He, K., and Hao, J.: Drivers of improved PM2.5 air quality in China from 2013 to 2017, Proc. Natl. Acad. Sci. USA., 116, 24463–24469, https://doi.org/10.1073/pnas.1907956116, 2019.
Zheng, B., Tong, D., Li, M., Liu, F., Hong, C., Geng, G., Li, H., Li, X., Peng, L., Qi, J., Yan, L., Zhang, Y., Zhao, H., Zheng, Y., He, K., and Zhang, Q.: Trends in China's anthropogenic emissions since 2010 as the consequence of clean air actions, Atmos. Chem. Phys., 18, 14095–14111, https://doi.org/10.5194/acp-18-14095-2018, 2018.
Zheng, Y., Xue, T., Zhang, Q., Geng, G., Tong, D., Li, X., and He, K.: Air quality improvements and health benefits from China's clean air action since 2013, Environ. Res. Lett., 12, 114020, https://doi.org/10.1088/1748-9326/aa8a32, 2017.
Zhou, W., Gao, M., He, Y., Wang, Q., Xie, C., Xu, W., Zhao, J., Du, W., Qiu, Y., Lei, L., Fu, P., Wang, Z., Worsnop, D. R., Zhang, Q., and Sun, Y.: Response of aerosol chemistry to clean air action in Beijing, China: Insights from two-year ACSM measurements and model simulations, Environ. Pollut., 255, 113345, https://doi.org/10.1016/j.envpol.2019.113345, 2019.