the Creative Commons Attribution 4.0 License.
the Creative Commons Attribution 4.0 License.
 | 13 Oct 2020
Aerosol light absorption and the role of extremely low volatility organic compounds
Antonios Tasoglou
Evangelos Louvaris
Kalliopi Florou
Aikaterini Liangou
Eleni Karnezi
Christos Kaltsonoudis
Ningxin Wang
Spyros N. Pandis
A month-long set of summertime measurements in a remote area in the Mediterranean is used to quantify aerosol absorption and the role of black and brown carbon. The suite of instruments included a high-resolution aerosol mass spectrometer (HR-ToF-AMS) and a scanning mobility particle sizer (SMPS), both coupled to a thermodenuder and an Aethalometer, a photoacoustic extinctiometer (PAX405), and a single particle soot photometer (SP2).
The average refractory black carbon (rBC) concentration during the campaign was 0.14 µg m−3, representing 3 % of the fine aerosol mass. The measured light absorption was two or more times higher than that of fresh black carbon (BC). Mie theory indicated that the absorption enhancement due to the coating of BC cores by nonrefractory material could explain only part of this absorption enhancement. The role of brown carbon (BrC) and other non-BC light-absorbing material was then investigated. A good correlation (R2=0.76) between the unexplained absorption and the concentration of extremely low volatility organic compounds (ELVOCs) mass was found.
- Article
(1596 KB) - Full-text XML
-
Supplement
(1497 KB) - BibTeX
- EndNote


Atmospheric aerosol may influence climate in two ways, namely directly, through scattering and absorbing radiation, and indirectly, through acting as cloud condensation nuclei (IPCC, 2011). Black carbon (BC) is the dominant light-absorbing aerosol component. BC is a distinct type of carbonaceous material that is formed mainly during combustion processes. In addition, some organic compounds have the ability to absorb sunlight. The organic aerosol (OA) with strong OA light absorption is called brown carbon (BrC; Andreae et al., 2006).
The absorption of BC depends on its mixing state (Liu et al., 2015, 2017). Usually, BC is coated with scattering material, causing its light absorption to increase due to the lensing effect (Fuller et al., 1999; Jacobson, 2001; Bond et al., 2006; Lack and Cappa, 2010). The absorption enhancement (Eabs) is defined as the ratio of the aerosol absorption coefficient (babs) over the babs of the pure BC particles. The Eabs accounts for the combined effects of lensing and the presence of BrC. This enhancement can also be calculated by the ratio of the equivalent mass absorption cross sections (MACs). The MAC is defined as the ratio of babs over the BC mass. The MAC of pure, uncoated BC at a specific wavelength depends not only on the size distribution of the particles but also on their morphology (fresh aggregates versus collapsed more spherical structures). Forestieri et al. (2018) measured the size-dependent MAC for particles with a diameter lower than 160 nm. Radney et al. (2014) and Dastanpour et al. (2017) showed that the MAC is proportional to particle mass. Based on Bond et al. (2006), pure BC particles in the 10–350 nm diameter range have an expected MAC550 = 3.9–6.8 m2 g−1 and MAC405 = 5.3–9.2 m2 g−1. The Eabs can be measured by using a thermodenuder (TD) for the removal of the nonrefractory coating material from the BC-containing particles, or it can be estimated using theoretical models (for example Mie or Rayleigh–Debye–Gans theory) if the size of the primary spherules is known. Incomplete removal of the nonrefractory material in the TD can lead to underestimation of the Eabs (Healy et al., 2015; McMeeking et al., 2014).
Previous studies have demonstrated that lensing has a wide range of effects on the light absorption of BC. Liu et al. (2015) quantified the Eabs in a rural area near London during the winter. Using the TD method, they found a campaign average Eabs of 1.3 at 405 nm and 1.4 at 781 nm. They also estimated the Eabs, combining their measurements with a reference MAC from the literature. At the large wavelength the two methods agreed, but this was not the case at the lower wavelength. In addition, they showed that there was continuous change in Eabs, with increasing RBC. The RBC was defined as the ratio of the nonrefractory black carbon mass to the refractory black carbon (rBC) mass in BC-containing particles. Finally, this study suggested that the lower volatility BrC had stronger absorption than the semivolatile BrC. Knox et al. (2009) performed measurements in downtown Toronto, during the wintertime, using a TD at 340 ∘C. They reported an average Eabs of 1.43 for fresh particles, based on thermal OC∕EC and photoacoustic measurements. Liu et al. (2017) combined laboratory experiments with diesel exhaust emissions and ambient measurements to show that particles with a ratio of RBC less than 1.5 (typical for traffic emissions) had a negligible lensing effect. The RBC was measured by combining an aerosol mass spectrometer (AMS) and a single particle soot photometer (SP2). When the RBC was above 3, lensing caused significant enhancement of the absorption of BC. They observed a continuous change in Eabs, with increasing RBC. Zhang et al. (2018a) presented 3 years of measurements in a suburban site outside Paris, France, influenced by both fresh and aged air masses. On average, they found an Eabs=2.07 at 370 nm and an Eabs=1.53 at 880 nm. They calculated the Eabs by measuring the absorption coefficient (babs) with an Aethalometer, while the elemental carbon (EC) was measured with thermal methods using daily filters. Zhang et al. (2018b) presented measurements in Beijing, China, during wintertime. Using Aethalometer measurements, refractory and nonrefractory particle size distributions, and Mie theory, they calculated that the lensing effect led to an Eabs ranging from 1.5 to 2 on average at 880 nm. Zanatta et al. (2018) found an average Eabs equal to 1.54 at 550 nm for measurements at the Zeppelin Arctic station. Lack et al. (2012) analyzed measurements of biomass burning plumes near Boulder, CO, during summertime. Using a TD at 200 ∘C, they found Eabs values as large as 2.5 at 404 nm and 1.7 at 532 nm. Using the absorption Angström exponent (AAE) and Mie theory calculations, they showed the presence of BrC.
Some studies have argued that Mie theory may overestimate the Eabs. Cappa et al. (2012) suggested that the absorption enhancement of BC in California in the summertime was low, with average values equal to 1.13 at 405 nm and 1.06 at 532 nm for RBC>10. For their measurements, they used a TD operated at 225–250 ∘C. Healy et al. (2015) also reported practically no enhancement in the BC absorption at 781 nm and an average Eabs=1.19 at 405 nm in Toronto, Canada, during summertime. During a period associated with wildfires, the same authors measured RBC=6.9 and an average Eabs=1.39 at 405 nm. They argued that there was little evidence of the lensing effect, and that BrC was driving the Eabs. Cappa et al. (2019) performed measurements in Fresno, CA, during wintertime and Fontana, CA, during summertime. They found that in Fresno there was absorbing OA and BrC, which was related to biomass burning OA and nitrate-associated OA. In Fresno, they reported average Eabs of 1.37, 1.22, and 1.1 at wavelengths equal to 405, 532, and 781 nm, respectively, for RBC ranging from 1 to 4. In Fontana, the Eabs was lower with values of 1.1 at 405 nm and 1.07 at 532 nm. Laboratory measurements of McMeeking et al. (2014) for biomass burning aerosol indicated higher absorption in lower wavelengths compared to higher ones and, thus, the presence of BrC. The enhancement of the absorption was negligible at RBC<10. On average, they found an Eabs equal to 1.25 at 781 nm with a maximum value of Eabs=4 for RBC>10.
Recent studies have suggested that the absorption efficiency of OA could be related to its volatility. Saleh et al. (2014), in their laboratory biomass burning experiments, showed that almost all absorbing OA was associated with extremely low volatility compounds (ELVOCs), with an effective saturation concentration C* of 10−4 µg m−3. In addition, Saleh et al. (2018), using controlled combustion experiments, showed that the absorption activity of BrC is proportional to its molecular size.
Despite the significant progress in understanding the absorption of atmospheric fine aerosol, there are still remaining questions regarding both the absorption enhancement of black carbon and the absorption of OA as the aerosol evolves in the atmosphere. In this study, we try to address these issues for aerosol that has been aged in the atmosphere for at least a few days before arriving at the island of Crete in the eastern Mediterranean.
A remote location in the eastern Mediterranean was used for the study of the absorption and volatility of aged carbonaceous aerosol. The area is characterized by intense photochemistry, especially during the summer (Pikridas et al., 2010), and is affected by pollutants transferred from continental Europe, Turkey, Greece, and Africa (Mihalopoulos et al., 1997; Lelieveld et al., 2002; Kalivitis et al., 2011; Bougiatioti et al., 2014). Previous measurements have shown that the OA reaching the area is highly oxidized regardless of its origin (Hildebrandt et al., 2010, 2011). Lee et al. (2010) showed that these oxidized organic compounds have much lower volatility than fresh secondary organic aerosol (SOA). Long-term measurements in the region have revealed relatively high light absorption and scattering by aerosol during the summer (Kalivitis et al., 2011; Vrekoussis et al., 2005).
The FAME-16 field campaign took place from 9 May to 2 June 2016. Measurements were conducted at the Finokalia Station (35∘20′ N, 25∘40′ E, 250 m above sea level – a.s.l.), a remote site on the island of Crete in Greece (Mihalopoulos et al., 1997). The nearest large city is Heraklion, with 150 000 inhabitants, located 50 km west of Finokalia (Kouvarakis et al., 2000). There are no local sources near the station, allowing the investigation of aged OA from different source regions. During this study, two Saharan dust events occurred from 12 to 15 May and 21 to 22 May.
A scanning mobility particle sizer (SMPS; classifier model 3080 and condensation particle counter model 3775; TSI Incorporated) was used to measure the number and the size distribution of the particles. The aerosol flow was set at 1 L min−1, and the sheath flow at 5 L min−1. The sampling time was 3 min.
The mass concentration and the chemical composition of the particles were monitored using a high-resolution time-of-flight aerosol mass spectrometer (HR-ToF-AMS; Aerodyne Research, Inc.). SQUIRREL 1.56D and PIKA v1.15D were used for the data analysis, while, for the elemental ratio calculations, the improved ambient calculation approach of Canagaratna et al. (2015) was used. The HR-ToF-AMS was operated in V mode, with a sample time of 3 min. The collection efficiency of the HR-ToF-AMS was calculated using the algorithm of Kostenidou et al. (2007). The average CE was 0.64±0.2. Positive matrix factorization (PMF) analysis (Lanz et al., 2007; Paatero and Tapper, 1994; Ulbrich et al., 2009) was performed using, as input, the high-resolution OA mass spectra and the mass-to-charge ratios (m∕z) from 12 to 200.
A single particle soot photometer (SP2; Droplet Measurement Technologies) was used to measure the BC size distribution and concentration. The SP2 had eight channels and included a 1064 nm Nd:YAG laser operating at 4 V and 3400 A. The instrument was calibrated using fullerene soot (stock 40971 and lot L20W054; Alfa Aesar; SSA = 0.4; Gysel et al., 2011). The calibration of the SP2 was verified in separate experiments, using a centrifugal particle mass analyzer (CPMA; Cambustion). The SP2 mode mass and the CPMA mode mass were in good agreement with an R2=0.99 (Saliba et al., 2016). The data were analyzed using the probe analysis package for Igor. The number concentration of BC was low (< 10 000 cm−3), and thus it was assumed that there were no coincidence artifacts in our measurements. The scattering measurement was calibrated using monodisperse polystyrene latex (PSL) spheres. The BC number concentration distributions measured by the SP2 were fitted using a log-normal distribution to account for particles smaller than the SP2 detection limit of approximately 50 nm (Ditas et al., 2018). This extrapolation resulted in an increase in the BC mass concentration by 3 %–8 % (Fig. S9 in the Supplement); therefore, the uncertainty introduced by BC outside the measurement window was minor.
A photoacoustic extinctiometer (PAX; Droplet Measurement Techniques) with a blue (405 nm) laser was used to measure the absorption (babs) and the scattering (bscat) coefficients. Fullerene soot and PSL spheres were used to calibrate the absorption and scattering signals, respectively. An activated carbon denuder was placed in front of the PAX to remove NO2. The babs measurement by the PAX has an uncertainty of less than 10 % (Nakayama et al., 2015). Furthermore, a seven wavelength Aethalometer (AE31; Magee Scientific) was used to measure the babs at 370, 470, 520, 590, 660, 880, and 950 nm and to calculate the absorption Angström exponent (AAE), which describes the wavelength dependence of the babs. The Aethalometer measurements were corrected for scattering and multiple scattering artifacts following Saleh et al. (2014) and Tasoglou et al. (2017), using the corrections suggested by Weingartner et al. (2003) and Kirchstetter and Novakov (2007). High relative humidity (>70 %) can introduce artifacts in the measured absorption coefficient by filter-based techniques or photoacoustic methods (Arnott et al., 2003). A diffusion drier was used upstream of the optical measurements. The campaign average temperature and relative humidity were 22±4 ∘C and 53±19 %, respectively. The measurement station had a temperature control system maintaining the temperature at approximately 25 ∘C.
The thermodenuder (TD) used in this study was placed upstream of the HR-ToF-AMS and the SMPS. The TD design was similar to that developed by An et al. (2007) and is described by Louvaris et al. (2017). The TD was operated at temperatures ranging from 25 to 400 ∘C, using several temperature steps from 25 to 200 ∘C over several hours, and then rapidly (in 20 min) increasing its temperature to the 375–400 ∘C to investigate the presence of ELVOCs. One complete cycle from 25 to 400 ∘C and back to 25 ∘C lasted approximately 10 h. Sampling was alternated between the ambient line and the TD line every 3 min, using computer-controlled valves. Changes in particle mass concentration, composition, and size due to evaporation in the TD were measured by the HR-ToF-AMS and the SMPS, resulting in thermograms of OA mass fraction remaining (MFR) as a function of TD temperature. The OA MFR was calculated as the ratio of organic mass concentration of a sample passing through the TD at time ti over the average mass concentration of the ambient samples that passed through the bypass line at times ti−1 and ti+1. The sample residence time in the center line of the TD was 14 s at 25 ∘C, corresponding to an average residence time in the TD of 28 s. The MFR values were corrected for particle losses in the TD due to diffusion and thermophoresis. To account for these losses, sample flow rate and size- and temperature-dependent loss corrections were applied, following Louvaris et al. (2017), corresponding to the operating conditions during the campaign. Less than 20 % of the particulate matter was lost in the TD at temperatures up to 100 ∘C. The losses increased at higher temperatures, and at 400 ∘C approximately 50 % of particles larger than 50 nm were lost. The uncertainty introduced by the loss correction was approximately 20 % (Gkatzelis et al., 2016; Louvaris et al., 2017). The final step in the data analysis was to average the MFR data corrected for CE and TD losses based on temperature bins of 10 ∘C. The MFR calculation assumes implicitly that the OA concentration remains constant during the measurement period. To ensure that this condition is satisfied, if two consecutive OA ambient mass concentrations differed by more than 25 %, the corresponding MFR was not included in the analysis. Also, in order to ensure that the temperature was constant during the measurement, the absolute difference between the two samples had to be less than 5 ∘C. If this difference for a TD sample was higher, then the sample was not included in our analysis. The same approach was also used for the factors resulting from the PMF analysis of the AMS spectra. However, in this case a minimum concentration threshold of 0.1 µg m−3 was used for the ambient concentrations, together with the criterion of the stability of the ambient concentrations during the sampling period. MFR values corresponding to concentrations of the PMF factors below this threshold were not included in the data set. Approximately 75 % of the OA samples satisfied all these constraints and were used in the analysis. The corresponding percentages were 65 % and 70 % for the two identified PMF factors. In the present work, the complete data sets were analyzed together, averaging the corresponding measurements. More details regarding the data analysis and the sensitivity tests of the TD measurements are provided in the Supplement.
The concentrations of gas-phase pollutants were measured using a proton transfer reaction mass spectrometer (PTR-MS 500; Ionicon Analytik GmbH) and gas monitors. The PTR-MS was calibrated with a standard gas mixture of volatility organic compounds (VOCs). The concentration of O3 was measured using a continuous O3 analyzer (49i; Thermo Scientific), and the concentrations of nitrogen oxides were measured using a NO/NO2/NOx analyzer (42i-TL; Thermo Scientific).
The dynamic TD evaporation model of Riipinen et al. (2010) together with the uncertainty estimation algorithm of Karnezi et al. (2014) were used for the determination of the OA volatility distribution. Inputs for the model included the ambient OA concentration, the OA density calculated by the algorithm proposed by Kostenidou et al. (2007), the initial average particle size, TD temperature, the MFR values, and TD residence time. In the volatility basis set framework of Donahue et al. (2006), the volatility distribution is represented with a range of logarithmically spaced C∗ bins along a volatility axis. In this study six bins with variable mass fractions were chosen. For this six-bin solution, the best 2 % of the mass fraction combinations with the lowest error were used to estimate the average mass fraction along with their corresponding standard deviation for the uncertainty of each bin. Additionally, the parameters that indirectly affect the calculated volatility, such as the effective vaporization enthalpy (ΔHvap) and the effective accommodation coefficient (am), were estimated following Karnezi et al. (2014). Additional information regarding the data analysis of the TD measurements is in the Supplement (Sects. S1 and S2).
A Mie theory model, based on the work of Bohren and Huffman (1983), was used to calculate the theoretical MAC and Eabs at 405 nm, assuming a spherical core shell morphology (China et al., 2015). The assumption that all BC particles were coated and had obtained a relatively spherical shape can be justified by the lack of any local sources and the fact that all particles reaching the site had been heavily processed in the photochemically active summertime atmosphere of the eastern Mediterranean. PMF analysis of the OA AMS spectra did not show any fresh emissions like hydrocarbon-like organic aerosol (HOA) or biomass burning organic aerosol (BBOA) and no acetonitrile was detected. FLEXPART analysis confirmed that the air masses measured were transferred from long distance areas (30 % continental Greece and the Balkans, 13 % the Aegean Sea, 24 % Africa, and 33 % Italy and/or Sicily). The measurements suggested a positive correlation (R=0.31) between the MAC405 and the ratio of nonrefractory PM1 to rBC, with an intercept of 12.1 m2 g−1 (Fig. S10).
For the BC core, we assumed a refractive index equal to (Bond et al., 2006) and a density of 1.8 g cm−3 (Mullins and Williams, 1987; Park et al., 2004; Wu et al., 1997). A nonabsorbing coating of the BC core was assumed, with a refractive index of nOA=1.55 (Bond and Bergstrom, 2006). The total aerosol effective density used was calculated based on the SMPS and HR-ToF-AMS distributions. The average effective density for the campaign was 1.66±0.11 g cm−3. The size distribution of the BC cores was provided by the SP2.
The coating thickness in the base case calculation was estimated based on the assumption that the BC material is internally mixed with the nonrefractory aerosol species (Saliba et al., 2016). The SMPS size distributions were used to estimate the ratio of the total aerosol mass over the BC mass as measured. A total of 1 h averaged data were used as inputs in the model. In order to provide a better constraint for the analysis, the average coating thickness for each period of the corresponding mean BC cores (±5 nm) was estimated using the leading-edge-only (LEO) fit method (Gao et al., 2007) and the SP2 data. The thicknesses, as expected, were lower than those resulting from the internal mixing assumption but were still significant (Fig. S11). Mie theory calculations using the coating thickness based on the LEO fit method were also performed.
The average rBC concentration of the campaign was 0.14 µg m−3, and the average OA concentration was 1.5 µg m−3 (Fig. 1). The two major Saharan dust events affected, as expected, the aerosol optical properties. In the present study, we focus only on the nondust periods. The dominant PM1 components were sulfate and OA, accounting for 46 % and 34 % of the PM1, respectively. The O : C ranged from 0.65 to 1, with an average value of 0.83, revealing the absence of fresh OA. These values are typical in Finokalia during the spring and summer periods (Hildebrandt et al., 2010).
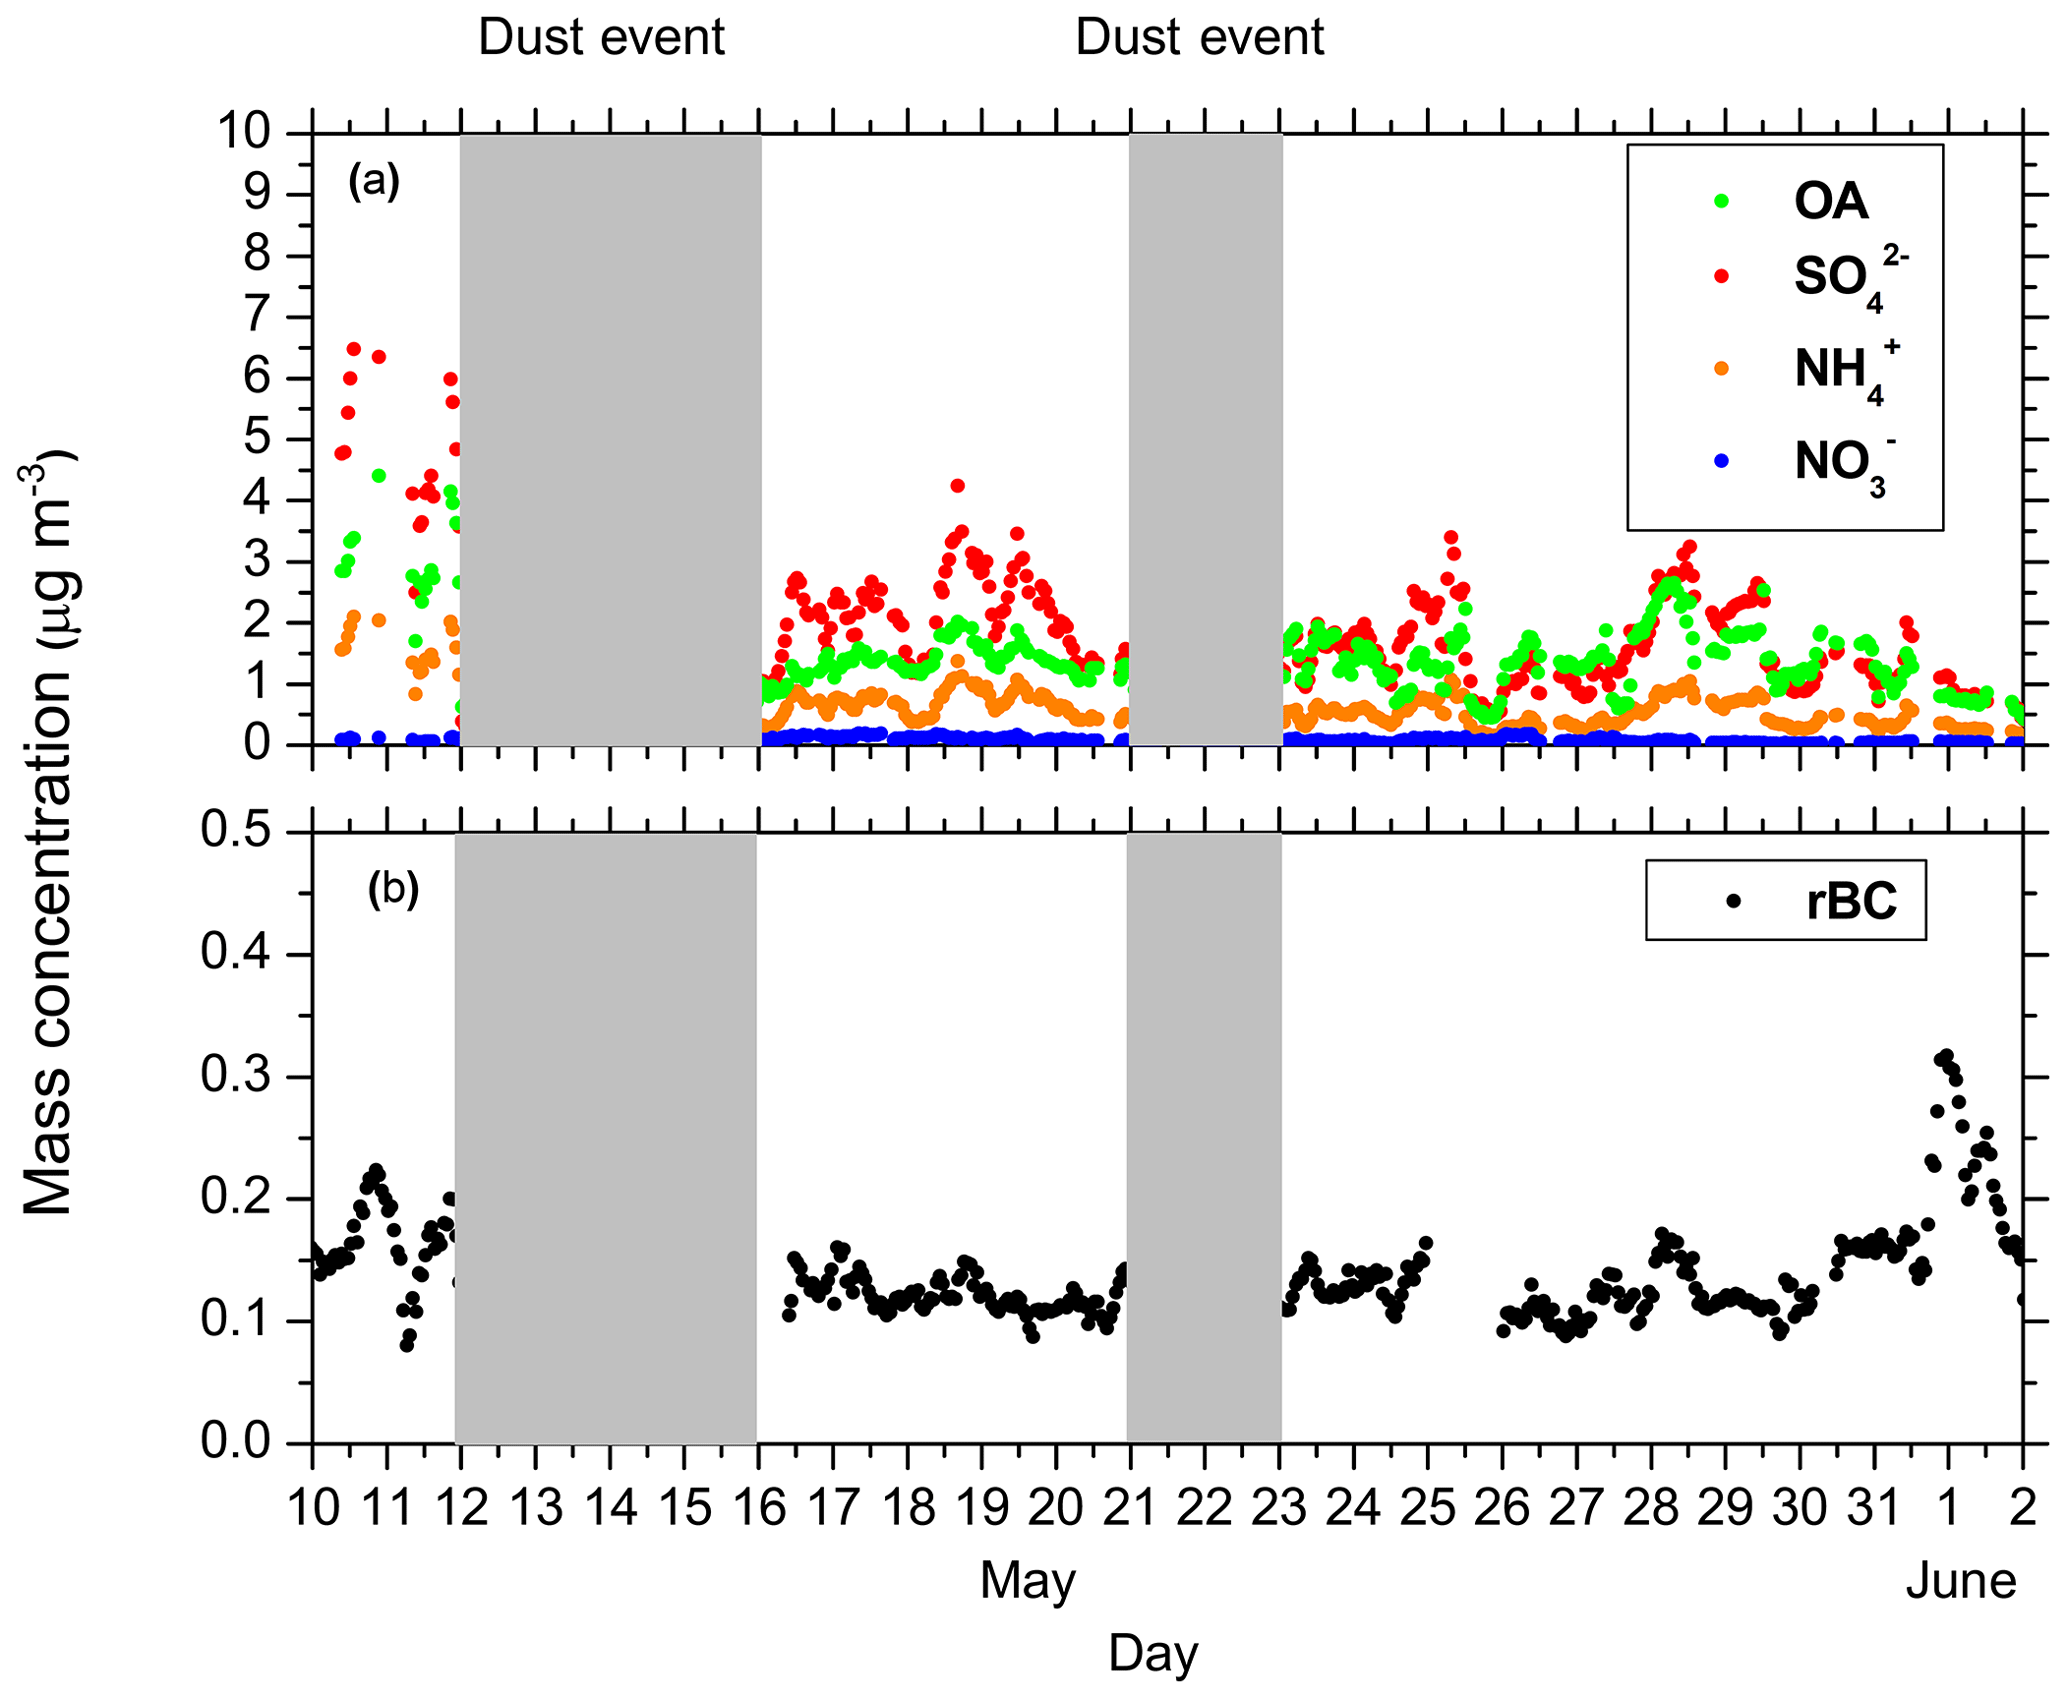
Figure 1Evolution of the aerosol chemical composition based on the high-resolution aerosol mass spectrometer (HR-ToF-AMS) and single particle soot photometer (SP2) measurements during FAME-16. (a) The nonrefractory aerosol components and (b) refractory black carbon (rBC) concentration. The shaded areas represent the dust event periods.
4.1 OA volatility
The estimated volatility distribution for the total OA in Finokalia during FAME-16 is depicted in Fig. 2. Use of OA with µg m−3 was needed to capture the behavior of the OA at 400 ∘C. Almost 40 % of the OA consisted of semivolatile organic compounds (SVOCs), 35 % of low volatility organic compounds (LVOCs), and the rest was extremely low volatility organic compounds (ELVOCs).
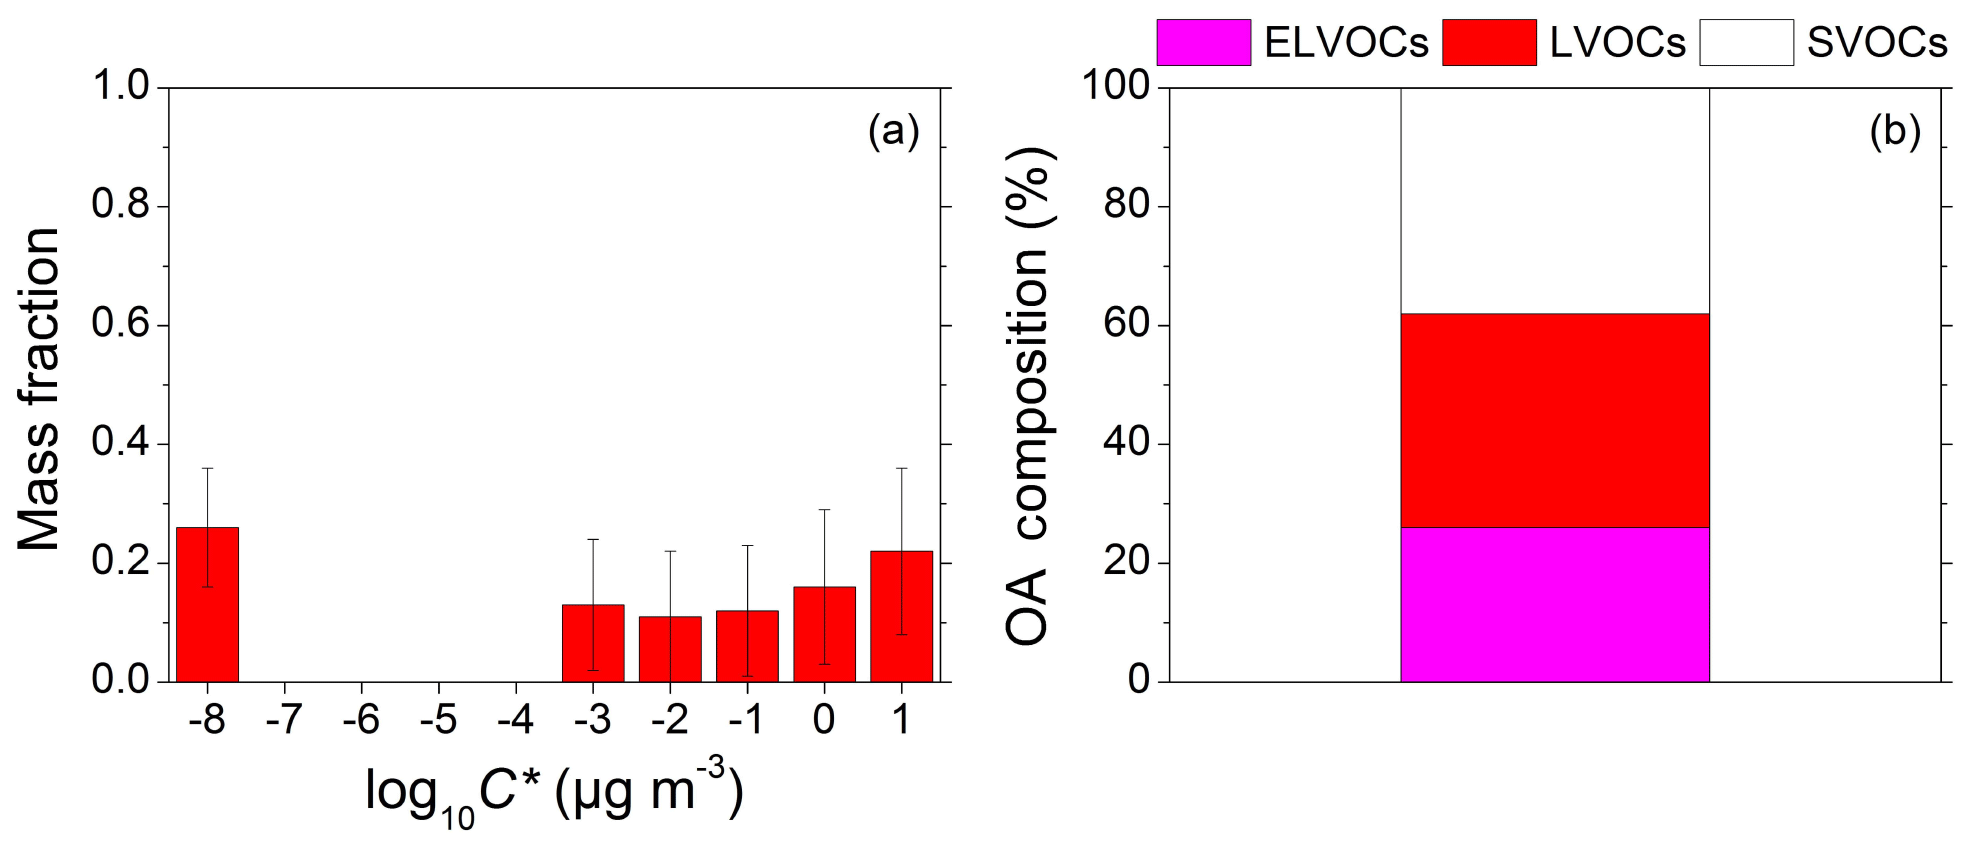
Figure 2(a) Total organic aerosol (OA) volatility distribution along with its uncertainty estimated by the Karnezi et al. (2014) approach. The error bars represent the corresponding variability (±1 standard deviation). (b) OA composition. Magenta represents the extremely low volatility organic compounds (ELVOCs), red the low volatility organic compounds (LVOCs), and white the semivolatile organic compounds (SVOCs).
The estimated value of the effective vaporization enthalpy was 80±20 kJ mol−1. This value was in agreement with the reported value by Lee et al. (2010) of 80 kJ mol−1 for the FAME-08 campaign. The estimated accommodation coefficient was 0.27, ranging from 0.1 to 0.8. This value was a little higher than the 0.05 value reported in the earlier study. However, both suggest only moderate resistances to mass transfer during the evaporation in the TD.
The corresponding measured and predicted thermograms are depicted in Fig. 3. Almost 30 % of the OA had not evaporated, even after heating at 400 ∘C. The temperature at which half of the OA evaporated was T50=120 ∘C, a value similar to that observed by Lee et al. (2010). The composition of the OA leaving the TD changed significantly as the temperature increased, according to the model. At 125 ∘C the LVOCs and ELVOCs contributed equally to the remaining OA mass. For further temperature increases, the LVOC fraction was reduced until 375 ∘C, at which point only the ELVOCs remained.
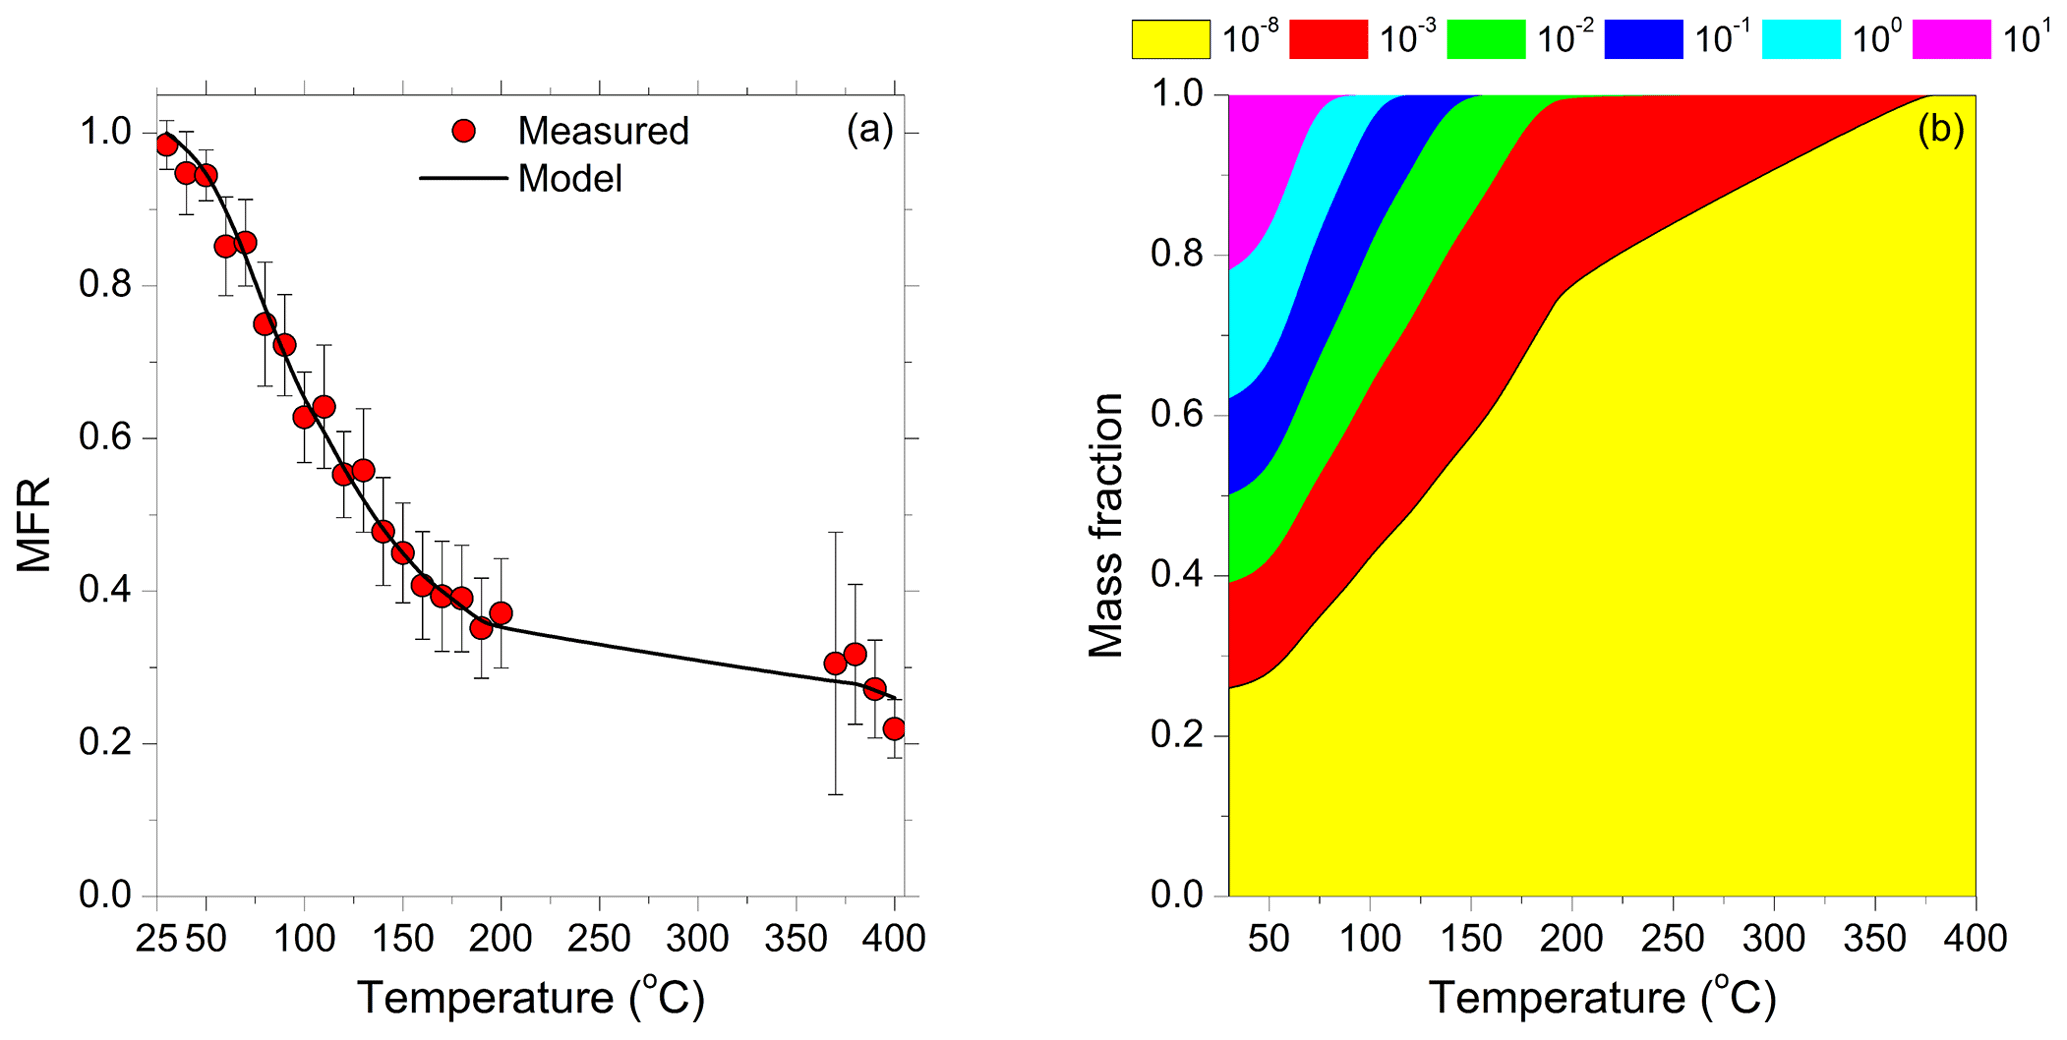
Figure 3(a) Average loss-corrected total OA thermograms. Red circles represent the measured total OA mass fraction remaining (MFR) and the error bars the corresponding variability (±2 standard deviations of the mean). The solid lines are the model predictions. (b) Mass fraction of the total OA for different effective saturation surrogate species, with concentrations as a function of thermodenuder (TD) temperature. Yellow represents the contribution of the effective saturation concentration µg m−3, red the contribution of the µg m−3, green the µg m−3, blue the µg m−3, cyan the µg m−3, and magenta the µg m−3.
PMF analysis resulted in a two-factor solution. Factor 1 corresponded to more oxidized oxygenated OA (MO-OOA) and Factor 2 to a less oxidized OA (LO-OOA) component. The average contribution of the two factors was 47 % for the MO-OOA and 53 % for the LO-OOA. The O : C for the MO-OOA was 0.95 (OSC=0.59), and for the LO-OOA it was 0.56 (OS). There was a weak positive correlation between LO-OOA, MO-OOA, and rBC. The R2 between the hourly concentrations of MO-OOA and rBC was 0.12 (Fig. S12) and for LO-OOA and rBC 0.17 (Fig. S13). This is not unexpected given that Finokalia is far away from the corresponding sources of both BC and organic compounds, and significant physical and chemical processing has taken place during the transport of the aerosol from the sources to the receptor.
The OA in the eastern Mediterranean during the summer has significant contributions from both anthropogenic and biogenic sources, but their contributions remain uncertain. Based on our recent work (Drosatou et al., 2019), the LO-OOA and MO-OOA do not reflect different sources but rather different degrees of chemical aging. The Finokalia area is characterized by the absence of local sources and, as a result, the absence of fresh OA. The area is characterized by dry land and dry vegetation (dry bushes); thus, no high biogenic emissions are expected. The OA during FAME-08 was also found to consist entirely of OOA with no primary OA (POA) present (Hildebrandt et al., 2010). POA evaporates and is oxidized rapidly in the photochemically active environment of the eastern Mediterranean during its transport from its sources to this remote site.
The volatility distributions of the two PMF factors were estimated following the same approach as that for the total OA. The measured thermograms for the two PMF factors are shown in Fig. 4. Almost 50 % of both the MO-OOA and the LO-OOA evaporated at 150 ∘C. Almost 30 % of the MO-OOA mass and about 20 % of the LO-OOA did not evaporate, even at temperatures as high as 400 ∘C. The model reproduced the observed MFR values for both factors. Both factors contained components with a wide volatility range. The MO-OOA exhibited a bimodal volatility distribution with peaks at effective saturation concentrations of 10−8 and 10 µg m−3. Its effective enthalpy of vaporization was approximately 90±35 kJ mol−1, and its accommodation coefficient was 0.27. The estimated volatility distribution of the LO-OOA was a little more uniform, peaking at an effective saturation concentration of 1 µg m−3. The average calculated saturation concentration of LO-OOA at 298 K was 0.016 µg m−3, an order of magnitude higher than that of the MO-OOA. The LO-OOA enthalpy of vaporization was 70±20 kJ mol−1, 20 kJ mol−1 lower than that of the MO-OOA. Its accommodation coefficient was approximately 0.1, indicating small mass transfer resistances. MO-OOA consisted of approximately 40 % SVOCs, 30 % LVOCs, and 30 % ELVOCs. On the contrary, LO-OOA consisted of almost 45 % SVOCs, 40 % LVOCs, and only 15 % ELVOCs. ELVOCs can be produced by both primary sources (combustion of fossil fuels but also biomass burning) and secondary processes. Given the intense chemical processing of the organic compounds from all the sources on their way to Finokalia, we cannot assign them to a specific source or process.
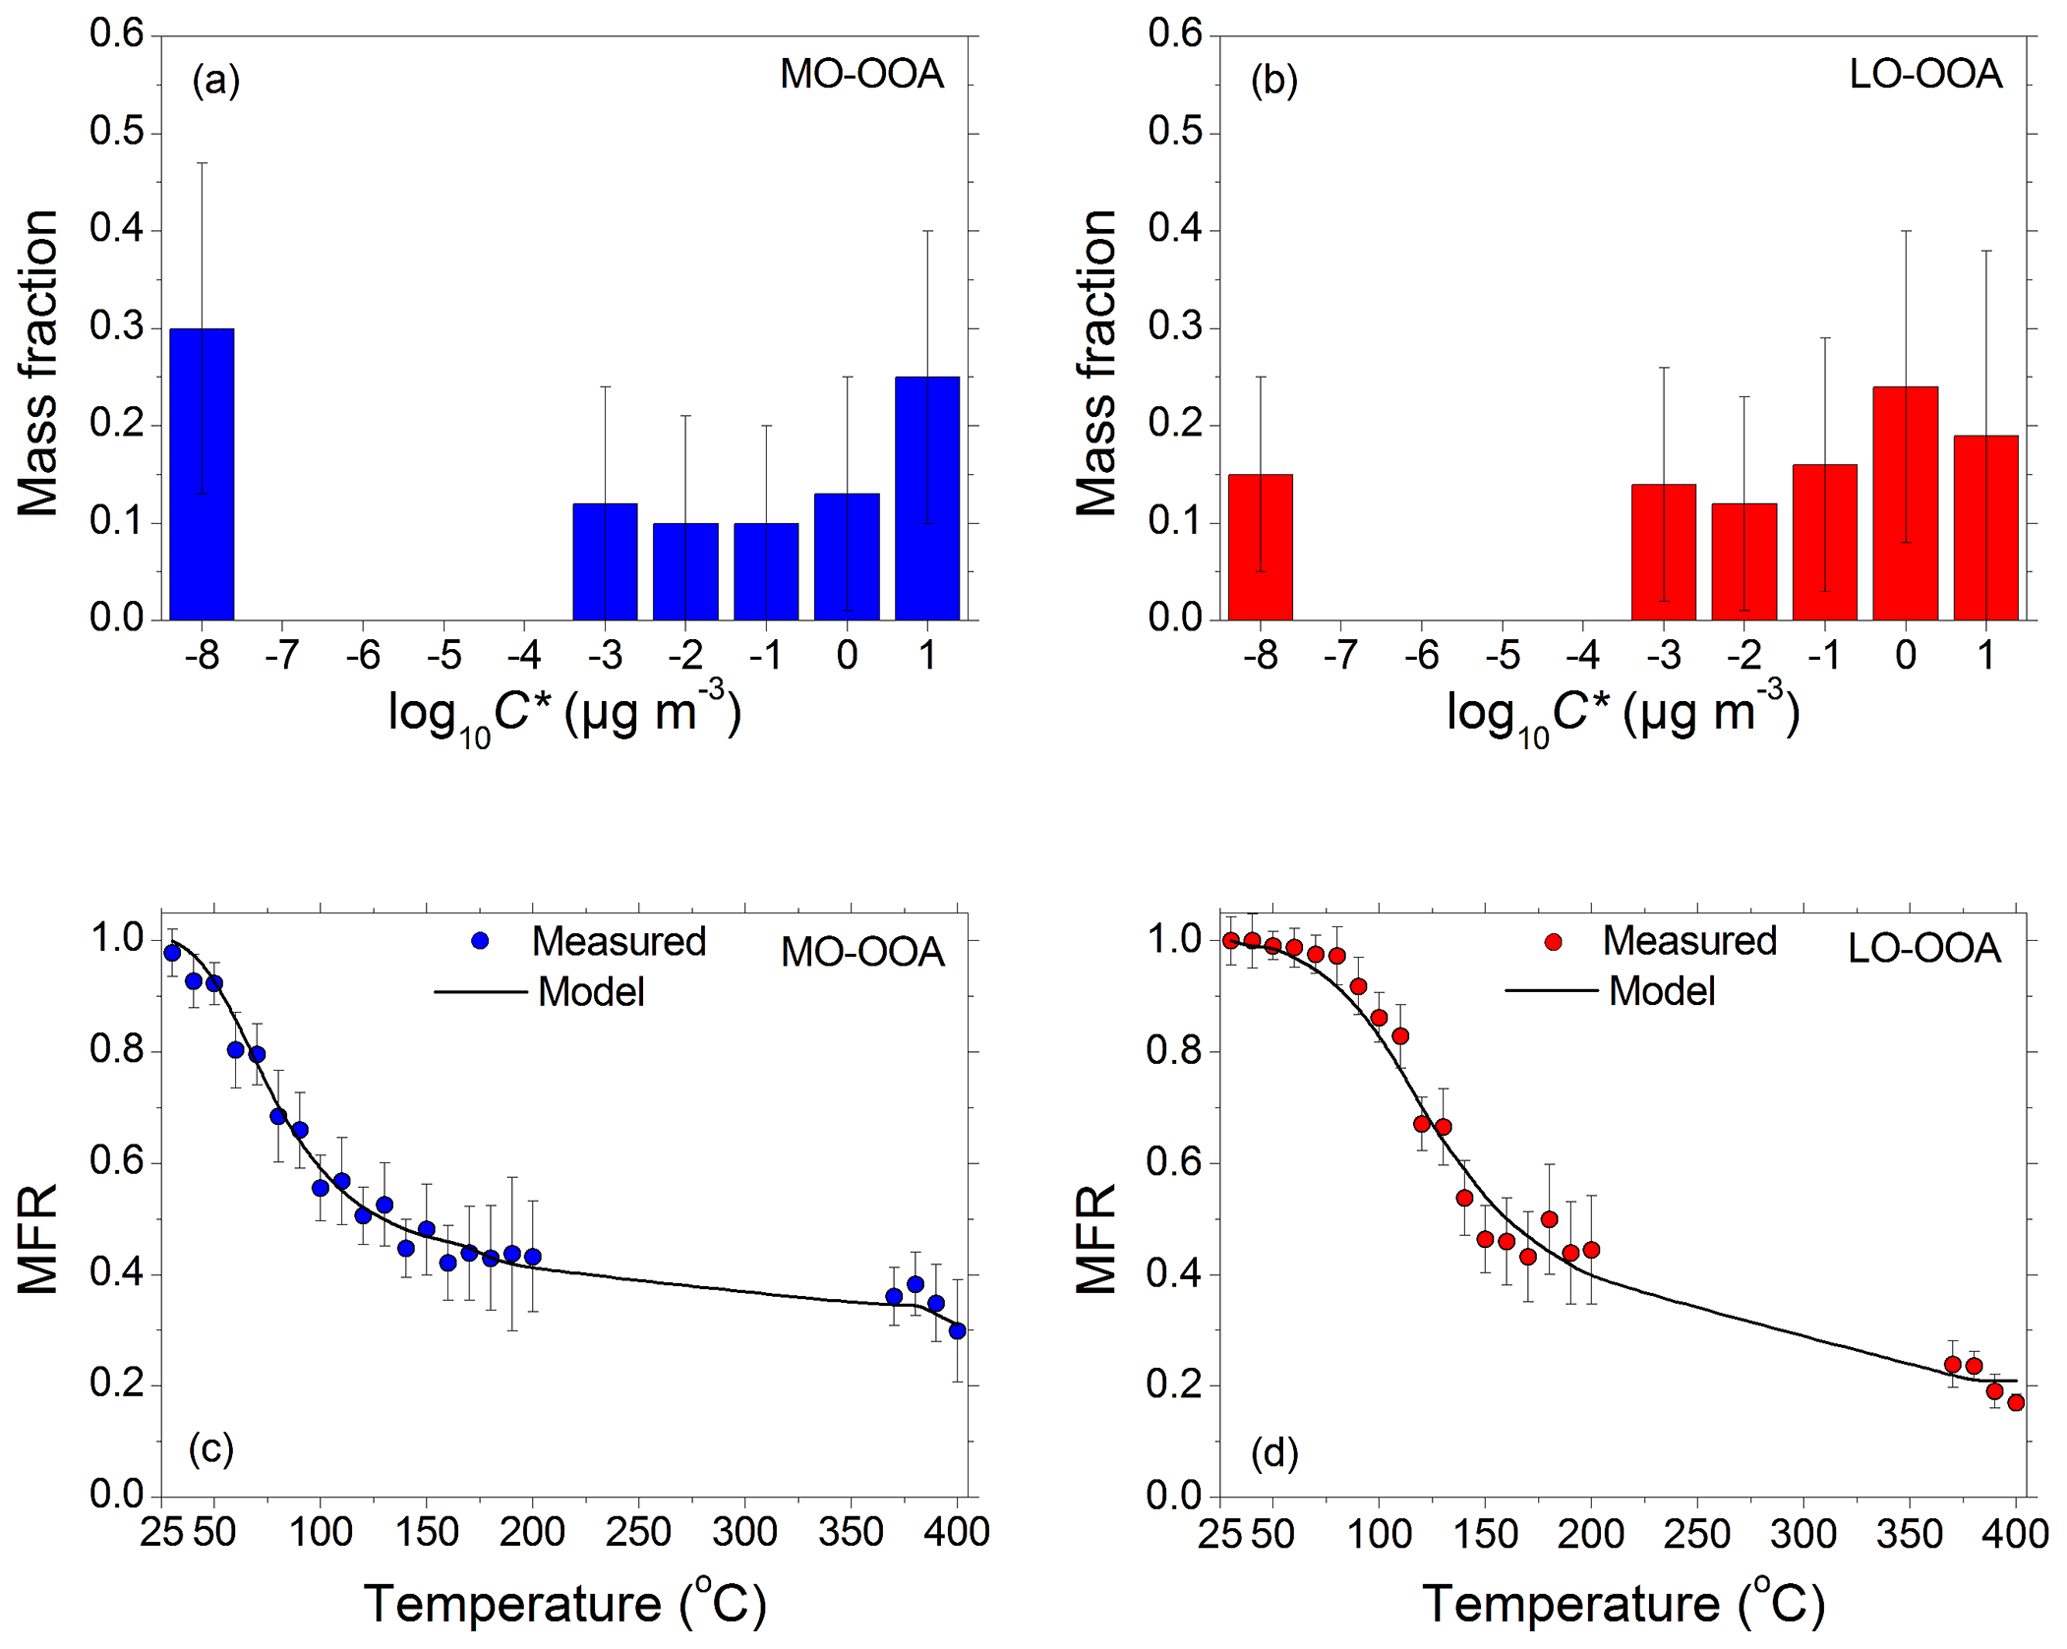
Figure 4(a) Estimated volatility distribution of the more oxidized oxygenated OA (MO-OOA) factor, along with its corresponding uncertainties, by using the approach of Karnezi et al. (2014). (b) Estimated volatility distribution of the less oxidized OA (LO-OOA) factor, along with its corresponding uncertainties. (c) Measured (in circles) and predicted thermograms for the MO-OOA factor. The error bars represent ±2 standard deviations of the mean. (d) Measured (in circles) and predicted thermograms for the LO-OOA factor. The error bars represent ±2 standard deviations of the mean.
The fitting of the individual factor thermograms implicitly assumes that each factor had the same size distribution as the total OA, and also that the two factors were externally mixed. The uncertainty introduced by these two assumptions was implicitly evaluated by comparing the estimated total OA of volatility distribution with the composition-weighted average of the volatility distributions of the two OA factors. The two distributions agreed within a few percent for 10 and within 10 % for the lowest and highest volatility bins.
4.2 Aerosol optical properties
The PAX was used to measure the babs and bscat at 405 nm. The measured bscat,405 ranged from 11.5 to 47 Mm−1, with an average campaign value of 26.5 Mm−1 (Fig. 5). The corresponding babs,405 ranged from 0.64 to 5.6 Mm−1, with an average value of 2.1 Mm−1.
The absorption coefficients measured by the Aethalometer at λ=370 nm and at λ=470 nm were compared with the absorption coefficient measured by the PAX at λ=405 nm. The measurements of the two instruments were highly correlated with R2 = 0.9–0.91. The babs,370 measured by the Aethalometer was higher than the babs,405 of the PAX. Their relationship is described by the equation . Similarly, the babs,470 measured by the Aethalometer was higher than that of the PAX at 405 nm, and their relationship was described by (Fig. S14). Part of these differences are due to the artifacts associated with filter-based absorption measurements (Cappa et al., 2008; Lack et al., 2008).
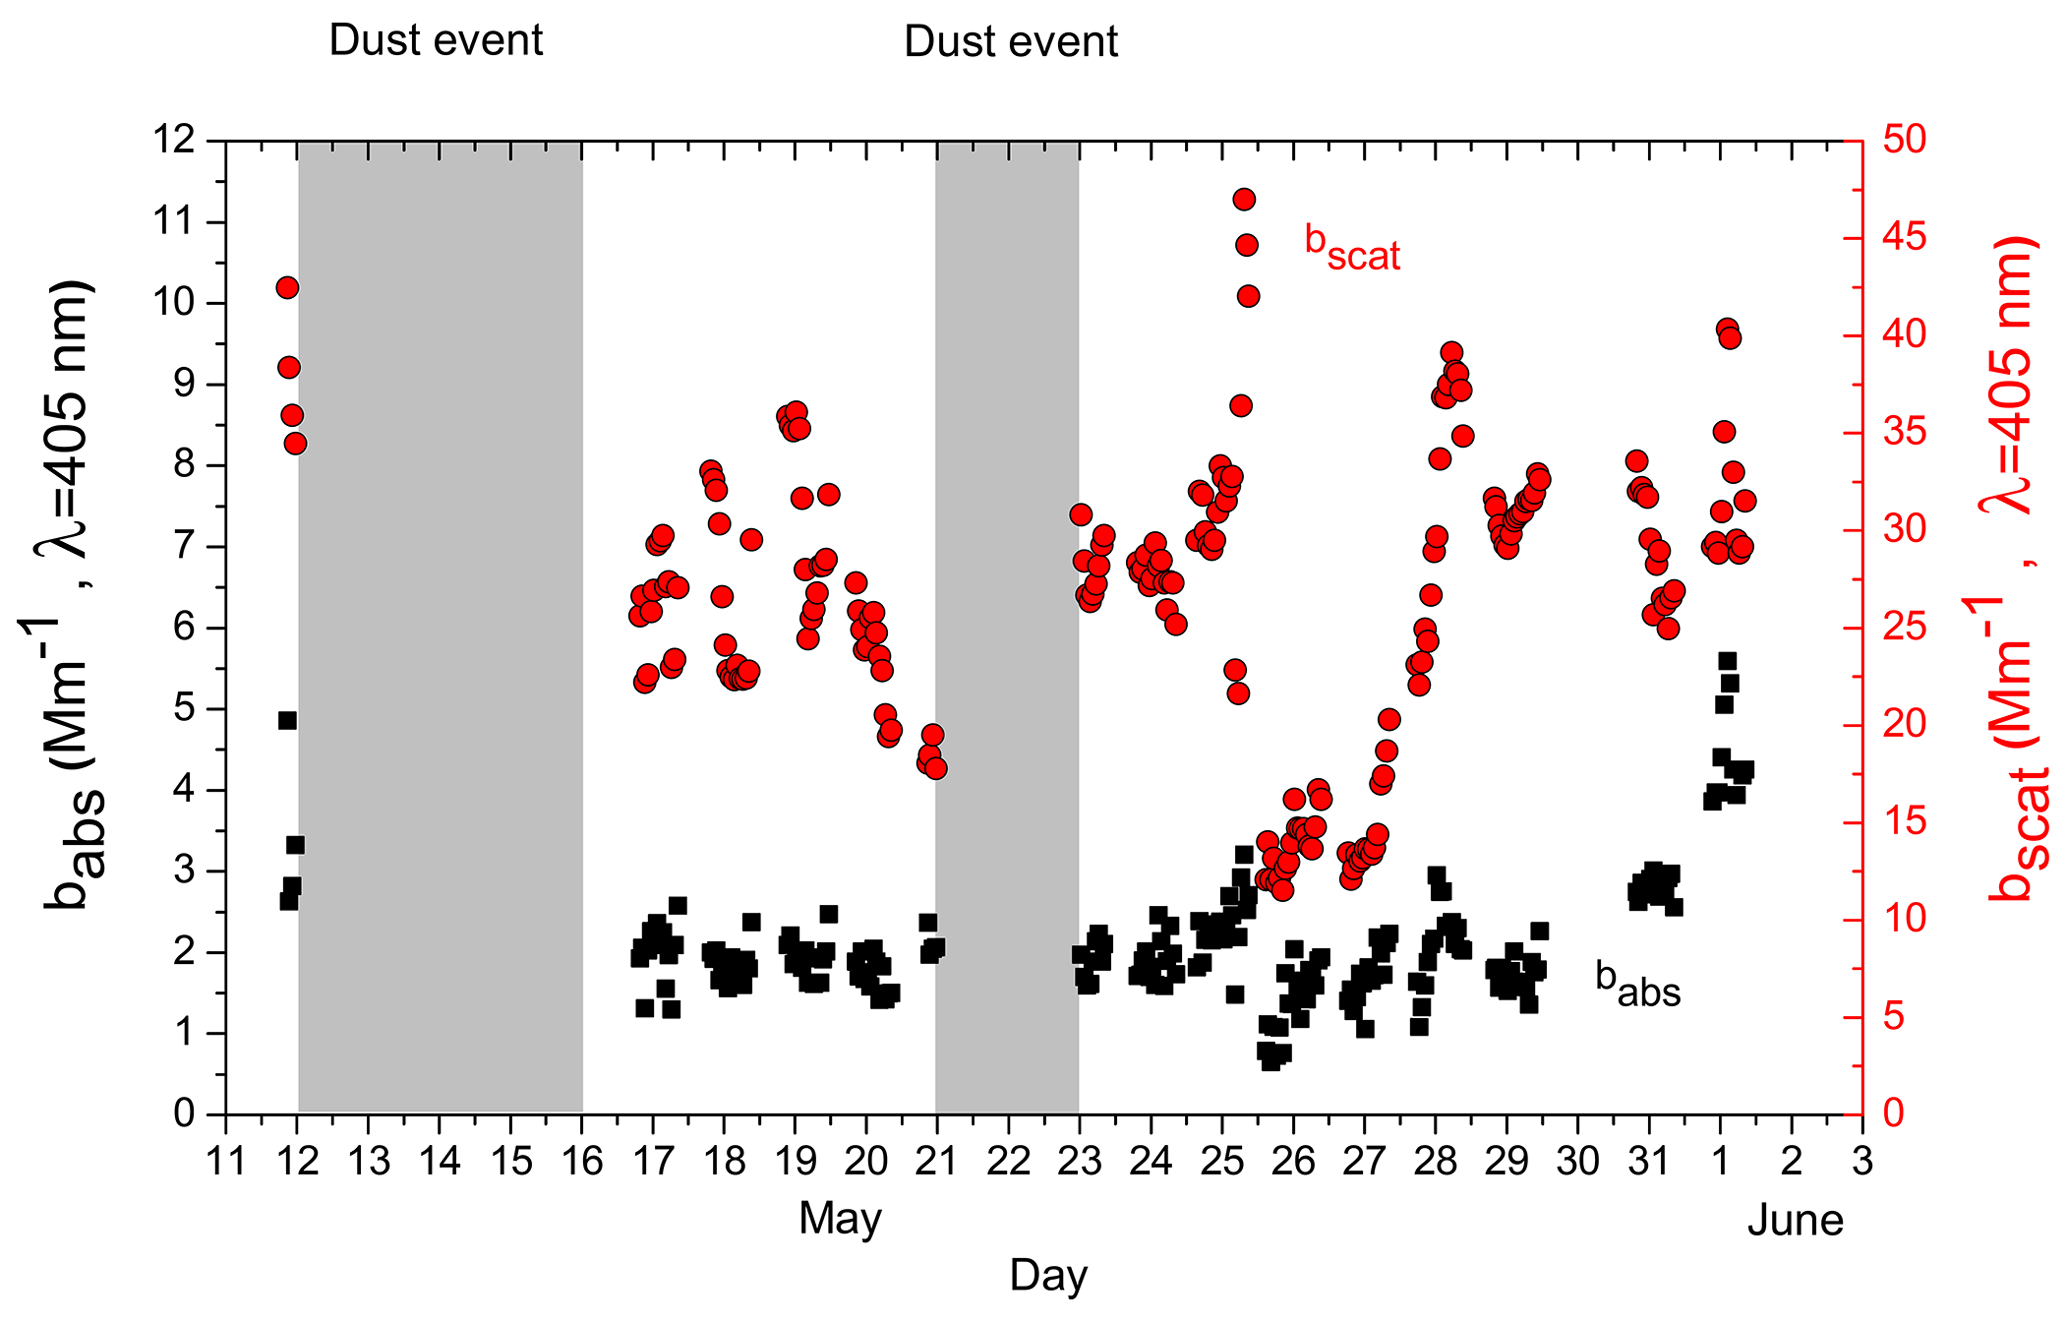
Figure 5The time series of the aerosol optical properties at λ=405 nm. The black squares represent the absorption coefficient, babs, while the red circles represent the scattering coefficient, bscat. The shading represents the dust event periods.
Acetonitrile is a known biomass burning marker and can help identify the potential influence of the site by biomass burning events or wildfires during the campaign. The acetonitrile concentration measured by the PTR-MS remained close to 0.4 parts per billion (ppb) during the campaign, which is the local background level. This, together with the low BC levels, indicates that the site was not impacted by nearby biomass burning during the study.
The babs,405 variation followed that of the rBC (R2=0.74 for the hourly averages). The R2 at λ=370 nm was equal to 0.67, lower than that at 405 nm. This is consistent with the presence of some BrC. However, the babs,370 is measured by the Aethalometer and the babs,405 by the PAX. For the babs at higher wavelengths measured by the Aethalometer, the R2 at λ=470 nm was 0.68, at λ=520 nm 0.67, at λ=590 nm 0.65, at λ=660 nm 0.65, and at λ=950 nm 0.51 (Fig. S15). These values are inconclusive regarding the existence or absence of BrC. Part of the explanation for this behavior could be that a fraction of the BrC is associated with rBC, either from the emissions or from the associated gas-phase pollutants that react on their way to the site.
The ratio of the babs,405, measured by the PAX, over the rBC mass was equal to 16±2.2 m2 g−1. In this study, the average rBC size distribution had a number mode diameter of 67 nm and a mass mode diameter equal to 185 nm. The measured MAC405 is clearly higher than the expected MAC405 of uncoated BC particles (Bond et al., 2006). The difference between the measured and the reference value of MAC405 can be due to the coating of BC by other PM components (lensing effect) and/or the existence of other absorbing material. These two potential explanations will be explored in the following paragraphs.
The AAE of the aerosol was calculated using a power-law fitting of the babs measured by the Aethalometer in all seven wavelengths (370, 470, 520, 590, 660, 880, and 950 nm). The campaign average AAE was 0.97±0.22. Lack and Cappa (2010) suggested that an AAE > 1.6 should confirm the presence of non-BC absorbing material; however, an AAE < 1.6 does not exclude its presence. The AAE of coated BC cores can deviate from the typical AAE = 1 with values greater or lower than unity. Gyawali et al. (2009) have shown, using a core shell model and assuming spherical particles, that for relatively small cores the coating thickness increase leads to the increase in the AAE, while for large cores AAE is not affected by the changes in the coating thickness. Liu et al. (2018) showed that the AAE of coated BC is highly sensitive to the particle size distribution and demonstrated that AAE decreases as particle size increases. They showed that an AAE as low as 0.8 is possible and demonstrated the importance of various parameters on the BC AAE and the potential problems introduced by assuming BC AAE as being equal to 1.0. Based on the relatively large aged particles present in Finokalia, relatively low values of AAE should be expected. According to simulation presented by Gyawali et al. (2009), the average AAE for this study can range from 1 to 1.25, based on the core diameter measured and the estimated coating thickness. Therefore, the relatively low average AAE does not preclude the presence of some absorbing organic aerosol.
Mie theory calculations were performed in order to estimate the MAC405 and the Eabs due to the lensing effect of the shell covering the BC core. In our base case, the coating thickness was estimated based on the ratio of the total aerosol mass over the BC mass (Saliba et al., 2016). Initially, a nonabsorbing shell was assumed. The predicted MAC405 had an average value of 15.8 m2 g−1. The average Eabs due to the lensing effect was 2.13. The predicted average MAC405, using the measured BC size distribution and assuming pure uncoated spherical particles, was 7.4 m2 g−1, varying from 6.1 to 7.8 m2 g−1 during the study (hourly averages). This is consistent with the expected 5.3–9.2 m2 g−1 for BC core diameters in the 10–350 nm size range (Bond et al., 2006). The average predicted MAC405 was lower than the average measured MAC405=16 m2 g−1, but the p value was equal to 0.079. Taking into account the measurement uncertainty, the measured average MAC405 could range from 14.4 to 17.6 m2 g−1. However, there were several periods during which the measured MAC was muc.h higher than the predicted values, with the differences as high as 8.5 m2 g−1 (Fig. 6). These differences suggest that the average contribution of BrC to absorption during the measurement period was relatively small, but there were periods with high levels of absorbing OA.

Figure 6Hourly averaged results from the Mie theory calculations, assuming a nonabsorbing shell (k=0). (a) Predicted (blue circles) and measured MAC405 (red circles). (b) Hourly averaged predicted Eabs values. The shading represents the dust event periods.
In the next step, the Mie theory calculations were repeated, assuming an absorbing shell with a refractive index of , where the imaginary part, k, was allowed to vary from 0 to 0.4. This range of k values was selected based on previous literature (Kirchstetter et al., 2004; Alexander et al., 2008; Chakrabarty et al., 2010, 2016; Chen and Bond, 2010; Saleh et al., 2014, 2018; Li et al., 2016). Approximately half of the resulting k values during the campaign were zero, suggesting a nonabsorbing shell, while the other half were positive. More specifically, 24 % of the estimated k values ranged from 0.01 to 0.1, 8 % from 0.11 to 0.2, 3 % from 0.21 to 0.3, and 10 % of the k values ranged from 0.31 to 0.4. During these periods, the campaign average babs,405 was equal to 2.4 Mm−1. BrC was estimated to lead to a 15 % increase in the campaign average babs,405.
The Mie calculations were repeated, using a coating thickness estimated by the LEO fit method and the SP2 data. The average coating thickness calculated by this approach was approximately half of that calculated using the internal mixture assumption (Fig. S11). This resulted in lower predicted absorption and, therefore, a larger gap between measurements and predictions, assuming that the organic aerosol was not absorbing. The predicted MAC405 had an average value of 14.4 m2 g−1. The predicted average MAC405, assuming pure uncoated spherical particles, was 7.4 m2 g−1. The Eabs was equal to 1.94. Assuming an absorbing shell, we found that the imaginary part of the refractive index of the shell was in the range of 0.01 to 0.1 for 20 % of the time, between 0.11 and 0.2 for 16 % of the time, between 0.21 and 0.3 for 16 % of the time, and between 0.31 and 0.4 for 20 % of the time. Only during 28 % of the time was the k equal to 0, indicating no absorbing shell.
For both methods used to estimate the MAC405, it is noted that there was the presence of absorbing material in a range from 45 % up to 72 % of the measurements.
4.3 The role of ELVOCs
ELVOCs can exhibit substantially larger light absorption than LVOCs or SVOCs. The association of photochemically aged BrC with material of lower volatility has been reported in a number of studies focusing on biomass burning (Saleh et al., 2014; Wong et al., 2019). The hypothesis that the presence of ELVOCs could explain the higher aerosol light absorption was tested. The unexplained MAC (ΔMAC) difference of measured and predicted values was compared with the total ELVOC mass concentration. The ELVOC concentration was estimated based on the results of the volatility analysis of the two PMF factors as follows:
The predicted MAC405 used was from the base case Mie theory calculations in which the coating thickness was estimated from BC mass fractions. The unexplained babs at 405 nm (3 h average values) was well correlated with the estimated ELVOC concentrations, with an R2=0.76 (Fig. 7). Even after excluding the period with the highest unexplained absorption, the relationship is still relatively strong, with R2=0.41. The corresponding R2 between the 3 h average ΔMAC and the ELVOCs was 0.66 (Fig. S16). These results suggest that the ELVOCs were probably contributing to the total absorption and could explain the difference in the MAC.

Figure 7The difference between the measured and the predicted unexplained babs,405 as a function of the estimated concentration of the ELVOCs. The data shown represent 3 h averaged values.
The correlation of the ΔMAC with the rBC and with other parameters was lower than those for the ELVOCs. For example, the R2 with the rBC was 0.38, with the LO-OOA 0.44 and with the MO-OOA 0.29. There was a relatively high correlation with the sulfate levels (R2=0.59) that could be interesting, as high sulfate levels in this area correspond to high aerosol acidity which has been shown to promote formation of oligomers in secondary organic aerosol. A comparison of the difference in measured and the predicted babs,405 and the ELVOC was also conducted for all the periods, including those in which no BrC was present (k=0). The correlation was R2=0.52. During the k=0 periods, the predicted babs,405 was equal to or higher than the measured babs,405. This difference was due to an overestimation of the absorption values by the Mie theory or due to the uncertainties in the measurements of the babs,405.
The calculations were repeated, using the predicted MAC based on the Mie theory, assuming a coating thickness according to the LEO fit. The correlation between the unexplained absorption and the ELVOC concentration remained high, with R2=0.69 (Fig. S17), suggesting that, despite the uncertainty in the coating thickness, our results are quite robust.
The analysis presented in the previous sections has been based on a series of assumptions and, as expected, is affected by measurement uncertainties. We have tested the robustness of our conclusion regarding the link between the unexplained absorption and ELVOC levels by repeating the analysis for several cases. We focused on the estimation of the coating thickness of the BC particles, the refractive index of black carbon, the uncertainty of the measurements by the SP2 and PAX405, the uncertainty of the results from the PMF analysis, and, finally, the uncertainty of the thermodenuder model. The results of the corresponding tests are summarized in the following paragraphs.
The effect of the assumed BC refractive index on our results was tested by repeating the Mie theory calculations for two additional values, namely a relatively high value of 1.95+0.79i and a relatively low value 1.5+0.5i (Bond and Bergstrom, 2006). For the high refractive index, the predicted average MAC405, using the measured BC size distribution and assuming pure uncoated spherical particles, was 7.7 m2 g−1, varying from 6.3 to 8.2 m2 g−1 during the study (hourly averages). Even if the unexplained absorption was reduced, its R2 with the ELVOCs remained high and equal to 0.72 (Fig. S18). For the low refractive index, the predicted average MAC405 of the uncoated BC particles was 6.2 m2 g−1 (range of 5.2–6.5 m2 g−1 during the study). The R2 between the unexplained absorption, Δbabs,405, and the ELVOC concentration was R2=0.55 (Fig. S19). The link between the unexplained absorption and the abundance of ELVOCs is quite robust with respect to the assumed value of the BC refractive index.
We estimated that 92 %–97 % of the BC mass concentration was inside the SP2 measurement window; therefore, given that we also corrected for it by fitting the measured size distribution, the uncertainty introduced by this limitation of the SP2 was minor. Nakayama et al. (2015) reported an uncertainty of the babs measurements by the PAX of less than 10 %. Both of these uncertainties did not have an important effect on the link between the unexplained absorption and the ELVOC concentrations.
An assessment of the uncertainty of the concentrations of the two OA factors determined by the PMF analysis was performed by bootstrapping 10 simulations (Ulbrich et al., 2009). The estimated uncertainty for the LO-OOA concentrations was 2 %, and for the MO-OOA concentrations it was 3 % (Fig. S20). These relatively small uncertainties suggest that the PMF uncertainty regarding the determination of these factors does not significantly affect the conclusions of this study.
The uncertainty related to the volatility distributions determined by the thermodenuder results was assessed by estimating the low and high limits of the ELVOC concentrations, namely ELVOClow and ELVOChigh. These were estimated based on the extreme mass fractions that were calculated during the sensitivity analysis of the TD model (Sect. S2 in the Supplement). The LO-OOA ELVOC mass fraction ranged from 0.09 to 0.25, while that of the MO-OOA ranged from 0.13 to 0.47. For the low ELVOC case, we assumed the following:
The R2 between the unexplained babs,405 and ELVOClow was R2=0.79 (Fig. S21). For the high ELVOC case, we assumed the following:
Once more, the correlation between the unexplained absorption at 405 nm and the ELVOCs was quite high, with R2=0.78 (Fig. S22).
A month-long campaign was conducted at a remote site in Finokalia, Crete, during May 2016. The dominant PM1 components were sulfate and aged organics with . The average ambient OA concentration was 1.5 µg m−3, and the rBC was 0.14 µg m−3. Continuous monitoring of biomass burning markers revealed that there were no periods of enhanced biomass burning influence on the site during the campaign. PMF analysis resulted in two secondary OA factors, namely one more oxidized (MO-OOA) and one less oxidized (LO-OOA). Total OA consisted on average of 40 % SVOCs, 35 % LVOCs, and 25 % ELVOCs. Both OA components had a wide range of volatilities. Approximately 30 % of the MO-OOA was ELVOCs, 30 % LVOCs, and 40 % semivolatile material. The LO-OOA was more volatile on average, with 40 % consisting of LVOCs and 45 % of SVOCs and 15 % of ELVOCs.
Aerosol optical properties were measured. The average bscat at 405 nm was 26.5 Mm−1, and the average babs at 405 nm was 2.1 Mm−1. Furthermore, the average AAE was 0.97, and the MAC405 was 16 m2 g−1. Mie theory calculations were able to reproduce approximately half of the measured MAC405 values, assuming core shell morphology and a nonabsorbing shell (k=0). We estimated that the nonabsorbing shell was causing an enhancement of the absorption by a factor of 2.1. For the other half of the measurements, the presence of an absorbing shell with an average k of 0.18 was needed to explain the measurements.
The ELVOC mass concentration was estimated using the volatility distributions of the two factors. The ELVOC concentration was highly correlated with the unexplained MAC405 (R2=0.66) and the unexplained babs,405 (R2=0.76), defined as the differences in the parameters measured and the ones predicted by Mie theory for k=0. These results suggest that the unexplained absorption in this remote site could be due, to a large extent, to the extremely low volatility components of the organic aerosol.
The data in the study are available from the authors upon request (spyros@chemeng.upatras.gr).
The supplement related to this article is available online at: https://doi.org/10.5194/acp-20-11625-2020-supplement.
AT conducted the absorption measurements, analyzed the results, and wrote the paper. EL performed the thermodenuder measurements and analyzed the results. KF performed the AMS measurements and analyzed the results. AL performed the PTR-MS measurements and analysis. EK was responsible for the OA volatility analysis. CK coordinated the field campaign and assisted with all measurements. NW assisted with all measurements. SNP was responsible for the design and coordination of the study and the synthesis of the results. All coauthors contributed to the writing of the paper.
The authors declare that they have no conflict of interest.
The authors would like to thank the Finokalia station personnel for the accommodation and for providing the Aethalometer measurements.
This work was supported by U.S. Environmental Protection Agency STAR program (grant no. R835035) and the Panhellenic infrastructure for atmospheric composition and climate change (PANACEA) project (grant no. MIS 5021516), which is implemented under the framework of “Reinforcement of the Research and Innovation Infrastructure” project funded by the European Operational Programme of “Competitiveness, Entrepreneurship and Innovation” (grant no. NSRF 2014–2020) and cofinanced by Greece and the European Union (as part of the European Regional Development Fund). Travel support was provided by the European research infrastructure of ACTRIS.
This paper was edited by Veli-Matti Kerminen and reviewed by two anonymous referees.
Alexander, D. T. L., Crozier, P. A., and Anderson, J. R.: Brown carbon spheres in East Asian outflow and their optical properties, Science, 321, 833–836, 2008.
An, W. J., Pathak, R. K., Lee, B. H., and Pandis, S. N.: Aerosol volatility measurement using an improved thermodenuder: Application to secondary organic aerosol, J. Aerosol Sci., 38, 305–314, 2007.
Andreae, M. O. and Gelencsér, A.: Black carbon or brown carbon? The nature of light-absorbing carbonaceous aerosols, Atmos. Chem. Phys., 6, 3131–3148, https://doi.org/10.5194/acp-6-3131-2006, 2006.
Arnott, W. P., Moosmüller, H., Sheridan, P. J., Ogren, J. A., Raspet, R., Slaton, W. V., Hand, J. L., Kreidenweis, S. M., and Collett Jr., J. L.: Photoacoustic and filter-based ambient aerosol light absorption measurements: instrument comparison and the role of relative humidity, J. Geophys. Res., 108, 4034–44, 2003.
Bond, T. C. and Bergstrom, R. W.: Light absorption by carbonaceous particles: An investigative review, Aerosol Sci. Tech., 40, 27–67, 2006.
Bond, T. C., Habib, G., and Bergstrom, R. W.: Limitations in the enhancement of visible light absorption due to mixing state, J. Geophys. Res., 111, D20211, 2006.
Bohren, C. F. and Huffman, D. R.: Absorption and scattering of light by small particles. Research supported by the University of Arizona and Institute of Occupational and Environmental Health, Wiley Interscience, New York, 1983.
Bougiatioti, A., Stavroulas, I., Kostenidou, E., Zarmpas, P., Theodosi, C., Kouvarakis, G., Canonaco, F., Prévôt, A. S. H., Nenes, A., Pandis, S. N., and Mihalopoulos, N.: Processing of biomass-burning aerosol in the eastern Mediterranean during summertime, Atmos. Chem. Phys., 14, 4793–4807, https://doi.org/10.5194/acp-14-4793-2014, 2014.
Canagaratna, M. R., Jimenez, J. L., Kroll, J. H., Chen, Q., Kessler, S. H., Massoli, P., Hildebrandt Ruiz, L., Fortner, E., Williams, L. R., Wilson, K. R., Surratt, J. D., Donahue, N. M., Jayne, J. T., and Worsnop, D. R.: Elemental ratio measurements of organic compounds using aerosol mass spectrometry: characterization, improved calibration, and implications, Atmos. Chem. Phys., 15, 253–272, https://doi.org/10.5194/acp-15-253-2015, 2015.
Cappa, C., Lack, D., Burkholder, J., and Ravishankara, A.: Bias in filter based aerosol light absorption measurements due to organic aerosol loading: Evidence from laboratory measurements, Aerosol Sci. Tech., 42, 1022–1032, 2008.
Cappa, C. D., Onasch, T. B., Massoli, P., Worsnop, D. R., Bates, T. S., Cross, E. S., Davidovits, P., Hakala, J., Hayden, K. L., Jobson, B. T., Kolesar, K. R., Lack, D. A., Lerner, B. M., Li, S. M., Mellon, D., Nuaaman, I., Olfert, J. S., Petäjä, T., Quinn, P. K., Song, C., Subramanian, R., Williams, E. J., and Zaveri, R. A.: Radiative absorption enhancements due to the mixing state of atmospheric black carbon, Science, 337, 1078–1081, 2012.
Cappa, C. D., Zhang, X., Russell, L. M., Collier, S., Lee, A. K. Y., Chen, C.-L., Betha, R., Chen, S., Liu, J., Price, D. J., Sanchez, K. J., McMeeking, G. R., Williams, L. R., Onasch, T. B., Worsnop, D. R., Abbatt, J., and Zhang, Q.: Light absorption by ambient black and brown carbon and its dependence on black carbon coating state for two California, USA, cities in winter and summer, J. Geophys. Res., 124, 1550–1577, 2019.
Chakrabarty, R. K., Moosmüller, H., Chen, L.-W. A., Lewis, K., Arnott, W. P., Mazzoleni, C., Dubey, M. K., Wold, C. E., Hao, W. M., and Kreidenweis, S. M.: Brown carbon in tar balls from smoldering biomass combustion, Atmos. Chem. Phys., 10, 6363–6370, https://doi.org/10.5194/acp-10-6363-2010, 2010.
Chakrabarty, R. K., Gyawali, M., Yatavelli, R. L. N., Pandey, A., Watts, A. C., Knue, J., Chen, L.-W. A., Pattison, R. R., Tsibart, A., Samburova, V., and Moosmüller, H.: Brown carbon aerosols from burning of boreal peatlands: microphysical properties, emission factors, and implications for direct radiative forcing, Atmos. Chem. Phys., 16, 3033–3040, https://doi.org/10.5194/acp-16-3033-2016, 2016.
Chen, Y. and Bond, T. C.: Light absorption by organic carbon from wood combustion, Atmos. Chem. Phys., 10, 1773–1787, https://doi.org/10.5194/acp-10-1773-2010, 2010.
China, S., Scarnato, B., Owen, R. C., Zhang, B., Ampadu, M. T., Kumar, S., Dzepina, K., Dziobak, M. P., Fialho, P., Perlinger, J. A., Hueber, J., Helmig, D., Mazzoleni, L. R., and Mazzoleni, C.: Morphology and mixing state of aged soot particles at a remote marine free troposphere site: Implications for optical properties, Geophys. Res. Lett., 42, 1243–1250, 2015.
Dastanpour, R., Momenimovahed, A., Thomson, K., Olfert, J., and Rogak, S.: Variation of the optical properties of soot as a function of particle mass, Carbon, 124, 201–211, 2017.
Ditas, J., Ma, N., Zhang, Y., Assmann, D., Neumaier, M., Riede, H., Karu, E., Williams, J., Scharffe, D., Wang, Q., Saturno, J., Schwarz, J. P., Katich, J. M., McMeeking, G. R., Zahn, A., Hermann, M., Brenninkmeijer, C. A. M., Andreae, M. O., Pöschl, U., Su, H., and Cheng, Y.: Strong impact of wildfires on the abundance and aging of black carbon in the lowermost stratosphere, P. Natl. Acad. Sci. USA, 115, 11595–11603, 2018.
Donahue, N. M., Robinson, A. L., Stanier, C. O., and Pandis, S. N.: Coupled partitioning, dilution, and chemical aging of semivolatile organics, Environ. Sci. Technol., 40, 2635–2643, 2006.
Drosatou, A. D., Skyllakou, K., Theodoritsi, G. N., and Pandis, S. N.: Positive matrix factorization of organic aerosol: insights from a chemical transport model, Atmos. Chem. Phys., 19, 973–986, https://doi.org/10.5194/acp-19-973-2019, 2019.
Forestieri, S. D., Helgestad, T. M., Lambe, A. T., Renbaum-Wolff, L., Lack, D. A., Massoli, P., Cross, E. S., Dubey, M. K., Mazzoleni, C., Olfert, J. S., Sedlacek III, A. J., Freedman, A., Davidovits, P., Onasch, T. B., and Cappa, C. D.: Measurement and modeling of the multiwavelength optical properties of uncoated flame-generated soot, Atmos. Chem. Phys., 18, 12141–12159, https://doi.org/10.5194/acp-18-12141-2018, 2018.
Fuller, K. A., Malm, W. C., and Kreidenweis, S. M.: Effects of mixing on extinction by carbonaceous particles, J. Geophys. Res., 104, 15941–15954, 1999.
Gao, R. S., Schwarz, J. P., Kelly, K. K., Fahey, D. W., Watts, L. A., Thompson, T. L., Spackman, J. R., Slowik, J. G., Cross, E. S., Han, J. H., Davidovits, P., Onasch, T. B., and Worsnop, D. R.: A novel method for estimating light-scattering properties of soot aerosols using a modified single-particle soot photometer, Aerosol Sci. Tech., 41, 125–135, 2007.
Gkatzelis, G. I., Papanastasiou, D. K., Florou, K., Kaltsonoudis, C., Louvaris, E., and Pandis, S. N.: Measurement of nonvolatile particle number size distribution, Atmos. Meas. Tech., 9, 103–114, https://doi.org/10.5194/amt-9-103-2016, 2016.
Gyawali, M., Arnott, W. P., Lewis, K., and Moosmüller, H.: In situ aerosol optics in Reno, NV, USA during and after the summer 2008 California wildfires and the influence of absorbing and non-absorbing organic coatings on spectral light absorption, Atmos. Chem. Phys., 9, 8007–8015, https://doi.org/10.5194/acp-9-8007-2009, 2009.
Gysel, M., Laborde, M., Olfert, J. S., Subramanian, R., and Gröhn, A. J.: Effective density of Aquadag and fullerene soot black carbon reference materials used for SP2 calibration, Atmos. Meas. Tech., 4, 2851–2858, https://doi.org/10.5194/amt-4-2851-2011, 2011.
Healy, R. M., Wang, J. M., Jeong, C.-H., Lee, A. K. Y., Willis, M. D., Jaroudi, E., Zimmerman, N., Hilker, N., Murphy, M., Eckhardt, S., Stohl, A., Abbatt, J. P. D., Wenger, J. C., and Evans, G. J.: Light-absorbing properties of ambient black carbon and brown carbon from fossil fuel and biomass burning sources, J. Geophys. Res., 120, 6619–6633, 2015.
Hildebrandt, L., Engelhart, G. J., Mohr, C., Kostenidou, E., Lanz, V. A., Bougiatioti, A., DeCarlo, P. F., Prevot, A. S. H., Baltensperger, U., Mihalopoulos, N., Donahue, N. M., and Pandis, S. N.: Aged organic aerosol in the Eastern Mediterranean: the Finokalia Aerosol Measurement Experiment – 2008, Atmos. Chem. Phys., 10, 4167–4186, https://doi.org/10.5194/acp-10-4167-2010, 2010.
Hildebrandt, L., Kostenidou, E., Lanz, V. A., Prevot, A. S. H., Baltensperger, U., Mihalopoulos, N., Laaksonen, A., Donahue, N. M., and Pandis, S. N.: Sources and atmospheric processing of organic aerosol in the Mediterranean: insights from aerosol mass spectrometer factor analysis, Atmos. Chem. Phys., 11, 12499–12515, https://doi.org/10.5194/acp-11-12499-2011, 2011.
Jacobson, M. Z.: Strong radiative heating due to the mixing state of black carbon in atmospheric aerosols, Nature, 409, 695–697, 2001.
Kalivitis, N., Bougiatioti, A., Kouvarakis, G., and Mihalopoulos, N.: Long term measurements of atmospheric aerosol optical properties in the Eastern Mediterranean, Atmos. Res., 102, 351– 357, 2011.
Karnezi, E., Riipinen, I., and Pandis, S. N.: Measuring the atmospheric organic aerosol volatility distribution: a theoretical analysis, Atmos. Meas. Tech., 7, 2953–2965, https://doi.org/10.5194/amt-7-2953-2014, 2014.
Kirchstetter, T., Novakov, T., and Hobbs, P.: Evidence that the spectral dependence of light absorption by aerosols is affected by organic carbon, J. Geophys. Res., 109, D21208, https://doi.org/10.1029/2004JD004999, 2004.
Kirchstetter, T. W. and Novakov, T.: Controlled generation of black carbon particles from a diffusion flame and applications in evaluating black carbon measurement methods, Atmos. Environ., 41, 1874–1888, 2007.
Knox, A., Evans, G. J., Brook, J. R., Yao, X., Jeong, C.-H., Godri, K. J., Sabaliauskas, K., and Slowik, J. G.: Mass absorption cross-section of ambient black carbon aerosol in relation to chemical age, Aerosol Sci. Tech., 43, 522–532, 2009.
Kostenidou, E., Pathak, R. K., and Pandis, S. N.: An algorithm for the calculation of secondary organic aerosol density combining AMS and SMPS data, Aerosol Sci. Tech., 41, 1002–1010, 2007.
Kouvarakis, G., Tsigaridis, K., Kanakidou, M., and Mihalopoulos, N.: Temporal variations of surface regional background ozone over Crete Island in the Southeast Mediterranean, J. Geophys. Res., 105, 399–407, 2000.
Lack, D. A., Cappa, C. D., Covert, D. S., Baynard, T., Massoli, P., Sierau, B., Bates, T. S., Quinn, P. K., Lovejoy, E. R., and Ravishankara, A. R.: Bias in filter based aerosol light absorption measurements due to organic aerosol loading: Evidence from ambient measurements, Aerosol Sci. Tech., 42, 1033–1041, 2008.
Lack, D. A. and Cappa, C. D.: Impact of brown and clear carbon on light absorption enhancement, single scatter albedo and absorption wavelength dependence of black carbon, Atmos. Chem. Phys., 10, 4207–4220, https://doi.org/10.5194/acp-10-4207-2010, 2010.
Lack, D. A., Langridge, J. M., Bahreini, R., Cappa, C. D., Middlebrook, A. N., and Schwarz, J. P.: Brown carbon and internal mixing in biomass burning particles, Proc. Natl. Acad. Sci. USA, 109, 14802–14807, 2012.
Lanz, V. A., Alfarra, M. R., Baltensperger, U., Buchmann, B., Hueglin, C., and Prévôt, A. S. H.: Source apportionment of submicron organic aerosols at an urban site by factor analytical modelling of aerosol mass spectra, Atmos. Chem. Phys., 7, 1503–1522, https://doi.org/10.5194/acp-7-1503-2007, 2007.
Lee, B. H., Kostenidou, E., Hildebrandt, L., Riipinen, I., Engelhart, G. J., Mohr, C., DeCarlo, P. F., Mihalopoulos, N., Prevot, A. S. H., Baltensperger, U., and Pandis, S. N.: Measurement of the ambient organic aerosol volatility distribution: application during the Finokalia Aerosol Measurement Experiment (FAME-2008), Atmos. Chem. Phys., 10, 12149–12160, https://doi.org/10.5194/acp-10-12149-2010, 2010.
Lelieveld, J., Berresheim, H., Borrmann, S., Crutzen, P. J., Dentener, F. J., Fischer, H., Feichter, J., Flatau, P. J., Heland, J., Holzinger, R., Korrmann, R., Lawrence, M. G., Levin, Z., Markowicz, K. M., Mihalopoulos, N., Minikin, A., Ramanathan, V., de Reus, M., Roelofs, G. J., Scheeren, H. A., Sciare, J., Schlager, H., Schultz, M., Siegmund, P., Steil, B., Stephanou, E. G., Stier, P., Traub, M., Warneke, C., Williams, J., and Ziereis, H.: Global air pollution crossroads over the mediterranean, Science, 298, 794–799, 2002.
Li, X., Chen, Y., and Bond, T. C.: Light absorption of organic aerosol from pyrolysis of corn stalk, Atmos. Environ. 144, 249–256, 2016.
Liu, S., Aiken, A. C., Gorkowski, K., Dubey, M. K., Cappa, C. D., Williams, L. R., Herndon, S. C., Massoli, P., Fortner, E. C., Chhabra, P. S., Brooks, W. A., Onasch, T. B., Jayne J. T., Worsnop, D. R., China, S., Sharma, N., Mazzoleni, C., Xu, L., Ng, N. L., Liu, D., Allan, J. D., Lee, J. D., Fleming, Z. L., Mohr, C., Zotter, P., Szidat, S., and Prévôt, A. S. H.: Enhanced light absorption by mixed source black and brown carbon particles in UK winter, Nat Commun., 6, 8435, https://doi.org/10.1038/ncomms9435, 2015.
Liu, D., Whitehead, J., Alfarra, M. R., Reyes-Villegas, E., Spracklen, D. V., Reddington, C. L., Kong, S., Williams, P. I., Ting, Y.-C., Haslett, S., Taylor, J. W., Flynn, M. J., Morgan, W. T., McFiggans, G., Coe, H., and Allan, J. D.: Black-carbon absorption enhancement in the atmosphere determined by particle mixing state, Nat. Geosci., 10, 184–188, 2017.
Liu, C., Chung, C. E., Yin, Y., and Schnaiter, M.: The absorption Ångström exponent of black carbon: from numerical aspects, Atmos. Chem. Phys., 18, 6259–6273, https://doi.org/10.5194/acp-18-6259-2018, 2018.
Louvaris, E. E., Florou, K., Karnezi, E., Papanastasiou, D. K., Gkatzelis, G. I., and Pandis, S. N.: Volatility of source apportioned wintertime organic aerosol in the city of Athens, Atmos. Environ., 158, 138–147, 2017.
McMeeking, G. R., Fortner, E., Onasch, T. B., Taylor, J. W., Flynn, M., Coe, H., and Kreidenweis, S. M.: Impacts of nonrefractory material on light absorption by aerosols emitted from biomass burning, J. Geophys. Res., 119, 12272–12286, 2014.
Mihalopoulos, N., Stephanou, E., Kanakidou, M., Pilitsidis, S., and Bousquet, P.: Tropospheric aerosol ionic composition in the eastern Mediterranean region, Tellus, 49B, 314–326, 1997.
Mullins, J. and Williams, A.: The optical properties of soot: A comparison between experimental and theoretical values, Fuel, 66, 277–280, 1987.
Nakayama, T., Suzuki, H., Kagamitani, S., Ikeda, Y., Uchiyama, A., and Matsumi, Y.: Characterization of a three wavelength Photoacoustic Soot Spectrometer (PASS-3) and a Photoacoustic Extinctiometer (PAX), J. Meteorol. Soc. Japan., 93, 285–308, 2015.
Paatero, P. and Tapper, U.: Positive matrix factorization: A non-negative factor model with optimal utilization of error estimates of data values, Environmetrics, 5, 111–126, 1994.
Park, K., Kittelson, D. B., Zachariah, M. R., and McMurry, P. H.: Measurement of inherent material density of nanoparticle agglomerates, J. Nanopart. Res., 6, 267–272, 2004.
Pikridas, M., Bougiatioti, A., Hildebrandt, L., Engelhart, G. J., Kostenidou, E., Mohr, C., Prévôt, A. S. H., Kouvarakis, G., Zarmpas, P., Burkhart, J. F., Lee, B.-H., Psichoudaki, M., Mihalopoulos, N., Pilinis, C., Stohl, A., Baltensperger, U., Kulmala, M., and Pandis, S. N.: The Finokalia Aerosol Measurement Experiment – 2008 (FAME-08): an overview, Atmos. Chem. Phys., 10, 6793–6806, https://doi.org/10.5194/acp-10-6793-2010, 2010.
Radney, J. G., You, R., Ma, X., Conny, J. M., Zachariah, M. R., Hodges, J. T., and Zangmeister, C. D.: Dependence of Soot Optical Properties on Particle Morphology: Measurements and Model Comparisons, Environ. Sci. Technol., 48, 3169–3176, 2014.
Riipinen, I., Pierce, J. R., Donahue, N. M., and Pandis, S. N.: Equilibration time scales of organic aerosol inside thermodenuders: Kinetics versus equilibrium thermodynamics, Atmos. Environ., 44, 597–607, 2010.
Saleh, R., Robinson, E. S., Tkacik, D. S., Ahern, A. T., Liu, S., Aiken, A. C., Sullivan, R. C., Presto, A. A., Dubey, M. K., Yokelson, R. J., Donahue, N. M., and Robinson, A. L.: Brownness of organics in aerosols from biomass burning linked to their black carbon content, Nat. Geosci., 7, 647–650, 2014.
Saleh, R., Cheng, Z., and Atwi., K.: The brown–black continuum of light-absorbing combustion aerosols, Environ. Sci. Technol. Lett. 5, 508–13, 2018.
Saliba, G., Subramanian, R., Saleh, R., Ahern, A. T., Lipsky, E. M., Tasoglou, A., Sullivan, R. C., Bhandari, J., Mazzoleni, C., and Robinson, A. L.: Optical properties of black carbon in cookstove emissions coated with secondary organic aerosols: Measurements and modeling, Aerosol Sci. Tech., 50, 1264–1276, 2016.
Tasoglou, A., Saliba, G., Subramanian, R., and S. N. Pandis S. N.: Absorption of chemically aged biomass burning carbonaceous aerosol, J. Aerosol. Sci., 113, 141–52, 2017.
Ulbrich, I. M., Canagaratna, M. R., Zhang, Q., Worsnop, D. R., and Jimenez, J. L.: Interpretation of organic components from Positive Matrix Factorization of aerosol mass spectrometric data, Atmos. Chem. Phys., 9, 2891–2918, https://doi.org/10.5194/acp-9-2891-2009, 2009.
Vrekoussis, M., Liakakou, E., Koçak, M., Kubilay, N., Oikonomou, K., Sciare, J., and Mihalopoulos, N.: Seasonal variability of optical properties of aerosols in the eastern Mediterranean, Atmos. Environ., 39, 7083–7094, 2005.
Weingartner, E., Saathoff, H., Schnaiter, M., Streit, N., Bitnar, B., and Baltensperger, U.: Absorption of light by soot particles: Determination of the absorption coefficient by means of aethalometers, J. Aerosol. Sci. 34, 1445–63, 2003.
Wong, J. P. S., Tsagkaraki, M., Tsiodra, I., Mihalopoulos, N., Violaki, K., Kanakidou, M., Sciare, J., Nenes, A., and Weber, R. J.: Atmospheric evolution of molecular-weight-separated brown carbon from biomass burning, Atmos. Chem. Phys., 19, 7319–7334, https://doi.org/10.5194/acp-19-7319-2019, 2019.
Wu, J.-S., Krishnan, S. S., and Feath, G. M.: Refractive indices at visible wavelengths of soot emitted from buoyant turbulent diffusion flames, J. Heat Transfer, 119, 230–237, 1997.
Zanatta, M., Laj, P., Gysel, M., Baltensperger, U., Vratolis, S., Eleftheriadis, K., Kondo, Y., Dubuisson, P., Winiarek, V., Kazadzis, S., Tunved, P., and Jacobi, H.-W.: Effects of mixing state on optical and radiative properties of black carbon in the European Arctic, Atmos. Chem. Phys., 18, 14037–14057, https://doi.org/10.5194/acp-18-14037-2018, 2018.
Zhang, Y., Favez, O., Canonaco, F., Liu, D., Močnik, G., Amodeo, T., Sciare, J., Prévôt, A. S. H., Gros, V., and Albinet, A.: Evidence of major secondary organic aerosol contribution to lensing effect black carbon absorption enhancement, NPJ Clim. Atmos. Sci., 1, https://doi.org/10.1038/s41612-018-0056-2, 2018a.
Zhang, Y., Zhang, Q., Cheng, Y., Su, H., Li, H., Li, M., Zhang, X., Ding, A., and He, K.: Amplification of light absorption of black carbon associated with air pollution, Atmos. Chem. Phys., 18, 9879–9896, https://doi.org/10.5194/acp-18-9879-2018, 2018b.