the Creative Commons Attribution 4.0 License.
the Creative Commons Attribution 4.0 License.
 | 12 Oct 2020
Optical properties and composition of viscous organic particles found in the Southern Great Plains
Daniel J. Bonanno
Swarup China
Don Q. Pham
Daniel Veghte
Johannes Weis
Gourihar Kulkarni
Ken Teske
Mary K. Gilles
Alexander Laskin
Ryan C. Moffet
Atmospheric high-viscosity organic particles (HVOPs) were observed in samples of ambient aerosols collected in April and May 2016 in the Southern Great Plains of the United States. These particles were apportioned as either airborne soil organic particles (ASOPs) or tar balls (TBs) from biomass burning based on spetro-microscopic imaging and assessments of meteorological records of smoke and precipitation data. Regardless of their apportionment, the number fractions of HVOPs were positively correlated (R2=0.85) with increased values of absorption Ångström exponent (AAE) measured in situ for ambient aerosol at the site. Extending this correlation to 100 % HVOPs yields an AAE of 2.6, similar to previous literature reports of the class of light-absorbing organic particles known as brown carbon (BrC). One out of the three samples investigated had a significant number of ASOPs, while the other two samples contained TBs. Although there are chemical similarities between ASOPs and TBs, they can be distinguished based on composition inferred from near-edge absorption X-ray fine structure (NEXAFS) spectroscopy. ASOPs were distinguished from TBs based on their average and peak ratios, with ASOPs having lower ratios. NEXAFS spectra of filtered soil organic brine particles nebulized from field samples of standing water deposited after rain were consistent with ASOPs when laboratory particles were generated by bubble bursting at the air–organic brine interface. However, particles generated by nebulizing the bulk volume of soil organic brine had a particle composition different from ASOPs. These observations are consistent with the raindrop generation mechanism responsible for ASOP emissions in the area of study. In contrast, nebulized samples carry with them higher fractions of soil inorganics dissolved in the bulk volume of soil brine, which are not aerosolized by the raindrop mechanism. Our results support the bubble bursting mechanism of particle generation during rainfall resulting in the ejection of soil organics into the atmosphere. In addition, our results show that ASOPs may only be atmospherically relevant during times when suitable emission conditions are met.
- Article
(4741 KB) - Full-text XML
-
Supplement
(1665 KB) - BibTeX
- EndNote


Regional and global atmospheric transport models are commonly used to predict the impact of aerosols on radiative forcing (Feng et al., 2013). The efficacy of these models relies on estimates of the types, number concentrations, spatial distribution, and emission sources of aerosols. One challenge of continued scientific discussion is how (and to what extent) industry and other anthropogenic activities contribute to climate forcing. Emissions of soot, one of the most well-studied anthropogenic aerosols emitted by fossil fuel combustion, have been shown to have a strong climate warming factor comparable to carbon dioxide (Bond et al., 2013). However, soot is not the only light-absorbing carbon-containing aerosol of concern. Less absorbing but often more abundant light-absorbing organic carbon aerosol, known as brown carbon (BrC), has been the subject of increased investigation, with studies showing that BrC may account for a substantial fraction of the total aerosol radiative forcing (Feng et al., 2013; Zhang et al., 2017). These particles exhibit a wavelength-dependent light absorption, absorbing stronger at shorter wavelengths, giving them a brown appearance. Ongoing research on the role of BrC in global radiative forcing suggests it is insufficiently represented in models (Feng et al., 2013; Laskin et al., 2015; Bond and Bergstrom, 2006).
BrC particles are defined in very general terms by their chemical composition and optical properties (Bond et al., 2013; Laskin et al., 2015). BrC refers to a broad category of organic particles comprised of many different chromophores originating from a variety of sources (Andreae and Gelencsér, 2006). Sources of BrC include, but are not limited to, biomass burning (Rizzo et al., 2013; Laskin et al., 2015), biogenic fungi, humic-like substances (Andreae and Gelencsér, 2006; Wang et al., 2016), and secondary organics (Laskin et al., 2015). One example of BrC particles are tar balls (TBs), which are most commonly found in biomass burning emissions downwind of smoldering fires (Chakrabarty et al., 2010). TBs of 50–300 nm size have a characteristic spherical morphology observed in many studies, which is indicative of their highly viscous or “glassy” phase state. Recently, larger spherical organic particles (∼500 nm) of a different BrC type (Veghte et al., 2017) have also been observed in rural Oklahoma, with their composition being consistent with soil organic matter (SOM). These newly discovered BrC particles have been termed airborne soil organic particles (ASOPs) (Wang et al., 2016). The study reported the formation of highly viscous submicron particles following the impaction of rain droplets on the soil surfaces which eject ASOPs into the ambient air (Wang et al., 2016). The mechanism of plausible ASOP emissions was further corroborated by laboratory experiments with water droplets falling onto surfaces of soil proxies. Briefly, as falling water droplets make contact with the porous soil surface, air from within the soil is trapped beneath the resulting water layer. Bubbles form as the droplet sinks and mixes with the soil. These bubbles then rise to the air–water interface, bringing dissolved soil organics with them, where a cavity forms and then ruptures producing aerosols containing compounds entrained from the soil (Joung and Buie, 2015).
A defining characteristic of BrC particles is the spectral dependence of light absorption at the visible wavelengths. One way of quantifying this dependence is to measure the absorption coefficient (σap) as a function of wavelength to calculate the absorption Ångström exponent (AAE) (Backman et al., 2014). The AAE value is essentially the slope of a log–log plot of absorption coefficient and wavelength, with higher values corresponding to enhanced absorption at shorter wavelengths. Because soot absorbs nearly equally across the entire visible spectrum, it has an AAE value of approximately 1. In contrast, reported AAE values for BrC are substantially higher, typically in the range of 2.5–6 (Rizzo et al., 2013; Lawless et al., 2004; Hoffer et al., 2006), but they could be as high as 9–11 (Andreae and Gelencsér, 2006; Lin et al., 2017). An AAE value of 2.5 has been used as a lower limit to attribute absorption, at least in part, to BrC (Lack and Langridge, 2013). In addition to the AAE, absorption due to BrC has also been investigated through the calculation of the complex refractive index (Veghte et al., 2017).
To better characterize highly viscous organic particles (HVOPs) appearing as solid spheres, samples of ambient particles were collected at the atmospheric radiation measurement (ARM) facility in Lamont, Oklahoma, located in the Southern Great Plains (SGP) as part of the Holistic Interactions of Shallow Clouds, Aerosols, and Land-Ecosystems (HI-SCALE) field campaign (Fast et al., 2019). To compare the spectroscopic signatures of atmospheric particles with SOM typical for the area of study, aquatic samples of the surface layer of muddy puddles were also collected around the sampling site. These aquatic samples were then filtered, nebulized, and the resulting particles were impacted onto microscopy substrates. The purpose of collecting these samples was to use them to compare particle morphology and composition when the AAE was high, as indicated by online measurements performed at the site (Springston et al., 2016). The particle samples were analyzed with both scanning electron microscopy (SEM) and scanning transmission X-ray microscopy coupled with near-edge X-ray absorption fine structure (STXM-NEXAFS) spectroscopy. SEM images were taken at a 75∘ tilted angle with respect to the surface normal to identify HVOPs. STXM was then used to obtain chemical images of particles at the C K-edge spectral range to distinguish ASOPs and TBs based on their carbon NEXAFS spectra (Wang et al., 2016).
The present work evaluates the appearance of ASOPs following rain events and determines their particle-specific spectroscopic characteristics that would enable us to distinguish them from biomass burning TBs, secondary organic aerosols (SOAs), and other anthropogenic sources (Parworth et al., 2015; Sheridan et al., 2001). Characterizing the properties and emission sources of unaccounted BrC particles like ASOPs is vital to ensure the proper representation of BrC in local and regional climate models. Multiple experimental records (both real-time and spectro-microscopic) were used here to assess the underreported ASOPs. Using these techniques in tandem with long-standing atmospheric measurements will also help in advancing our knowledge of how ASOPs fit into the broader class of BrC and how ASOPs may affect radiative forcing by aerosols.
2.1 2.1 Sample collection
Samples of atmospheric particles were collected at the ARM SGP field site located in north central Oklahoma (36∘36′18.0′′ N, 97∘29′6.0′′ W) at an altitude of 320 m (Ferrare et al., 2006). Sampling was performed before forecasted and after observed rain events during the rainy season from 26 April through 17 May during day and night periods separately. Within this timeframe, samples were collected between 08:00 and 21:00 local time (LT). The total sampling time was approximately 8 h (unless interrupted by a major rain event) with samplers operating using a 30 min on/30 min off duty cycle. Similarly, four nighttime samples were collected between the hours of 18:00 and 06:00 LT with a duty cycle of 60 min on/30 min off. Rain events interrupted 2 sampling days (8 and 16 May) during which no sampling took place. The primary objective was to observe particle types during sunny days following major rain events, for which a threshold precipitation rate of 10 mm h−1 was used to define a rain event when enhanced ASOP concentrations would be likely. Note that ASOPs may be present during some periods without a recent local rain event due to transport from elsewhere.
Particles were collected by impaction using a Micro-Orifice Uniform Deposit Impactor (MOUDI; MSP 100) attached to a rotating motor that rotates the eight impaction surfaces (known as stages) to facilitate uniform particle deposition. The impactor was connected to a 3∕4 max horsepower (0.56 kW) vacuum pump (General Electric Motors & Industrial Systems, 10 PSI rating). With a 30 L min−1 sampling flow rate, the micro-orifice nozzles reduce jet velocity, pressure drop, particle bounce, and re-entrainment. This MOUDI was connected to a mesh-covered sampling inlet which was tilted downward, avoiding unwanted collection of descending debris, insects, and other sources of contamination, and was positioned ∼6 m above the ground.
Samples for analysis were selected from two stages with the following particle size cutoff ranges: stage 7 (0.32 to 0.56 µm) and stage 8 (0.18 to 0.32 µm). These stages were chosen to cover part of the size ranges for TBs (50 to 300 nm) (Tóth et al., 2014) and ASOPs (300 to 800 nm) (Wang et al., 2016) while also constraining the number of samples to analyze. Substrates of Si3N4 film supported by a silicon wafer (0.5 mm×0.5 mm Si3N4 window, 100 nm membrane thickness, 5 mm×5 mm Si frame; Silson, Inc.) and filmed transmission electron microscopy copper grids (carbon type B film, copper 400 mesh grids; Ted Pella, Inc.) were used as impaction substrates.
In addition to impaction samples of ambient particles, aquatic samples containing SOM brine were collected in 50–200 mL aliquots via syringes from mud puddles surrounding the SGP field site. This was performed to evaluate a connection between organics from terrestrial aquatic samples, the hypothesized source of ASOPs, and ambient ASOPs. Four SOM aquatic samples were collected on 17 May 2016 prior to the offline analysis of microscopy samples. The obtained samples were then nebulized in laboratory experiments using a Collison Nebulizer (3 jet MRE, CH Technologies, United States) and collected on stage 8 of a 10-stage impactor (110-R, MSP, Inc.) to produce 300–500 nm diameter particles, in which subsequent tilted SEM imaging revealed that ASOPs comprised up to 80 % of the particles by number. In addition, an aliquot of 30–40 mL of one SOM sample was used to generate particles by bubbling N2 gas (at 8 L min−1) through the liquid using a fritted glass bubbler. The N2 gas, now carrying particles generated from the bursting of bubbles at the air–water interface, was directed into a cascade impactor (Sioutas Personal Cascade Impactor #225-370, SKC) in which particles were collected on a preloaded microscopy grid to mimic the hypothesized mechanism of ASOP formation. Stage D of the Sioutas impactor was used (D50 0.25 µm) to best correspond with the size ranges of MOUDI samples taken.
2.2 STXM measurements and image processing
The STXM instruments (beamline 5.3.2.2 ALS, Berkeley, CA, United States, and the SM1 beamline CLS, Saskatoon, SK, Canada) used in this work are located in the Advanced Light Source (ALS) at the Lawrence Berkley National Laboratory and at the Canadian Light Source (CLS) at the University of Saskatchewan (Kilcoyne et al., 2003; Regier et al., 2007). Briefly, monochromatic soft X-rays are focused down to a spot size ranging from 20 to 40 nm in diameter. The sample is raster scanned after a region of sufficient particle concentration is found, and individual images are captured at selected photon energies. Maps were collected in addition to spectra, which are images consisting of eight energies around the elemental absorption k edges, four energies corresponding to C absorption at 278.0, 285.4, 288.6, and 320.0 eV, two for N absorption at 398.0 and 430.0 eV, and two for O absorption at 525.0 and 550.0 eV. These energies are used to identify and characterize the basic chemical composition maps of particles on a pixel-by-pixel basis (Fraund et al., 2017). The two C energies at 285.4 and 288.6 eV are used for the identification of soot or elemental carbon (EC). The absorption peak at 285.4 eV occurs due to the excitation of the C transition (* indicating the excited state), which is indicative of sp2 hybridized carbon-carbon bonds (C=C). This excitation of sp2 hybridized carbon is prominent for soot (Bond and Bergstrom, 2006). To identify soot, the intensity of the sp2 peak (relative to the pre-edge at 278 eV after normalization to 320 eV) must be equal to or exceed 35 % of that of highly ordered pyrolytic graphite (Moffet et al., 2010). Absorption at 288.6 eV is representative of the C transition characteristic of carboxylic acid groups (COOH) that are very common in atmospheric organic carbon. These photon energies aid in differentiating individual particles based on the molecular speciation of carbon, making this method convenient for the analysis of the field collected particles (Moffet et al., 2010). Spatial displacement between images within a stack does occur, and, whenever needed, it has been corrected for by utilizing the image registration algorithm developed by Guizar-Sicairos (Fraund et al., 2017; Guizar-Sicairos et al., 2008).
2.3 SEM measurements
The SEM analysis of particle samples was performed at the Environmental Molecular Sciences Laboratory (EMSL) located at Pacific Northwest National Laboratory (PNNL). Particles were imaged using a computer-controlled scanning electron microscope (FEI Quanta 3D FEG, Hillsboro, AL, United States). SEM images were initially taken orthogonally to the substrate until a particle-laden region on the substrate was identified. The substrate mount was then tilted by 75∘ in order to identify spherical particles. Based on the tilted images, particles which had an aspect ratio (height divided by width) greater than 0.8 were identified as spherical HVOPs. The SEM images were categorized based on aspect ratio to determine the fraction of HVOPs (high aspect ratio) compared to flat, nonspherical particles (low aspect ratio) for ensembles of approximately 400 total particles. This counting was performed manually for both ambient and lab-generated samples.
2.4 Particle soot absorption photometer measurements
The particle soot absorption photometer (3-λ PSAP) instrument measures light transmission through aerosol filter samples at three wavelengths: red (660 nm), green (522 nm), and blue (470 nm) (Springston, 2018). PSAP measurements, taken at the SGP ARM facility, are a standard data product (ARM, 2019). Equation (1) shows how absorption coefficients (σap) are calculated from raw PSAP data using spot size (A), sample volume (V), and average filter transmittances for incident (Io) and transmitted (e) light through a particle-laden filter:
Implementing corrections specified in Bond et al. (1999), as shown in Eq. (2), minimizes noise present in the PSAP data, which is a result of inherent unit-to-unit variability in field instrumentation. Additionally, these corrections mitigate systematic error from filter loading. The absorption reported by the PSAP instrument (σPSAP) includes an inherent calibration for a given measurement period which monitors the change in transmission by using the previous sample as a blank:
The raw absorption coefficient of a sample (σap) at a given time is normalized by filter transmission (τ), which is reset after the installation of a new filter (τ=1 for an unloaded filter) (Springston, 2018). The corrected absorption coefficients were used to calculate the AAE values. Backman et al. (2014) introduced the following equation relating Ångström exponent (AE) to the wavelength-dependent (λ) extinction (Backman et al., 2014):
where σE refers to the extinction coefficient at wavelength λ. While the AE represents the spectral dependence of combined scattering and absorption, the AAE is specific to absorption and is obtained by substituting σap for σE (Backman et al., 2014). By taking Eq. (3) at a given wavelength and subtracting Eq. (1) at another wavelength, the constant C can be removed, resulting in a more practical equation:
Using Eq. (4), PSAP data were used to calculate the AAE of ambient aerosols. The appearance of BrC was then inferred from PSAP time records based on elevated values of AAE greater than 1.7 (Kirchstetter et al., 2004).
3.1 Optical properties of high-viscosity organic particles
Spherical HVOPs have similar spectral characteristics to BrC regardless of their origin. Both TBs and ASOPs show a characteristic increased absorption for shorter wavelengths of visible light compared to longer wavelengths (Alexander et al., 2008; Veghte et al., 2017). During periods when they are prevalent, overall aerosol optical properties should start to resemble those of BrC. To investigate the presence of BrC with this wavelength dependence, PSAP data were utilized to determine time records of AAE as shown in Fig. 1 alongside the corrected absorption coefficients. Time records of CO mixing ratios and particle number concentrations are also shown in Fig. 1 to provide further information on the composition of air mass. Figure 1 shows how both red and blue absorption coefficients and AAE change over the course of this study. Rain events were defined as periods of time when rainfall exceeded 10 mm h−1. If two rain events were observed less than 30 min apart, they were considered one event. The vertical gray bars show sampling periods when aerosol with BrC properties was detected and which particle samples were imaged with STXM and SEM.
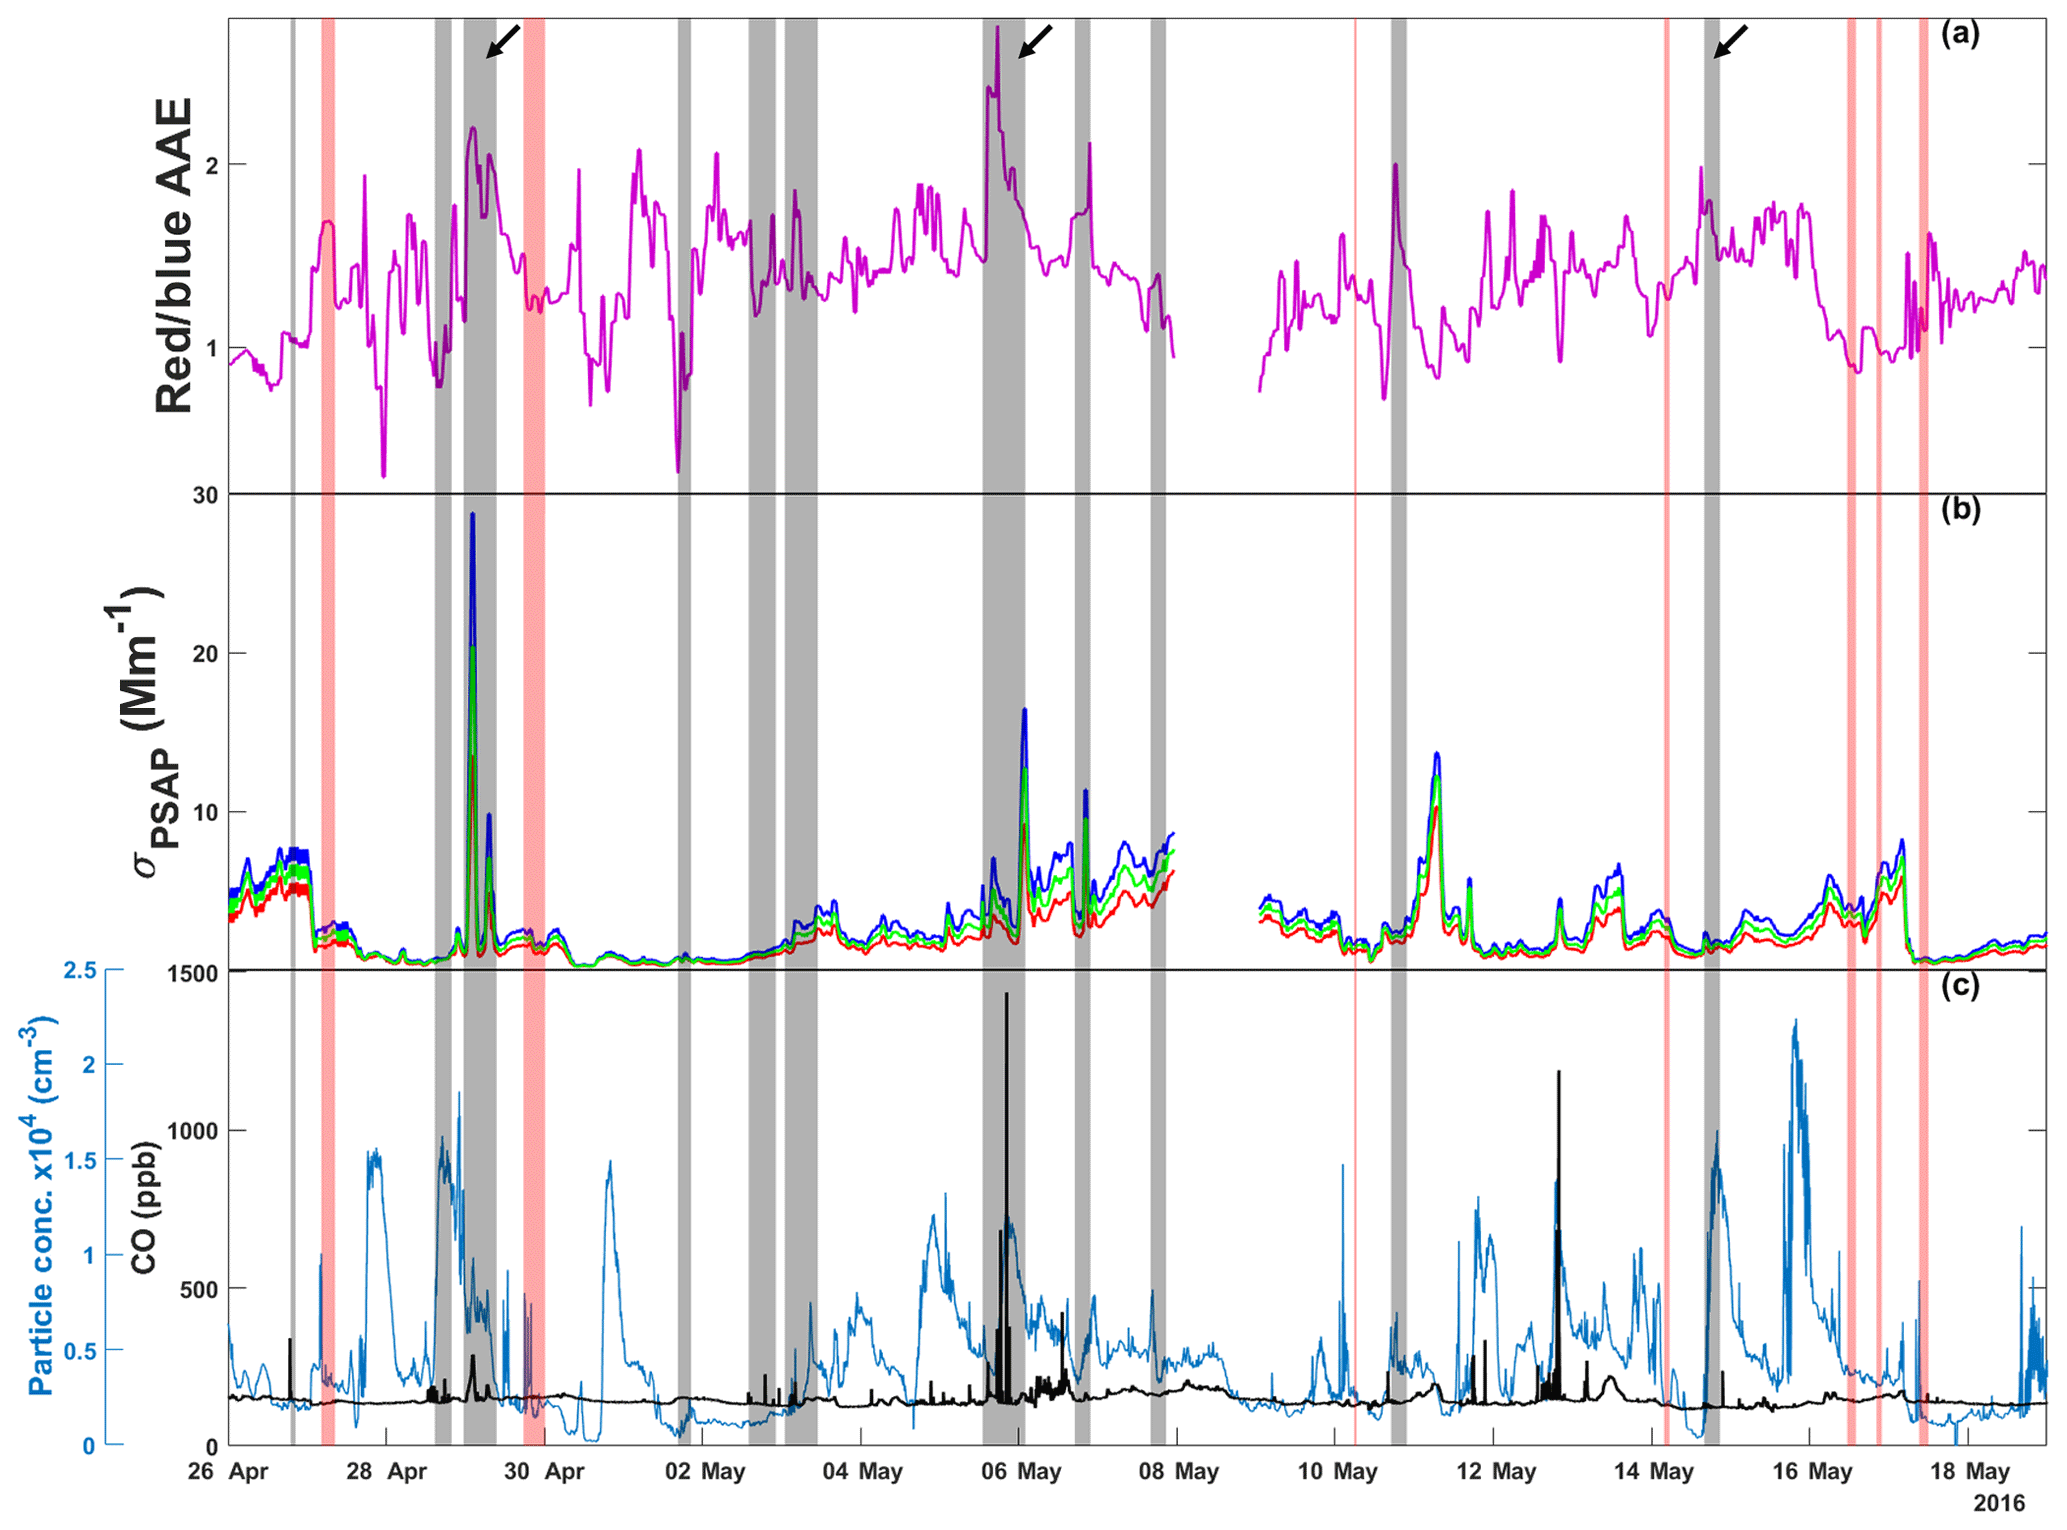
Figure 1Time series for (a) absorption Ångström exponent (AAE) calculated from red and blue absorption coefficients (reported in units of reciprocal megameters), (b) absorption coefficients measured at red (660 nm), green (522 nm), and blue (470 nm) wavelengths, and (c) CO mixing ratio and ambient particle concentration. Gray vertical bars indicate sampling periods where microscopy samples were collected. Red vertical bars represent rain events. Arrows indicate the three sampling periods investigated in the current work where BrC particles were expected. PSAP data for 8 May are not available due to instrument error.
Both the absorption coefficient and AAE time series data were collected with minute time resolution; the data have been averaged over 30 min time windows to emphasize longer-term data trends instead of short-term fluctuations. The AAE sometimes shows an increase after rain events, though it is not consistent; because aerosol production from rain is more complex than rainfall amounts (depending on droplet size and impact velocity, as well as soil characteristics), it is difficult to see a direct correlation between rain and AAE or particle concentration. While ASOP emissions are expected during rain events, precipitation scavenging is also occurring (Joung and Buie, 2015). The net effect of these two competing processes likely depends on many environmental conditions and is not yet clear. During a rain event, ASOPs will contribute to an increased AAE but because AAE is a bulk optical property, the presence of other absorbing aerosols like black carbon or the washout of mineral dust (large particles with a high AAE) can dampen the effect that rain events have on AAE (Bergstrom et al., 2007).
From this time record, a few samples stand out: the nights of 28 April and 5 and 14 May as these samples had elevated AAE greater than 1.7. On 5 May and 28 April, measured AAE values were above 2, warranting the analysis of particle samples (Lack and Langridge, 2013). While the 14 May sample does not show particularly high AAE values compared to the entire time series, it was collected after a heavy rain storm passed through the area. Also, the particle concentration immediately following the rain event on 14 May shows a significant level of precipitation scavenging, reducing the number of background particles present during sampling and concentrating any ASOPs produced (Hegg et al., 2011). Of note, the lower the σap drops due to rain or otherwise, the more pronounced the effect that PSAP noise has on the calculated AAE. In addition to having high AAE values, both the 28 April and 5 May periods showed elevated particle and CO concentrations, indicating plausible anthropogenic activity or biomass burning plumes. Figure S1 in the Supplement shows the time series of trace gases (CO, O3, and SO2) and particle concentration which can be used to identify anthropogenically influenced air plumes. In addition to elevated CO levels, the 28 April and 5 May samples show elevated SO2 concentrations, while some of the highest O3 concentrations seen over the sampling periods were observed during 5 May. In contrast, the 14 May period exhibits low or fairly average concentrations of these trace gases.
3.2 Chemical imaging of high-viscosity organic particles
Bulk optical properties, like an elevated AAE, may suggest the presence of spherical HVOPs; therefore, these measurements were used to select samples for detailed chemical imaging of particles. First, tilted SEM images were taken, and HVOP fractions were observed in individual samples ranging from 5 % to nearly 70 % by number. Figure 2 shows representative microscopy and spectro-microscopy images for 3 d when HVOP fractions were high. The top row shows the tilted SEM images used to identify HVOPs. Magenta arrows point to a few identified HVOPs to highlight how much they stick out above the substrate compared to the others. Of note, the SEM images also show the presence of what looks like fractal soot particles in the 28 April and 5 May samples.
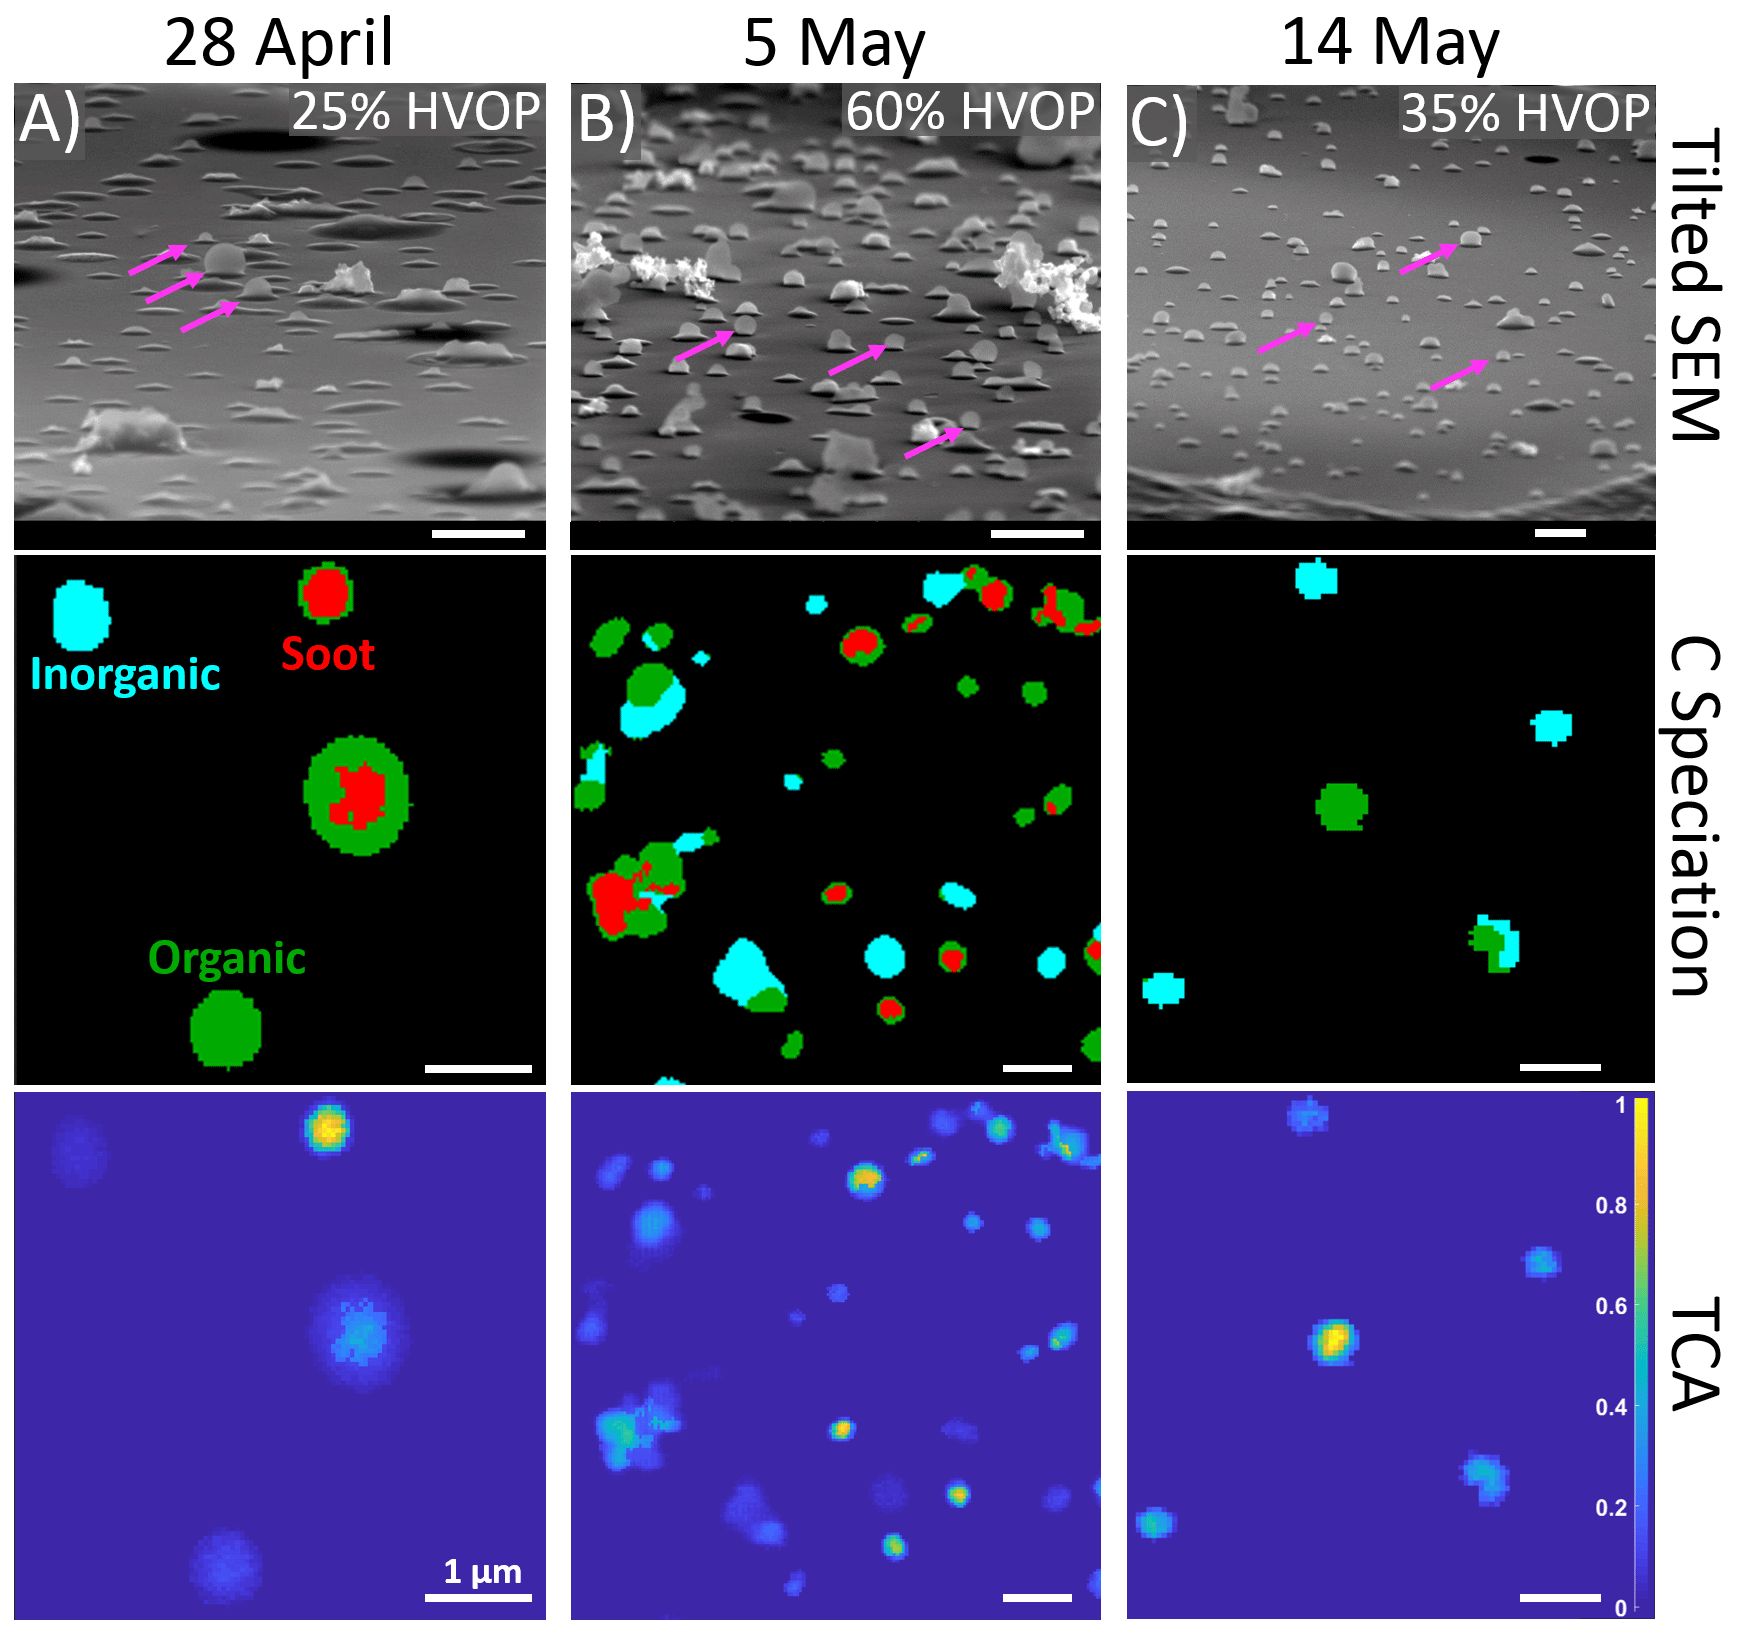
Figure 2(Top row) Tilted (75∘) SEM images show differences in HVOP fractions between three samples. Each of these samples were collected on a MOUDI stage 8, which selected particles in the 150–360 nm size range. Magenta arrows point to characteristic HVOPs. (Middle row) Carbon speciation maps with red representing regions with enhanced C=C bonding, green representing organics, and teal representing inorganics. (Bottom row) Total carbon absorption (TCA) images calculated from dividing thickness by the area equivalent diameter of each particle. The carbon speciation and TCA maps show the same fields of view. All scale bars are 1 µm in length.
Second, the same samples were later imaged by STXM spectro-microscopy. The middle and bottom row of images shown in Fig. 2 are STXM chemical speciation maps and total carbon absorbance (TCA) maps, respectively. Following the procedure described in Moffet (2010) for chemical speciation maps, each pixel is assigned as either inorganic dominant, organic dominant, or as a region with high C=C bonding (Moffet et al., 2010). The TCA maps indicate the thickness of each of the particles (as calculated using previously published thickness equations; Fraund et al., 2019; O'Brien et al., 2015) normalized by the individual area equivalent diameter. Values close to 0 represent flat particles, while values closer to 1 represent taller, nearly spherical particles. As was suggested in the SEM images, soot is present in both the 28 April and 5 May samples, while the 14 May sample has only organic and inorganic particles. In the 28 April and 5 May samples, circular soot-containing particles are associated with the highest TCA. In contrast, the 14 May sample contained high-TCA spherical particles comprised of organic-dominant material only.
Sample collection information from the seven samples for which the fractions of HVOPs were calculated is presented in Table 1 below. The highest HVOP fraction was observed with the samples taken on 5 May. The prevalence of these particles can be seen in Fig. 2 in the top row. Elevated fractions of HVOPs were also found for the 28 April night sample taken at 18:30 LT and for the 14 May sample. While the 28 April and 5 May samples showed elevated HVOP fractions for both stage 7 and 8 samples, the 14 May sample is unique in that a higher HVOP fraction was only found for the smaller stage. In addition, the 28 April and the 5 May samples both have elevated particle concentrations and CO mixing ratios, suggesting more polluted conditions possibly due to anthropogenic activity or biomass burning events. In contrast, the time period corresponding to the 14 May sample shows the lowest particle concentration and CO mixing ratio. Also of note is that the 28 April and 5 May samples were both taken long after the last rain event, with 5 May being taken multiple days afterwards, whereas the 14 May sample was taken 10 h after the last rain event.
Optical properties of individual HVOPs from this same data set have been investigated in our previous work (Veghte et al., 2017). There, the complex refractive index from 200 to 1200 nm was calculated for HVOPs found in the 28 April sample using electron energy loss spectroscopy (EELS). The imaginary part (k) of the refractive index is related to light absorption and can be related to the absorption coefficient using (Jennings et al., 1979). Absorption coefficients over the 200–1200 nm wavelength range were calculated from a published imaginary refractive index plot (Veghte et al., 2017). From this plot published in Veghte (2017), the AAE was calculated using σap values for 660 and 470 nm and resulted in a value of 1.41. This is close to the value calculated in the present work (1.42; Table 1) for the 28 April sample (a difference of only 0.01), showing that the two methods agree at least for one sample.
Table 1Ambient sampling information. Stage 8 values in parentheses when available.
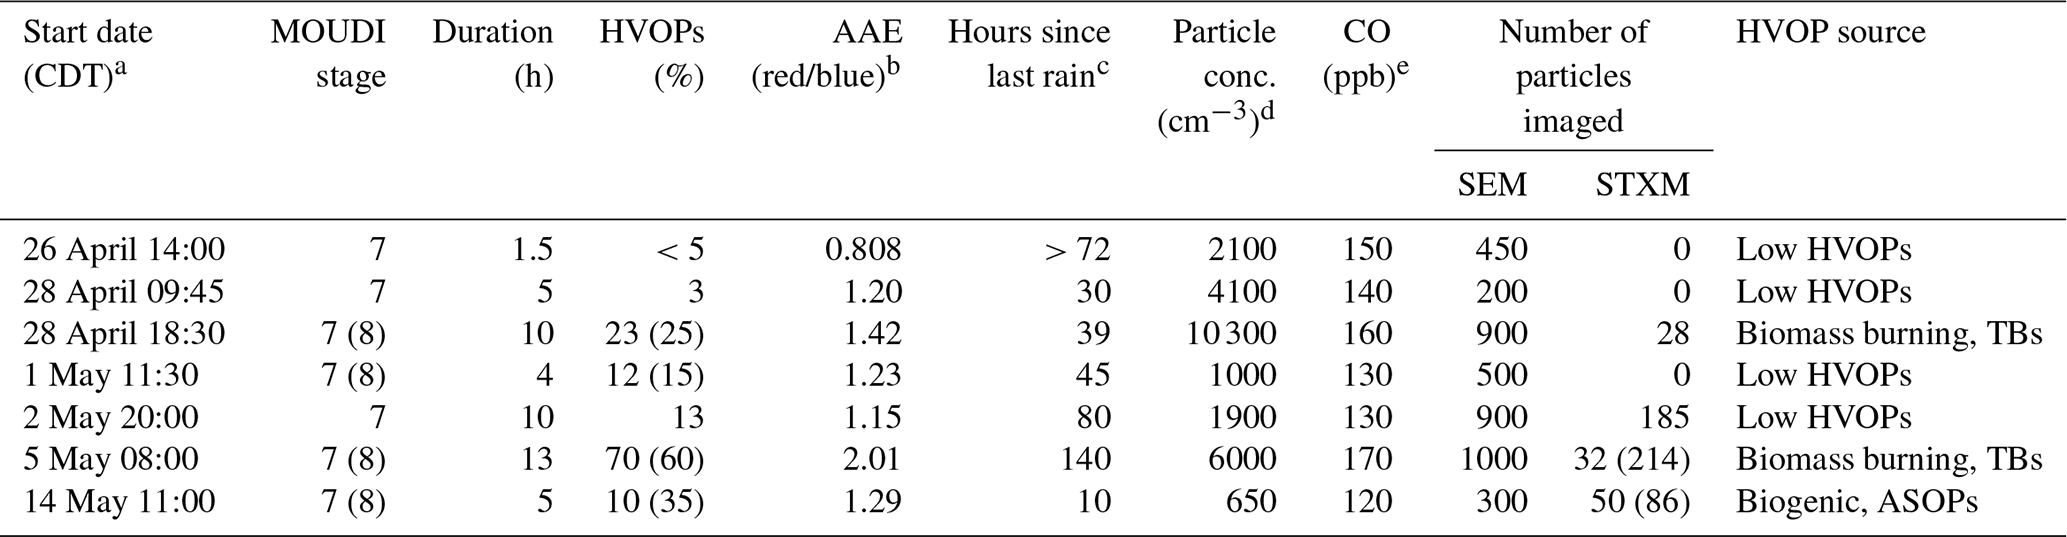
a Central daylight time (UTC-5). b Particle soot absorption photometer (PSAP). c Video disdrometer. d Condensation particle counter (CPC). e ARM/aerosol observatory system (AOS).
Even though elevated HVOP numbers were identified on a number of days, Fig. 1 shows that there is no clear relationship between the particle concentration and AAE. One reason for this is the presence of other absorbing or non-absorbing aerosols which will increase the measured particle concentration while affecting the AAE differently than HVOPs are expected to. To address this, a correlation plot was made (using values found in Table 1) between the AAE values and the HVOP fractions, and a strong correlation was found (R2=0.85), as seen in Fig. S2. Extrapolating this linear correlation to 100 % HVOPs yields an AAE value of 2.6, which is consistent with previously reported AAE values for BrC (Lack and Langridge, 2013). This correlation also uses only aerosols impacted onto MOUDI stages 7 and 8, whose combined aerodynamic size range (0.18–0.56 µm) covers much of the ambient aerosol surface area distribution (Seinfeld and Pandis, 2006). Because optical properties like AAE will be most sensitive to changes in this size range, we exclude particles which are counted in the overall particle concentration but contribute less to bulk optical properties. This not only suggests that the HVOPs found here are BrC but that they warrant consideration by models due to their measurable effect on bulk aerosol–radiation interactions as they can occupy a significant fractions of the aerosol fine mode.
The appearance of viscous HVOPs at the SGP site has been reported previously (Wang et al., 2016). There, they showed that the viscous HVOPs at SGP had an elevated total carbon absorption (TCA; defined by the pre-edge optical density, OD, subtracted from the post-edge OD) compared to other carbonaceous particles of similar sizes. High TCA values indicate particles that were not deformed upon impaction suggesting a high viscosity. Figure 3 shows TCA values of individual particles plotted against circular equivalent diameter (CED) for four samples reported in this work. The 28 April and 5 and 14 May samples all have elevated TCA whereas the 2 May sample shows lower carbon absorption, in line with the TCA values characteristic of lab-generated SOA particles (Wang et al., 2016). Note that the 5 May sample, when the highest HVOP fraction was identified, has the smallest particles with TCA values above the ambient organic particle regions. Contrast this with the 2 May sample, which shows very few particles with high TCA values and a correspondingly low HVOP fraction.
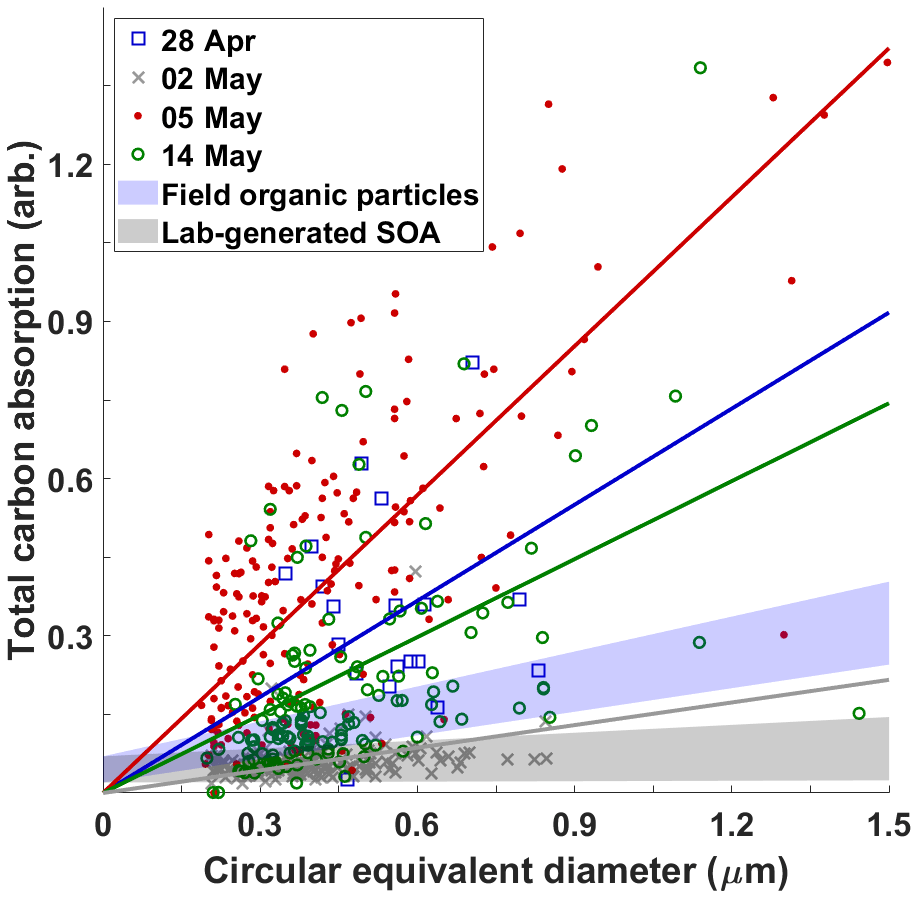
Figure 3Correlation between total carbon absorption (TCA) and size measured by circular equivalent diameter for four sampling dates with colored best-fit lines (anchored at 0) for each sample. Blue and gray shaded regions show regions characteristic of ambient organic particles and lab-generated secondary organic aerosols reported in previous study (Wang et al., 2016). The sharp cutoff at about 0.2 µm is due to the selected detection limit of small particles (5 or fewer pixels in diameter) from raw data to avoid falsely identifying noise spikes as particles.
So far, the above analysis applies to a general class of HVOPs, which can include both ASOP and TB particles. Additional considerations are necessary, however, before any conclusions are tied to ASOPs exclusively. The two samples with the highest HVOP fractions and AAE values were those collected more than 39 h after a rain event. Because the emission of ASOPs is associated with the bursting of bubbles at flooded soil surfaces after rain, the HVOPs found in the 28 April and 5 May samples are likely not locally emitted ASOPs, while ASOPs might be present in the sample of 14 May.
To investigate the nature and source of HVOPs and determine which can be confidently classified as ASOPs, smoke and fire from biomass burning sources (NOAA:OSPO, 2019) and precipitation data (NWS, 2019) were used along with the calculations of air backward trajectories using a hybrid single particle Lagrangian integrated trajectory model (HYSPLIT) (Stein et al., 2015; Rolph et al., 2017). These data for the events when the three samples had elevated HVOP fractions are shown in Fig. 4 for 28 April and 5 and 14 May. Additional information about the HYSPLIT trajectory conditions, as well as trajectories calculated from multiple starting altitudes, is available in Fig. S3.
The 28 April sample had a moderate fraction of HVOPs (25±0.6 %) along with the second highest AAE over the sampling periods studied here. This sample was also taken about 39 h after the last rain event, which makes ASOPs less likely to be found. Figure 4 shows that the corresponding air mass trajectories passed over a few burning fires, and, while smoke was present in some of the fires surrounding the sampling site, the air mass did not pass through these regions. Precipitation data show rainfall in some of the surrounding states but none close to the sampling site. The storm surrounding Oklahoma may have produced some ASOPs which could have been transported to the sampling site, although elevated particle concentration and slightly enhanced CO, SO4, and N2O concentration at the time of sampling suggested that biomass burning was the more prominent emission source (Koppmann et al., 2005). Although it is possible that ASOPs may make up a fraction of the HVOPs seen during the 28 April sample, immediately east of the sampling site are a coal-fired power plant, an oil refinery, and natural gas power plant which could possibly contribute to the HVOPs seen on this day. Furthermore, as seen in Fig. 4 (as well as in more detail in Fig. S3), the 28 April sample has an initial eastward direction.
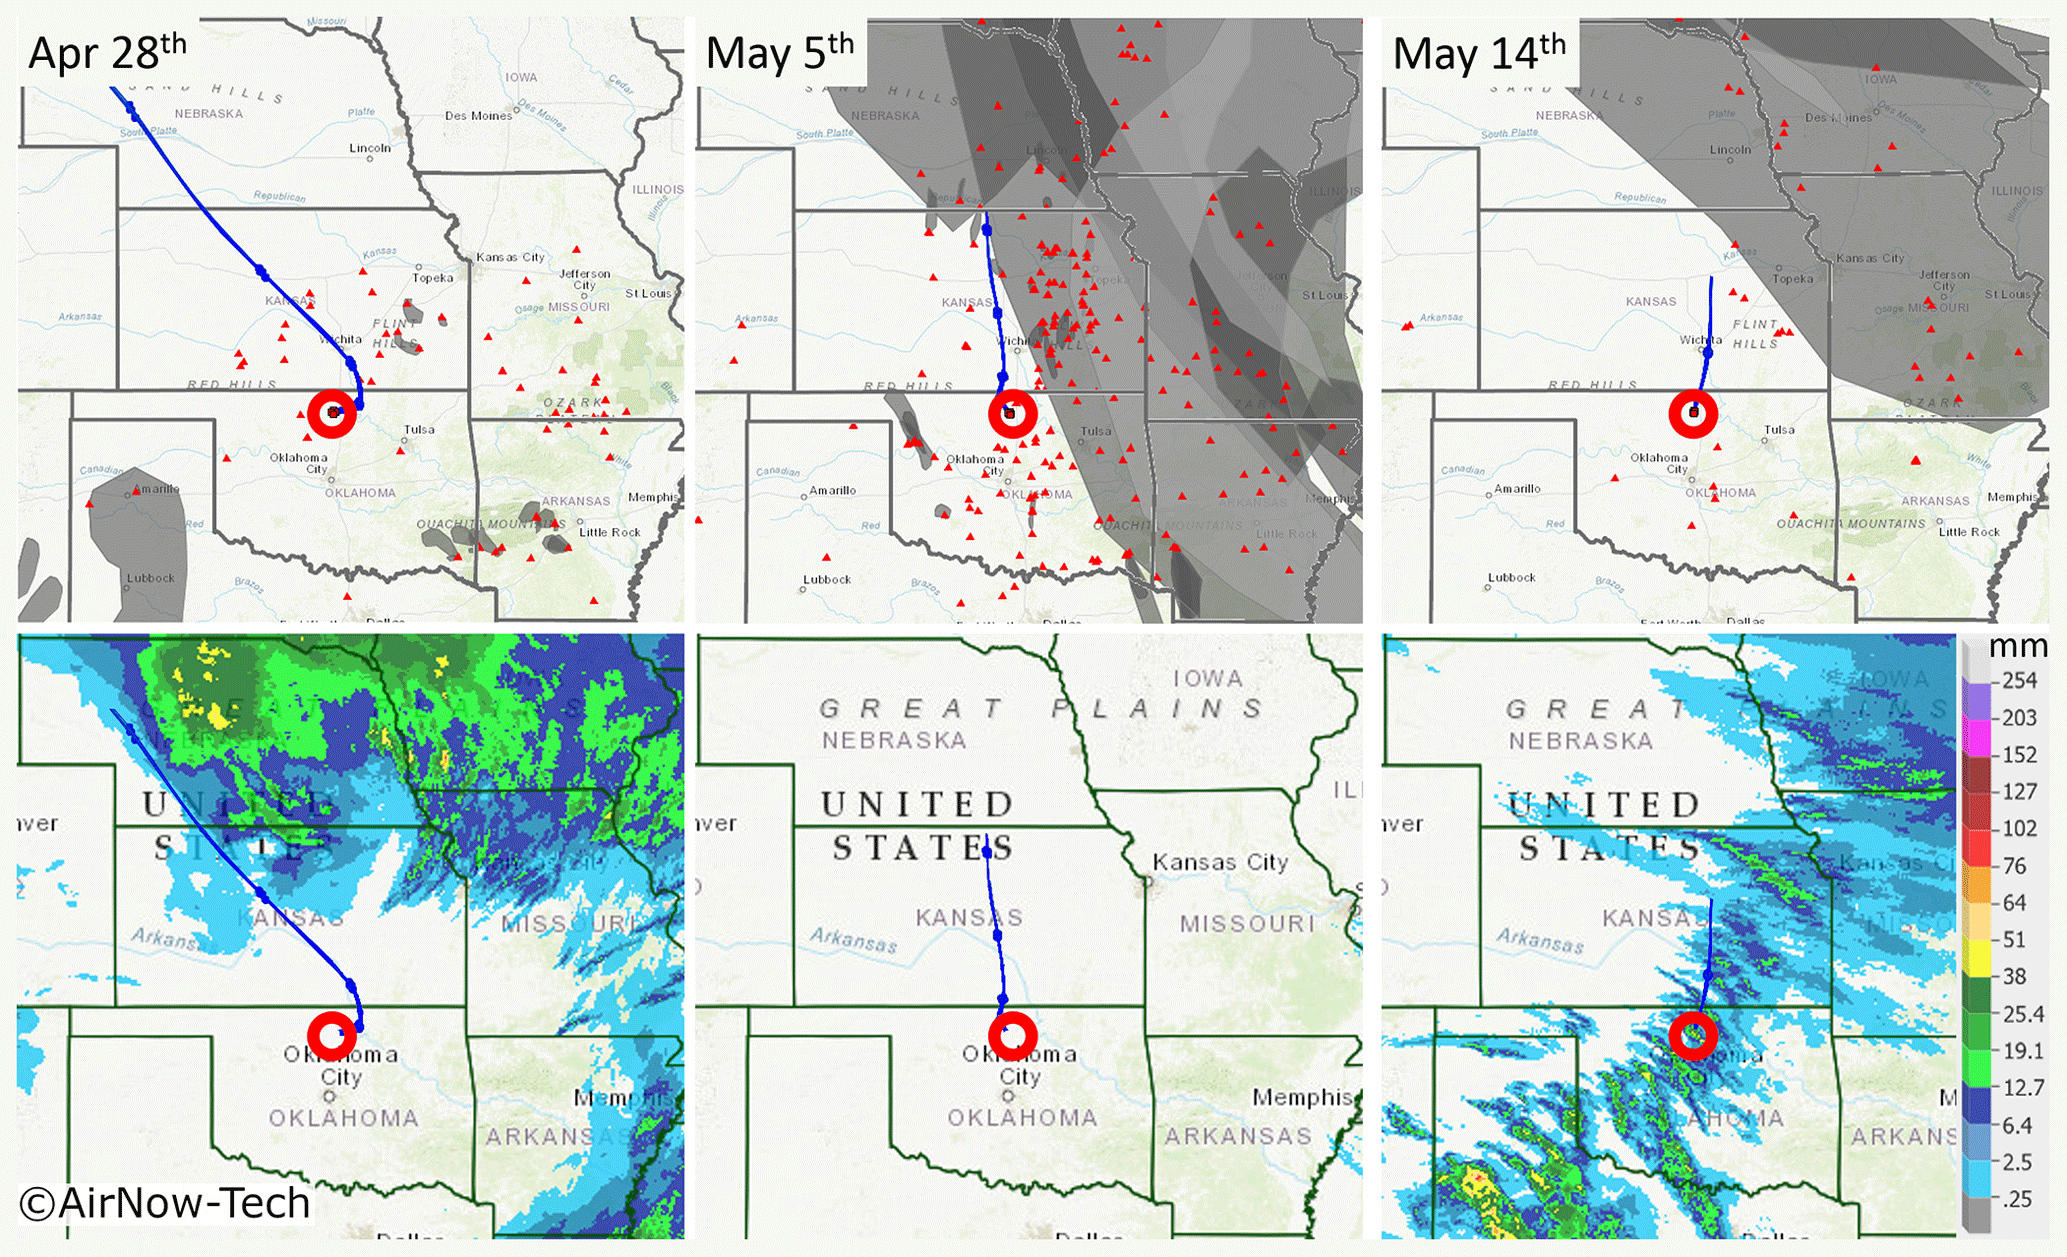
Figure 4Smoke, fire, and precipitation data along with HYSPLIT back trajectories for three sample dates. The red circle represents the sampling site, while the small red triangles represent fires. The gray overlays seen in the top row represent detected smoke particles (overlapping smoke plumes are shown in darker shades of gray). The bottom row shows the 24 h average precipitation amount over the sampling date. The top row maps were obtained using the AirNow-Tech navigator using the Hazard Mapping System Smoke Product from NOAA (NOAA, 2019). Source: US EPA AirNow-Tech (Sonoma Technologies Inc., 2019). HYSPLIT trajectories for 28 April and 5 May are for 24 h (Stein et al., 2015; Rolph et al., 2017). The 14 May back trajectory was truncated at 10 h due to a rain event with significant precipitation scavenging. Precipitation maps were made using the NWS Advanced Hydrologic Prediction Service (AHPS) (NWS, 2019).
The 5 May sample has the highest HVOP fraction and the highest average AAE, but it had also been days (140 h) since the last rain event, making ASOPs unlikely. There were many fires surrounding the sampling site compared to the other sampling periods, and the back trajectories show air masses passing directly over some of these fires, suggesting the presence of associated smoke emissions. Precipitation data show that no rainfall was observed anywhere near the sampling site. Figure 1 also shows that this sampling date coincided with a slight particle concentration enhancement and the highest CO mixing ratios observed over this period of the field campaign. Figure S1 also shows enhancement in O3 and SO2 concentrations. Because TBs are found within smoke plumes, the high HVOP fraction observed in the 28 April and 5 May samples may be primarily (or exclusively) due to TBs (Pósfai et al., 2004). The presence of combustion byproducts like TBs and soot is supported by the STXM carbon speciation maps shown in Fig. 2, where particles with elevated C=C bonding constituents are often attributed to soot.
The last sample date shown (14 May) has regions of smoke away from the sampling site with backward trajectories heading from just outside the smoke-filled region. However, because a rain event was recorded 10 h prior to sampling when significant precipitation scavenging was observed (see the particle concentration decrease in Fig. 1), no influence from biomass burning was observed in this sample. The precipitation map shows that precipitation was observed over the sampling site, as well as in many of the surrounding areas (Radke et al., 1980). Because the microscopy samples were taken shortly after it had rained, the 35±1.3 % fraction of HVOPs observed at that time may likely be related to ASOPs contributing to the spike in AAE seen during this sampling period.
With the HVOPs observed in the microscopy images being around 0.6 µm in diameter, it is expected that they would be aloft and present for the sampling period for at least 10 h after the rain event (Williams et al., 2002). Any particles of this size traveling from further away, such as ASOPs produced elsewhere, through some of the surrounding storm are less likely to be scavenged due to the lowered precipitation scavenging efficiency (Greenfield scavenging gap) at approximately 0.1 µm (Radke et al., 1980). This could have effectively concentrated ASOP particles as the air mass traveled through the surrounding storm. It is also possible that emission conditions for ASOPs (soil and rainfall characteristics) were ideal somewhere along the air mass trajectory. This would have the effect of bringing in a high concentration of ASOPs after the aerosol plume traveled. In addition, the production of viscous SOA particles was likely taking place at the same time (Virtanen et al., 2010). The peak in AAE seen during the 14 May sampling period occurs as the sun is rising and ozone concentration rapidly increases (this also coincides with an increase in particle concentration). Although viscous SOA particles would contribute to the AAE, they are formed less than 100 nm in size, limiting their effect on optical properties. The peak in AAE here, and in the other cases, drops down quickly due to the particle-laden air mass moving away from the sampling site.
The influence of smoke shown in Fig. 4 may account for the enhancement of HVOP fractions without rainfall in the 28 April and 5 May samples likely due to TBs. The carbon STXM-NEXAFS spectra of TBs have been recorded previously, and their characteristic features are shown in Fig. 5 (Tivanski et al., 2007). The same figure compares the STXM-NEXAFS spectra for both ambient particles collected during this study and lab-generated ASOP proxies. Figure 5b also includes three characteristic spectra of HVOP particles from the 28 April and 5 and 14 May samples. Even though 5 May and 28 April had the highest AAE values and the highest HVOP fractions, many hours since the last rain event along with the presence of smoke suggest they might be TBs, which is consistent with their NEXAFS spectral features. Three apparent peaks are common for these spectra: the C=C peak at 285.3 eV, the COH peak at 286.7 eV, and the peak at 288.6 eV, all of which are present in the previously reported TB spectra (Tivanski et al., 2007). The 5 May spectra also show a small feature around 289.5 eV which is present (and more prominent) in the TB spectra, a peak which is associated with alkyl carbon bonded to oxygen, often alcohols. This similarity reinforces the assumption that 5 May contains a large amount (70 %) of HVOPs attributable to TBs.
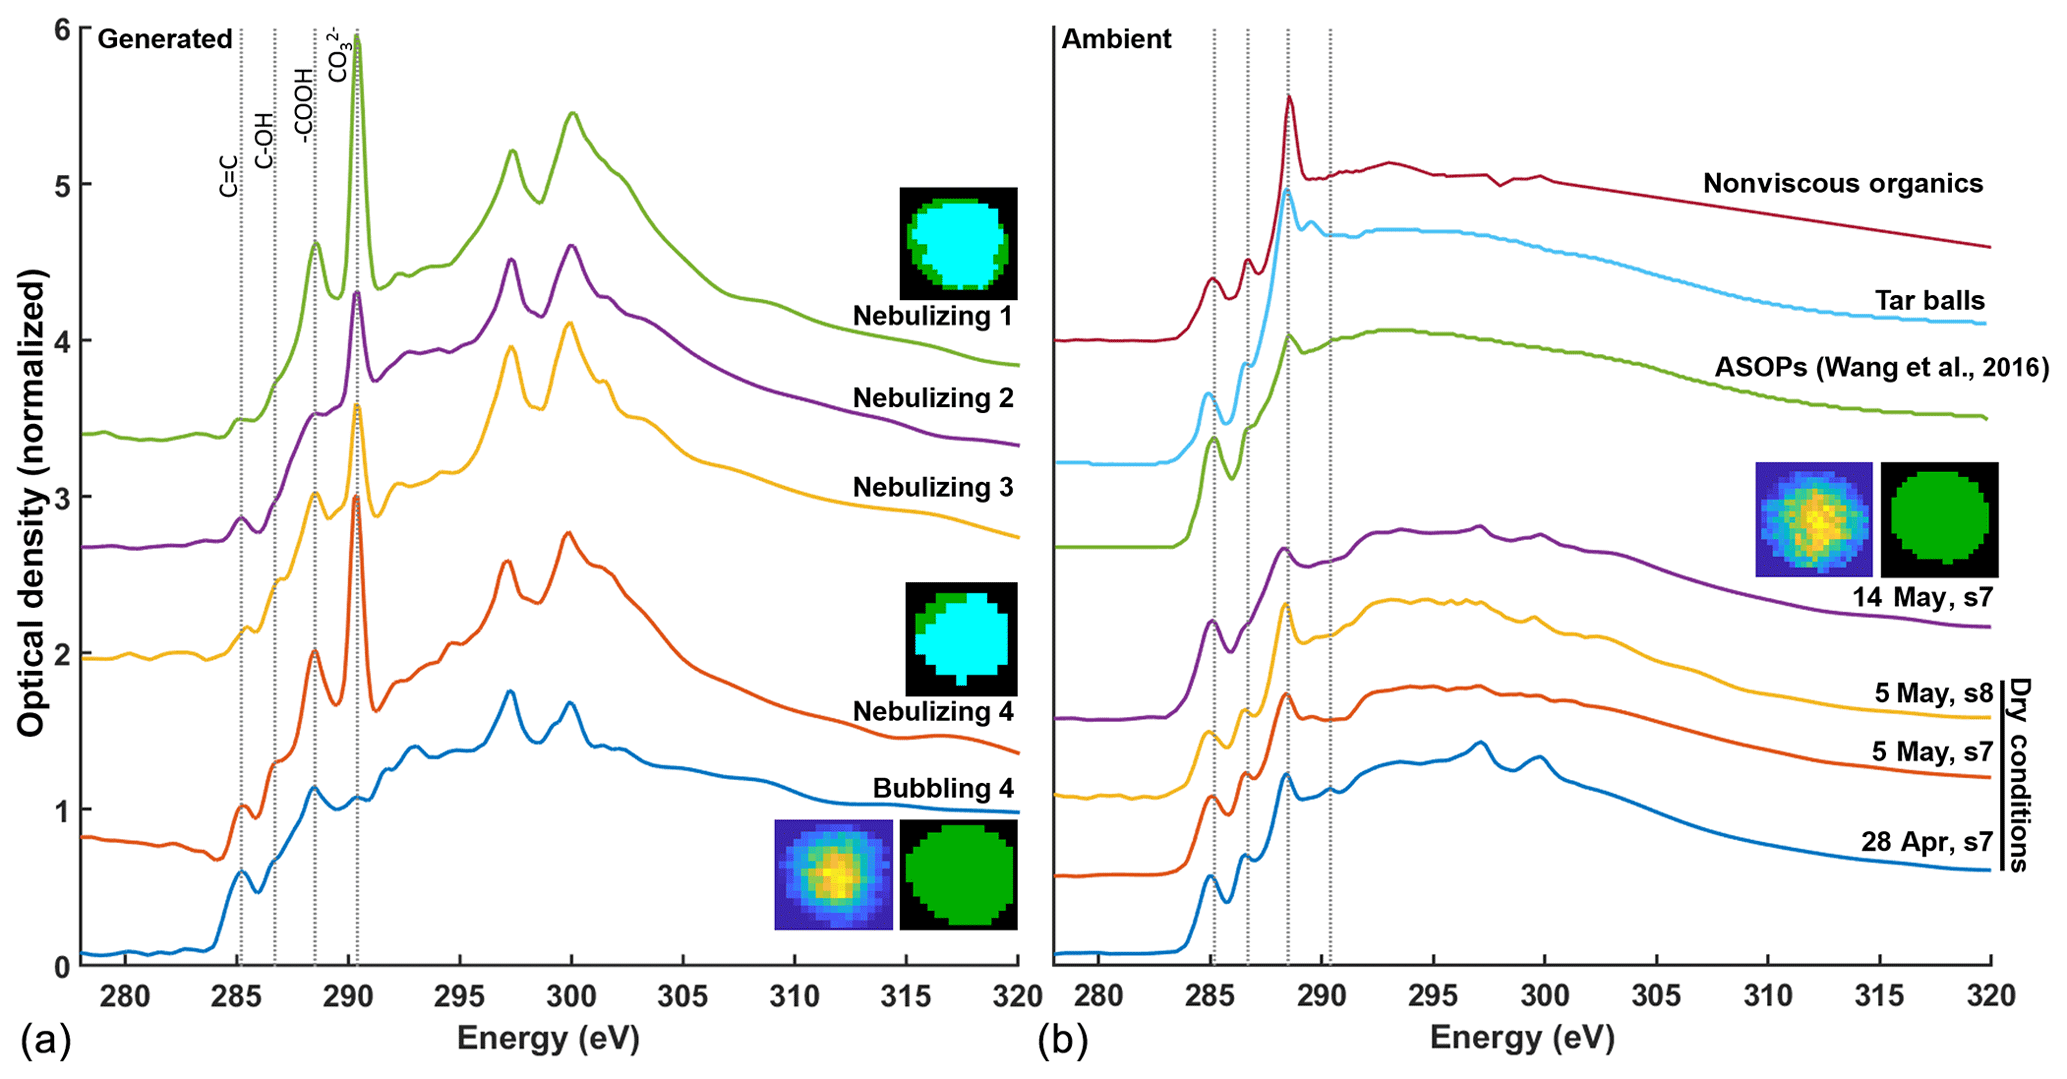
Figure 5Comparison of NEXAFS spectra between laboratory-generated ASOP proxies (a) and four ambient ASOP samples (b). Inset carbon speciation maps are shown for representative particles with green representing organic-dominant regions and teal representing inorganic-dominant regions. TCA images, like the ones shown in Fig. 2, are shown as well. Only one image is shown for the ambient samples as they all look similar. The ASOP proxy spectra are show for particles generated by nebulizing aquatic samples collected at the site and by bubbling N2 gas through one of the aquatic samples.
Upon comparison with the 28 April and 5 May samples, NEXAFS spectra of HVOP particles from the 14 May sample (taken 10 h after raining) show a slightly enhanced C=C peak and an almost absent COH peak. These same features can be seen in the previously reported NEXAFS spectra of ASOPs (Wang et al., 2016; Veghte et al., 2017) and “free light” SOM isolated in those studies for comparison. One reason for the difference in COH peak intensity may be due to the presence of levoglucosan or other plant-derived products such as polysaccharides, tannins, or lignin fragments (Marín-Spiotta et al., 2008) (which contain multiple −OH groups) in the samples affected by smoke plumes, a common product of biomass burning from the pyrolysis of carbohydrates (Lakshmanan and Hoelscher, 1970). Another differentiating factor is the ratio of intensities between the −COOH peak at 288.6 eV and the C=C peak at 285.3 eV. In the TB spectrum, the −COOH peak is much higher than the C=C peak compared to the ASOP spectra (Wang et al., 2016), and this difference is borne out in the spectra collected for the current study as well.
The chemical composition of TBs has been reported in the literature, with fresh TBs being comprised of various biomass tar products with a substantial degree of aromaticity. The nonpolar products were most strongly associated with the wavelength dependence in absorption seen in TBs and were found in greater number in fresh TBs (Li et al., 2019). Photochemical oxidation in the presence of O3 or OH radicals was shown to bleach this wavelength dependence after about 3.5 d (Sumlin et al., 2017). Photooxidation was suggested to break the network of conjugated double bonds in the TB chromophores, resulting in more oxygenated (carbonyl-substituted) products which concentrated on the surface of the TBs (Hand et al., 2005; Tóth et al., 2014). ASOPs are comprised, in part, of high-molecular-weight humic-like substances. These compounds contain multiple conjugated ring systems which likely serve as chromophores in a similar way to the tar materials in TBs (Kumada, 1955). The extensive conjugated systems may be driving the enhanced C=C peak in Fig. 5 for ASOP-associated spectra. Also, because humic-like substances in ASOPs are substituted by many different functional groups rather than the nonpolar components of TBs, more reactive sites may be available for oxidation. This may lead to faster atmospheric processing and bleaching of ASOP wavelength-dependent absorption. This aging could also serve to increase the viscosity of ASOPs in the same way that it does for TBs (Adachi et al., 2019). Another factor differentiating their aging processes could be their hygroscopicity. Reports have shown TBs change very little in morphology even when cycled from 0 % to 100 % relative humidity (RH), having a growth factor of ∼1.09 (Adachi and Buseck, 2011; Semeniuk et al., 2007). However, because ASOPs are formed via dissolved SOM that is ejected during precipitation, they are expected to be more hygroscopic. Indeed, Wang (2016) showed the results of RH cycling in supplemental figures and found a growth factor of ∼1.15 at 85 % RH along with droplet activation at 98 % RH.
Also shown is a spectrum of organic particles not associated with HVOPs. This spectrum is characterized by small C=C and COH absorptions with an intense −COOH peak. The large −COOH peak seen in non-HVOP organics is indicative of much higher contributions of carboxylic functional groups which define the solubility of the organic particles. This increased solubility would lower the viscosity of the nonviscous organic particles due to their substantial water content, and thus these particles would be deformed and flatten upon impaction. Viscous SOAs have been observed previously under both laboratory and ambient conditions (Virtanen et al., 2010). The HVOPs discussed in the current work differ from these viscous SOAs by virtue of their mode of formation with both TBs and ASOPs being comprised of larger organic compounds. Furthermore, the particles themselves are larger. Viscous SOAs are formed and observed as much smaller particles (<100 nm) than TBs and ASOPs (300–700 nm).
Figure 5a shows STXM-NEXAFS spectra of ASOP proxies generated from the SOM brine. The top four spectra from the puddle water samples all show a fairly strong carbonate signal at around 290.1 eV along with two broad potassium peaks (L2 and L3) at about 298 eV. Also, the corresponding inset carbon speciation map shows a large, inorganic-dominant region (teal blue). The presence of large inorganic regions is not consistent with the mainly organic particles seen previously. However, because these samples were nebulized from bulk solutions to begin with, water soluble carbonates from the soil must have been present upon nebulization. To better model the bubble bursting mechanism of generating ASOPs, dry N2 gas was bubbled through puddle water samples, and particles resulted from the bubble bursting at the air–solution interface were collected. In these experiments, generated particles showed almost a complete reduction in the carbonate peak and a small reduction in the potassium peaks, and the carbon speciation map (Fig. 5 inset) showed an entirely organic-dominant particle. A comparison between the spectra of ASOP proxies generated in the “bubbling experiment” with the ambient spectra of HVOPs from 14 May shown in Fig. 5b indicates substantial similarities between their spectral features. This includes the diminished peak ratio and the relative absence of a COH peak.
For more quantitative comparison, two sets of peak ratios were calculated: the first between the −COOH and C=C absorptions and another between the −COOH and COH peaks. The peak ratios are plotted in Fig. 6 for all of the ambient samples, the proxy particles from the “bubbling” experiment, and the two literature spectra. As noted above, the TB spectra have higher and peak ratios. The separation between these two ratios is also the largest for the TB spectrum. While the 28 April and 5 May peak ratios are not quite as high, they all bear a strong resemblance to the TB spectrum. Perhaps alone the similarity would not be enough to define these ambient samples as TBs; however, coupled with the other data presented here, the peak ratios support the HVOPs seen in the 5 May sample as being TBs. The 28 April peak ratios are further separated than the literature ASOP peak ratios are but closer together than the TB literature peak ratios. With the possibility of ASOPs traveling from surrounding states (with active rainfall), as well as the proximity of smoke plumes, it is likely that the HVOPs observed on 28 April are comprised of both TBs and ASOPs. The 14 May sample peak ratios, however, are much different and are more comparable to the ASOP peak ratios. The ratio is much lower in both cases, and the ratio is of the same value. From the lab-generated aerosols, the bubbling sample peak ratios are also similar to the ASOP peak ratios, suggesting that bubbling reproduces the mechanism of ASOP generation. Another noteworthy observation is the difference between the 28 April and 5 May peak ratios and the 14 May peak ratios. Although each of these samples showed the presence of HVOPs and each sample's AAE suggested that these HVOPs were BrC, there is a stark contrast between the smoke-influenced samples (28 April and 5 May) and the rainfall-influenced samples (14 May), suggesting different sources of HVOPs in these two cases.

Figure 6Plot of peak ratios for (blue dots) carboxylic acid peak at 288.6 eV and the carbon double bond peak at 285.3 eV and (red dots) carboxylic acid peak and the COH peak at 286.7 eV. ASOP proxies refer to particles generated via bubbling through the aquatic sample of SOM.
BrC particles like TBs and ASOPs and their place in the global aerosol budget are yet insufficiently understood. Here, it was shown that the presence of HVOPs is correlated with the BrC properties of overall aerosols, as indicated by the elevated values of AAE. On multiple days, HVOPs were observed to comprise a significant fraction of the fine mode aerosols.
Tilted SEM was used to identify HVOP fractions in a number of samples taken during this study, and the fractions of HVOPs present for each sample were determined based on the aspect ratios of individual particles. The HVOP fractions showed a strong correlation with the average AAE over the sampling periods with an R2 of 0.85. When extrapolated to 100 % fraction of HVOPs, an AAE of 2.6 was calculated, which is consistent with literature-reported values of BrC (Lack and Langridge, 2013). These observed AAE values suggest that BrC relevant particles can be identified by methods of chemical imaging based on three-dimensional morphology coupled with chemical composition. These samples were further classified into samples with TBs and samples with ASOPs based on their NEXAFS characteristics and by comparing smoke and precipitation data during corresponding collection periods.
Chemical imaging showing the differences between ASOP- and TB-laden samples was performed using STXM-NEXAFS spectro-microscopy. Samples unaffected by recent rain, collected while smoke plumes were present, showed a higher peak ratio and an elevated −COH peak intensity. The elevated −COH peak is likely due to the presence of sugars such as levoglucosan or other less oxidized molecules. The sample from 14 May was collected 10 h after a rain event and had less influence from smoke plumes. This sample showed a much more subdued −COH peak and a smaller peak ratio. Comparing the ambient spectra collected here with previously collected spectra supported the presence of TBs in the smoke-affected samples and the presence of ASOPs in the samples taken after a rain event. Peak ratios between −COOH and C=C and between −COOH and COH were calculated to serve as a quantitative metric that can be potentially used to differentiate between TBs and ASOPs and, probably more generally, between the smoke-affected samples and the samples with particles induced by rainfall.
HVOPs are a subclass of BrC particles which can define the nature of aerosol–radiation interactions during time periods when they are prevalent. Differentiating between types of HVOPs like TBs and ASOPs has proven to be a challenging task that relies on subtle differences in chemical composition and atmospheric conditions at the time of sampling. Of the 3 sampling days focused on in this study, only 1 indicated an appreciable number of ASOPs present. Because the conditions necessary for ASOP emission depend both on soil properties and precipitation characteristics, the dominant source of HVOPs will often be TBs due to the frequency of biomass burning instances along with the large number of particles they emit. ASOPs are likely to contribute to aerosol properties, optical and otherwise, only during short time periods when the emission conditions are met. Further questions still exist about ASOPs specifically. How do soil characteristics affect the composition of ASOPs? How are ASOPs transformed as they travel through the atmosphere? What are the emissions factors of ASOPs? Answering questions like these may improve the quality of models in regions where large areas with open soils such as agricultural fields and grasslands are exposed to intensive rains, especially during rainy seasons when ASOPs might be prevalent.
The MATLAB code used for the current work is available as a Supplement.
The data set used here is available for download as a .zip file at https://doi.org/10.17605/OSF.IO/G8FPW (Fraund, 2020).
The supplement related to this article is available online at: https://doi.org/10.5194/acp-20-11593-2020-supplement.
MF, DJB, SC, DV, MKG, AL, and RCM were involved in the project conceptualization. MF, DJB, and RCM developed the software. MF and DJB performed the formal analysis. MF, DJB, SC, DQP, DV, JW, GK, and RCM were involved with the experimental investigation. KT, MKG, AL, and RCM provided resources. MF, DJB, SC, DV, and RCM assisted with data curation. MF and DJB assisted in writing the original draft. All authors were involved in writing, reviewing, and editing. MF, DJB, and SC created the displayed visualizations. MKG, AL, and RCM assisted with project supervision, project administration, and funding acquisition.
The authors declare that there is no conflict of interest.
PSAP records obtained from the Atmospheric Radiation Measurement (ARM) user facility of OBER were used in this study. The chemical imaging of particles was performed at the Advanced Light Source at Lawrence Berkeley National Laboratory. The beamline staff of 11.0.2 and 5.3.2 helped make the current work possible, specifically David Shapiro, David Kilcoyne, Matthew Markus, and Hendrik Ohldag. A portion of the research was performed using EMSL (grid.436923.9), a DOE Office of Science user facility sponsored by the Office of Biological and Environmental Research. Part of the research described in this paper was performed at the Canadian Light Source, a national research facility of the University of Saskatchewan, which is supported by the Canada Foundation for Innovation (CFI), the Natural Sciences and Engineering Research Council (NSERC), the National Research Council (NRC), the Canadian Institutes of Health Research (CIHR), the Government of Saskatchewan, and the University of Saskatchewan. The CLS work was done at the SM beamline 10ID-1 with help of its staff: Jian Wang, Yingshen Lu, and Jan Geilhufe. The NOAA HYSPLIT transport and dispersion model (https://www.ready.noaa.gov/HYSPLIT_traj.php, last access: 10 May 2019) was used to calculate backward trajectories for this publication. We would like to acknowledge Shih-Ming Huang from Sonoma Technologies Inc. for suggesting the use of the archived precipitation data from the National Weather Service's (NWS) Advanced Hydrologic Prediction Service reported here for the selected periods of our study.
This research has been supported by the US Department of Energy, Biological and Environmental Research (award no. DE-SC0018948).
This paper was edited by Markus Petters and reviewed by two anonymous referees.
Adachi, K. and Buseck, P. R.: Atmospheric tar balls from biomass burning in Mexico, J. Geophys. Res., 116, D05204, https://doi.org/10.1029/2010JD015102, 2011.
Adachi, K., Sedlacek, A. J., Kleinman, L., Springston, S. R., Wang, J., Chand, D., Hubbe, J. M., Shilling, J. E., Onasch, T. B., and Kinase, T.: Spherical tarball particles form through rapid chemical and physical changes of organic matter in biomass-burning smoke, P. Natl. Acad. Sci. USA, 116, 19336–19341, 2019.
Alexander, D. T., Crozier, P. A., and Anderson, J. R.: Brown carbon spheres in East Asian outflow and their optical properties, Science, 321, 833–836, 2008.
Andreae, M. O. and Gelencsér, A.: Black carbon or brown carbon? The nature of light-absorbing carbonaceous aerosols, Atmos. Chem. Phys., 6, 3131–3148, https://doi.org/10.5194/acp-6-3131-2006, 2006.
ARM: Data Discovery, available at: https://adc.arm.gov/discovery/, last access: 10 May 2019.
Backman, J., Virkkula, A., Vakkari, V., Beukes, J. P., Van Zyl, P. G., Josipovic, M., Piketh, S., Tiitta, P., Chiloane, K., Petäjä, T., Kulmala, M., and Laakso, L.: Differences in aerosol absorption Ångström exponents between correction algorithms for a particle soot absorption photometer measured on the South African Highveld, Atmos. Meas. Tech., 7, 4285–4298, https://doi.org/10.5194/amt-7-4285-2014, 2014.
Bergstrom, R. W., Pilewskie, P., Russell, P. B., Redemann, J., Bond, T. C., Quinn, P. K., and Sierau, B.: Spectral absorption properties of atmospheric aerosols, Atmos. Chem. Phys., 7, 5937–5943, https://doi.org/10.5194/acp-7-5937-2007, 2007.
Bond, T. C. and Bergstrom, R. W.: Light absorption by carbonaceous particles: An investigative review, Aerosol Sci. Tech., 40, 27–67, 2006.
Bond, T. C., Anderson, T. L., and Campbell, D.: Calibration and intercomparison of filter-based measurements of visible light absorption by aerosols, Aerosol Sci. Tech., 30, 582–600, https://doi.org/10.1080/027868299304435, 1999.
Bond, T. C., Doherty, S. J., Fahey, D., Forster, P., Berntsen, T., DeAngelo, B., Flanner, M., Ghan, S., Kärcher, B., and Koch, D.: Bounding the role of black carbon in the climate system: A scientific assessment, J. Geophys. Res.-Atmos., 118, 5380–5552, 2013.
Chakrabarty, R. K., Moosmüller, H., Chen, L.-W. A., Lewis, K., Arnott, W. P., Mazzoleni, C., Dubey, M. K., Wold, C. E., Hao, W. M., and Kreidenweis, S. M.: Brown carbon in tar balls from smoldering biomass combustion, Atmos. Chem. Phys., 10, 6363–6370, https://doi.org/10.5194/acp-10-6363-2010, 2010.
Fast, J. D., Berg, L. K., Alexander, L., Bell, D., D'Ambro, E., Hubbe, J., Kuang, C., Liu, J., Long, C., and Matthews, A.: Overview of the HI-SCALE Field Campaign: A New Perspective on Shallow Convective Clouds, B. Am. Meteorol. Soc., 100, 821–840, 2019.
Feng, Y., Ramanathan, V., and Kotamarthi, V. R.: Brown carbon: a significant atmospheric absorber of solar radiation?, Atmos. Chem. Phys., 13, 8607–8621, https://doi.org/10.5194/acp-13-8607-2013, 2013.
Ferrare, R., Turner, D., Clayton, M., Schmid, B., Redemann, J., Covert, D., Elleman, R., Ogren, J., Andrews, E., and Goldsmith, J. E.: Evaluation of daytime measurements of aerosols and water vapor made by an operational Raman lidar over the Southern Great Plains, J. Geophys. Res., 111, D05S08, https://doi.org/10.1029/2005JD005836, 2006.
Fraund, M.: SGP HISCALE STXM Images and Spectra, OSF, https://doi.org/10.17605/OSF.IO/G8FPW, 2020.
Fraund, M., Pham, D. Q., Bonanno, D., Harder, T. H., Wang, B., Brito, J., de Sá, S. S., Carbone, S., China, S., and Artaxo, P.: Elemental Mixing State of Aerosol Particles Collected in Central Amazonia during GoAmazon2014/15, Atmosphere, 8, 173, https://doi.org/10.3390/atmos8090173, 2017.
Fraund, M., Park, T., Yao, L., Bonanno, D., Pham, D. Q., and Moffet, R. C.: Quantitative capabilities of STXM to measure spatially resolved organic volume fractions of mixed organic/inorganic particles, Atmos. Meas. Tech., 12, 1619–1633, https://doi.org/10.5194/amt-12-1619-2019, 2019.
Guizar-Sicairos, M., Thurman, S. T., and Fienup, J. R.: Efficient subpixel image registration algorithms, Opt. Lett., 33, 156–158, 2008.
Hand, J. L., Malm, W., Laskin, A., Day, D., Lee, T.-b., Wang, C., Carrico, C., Carrillo, J., Cowin, J. P., and Collett Jr., J.: Optical, physical, and chemical properties of tar balls observed during the Yosemite Aerosol Characterization Study, J. Geophys. Res., 110, D21210, https://doi.org/10.1029/2004JD005728, 2005.
Hazard Mapping System Fire and Smoke Product: https://www.ospo.noaa.gov/Products/land/hms.html, last access: 10 May 2019.
Hegg, D. A., Clarke, A. D., Doherty, S. J., and Ström4, J.: Measurements of black carbon aerosol washout ratio on Svalbard, Tellus B, 63, 891–900, 2011.
Hoffer, A., Gelencsér, A., Guyon, P., Kiss, G., Schmid, O., Frank, G. P., Artaxo, P., and Andreae, M. O.: Optical properties of humic-like substances (HULIS) in biomass-burning aerosols, Atmos. Chem. Phys., 6, 3563–3570, https://doi.org/10.5194/acp-6-3563-2006, 2006.
Jennings, S., Pinnick, R., and Gillespie, J.: Relation between absorption coefficient and imaginary index of atmospheric aerosol constituents, Appl. Optics, 18, 1368–1371, 1979.
Joung, Y. S. and Buie, C. R.: Aerosol generation by raindrop impact on soil, Nat. Commun., 6, 6083, https://doi.org/10.1038/ncomms7083, 2015.
Kilcoyne, A., Tyliszczak, T., Steele, W., Fakra, S., Hitchcock, P., Franck, K., Anderson, E., Harteneck, B., Rightor, E., and Mitchell, G.: Interferometer-controlled scanning transmission X-ray microscopes at the Advanced Light Source, J. Synchrotron Radiat., 10, 125–136, 2003.
Kirchstetter, T. W., Novakov, T., and Hobbs, P. V.: Evidence that the spectral dependence of light absorption by aerosols is affected by organic carbon, J. Geophys. Res., 109, D21208, https://doi.org/10.1029/2004JD004999, 2004.
Koppmann, R., von Czapiewski, K., and Reid, J. S.: A review of biomass burning emissions, part I: gaseous emissions of carbon monoxide, methane, volatile organic compounds, and nitrogen containing compounds, Atmos. Chem. Phys. Discuss., 5, 10455–10516, https://doi.org/10.5194/acpd-5-10455-2005, 2005.
Kumada, K.: Absorption spectra of humic acids, Soil Sci. Plant Nutr., 1, 29–30, https://doi.org/10.1080/00380768.1955.10434360, 1955.
Lack, D. A. and Langridge, J. M.: On the attribution of black and brown carbon light absorption using the Ångström exponent, Atmos. Chem. Phys., 13, 10535–10543, https://doi.org/10.5194/acp-13-10535-2013, 2013.
Lakshmanan, C. M. and Hoelscher, H. E.: Production of Levoglucosan by Pyrolysis of Carbohydrates Pyrolysis in Hot Inert Gas Stream, Starch-Starke, 22, 261–264, 1970.
Laskin, A., Laskin, J., and Nizkorodov, S. A.: Chemistry of atmospheric brown carbon, Chem. Rev., 115, 4335–4382, 2015.
Lawless, P. A., Rodes, C. E., and Ensor, D. S.: Multiwavelength absorbance of filter deposits for determination of environmental tobacco smoke and black carbon, Atmos. Environ., 38, 3373–3383, 2004.
Li, C., He, Q., Schade, J., Passig, J., Zimmermann, R., Meidan, D., Laskin, A., and Rudich, Y.: Dynamic changes in optical and chemical properties of tar ball aerosols by atmospheric photochemical aging, Atmos. Chem. Phys., 19, 139–163, https://doi.org/10.5194/acp-19-139-2019, 2019.
Lin, P., Bluvshtein, N., Rudich, Y., Nizkorodov, S. A., Laskin, J., and Laskin, A.: Molecular chemistry of atmospheric brown carbon inferred from a nationwide biomass burning event, Environ. Sci. Technol., 51, 11561–11570, 2017.
Marín-Spiotta, E., Swanston, C. W., Torn, M. S., Silver, W. L., and Burton, S. D.: Chemical and mineral control of soil carbon turnover in abandoned tropical pastures, Geoderma, 143, 49–62, 2008.
Moffet, R. C., Henn, T., Laskin, A., and Gilles, M. K.: Automated Chemical Analysis of Internally Mixed Aerosol Particles Using X-ray Spectromicroscopy at the Carbon K-Edge, Anal. Chem., 82, 7906–7914, 2010.
NOAA:OSPO: Hazard Mapping System Fire and Smoke Product, available at: https://www.ospo.noaa.gov/Products/land/hms.html, last access: 10 May 2019.
NWS: Quantitative Precipitation Estimates, available at: https://water.weather.gov/precip/, last access: 10 May 2019.
NWS: Quantitative Precipitation Estimates, available at: https://water.weather.gov/precip/, access: 10 May 2019.
O'Brien, R. E., Wang, B., Laskin, A., Riemer, N., West, M., Zhang, Q., Sun, Y., Yu, X. Y., Alpert, P., and Knopf, D. A.: Chemical imaging of ambient aerosol particles: Observational constraints on mixing state parameterization, J. Geophys. Res.-Atmos., 120, 9591–9605, 2015.
Parworth, C., Fast, J., Mei, F., Shippert, T., Sivaraman, C., Tilp, A., Watson, T., and Zhang, Q.: Long-term measurements of submicrometer aerosol chemistry at the Southern Great Plains (SGP) using an Aerosol Chemical Speciation Monitor (ACSM), Atmos. Environ., 106, 43–55, 2015.
Pósfai, M., Gelencsér, A., Simonics, R., Arató, K., Li, J., Hobbs, P. V., and Buseck, P. R.: Atmospheric tar balls: Particles from biomass and biofuel burning, J. Geophys. Res., 109, D06213, https://doi.org/10.1029/2003JD004169, 2004.
Radke, L. F., Hobbs, P. V., and Eltgroth, M. W.: Scavenging of aerosol particles by precipitation, J. Appl. Meteorol., 19, 715–722, 1980.
Regier, T., Krochak, J., Sham, T., Hu, Y., Thompson, J., and Blyth, R.: Performance and capabilities of the Canadian Dragon: The SGM beamline at the Canadian Light Source, Nucl. Instrum. Meth. A, 582, 93–95, 2007.
Rizzo, L. V., Artaxo, P., Müller, T., Wiedensohler, A., Paixão, M., Cirino, G. G., Arana, A., Swietlicki, E., Roldin, P., Fors, E. O., Wiedemann, K. T., Leal, L. S. M., and Kulmala, M.: Long term measurements of aerosol optical properties at a primary forest site in Amazonia, Atmos. Chem. Phys., 13, 2391–2413, https://doi.org/10.5194/acp-13-2391-2013, 2013.
Rolph, G., Stein, A., and Stunder, B.: Real-time Environmental Applications and Display sYstem: READY, Environ. Modell. Softw., 95, 210–228, 2017.
Seinfeld, J. H. and Pandis, S. N.: Atmospheric chemistry and physics: from air pollution to climate change, John Wiley & Sons, Hoboken, New Jersey, USA, 2006.
Semeniuk, T. A., Wise, M. E., Martin, S. T., Russell, L. M., and Buseck, P. R.: Hygroscopic behavior of aerosol particles from biomass fires using environmental transmission electron microscopy, J. Atmos. Chem., 56, 259–273, 2007.
Sheridan, P., Delene, D., and Ogren, J.: Four years of continuous surface aerosol measurements from the Department of Energy's Atmospheric Radiation measurement Program Southern Great Plains Cloud and Radiation Testbed site, J. Geophys. Res., 106, 20735–20747, 2001.
Sonoma Technologies, Inc.: AirNow – Tech Navigator: https://www.airnowtech.org/navigator/, last access: 10 May 2019.
Springston, S., Andrews, E., and Salwen, C.: Particle Soot Absorption Photometer (AOSPSAP3W1M), ARM, 2016.
Springston, S.: Radiance Research Particle Soot/Absorption Photometer Instrument Handbook, DOE ARM Climate Research Facility, Washington, DC, United States, 2018.
Stein, A., Draxler, R. R., Rolph, G. D., Stunder, B. J., Cohen, M., and Ngan, F.: NOAA's HYSPLIT atmospheric transport and dispersion modeling system, B. Am. Meteorol. Soc., 96, 2059–2077, 2015.
Sumlin, B. J., Pandey, A., Walker, M. J., Pattison, R. S., Williams, B. J., and Chakrabarty, R. K.: Atmospheric photooxidation diminishes light absorption by primary brown carbon aerosol from biomass burning, Environ. Sci. Tech. Let., 4, 540–545, 2017.
Tivanski, A. V., Hopkins, R. J., Tyliszczak, T., and Gilles, M. K.: Oxygenated interface on biomass burn tar balls determined by single particle scanning transmission X-ray microscopy, J. Phys. Chem. A, 111, 5448–5458, 2007.
Tóth, A., Hoffer, A., Nyirő-Kósa, I., Pósfai, M., and Gelencsér, A.: Atmospheric tar balls: aged primary droplets from biomass burning?, Atmos. Chem. Phys., 14, 6669–6675, https://doi.org/10.5194/acp-14-6669-2014, 2014.
Veghte, D. P., China, S., Weis, J., Kovarik, L., Gilles, M. K., and Laskin, A.: Optical Properties of Airborne Soil Organic Particles, ACS Earth Space Chem., 1, 511–521, 2017.
Virtanen, A., Joutsensaari, J., Koop, T., Kannosto, J., Yli-Pirilä, P., Leskinen, J., Mäkelä, J. M., Holopainen, J. K., Pöschl, U., and Kulmala, M.: An amorphous solid state of biogenic secondary organic aerosol particles, Nature, 467, 824–827, 2010.
Wang, B., Harder, T. H., Kelly, S. T., Piens, D. S., China, S., Kovarik, L., Keiluweit, M., Arey, B. W., Gilles, M. K., and Laskin, A.: Airborne soil organic particles generated by precipitation, Nat. Geosci., 9, 433–437, 2016.
Williams, J., de Reus, M., Krejci, R., Fischer, H., and Ström, J.: Application of the variability-size relationship to atmospheric aerosol studies: estimating aerosol lifetimes and ages, Atmos. Chem. Phys., 2, 133–145, https://doi.org/10.5194/acp-2-133-2002, 2002.
Zhang, Y., Forrister, H., Liu, J., Dibb, J., Anderson, B., Schwarz, J. P., Perring, A. E., Jimenez, J. L., Campuzano-Jost, P., and Wang, Y.: Top-of-atmosphere radiative forcing affected by brown carbon in the upper troposphere, Nat. Geosci., 10, 486–489, 2017.