the Creative Commons Attribution 4.0 License.
the Creative Commons Attribution 4.0 License.
 | 08 Oct 2020
Measurement report: Characterization of severe spring haze episodes and influences of long-range transport in the Seoul metropolitan area in March 2019
Hwajin Kim
Severe haze episodes have occurred frequently in the Seoul metropolitan area (SMA) and throughout East Asian countries, especially during winter and early spring. Although notable progress has been attained in understanding these issues, the causes of severe haze formation have not yet been fully investigated. SMA haze is especially difficult to understand, because the area is impacted by both local emissions from anthropogenic and biogenic activities and emissions transported from upwind sources. Here, we investigated the emission sources and formation processes of particulate matter (PM) during three haze episodes measured in early spring of 2019, from 22 February to 2 April, using a high-resolution aerosol mass spectrometer (HR-AMS).
Overall, the average concentration of nonrefractory submicron aerosol (NR-PM1) + BC (black carbon) was 35.1 µg m−3, which was composed of 38 % organics, 12 % SO4, 30 % NO3, 13 % NH4, and 5 % BC. The organics had an average oxygen-to-carbon ratio (O∕C) of 0.52 and an average organic mass to organic carbon ratio (OM∕OC) of 1.86. Seven distinct sources of organic aerosols (OAs) were identified via positive matrix factorization (PMF) analysis of the HR-AMS data: vehicle-emitted hydrocarbon-like OA (HOA), cooking OA (COA), solid-fuel-burning emitted OA (SFOA), and four different types of oxidized secondary OA with varying oxidation degrees and temporal trends.
Of the 40 d of the measurement period, 23 were identified as haze days (daily average: >35 µg m−3), during which three severe haze episodes were recorded. In particular, PM1 concentration exceeded 100 µg m−3 during the first episode when an alert was issued, and strict emission controls were implemented in the SMA. Our results showed that nitrate dominated during the three haze episodes and accounted for 39 %–43 % of the PM1 concentration on average (vs. 21 %–24 % during the low-loading period), for which there were indications of regional-transport influences. Two regional-transport-influenced oxidized organic aerosols (OOAs), i.e., less oxidized OOA2 (LO-OOA2) and more oxidized OOA2 (MO-OOA2), contributed substantially to the total PM1 during the haze period (12 %–14 % vs. 7 % during the low-loading period), as well. In contrast, HOA and COA only contributed little (4 %–8 % vs. 4 %–6 % during the low-loading period) to the PM1 concentration during the haze days, indicating that local emissions were likely not the main reason for the severe haze issues. Hence, from simultaneous downwind (SMA) and upwind (Beijing) measurements using HR-AMS and ACSM (aerosol chemical speciation monitor) over the same period, the temporal variations in PM1 and each chemical species showed peak values on the order of Beijing (upwind) to the SMA for approximately 2 d. Furthermore, lead (Pb) derived from HR-AMS measurements was observed to increase significantly during the haze period and showed good correlations with MO-OOA2 and LO-OOA2, which is consistent with regional sources. A multiple linear regression model indicated that the transported regionally processed air masses contributed significantly to Pb in the SMA (31 %), especially during the haze period, although local burning was also important by contributing 38 %. The above results suggest that regional transport of polluted air masses might have played an important role in the formation of the haze episodes in the SMA during early spring.
- Article
(7824 KB) - Full-text XML
-
Supplement
(6146 KB) - BibTeX
- EndNote


Haze is an atmospheric phenomenon where smoke, dust, moisture, and vapor in air decrease the visibility due to the high levels of pollutants in the atmosphere (Watson, 2002). Haze has become a major concern not only to atmospheric scientists but also to the public and governments because of its detrimental effects on visibility (Zhang et al., 2010) and human health (Ebenstein et al., 2017). Haze also influences climate change directly by absorbing and reflecting solar radiation and indirectly by modifying cloud formation and cloud properties (IPCC, 2013; Pope III and Dockery, 2006; Pöschl, 2005).
In an effort to improve the ambient air quality, the Government of South Korea enacted the Special Act on Seoul Metropolitan Air Quality Improvement to regulate the concentrations of key pollutants such as SO2, CO, NO2, O3, PM, and lead (Pb) in 2005 (MOE, 2018). However, to date, the Seoul metropolitan area (SMA) is still facing air quality problems, especially in terms of high concentrations of PM2.5 and O3. PM2.5 has been one of the primary concerns due to its detrimental impacts on human health as well as on visibility. O3 is an important air pollutant itself and contributes to the secondary formation of PM2.5. Owing to the growing concern over haze pollution, extensive studies have been conducted in recent years to investigate the sources and formation mechanisms of haze in South Korea (Schroeder et al., 2020; Peterson et al., 2019; Kim and Zhang, 2019; Nault et al., 2018; Kim et al., 2017; Kim et al., 2018). Previous studies have shown that stagnant meteorological conditions, primary emissions, secondary formation, and regional transport are the major factors leading to the formation and evolution of severe haze episodes in South Korea (Nault et al., 2018; Kim et al., 2018, 2017). For example, the severe haze pollution observed in the winter of 2015 occurred due to the accumulation of local pollutants under stagnant conditions (Kim et al., 2017). Common characteristics of the stagnant meteorological parameters, e.g., a low wind speed (WS), high humidity, and shallow boundary layer (BL), during severe haze pollution periods have been observed many times at various locations in previous studies (Quan et al., 2014; Sun et al., 2014; Zhao et al., 2013; Zheng et al., 2015). However, the severe haze pollution period observed during the spring of 2016 (the KOREA-United States Air Quality Study – KORUS-AQ – campaign) was caused by both regional transport and local accumulation. Large increases in regional species, e.g., SO4 and low-volatility oxidized organic aerosols (OAs) (LV-OOA), were observed under a strong westerly wind, illustrating the regional characteristic of haze pollution, followed by the enhancement of locally generated species such as NO3, semivolatile oxidized OA (SV-OOA), and locally generated OA (e.g., hydrocarbon-like OA (HOA), cooking-generated OA (COA)) under calm winds (Kim et al., 2018; Peterson et al., 2019). These results suggest that both meteorological conditions and aerosol chemistry play important roles in haze formation and evolution. Despite previous efforts in the characterization of haze pollution, our knowledge of its sources and evolution processes is still incomplete. Hence, we still have limited understanding of the formation processes of species such as OA and NO3 during severe haze episodes, particularly for haze alert periods (the daily expected PM2.5 concentration exceeds 50 µg m−3 for more than 2 d based on the Special Act on PM2.5 released in February 2019) with temporary emission controls. Therefore, a more detailed characterization of the species sources and formation processes is of great importance for elucidating their impact on haze formation.
In March 2019, the SMA experienced several severe haze episodes, including a record-breaking haze episode over the past 10 years. The observed PM2.5 mass concentration exceeded the Korea National Ambient Air Quality Standard (35 µg m−3 for the 24 h average) by more than 2 times for longer than 5 d, and more than 50 % of the measurement days violated the national standard released in March 2018 by the Ministry of Environmental Protection of Korea. Although studies have been conducted to investigate severe haze pollution from the perspectives of meteorology and modeling (Oh et al., 2020), the sources and evolution processes of the record-breaking haze episode in the early spring of 2019 remain unclear. Since the development of effective air pollution control policies must rely on knowledge about the sources, it is important to investigate the major formation processes and emission sources that contribute to the high PM loadings. Therefore, understanding the sources, formation mechanisms, and evolution processes of haze pollution is important for air pollution control and the assessment of the health and climate impacts.
In this study, we conduct a comprehensive characterization of the aerosol particles in March in the SMA focusing on severe haze episodes. The high-resolution aerosol mass spectrometer (HR-AMS) is unique in providing properties of nonrefractory submicron aerosol (NR-PM1) species (organics (Org), SO4, NO3, NH4, and chloride – Chl) in real time at a high temporal resolution ranging from seconds to minutes (Canagaratna et al., 2007; Jayne et al., 2000). We deployed a HR-AMS, manufactured by Aerodyne Research Inc. (Billerica, MA, USA), in Seoul for 6 weeks (from 22 February to 2 April) in 2019 to characterize the early springtime NR-PM1 properties in this urban area. During the same period, a time-of-flight aerosol chemical speciation monitor (ACSM) was employed in Beijing to characterize the NR-PM2.5 species (organics, SO4, NO3, NH4, and chloride). By comparing the detailed information obtained from the in situ measurements at both sites, our goal was to investigate the chemical evolution of the composition of PM1 and OA, in terms of the upwind aerosol properties, and the relationship between meteorological conditions and haze formation in detail. In particular, the regional contributions to the record-breaking haze episode were investigated, which may improve our understanding of the factors and their influence on haze formation in the SMA. This information will eventually allow for the design of better pollution abatement strategies and red alert control measures. Here, we report (1) the general mass concentration, chemical composition, and temporal and diurnal variations in PM1 species during the early spring; (2) the characteristics and dynamic variations in OA sources and processes through positive matrix factorization (PMF); (3) the characteristics, sources, and important factors of the PM1 composition and components of OA during the haze period; and (4) the impacts of regional transport on haze formation in terms of the upwind PM properties.
2.1 Sampling site and measurement
Real-time measurements of the particle composition and size distribution were conducted at the Korea Institute of Science and Technology (KIST), which is located in the northeast of Seoul (37.60∘ N, 127.05∘ E), 7 km from the city center, as reported in Kim et al. (2017). Sampling was conducted on the fifth floor of one of the KIST buildings (60 m above sea level) from 22 February to 2 April 2019. This is a typical urban site affected by multiple local emissions, including nearby restaurants, traffic, burning, and a variety of residential sources (Kim et al., 2017). The NR-PM1 chemical components, including SO4, NO3, NH4, chloride, and organics, were measured with the HR-AMS instrument (Canagaratna et al., 2007; DeCarlo et al., 2006) at a time resolution of 2.5 min. At the same time, from 21 January to 21 March 2019, NR-PM2.5 was sampled using an ACSM at the tower branch of the Institute of Atmospheric Physics, Chinese Academy of Sciences, Beijing, and compared with SMA NR-PM1 data to investigate the regional-transport impacts (Fig. 1a). The sampling setup, operation, and calibration procedures of the ACSM have been described elsewhere (Xu et al., 2015; Zhao et al., 2017).

Figure 1(a) © Google map of the measurement sites in the SMA in South Korea and Beijing in China; (b) wind rose plot for the entire study period; (c) average compositional pie chart of the PM1 species and each of the factors of the OA during the whole campaign. The green outline indicates the fraction of the total OA; (d) averaged compositional pie chart of the PM1 species (nonrefractory-PM1 plus black carbon (BC)) in the three different HYSPLIT clusters. The trajectories were released at half of the mixing height at the KIST site (37.60∘ N, 127.05∘ E; latitude, longitude) during the entire period.
Colocated measurements during this campaign, including the black carbon (BC) mass concentration, were performed with a multiangle absorption photometer (MAAP; Thermo Fisher Scientific, Waltham, MA, USA), and the number size distribution of the aerosols with a mobility size between 20.9 and 947.5 nm was determined with a scanning mobility particle sizer (SMPS 3080; TSI Inc., St. Paul, MN, USA). Both instruments conducted sampling downstream of a PM2.5 cyclone (URG Corp., Chapel Hill, NC, USA). The hourly concentrations of the trace gases (e.g., CO, O3, NO2, and SO2) measured at the Gireum site (37.61∘ N, 127.03∘ E) were acquired from the Korea Environment Cooperation (KECO) (http://www.airkorea.or.kr, last access: March 2020). Meteorological measurement data such as the ambient temperature, relative humidity (RH), WS, and wind direction were obtained from the nearby Jungreung site (37.61∘ N, 127.00∘ E) maintained by the Korea Meteorological Administration (http://www.kma.go.kr, last access: March 2020). The data reported in this paper are expressed in local time, which is the Korea standard time (KST) and is 9 h ahead compared to coordinated universal time (UTC). Beijing time is 1 h behind than KST; thus, for the comparisons, the time has been modified to KST. Detailed descriptions of the sampling sites, sampling setup, operation, and calibration procedures can be found in Kim et al. (2017).
2.2 HR-AMS data analysis
2.2.1 Basic HR-AMS data analysis
The HR-AMS data were processed and analyzed using the standard toolkit (SeQUential Igor data RetRiEval (SQUIRREL; version 1.57I) and PIKA (version 1.16H; available for download at http://cires.colorado.edu/jimenez-group/ToFAMSResources/ToFSoftware/index.html, last access: September 2016)) in Igor Pro (WaveMetrics, Lake Oswego, OR, USA). Details on the data processing procedures have been described in previous studies (Aiken et al., 2008, 2009; Allan et al., 2004). Briefly, using measurements of particle-free ambient air, modifications were made to the () signal and 15NN+ at to remove the contributions of the gas-phase CO2 as well as to adjust the air signals. From the separate calibrations using pure NH4NO3 and (NH4)2SO4 aerosols, the relative ionization efficiencies (RIEs) were determined to be 1.1, 1.12, and 3.99 for NO3, SO4, and NH4, respectively. A composition-dependent collection efficiency (CDCE, 0.51±0.03, average ±1σ) was applied to the data based on an algorithm published by Middlebrook et al. (2012).
The quantification of the NR-PM1 species was validated through a comparison of the total PM1 mass (PM1= NR-PM1+ BC) and the apparent particle volume measured by the SMPS (Fig. S1c in the Supplement). As shown in Fig. S1c, the SMPS-measured particle volume was strongly correlated with the HR-AMS-measured total mass (r=0.90). From this strong correlation, the intercomparison of the HR-AMS mass and SMPS volume yielded a slope of 1.29, which was lower than the average particle density of 1.47 estimated using the measured chemical composition in this study (Zhang et al., 2005b) (Fig. S1c and d). Note that the average density of the OA was estimated to be 1.27 g cm−3 based on measured elemental ratios (Kuwata et al., 2012). The evolution pattern of the HR-AMS total concentration also agreed well with the volume-based concentration from the SMPS measurements throughout the day (Fig. S1a and c). In addition, the total PM1+BC correlated well (r=0.86) with the PM2.5 mass measured using a beta attenuation mass monitor (Thermo FH62C14) at the Gireum site (∼5 km from the KIST site), accounting for 75 % of the PM2.5 mass (Fig. S2). The HR-AMS detection limits of the main chemical components are listed in Table S1 and are typically far lower than the observed concentrations. All the reported HR-AMS-measured mass concentrations in this study are based on ambient conditions.
The elemental ratios between oxygen, carbon, hydrogen, and nitrogen as well as the organic mass to organic carbon ratios (OM∕OC) of the OA were determined from an analysis of the W-mode high-resolution mass spectroscopy (HRMS) data, following the method reported by Canagaratna et al. (2015). The elemental ratios calculated using the “Aiken-ambient” method (Aiken et al., 2008) are listed in Table S2 in the Supplement along with the ratios calculated using the “improved-Aiken” method for the sake of comparison. Unless otherwise indicated, the O∕C, H∕C, and OM∕OC ratios in this paper that are obtained from other studies have been calculated using the updated elemental analysis method (Canagaratna et al., 2015).
2.2.2 Particulate lead (Pb) analysis
Particulate lead (Pb) was measured with the HR-AMS. Because of its low-volatility and refractory characteristics, it is not straightforward to measure and quantify its concentration with a HR-AMS. In this study, the particulate Pb was measured with the HR-AMS and adopted as evidence for regional-transport impacts. A detailed description of the validation and quantification of lead can be found in Salcedo et al. (2010), where Pb was measured with an AMS and quantified with the model developed by Salcedo et al. (2010).
In brief, the lead signal was recorded at an m∕z value of 208 based on the most abundant lead isotope (208Pb+). The signals corresponding to the ions of the other main lead isotopes (207Pb+ and 206Pb+) (Fig. S3), as well as to the doubly charged ions of the three main lead isotopes (208Pb2+, 207Pb2+, and 206Pb2+), were also observed (Fig. S4). No 204Pb+ signal was detected, as expected due to its low abundance (0.027 relative to 208Pb+) (De Laeter et al., 2003) and the limited signal-to-noise ratio of our measurements. Given the expected values of the isotopic ratios (De Laeter et al., 2003) and the linear fitting results, e.g., the slope (m) and Pearson's R (isotopic ratios of the singly and doubly charged ions of 207Pb and 206Pb vs. 208Pb), summarized in Table S3, identification of the lead signals measured with the HR-AMS in the SMA was conducted. The total Pb signal for both the open and closed signals was calculated as the sum of the 208Pb+, 207Pb+, 206Pb+, 208Pb2+, 207Pb2+, and 206Pb2+ signals using V-mode data since they provide better expected ratios of Pb isotopes than those from W-mode data, probably due to their high sensitivity. Because of the relatively low-volatility features of Pb, Pb slowly evaporates on the HR-AMS vaporizer; thus, both the open and closed Pb signals were separately observed. Note that in general the chopper-closed signal represents the instrument background signal, and there are no Pb sources in the HR-AMS. Figure S5 compares the time series of both the open and closed Pb signals in the SMA. The sensitivity of the open signal was higher than that of the closed signal, and the isotopic ratios from the open V-mode signal were closest to the expected values (Table S3); thus, in this study, we report the Pb time series from the open V-mode signal to explain the overall Pb trend and adopted it for further investigations. Since both the open and closed signals are well correlated, using only the open signals does not distort the results. Salcedo et al. (2010) quantified the Pb concentration, considering the residual effect on the vaporizer, by developing a model from the observed open and closed Pb signals from the AMS; however, since the main purpose of this study was to use the temporal variations in Pb as an indicator for regional-range transport of polluted air masses, this was not conducted in this study since it is beyond of the scope of the current study.
The contribution of the Pb sources was further analyzed using a multiple linear regression algorithm. The ambient Pb can be freshly emitted from burning sources or transported in aged air masses along with other unknown species. Hence, by including OA sources and (unknown) background of the OA, the linear decomposition algorithm was determined by the following:
tsPb tsHOA tsCOA tsLO-OOA1 tsLO-OOA1 tsMO-OOA1 tsMO-OOA2 tsSFOA + background
where tsHOA, tsCOA, tsLO-OOA1, tsLO-OOA2, tsMO-OOA1, tsMO-OOA2, tsSFOA, and background are the time series of each organic source and the sum of the unknown sources, and x1 to x7 indicate the contribution of each factor. Note that other unknown sources can generate a background level and discrepancies between the measured and reconstructed Pb concentrations. Additionally, the slight evaporation signal of Pb may cause uncertainties since only the open signal was considered for this calculation. However, this approach is useful to estimate the time-dependent major sources of Pb among various volatile compounds. Since the Pb concentration is very low, the value of each factor is also low, but the relative contribution can be assessed.
2.2.3 Positive matrix factorization (PMF) analysis
The high-resolution mass spectra (from HR-AMS) of the OA were analyzed using PMF. The analysis was performed using the PMF2 algorithm in robust mode (Paatero and Tapper, 1994) with the PMF Evaluation Toolkit (PET version 2.05) (Ulbrich et al., 2009), which was retrieved from http://cires1.colorado.edu/jimenez-group/wiki/index.php/PMF-AMS_Analysis_Guide#PMF_Evaluation_Tool_Software (last access: August 2012). The data and error matrices were prepared according to the protocol described by Ulbrich et al. (2009) and outlined in Table 1 of Zhang et al. (2011). After these treatments, PMF was performed with a matrix consisting of 252 ions at m∕z values between 12 and 120 by examining the number of factors (p) in the solution from one to nine.
Table 1Correlation coefficient (Pearson's r) for the linear regression between the factors of the organic aerosols (OA) and the various particle- and gas-phase species and ions.
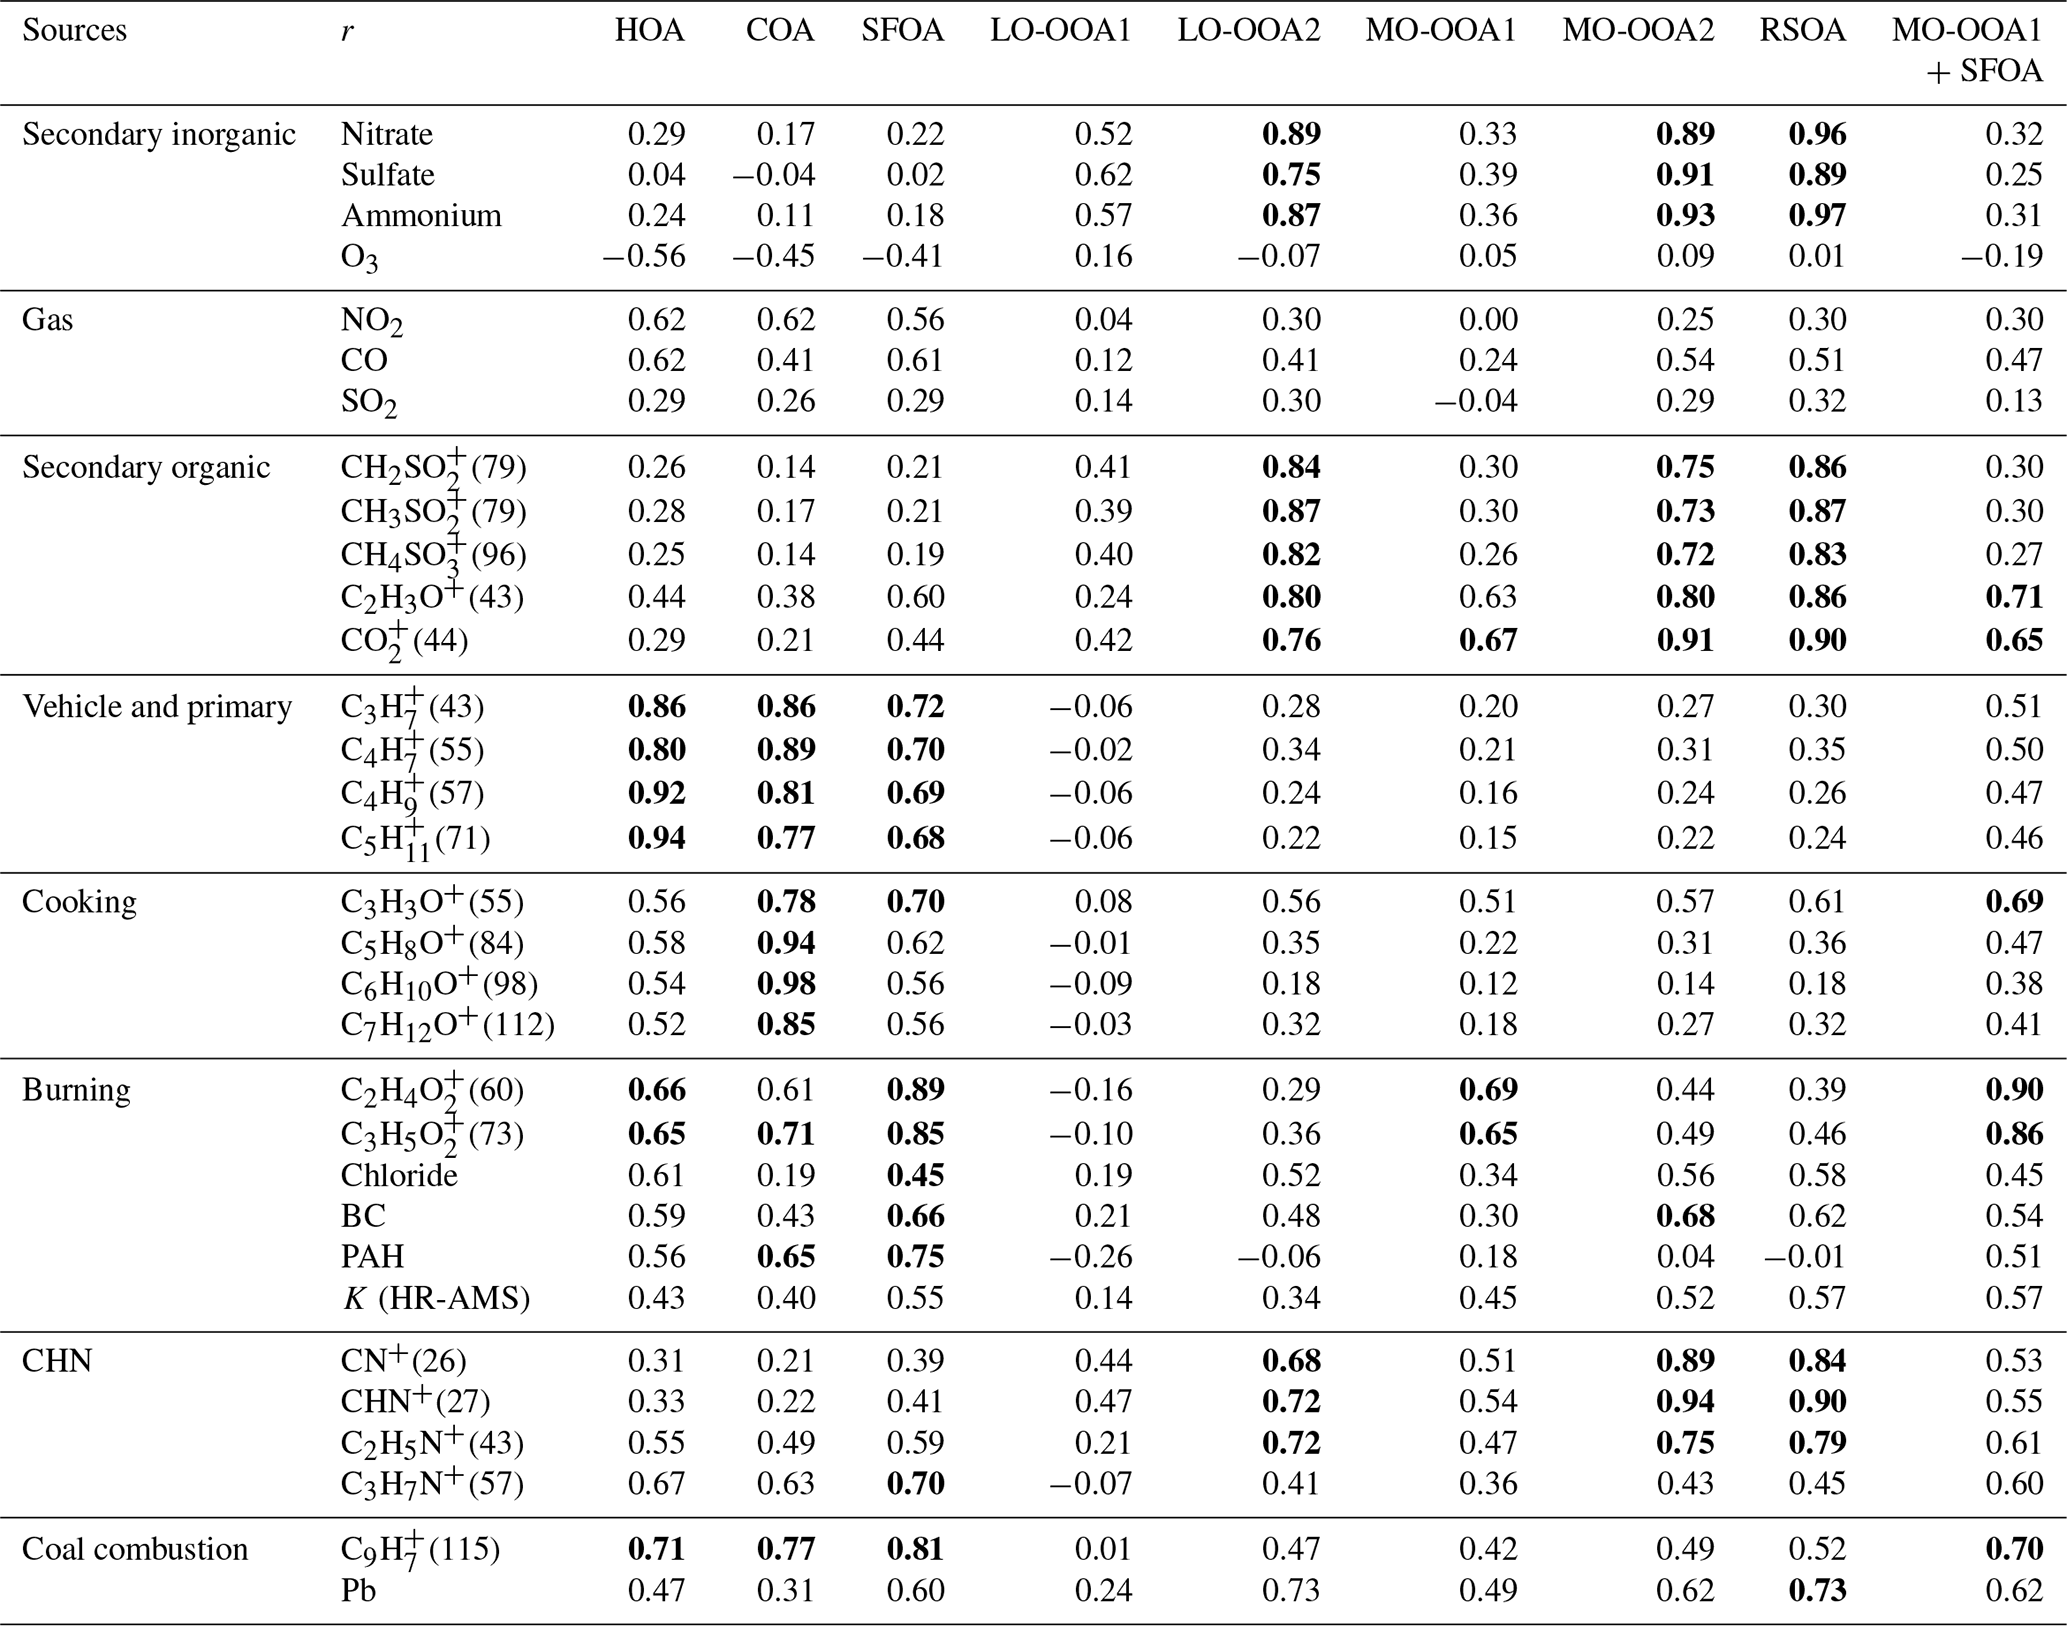
BC, black carbon; PAH, polycyclic aromatic hydrocarbon. RSOA, regional-transport-influenced secondary OA (SOA). The values with r>0.7 are boldfaced.
After a careful evaluation based on the recommendations outlined in Zhang et al. (2011), including an investigation of the key diagnostic plots, mass spectral signatures, diurnal profiles, and correlations with external tracers, the seven-factor solution with ) was selected for further analysis, because it satisfied the above criteria, with a distinct separation between the temporal and mass spectral variations in the seven factors. A summary of the key diagnostics is shown in Fig. S6 in the Supplement. The seven-factor solution was found to be very stable, as the mass fraction of each of the factors remained relatively constant between fPeak values of −1 and +0.3 (Fig. S6c). Figure S7 shows the mass spectra and the time series of the six- and eight-factor solutions, where factors 1–3 of the six-factor solution could be identified as secondary organic aerosols (SOAs) based on the O∕C ratio, with a high fraction of m∕z 44 and m∕z 43. However, factor 3 of this solution revealed a mixed feature with cooking OA in both the mass spectra and time series. Moreover, factor 6 could also be attributed to fuel-burning OA based on the fuel-burning signature of the OA at m∕z 60 and m∕z 73, but it exhibited a mixed feature with SOAs based on the pronounced peak at m∕z 43, indicating that more factors may be required to resolve these mixed factors. In contrast, the temporal variations in the eight-factor solution were similar to those in the seven-factor solution but exhibited indications of factor splitting. For example, two very similar time series of fuel-burning-like factors (factors 5 and 6) were identified in the eight-factor solution, where the main difference was that factor 6 had a pronounced peak at m∕z 60 and m∕z 73 with lower O∕C and higher H∕C ratios than those of factor 5. Although different fuel-burning types and sources are possible, we did not acquire external evidence to validate the separation. Furthermore, given that accounting for only one fuel factor (i.e., the seven-factor solution) did not influence the separation between the other factors, it was not necessary to consider it for a larger number of factors. Consequently, the seven-factor solution, which resolved hydrocarbon-like OA (HOA), cooking OA (COA), solid-fuel-burning OA (SFOA), and four types of SOAs (less oxidized OOA1 (LO-OOA1), less oxidized OOA2 (LO-OOA2), more oxidized OOA1 (MO-OOA1), and more oxidized OOA2 (MO-OOA2)), was chosen, because it best represented the sources and processes of the OA in the SMA during early spring. Details on the source descriptions will be provided in Sect. 3.2.
2.3 Back-trajectory and bivariate conditional probability function analysis
In this study, 96 h back trajectories were calculated every hour using version 4.8 of the HYbrid Single-Particle Lagrangian Integrated Trajectory (HYSPLIT) model (Draxler, 2012, 1997) for the sampling periods from 22 February 2019 to 2 April 2019. Every trajectory was released at half of the mixing height at the KIST site (37.60∘ N, 127.05∘ E; latitude, longitude). Note that half of the mixing height was automatically calculated by the HYSPLIT model. To identify the pollutant characteristics in the different dominant transport patterns, cluster analysis was performed on the trajectories using HYSPLIT4, and three clusters were identified according to the similarity in their spatial distributions. The average starting height for the back trajectories over the entire study period was approximately 225 m for clusters 1 and 2 and 691 m for cluster 3 (Fig. 1d). In addition, forward trajectories from Beijing were calculated separately for the haze periods to determine the direction and travel time of the plumes departing from Beijing (Fig. S19). Moreover, conditional probability function (CPF) (Kim et al., 2003) analysis was performed to estimate the local sources and their impacts on the PM1 composition and individual sources of the OA from PMF analysis based on the wind direction coupled with the time series of the concentration of each species (Fig. S17). The CPF plots represent the probability that a specific compound or source is located in a certain wind direction, which can assist in the determination of local point sources. The directional origin of regionally transported sources may not be consistent with the local surface wind data used for the CPF plots due to the topography of the region (Heo et al., 2009; Kim et al., 2017).
3.1 Overall characteristics
3.1.1 Temporal variations in the PM1 composition and chemical properties
The overall characteristics and temporal variations in the spring PM1 concentration from 22 February to 2 April in the SMA are shown in Fig. S8, along with the time series of the gaseous pollutants, e.g., CO, SO2, O3, and NO2, and the meteorological conditions (RH, temperature, wind direction, and WS). From 22 February to 2 April 2019, the average PM1 concentration (= NR-PM1+ BC) was 35.1 µg m−3, ranging from 3.85 to 129 µg m−3. On average, OA constituted the largest component of PM1, accounting for 38 % of the total mass, followed by NO3 (30 %), SO4 (12 %), NH4 (13 %), BC (5 %), and chloride (2 %) (Fig. 1c). Compared to the KORUS-AQ measurement, which occurred during late spring (May 2016), the NO3 fraction was much higher (30 % vs. 17 %), whereas the organic fraction relatively decreased (38 % vs. 44 %). This occurred due to the enhanced gas-to-particle partitioning of semivolatile species due to the lower temperature (4.7 ∘C vs. 19 ∘C), and likelihood of additional NO3 sources and/or NO3 formation pathways, which are further examined in the following section. The relationships of NO3 and/or nitrogen oxidation ratio (NOR, molar fraction of NO3 in total N, i.e., nitrate + NO2) and SO4 and/or sulfate oxidation ratio (SOR, molar fraction of SO4 in total S, i.e., SO4 + SO2) with RH were often analyzed to understand the role of heterogeneous aqueous-phase formation of secondary inorganic aerosols (Sun et al., 2013; Li et al., 2017; Xu et al., 2014). Both NO3 and NOR showed an increasing trend with RH but in a rather scattered relationship (i.e., r=0.40). The correlation between RH and NOR is also positive but relatively weak (r=0.48). These results suggest that heterogeneous aqueous-phase processing likely contributed to some degree to the formation of inorganic nitrate and sulfate during this period (Fig. S9). The primary organic aerosols (POAs) (= HOA + COA + SFOA) and SOAs (= LO-OOA1 + LO-OOA2 + MO-OOA1+ MO-OOA2) accounted for 31 % and 69 %, respectively, of the OA mass (Fig. 2, Sect. 3.3). Due to the lower temperature, there was a burning source that was not identified during the KORUS-AQ campaign (May 2016). Even with the extra source of the POAs, the total fraction of the primary species (BC + POAs) was lower than that determined in the KORUS-AQ campaign (21 % vs. 26 %), with the remainder (79 %) being secondary species (NO3 + SO4 + NH4 + Chl + SOAs). This indicates that the aerosol pollution problem in the SMA during early spring was more strongly influenced by secondary aerosols, although the formation process was apparently not the same as that determined by the KORUS-AQ measurements, where photochemical formation was the major process (Kim et al., 2018).
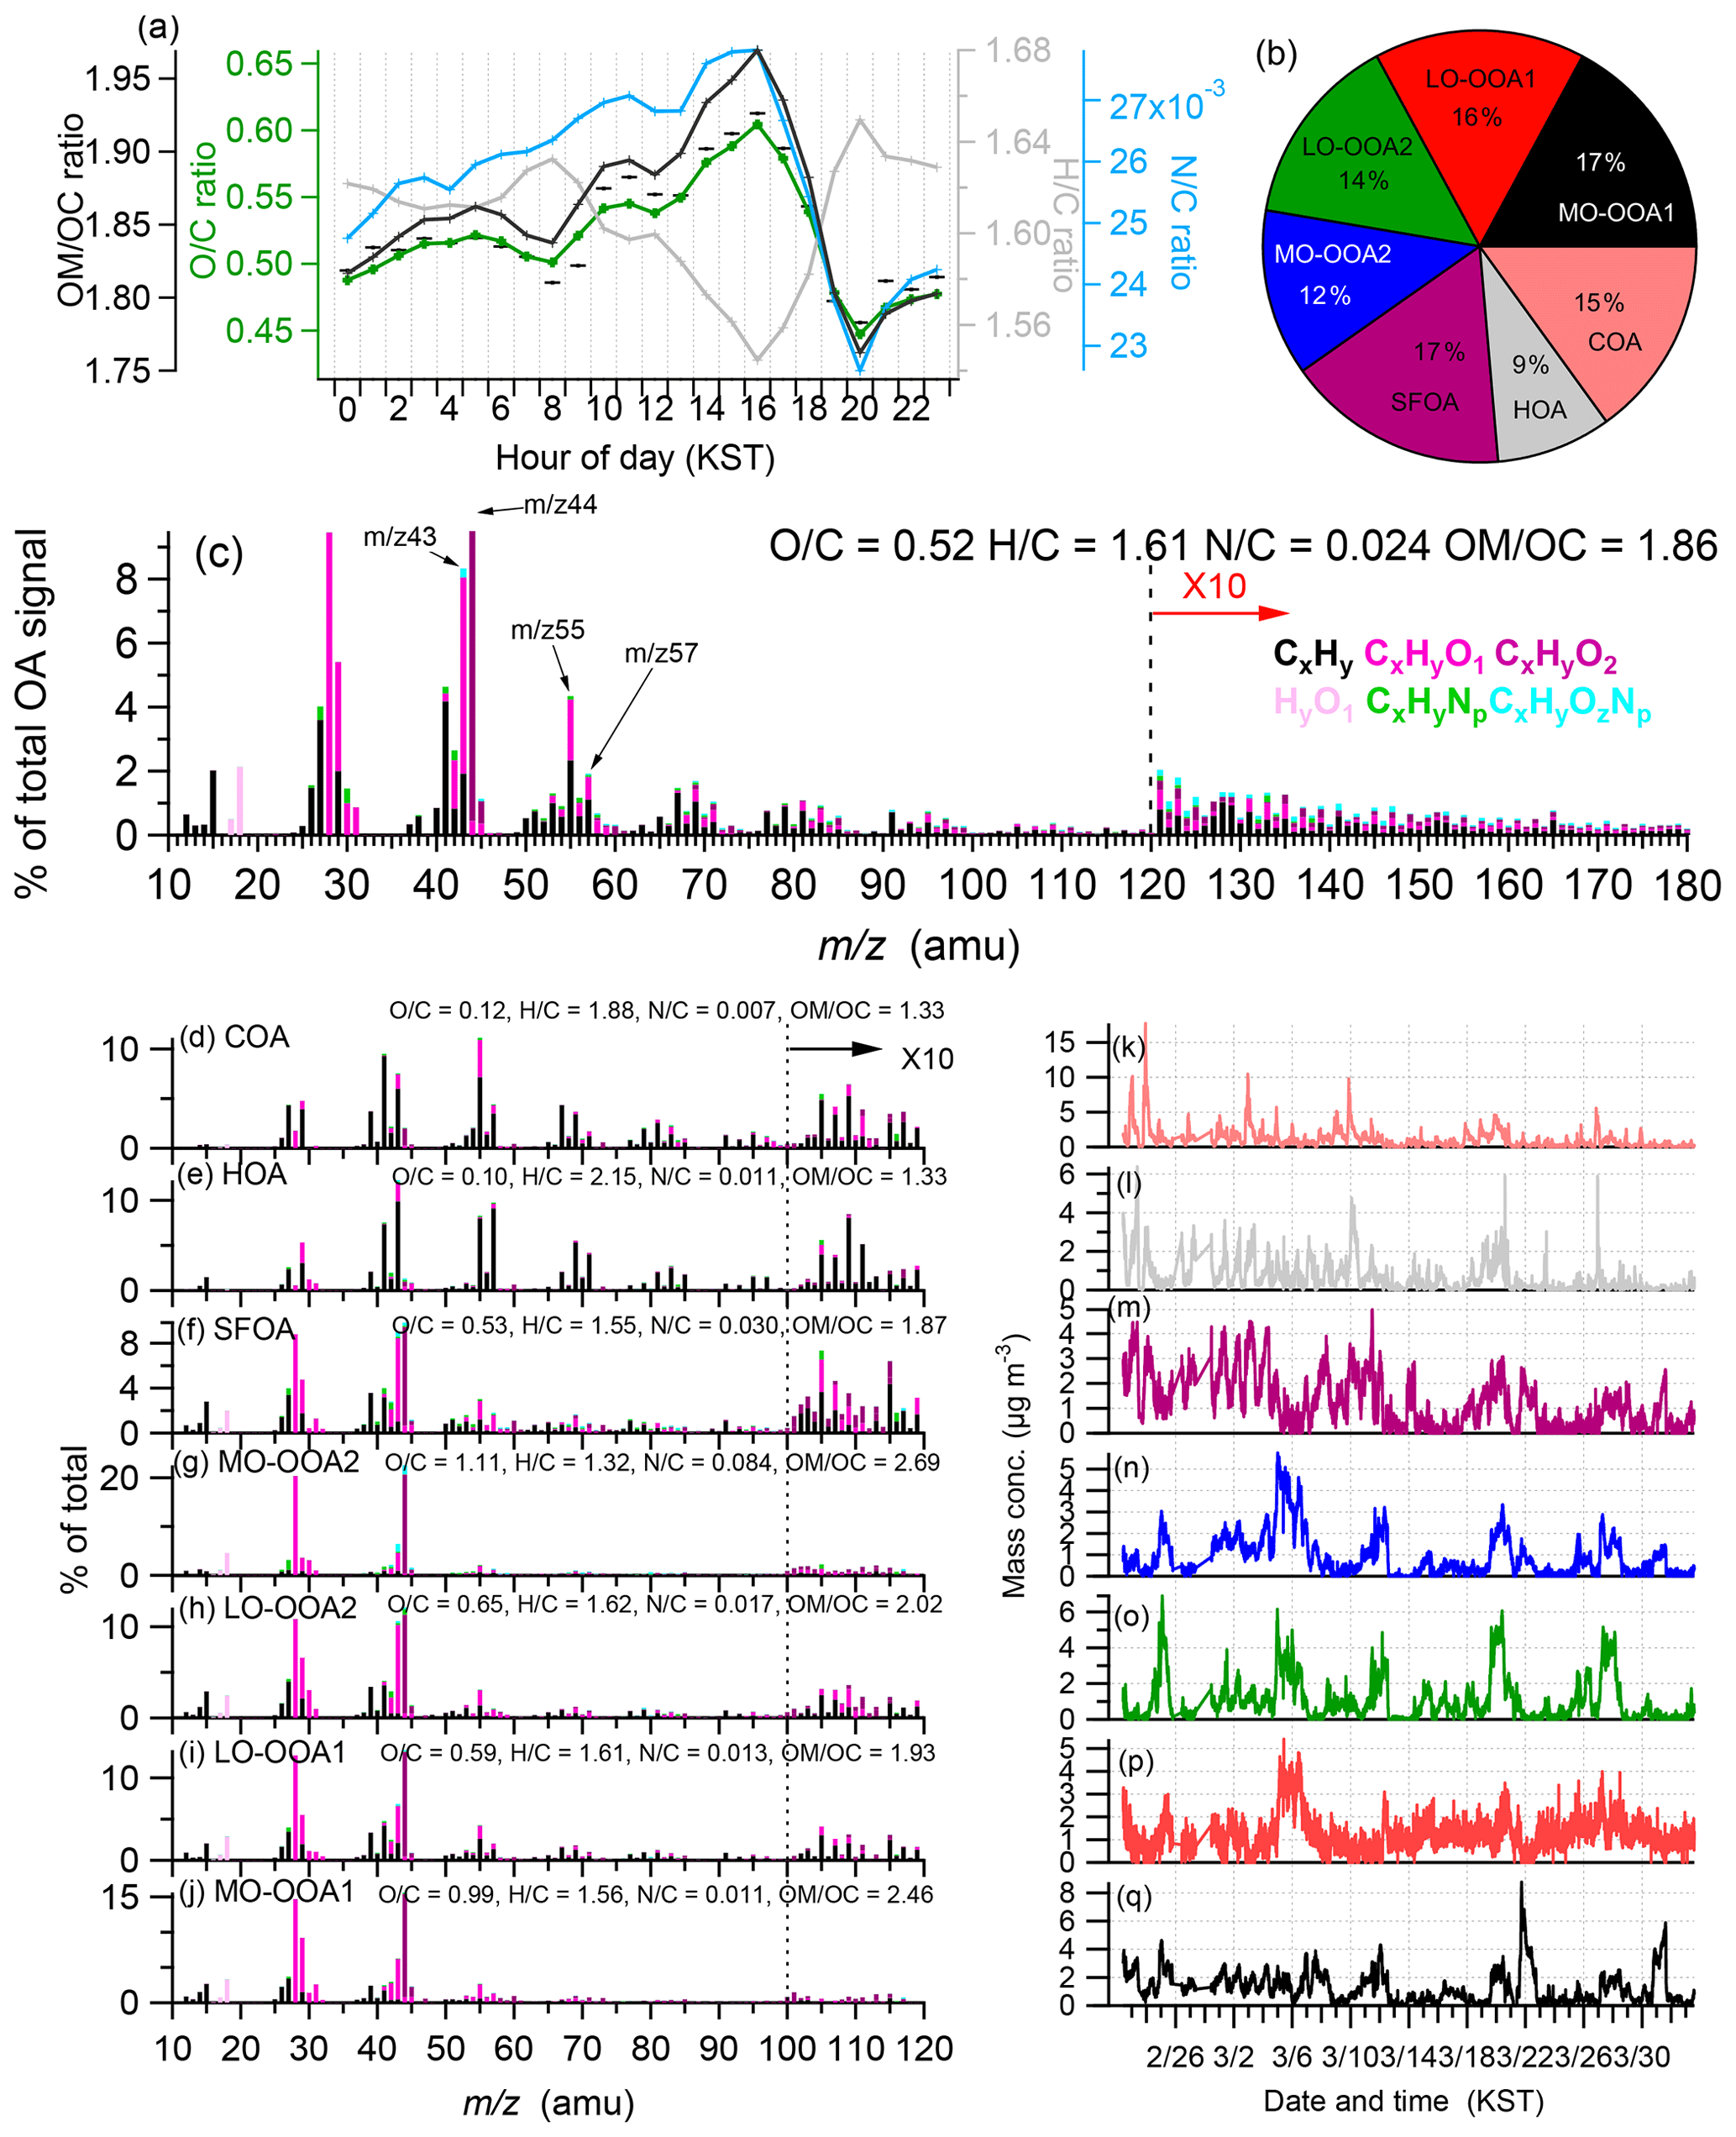
Figure 2(a) Average diurnal profiles of the organic matter to organic carbon ratio (OM∕OC), oxygen-to-carbon ratio (O∕C), hydrogen-to-carbon ratio (H∕C), and nitrogen-to-carbon ratio (N∕C), where the O∕C, H∕C, and OM∕OC elemental ratios were determined using the updated method (Canagaratna et al., 2015); (b) compositional pie chart of the average fractional contribution of each of the factors of the OA to the total OA during the campaign; (c) average high-resolution mass spectra of the OA colored by the different ion families. The average elemental ratios for the fractions of the OA are described; (d–j) high-resolution mass spectra of all organic sources from the PMF analysis including cooking OA (COA), hydrocarbon-like OA (HOA), solid-fuel-burning OA (SFOA), more oxidized OA2 (MO-OOA2), less oxidized OA2 (LO-OOA2), less oxidized OA1 (LO-OOA1), and more oxidized OA1 (MO-OOA1); and (k–q) time series of each organic source from the PMF analysis including COA, HOA, SFOA, MO-OOA2, LO-OOA2, LO-OOA1, and MO-OOA1 (from top to bottom).
Assuming that PM1 represents approximately 80 % of the PM2.5 mass (Lim et al., 2012), we found that 58 % of the measurement days (i.e., 23 d) violated the National Institute of Environmental Research (NIER) daily PM2.5 standard (35 µg m−3). This was the most severe haze measurement since December 2015 when we started to measure the PM properties in the SMA with the HR-AMS. This occurred because the mass concentration was indeed the highest, and the regulation of the daily PM2.5 standard in South Korea has changed from 50 to 35 µg m−3 since 2018. Using a global standard, 70 % of the days (30 d) violated the WHO (World Health Organization) daily standard (25 µg m−3), thus indicating how significant the haze was during the measurement period. Details on the sources and processes that led to the very poor air quality are provided in Sect. 3.3. In total, three haze episodes (EP1, EP2, and EP3) were identified, as shown in Fig. S7. The haze features, e.g., the composition and meteorological conditions, are similar among the various haze episodes (Fig. S11), but the first haze episode, namely, EP1, in particular, exhibited a consistently high PM1 mass concentration for more than 5 d despite the red alert issued by the Government of South Korea and the subsequent strict emission controls implemented during this period, which will be discussed in detail in Sect. 3.3. Alternating high- and low-loading periods were observed. Hence, despite the frequently observed high PM1 concentrations >100 µg m−3, the averaged PM1 mass concentration over the entire period (35.1 µg m−3) was still moderate.
3.2 Characteristics and source apportionment of the organic aerosols
Overall, on a mass basis, OA over the SMA during the early spring of 2019 consisted of approximately 59 % carbon, 32 % oxygen, 7.5 % hydrogen, and 1.5 % nitrogen (Fig. S12). The average carbon-normalized molecular formula of the OA was C1H1.61O0.52N0.02, yielding an average OM∕OC ratio of 1.86 (Fig. 2c). The average elemental ratios, which were calculated using the updated elemental analysis method (Canagaratna et al., 2015), were within the range of the revised values observed at other urban locations (Canagaratna et al., 2015; Young et al., 2016, and the references therein), but they were more oxidized than those measured during the other periods, e.g., winter (OM∕OC: 1.67) (Kim et al., 2017) and KORUS-AQ (OM∕OC; 1.82) (Kim et al., 2018), in the SMA, suggesting that intensive SOA formation occurred during this study period. The moderate correlation of the daytime (10:00–16:00) SOA∕Ox ratio (r=0.60, 0.19 µg m−3 ppbv−1) suggests that photochemical processing was an important process of the SOA formation (Fig. 3), which is consistent with Herndon et al. (2008), where a strong correlation between OOA and Ox was observed in photochemically processed urban plumes originating from Mexico City. Hence, the average SOA∕Ox ratio (0.19 µg m−3 ppbv−1) in the SMA observed in this study is at the high end of the ranges (0.03–0.19) observed in Mexico City and other megacities, e.g., Tokyo, Los Angeles, and Paris, in other seasons in the SMA (Kim et al., 2018; Zhang et al., 2015), indicating that the photochemical SOA formation rate in the SMA was higher than those in the other megacities and other periods. This suggests that different types or different amounts of volatile organic compounds (VOCs) might influence the SOA formation rate during this period, although VOCs were not detected during this period. Note that only regional-transport-influenced OOAs (i.e., LO-OOA2 and MO-OOA2; Sect. 3.2.1) exhibited a notable correlation with Ox, suggesting that these two types of aerosols are photochemically formed SOAs. The other two OOA types, namely, LO-OOA1 and MO-OOA1, did not exhibit a notable correlation (Fig. S24). This result indirectly suggests that VOCs in the regionally transported plumes influenced SOA loading during this period.
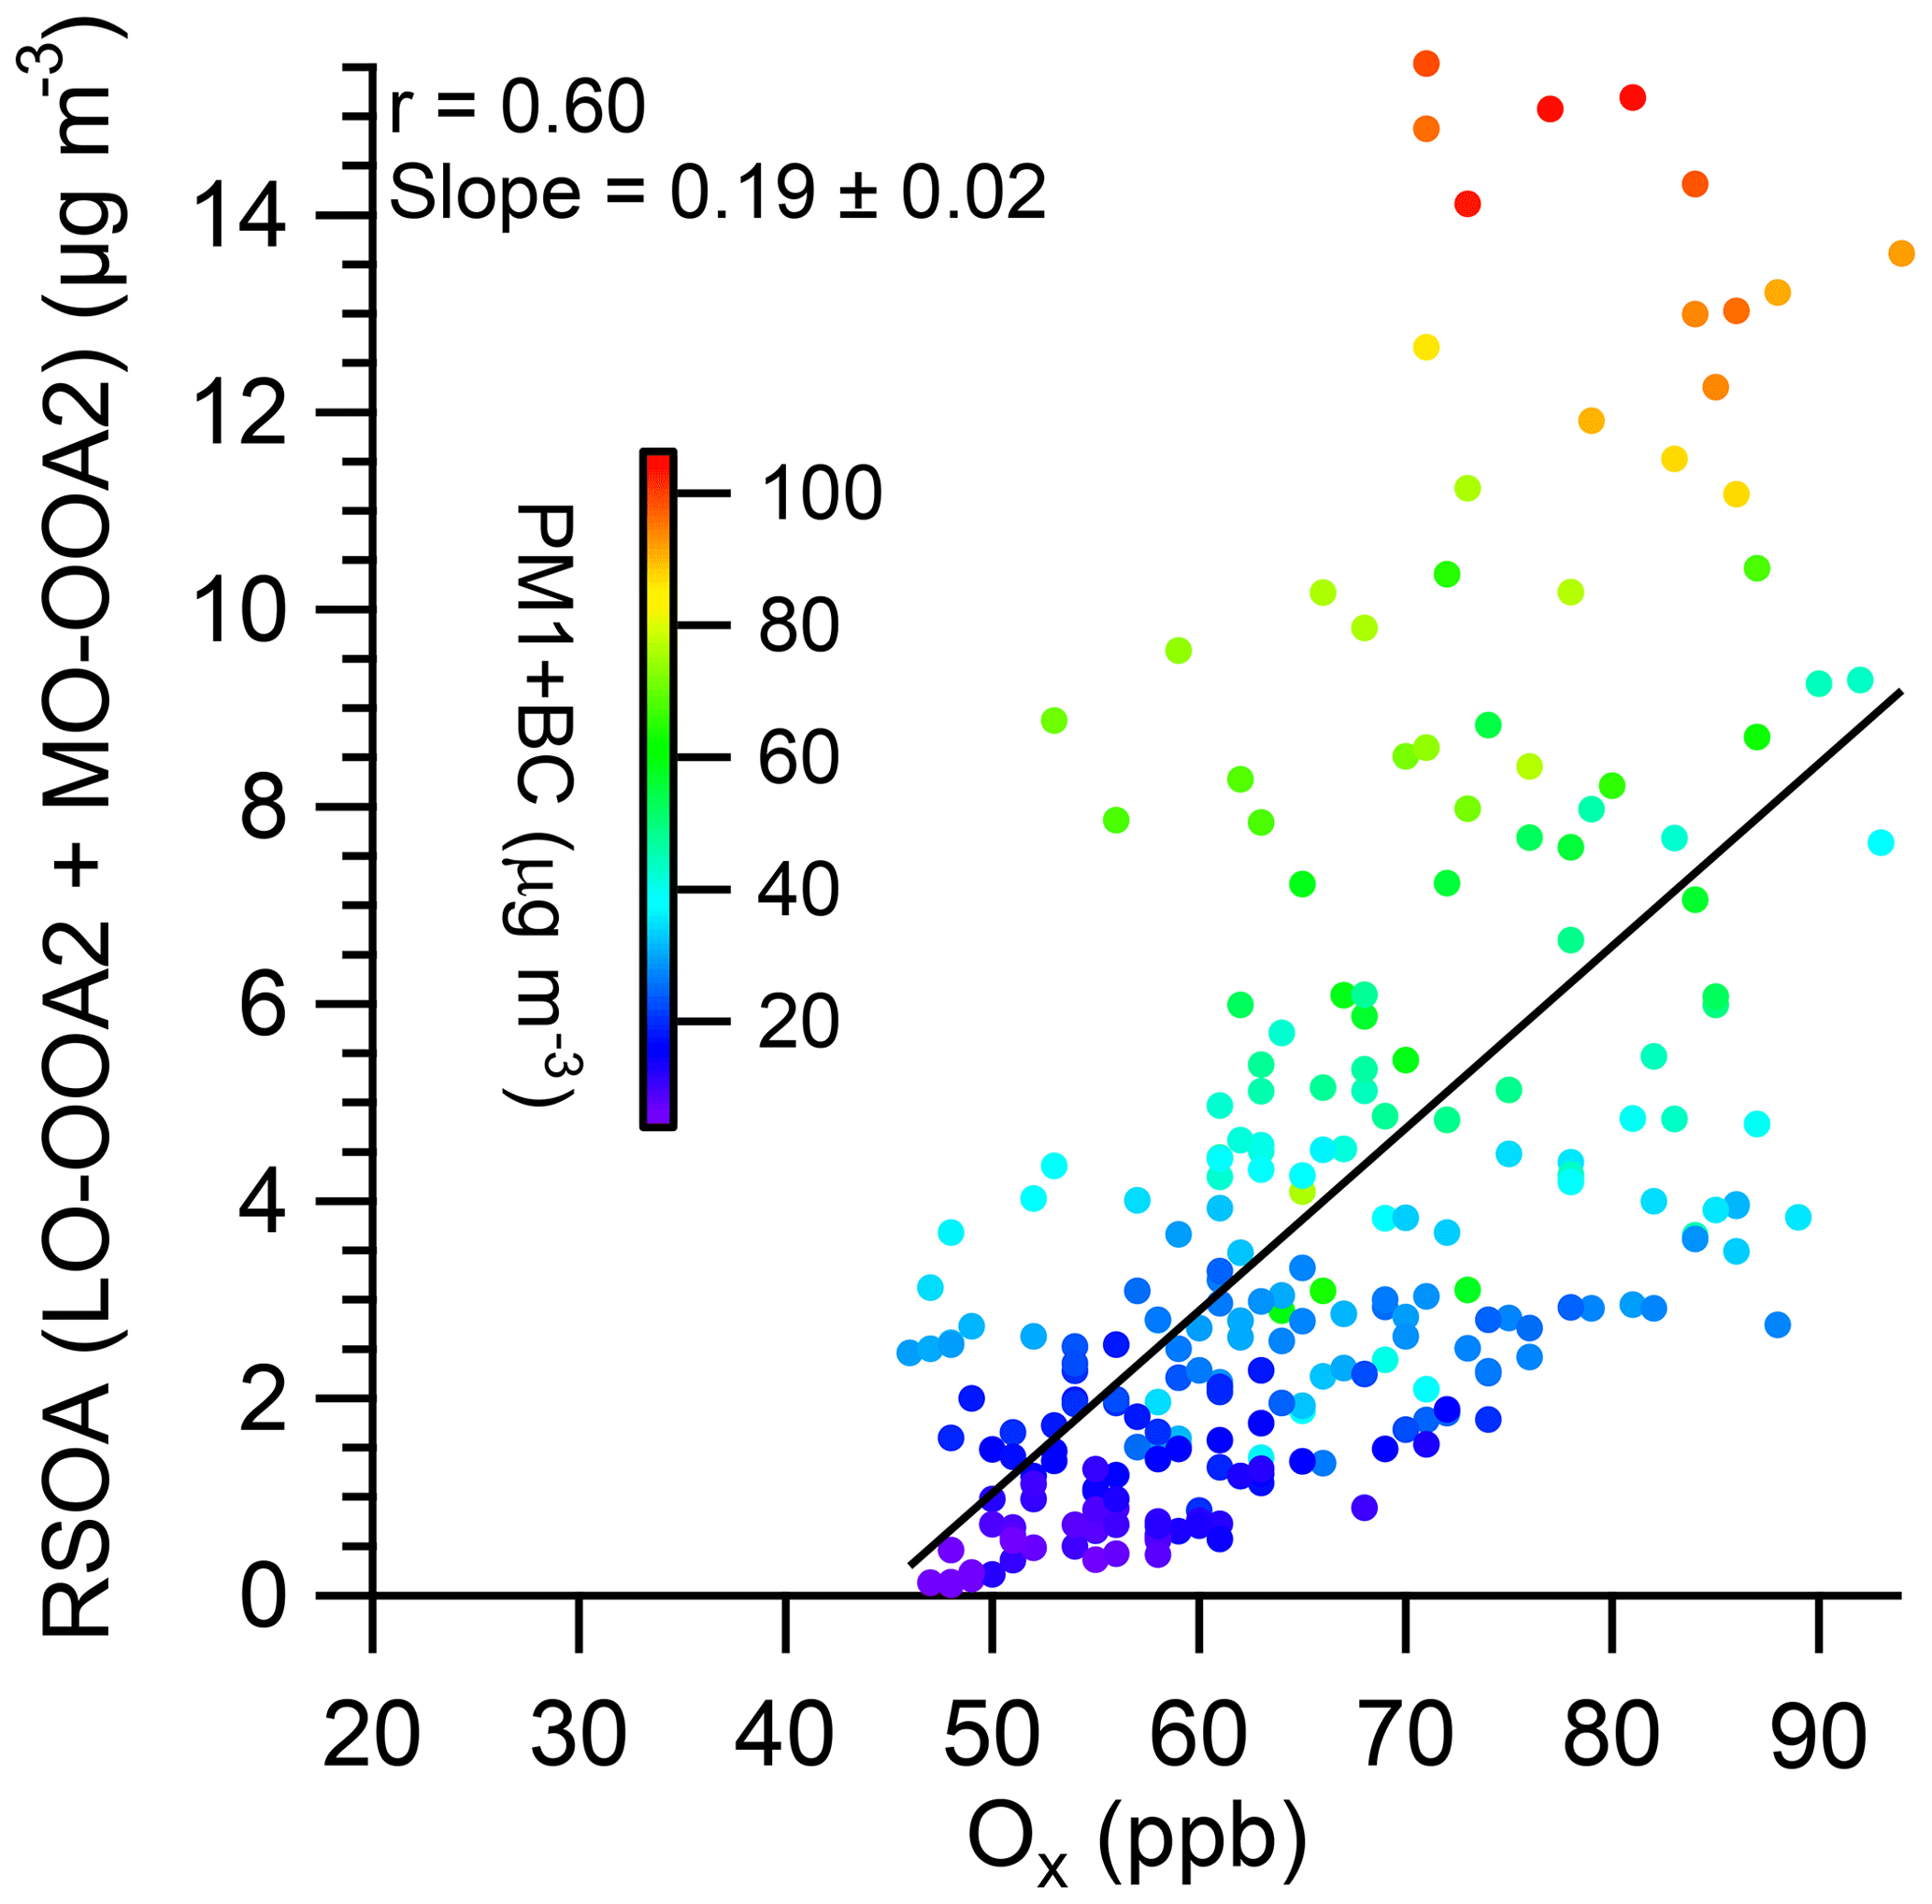
Figure 3Scatter plot of RSOA vs. Ox during the daytime (10:00–16:00) in the early spring of 2019. Note that the fitting for the RSOAs includes LO-OOA2 and MO-OOA2, which exhibited a good correlation with Ox shown in Fig. S24.
Upon examining the diurnal patterns of the atomic ratios among the elements in the OA, we found that the O∕C and OM∕OC ratios exhibited similar patterns with bimodal patterns at 11:00 and 16:00, but the pattern of the H∕C ratio was different, peaking at 8:00 and 20:00 (Fig. 2a). This occurred because of the variations in the relative contributions of the POAs and SOAs. Additionally, the diurnal profile of the nitrogen-to-carbon ratio (N∕C) was similar to those of the O∕C and OM∕OC ratios but gradually increased overnight until 10:00, indicating that both primary and secondary factors might influence the N∕C ratio (Fig. 2a). Or this enhanced N∕C ratio overnight is possibly due to the nighttime reactions of amines with nitrate radicals (Silva et al., 2008; C. Chen et al., 2018), which can be further increased during fog events (Chen et al., 2016). High nighttime RH during this study (Fig. 7) further suggests the possibility of nighttime reaction of nitrogen-containing species. More investigations will be needed to confirm these nighttime processes in the SMA.
3.2.1 Investigation of the sources of OA
In this study, seven distinct OA factors were identified, including three types of POA (HOA, COA, and SFOA) and four types of SOAs (LO-OOA1, LO-OOA2, MO-OOA1, and MO-OOA2). These four different types of SOAs were distinguished based on the O∕C ratio, e.g., 0.59, 0.65, 0.99, and 1.11, but the features of their time series and diurnal patterns were also different (Fig. 2). The O∕C ratios for the HOA, COA, and SFOA were 0.1, 0.12, and 0.53, respectively. The four SOAs (59 %) account for the largest fraction of the OA mass, followed by the SFOA (17 %), COA (15 %), and HOA (9 %) (Fig. 2b).
Briefly, the HOA showed a typical picket fence fragmentation pattern, as commonly seen in freshly emitted vehicle OA, with major peaks at m∕z values of 41, 43, 55, and 57, which are mostly composed of , , , and , respectively (Fig. 2e). The HOA also exhibited strong correlations with tracer ions, i.e., (r=0.86), (r=0.80), (r=0.92), and (r=0.94) (Fig. 2l and Table 1). The fraction of the HOA to the total PM is 3 % (Fig. 1c), and the absolute concentration is 1.1 µg m−3, which is lower than the 2016 spring (2.21 µg m−3) (Kim et al., 2018) and 2016 winter measurements (1.92 µg m−3) (Kim et al., 2017). Because of the haze alert during the measurement period, vehicle emission control measures were implemented from 2 to 8 March. This might have influenced the decreased concentration of the HOA; however, further measurement and analysis would be needed to confirm the effectiveness of these control measures. However, the decreasing trend of the HOA suggests that the enhanced mass concentration during this measurement period is not formed by the accumulation of local sources. The average HOA∕BC ratio was 0.6, which is close to that for diesel trucks (0.5) (Ban-Weiss et al., 2008) but much lower than the ratio for light-duty vehicles (1.4). This probably occurs due to the impact of BC from solid fuel burning sources (SMA, winter, 0.58) (Kim et al., 2018). Generally, the HOA∕BC ratios observed in other large urban areas were close to those for light-duty vehicles when there were no other burning sources, e.g., Pittsburgh (1.41±0.22) (Zhang et al., 2005b), New York City (1.29) (Sun et al., 2011), and Mexico City (1.25) (Aiken et al., 2009); in contrast, the ratios in China and South Korea were between those for diesel and gasoline vehicles, e.g., Xianghe, China (0.91) (Sun et al., 2016b), and the SMA in spring (1.03) (Kim et al., 2018).
A COA factor was also resolved in the SMA. The COAs were characterized by ratios between f55 and f57 of the OA and increased proportionally with increasing fractional contribution of the COA to the total OA, thereby exhibiting a V shape with its two edges defined by the COA and HOA factors from several urban AMS data sets (Mohr et al., 2012) (Fig. S13). Additionally, the mass spectrum of the COA determined in this study was almost identical to the spectrum of the COA determined in the spring of 2016 at the same site (Figs. 2d and S14, respectively). Hence, the mass concentration of the COA is ∼2.1 µg m−3, which is similar to previous measurements at SMA (1.55 µg m−3 during the KORUS-AQ campaign in May 2016 and 2.47 µg m−3 during the 2015–2016 winter) (Kim et al., 2018), suggesting that cooking styles remained consistent, and local accumulation was not the major haze source during the measurement period (Fig. S14). Note that the mass fraction of the COA in total PM1 is lower in this study (6 %) compared to previous observations (e.g., 9 % in the winter and 7 % in the KORUS-AQ campaign) because of the enhanced total aerosol concentration during this period. The good correlation with the key tracer ions commonly used to justify the COA, such as C3H3O+ (; r=0.78), C3H5O+ (; r=0.61), C5H8O+ (; r=0.94), C6H10O+ (; r=0.98), and C7H12O+ (; r=0.85) (Fig. 2l and Table 1), and the diurnal pattern with a dinnertime peak (between ∼18:00 and 19:00) and a lunchtime peak (at ∼12:00), further confirm the source of the COA (Fig. 7) (Adhikary et al., 2010; Allan et al., 2010; Dall'Osto et al., 2013; Ge et al., 2012b; Hayes et al., 2013; He et al., 2004; Huang et al., 2010; Mohr et al., 2012, 2009; Sun et al., 2013; Young et al., 2016).
The SFOAs were found to be another important POA source (7 % of the total PM, Fig. 1c) in the SMA in March in addition to vehicle and cooking emissions. The mass spectrum of the SFOA showed typical features of biomass-burning OA (BBOA), with dominant peaks at and 73 and strong signals of oxygenated ions (: 34.7 % of the total SFOA signal; : 14.5 % of the total SFOA signal) (Fig. S15). Also, it showed the intense peak of the typical feature of coal-combustion OA (CCOA) at (mainly ), showing mixed characteristics of biomass burning and other fuel burning but not pure biomass-burning OA. Indeed, the time series of the SFOA correlated with biomass-burning tracers, i.e., (r=0.85), (r=0.74), potassium (r=0.63), the CHN family of ions such as C2H5N+ (r=0.59) and C3H7N+ (r=0.70), and BC (r=0.82), but it also exhibited a good correlation with Pb (r=0.60), PAH (r=0.75), and alkyl fragments ( and ), including (r=0.81), which were likely emitted from other burning activities, such as fossil-fuel combustion (Hu et al., 2013) (Table 1). Hence, when SFOA is combined with MO-OOA1, an SOA influenced by a burning event, the correlations with biomass-burning tracers were enhanced (e.g., (r=0.90), (r=0.86)), whereas the correlations with coal-burning tracers were decreased (e.g., PAH (r=0.51) and C9H5 (r=0.70)), implying that biomass-burning OA is probably separated into SFOA and MO-OOA1, and coal burning is significantly impacting on SFOA, which is further evidence of the mixture feature of SFOA during this study. Furthermore, the scatter plots of f44 versus f60 indicate high f60 and low f44 values (i.e., toward the center of the triangular area of the biomass-burning plumes) with increasing relative importance of biomass burning to the total OA (Fig. S13). The f44 and f60 values of the SFOA in this study were much higher than the values of the COA and HOA; in contrast, the f60 values of SFOA were somewhat lower than the previous BBOA values observed in the SMA (Kim et al., 2017), further verifying that the SFOAs are influenced by the impacts of other burning activities such as pulverized coal combustion (Wang et al., 2013). Furthermore, BBOA is typically prevalent at locations where wood is used for residential heating (Crippa et al., 2013; Ge et al., 2012a; Young et al., 2016); however, residential wood burning is not the main heating source in the SMA. For these reasons, this factor was indicated as part of the SFOA and not purely BBOA. Given that the polar plot of the SFOA revealed high concentrations at both low and high WSs (Fig. S17), the sources of the SFOA in the SMA likely include both local and regional burning activities. The local burning activities possibly occurred for the purposes of open and public area heating (e.g., construction areas and markets), disposal of leaves and woody trash in the city, and residential heating, which can include all types of burning. The regional sources of the SFOA are possibly the open biomass-burning activities in the agricultural areas near Seoul (Heo et al., 2009) and the transport emissions from North Korea or farther away from Mongolia (Jung et al., 2016), where biomass and coal burning is a major heating source during the cold season (Batmunkh et al., 2013; Jung et al., 2010). Indeed, back-trajectory analysis indicated a high fraction of the SFOA in the plumes originating from the north, including North Korea and the Mongolian region (Fig. 1d). The more oxidized features compared to those of the BBOA observed in the SMA (O∕C ratio, i.e., 0.53 vs. 0.34 (Kim et al., 2017) further support that there is some influence of regional transport (Fig. 2f).
In addition to the three POA factors, four SOAs were identified as accounting for an average of 59 % of the OA mass (Fig. 2b), with LO-OOA1, LO-OOA2, MO-OOA1, and MO-OOA2 contributing 16 %, 14 %, 17 %, and 12 %, respectively. They contained major ion fragments representative of oxidized organics, e.g., (m∕z 44) and C2H3O+ (m∕z 43) (Fig. 2g–j). MO-OOA2 (O∕C =1.11; H∕C =1.32) and MO-OOA1 (O∕C =0.99; H∕C =1.56) (Fig. 2g and h) reside within the region representing aged and highly oxidized SOAs in the triangle plot (Fig. S13), whereas LO-OOA1 (O∕C =0.59; H∕C =1.61) and LO-OOA2 (O∕C =0.65; H∕C =1.62) (Fig. 2i and j) are characterized by a low O∕C ratio (Fig. 2), residing within the region representing fresher SOAs in the triangle plot (Fig. S13).
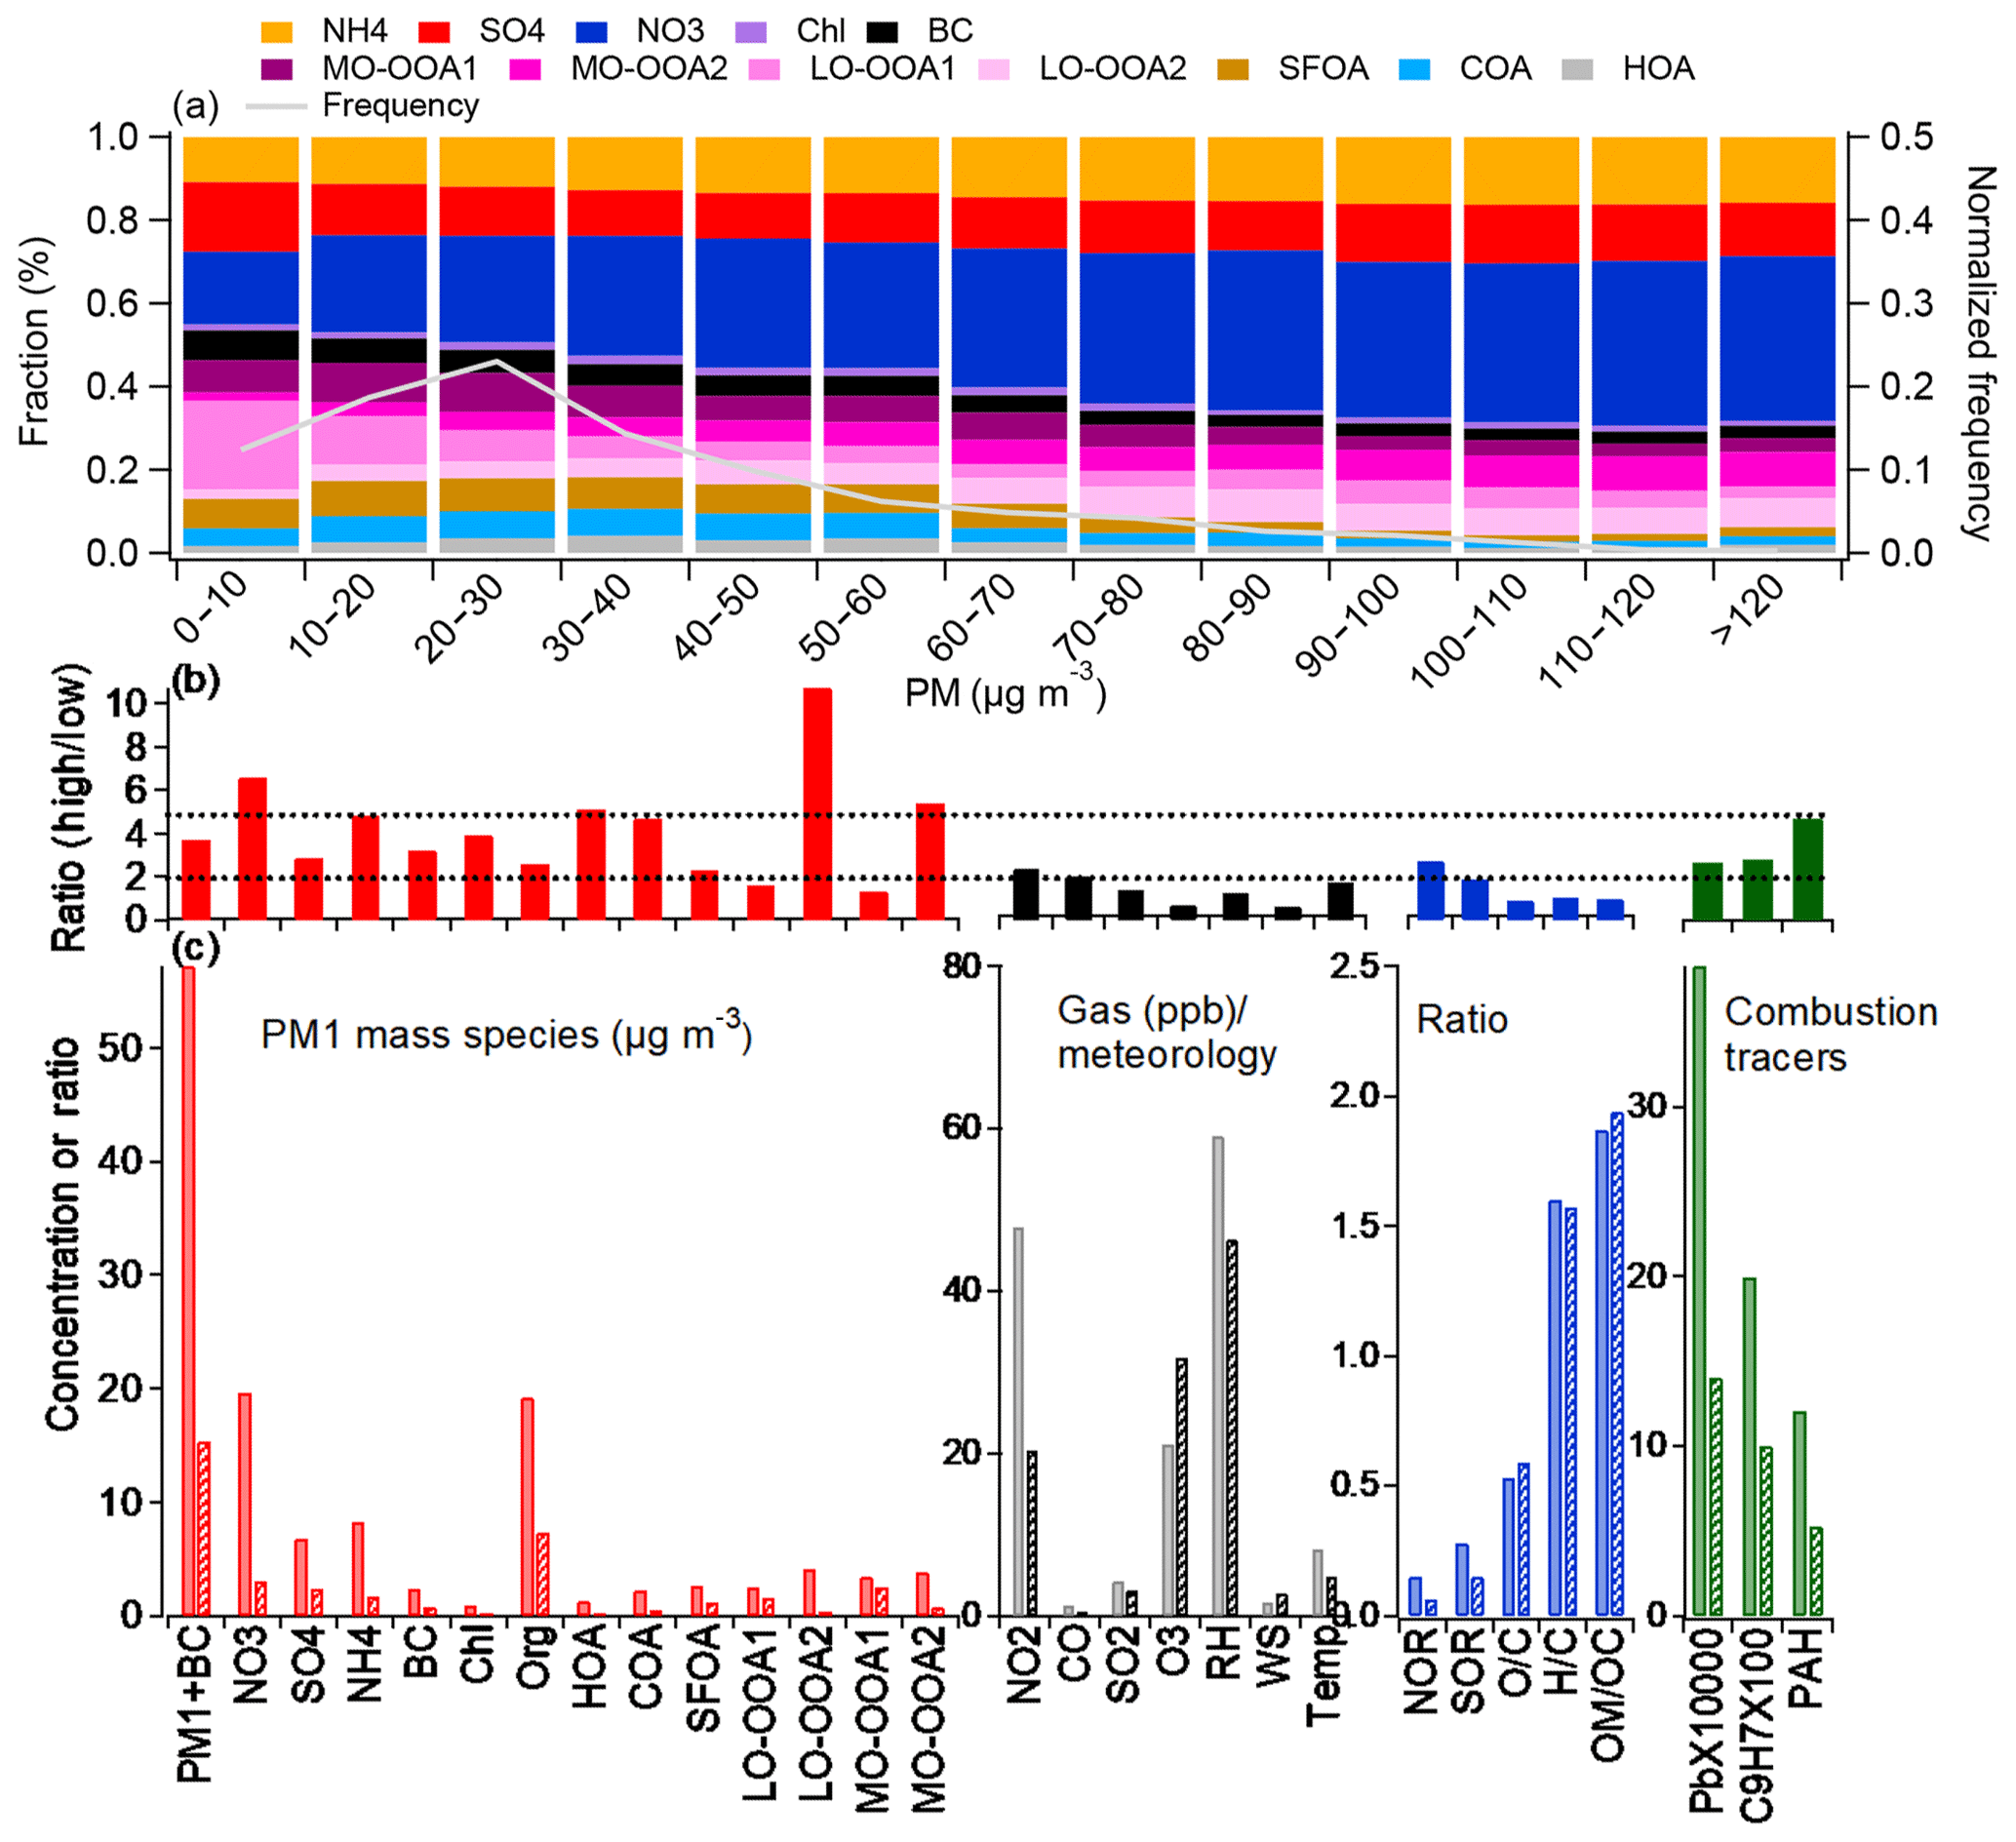
Figure 4(a) Variation in the PM1+BC composition as a function of the PM1+BC mass concentration during the entire period. The probabilities of the PM1 mass during the study period are also shown on the right axis; (b) the ratios of the absolute concentration of PM1, gaseous species, meteorological parameters, and the ratios of tracers during haze and clean periods; (c) comparison of the averaged absolute concentrations of the PM1 species, gaseous pollutants, meteorological parameters, ratios, and combustion tracers during the haze (solid) and clean periods (pattern). The dotted lines in Fig. 1b are a guide for the eye.

Figure 5Overview of the chemical composition of the submicron aerosols at the Korea Institute of Science and Technology (KIST) in the SMA and Beijing from 28 February to 16 March 2019, including two haze episodes: (a) time series of the wind direction (WD), with the colors showing the different wind speeds (WSs) in the SMA; (b) time series of PM1+BC in the SMA and of PM1 in Beijing; (c) time series of ammonium () in the SMA and Beijing; (d) time series of sulfate (SO4) in the SMA and Beijing; (e) time series of nitrate () in the SMA and Beijing; (f) time series of the organic and stacked contributions of the sources of the OA in the SMA and Beijing. Note that the time series of each species in Beijing is modified to KST based on Beijing time.
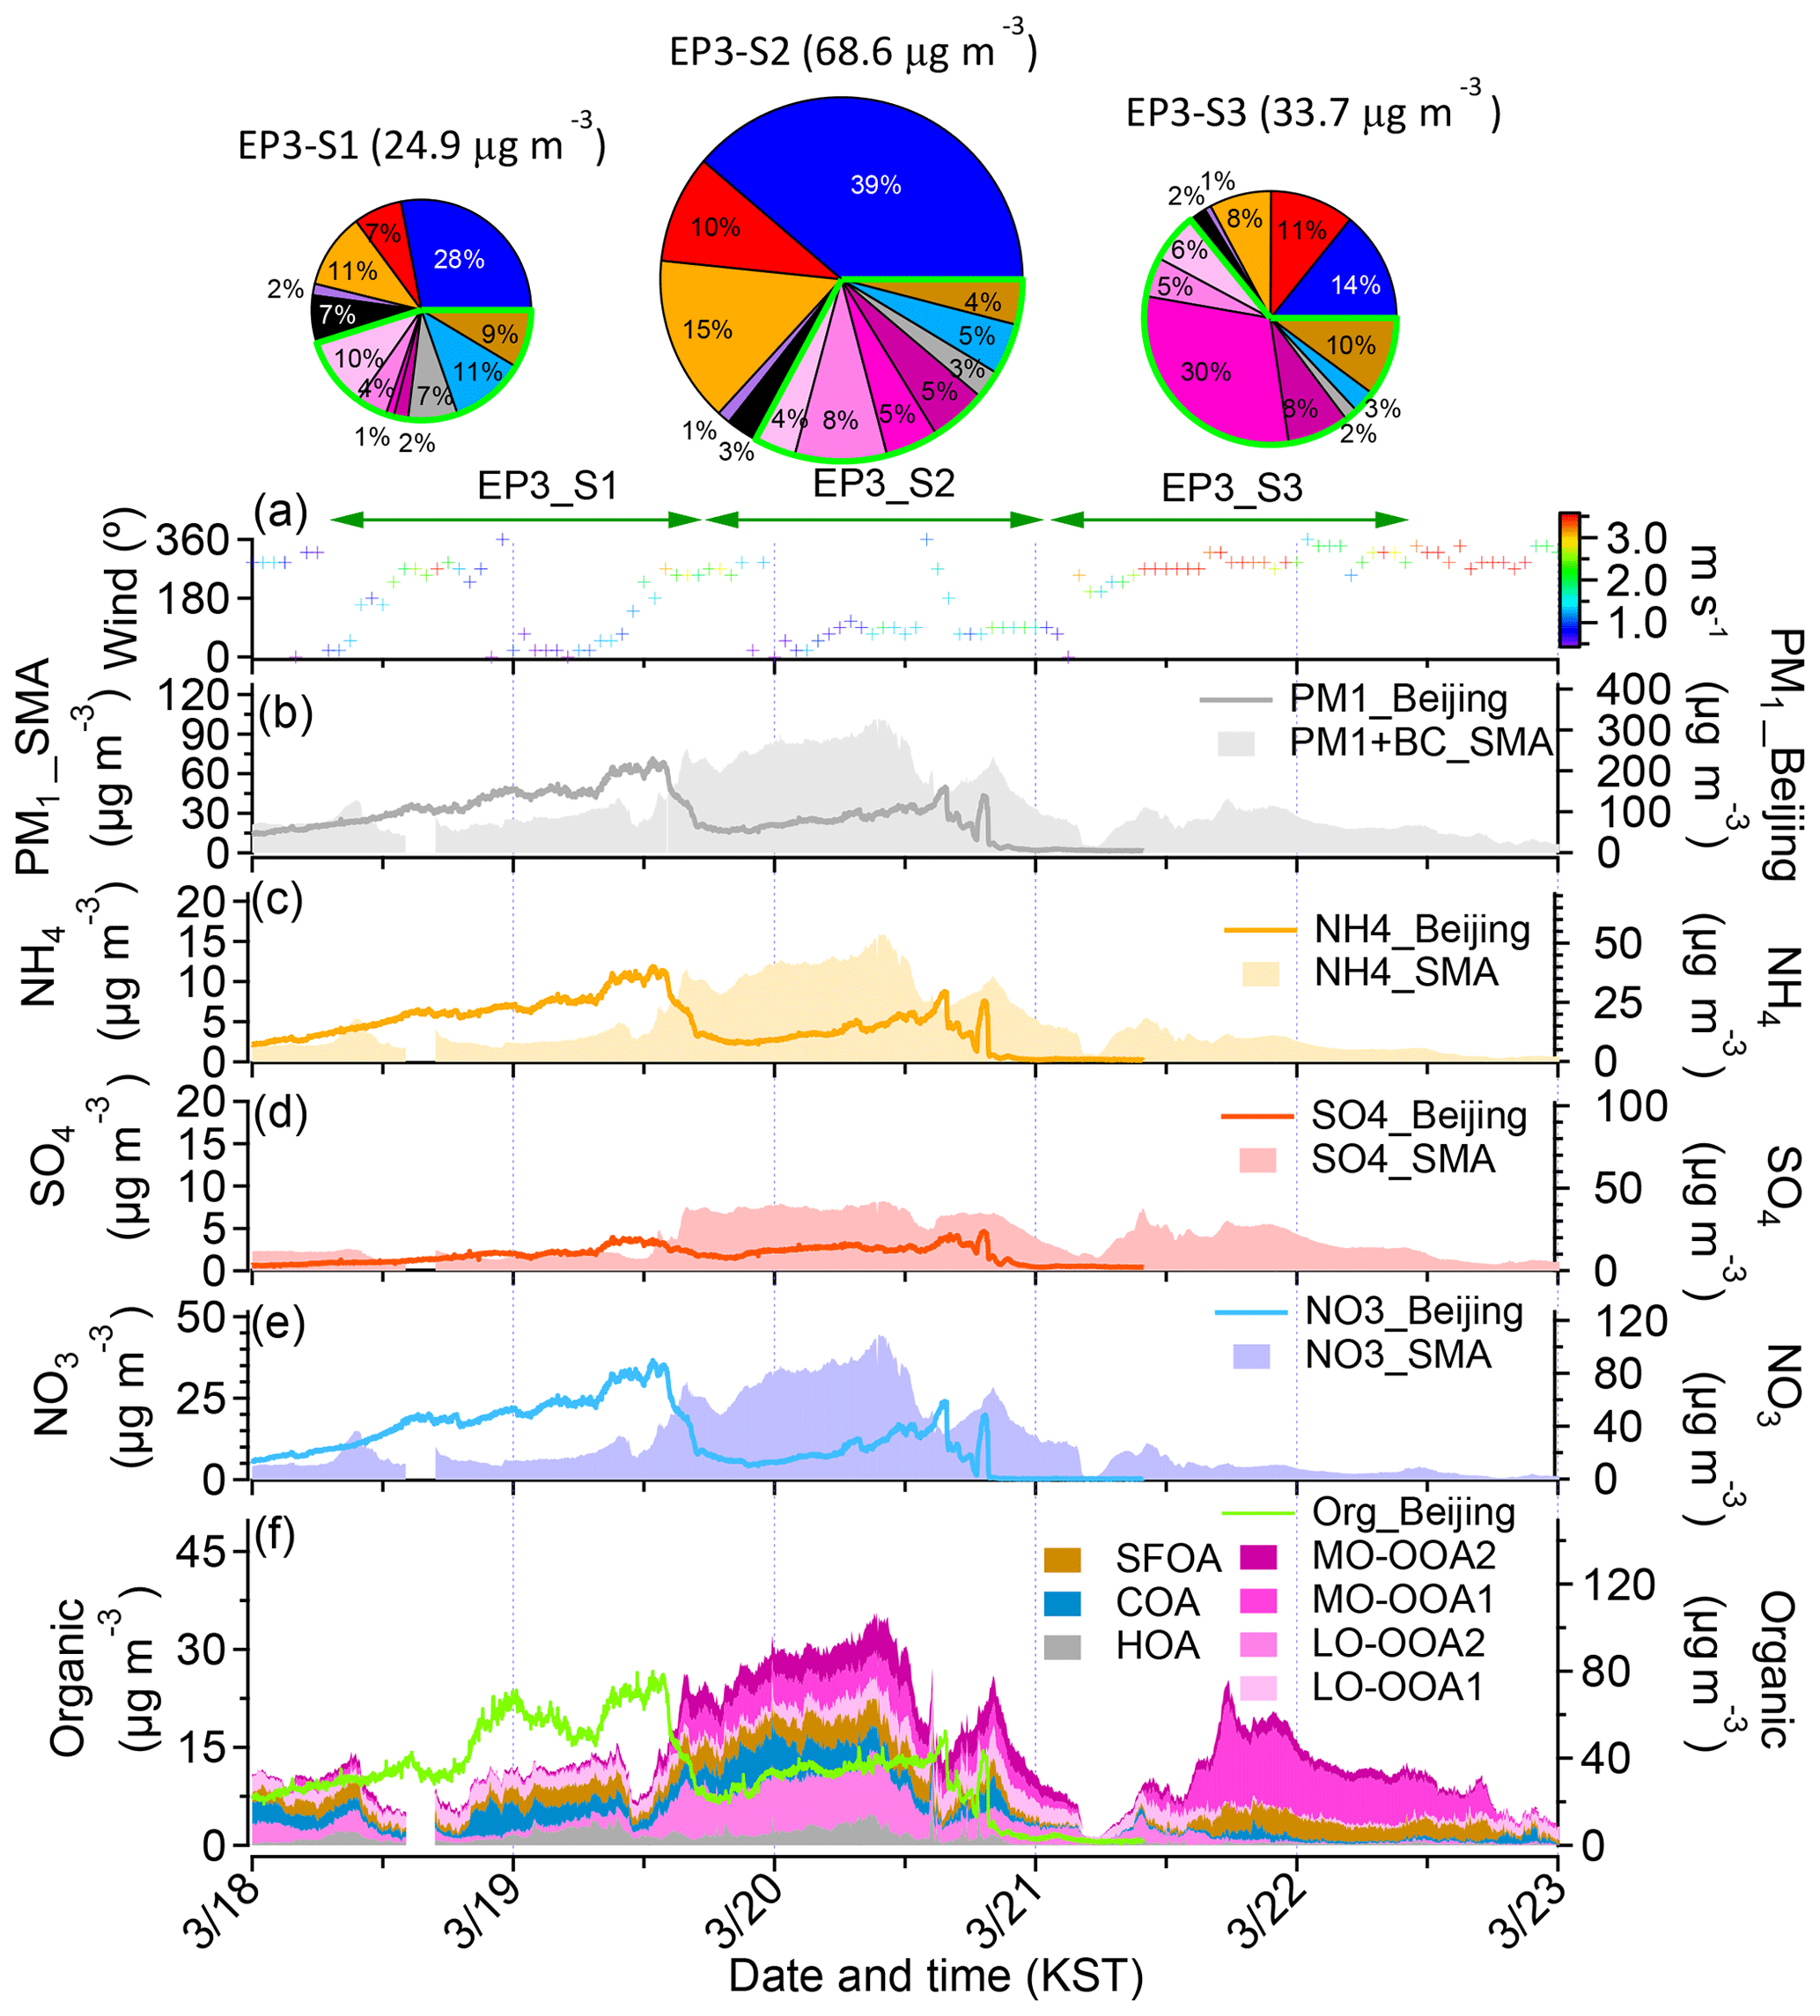
Figure 6Overview of the chemical composition of the submicron aerosols at the Korea Institute of Science and Technology (KIST) in the SMA and Beijing from 18 to 23 March 2019, including one haze episode: (a) time series of the wind direction (WD), with the colors showing the different wind speeds (WSs) in the SMA; (b) time series of PM1+BC in the SMA and of PM1 in Beijing; (c) time series of ammonium () in the SMA and Beijing; (d) time series of sulfate (SO4) in the SMA and Beijing; (e) time series of nitrate () in the SMA and Beijing; (f) time series of the organic and stacked contributions of the sources of the OA in the SMA and Beijing. Note that the time series of each species in Beijing is modified to KST from Beijing time.
Both MO-OOA2 and LO-OOA2 were identified as regional-transport-influenced SOAs (RSOAs). These RSOAs were identified first in the SMA. Among the two RSOAs, the mass spectrum of MO-OOA2 (Fig. 2g) is similar to the mass spectrum of the RSOA determined by Sun et al. (2014) in China and of fulvic acid by Zhang et al. (2005a) with an intense CO2 peak. However, the mass spectrum of LO-OOA2 (Fig. 2n and o) is somewhat different from the mass spectrum of RSOA (Sun et al., 2014). However, we suggest that both MO-OOA2 and LO-OOA2 are RSOAs since the time series of both MO-OOA2 and LO-OOA2 are notably correlated (r=0.72) (Table 1 and Fig. S18), and they were characterized by a high peak during the haze episode, which differed from the other two SOA factors, i.e., MO-OOA1 and LO-OOA1 (Fig. 2p and q). Compared to the clean period, the averaged RSOA (LO-OOA2+MO-OOA2) concentration during the three haze episodes had increased by a factor of ∼8 (Figs. 2, 5, 6, and Table 2). Both RSOAs were suitably correlated with NO3, SO4, and CO2 (Table 1). It should be noted that compared to MO-OOA1 (vs NO3: 0.33; vs. SO4: 0.39) and LO-OOA1 (vs NO3: r=0.52; vs. SO4: r=0.62), NO3 and SO4 correlated better with the RSOA (MO-OOA2 vs. NO3: r=0.62; MO-OOA2 vs. SO4: r=0.75; LO-OOA2 vs. NO3: 0.89; LO-OOA2 vs. SO4: 0.75), suggesting that the RSOA had similar features to those of NO3 and SO4 (Table 1). It should be noted that NO3 and SO4 exhibited regional-transport features in this study. Hence the correlations of major ions with MO-OOA2+LO-OOA2 (= RSOA) (RSOAs vs. NO3: r=0.96; RSOA vs. SO4: r=0.89) are higher than each MO-OOA2 and LO-OOA2, further confirming that both factors have similar regional-transport features (Table 1). The diurnal patterns are also similar to the shapes of NO3 and SO4, with peaks in the early morning (∼08:00), because the high concentration transported during the night in the upper layer influences the ground after the BL dissipates and the concentration is diluted by the enhanced mixing height. Thereafter, at night, the decreased mixing height enhances the surface concentration (Fig. 7). The influence of regional transport is further supported by the good correlation with Pb (MO-OOA2: r=0.73; LO-OOA2: r=0.62; RSOA: r=0.73) and C9H7 (MO-OOA2: r=0.49; LO-OOA2: r=0.47; RSOA: r=0.52), which are tracers of coal combustion (Elser et al., 2016; Hu et al., 2013; Sun et al., 2016a; Xu et al., 2016), but the SMA is not a major source region of coal combustion. Generally, most alkyl fragments ( and ) do not exhibit a good correlation with SOAs. Moreover, only C9H7 shows a moderate correlation (Table 1). This would be possible if they occur in the same regionally transported plumes. The difference between the two RSOA is revealed by the mass spectra: MO-OOA2 compounds are more oxidized than LO-OOA2 (O∕C, 1.11 vs. 0.65) and exhibit a higher N∕C ratio (0.084 vs. 0.017). Additionally, MO-OOA2 had a better correlation with methane sulfonic acid (MSA)-related species (e.g., (r=0.75), (r=0.73), and (r=0.72)) (Table 1). Because a high N∕C ratio and notable MSA formation would occur in secondary formation processes, the post chemical processing occurring after transport might influence the different features. Conversely, the initial source would be the same but the status (e.g., particles vs. precursors or the mixing and oxidation states) during transport would be different, although this remains unclear at this point. Since the impact of transport was dominant, it is likely that local processing and/or different source features were not pronounced.
Table 2Comparison of the aerosol properties and meteorological parameters between the high- and low-loading periods.
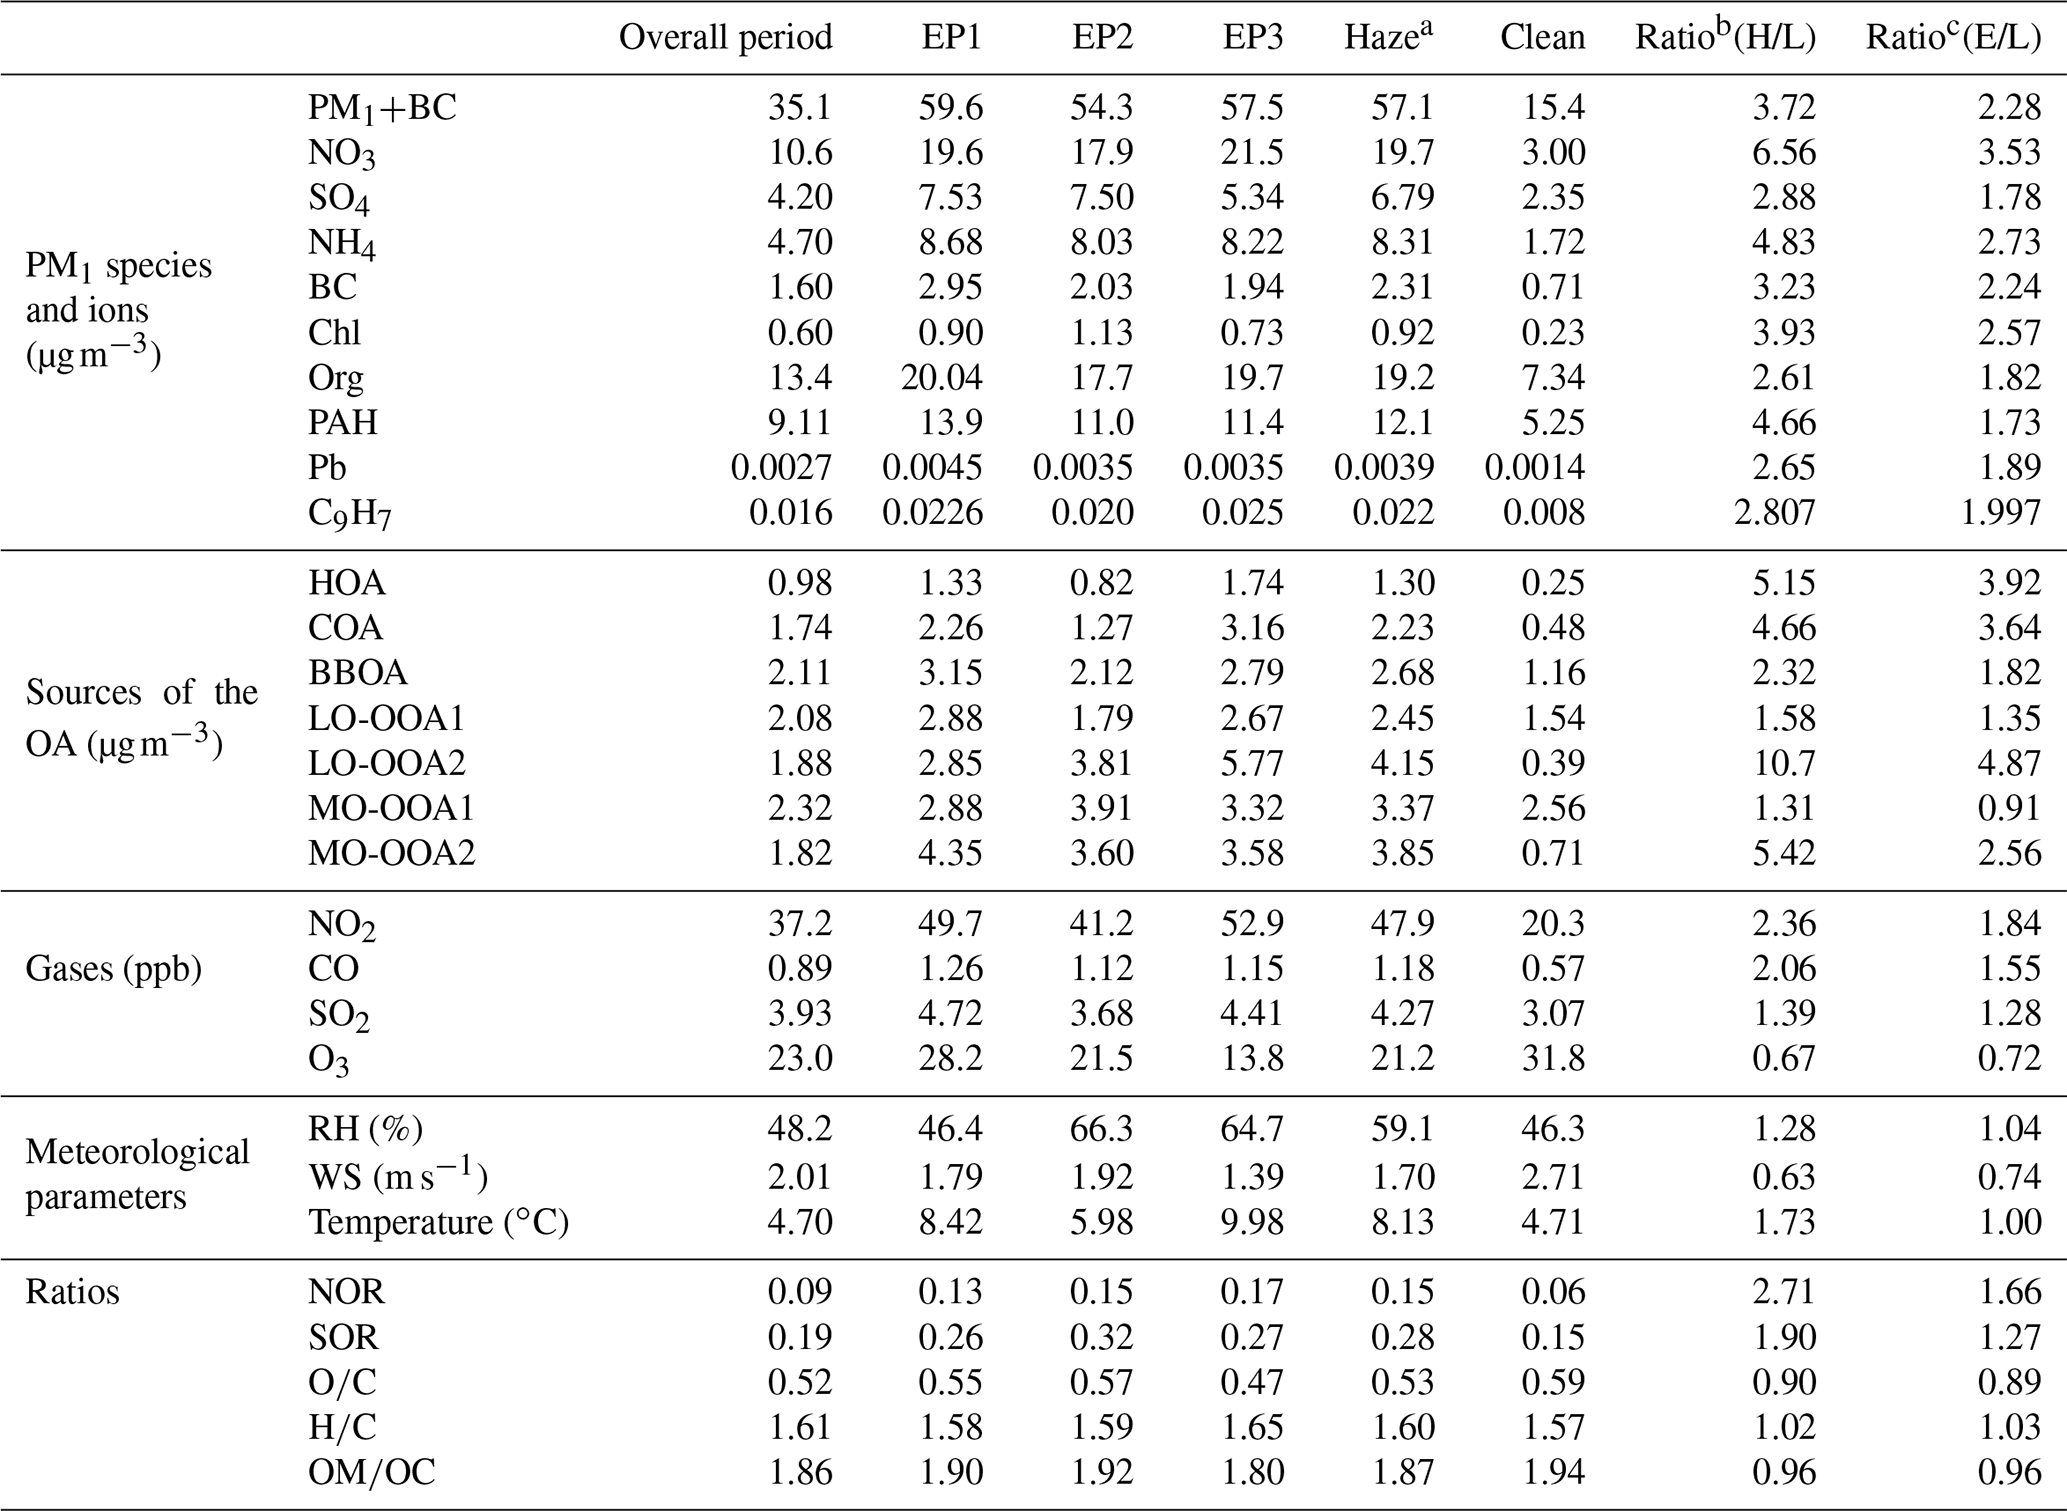
a Averaged concentration during three haze episodes (EP1, EP2, EP3). b Ratios of haze to clean period. c Ratios of overall to clean period.
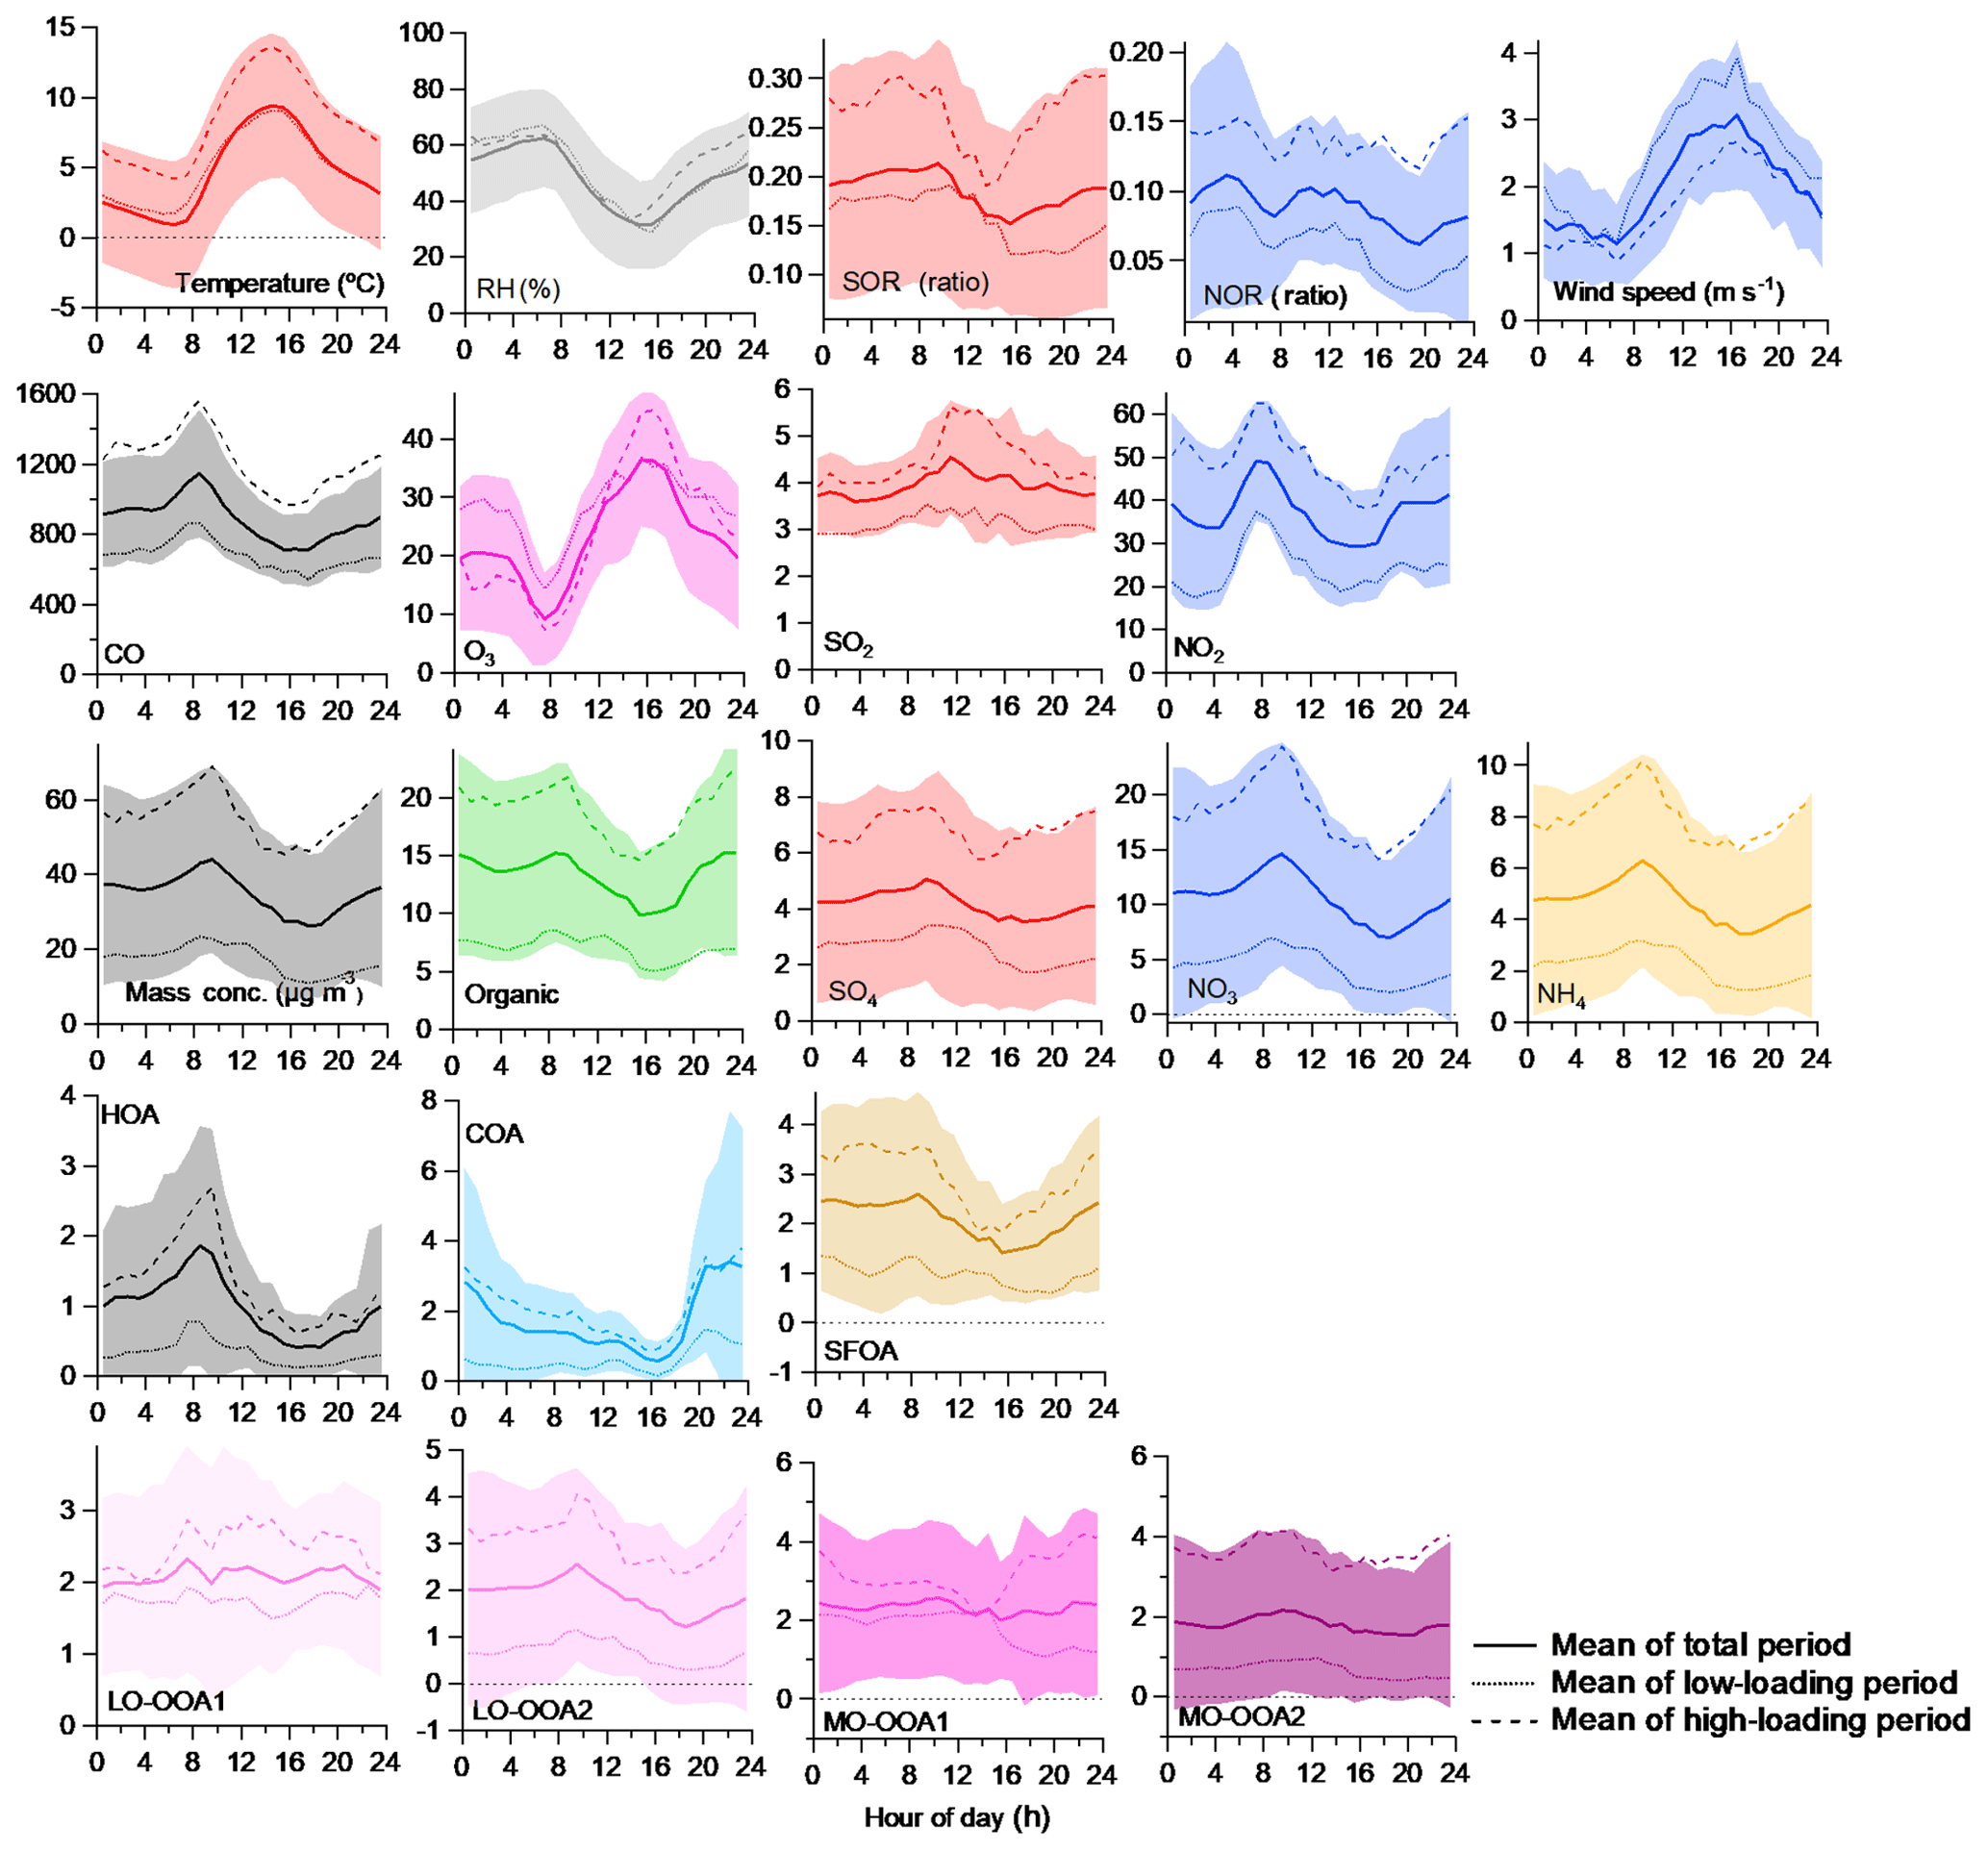
Figure 7Comparison of the 1 h averaged diurnal profiles for the various meteorological parameters (top row), gas-phase species (second row from the top), PM1 species (third row), primary OA (fourth row), and secondary OA (fifth row) between the high- (haze) and low-loading (clean) periods. The solid line and shaded area indicate the mean ± SD. The dotted line indicates the low-loading (clean) period and the dashed line indicates the high-loading (haze) period.
Compared to the RSOA, the two other SOA factors, namely, MO-OOA1 and LO-OOA1, exhibited different mass spectra, time variations, and diurnal patterns (Figs. 2 and 7). These two factors exhibited time-dependent features, revealing that LO-OOA1 compounds were enhanced during the first haze episode (5–8 March ), whereas MO-OOA1 compounds were enhanced from 21 to 23 March. Compared to the RSOA, both of these factors were less correlated with the SOA tracers, such as NO3, SO4, , and C2H3O+, but they still exhibited a moderate correlation (Table 1). This lower correlation might be due to the time-dependent feature of the factors not the generally formed factor throughout the measurement period. These two factors had the following typical features. First, the diurnal profile of LO-OOA1 during the overall period was mostly flat, but a slight increase was observed starting at 06:00 to 12.5 µg m−3 at 17:00 (Fig. 7) during the haze period (5–8 March), indicating photochemical production of LO-OOA1 during the daytime. A decreasing trend was observed at 09:00, likely due to local dilution when the mixing height was enhanced. Thus, this factor seems to be due to the locally formed SOAs during the haze episode (Sect. 3.3.2), although the very high impacts of regional transport masked the local formation of secondary species. In contrast to LO-OOA1, MO-OOA1, with a pronounced time series on approximately 22 March, showed a moderate correlation with biomass-burning tracers such as (r=0.69) and (r=0.65). A moderate correlation was also exhibited with the SOA tracers, e.g., (r=0.67) and C2H3O+ (r=0.63), while a poor correlation occurred with NO3 (r=0.33) and SO4 (r=0.39) (Table 1), suggesting that this factor has secondary features but is influenced by burning sources. Indeed, MO-OOA1 compounds contribute 29.7 % and 26.5 %, respectively, to the biomass-burning signal of () and () sharing with SFOA (32.9 % and 26.6 %, respectively) (Fig. S16). Furthermore, we also observed that the evolution of MO-OOA1 and SFOAs appeared to be intrinsically linked. Overall, diurnal patterns of both MO-OOA1 and SFOA appeared similar during the high-loading period, i.e., high during the night and low during the afternoon, but a small afternoon peak of MO-OOA1 was observed (Fig. 7). This indicates that MO-OOA1 compounds are the SOAs formed by the impacts of the burning activities on 22 March. The similarity of these two sources is further supported by the CPF plots of MO-OOA1 and SFOAs, revealing that the high concentrations from the northeast are unlikely to be associated with the other SOAs, mostly from the southwest (Fig. S17).
3.3 Investigation of the sources and evolution processes of the severe haze episodes
3.3.1 General description of the haze episode
PM1 composition changed substantially as a function of the mass concentration throughout the measurement period (Fig. 4a). NO3 was the most notable contributor to the PM, especially at high loadings. As PM1+BC increased, the fractions of NO3, MO-OOA2, and LO-OOA2 continuously increased, while the POA fraction decreased. As discussed in the previous section, these three species (NO3, MO-OOA2, and LO-OOA2) were found to be all influenced by regional transport. Hence, the results shown here verify the notable role of regional impacts in the formation of haze pollution.
Comparing the high- and low-loading periods can indicate how the different sources and atmospheric processes influence haze pollution in more detail (Fig. 4b and c). The aerosol composition was different between the high- and low-loading periods, and the average concentrations of all aerosol components and sources of the OA were 1.31–10.7 times higher during the high-loading periods than those during the low-loading periods (Table 2, Figs. 4 and S11). The ratios of the PM species between the haze and clean periods varied in the order of NO3, NH4, Chl, SO4, and organic matter, although the organic matter was contributed by a mixture of seven different sources. Separating the organic sources, LO-OOA2 showed the highest enhancement with a factor of 10.7, followed by NO3 and MO-OOA2 at factors of 6.5 and 5.4, respectively (Table 2, Fig. 4b). In the previous section, these three species are all influenced by regional transport. Hence, the results shown here support the notable role of regional impacts in the formation of haze pollution. Note that HOA and COA, which are locally emitted OAs also showed the enhancement with a factor of 5.2 and 4.7, respectively, indicating that not only regional impacts but also local accumulation might impact on the haze episode. However, relatively higher ratios between overall and low-loading periods (Table 2) suggest that lower concentrations during the clean period also possibly enhance the ratio between high- and low-loading periods. Details on the haze evolution will be discussed in Sect. 2.
The NO3 enhancement during the haze period has also been previously observed (Kim et al., 2017), which occurred mainly due to local accumulation under stagnant conditions. However, the latter is likely not the major or only reason for the haze in this case because of the accompanied enhancement in the ratio of the other regional sources, such as LO-OOA2 and MO-OOA2. Their enhancement factors were 10.7 and 5.4 (Figs. 4 and S11), respectively, which are considerably higher than those of the local sources, e.g., the HOA and COA, thereby indicating the role of regional transport in the formation of the haze episodes. The low correlation of the RH vs. NO3 (r=0.40) and vs. NOR (r=0.48) excludes the aqueous-phase formation of NO3 during the haze period (Fig. S9). For these reasons, NO3 enhancement could be caused by regional transport and not only by local formation, although it is not clear what the phase state of NO3 (e.g., a precursor of NO and/or NO3) is during transport. Since ammonium nitrate is a semivolatile compound, it can continuously evaporate and condense on the co-emitted particles while they are transported. The back trajectories in Fig. 1 further show that the air masses originating from northern China passing over the Yellow Sea (cluster 1) showed the highest PM concentration with a high fraction of NO3, thus supporting that a high loading is associated with the long-distance transport of air masses (Fig. 1). However, this does not mean that local sources do not play any role in haze formation. As shown in Fig. 4 and Table 2, during the haze period, the ratio of the local sources such as the HOA and COA was also enhanced. This enhancement could be because of the relatively lower concentration during the low-loading period (a high total to low ratio, Table 2), but this also indicates a local contribution to haze formation. Investigating the temporal evolution of haze in Sect. 3.3.2 will provide a better understanding of how regional transport and local accumulation influence haze formation.
It has already been found that SO4 can be attributed to regional sources in the SMA (Kim et al., 2017, 2018), although its relative enhancement ratio during the haze periods in this study is lower than that of NO3. This is consistent with recent studies conducted in China (G. Chen et al., 2018; Fontes et al., 2017). Due to the emission control measures of coal combustion, NO3 is becoming increasingly important in the occurrence of severe haze episodes (Xu et al., 2019). Given that the nitrate enhancement was substantial during the Beijing haze periods (reaching above 400 µg m−3 during the first haze episode, Fig. 5), there might be a more notable influence of NO3 and precursors from the upwind areas, thus more notably enhancing the NO3 concentration in the downwind areas, i.e., in the SMA. In accordance with the current emission control policies in China, SO4 and SO2 did not drastically change between the high- and low-loading periods, compared to NO3 (Fig. 4 and Table 2).
3.3.2 Chemical evolution of the haze episode
Figure 5 reveals that all compounds, such as NO3, SO4, NH4, and organic compounds, attained peak values in the order of Beijing (line) to the SMA (filled) over approximately 2 d, thereby verifying the impacts of transport on haze formation in the SMA. The forward trajectory from Beijing during that time (Fig. S19) indicates that approximately 2 d are required for the Beijing plumes to arrive in the SMA, which coincides with the time gap shown in Fig. 5. The three severe haze periods occurred with clean periods in between (Fig. S8), and each haze episode was categorized into three different stages, i.e., S1, S2, and S3, where S1 is when Beijing haze developed, S2 is then both SMA and Beijing are under a haze period, and S3 is after the Beijing haze period, although their haze features are somewhat different. In each figure and relevant discussions, haze stage is denoted followed by the haze event, i.e., EP1-S1, EP1-S2, etc. As shown in Fig. 5, for the first haze episode (EP1), during S1, when Beijing experienced a haze period, the SMA also experienced a haze period. Hence, all submicron aerosol species substantially increased, suggesting that not only regional transport but also local accumulation impacted haze formation, while the local winds were moderate (1.7 m s−1). If the SMA was subject to dynamic conditions, even if regional transport impact occurred, pollutants could be diluted. However, this was not the case; therefore, the transported species were trapped, and local primary pollutants also accumulated, thereby intensifying the haze event, similar to the case observed during the KORUS-AQ campaign (Kim et al., 2018). Additionally, the regional-scale meteorology, such as that depicted in the Moderate Resolution Imaging Spectroradiometer (MODIS) satellite image in Fig. S20, indicated that all East Asian countries experienced severe haze conditions that moved slowly from west to east, thereby transporting upwind regional pollutants, such as NO3, SO4, LO-OOA2, and MO-OOA2. Under regional movement, local accumulation also likely occurred. In contrast, the S2 stage is different, which is categorized as the time after the Beijing haze period had ended. Even after S1, when the Beijing PM concentration decreased, the SMA PM concentration remained high and even exceeded that in S1 (55.1 vs. 74.5 µg m−3). Furthermore, unlike S1, the overall fractions of the regional species of NO3 (32 % vs. 35 %), SO4 (11 vs. 16 %), and RSOA (MO-OOA2 and LO-OOA2) (12 % vs. 13 %) were enhanced, while the POA (e.g., HOA, COA, and SFOAs) fraction considerably decreased from 15 % to 7 %, which implies almost no local source impact on the haze formation (Fig. 5) during that period, coinciding with the vehicle control period, from 2 to 8 March (intensive vehicle control such as class 5 vehicle control from 4 to 6 March). The enhancement of the mass concentration, in addition to the concentration decrease of local sources, suggests that regional transport likely was the major reason for the large enhancement. Approximately 2 d were required for transport from Beijing to the SMA. Hence, even though the haze period had ended in Beijing, it could still influence the SMA in approximately 2 d. The stronger wind (2.0 vs. 1.7 m s−1) from the west also supports the impact of transport as well as the dilution effect on local sources. Dry conditions inhibit the impact of local aqueous-phase formation of NO3. Indeed, the MODIS satellite image in Fig. S20 shows the successive regional transport of the plumes from west to east; the haze in both Beijing and SMA during S1 arrived at the SMA during S2, while Beijing became clean after the plume left (S3). For these reasons, it appears that the regional meteorology plays an important role in causing the high-PM pollution conditions in the SMA.
A similar trend was observed for the second haze episode (EP2), although no haze was observed when Beijing experienced haze (S1); thus, a relatively short haze event was developed (Fig. 5). The main reason for this was that when the Beijing haze event had developed, in contrast to the first haze event, a strong north wind occurred, which likely inhibited transport from northern China as well as the accumulation of pollutants. However, the wind direction changed to the west again, and the SMA haze episode occurred within 2 d after the Beijing haze episode occurred. Similar but more extreme chemical composition change trends were observed. The observed haze event after the Beijing haze event had disappeared (S2) exhibited a lower fraction of POAs (34 % vs. 10 %) but a higher fraction of regional sources such as RSOA (8 % vs. 12 %), NO3 (25 % vs. 33 %), and SO4 (5 % vs. 14 %) than those during S1 with the enhancement of the mass concentration from 29 to 54.9 µg m−3, thereby strongly supporting the regional impacts on haze formation. Compared to the first haze event, a relatively short haze event occurred without the impact of stagnant conditions on haze development.
Finally, the third haze episode (EP3) also revealed a similar trend, but an SMA-only haze period did not occur after the Beijing haze had arrived in the SMA since the SMA and Beijing haze events occurred almost simultaneously (but haze still develops successively from Beijing to the SMA) (Fig. 6). Additionally, immediately after the haze period in the SMA, a strong NW wind occurred, which possibly decreased the PM concentration in the SMA. Although an SMA-only haze was not observed, we can still identify the impacts of regional transport during the non-haze period (S3). The PM concentration in Beijing started to increase on 18 March when no haze was observed in the SMA (S1), while the SMA haze started to intensify starting on 19 March 12:00 (S2). A lower fraction of the POAs (27 % vs. 12 %) and a higher fraction of regional sources, i.e., RSOA (6 % vs. 13 %), NO3 (28 % vs. 39 %), and SO4 (7 % vs. 10 %), compared to those during S1, were observed during S2 with the mass concentration increasing from 24.0 to 68.6 µg m−3, suggesting regional impacts on haze formation, which is consistent with the pattern of the previous EP1 and EP2 episodes. However, the winds weakened during this period, and stagnant conditions likely also impacted haze formation, as was the case in S2 of EP1. This haze event disappeared due to the strong winds. Hence, there are no regional impact-only haze periods, based on EP1 and EP2. In contrast, during this period, with strong winds from the north, there was an enhancement of the burning-related source, i.e., MO-OOA1 (Sect. 3.2.1), suggesting that the aged burning plums in remote regions might influence measurements during this period.
3.3.3 Diurnal patterns of the PM1 composition during haze
Diurnal patterns can provide insights into aerosol sources and formation processes. Throughout the entire study period, the average daily variations in the concentration of the aerosol species revealed similar patterns among the different species, peaking at approximately 10:00 (Fig. 7). This is the influence of the more polluted plumes from the upper layer to the bottom layer as the ground temperature increased. More polluted upper-layer plumes could be formed during the night by chemical processes and/or transportation. However, under similar meteorological conditions among the high-loading, low-loading, and overall periods (Figs. 7a, b, S21, and S22), transportation is more likely rather than nighttime chemical formation. Thus, the enhanced peak at this time (∼10:00) for all species suggests that there are notable impacts of regional transport on the PM concentration, and this strong impact masks the local formation processes. In an effort to understand the typical features of the high-loading period and the general PM formation processes, we investigated the diurnal patterns separately among the different periods (overall, low-loading, and high-loading periods) for each species and source (Fig. 7). Here, the high- and low-loading periods are highlighted in Fig. S8 and are consistent with the periods described in Sect. 3.3.2.
In the case of NO3 (Figs. 7 and S21), during the overall period, the daily variations gradually increased overnight, peaked at 10:00, and then slowly decreased until 17:00, similar to the KORUS-AQ campaign in May 2016, although the overall background concentration was enhanced by a factor of 2 during the overall period and by a factor of 3 during the high-loading period. The peak at 10:00 is attributed to down-mixing of the secondary aerosols formed at night in the residual layer aloft, in addition to those generated via photochemical formation of the nitrate from NOx, emitted from the rush hour traffic period. The decreasing trend of NO3 over the afternoon likely occurs due to the evaporative loss of semivolatile species at high air temperatures as well as the dilution effects due to the enhanced BL height in the afternoon (Lee et al., 2019a, b). Given that somewhat high concentrations of O3 (∼20.0 ppb) and NO2 (∼40 ppb) were observed during the night (18:00–06:00), nitrate formation from N2O5 hydrolysis possibly occurred, and a shallow mixing height possibly increased the concentration as well. Similar trends were observed among the overall, low-loading, and high-loading periods, but their ranges are different: during the low-loading period, the concentration ranged from 2 to 6 µg m−3, whereas it ranged from 14–23 µg m−3 during the high-loading period. During the three different periods, due to the meteorological conditions, slightly higher RH and solar radiation levels were measured. The poor correlation of NOR with RH (r=0.54) excludes the possibility of the aqueous-phase processing effect on NO3 formation during the high-loading period (Fig. S9). Moreover, higher temperatures and WSs were observed during the high-loading period, and these conditions inhibited local accumulation and formation of NO3. As discussed in Sect. 3.3.1, this would suggest that the NO3 enhancement during the high-loading period can more likely be attributed to regional transport than to local formation. The enhanced NOx, O3, and N2O5 levels suggest that both NO3 and its precursors could be transported (Figs. 7 and S21). Alternatively, under similar meteorological conditions, the enhanced NOR level suggests that NO3 itself can be transported. More measurements and analyses are required to understand the nitrate phase during transport.
The diurnal trends of SO4 are similar to those of NO3 (Fig. 7), and similar trends but different concentration ranges were observed among the overall and low- and high-loading periods (Figs. 7 and S22). The concentration was elevated during the nighttime, increased from the late afternoon (∼16:00), peaked from approximately 09:00 to 0:00 on the following day, and then gradually decreased thereafter to a minimum value at 16:00 (Fig. 7). The peak at 10:00 appeared to be due to a similar reason as that for NO3 – down-mixing of the high SO4 concentration in the upper residual layer formed at night. Unlike NO3, during the high-loading period, the increase in SO4 started earlier (13:00) than in the overall period (17:00), which appeared to be associated with the enhanced gas-to-particle partitioning of SO2 and/or aqueous-phase processing facilitated by the relatively higher RH (Fig. 7b). Compared to the overall period (r=0.67), the better correlation between SOR and RH (r=0.75) during the high-loading period supports the possibility of an enhanced aqueous-phase reaction impact on SO4 formation (Fig. S10). The high SO2 concentrations during the high-loading period would contribute to the formation of SO4. Indeed, the precursor enhancement was more pronounced during the high-loading period than during the overall period, probably because strong impacts of regional transport occurred and SO2 mostly depended on regional sources, while NO2 depended on both local and regional sources. Due to the major impact of regional transport during the high-loading period, more notable diurnal variations were observed than those observed during the low-loading period. The enhanced background concentration of CO (Fig. 7) further supports the impacts of transport on this enhancement. The bivariate polar plots (Fig. S17) indicate that a high SO2 concentration tended to occur under high-speed winds from the south and southeast directions, which shifted relative to the locations of the SO2 point sources, thus suggesting that the industrial facilities located on the west and southwest outskirts of Seoul might be responsible (Fig. 1b of Kim et al., 2017). Similar trends were also observed for the regional transport features of the other sources and species (e.g., NO3, MO-OOA2, and LO-OOA2). The reason might be the geographical location since Bukhan Mountain (to the north) blocks the wind, thus promoting the circulation of the air masses. Similar trends were reported in a previous study (Heo et al., 2009; Kim et al., 2017).
In this study, the NO3, SO4, and chloride in PM1 appeared to be fully neutralized by NH4, indicating that the inorganic species were mainly present in the forms of NH4NO3, (NH4)2SO4, and NH4Cl (Fig. S23). Since NO3 was more abundant than SO4 and chloride (Fig. 1c), the NH4 diurnal pattern was similar to that of NO3. The diurnal pattern of the OA tended to be similar to that of NO3 and SO4 (Fig. 7), showing the high concentration during nighttime peaking at ∼10:00, but each source showed a clearly different trend. For example, the regional transport sources such as MO-OOA2 and LO-OOA2 were consistent with NO3 and SO4, while between the high- and low-loading periods, similar profiles were detected but with different ranges (Fig. 7). However, the locally generated and accumulated sources such as the POAs, LO-OOA1, and MO-OOA1 exhibited typical features, as mentioned in Sect. 3.2.
3.3.4 Evidence of regional transport: determination of particulate lead (Pb)
Atmospheric lead (Pb) is found in the aerosol-phase emissions from coal and wood combustion and waste incineration; thus, its source can be both local and regional (Heal et al., 2005; Kummer et al., 2009; Lough et al., 2005; Murphy et al., 2007; Reff et al., 2009). The time series and the diurnal cycle of the Pb mass concentration determined with the HR-AMS in the SMA is shown in Fig. 8. As mentioned in Sect. 2.2.2, Pb has been reported as the sum of the ion signals of Pb and its isotopes from the V-mode measurement under the chopper-open condition. Periods with an elevated Pb level occur in the early morning with a maximum average concentration at approximately 09:00–10:00, while the concentration remains relatively low in the afternoon and starts to increase again from 17:00 (Fig. 8f). In general, the shape of the diurnal cycle of Pb is consistent with that of the regional transport-related species such as NO3, SO4, MO-OOA2, and LO-OOA2 (Fig. 7). The Pb time series in Fig. 8 shows that an increase in the Pb concentration occurred during the haze periods 5–7, 11–13, and 19–21 March, consistent with the other regional sources. The correlation further suggests that regional transport might possibly impact this enhancement since Pb exhibits an especially strong correlation for two components of the OA, namely, LO-OOA2 (r=0.62) and MO-OOA2 (r=0.73), influenced by regional transport (Table 1). Pb has a moderate correlation with SFOA (r=0.60), which is consistent with a previous study (Heo et al., 2009) that showed Pb can be emitted from burning activities in the SMA and along the outskirts of the SMA. This might also influence the background concentration of Pb. These results suggest that the Pb observed in the SMA is predominantly co-emitted with burning sources and transported with the plumes from the upwind sources.
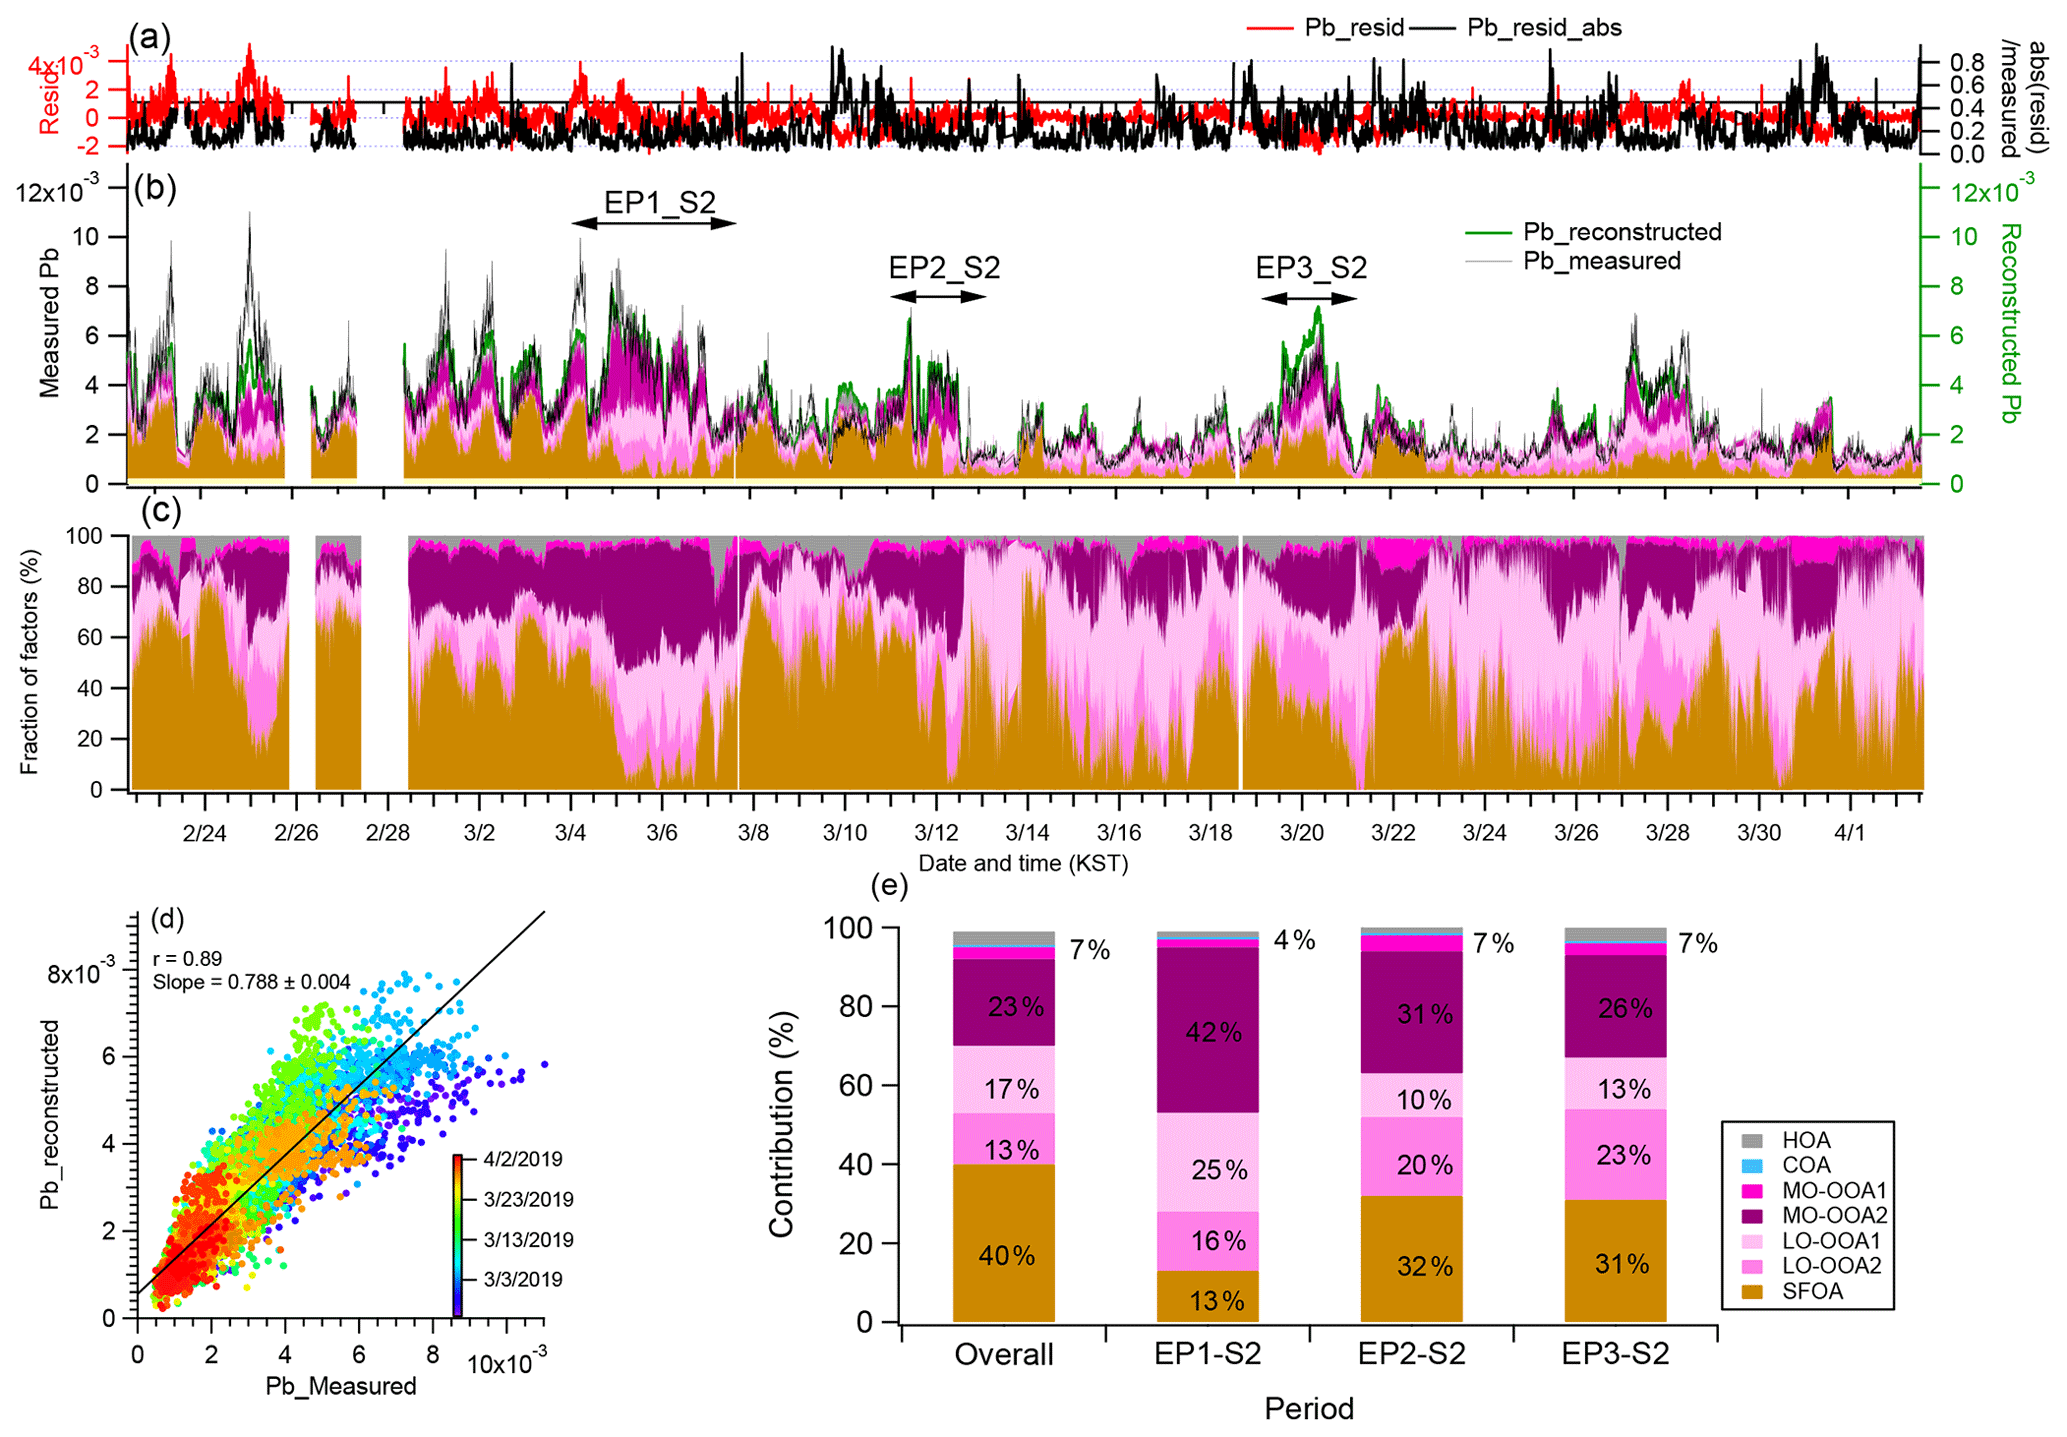
Figure 8Diagnostic plots of the Pb decomposition results. (a) Time series of the ratio of the residual to the measured Pb concentration and variations in the absolute fitting residuals; (b) time series of the measured Pb and the stacked contributions of all fitted sources of the OA; (c) time series of the contributions of all fitted sources of the OA; (d) scatter plot and linear fit between the measured and reconstructed Pb concentrations where a good agreement was observed between the measured and reconstructed Pb concentrations, with a linear regression slope of 0.79 and r value of 0.89; (e) the average contribution of the different factors to Pb during overall, EP1-S1, EP2-S2, and EP3-S2 periods. Numbers indicate the fraction of each source and HOA, COA, and MO-OOA1 fractions are summed since their fractions were very low.
The contribution of the Pb sources analyzed using a linear decomposition algorithm further showed that the airborne Pb measured at SMA can be freshly emitted from burning sources and transported in aged air masses along with other unknown species. Figure 8 reveals that a major source mixed with Pb was the SFOA (40 %). The other mass fractions of the Pb-associated OA sources were MO-OOA2 (22 %), LO-OOA1 (17 %), and LO-OOA2 (13 %). In particular, the contributions of MO-OOA2 and LO-OOA2 were greatly enhanced during the high-Pb period, which is also consistent with the haze periods, i.e., 5–7, 11–12, and 19–21 March, thus further supporting that haze formation was indeed impacted by regional transport. Note that the overall contribution of LO-OOA1 is higher than that of LO-OOA2 (Fig. 8e), suggesting that there could be another source of Pb in the local scale in the SMA. As discussed previously, LO-OOA1 is the locally formed SOA mostly enhanced during the first haze episode; thus, it showed the significant impacts on the Pb concentration during the first haze episodes together with MO-OOA2 and LO-OOA2. However, the fraction of LO-OOA1 is high during the low-loading period as well, resulting in the third highest significance to Pb (Fig. 8e), although the correlation with Pb is low (r=0.24). This might be because the variation of Pb, especially the high concentration of Pb, is mostly caused by the regional transport related with MO-OOA2 (r=0.62) and LO-OOA2 (r=0.73) (Table 1). The HOA and COA rarely contribute to Pb. These results suggested that 40 % of the Pb-containing particles in the SMA originated from combustion sources of the OA, whereas the rest was associated with aged and transported sources of the OA (RSOA) and locally formed SOA.
The aerosol composition, sources, and evolution processes during the severe haze events that occurred in March 2019 were investigated with a HR-AMS. The average PM1+ BC concentration was 35.1 µg m−3 and the total mass was dominated by organics (39 %), followed by nitrate (30 %) and sulfate (12 %). Secondary species (i.e., , , , LO-OOA1, LO-OOA2, MO-OOA1, and MO-OOA2) accounted for 78 % of the PM1 total mass, with the remainder consisting of primary species (HOA, COA, SFOA, and BC), suggesting secondary reactions being the significant source of PM. Cooking, fuel burning, and vehicle emissions were identified as major POA sources in Seoul, contributing 41 % on average to the total OA mass in this study.
Meteorological conditions and various emission sources influenced the concentration, composition, and properties of the aerosol particles in the SMA. Moreover, haze episodes often occurred, and they tended to intensify over a period of 2–6 d and were interleaved with multiple relatively clean days. The haze events that occurred in March 2019 were strongly influenced by regional transport. However, a very long haze period occurred from 1 to 8 March promoted by the combined impacts of stagnant conditions and regional transport. The major regional transport-related species and/or sources were NO3, SO4, LO-OOA2, and MO-OOA2, which were highly enhanced during the haze period. The temporal variations in the peak values of these regional feature components shifted from Beijing to South Korea over a period of 2 d, further verifying the important role of regional transport in haze formation. Furthermore, based on Pb measurements by the HR-AMS, enhanced Pb occurred during the haze period, confirming the regional impacts on the haze episodes.
Another interesting feature in this study was the significance of NO3. Compared to previous studies in the SMA, NO3 was found to present at a higher concentration in spring 2019. The highest fraction and concentration of NO3 were detected since PM properties have been investigated in the SMA using HR-AMS from December 2015, demonstrating the possibility of regional transport features, generally considered a locally formed secondary species. This is consistent with recent studies conducted in China, where NO3 has become a more important driver of severe haze episodes due to the effective emission controls of coal combustion which have reduced SO2 emissions. Due to the current emission control policies in China, SO4 and SO2 did not considerably change during the haze period compared to the low-loading period,
An extremely severe haze episode (the PM1+BC level exceeded 400 µg m−3) occurred in China ∼2 d prior to the severe haze episode in the SMA. In addition to the regional transport impacts, it appears that some influence was exerted on the accelerated formation of species (e.g., ) during the transport from the upwind to the downwind area of the SMA. Our results indicate that the PM concentration, composition, and sources in South Korea are very complex and are influenced by meteorological conditions and regional and long-range transport.
Data presented in this article are available upon request to the corresponding author.
The supplement related to this article is available online at: https://doi.org/10.5194/acp-20-11527-2020-supplement.
HK designed and conducted the measurements. YS provided data. HK and QZ analyzed the data and prepared the article with contributions from all authors.
The authors declare that they have no conflict of interest.
This work was supported by the Korea Institute of Science and Technology (KIST) Institutional Program (Atmospheric Environment Research Program, project no. 2E30111) and supported by the National Strategic Project-Fine Particle of the National Research Foundation of Korea (NRF) which is funded by the Ministry of Science and ICT (MSIT), the Ministry of Environment, and the Ministry of Health and Welfare (2017M3D8A1092015).
This work was supported by the Korea Institute of Science and Technology (KIST) Institutional Program (Atmospheric Environment Research Program, project no. 2E30111) and supported by the National Strategic Project-Fine Particle of the National Research Foundation of Korea (NRF) which is funded by the Ministry of Science and ICT (MSIT), the Ministry of Environment, and the Ministry of Health and Welfare (2017M3D8A1092015).
This paper was edited by Lynn M. Russell and reviewed by two anonymous referees.
Adhikary, B., Carmichael, G. R., Kulkarni, S., Wei, C., Tang, Y., Allura, A., Mena-Carrasco, M., Streets, D. G., Zhang, Q., Pierce, R. B., Al-Saadi, J. A., Emmons, L. K., Pfister, G. G., Avery, M. A., Barrick, J. D., Blake, D. R., Brune, W. H., Cohen, R. C., Dibb, J. E., Fried, A., Heikes, B. G., Huey, L. G., Sullivan, D. W., Sachse, G. W., Shetter, R. E., Singh, H. B., Campos, T. L., Cantrell, C. A., Flocke, F. M., Dunlea, E. J., Jimenez, J. L., Weinheimer, A. J., Crounse, J. D., Wennberg, P. O., Schauer, J. J., Stone, E. A., Jaffe, D. A., and Reidmiller, D. R.: A regional scale modeling analysis of aerosol and trace gas distributions over the eastern Pacific during the INTEX-B field campaign, Atmos. Chem. Phys., 10, 2091–2115, https://doi.org/10.5194/acp-10-2091-2010, 2010.
Aiken, A. C., Decarlo, P. F., Kroll, J. H., Worsnop, D. R., Huffman, J. A., Docherty, K. S., Ulbrich, I. M., Mohr, C., Kimmel, J. R., Sueper, D., Sun, Y., Zhang, Q., Trimborn, A., Northway, M., Ziemann, P. J., Canagaratna, M. R., Onasch, T. B., Alfarra, M. R., Prevot, A. S. H., Dommen, J., Duplissy, J., Metzger, A., Baltensperger, U., and Jimenez, J. L.: O∕C and OM∕OC ratios of primary, secondary, and ambient organic aerosols with high-resolution time-of-flight aerosol mass spectrometry, Environ. Sci. Technol., 42, 4478–4485, https://doi.org/10.1021/es703009q, 2008.
Aiken, A. C., Salcedo, D., Cubison, M. J., Huffman, J. A., DeCarlo, P. F., Ulbrich, I. M., Docherty, K. S., Sueper, D., Kimmel, J. R., Worsnop, D. R., Trimborn, A., Northway, M., Stone, E. A., Schauer, J. J., Volkamer, R. M., Fortner, E., de Foy, B., Wang, J., Laskin, A., Shutthanandan, V., Zheng, J., Zhang, R., Gaffney, J., Marley, N. A., Paredes-Miranda, G., Arnott, W. P., Molina, L. T., Sosa, G., and Jimenez, J. L.: Mexico City aerosol analysis during MILAGRO using high resolution aerosol mass spectrometry at the urban supersite (T0) – Part 1: Fine particle composition and organic source apportionment, Atmos. Chem. Phys., 9, 6633–6653, https://doi.org/10.5194/acp-9-6633-2009, 2009.
Allan, J. D., Delia, A. E., Coe, H., Bower, K. N., Alfarra, M. R., Jimenez, J. L., Middlebrook, A. M., Drewnick, F., Onasch, T. B., Canagaratna, M. R., Jayne, J. T., and Worsnop, D. R.: A generalised method for the extraction of chemically resolved mass spectra from aerodyne aerosol mass spectrometer data, J. Aerosol Sci., 35, 909–922, 10.1016/j.jaerosci.2004.02.007, 2004.
Allan, J. D., Williams, P. I., Morgan, W. T., Martin, C. L., Flynn, M. J., Lee, J., Nemitz, E., Phillips, G. J., Gallagher, M. W., and Coe, H.: Contributions from transport, solid fuel burning and cooking to primary organic aerosols in two UK cities, Atmos. Chem. Phys., 10, 647–668, https://doi.org/10.5194/acp-10-647-2010, 2010.
Ban-Weiss, G. A., McLaughlin, J. P., Harley, R. A., Lunden, M. M., Kirchstetter, T. W., Kean, A. J., Strawa, A. W., Stevenson, E. D., and Kendall, G. R.: Long-term changes in emissions of nitrogen oxides and particulate matter from on-road gasoline and diesel vehicles, Atmos. Environ., 42, 220–232, https://doi.org/10.1016/j.atmosenv.2007.09.049, 2008.
Batmunkh, T., Kim, Y. J., Jung, J. S., Park, K., and Tumendemberel, B.: Chemical characteristics of fine particulate matters measured during severe winter haze events in Ulaanbaatar, Mongolia, J. Air Waste Manage., 63, 659–670, https://doi.org/10.1080/10962247.2013.776997, 2013.
Canagaratna, M. R., Jayne, J. T., Jimenez, J. L., Allan, J. D., Alfarra, M. R., Zhang, Q., Onasch, T. B., Drewnick, F., Coe, H., Middlebrook, A., Delia, A., Williams, L. R., Trimborn, A. M., Northway, M. J., DeCarlo, P. F., Kolb, C. E., Davidovits, P., and Worsnop, D. R.: Chemical and microphysical characterization of ambient aerosols with the aerodyne aerosol mass spectrometer, Mass Spectrom. Rev., 26, 185–222, https://doi.org/10.1002/mas.20115, 2007.
Canagaratna, M. R., Jimenez, J. L., Kroll, J. H., Chen, Q., Kessler, S. H., Massoli, P., Hildebrandt Ruiz, L., Fortner, E., Williams, L. R., Wilson, K. R., Surratt, J. D., Donahue, N. M., Jayne, J. T., and Worsnop, D. R.: Elemental ratio measurements of organic compounds using aerosol mass spectrometry: characterization, improved calibration, and implications, Atmos. Chem. Phys., 15, 253–272, https://doi.org/10.5194/acp-15-253-2015, 2015.
Chen, C., Chen, S., Russell, L. M., Liu, J., Price, D. J., Betha, R., Sanchez, K., Lee, A. K. Y., Williams, L., Collier, S. C., Zhang, Q., Kumar, A., Kleeman, M., Zhang, X., and Cappa, C. D.: Organic aerosol particle chemical properties associated with residential burning and fog in wintertime San Joaquin Valley (Fresno) and with vehicle and firework emissions in summertime South Coast Air Basin (Fontana), J. Geophys. Res.-Atmos., 123, 10707–10731, https://doi.org/10.1029/2018JD028374, 2018.
Chen, G., Knibbs, L. D., Zhang, W., Li, S., Cao, W., Guo, J., Ren, H., Wang, B., Wang, H., Williams, G., Hamm, N. A. S., and Guo, Y.: Estimating spatiotemporal distribution of PM1 concentrations in China with satellite remote sensing, meteorology, and land use information, Environ. Pollut., 233, 1086–1094, https://doi.org/10.1016/j.envpol.2017.10.011, 2018.
Crippa, M., DeCarlo, P. F., Slowik, J. G., Mohr, C., Heringa, M. F., Chirico, R., Poulain, L., Freutel, F., Sciare, J., Cozic, J., Di Marco, C. F., Elsasser, M., Nicolas, J. B., Marchand, N., Abidi, E., Wiedensohler, A., Drewnick, F., Schneider, J., Borrmann, S., Nemitz, E., Zimmermann, R., Jaffrezo, J.-L., Prévôt, A. S. H., and Baltensperger, U.: Wintertime aerosol chemical composition and source apportionment of the organic fraction in the metropolitan area of Paris, Atmos. Chem. Phys., 13, 961–981, https://doi.org/10.5194/acp-13-961-2013, 2013.
Dall'Osto, M., Ovadnevaite, J., Ceburnis, D., Martin, D., Healy, R. M., O'Connor, I. P., Kourtchev, I., Sodeau, J. R., Wenger, J. C., and O'Dowd, C.: Characterization of urban aerosol in Cork city (Ireland) using aerosol mass spectrometry, Atmos. Chem. Phys., 13, 4997–5015, https://doi.org/10.5194/acp-13-4997-2013, 2013.
De Laeter, J. R., Böhlke, J. K., De Bièvre, P., Hidaka, H., Peiser, H. S., Rosman, K. J. R., and Taylor, P. D. P.: Atomic weights of the elements, Review 2000 (IUPAC technical report), Pure Appl. Chem., 75, 683–800, https://doi.org/10.1351/pac200375060683, 2003.
DeCarlo, P. F., Kimmel, J. R., Trimborn, A., Northway, M. J., Jayne, J. T., Aiken, A. C., Gonin, M., Fuhrer, K., Horvath, T., Docherty, K. S., Worsnop, D. R., and Jimenez, J. L.: Field-deployable, high-resolution, time-of-flight aerosol mass spectrometer, Anal. Chem., 78, 8281–8289, https://doi.org/10.1021/ac061249n, 2006.
Draxler, R. R. and Hess, G. D.: Description of the HYSPLIT_4 modeling system, available at: http://www.arl.noaa.gov/documents/reports/arl-224.pdf (last access: 5 January 2014), NOAA Air Resources Laboratory, Silver Spring, MD, USA, 1997.
Draxler, R. R., Stunder, B., Rolph, G., Stein, A., and Taylor, A.: HYSPLIT_4 User's Guide, available at: http://www.arl.noaa.gov/documents/reports/hysplit_user_guide.pdf (last access: April 2020), NOAA Air Resources Laboratory, Silver Spring, MD, USA, 2012.
Ebenstein, A., Fan, M., Greenstone, M., He, G., and Zhou, M.: New evidence on the impact of sustained exposure to air pollution on life expectancy from China's Huai River Policy, P. Natl. Acad. Sci. USA, 114, 10384–10389, https://doi.org/10.1073/pnas.1616784114, 2017.
Elser, M., Huang, R.-J., Wolf, R., Slowik, J. G., Wang, Q., Canonaco, F., Li, G., Bozzetti, C., Daellenbach, K. R., Huang, Y., Zhang, R., Li, Z., Cao, J., Baltensperger, U., El-Haddad, I., and Prévôt, A. S. H.: New insights into PM2.5 chemical composition and sources in two major cities in China during extreme haze events using aerosol mass spectrometry, Atmos. Chem. Phys., 16, 3207–3225, https://doi.org/10.5194/acp-16-3207-2016, 2016.
Fontes, T., Li, P., Barros, N., and Zhao, P.: Trends of PM2.5 concentrations in China: a long term approach, J. Environ. Manage., 196, 719–732, https://doi.org/10.1016/j.jenvman.2017.03.074, 2017.
Ge, X., Setyan, A., Sun, Y., and Zhang, Q.: Primary and secondary organic aerosols in Fresno, California during wintertime: results from high resolution aerosol mass spectrometry, J. Geophys. Res.-Atmos., 117, D19301, https://doi.org/10.1029/2012jd018026, 2012a.
Ge, X., Zhang, Q., Sun, Y., Ruehl, C. R., and Setyan, A.: Effect of aqueous-phase processing on aerosol chemistry and size distributions in Fresno, California, during wintertime, Environ. Chem., 9, 221–235, https://doi.org/10.1071/en11168, 2012b.
Hayes, P. L., Ortega, A. M., Cubison, M. J., Froyd, K. D., Zhao, Y., Cliff, S. S., Hu, W. W., Toohey, D. W., Flynn, J. H., Lefer, B. L., Grossberg, N., Alvarez, S., Rappenglück, B., Taylor, J. W., Allan, J. D., Holloway, J. S., Gilman, J. B., Kuster, W. C., de Gouw, J. A., Massoli, P., Zhang, X., Liu, J., Weber, R. J., Corrigan, A. L., Russell, L. M., Isaacman, G., Worton, D. R., Kreisberg, N. M., Goldstein, A. H., Thalman, R., Waxman, E. M., Volkamer, R., Lin, Y. H., Surratt, J. D., Kleindienst, T. E., Offenberg, J. H., Dusanter, S., Griffith, S., Stevens, P. S., Brioude, J., Angevine, W. M., and Jimenez, J. L.: Organic aerosol composition and sources in Pasadena, California, during the 2010 CalNex campaign, J. Geophys. Res.-Atmos., 118, 9233–9257, https://doi.org/10.1002/jgrd.50530, 2013.
He, L.-Y., Hu, M., Huang, X.-F., Yu, B.-D., Zhang, Y.-H., and Liu, D.-Q.: Measurement of emissions of fine particulate organic matter from Chinese cooking, Atmos. Environ., 38, 6557–6564, https://doi.org/10.1016/j.atmosenv.2004.08.034, 2004.
Heal, M. R., Hibbs, L. R., Agius, R. M., and Beverland, I. J.: Total and water-soluble trace metal content of urban background PM10, PM2.5 and black smoke in Edinburgh, UK, Atmos. Environ., 39, 1417–1430, https://doi.org/10.1016/j.atmosenv.2004.11.026, 2005.
Heo, J.-B., Hopke, P. K., and Yi, S.-M.: Source apportionment of PM2.5 in Seoul, Korea, Atmos. Chem. Phys., 9, 4957–4971, https://doi.org/10.5194/acp-9-4957-2009, 2009.
Herndon, S. C., Onasch, T. B., Wood, E. C., Kroll, J. H., Canagaratna, M. R., Jayne, J. T., Zavala, M. A., Knighton, W. B., Mazzoleni, C., Dubey, M. K., Ulbrich, I. M., Jimenez, J. L., Seila, R., de Gouw, J. A., de Foy, B., Fast, J., Molina, L. T., Kolb, C. E., and Worsnop, D. R.: Correlation of secondary organic aerosol with odd oxygen in Mexico City, Geophys. Res. Lett., 35, L15804, https://doi.org/10.1029/2008gl034058, 2008.
Hu, W. W., Hu, M., Yuan, B., Jimenez, J. L., Tang, Q., Peng, J. F., Hu, W., Shao, M., Wang, M., Zeng, L. M., Wu, Y. S., Gong, Z. H., Huang, X. F., and He, L. Y.: Insights on organic aerosol aging and the influence of coal combustion at a regional receptor site of central eastern China, Atmos. Chem. Phys., 13, 10095–10112, https://doi.org/10.5194/acp-13-10095-2013, 2013.
Huang, X. F., He, L. Y., Hu, M., Canagaratna, M. R., Sun, Y., Zhang, Q., Zhu, T., Xue, L., Zeng, L. W., Liu, X. G., Zhang, Y. H., Jayne, J. T., Ng, N. L., and Worsnop, D. R.: Highly time-resolved chemical characterization of atmospheric submicron particles during 2008 Beijing Olympic Games using an aerodyne high-resolution aerosol mass spectrometer, Atmos. Chem. Phys., 10, 8933–8945, https://doi.org/10.5194/acp-10-8933-2010, 2010.
IPCC: Summary for policymakers, in: Climate Change 2013: The Physical Science Basis, edited by: Stocker, T. F., Qin, D., Plattner, G.-K., Tignor, M., Allen, S. K., Boschung, J., Nauels, A., Xia, Y., Bex, V., and Midgley, P. M., Cambridge University Press, Cambridge, UK, New York, NY, USA, 3–29, 2013.
Jayne, J. T., Leard, D. C., Zhang, X., Davidovits, P., Smith, K. A., Kolb, C. E., and Worsnop, D. R.: Development of an aerosol mass spectrometer for size and composition analysis of submicron particles, Aerosol Sci. Tech., 33, 49–70, https://doi.org/10.1080/027868200410840, 2000.
Jung, J., Tsatsral, B., Kim, Y. J., and Kawamura, K.: Organic and inorganic aerosol compositions in Ulaanbaatar, Mongolia, during the cold winter of 2007 to 2008: dicarboxylic acids, ketocarboxylic acids, andα-dicarbonyls, J. Geophys. Res., 115, https://doi.org/10.1029/2010jd014339, 2010.
Jung, J., Lyu, Y., Lee, M., Hwang, T., Lee, S., and Oh, S.: Impact of Siberian forest fires on the atmosphere over the Korean Peninsula during summer 2014, Atmos. Chem. Phys., 16, 6757–6770, https://doi.org/10.5194/acp-16-6757-2016, 2016.
Kim, E., Hopke, P. K., and Edgerton, E. S.: Source identification of Atlanta aerosol by positive matrix factorization, J. Air Waste Manage., 53, 731–739, 2003.
Kim, H. and Zhang, Q.: Chemistry of new particle growth during springtime in the Seoul metropolitan area, Korea, Chemosphere, 225, 713–722, https://doi.org/10.1016/j.chemosphere.2019.03.072, 2019.
Kim, H., Zhang, Q., and Heo, J.: Influence of intense secondary aerosol formation and long-range transport on aerosol chemistry and properties in the Seoul Metropolitan Area during spring time: results from KORUS-AQ, Atmos. Chem. Phys., 18, 7149–7168, https://doi.org/10.5194/acp-18-7149-2018, 2018.
Kim, H., Zhang, Q., Bae, G.-N., Kim, J. Y., and Lee, S. B.: Sources and atmospheric processing of winter aerosols in Seoul, Korea: insights from real-time measurements using a high-resolution aerosol mass spectrometer, Atmos. Chem. Phys., 17, 2009–2033, https://doi.org/10.5194/acp-17-2009-2017, 2017.
Kummer, U., Pacyna, J., Pacyna, E., and Friedrich, R.: Assessment of heavy metal releases from the use phase of road transport in Europe, Atmos. Environ., 43, 640–647, https://doi.org/10.1016/j.atmosenv.2008.10.007, 2009.
Kuwata, M., Zorn, S. R., and Martin, S. T.: Using elemental ratios to predict the density of organic material composed of carbon, hydrogen, and oxygen, Environ. Sci. Technol., 46, 787–794, https://doi.org/10.1021/es202525q, 2012.
Lee, H., Jo, H., Kim, S., Park, M., and Kim, C.: Impacts of atmospheric vertical structures on transboundary aerosol transport from China to South Korea, Sci. Rep., 9, 13040, https://doi.org/10.1038/s41598-019-49691-z, 2019.
Lee, J., Hong, J., Lee, K., Hong, J., Velasco, E., Lim, Y. J., Lee, J. B., Nam, K, and Park, J.: Ceilometer Monitoring of Boundary-Layer Height and Its Application in Evaluating the Dilution Effect on Air Pollution, Bound.-Lay. Meteorol., 172, 435–455, https://doi.org/10.1007/s10546-019-00452-5, 2019.
Lim, S., Lee, M., Lee, G., Kim, S., Yoon, S., and Kang, K.: Ionic and carbonaceous compositions of PM10, PM2.5 and PM1.0 at Gosan ABC Superstation and their ratios as source signature, Atmospheric Chemistry and Physics, 12, 2007–2024, https://doi.org/10.5194/acp-12-2007-2012, 2012.
Lough, G. C., Schauer, J. J., Park, J.-S., Shafer, M. M., DeMinter, J. T., and Weinstein, J. P.: Emissions of metals associated with motor vehicle roadways, Environ. Sci. Technol., 39, 826–836, https://doi.org/10.1021/es048715f, 2005.
Middlebrook, A. M., Bahreini, R., Jimenez, J. L., and Canagaratna, M. R.: Evaluation of composition-dependent collection efficiencies for the aerodyne aerosol mass spectrometer using field data, Aerosol Sci. Technol., 46, 258–271, https://doi.org/10.1080/02786826.2011.620041, 2012.
MOE, Minitstry of Envieronment: White Paper of Environment,, Seoul, Korea, 2016.
Mohr, C., DeCarlo, P. F., Heringa, M. F., Chirico, R., Slowik, J. G., Richter, R., Reche, C., Alastuey, A., Querol, X., Seco, R., Peñuelas, J., Jiménez, J. L., Crippa, M., Zimmermann, R., Baltensperger, U., and Prévôt, A. S. H.: Identification and quantification of organic aerosol from cooking and other sources in Barcelona using aerosol mass spectrometer data, Atmos. Chem. Phys., 12, 1649–1665, https://doi.org/10.5194/acp-12-1649-2012, 2012.
Mohr, C., Huffman, J. A., Cubison, M. J., Aiken, A. C., Docherty, K. S., Kimmel, J. R., Ulbrich, I. M., Hannigan, M., and Jimenez, J. L.: Characterization of primary organic aerosol emissions from meat cooking, trash burning, and motor vehicles with high-resolution aerosol mass spectrometry and comparison with ambient and chamber observations, Environ. Sci. Technol., 43, 2443–2449, https://doi.org/10.1021/es8011518, 2009.
Murphy, D. M., Hudson, P. K., Cziczo, D. J., Gallavardin, S., Froyd, K. D., Johnston, M. V., Middlebrook, A. M., Reinard, M. S., Thomson, D. S., Thornberry, T., and Wexler, A. S.: Distribution of lead in single atmospheric particles, Atmos. Chem. Phys., 7, 3195–3210, https://doi.org/10.5194/acp-7-3195-2007, 2007.
Nault, B. A., Campuzano-Jost, P., Day, D. A., Schroder, J. C., Anderson, B., Beyersdorf, A. J., Blake, D. R., Brune, W. H., Choi, Y., Corr, C. A., de Gouw, J. A., Dibb, J., DiGangi, J. P., Diskin, G. S., Fried, A., Huey, L. G., Kim, M. J., Knote, C. J., Lamb, K. D., Lee, T., Park, T., Pusede, S. E., Scheuer, E., Thornhill, K. L., Woo, J.-H., and Jimenez, J. L.: Secondary organic aerosol production from local emissions dominates the organic aerosol budget over Seoul, South Korea, during KORUS-AQ, Atmos. Chem. Phys., 18, 17769–17800, https://doi.org/10.5194/acp-18-17769-2018, 2018.
Oh, H. R., Ho, C. H., Koo, Y. S., Baek, K. G., Yun, H. Y., Hur, S. K., Choi, D. R., Jhun, J. G., and Shim, J. S.: Impact of Chinese air pollutants on a record-breaking PMs episode in the Republic of Korea for 11–15 January 2019, Atmos. Environ., 223, 117262, https://doi.org/10.1016/j.atmosenv.2020.117262, 2020.
Paatero, P. and Tapper, U.: Positive matrix factorization: A non-negative factor model with optimal utilization of error estimates of data values, Environmetrics, 5, 111–126, https://doi.org/10.1002/env.3170050203, 1994.
Peterson, D. A., Hyer, E. J., Han, S.-O., Crawford, J. H., Park, R. J., Holz, R., Kuehn, R. E., Eloranta, E., Knote, C., Jordan, C. E., and Lefer, B. L.: Meteorology influencing springtime air quality, pollution transport, and visibility in Korea, Elementa: Science of the Anthropocene, 7, 57, https://doi.org/10.1525/elementa.395, 2019.
Pope III, C. A. and Dockery, D. W.: Health Effects of Fine Particulate Air Pollution: Lines that Connect, J. Air Waste Manage., 56, 709–742, 2006.
Pöschl, U.: Atmospheric Aerosols: Composition, Transformation, Climate and Health Effects, Angew. Chem. Int. Edit., 44, 7520–7540, 10.1002/anie.200501122, 2005.
Quan, J., Tie, X., Zhang, Q., Liu, Q., Li, X., Gao, Y., and Zhao, D.: Characteristics of heavy aerosol pollution during the 2012–2013 winter in Beijing, China, Atmos. Environ., 88, 83–89, https://doi.org/10.1016/j.atmosenv.2014.01.058, 2014.
Reff, A., Bhave, P. V., Simon, H., Pace, T. G., Pouliot, G. A., Mobley, J. D., and Houyoux, M.: Emissions inventory of PM2.5 trace elements across the United States, Environ. Sci. Technol., 43, 5790–5796, https://doi.org/10.1021/es802930x, 2009.
Salcedo, D., Onasch, T. B., Aiken, A. C., Williams, L. R., de Foy, B., Cubison, M. J., Worsnop, D. R., Molina, L. T., and Jimenez, J. L.: Determination of particulate lead using aerosol mass spectrometry: MILAGRO/MCMA-2006 observations, Atmos. Chem. Phys., 10, 5371–5389, https://doi.org/10.5194/acp-10-5371-2010, 2010.
Schroeder, J. R., Crawford, J. H., Ahn, J.-Y., Chang, L., Fried, A., Walega, J., Weinheimer, A., Montzka, D. D., Hall, S. R., Ullmann, K., Wisthaler, A., Mikoviny, T., Chen, G., Blake, D. R., Blake, N. J., Hughes, S. C., Meinardi, S., Diskin, G., Digangi, J. P., Choi, Y., Pusede, S. E., Huey, G. L., Tanner, D. J., Kim, M., and Wennberg, P.: Observation-based modeling of ozone chemistry in the Seoul metropolitan area during the Korea-United States Air Quality Study (KORUS-AQ), Elementa: Science of the Anthropocene, 8, 2, https://doi.org/10.1525/elementa.400, 2020.
Silva, P. J., Erupe, M. E., Price, D., Elias, J., Malloy, Q. G. J., Li, Q., Warren, B., Cocker III, D. R.: Trimethylamine as precursor to secondary organic aerosol formation via nitrate radical reaction in the atmosphere, Environ. Sci. Technol., 42, 4689–4696, https://doi.org/10.1021/es703016v, 2008.
Sun, Y., Du, W., Fu, P., Wang, Q., Li, J., Ge, X., Zhang, Q., Zhu, C., Ren, L., Xu, W., Zhao, J., Han, T., Worsnop, D. R., and Wang, Z.: Primary and secondary aerosols in Beijing in winter: sources, variations and processes, Atmos. Chem. Phys., 16, 8309–8329, https://doi.org/10.5194/acp-16-8309-2016, 2016a.
Sun, Y., Du, W., Fu, P., Wang, Q., Li, J., Ge, X., Zhang, Q., Zhu, C., Ren, L., Xu, W., Zhao, J., Han, T., Worsnop, D. R., and Wang, Z.: Primary and secondary aerosols in Beijing in winter: sources, variations and processes, Atmos. Chem. Phys., 16, 8309–8329, https://doi.org/10.5194/acp-16-8309-2016, 2016b.
Sun, Y., Jiang, Q., Wang, Z., Fu, P., Li, J., Yang, T., and Yin, Y.: Investigation of the sources and evolution processes of severe haze pollution in Beijing in January 2013, J. Geophys. Res.-Atmos., 119, 4380–4398, https://doi.org/10.1002/2014jd021641, 2014.
Sun, Y., Wang, Z., Fu, P., Jiang, Q., Yang, T., Li, J., and Ge, X.: The impact of relative humidity on aerosol composition and evolution processes during wintertime in Beijing, China, Atmos. Environ., 77, 927–934, https://doi.org/10.1016/j.atmosenv.2013.06.019, 2013.
Sun, Y., Zhang, Q., Zheng, M., Ding, X., Edgerton, E. S., and Wang, X.: Characterization and source apportionment of water-soluble organic matter in atmospheric fine particles (PM2.5) with high-resolution aerosol mass spectrometry and GC–MS, Environ. Sci. Technol., 45, 4854–4861, https://doi.org/10.1021/es200162h, 2011.
Ulbrich, I. M., Canagaratna, M. R., Zhang, Q., Worsnop, D. R., and Jimenez, J. L.: Interpretation of organic components from Positive Matrix Factorization of aerosol mass spectrometric data, Atmos. Chem. Phys., 9, 2891–2918, https://doi.org/10.5194/acp-9-2891-2009, 2009.
Wang, X., Williams, B. J., Wang, X., Tang, Y., Huang, Y., Kong, L., Yang, X., and Biswas, P.: Characterization of organic aerosol produced during pulverized coal combustion in a drop tube furnace, Atmos. Chem. Phys., 13, 10919–10932, https://doi.org/10.5194/acp-13-10919-2013, 2013.
Watson, J. G.: Visibility: science and regulation, JAPCA J. Air Waste Ma., 52, 628–713, https://doi.org/10.1080/10473289.2002.10470813, 2002.
Xu, J., Zhang, Q., Chen, M., Ge, X., Ren, J., and Qin, D.: Chemical composition, sources, and processes of urban aerosols during summertime in northwest China: insights from high-resolution aerosol mass spectrometry, Atmos. Chem. Phys., 14, 12593–12611, https://doi.org/10.5194/acp-14-12593-2014, 2014.
Xu, J., Shi, J., Zhang, Q., Ge, X., Canonaco, F., Prévôt, A. S. H., Vonwiller, M., Szidat, S., Ge, J., Ma, J., An, Y., Kang, S., and Qin, D.: Wintertime organic and inorganic aerosols in Lanzhou, China: sources, processes, and comparison with the results during summer, Atmos. Chem. Phys., 16, 14937–14957, https://doi.org/10.5194/acp-16-14937-2016, 2016.
Xu, L., Guo, H., Boyd, C. M., Klein, M., Bougiatioti, A., Cerully, K. M., Hite, J. R., Isaacman-VanWertz, G., Kreisberg, N. M., Knote, C., Olson, K., Koss, A., Goldstein, A. H., Hering, S. V., de Gouw, J., Baumann, K., Lee, S.-H., Nenes, A., Weber, R. J., and Ng, N. L.: Effects of anthropogenic emissions on aerosol formation from isoprene and monoterpenes in the southeastern United States, P. Natl. Acad. Sci. USA, 112, 37–42, https://doi.org/10.1073/pnas.1417609112, 2015.
Xu, W., Sun, Y., Wang, Q., Zhao, J., Wang, J., Ge, X., Xie, C., Zhou, W., Du, W., Li, J., Fu, P., Wang, Z., Worsnop, D. R., and Coe, H.: Changes in aerosol chemistry from 2014 to 2016 in winter in Beijing: insights from high-resolution aerosol mass spectrometry, J. Geophys. Res.-Atmos., 124, 1132–1147, https://doi.org/10.1029/2018jd029245, 2019.
Young, D. E., Kim, H., Parworth, C., Zhou, S., Zhang, X., Cappa, C. D., Seco, R., Kim, S., and Zhang, Q.: Influences of emission sources and meteorology on aerosol chemistry in a polluted urban environment: results from DISCOVER-AQ California, Atmos. Chem. Phys., 16, 5427–5451, https://doi.org/10.5194/acp-16-5427-2016, 2016.
Zhang, Q. H., Zhang, J. P., and Xue, H. W.: The challenge of improving visibility in Beijing, Atmos. Chem. Phys., 10, 7821–7827, https://doi.org/10.5194/acp-10-7821-2010, 2010.
Zhang, Q., Alfarra, M. R., Worsnop, D. R., Allan, J. D., Coe, H., Canagaratna, M. R., and Jimenez, J. L.: Deconvolution and quantification of hydrocarbon-like and oxygenated organic aerosols based on aerosol mass spectrometry, Environ. Sci. Technol., 39, 4938–4952, https://doi.org/10.1021/es048568l, 2005a.
Zhang, Q., Jimenez, J. L., Canagaratna, M. R., Ulbrich, I. M., Ng, N. L., Worsnop, D. R., and Sun, Y.: Understanding atmospheric organic aerosols via factor analysis of aerosol mass spectrometry: a review, Anal. Bioanal. Chem., 401, 3045–3067, https://doi.org/10.1007/s00216-011-5355-y, 2011.
Zhang, Q., Worsnop, D. R., Canagaratna, M. R., and Jimenez, J. L.: Hydrocarbon-like and oxygenated organic aerosols in Pittsburgh: insights into sources and processes of organic aerosols, Atmos. Chem. Phys., 5, 3289–3311, https://doi.org/10.5194/acp-5-3289-2005, 2005b.
Zhang, Y. J., Tang, L. L., Wang, Z., Yu, H. X., Sun, Y. L., Liu, D., Qin, W., Canonaco, F., Prévôt, A. S. H., Zhang, H. L., and Zhou, H. C.: Insights into characteristics, sources, and evolution of submicron aerosols during harvest seasons in the Yangtze River delta region, China, Atmos. Chem. Phys., 15, 1331–1349, https://doi.org/10.5194/acp-15-1331-2015, 2015.
Zhao, J., Du, W., Zhang, Y., Wang, Q., Chen, C., Xu, W., Han, T., Wang, Y., Fu, P., Wang, Z., Li, Z., and Sun, Y.: Insights into aerosol chemistry during the 2015 China Victory Day parade: results from simultaneous measurements at ground level and 260 m in Beijing, Atmos. Chem. Phys., 17, 3215–3232, https://doi.org/10.5194/acp-17-3215-2017, 2017.
Zhao, P., Dong, F., Yang, Y., He, D., Zhao, X., Zhang, W., Yao, Q., and Liu, H.: Characteristics of carbonaceous aerosol in the region of Beijing, Tianjin, and Hebei, China, Atmos. Environ., 71, 389–398, https://doi.org/10.1016/j.atmosenv.2013.02.010, 2013.
Zheng, G. J., Duan, F. K., Su, H., Ma, Y. L., Cheng, Y., Zheng, B., Zhang, Q., Huang, T., Kimoto, T., Chang, D., Pöschl, U., Cheng, Y. F., and He, K. B.: Exploring the severe winter haze in Beijing: the impact of synoptic weather, regional transport and heterogeneous reactions, Atmos. Chem. Phys., 15, 2969–2983, https://doi.org/10.5194/acp-15-2969-2015, 2015.