the Creative Commons Attribution 4.0 License.
the Creative Commons Attribution 4.0 License.
 | 30 Jan 2020
Air quality and climate change, Topic 3 of the Model Inter-Comparison Study for Asia Phase III (MICS-Asia III) – Part 2: aerosol radiative effects and aerosol feedbacks
Zhining Tao
Jiawei Li
Jeong-Eon Kang
Kan Huang
Xinyi Dong
Bingliang Zhuang
Shu Li
Baozhu Ge
Qizhong Wu
Hyo-Jung Lee
Cheol-Hee Kim
Joshua S. Fu
Tijian Wang
Mian Chin
Meng Li
Jung-Hun Woo
Qiang Zhang
Yafang Cheng
Zifa Wang
Gregory R. Carmichael
Topic 3 of the Model Inter-Comparison Study for Asia (MICS-Asia) Phase III examines how online coupled air quality models perform in simulating wintertime haze events in the North China Plain region and evaluates the importance of aerosol radiative feedbacks. This paper discusses the estimates of aerosol radiative forcing, aerosol feedbacks, and possible causes for the differences among the participating models. Over the Beijing–Tianjin–Hebei (BTH) region, the ensemble mean of estimated aerosol direct radiative forcing (ADRF) at the top of atmosphere, inside the atmosphere, and at the surface are −1.1, 7.7, and −8.8 W m−2 during January 2010, respectively. Subdivisions of direct and indirect aerosol radiative forcing confirm the dominant role of direct forcing. During severe haze days (17–19 January 2010), the averaged reduction in near-surface temperature for the BTH region can reach 0.3–1.6 ∘C. The responses of wind speeds at 10 m (WS10) inferred from different models show consistent declines in eastern China. For the BTH region, aerosol–radiation feedback-induced daytime changes in PM2.5 concentrations during severe haze days range from 6.0 to 12.9 µg m−3 (<6 %). Sensitivity simulations indicate the important effect of aerosol mixing states on the estimates of ADRF and aerosol feedbacks. Besides, black carbon (BC) exhibits a large contribution to atmospheric heating and feedbacks although it accounts for a small share of mass concentration of PM2.5.
- Article
(5619 KB) - Full-text XML
- Companion paper
-
Supplement
(146 KB) - BibTeX
- EndNote


Aerosols change weather and climate via the following pathways: they absorb and scatter solar and thermal radiation to alter the radiative balance of the earth–atmosphere system (Gao et al., 2019b; Liu et al., 2011; Jia et al., 2018), which is referred to as direct effects, and they serve as cloud condensation nuclei (CCN) and/or ice nuclei (IN) to modify cloud properties, which is referred to as indirect effects (Haywood and Boucher, 2000). The suppression of cloud convection induced by direct effects of absorbing aerosols is known as the semidirect effect (Huang et al., 2006; Lohmann and Feichter, 2005). Increases in cloud droplet number can increase cloud albedo for a constant liquid water path (LWP), which is further classified as the first indirect effect or Twomey effect (Twomey, 1991). More but smaller cloud droplets reduce precipitation intensity but increase cloud lifetime, which is known as the cloud lifetime or second indirect aerosol effect (Albrecht, 1989). In turn, changes in the radiative balance can alter meteorological variables (e.g., temperature, relative humidity, photolysis rate, etc.) and further the transport, diffusion, and chemical conversion of trace gases and aerosols, while changes in clouds can affect in-cloud aqueous-phase chemistry and wet deposition of gases and aerosols.
The impacts of meteorology on chemistry have been explicitly treated in chemical transport models (CTMs). For example, temperature modulates chemical reactions and photolysis rates, which affects volatility of chemical species; biogenic emissions, wind speed, and wind direction determine transport and mixing; and precipitation influences wet deposition (Baklanov et al., 2014). However, due to the complexity of these processes and a lack of computational resources, the influences of atmospheric compositions on weather and climate have been generally ignored in previous CTMs (Baklanov et al., 2014). Studies examining how aerosols interact with weather and climate remain uncertain and limited. Recently, with the rapid development of coupled meteorology and chemistry models, many new studies have been conducted to investigate the aerosol direct and indirect effects and feedbacks (Baklanov et al., 2017; Forkel et al., 2015; Gao et al., 2016, 2017; Grell et al., 2005; Han, 2010; Huang et al., 2016; Jacobson et al., 2007; Saide et al., 2012; J. Wang et al., 2014; Yang et al., 2011; Zhang et al., 2010). In highly polluted regions like Asia, aerosol feedbacks can be particularly important (Gao et al., 2016, 2017). High concentrations of aerosols would enhance the stability of the boundary layer due to reductions in radiation that reach the surface, which in turn can cause further increases in PM2.5 concentrations (Ding et al., 2016; Gao et al., 2016).
Aerosol feedbacks during haze events in China have been explored using multiple online coupled meteorology–chemistry models, including WRF-Chem (the Weather Research Forecasting model coupled with Chemistry; Chen et al., 2013, 2018; Gao et al., 2016, 2017, 2019a; Liu et al., 2015) and WRF-CMAQ (Community Multiscale Air Quality; J. Wang et al., 2014). Nevertheless, large uncertainties remain in the modeling of these processes, due to the lack of direct observational constraints and challenges in predicting properties of aerosols. Thus, the intercomparison of coupled meteorology–chemistry models is of great significance to better understand the differences, causes, and uncertainties within these processes.
“Topic 3: air quality and climate change” within the Model Inter-Comparison Study for Asia Phase III (MICS-Asia III) was initialized to address these issues (Gao et al., 2018a). Results from seven applications of fully online coupled meteorology–chemistry models using harmonized emission and chemical boundary conditions were submitted to this study (Gao et al., 2018a). These model applications include two applications of WRF-Chem by different institutions, two applications of the National Aeronautics and Space Administration (NASA) Unified WRF (NU-WRF) model with different model resolutions, one application of the Regional Integrated Environment Modeling System with Chemistry (RIEMS-Chem; Han, 2010), one application of the coupled Regional Climate Chemistry Modeling System (RegCCMS), and one application of the coupled WRF-CMAQ model (Gao et al., 2018a). More detailed information on the participating models, how the experiments were designed, and how models perform have been archived in Gao et al. (2018a).
In this paper, we analyze the results from the participating models to address the following questions. (1) How large is the aerosol radiative forcing during winter haze episodes in China and how differently are models estimating it? (2) How do aerosol feedbacks change meteorological variables and how do current models differ in estimating these changes? (3) How do aerosol feedbacks contribute to the evolution of high aerosol concentrations during winter haze episodes and what are the best estimates from different models? Finally, (4) what are the major causes of the differences among the models? Section 2 describes briefly how the experiments were designed and how models perform. Section 3 presents the estimates of aerosol direct radiative forcing inferred from multiple models, including the separation of direct and indirect effects. In Sect. 4, we discuss the impacts of aerosol–radiation feedbacks on meteorological variables and PM2.5 concentrations. Section 5 illustrates the sensitivity of aerosol forcing and feedbacks to different processes in the model, and the summary is presented in Sect. 6.
The participants were requested to use common emissions to simulate air quality during January 2010 and submit requested model variables. The participating models include the following:
-
one application of the Weather Research Forecasting model coupled with Chemistry (WRF-Chem; Fast et al., 2006; Grell et al., 2005) by Pusan National University (PNU) (M1);
-
one application of the WRF-Chem model by the University of Iowa (UIOWA) (M2);
-
two applications (two domains: 45 and 15 km horizontal resolutions) of the National Aeronautics and Space Administration (NASA) Unified WRF (NU-WRF; Peters-Lidard et al., 2015) model by the Universities Space Research Association (USRA) and NASA's Goddard Space Flight Center (M3 and M4);
-
one application of the Regional Integrated Environment Modeling System with Chemistry (RIEMS-Chem; Han, 2010) by the Institute of Atmospheric Physics (IAP), Chinese Academy of Sciences (M5);
-
one application of the coupled Regional Climate Chemistry Modeling System (RegCCMS; Wang et al., 2010) from Nanjing University (M6); and
-
one application of the coupled WRF-CMAQ (Community Multiscale Air Quality) model by the University of Tennessee at Knoxville (UTK) (M7) (Table 1).
A new Asian emission inventory was developed for MICS-Asia III by integrating state-of-the-art national or regional inventories (Li et al., 2017), which was provided to all modeling groups, along with biogenic emissions, biomass burning emissions, etc. Simulations from two global chemical transport models (e.g., GEOS-Chem, the Goddard Earth Observing System model with chemistry, and MOZART, Model for OZone And Related chemical Tracers) were provided as boundary conditions for MICS-Asia III. The entire month of January 2010 was simulated and covered by one single simulation for each participating model. Comprehensive model evaluations indicate that all models could capture the observed near-surface temperature and water vapor mixing ratio, but they overestimated near-surface wind speeds. These models were able to represent the observed daily maximum downward shortwave radiation, particularly low values during haze days. The observed variations of air pollutants, including SO2, NOx, CO, O3, PM2.5, and PM10, were reproduced by these models. However, large differences in the models were found in the predicted PM2.5 chemical compositions.
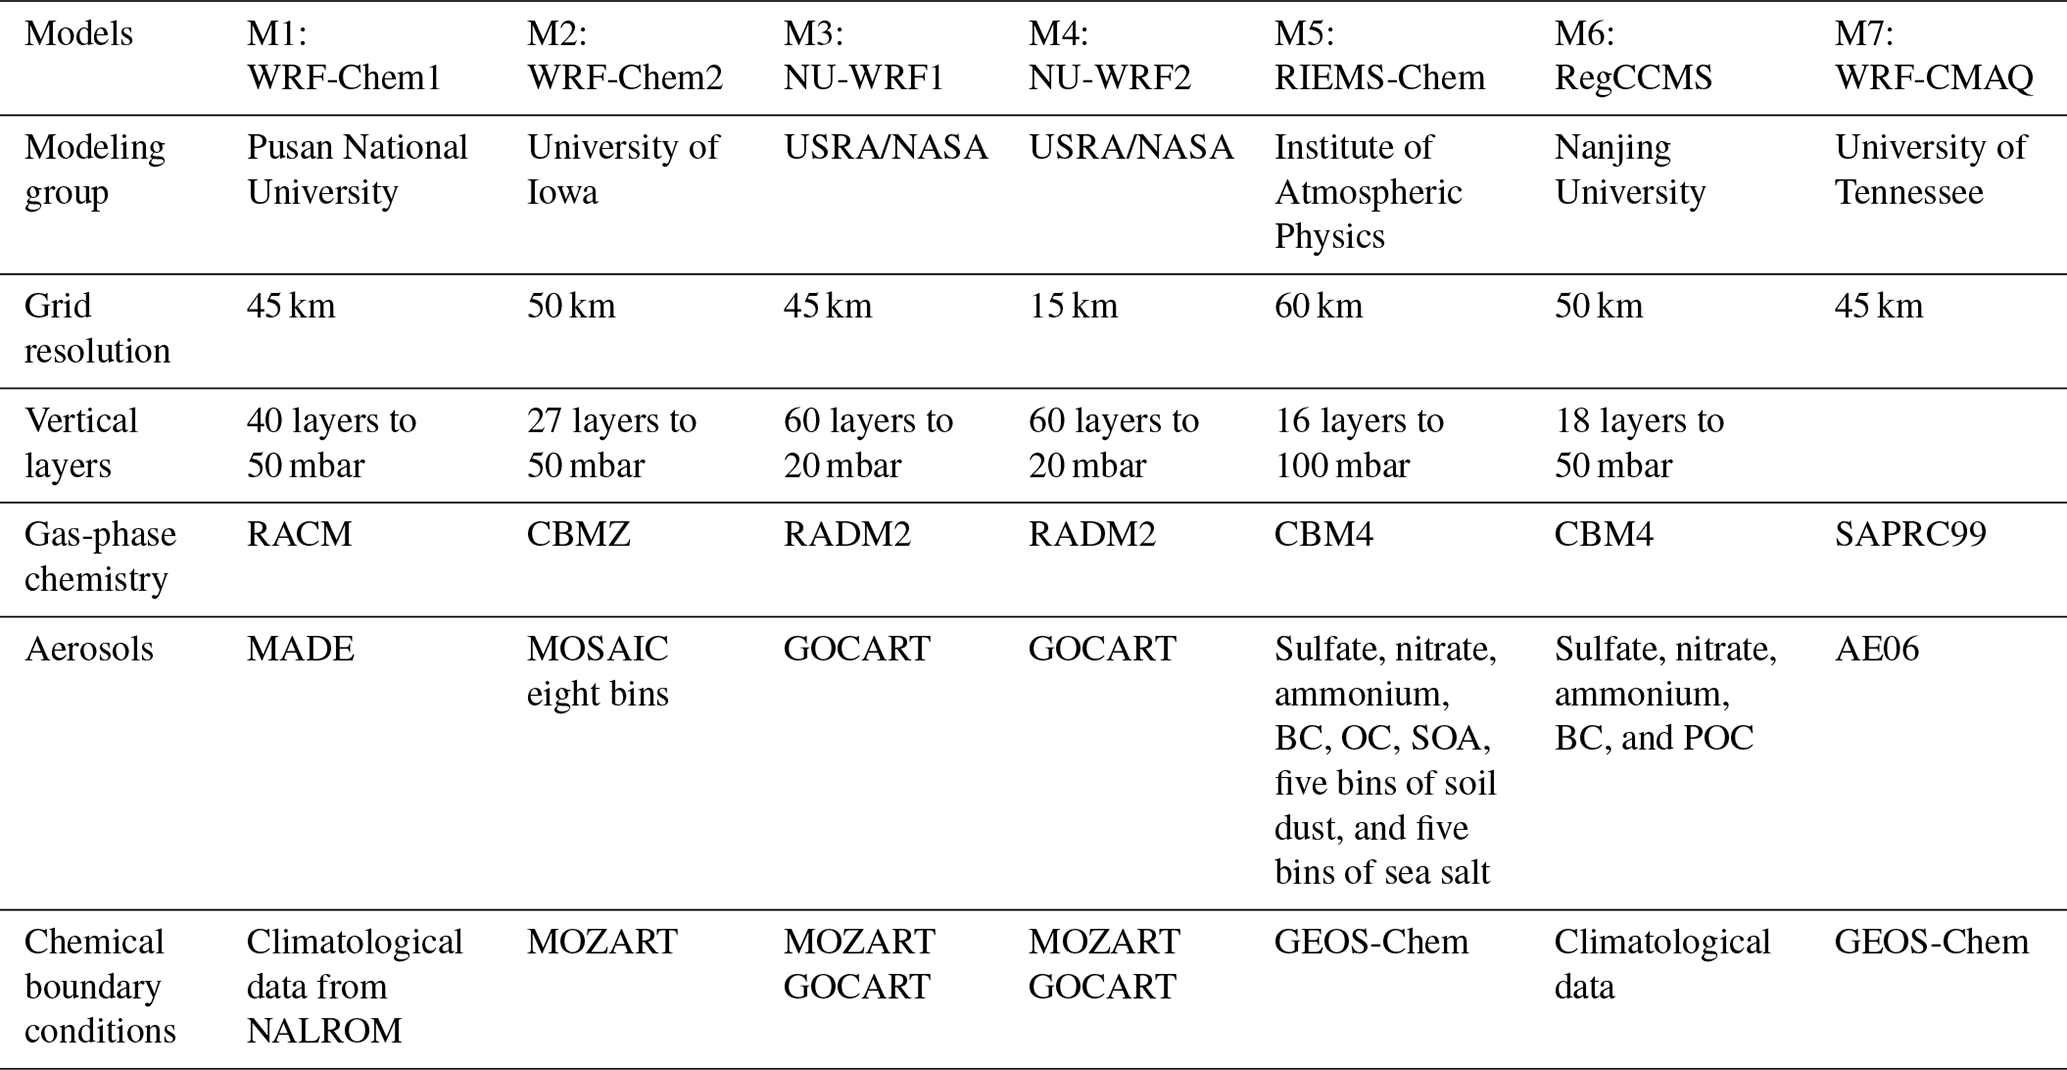
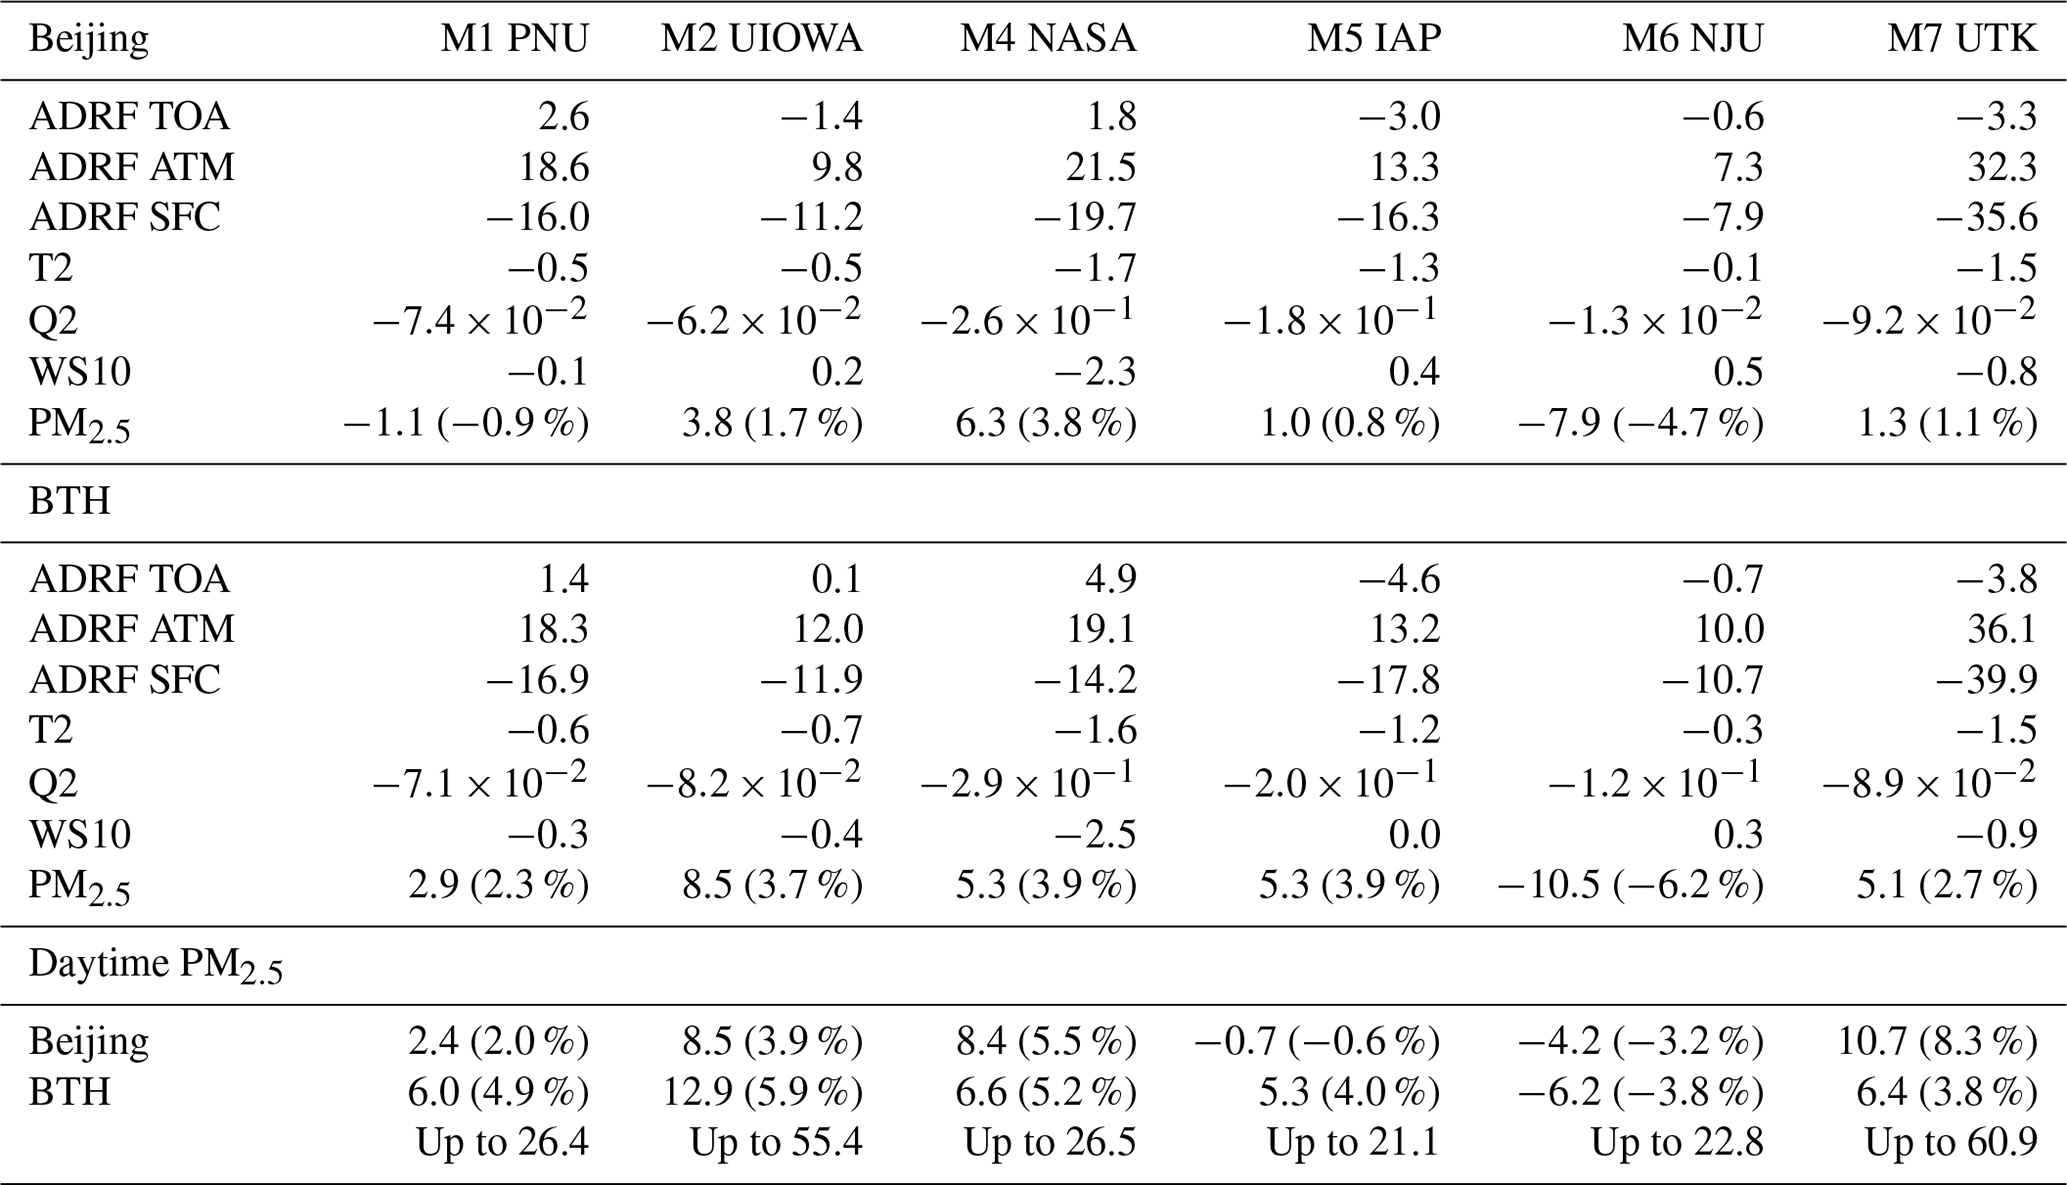
Figure 1 shows the monthly mean all-sky aerosol direct radiative forcing (ADRF) over China. The spatial distributions of ADRF at the surface and inside the atmosphere inferred from multiple models are generally consistent, with the largest values in eastern and southwestern China. Over the Beijing–Tianjin–Hebei (BTH) region (areas marked in Fig. S1 in the Supplement), M7 reports the highest ADRF at the surface (−17.0 W m−2), and the largest ADRF inside the atmosphere (14.6 W m−2), respectively (Table 2). M6 shows the lowest ADRF both at the surface and inside the atmosphere (−3.6 and 3.6 W m−2) (Table 2). It is noticed that M6 predicts lower aerosol optical depth (AOD) than M7 (Gao et al., 2018a), which could partly explain the weaker ADRF estimated by M6. M6 uses an external assumption of aerosol mixing states, which is likely to cause weaker absorption and ADRF in the atmosphere (Conant et al., 2003). However, the reported ADRF at the top of the atmosphere (TOA) varies widely, and no consensus is reached on whether the forcing is positive or negative. The spatial pattern of ADRF values at the TOA inferred from M5 are consistently negative across the modeling domain, while the results inferred from other models are patchy with positive values to the north or to the southwest (Fig. 1). The consistently negative ADRF at the TOA estimated by M5 is related to the strong negative forcing at the surface and the predicted high concentrations of sulfate by M5 (Gao et al., 2018a). Over the BTH region, simulated ADRF values at the TOA range from −2.6 to 0.2 W m−2 (Table 2). Li et al. (2010) reported observation-based estimates of aerosol radiative forcing across China to be 0.3±1.6 at the TOA. Chung et al. (2005) and Chung et al. (2010) estimated the forcing over south Asia to be −2.9 and −3.6 W m−2 at the TOA, respectively. The magnitudes of the model-estimated aerosol radiative forcing values are generally in line with the estimates inferred from observations, while discrepancies among models could be due to assumptions of aerosol mixing states and other model treatments (parameterization of hygroscopicity, soil dust, etc.). The discussions on how different model treatments affect the results of ADRF are provided in Sect. 5.
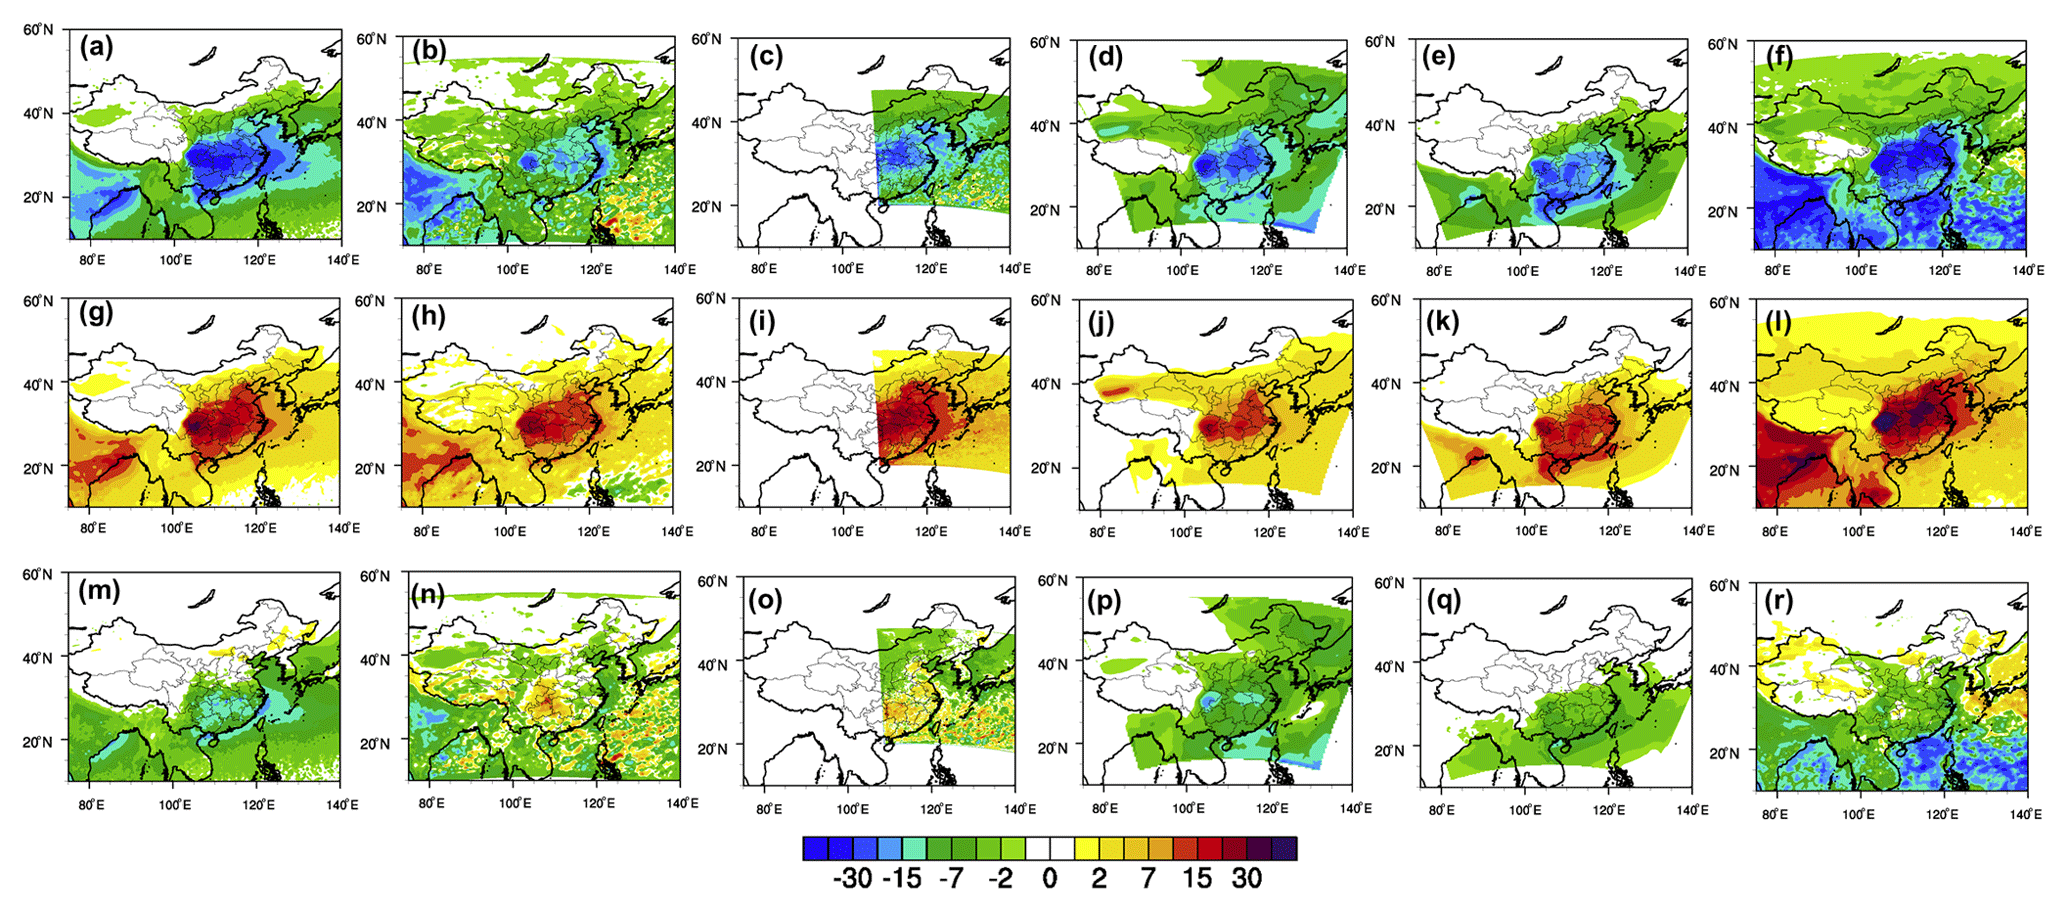
Figure 1Monthly (January 2010) mean aerosol direct radiative forcing at the surface, inside the atmosphere, and at the top of the atmosphere inferred from M1 (a, g, m), M2 (b, h, n), M4 (c, i, o), M5 (d, j, p), M6 (e, k, q), and M7 (f, l, r) (M1: WRF-Chem, Pusan National University; M2: WRF-Chem, University of Iowa; M4: NU-WRF, NASA; M5: RIEMS-Chem, Institute of Atmospheric Physics; M6: RegCCMS, Nanjing University; M7: WRF-CMAQ, University of Tennessee; Gao et al., 2018a).
Table 2Monthly mean (January 2010) aerosol direct radiative forcing (W m−2) and changes in T2 (∘C), Q2 (g kg−1), WS10 (0.1 m s−1), and PM2.5 (µg m−3) for Beijing and the Beijing–Tianjin–Hebei region (areas marked in Fig. S1).
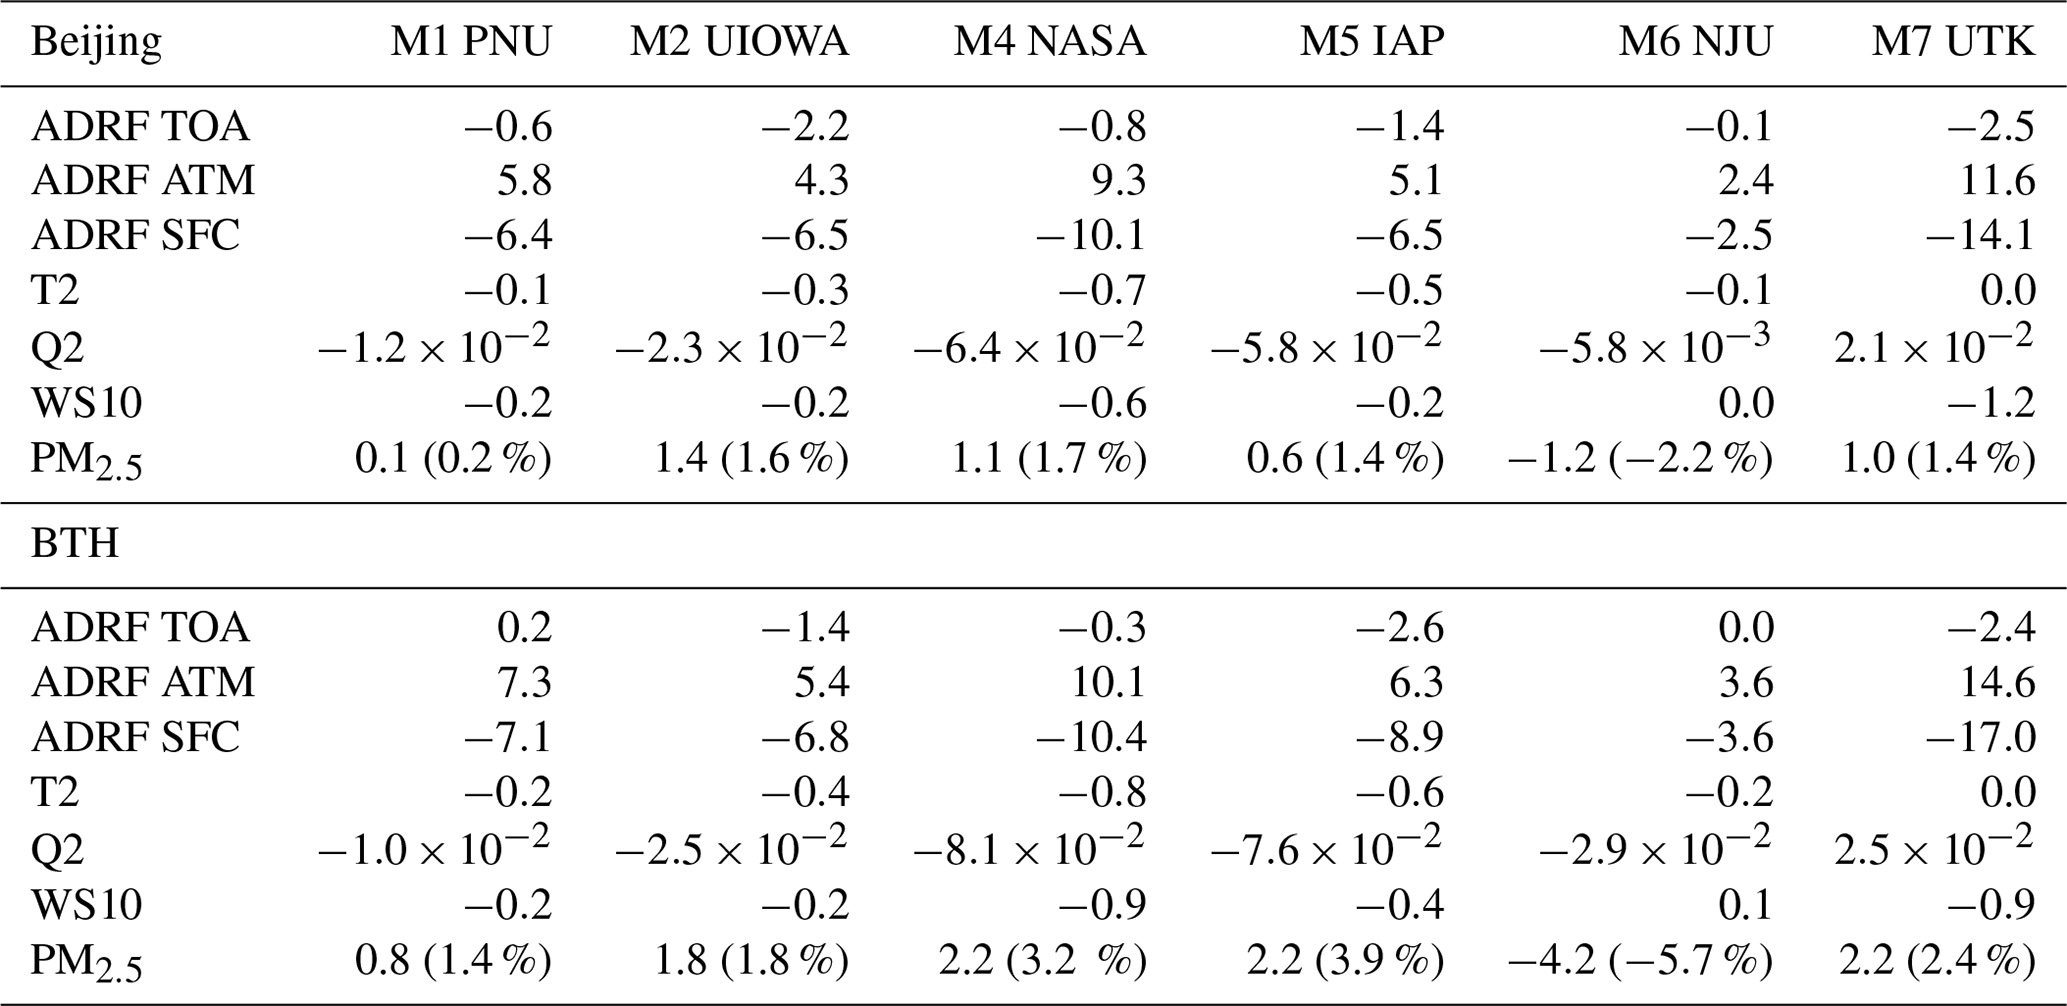
Figure 2 exhibits the ensemble mean of monthly averaged ADRF at the TOA, inside the atmosphere and at the surface. Elevated forcing data inside the atmosphere and at the surface are mainly located in east China. However, the ensemble means of forcing at the TOA over the ocean is slightly higher than that over the land. Over the BTH region, the ensemble mean of ADRF at the TOA, inside the atmosphere, and at the surface are −1.1, 7.7, and −8.8 W m−2, respectively. In winter, the aerosol radiative forcing in China is largely contributed to by the power sector and residential sector, but with different signs of the contribution (Gao et al., 2018b).
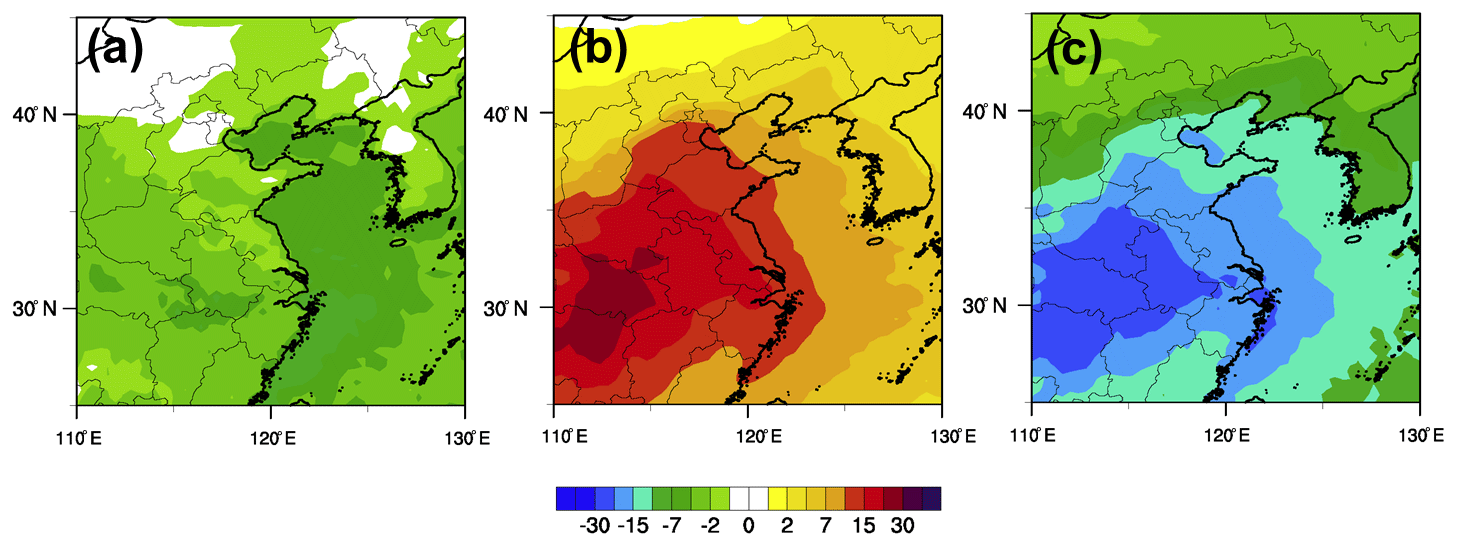
Figure 2Ensemble mean of monthly (January 2010) mean aerosol direct radiative forcing at the top of the atmosphere (a), inside the atmosphere (b), and at the surface (c).
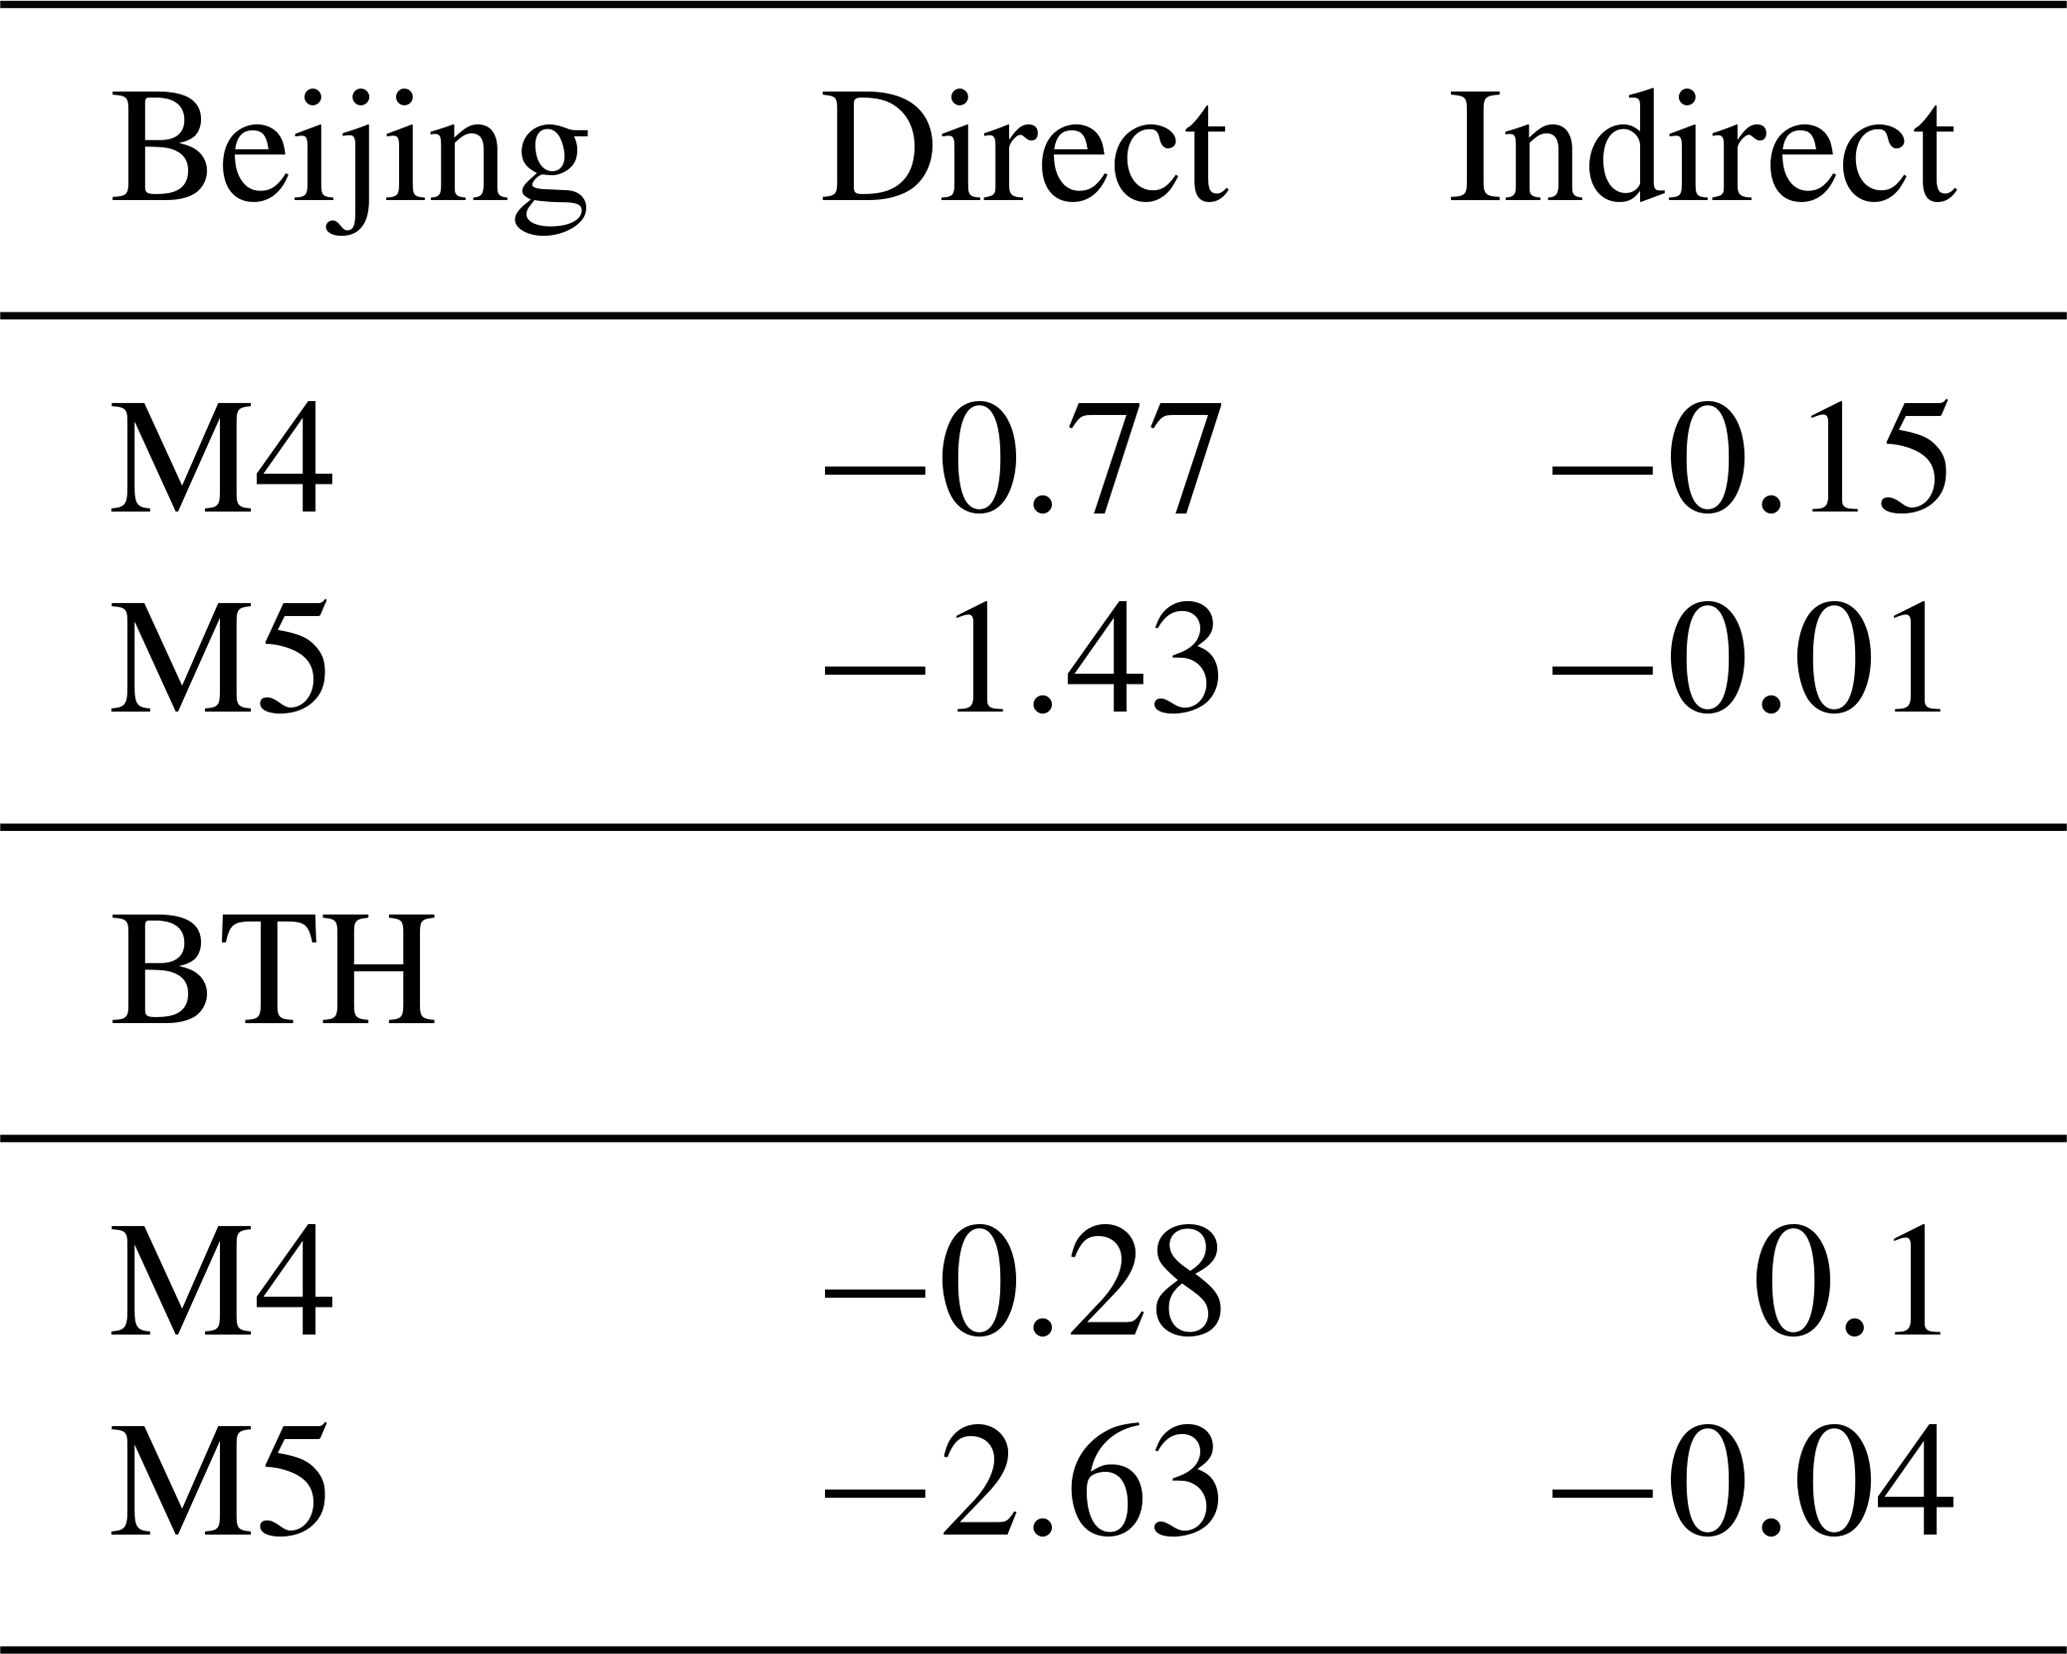
M4 and M5 further provide subdivision of direct and indirect aerosol radiative forcing. As listed in Table 3, although the magnitudes of forcing data estimated by M4 and M5 differ from each other, the dominant roles of direct forcing are consistent. Over northern China and during wintertime, aerosol indirect forcing is negligible due to the lack of water vapor and the stable weather conditions.
Table 3Monthly mean (January 2010) aerosol direct radiative forcing and indirect radiative forcing (W m−2) at the top of the atmosphere inferred from M4 and M5 (areas marked in Fig. S1).
When extreme haze events happen, high aerosol loadings can reduce significantly the shortwave radiation reaching the surface, modifying near-surface temperature (Gao et al., 2017). Figure 3 displays the aerosol–radiation feedback-induced changes in temperature at 2 m (T2) from M1 (a), M2 (b), M4 (c), M5 (d), M6 (e), and M7 (f) (Table 1: M1: WRF-Chem, Pusan National University; M2: WRF-Chem, University of Iowa; M4: NU-WRF, NASA; M5: RIEMS-Chem, Institute of Atmospheric Physics; M6: RegCCMS, Nanjing University; M7: WRF-CMAQ, University of Tennessee; Gao et al., 2018a). The participating models show different degrees of reductions in T2. M5 exhibits the most widespread areas with reductions, which include northeastern China. However, significant reductions in T2 inferred from other models are mainly concentrated in southern and eastern China (Fig. 3). In Beijing (areas marked in Fig. S1), the monthly averaged reductions in T2 from multiple models range from 0 to 0.7 ∘C, with the greatest changes calculated from M4 (Table 2). In the Beijing–Tianjin–Hebei (BTH) region, similar magnitudes (0–0.8 ∘C) are found. When only severe haze days (17–19 January) are considered, the averaged reductions in T2 for Beijing (0.1–1.7 ∘C) and the BTH region (0.3–1.6 ∘C) are further enhanced (Table 4). In terms of aerosol–radiation feedback-induced temperature reduction, M1 and M2 generally report similar magnitudes, which are lower than M4, M5, and M7. Model evaluations of PM2.5 composition in Gao et al. (2018a) reveal that M4 overpredicts the concentrations of organic carbon, which could be one of the reasons for the higher estimated reductions in T2 due to aerosols.
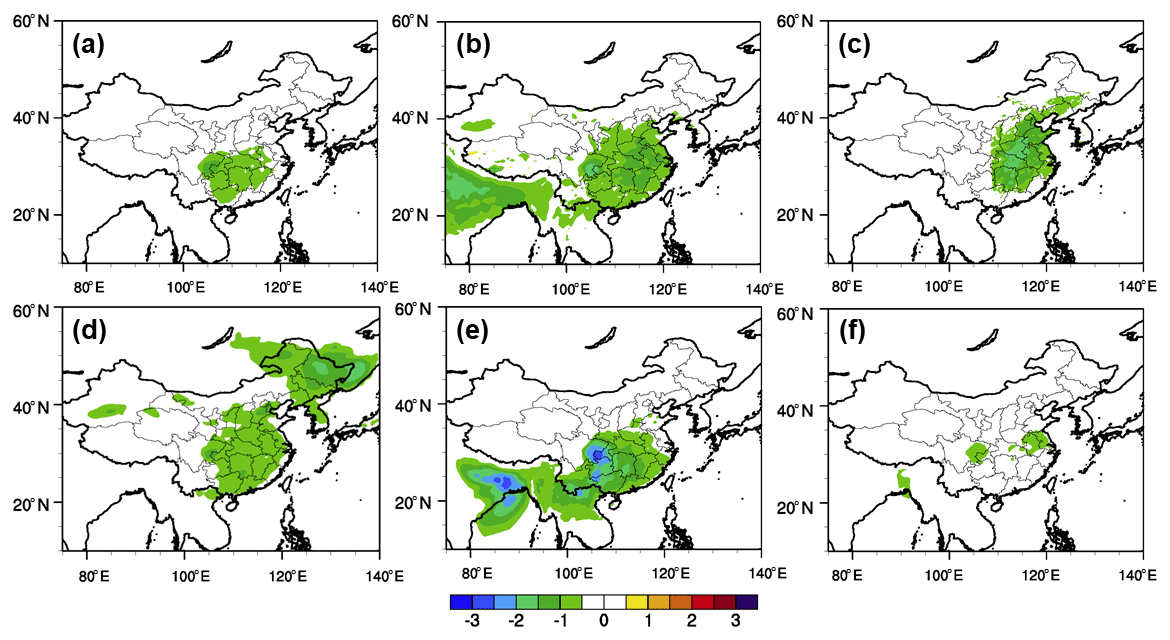
Figure 3Monthly (January 2010) mean changes in temperature at 2 m (T2, ∘C) due to aerosol radiative effects from M1 (a), M2 (b), M4 (c), M5 (d), M6 (e), and M7 (f) (M1: Pusan National University; M2: University of Iowa; M4: NASA; M5: Institute of Atmospheric Physics; M6: Nanjing University; M7: University of Tennessee; Gao et al., 2018a).
Table 4Mean aerosol (January 2010) direct radiative forcing (W m−2) and changes in T2 (∘C), Q2 (g kg−1), WS10 (0.1 m s−1), and PM2.5 (µg m−3) for Beijing and the Beijing–Tianjin–Hebei (BTH) region averaged over 17–19 January 2010 (areas marked in Fig. S1).
Pronounced decreases in water vapor at 2 m (Q2) are mostly located in southern China (Fig. 4), where water vapor is more abundant due to the proximity to the sea. During extreme haze days, the aerosol–radiation feedback-induced decreases in Q2 in the BTH region from multiple models range from 0.07 to 0.29 g kg−1, with the lowest estimate from M1 and the highest from M4 (Table 4).
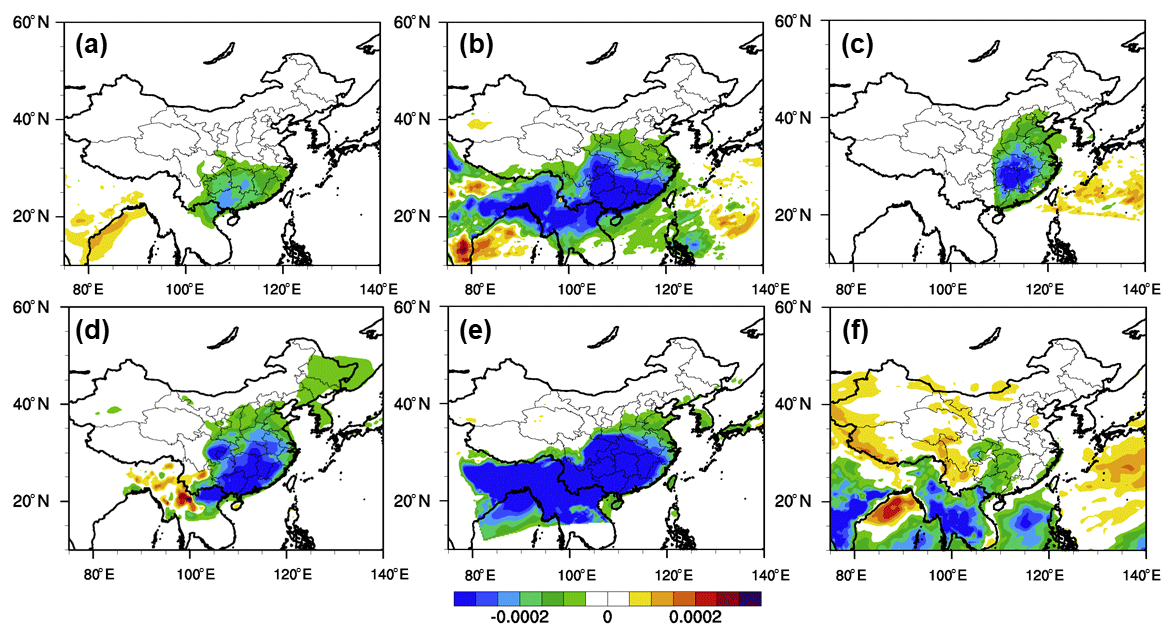
Figure 4Monthly (January 2010) mean changes in water vapor at 2 m (Q2, kg kg−1) due to aerosol radiative effects from M1 (a), M2 (b), M4 (c), M5 (d), M6 (e), M7 (f) (M1: Pusan National University; M2: University of Iowa; M4: NASA; M5: Institute of Atmospheric Physics; M6: Nanjing University; M7: University of Tennessee; Gao et al., 2018a).
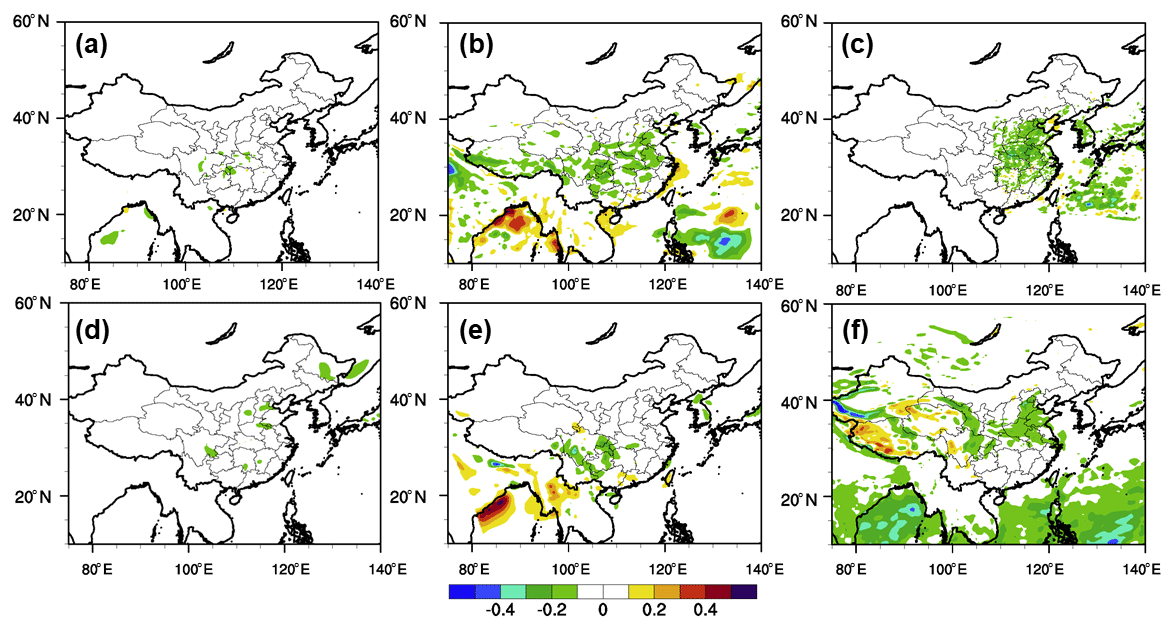
Figure 5Monthly (January 2010) mean changes in wind speeds at 10 m (WS10, m s−1) due to aerosol radiative effects from M1 (a), M2 (b), M4 (c), M5 (d), M6 (e), and M7 (f) (M1: Pusan National University; M2: University of Iowa; M4: NASA; M5: Institute of Atmospheric Physics; M6: Nanjing University; M7: University of Tennessee; Gao et al., 2018a).
The responses of wind speeds at 10 m (WS10) inferred from different models are generally consistent, displaying decreases in eastern China except M6 (Fig. 5). In the BTH region, the monthly mean aerosol–radiation feedback-induced decreases in WS10 range from 0.02 to 0.09 m s−1 (Table 2), and more pronounced reductions are suggested by M4 and M7 (Fig. 5).

Figure 6Monthly (January 2010) mean changes in surface PM2.5 (µg m−3) due to aerosol radiative effects from M1 (a), M2 (b), M4 (c), M5 (d), M6 (e), and M7 (f) (M1: Pusan National University; M2: University of Iowa; M4: NASA; M5: Institute of Atmospheric Physics; M6: Nanjing University; M7: University of Tennessee; Gao et al., 2018a).
Because of aerosol–radiation feedback, most models report that surface PM2.5 concentrations are enhanced in China, with the exception of M6 (Fig. 6). It is also noteworthy that PM2.5 concentrations decrease in the Gobi desert and Taklimakan desert of western China in M5 and M2, which is caused by the decreased wind speed near the surface due to the weakened downward transport of momentum from upper layer above boundary layer to the surface (Han et al., 2013). The changes in PM2.5 concentrations suggested by M6 are patchy over east China, with decreases to the north and to the southwest. The monthly mean PM2.5 are enhanced by 0.1–1.4 µg m−3 for Beijing and by 0.8–2.2 µg m−3 for the BTH region. The enhancement fractions are generally below 2 % for Beijing and below 4 % for the BTH region (Table 2).
To further understand how aerosol–radiation feedback contributes to the formation of haze event, we calculate the mean increase during extreme haze days (17–19 January). For the BTH region, the contribution of aerosol–radiation feedback to PM2.5 concentrations are lower than 4 %, and the enhancement are below 8.5 µg m−3. Gao et al. (2017) demonstrates that the aerosol–radiation feedback-induced changes in PM2.5 are negligible during nighttime, so we further calculate daytime mean changes, as listed in Table 4. For the BTH region, M2 reports the largest enhancement (12.9 µg m−3) of PM2.5 concentrations during daytime. Other models, except M6, report similar magnitudes of enhancement, ranging from 5.3 to 6.6 µg m−3. The enhancement fraction remains less than 6 % for the BTH region and below 8.3 % for Beijing. Table 4 also displays the maximum enhancement of PM2.5 during haze days over the BTH region. M7 suggests the largest PM2.5 enhancement (up to 60.9 µg m−3), followed by M2 (up to 55.4 µg m−3). The other three models, M1, M4, M5, and M6, indicate the aerosol–radiation-induced increase in PM2.5 can reach up to more than 20 µg m−3 in the BTH region (Table 4).
The contributions of aerosol–radiation feedback to haze formation in China have been investigated in many previous studies (Ding et al., 2016; Gao et al., 2015, 2016; Liu et al., 2018; J. Wang et al., 2014; Z. Wang et al., 2014; Wang et al., 2015; Wu et al., 2019; Zhang et al., 2015, 2018; Zhong et al., 2018), but the reported values diverge. Ding et al. (2016), J. Wang et al. (2014), and Zhong et al. (2018) indicate that the aerosol radiative effects can increase PM2.5 by more than 100 µg m−3 (maximum hourly changes) or +70 %. Gao et al. (2015), Z. Wang et al. (2014), Wang et al. (2015), and Zhang et al. (2018) suggest that the contributions are generally within the range of 10 %–30 %. These reports are different from this study in terms of study periods, region, and pollution levels. Most of the previous reports focused on the January 2013 haze episodes (J. Wang et al., 2014), while the monthly mean concentrations of PM2.5 in January 2010 are nearly 50 % lower than those of January 2013. According to the findings in this study, the contribution of aerosol–radiation feedback to haze formation during January 2010 is generally below 10 %. Uncertainties still remain as suggested by the errors in the simulated chemical compositions (Gao et al., 2018a). Concentrations of sulfate and organic aerosol are generally underestimated by most of the participating models, and M4 overestimates the concentrations of organic aerosols (Gao et al., 2018a). These model errors were attributed to the incomplete multiphase oxidation mechanisms of sulfate, and different treatments of secondary organic aerosol (SOA) formation in these models (Gao et al., 2018a).
To explore the potential causes for the differences among models, and the major factors that influence aerosol–radiation feedback, several sensitivity simulations were conducted with the RIEMS-Chem model (M5) (Han, 2010). These simulations aim to examine the effects of mixing states of aerosols, hygroscopic growth, black carbon, and soil dust.
5.1 Aerosol mixing states
In the control simulation, inorganic aerosols and BC are assumed to be internally mixed to form a homogeneous mixture. The refractive index of this mixture is estimated using the volume-weighted average of the refractive index of individual component. The size of the mixture is prescribed to be the maximum size of the mixed aerosol components. For example, the size of the mixture of sulfate and BC is set to be equal to the size of sulfate, assuming a small BC particle sticking to a larger sulfate particle.
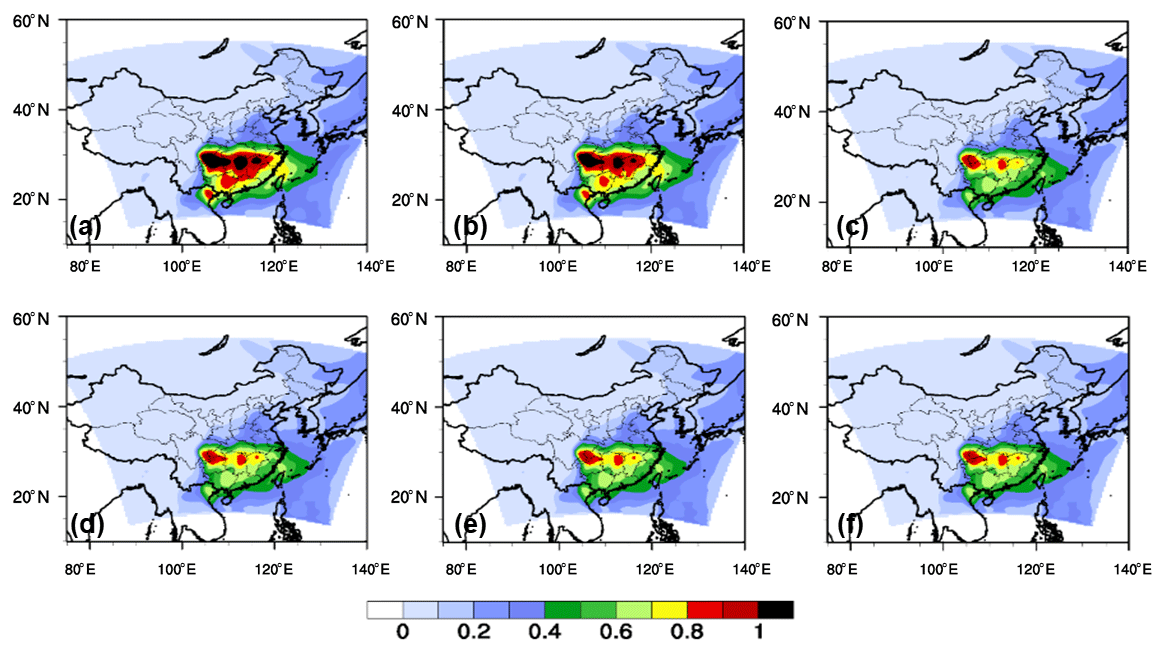
Figure 7Monthly (January 2010) mean RIEMS-Chem modeled AOD from different simulations: control run (default simulation with internal mixing assumption) (a), external mixing assumption (b), internal mixing assumption but without BC (c), internal mixing assumption but with doubled BC (d), without dust and sea-salt (e), and reduced RH (f).
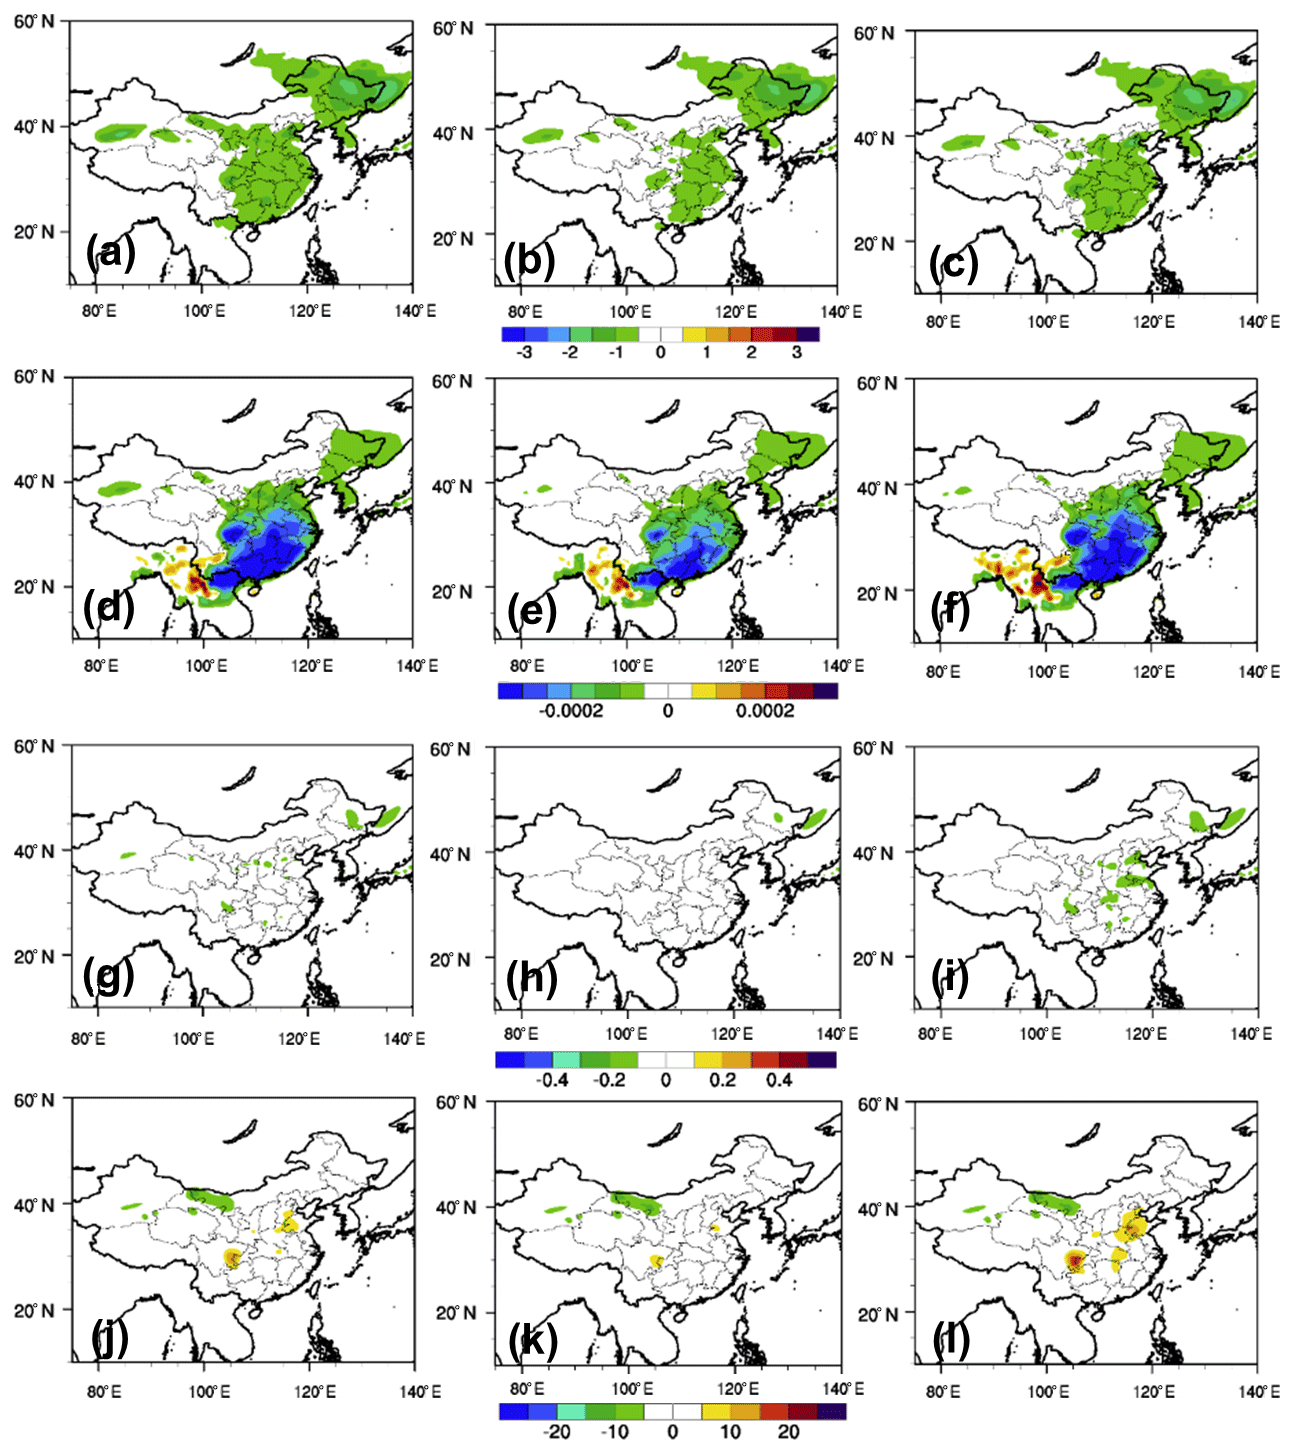
Figure 8Monthly (January 2010) mean RIEMS-Chem modeled changes in T2 (∘C), Q2 (kg kg−1), WS10 (m s−1), and PM2.5 (µg m−3) from different simulations: external mixing assumption (first column), internal mixing assumption but without BC (second column), and internal mixing assumption but with doubled BC (third column).
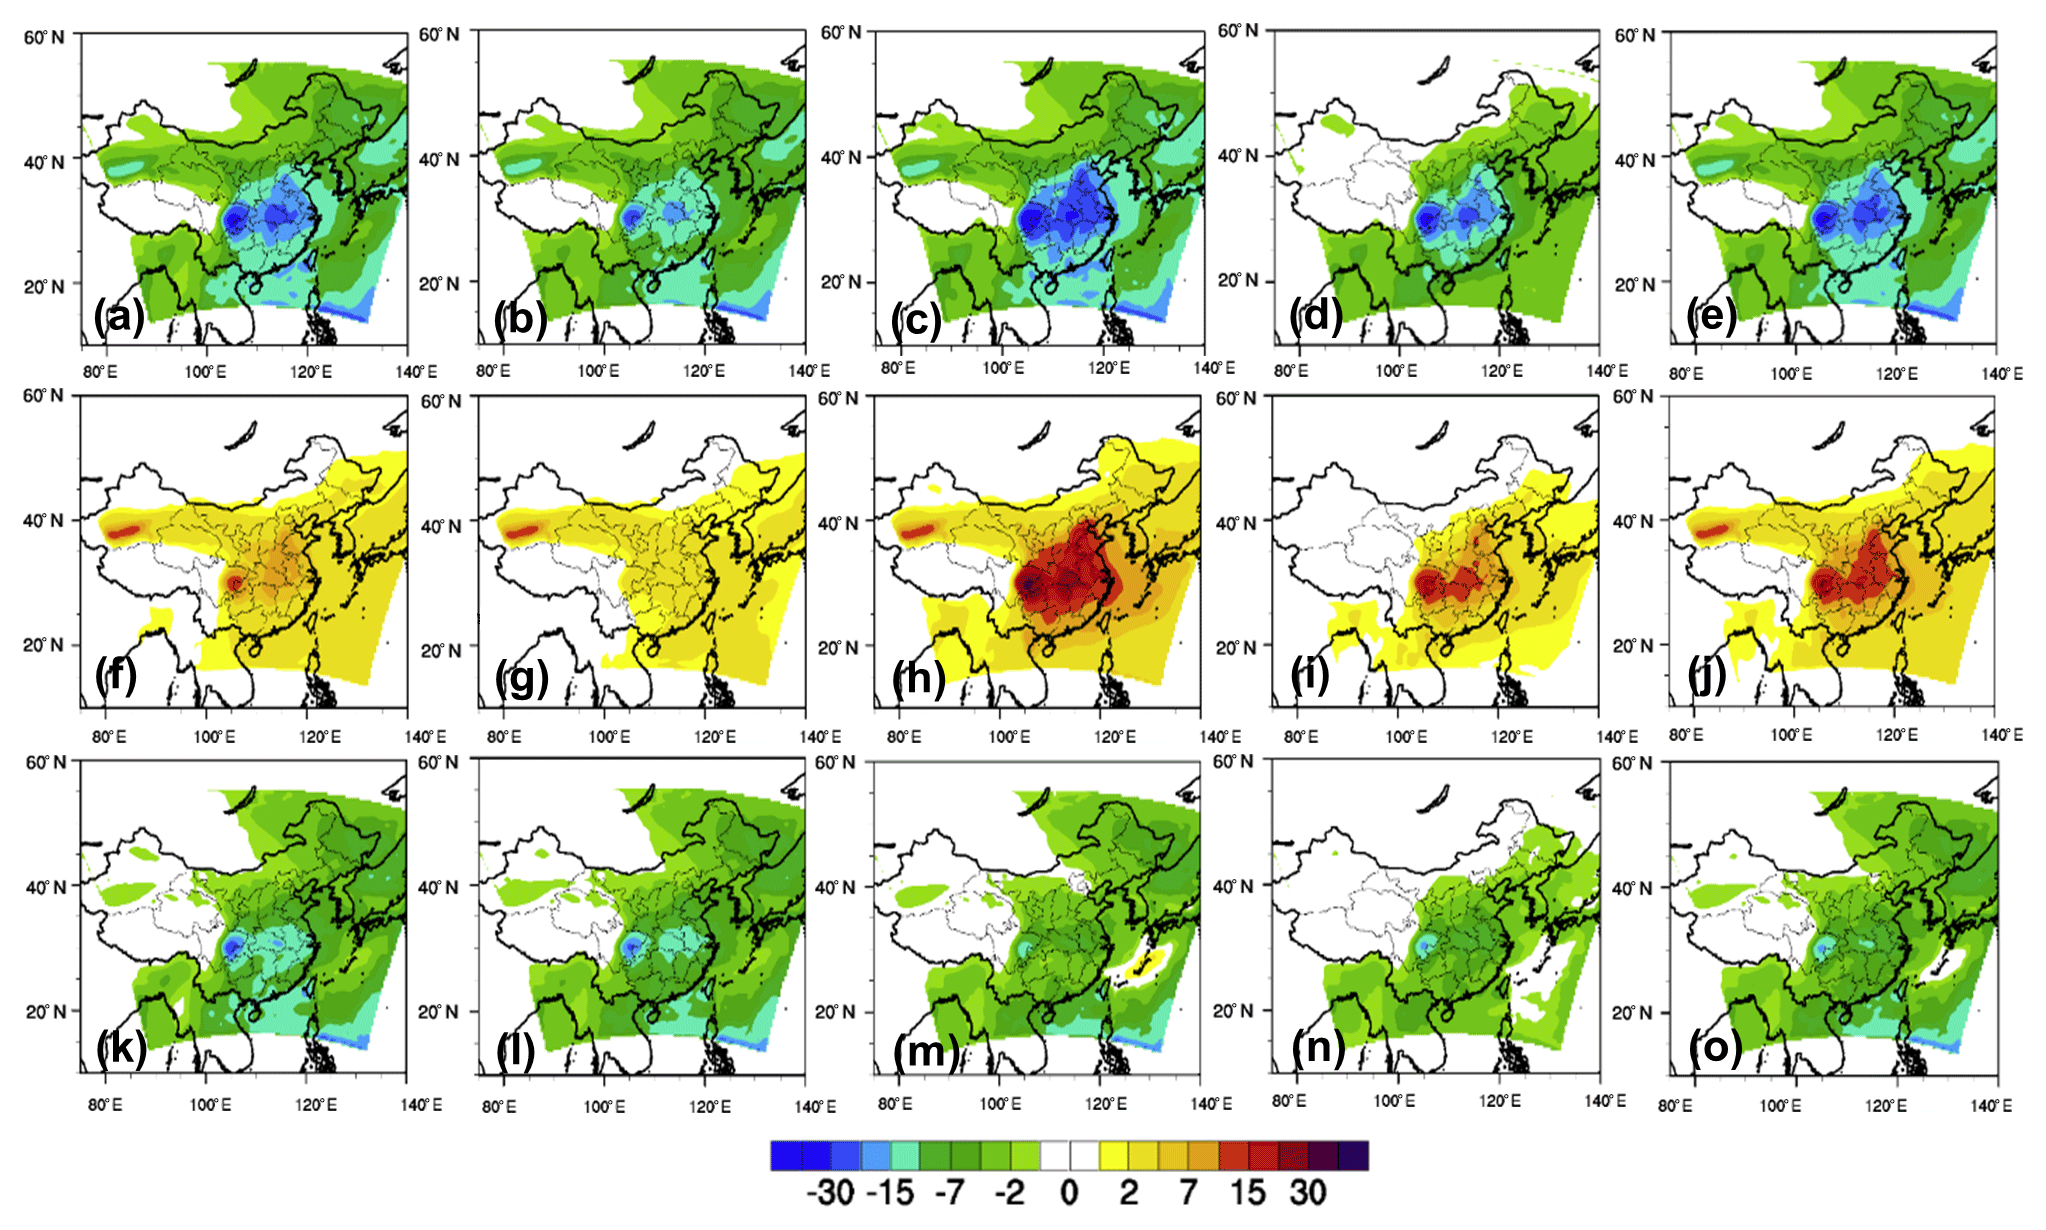
Figure 9Monthly (January 2010) mean RIEMS-Chem modeled aerosol direct radiative forcing at the surface (a–e), inside the atmosphere (f–j), and at the top of the atmosphere (k–o) from different simulations: external mixing assumption (first column), internal mixing assumption but without BC (second column), internal mixing assumption but with doubled BC (third column), without dust and sea-salt (fourth column), and reduced RH (fifth column).
An additional simulation was conducted with the aerosols were treated as externally mixed, and the corresponding results are displayed in Figs. 7–9. For external mixing assumption, each aerosol component is considered individually, and the total AOD is calculated as the sum of extinction by each aerosol component. Compared with the results with internal mixing assumption, results with external mixing assumption generally exhibit a weaker (negative) ADRF at the surface (∼15 %), a stronger (negative) ADRF at TOA (∼50 %), and a decreased (positive) ADRF in the atmosphere (∼30 %) (Fig. 9a, f, k). These responses of ADRF to the assumption of aerosol mixing states are consistent with Conant et al. (2003). However, Curci et al. (2015) reported lower AOD with internal mixing assumption than with external mixing assumption. In Curci et al. (2015), aerosol mass was distributed in less numerous particles with larger sizes. As a result, fewer scattering agents and lower AOD were estimated.
Aerosol feedbacks estimated by M5 also tend to be weaker with external mixing assumption than with internal mixing assumption (changes in surface meteorological variables and PM2.5 concentrations; Fig. 8a, d, g, and j). The monthly averaged changes in T2, WS10, and PM2.5 are −0.6 ∘C, −0.04 m s−1, and 2.2 µg m−3, respectively, for the BTH region with internal mixing assumption, while the corresponding values change to −0.6 ∘C, −0.03 m s−1, and 1.8 µg m−3 with external mixing assumption. These differences emphasize the important influences of aerosol mixing states on the estimates of ADRF and aerosol feedbacks. However, aerosol mixing states are also varying with time and location. Measurements in northern China suggest that aerosols are partially internally mixed, and the fraction of internal mixing increased from clean to haze periods (Li et al., 2014).
5.2 Hygroscopic growth
Given the appreciable effect of aerosol hygroscopic growth on ADRF (Li et al., 2014), another simulation was conducted with decreased relative humidity (RH). In this simulation, FNL (final) analysis data nudging was applied above boundary layer to reduce RH. This perturbation of RH was based on the fact that M5 overestimates relative humidity (water vapor mixing ratio) (Gao et al., 2017). With FNL nudging, RH was reduced by 5 %–10 % in the BTH and by ∼25 % in the middle and lower reaches of the Yangtze River, leading to lower values of AOD (Fig. 7f) and weaker ADRF at the surface and TOA (Fig. 9e, j, and o, about 10 % lower in the BTH region).
5.3 Soil dust and sea salt
M5 (RIEMS-Chem) includes naturally emitted soil dust and sea salt, while the other models except M2 (WRF-Chem, University of Iowa) do not consider soil dust in their model settings. In an additional sensitivity simulation, soil dust and sea salt emissions were turned off in M5 to examine the influence on ADRF and aerosol feedbacks (Fig. 9d, l and n). In January 2010, significant amounts of soil dust were emitted from the Taklimakan desert, influencing wide areas of China. M5 estimates that the monthly mean ADRF at the surface due to dust and sea salt is about −12 W m−2 over the Taklimakan desert, −4 to −6 W m−2 in the middle reaches of the Yellow River and the Yangtze River Delta and about −2 to −4 W m−2 over the BTH region. Over the BTH region, the contribution of dust and sea salt aerosols to total ADRF can reach 5 %–10 %. Table 2 illustrates that M5 predicts the largest (negative) radiative forcing at TOA over the BTH region. The above analyses with reduced relative humidity and perturbations in dust and sea salt suggest that the inclusion of dust and overprediction of relative humidity by M5 are important reasons.
5.4 The effect of BC
Two sets of simulations, namely without BC and with doubled BC concentrations, were conducted to examine the influences of BC on aerosol radiative forcing and feedbacks. In the control simulation, the aerosol-induced changes in monthly T2, WS10 and PM2.5 are −0.6 ∘C, −0.04 m s−1, and 2.2 µg m−3 for the BTH region, respectively. When BC is not included (only scattering aerosols and dust), the corresponding aerosol-induced changes are −0.5 ∘C, −0.02 m s−1, and 1.0 µg m−3, respectively. When BC concentrations are doubled, these values change to −0.7 ∘C, −0.05 m s−1, and 3.2 µg m−3, respectively. The comparison between the control case and two additional sensitivity cases indicates that the changes caused by BC are comparable to those by scattering aerosols. The contribution of BC to aerosol feedbacks can reach up to 40 %–50 %. It is also found that the influence of BC on aerosol feedbacks with internal mixing assumption is larger than that with external mixing assumption (Figure not shown).
Large uncertainties still remain in the estimates of the role of BC in aerosol feedbacks relative to scattering aerosols. Gao et al. (2016) suggested that the impacts of BC on boundary layer height and PM2.5 concentrations can account for as high as 60 % of the total aerosol feedbacks in the North China Plain at 14:00 LT, although it only accounts for a small share of PM in terms of mass concentration. Qiu et al. (2017) indicated that PM2.5 concentrations averaged over the North China Plain increased by 16.8 % and 1.0 % due to scattering aerosols and BC, respectively. It should be noted that most participating models, including RIEMS-Chem, tend to underpredict the total mass concentrations of scattering aerosols (inorganic and organic aerosols) by up to a factor of 2 over the study period, leading to overestimation of the contribution of BC.
Topic 3 of MICS-Asia III (Gao et al., 2018a) focuses on understanding how current online coupled air quality models perform in capturing extreme aerosol pollution events in northern China and how aerosols interact with radiation and weather. Seven applications of different online coupled meteorology–chemistry models were involved in this activity. Gao et al. (2018a) has demonstrated that main features of the accumulation of air pollutants are generally well represented, while large differences in the models were found in the predicted PM2.5 chemical compositions. These inconsistencies would lead to differences in estimated ADRF and aerosol feedbacks.
The spatial distributions of ADRF at the surface and inside the atmosphere inferred from multiple models are generally consistent, but the spatial distributions of ADRF at the TOA estimated by these models greatly differ. Over the BTH region, the ensemble mean of ADRF at the TOA, inside the atmosphere, and at the surface are −1.1, 7.7, and −8.8 W m−2, respectively. Subdivisions of direct and indirect aerosol radiative forcing confirm the dominant roles of direct forcing.
During severe haze days (17–19 January), the averaged reduction in T2 for the BTH region can reach 0.3–1.6 ∘C. The responses of wind speeds at 10 m (WS10) inferred from different models show consistent declines in eastern China. For the BTH region, aerosol–radiation feedback-induced changes in daytime PM2.5 range from 5.3 to 12.9 µg m−3 (<6 %). Our findings differ from previous studies (Ding et al., 2016; Gao et al., 2015, 2016; Liu et al., 2018; J. Wang et al., 2014; Z. Wang et al., 2014b; Wang et al., 2015; Wu et al., 2019; Zhang et al., 2015, 2018; Zhong et al., 2018) in terms of study period, region, and pollution levels. The monthly mean concentrations of PM2.5 in January 2010 (current study period) are about 50 % lower than those in January 2013.
Sensitivity simulations were conducted with the RIEMS-Chem model (M5) to understand the influences of aerosol mixing states, hygroscopic growth, black carbon, and soil dust. The results indicate the important effect of aerosol mixing states on the estimates of ADRF and aerosol feedbacks. It was also found that BC exhibits a large contribution to atmospheric heating and feedbacks, but uncertainties remain in estimating its contribution given the fact that the observed aerosol chemical components were not perfectly simulated. Huang et al. (2015) separated the contributions of different aerosol components to aerosol direct radiative forcing, highlighting the roles of BC and sulfate. Future studies are also needed to improve predictions of aerosol chemical components and to separate the effects of individual aerosol component on aerosol feedbacks.
The measurements and model simulation data can be accessed by contacting the corresponding authors.
The supplement related to this article is available online at: https://doi.org/10.5194/acp-20-1147-2020-supplement.
MG, ZH, and GRC designed the study, and MG processed and analyzed the data. ZT and MC provided the NU-WRF model results; JL and ZH provided the RIEMS-Chem model results; JEK, HJL, and CHK provided the WRF-Chem model results; KH, XD, and JSF provided the WRF-CMAQ model results; BZ, SL, and TW provided the RegCCMS model results; ML, JHW, QZ and YC provided the emission data; BG, QW, and ZW managed the submission and sharing of data. MG, ZH, and GRC wrote the paper with inputs from all other authors.
The authors declare that they have no conflict of interest.
This article is part of the special issue “Regional assessment of air pollution and climate change over East and Southeast Asia: results from MICS-Asia Phase III”. It is not associated with a conference.
The authors would like to acknowledge support for this project from the National Natural Science Foundation of China (91644217 and 41620104008). This work was supported also by the special fund of the State Key Joint Laboratory of Environment Simulation and Pollution Control (19K03ESPCT), the Natural Science Foundation of Guangdong Province (2019A1515011633), and the National Natural Science Foundation of China (NSFC91543202).
This research has been supported by the National Natural Science Foundation of China (grant nos. 91644217, 41620104008, and NSFC91543202), the special fund of the State Key Joint Laboratory of Environment Simulation and Pollution Control (grant no. 19K03ESPCT), and the Natural Science Foundation of Guangdong Province (grant no. 2019A1515011633).
This paper was edited by Jianping Huang and reviewed by two anonymous referees.
Albrecht, B. A.: Aerosols, cloud microphysics, and fractional cloudiness, Science, 245, 1227–1230, https://doi.org/10.1126/science.245.4923.1227, 1989.
Baklanov, A., Schlünzen, K., Suppan, P., Baldasano, J., Brunner, D., Aksoyoglu, S., Carmichael, G., Douros, J., Flemming, J., Forkel, R., Galmarini, S., Gauss, M., Grell, G., Hirtl, M., Joffre, S., Jorba, O., Kaas, E., Kaasik, M., Kallos, G., Kong, X., Korsholm, U., Kurganskiy, A., Kushta, J., Lohmann, U., Mahura, A., Manders-Groot, A., Maurizi, A., Moussiopoulos, N., Rao, S. T., Savage, N., Seigneur, C., Sokhi, R. S., Solazzo, E., Solomos, S., Sørensen, B., Tsegas, G., Vignati, E., Vogel, B., and Zhang, Y.: Online coupled regional meteorology chemistry models in Europe: current status and prospects, Atmos. Chem. Phys., 14, 317–398, https://doi.org/10.5194/acp-14-317-2014, 2014.
Baklanov, A., Brunner, D., Carmichael, G., Flemming, J., Freitas, S., Gauss, M., Hov, Ø., Mathur, R., Schlünzen, K. H., Seigneur, C., and Vogel, B.: Key Issues for Seamless Integrated Chemistry–Meteorology Modeling, B. Am. Meteorol. Soc., 98, 2285–2292, https://doi.org/10.1175/bams-d-15-00166.1, 2017.
Chen, S., Huang, J., Zhao, C., Qian, Y., Leung, L. R., and Yang, B.: Modeling the transport and radiative forcing of Taklimakan dust over the Tibetan Plateau: A case study in the summer of 2006, J. Geophys. Res.-Atmos., 118, 797–812, https://doi.org/10.1002/jgrd.50122, 2013.
Chen, S., Yuan, T., Zhang, X., Zhang, G., Feng, T., Zhao, D., Zang, Z., Liao, S., Ma, X., Jiang, N., and Zhang, J.: Dust modeling over East Asia during the summer of 2010 using the WRF-Chem model, J. Quant. Spectrosc. Ra., 213, 1–12, https://doi.org/10.1016/j.jqsrt.2018.04.013, 2018.
Chung, C. E., Ramanathan, V., Kim, D., and Podgorny, I. A.: Global anthropogenic aerosol direct forcing derived from satellite and ground-based observations, J. Geophys. Res.-Atmos., 110, D24207, https://doi.org/10.1029/2005jd006356, 2005.
Chung, C. E., Ramanathan, V., Carmichael, G., Kulkarni, S., Tang, Y., Adhikary, B., Leung, L. R., and Qian, Y.: Anthropogenic aerosol radiative forcing in Asia derived from regional models with atmospheric and aerosol data assimilation, Atmos. Chem. Phys., 10, 6007–6024, https://doi.org/10.5194/acp-10-6007-2010, 2010.
Conant, W. C., Seinfeld, J. H., Wang, J., Carmichael, G. R., Tang, Y., Uno, I., Flatau, P. J., Markowicz, K. M., and Quinn, P. K.: A model for the radiative forcing during ACE–Asia derived from CIRPAS Twin Otter and R/V Ronald H. Brown data and comparison with observations, J. Geophys. Res.-Atmos., 108, 8661, https://doi.org/10.1029/2002JD003260, 2003.
Curci, G., Hogrefe, C., Bianconi, R., Im, U., Balzarini, A., Baró, R., Brunner, D., Forkel, R., Giordano, L., Hirtl, M., Honzak, L., Jiménez-Guerrero, P., Knote, C., Langer, M., Makar, P. A., Pirovano, G., Pérez, J. L., San José, R., Syrakov, D., Tuccella, P., Werhahn, J., Wolke, R., Žabkar, R., Zhang, J., and Galmarini, S.: Uncertainties of simulated aerosol optical properties induced by assumptions on aerosol physical and chemical properties: An AQMEII-2 perspective, Atmos. Environ., 115, 541–552, 2015.
Ding, A. J., Huang, X., Nie, W., Sun, J. N., Kerminen, V. M., Petäjä, T., Su, H., Cheng, Y. F., Yang, X. Q., Wang, M. H., and Chi, X. G.: Enhanced haze pollution by black carbon in megacities in China, Geophys. Res. Lett., 43, 2873–2879, https://doi.org/10.1002/2016gl067745, 2016.
Fast, J. D., Gustafson, W. I., Easter, R. C., Zaveri, R. A., Barnard, J. C., Chapman, E. G., Grell, G. A., and Peckham, S. E.: Evolution of ozone, particulates, and aerosol direct radiative forcing in the vicinity of Houston using a fully coupled meteorology-chemistry-aerosol model, J. Geophys. Res.-Atmos., 111, D21305, https://doi.org/10.1029/2005JD006721, 2006.
Forkel, R., Balzarini, A., Baró, R., Bianconi, R., Curci, G., Jiménez-Guerrero, P., Hirtl, M., Honzak, L., Lorenz, C., Im, U., Pérez, J. L., Pirovano, G., José, R. S., Tuccella, P., Werhahn, J., and Zabkar, R.: Analysis of the WRF-Chem contributions to AQMEII phase2 with respect to aerosol radiative feedbacks on meteorology and pollutant distributions, Atmos. Environ., 115, 630–645, 2015.
Gao, Y., Zhang, M., Liu, Z., Wang, L., Wang, P., Xia, X., Tao, M., and Zhu, L.: Modeling the feedback between aerosol and meteorological variables in the atmospheric boundary layer during a severe fog–haze event over the North China Plain, Atmos. Chem. Phys., 15, 4279–4295, https://doi.org/10.5194/acp-15-4279-2015, 2015.
Gao, M., Carmichael, G. R., Wang, Y., Saide, P. E., Yu, M., Xin, J., Liu, Z., and Wang, Z.: Modeling study of the 2010 regional haze event in the North China Plain, Atmos. Chem. Phys., 16, 1673–1691, https://doi.org/10.5194/acp-16-1673-2016, 2016.
Gao, M., Carmichael, G. R., Wang, Y., Saide, P. E., Liu, Z., Xin, J., Shan, Y., and Wang, Z.: Chemical and Meteorological Feedbacks in the Formation of Intense Haze Events, in: Air Pollution in Eastern Asia: An Integrated Perspective, Springer, Cham, 437–452, https://doi.org/10.1007/978-3-319-59489-7_21, 2017.
Gao, M., Han, Z., Liu, Z., Li, M., Xin, J., Tao, Z., Li, J., Kang, J.-E., Huang, K., Dong, X., Zhuang, B., Li, S., Ge, B., Wu, Q., Cheng, Y., Wang, Y., Lee, H.-J., Kim, C.-H., Fu, J. S., Wang, T., Chin, M., Woo, J.-H., Zhang, Q., Wang, Z., and Carmichael, G. R.: Air quality and climate change, Topic 3 of the Model Inter-Comparison Study for Asia Phase III (MICS-Asia III) – Part 1: Overview and model evaluation, Atmos. Chem. Phys., 18, 4859–4884, https://doi.org/10.5194/acp-18-4859-2018, 2018a.
Gao, M., Ji, D., Liang, F., and Liu, Y.: Attribution of aerosol direct radiative forcing in China and India to emitting sectors, Atmos. Environ., 190, 35–42, https://doi.org/10.1016/j.atmosenv.2018.07.011, 2018b.
Gao, M., Liu, Z., Zheng, B., Ji, D., Sherman, P., Song, S., Xin, J., Liu, C., Wang, Y., Zhang, Q., Wang, Z., Carmichael, G., and McElroy, M.: China's Clean Air Action has suppressed unfavorable influences of climate on wintertime PM2.5 concentrations in Beijing since 2002, Atmos. Chem. Phys. Discuss., https://doi.org/10.5194/acp-2019-325, in review, 2019a.
Gao, M., Sherman, P., Song, S., Yu, Y., Wu, Z., and McElroy, M. B.: Seasonal prediction of Indian wintertime aerosol pollution using the ocean memory effect, Sci. Adv., 5, eaav4157, https://doi.org/10.1126/sciadv.aav4157, 2019b.
Grell, G. A., Peckham, S. E., Schmitz, R., McKeen, S. A., Frost, G., Skamarock, W. C., and Eder, B.: Fully coupled “online” chemistry within the WRF model, Atmos. Environ., 39, 6957–6975, 2005.
Han, Z.: Direct radiative effect of aerosols over East Asia with a regional coupled climate/chemistry model, Meteorol. Z., 19, 287–298, https://doi.org/10.1127/0941-2948/2010/0461, 2010.
Han, Z., Li, J., Guo, W., Xiong, Z., and Zhang, W.: A study of dust radiative feedback on dust cycle and meteorology over East Asia by a coupled regional climate-chemistry-aerosol model, Atmos. Environ., 68, 54–63, https://doi.org/10.1016/j.atmosenv.2012.11.032, 2013.
Haywood, J. and Boucher, O.: Estimates of the direct and indirect radiative forcing due to tropospheric aerosols: A review, Rev. Geophys., 38, 513–543, https://doi.org/10.1029/1999rg000078, 2000.
Huang, J., Lin, B., Minnis, P., Wang, T., Wang, X., Hu, Y., Yi, Y., and Ayers, J.K.: Satellite-based assessment of possible dust aerosols semi-direct effect on cloud water path over East Asia, Geophys. Res. Lett., 33, L19802, https://doi.org/10.1029/2006GL026561, 2006.
Huang, X., Song, Y., Zhao, C., Cai, X., Zhang, H., and Zhu, T.: Direct radiative effect by multicomponent aerosol over China, J. Climate., 28, 3472–3495, https://doi.org/10.1175/JCLI-D-14-00365.1, 2015.
Huang, X., Ding, A., Liu, L., Liu, Q., Ding, K., Niu, X., Nie, W., Xu, Z., Chi, X., Wang, M., Sun, J., Guo, W., and Fu, C.: Effects of aerosol–radiation interaction on precipitation during biomass-burning season in East China, Atmos. Chem. Phys., 16, 10063–10082, https://doi.org/10.5194/acp-16-10063-2016, 2016.
Jacobson, M. Z., Kaufman, Y. J., and Rudich, Y.: Examining feedbacks of aerosols to urban climate with a model that treats 3-D clouds with aerosol inclusions, J. Geophys. Res.-Atmos., 112, D24205, https://doi.org/10.1029/2007jd008922, 2007.
Jia, R., Liu, Y., Hua, S., Zhu, Q., and Shao, T.: Estimation of the aerosol radiative effect over the Tibetan Plateau based on the latest CALIPSO product, J. Meteorol. Res., 32, 707–722, https://doi.org/10.1007/s13351-018-8060-3, 2018.
Li, J., Han, Z., and Zhang, R.: Influence of aerosol hygroscopic growth parameterization on aerosol optical depth and direct radiative forcing over East Asia, Atmos. Res., 140–141, 14–27, https://doi.org/10.1016/j.atmosres.2014.01.013, 2014.
Li, M., Zhang, Q., Kurokawa, J.-I., Woo, J.-H., He, K., Lu, Z., Ohara, T., Song, Y., Streets, D. G., Carmichael, G. R., Cheng, Y., Hong, C., Huo, H., Jiang, X., Kang, S., Liu, F., Su, H., and Zheng, B.: MIX: a mosaic Asian anthropogenic emission inventory under the international collaboration framework of the MICS-Asia and HTAP, Atmos. Chem. Phys., 17, 935–963, https://doi.org/10.5194/acp-17-935-2017, 2017.
Li, Z., Lee, K. H., Wang, Y., Xin, J., and Hao, W. M.: First observation-based estimates of cloud-free aerosol radiative forcing across China, J. Geophys. Res.-Atmos., 115, D00K18, https://doi.org/10.1029/2009jd013306, 2010.
Liu, Q., Jia, X., Quan, J., Li, J., Li, X., Wu, Y., Chen, D., Wang, Z., and Liu, Y.: New positive feedback mechanism between boundary layer meteorology and secondary aerosol formation during severe haze events, Sci. Rep., 8, 6095, https://doi.org/10.1038/s41598-018-24366-3, 2018.
Liu, Y., Huang, J., Shi, G., Takamura, T., Khatri, P., Bi, J., Shi, J., Wang, T., Wang, X., and Zhang, B.: Aerosol optical properties and radiative effect determined from sky-radiometer over Loess Plateau of Northwest China, Atmos. Chem. Phys., 11, 11455–11463, https://doi.org/10.5194/acp-11-11455-2011, 2011.
Liu, Y., Sato, Y., Jia, R., Xie, Y., Huang, J., and Nakajima, T.: Modeling study on the transport of summer dust and anthropogenic aerosols over the Tibetan Plateau, Atmos. Chem. Phys., 15, 12581–12594, https://doi.org/10.5194/acp-15-12581-2015, 2015.
Lohmann, U. and Feichter, J.: Global indirect aerosol effects: a review, Atmos. Chem. Phys., 5, 715–737, https://doi.org/10.5194/acp-5-715-2005, 2005.
Peters-Lidard, C. D., Kemp, E. M., Matsui, T., Santanello Jr., J. A., Kumar, S. V., Jacob, J. P., Clune, T., Tao, W.-K., Chin, M., Hou, A., Case, J. L., Kim, D., Kim, K.-M., Lau, W., Liu, Y., Shi, J., Starr, D., Tan, Q., Tao, Z., Zaitchik, B. F., Zavodsky, B., Zhang, S. Q., and Zupanski, M.: Integrated modeling of aerosol, cloud, precipitation and land processes at satellite-resolved scales, Environ. Model. Softw., 67, 149–159, https://doi.org/10.1016/j.envsoft.2015.01.007, 2015.
Qiu, Y., Liao, H., Zhang, R., and Hu, J.: Simulated impacts of direct radiative effects of scattering and absorbing aerosols on surface layer aerosol concentrations in China during a heavily polluted event in February 2014, J. Geophys. Res.-Atmos., 122, 5955–5975, https://doi.org/10.1002/2016JD026309, 2017.
Saide, P. E., Spak, S. N., Carmichael, G. R., Mena-Carrasco, M. A., Yang, Q., Howell, S., Leon, D. C., Snider, J. R., Bandy, A. R., Collett, J. L., Benedict, K. B., de Szoeke, S. P., Hawkins, L. N., Allen, G., Crawford, I., Crosier, J., and Springston, S. R.: Evaluating WRF-Chem aerosol indirect effects in Southeast Pacific marine stratocumulus during VOCALS-REx, Atmos. Chem. Phys., 12, 3045–3064, https://doi.org/10.5194/acp-12-3045-2012, 2012.
Twomey, S.: Aerosols, clouds and radiation, Atmos. Environ. A-Gen., 25, 2435–2442, https://doi.org/10.1016/0960-1686(91)90159-5, 1991.
Wang, H., Xue, M., Zhang, X. Y., Liu, H. L., Zhou, C. H., Tan, S. C., Che, H. Z., Chen, B., and Li, T.: Mesoscale modeling study of the interactions between aerosols and PBL meteorology during a haze episode in Jing–Jin–Ji (China) and its nearby surrounding region – Part 1: Aerosol distributions and meteorological features, Atmos. Chem. Phys., 15, 3257–3275, https://doi.org/10.5194/acp-15-3257-2015, 2015.
Wang, J., Wang, S., Jiang, J., Ding, A., Zheng, M., Zhao, B., Wong, D. C., Zhou, W., Zheng, G., Wang, L., and Pleim, J. E.: Impact of aerosol–meteorology interactions on fine particle pollution during China's severe haze episode in January 2013, Environ. Res. Lett., 9, 094002, https://doi.org/10.1088/1748-9326/9/9/094002, 2014.
Wang, T., Li, S., Shen, Y., Deng, J., and Xie, M.: Investigations on direct and indirect effect of nitrate on temperature and precipitation in China using a regional climate chemistry modeling system, J. Geophys. Res., 115, D00K26, https://doi.org/10.1029/2009JD013264, 2010.
Wang, Z., Li, J., Wang, Z., Yang, W., Tang, X., Ge, B., Yan, P., Zhu, L., Chen, X., Chen, H., and Wand, W.: Modeling study of regional severe hazes over mid-eastern China in January 2013 and its implications on pollution prevention and control, Sci. China Earth Sci., 57, 3–13, https://doi.org/10.1007/s11430-013-4793-0, 2014.
Wu, J., Bei, N., Hu, B., Liu, S., Zhou, M., Wang, Q., Li, X., Liu, L., Feng, T., Liu, Z., Wang, Y., Cao, J., Tie, X., Wang, J., Molina, L. T., and Li, G.: Aerosol–radiation feedback deteriorates the wintertime haze in the North China Plain, Atmos. Chem. Phys., 19, 8703–8719, https://doi.org/10.5194/acp-19-8703-2019, 2019.
Yang, Q., W. I. Gustafson Jr., Fast, J. D., Wang, H., Easter, R. C., Morrison, H., Lee, Y.-N., Chapman, E. G., Spak, S. N., and Mena-Carrasco, M. A.: Assessing regional scale predictions of aerosols, marine stratocumulus, and their interactions during VOCALS-REx using WRF-Chem, Atmos. Chem. Phys., 11, 11951–11975, https://doi.org/10.5194/acp-11-11951-2011, 2011.
Zhang, B., Wang, Y., and Hao, J.: Simulating aerosol–radiation–cloud feedbacks on meteorology and air quality over eastern China under severe haze conditionsin winter, Atmos. Chem. Phys., 15, 2387–2404, https://doi.org/10.5194/acp-15-2387-2015, 2015.
Zhang, X., Zhang, Q., Hong, C., Zheng, Y., Geng, G., Tong, D., Zhang, Y., and Zhang, X.: Enhancement of PM2.5 Concentrations by Aerosol-Meteorology Interactions Over China, J. Geophys. Res.-Atmos., 123, 1179–1194, https://doi.org/10.1002/2017jd027524, 2018.
Zhang, Y., Wen, X. Y., and Jang, C. J.: Simulating chemistry–aerosol–cloud–radiation–climate feedbacks over the continental US using the online-coupled Weather Research Forecasting Model with chemistry (WRF/Chem), Atmos. Environ., 44, 3568–3582, https://doi.org/10.1016/j.atmosenv.2010.05.056, 2010.
Zhong, J., Zhang, X., Dong, Y., Wang, Y., Liu, C., Wang, J., Zhang, Y., and Che, H.: Feedback effects of boundary-layer meteorological factors on cumulative explosive growth of PM2.5 during winter heavy pollution episodes in Beijing from 2013 to 2016, Atmos. Chem. Phys., 18, 247–258, https://doi.org/10.5194/acp-18-247-2018, 2018.
- Abstract
- Introduction
- Overview of MICS-Asia III Topic 3
- Aerosol direct and indirect forcing
- Impact of aerosol feedbacks on meteorological variables and PM2.5 concentrations
- Sensitivity to different processes
- Summary
- Data availability
- Author contributions
- Competing interests
- Special issue statement
- Acknowledgements
- Financial support
- Review statement
- References
- Supplement