the Creative Commons Attribution 4.0 License.
the Creative Commons Attribution 4.0 License.
 | 06 Oct 2020
Increases in surface ozone pollution in China from 2013 to 2019: anthropogenic and meteorological influences
Daniel J. Jacob
Lu Shen
Isabelle De Smedt
Hong Liao
Surface ozone data from the Chinese Ministry of Ecology and Environment (MEE) network show sustained increases across the country over the 2013–2019 period. Despite Phase 2 of the Clean Air Action Plan targeting ozone pollution, ozone was higher in 2018–2019 than in previous years. The mean summer 2013–2019 trend in maximum 8 h average (MDA8) ozone was 1.9 ppb a−1 (p<0.01) across China and 3.3 ppb a−1 (p<0.01) over the North China Plain (NCP). Fitting ozone to meteorological variables with a multiple linear regression model shows that meteorology played a significant but not dominant role in the 2013–2019 ozone trend, contributing 0.70 ppb a−1 (p<0.01) across China and 1.4 ppb a−1 (p=0.02) over the NCP. Rising June–July temperatures over the NCP were the main meteorological driver, particularly in recent years (2017–2019), and were associated with increased foehn winds. NCP data for 2017–2019 show a 15 % decrease in fine particulate matter (PM2.5) that may be driving the continued anthropogenic increase in ozone, as well as unmitigated emissions of volatile organic compounds (VOCs). VOC emission reductions, as targeted by Phase 2 of the Chinese Clean Air Action Plan, are needed to reverse the increase in ozone.
- Article
(7633 KB) - Full-text XML
-
Supplement
(2050 KB) - BibTeX
- EndNote


Surface ozone is a serious air pollution issue over much of eastern China (Ma et al., 2012; Fu et al., 2019). Measurements from the Chinese Ministry of Environment and Ecology (MEE) network of sites frequently exceed the national air quality standard of 160 µg m−3, corresponding to 82 ppb at 298 K and 1013 hPa (Li et al., 2017; Shen et al., 2019a; Fan et al., 2020). The Clean Air Action Plan initiated in 2013 imposed rapid decreases in pollutant emissions (Chinese State Council, 2013) and resulted in large decreases in fine particulate matter (PM2.5) concentrations (Zhai et al., 2019; Q. Zhang et al., 2019). However, ozone increased by 1–3 ppb a−1 over the 2013–2017 period in the megacity clusters of eastern China (Lu et al., 2018, 2020; Li et al., 2019a), partly offsetting the health benefits gained from improved PM2.5 (Dang and Liao, 2019; Q. Zhang et al., 2019). Phase 2 of the Clean Air Action Plan, which began in 2018 (Chinese State Council, 2018), imposed new emission controls targeted at ozone. Here, we show that the increasing ozone trend in eastern China has continued through 2019, driven by both anthropogenic emissions and meteorological trends, stressing the urgent need for more vigorous emission controls.
Ozone in polluted regions is produced by photochemical reactions of volatile organic compounds (VOCs) and nitrogen oxides (), enabled by hydrogen oxide radicals () as oxidants. VOCs and NOx are emitted by fuel combustion, and VOCs also have additional industrial (Zheng et al., 2018) and biogenic (Guenther et al., 2012) sources. HOx is produced photochemically from ozone and water, formaldehyde (HCHO), nitrous acid, and other precursors (Tan et al., 2019). Ozone is highest in summer when photochemistry is most active (Wang, T. et al., 2017). Meteorological conditions play an important role in modulating ozone concentrations, not only through transport but also by affecting natural emissions and chemical rates (Jacob and Winner, 2009; Shen et al., 2016; Fu et al., 2019; Lu et al., 2019).
A number of studies have investigated the roles of anthropogenic and meteorological factors in driving the 2013–2017 ozone trend and have concluded that meteorological factors were not negligible but anthropogenic factors were dominant (Ding et al., 2019; Li et al., 2019a; Liu et al., 2019, 2020; Yu et al., 2019). Our previous work (Li et al., 2019a, b) found that the decrease in PM2.5 was a major factor driving the increase in ozone due to the role of PM2.5 as scavenger of hydroperoxy (HO2) radicals and NOx that would otherwise produce ozone. Here, we extend the analysis of ozone trends to 2019, into the implementation of the Clean Air Action Plan Phase 2, and bring in satellite and ground-based observations to relate the most recent ozone trends to those of VOC (Shen et al., 2019b) and NOx (Zheng et al., 2018; Shah et al., 2020) emissions.
2.1 Surface measurements
Hourly concentrations of ozone, PM2.5, and NO2 are taken from the MEE website (http://106.37.208.233:20035, last access: 30 June 2020) and archived at https://quotsoft.net/air (Wang, X. L., 2020; last access: 30 June 2020). The network was launched in 2013 as part of the Clean Air Action Plan. It included 450 monitoring stations in 2013, which had grown to ∼1500 stations by 2019. In this study, ozone trends are estimated across all of the sites, including those with partial records. We will show later that the estimated ozone trends change only marginally if continuous records throughout 2013–2019 are used in the analysis. We compute maximum daily 8 h average (MDA8) ozone as well as 24 h average PM2.5 and NO2 concentrations from the hourly data for June–July–August (JJA). Concentrations were reported by the MEE in micrograms per cubic meter (µg m−3) under standard conditions (273 K, 1013 hPa) until 31 August 2018. This reference state was changed on 1 September 2018 to 298 K and 1013 hPa for gases and to local ambient state for PM2.5 (MEE, 2018). We converted ozone and NO2 concentrations to parts per billion (ppb) and rescaled post-August 2018 PM2.5 concentrations to standard conditions by assuming 298 K and 1013 hPa as the local ambient state.
2.2 Satellite observations
We use observations of NO2 and formaldehyde (HCHO) columns from the OMI and TROPOMI satellite instruments to track recent changes in anthropogenic emissions of NOx and VOCs, respectively. Shen et al. (2019b) and Shah et al. (2020) previously found that OMI-derived trends of VOC and NOx emissions were consistent with 2013–2017 bottom-up estimates from the Multi-resolution Emission Inventory for China (MEIC; Zheng et al., 2018). Here we extend the analysis using 2013–2019 OMI data from the European Quality Assurance for Essential Climate Variables project for NO2 (Boersma et al., 2018) and HCHO (De Smedt et al., 2015). We further use TROPOMI HCHO data available for the summers of 2018–2019 (De Smedt et al., 2018). We do not use TROPOMI NO2 data due to a version change in March 2019 (from v1.2.0 to v1.3.0) that could bias the trend between the summers of 2018 and 2019 (http://www.tropomi.eu/document/product-readme-file-nitrogen-dioxide, last access: 20 July 2020). The TROPOMI HCHO data are freely accessed from https://s5phub.copernicus.eu/dhus/ (last access: 28 February 2020), and we only use observations with a quality assurance value larger than 0.5. This filter effectively removes data with a cloud fraction larger than 0.5. Interannual trends in HCHO columns could be affected by temperature-dependent emissions of biogenic VOCs (Palmer et al., 2006). Following Zhu et al. (2017), we remove this contribution by regressing JJA monthly mean HCHO columns onto noon (13:00 LT; local time) surface air temperatures and then subtracting this fitted temperature dependency.
2.3 Stepwise multiple linear regression (MLR) model
To quantify the role of meteorology in driving 2013–2019 ozone trends, we use the same stepwise multiple linear regression (MLR) modeling approach as Li et al. (2019a). This modeling approach relates the month-to-month variability of MDA8 ozone to that of meteorological variables. Consistent meteorological fields for 2013–2019 were obtained from the NASA Modern-Era Retrospective Analysis for Research and Applications, Version 2 (MERRA-2) product (Gelaro et al., 2017). The MERRA-2 data have a spatial resolution of 0.5∘ latitude ×0.625∘ longitude. We average the daily MDA8 ozone from the MEE network onto the MERRA-2 grid. Firstly, the regression model is applied to select the key meteorological parameters driving the day-to-day variability of ozone for each grid cell. There are nine MERRA-2 meteorological variables considered as ozone covariates, including daily maximum 2 m air temperature (Tmax), 10 m zonal wind (U10) and meridional wind (V10), planetary boundary layer height (PBLH), total cloud area fraction (TCC), rainfall (Rain), sea level pressure (SLP), relative humidity (RH), and 850 hPa meridional wind (V850), following Li et al. (2019a). The meteorology fields are averaged over 24 h for use in the MLR model except for the PBLH and TCC, which are averaged over daytime hours (08:00–20:00 LT; local time), as well as Tmax (daily maximum).
Secondly, to avoid overfitting, only the three locally dominant meteorological parameters are regressed onto the deseasonalized monthly MDA8 ozone to fit the role of 2013–2019 meteorological variability. The top three variables are selected based on their individual contribution to the regressed ozone, along with the requirement that they are statistically significant above the 95 % confidence level in the MLR model. They will differ for each grid cell. We show these top three meteorological drivers for ozone variability in Figs. S1–S3 in the Supplement for different locations in China.
Thirdly, we fit the observed monthly ozone anomalies by applying these dominant meteorological drivers in the MLR model. The coefficients of determination (R2) for the MLR model are generally above 0.4–0.5 for the polluted regions of China, which are of most interest to us (Fig. S4). Remote locations with background ozone levels have less ozone variability and are, thus, harder to fit. Similar MLR models have been extensively employed to quantify the effect of meteorological variability on air pollutants (e.g., Tai et al., 2010; Otero et al., 2018; Zhai et al., 2019; Han et al., 2020).
Finally, the trend in regressed ozone is taken to reflect the meteorological contribution, and the residual is then taken to reflect the presumed anthropogenic contribution, with the statistical significance of the anthropogenic trend determined by a Student's t test. We have followed this approach before to isolate the anthropogenic trends of ozone and PM2.5 (Li et al., 2019a; Zhai et al., 2019). A similar statistical decomposition of anthropogenic and meteorological contributions to air pollutant trends has been employed by previous studies (e.g., Chen et al. 2019; Yu et al., 2019; X. Zhang et al., 2019). The effect of biogenic VOCs on ozone trends depends on meteorological and land cover drivers. Meteorological drivers, in particular temperature, would be accounted for in the MLR model. The effect of land cover changes is expected to be small over the 7-year time horizon of our analysis (Fu and Tai, 2015).
We first present the general 2013–2019 summer ozone trends in China and their statistically decomposed meteorological and anthropogenic contributions. Ozone trends over the major megacity clusters in China are highlighted. We go on to more specifically attribute the meteorological and anthropogenic drivers of recent ozone trends over the North China Plain, where the ozone increase is the highest.
3.1 Ozone trends from 2013 to 2019: anthropogenic and meteorological contributions
Figure 1 shows the 2013–2019 trends of the summer maximum and mean MDA8 ozone and PM2.5 from the MEE network. The Clean Air Action Plan has dramatically improved PM2.5 pollution since 2013, with a ∼50 % decrease in summertime mean PM2.5 concentrations across eastern China over the 2013–2019 period. Maximum PM2.5 concentrations have experienced a similar decreasing trend. In contrast, ozone steadily increased over the 2013–2019 period, and ozone concentrations in 2019 were the highest in the record. The Clean Air Action Plan focused specific attention on the four megacity clusters identified using rectangles in Fig. 2: the North China Plain (NCP; 34–41∘ N, 113–119∘ E), the Yangtze River Delta (YRD; 30–33∘ N, 119–122∘ E), the Pearl River Delta (PRD; 21.5–24∘ N, 112–115.5∘ E), and the Sichuan Basin (SCB; 28.5–31.5∘ N, 103.5–107∘ E). Mean MDA8 ozone in summer 2019 averaged 83 ppb across the NCP sites, and maximum MDA8 ozone averaged 129 ppb. Summer mean MDA8 ozone in 2019 was lower for the other megacity clusters (67 ppb for YRD, 46 ppb for PRD, and 57 ppb for SCB), but the summer maximum MDA8 ozone values were comparable to the NCP. These three megacity clusters are subject to ozone pollution episodes under stagnant conditions that are similar to those observed in the NCP (Wang, T. et al., 2017); however, the other three clusters are more frequently ventilated by the summer monsoon, which brings cleaner tropical air and precipitation, resulting in the lower mean ozone.
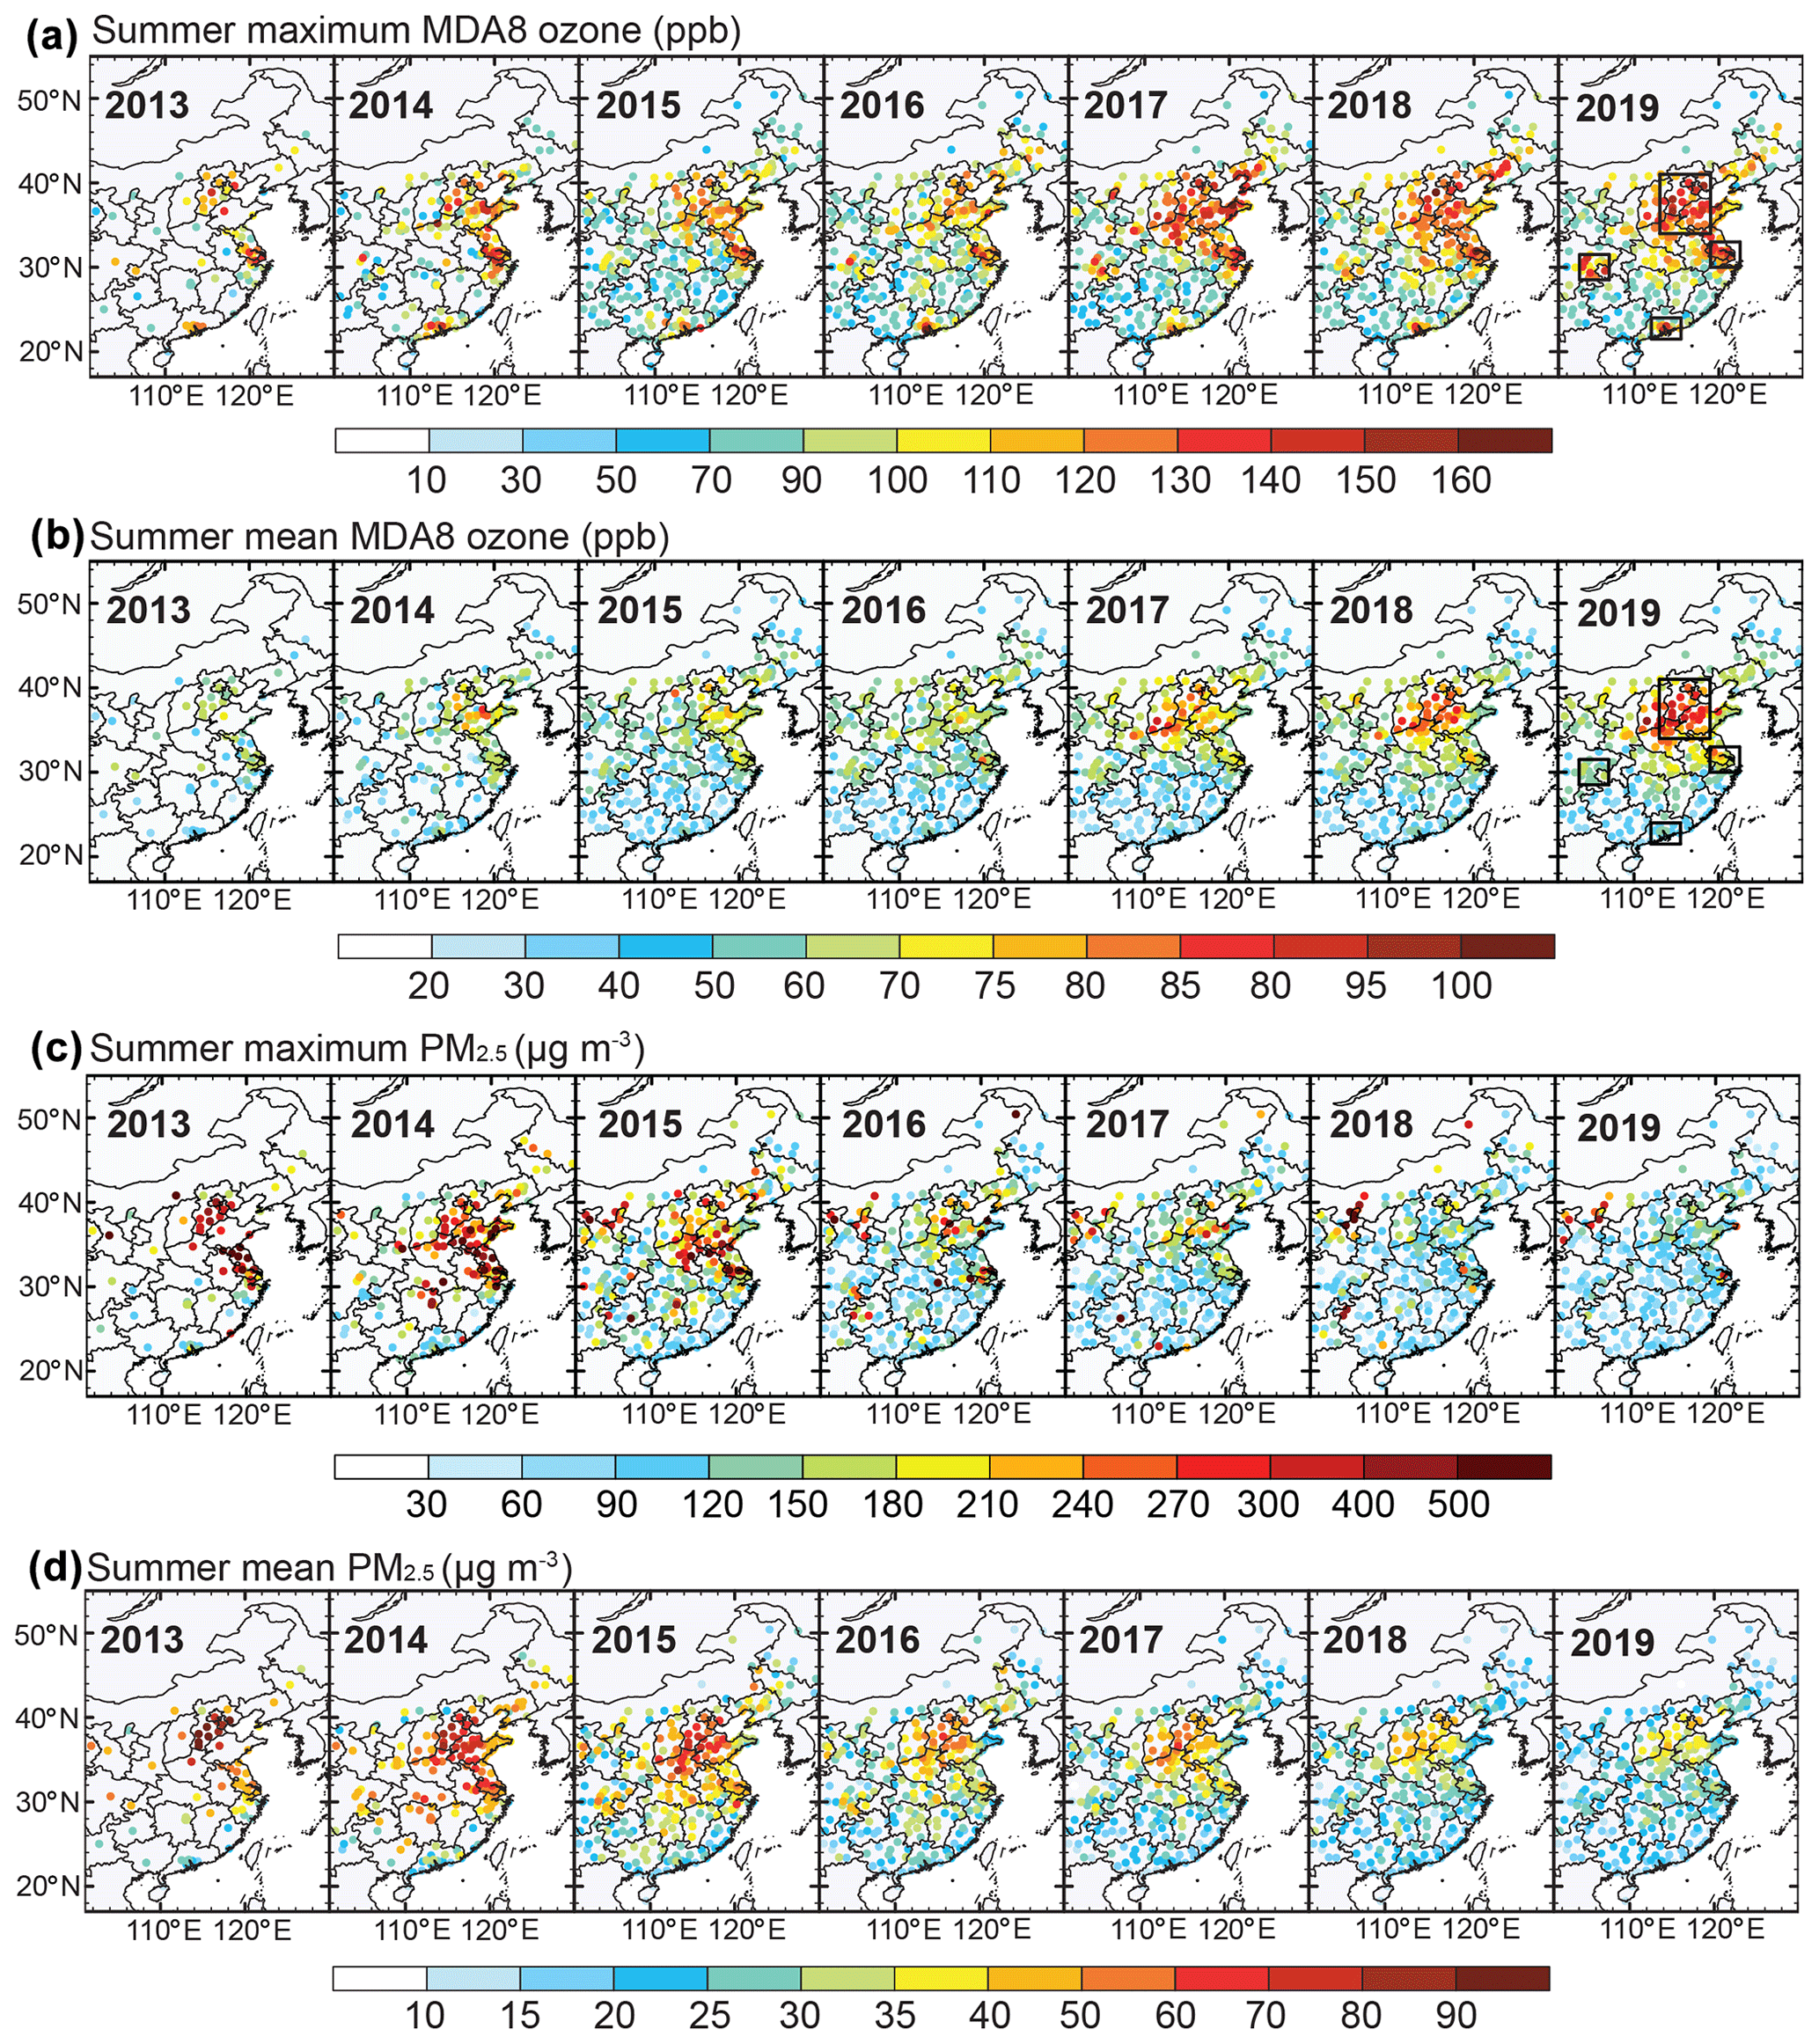
Figure 1Summer (JJA) concentrations of maximum MDA8 ozone (a), mean MDA8 ozone (b), maximum PM2.5 (c), and mean PM2.5 (d) for 2013–2019 at the network operated by the China Ministry of Ecology and Environment (MEE). Rectangles denote the four megacity clusters discussed in the text: the North China Plain (NCP; 34–41∘ N, 113–119∘ E), the Yangtze River Delta (YRD; 30–33∘ N, 119–122∘ E), the Pearl River Delta (PRD; 21.5–24∘ N, 112–115.5∘ E), and the Sichuan Basin (SCB; 28.5–31.5∘ N, 103.5–107∘ E).
Figure 2a shows the 2013–2019 trends in summer mean MDA8 ozone obtained by ordinary linear regression of the data averaged over the MERRA-2 grid. Ozone increases almost everywhere in China. Decreases are largely restricted to the Shandong Peninsula and northeastern China (including the Heilongjiang, Jilin, and Liaoning provinces). The mean trend for China is 1.9 ppb a−1 (p<0.01). Trends in the four megacity clusters are 3.3 ppb a−1 (p<0.01) for the NCP, 1.6 ppb a−1 (p<0.01) for the YRD, 1.1 ppb a−1 (p=0.03) for the PRD, and 0.7 ppb a−1 (p=0.23) for the SCB (Table 1). The increases are largest in the NCP, which could be explained by the greater influence of radical scavenging by PM2.5 (Li et al., 2019a, b).

Figure 2Summertime ozone trends in China from 2013 to 2019. Panel (a) shows the observed trends of summer mean MDA8 ozone at MEE sites averaged on the ( km2) MERRA-2 grid. The trends are obtained by ordinary linear regression and include sites with partial records. Panel (b) shows meteorologically driven trends determined by fitting ozone to meteorological covariates in the multiple linear regression (MLR) model. Panel (c) shows anthropogenic trends as inferred from the residual of the MLR model. Statistically significant trends above the 90 % confidence level are marked with black dots. The mean trends for all of China and for the four megacity clusters (rectangles) are inset, where the regression is applied to the spatially averaged MDA8 ozone for the cluster. Numbers in bold are statistically significant above the 90 % confidence level (Table 1).
Table 1The MDA8 ozone trends in China (ppb a−1) from 2013 to 2019 and from 2013 to 2017.
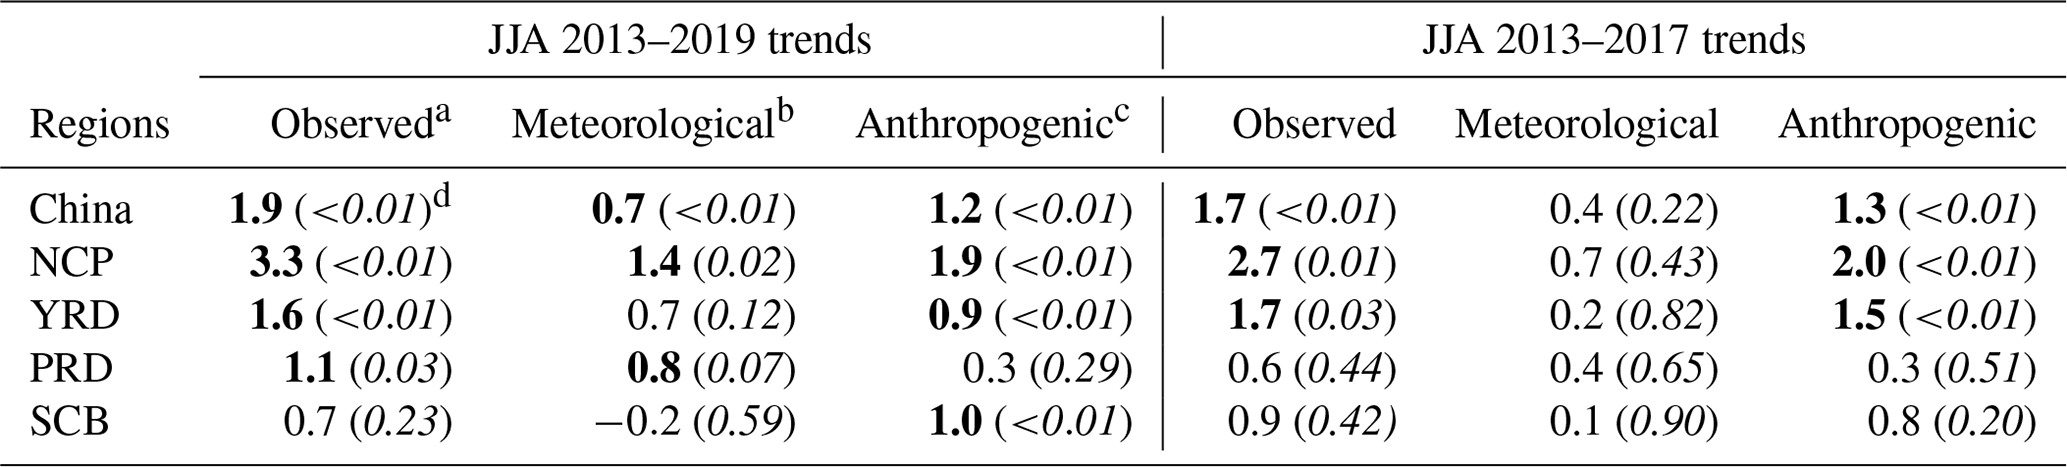
a Observed trends are obtained by ordinary linear regression on
summer (JJA) mean values of maximum daily 8 h average (MDA8) ozone measured
at the sites of the Ministry of Ecology and Environment (MEE) network. The
MDA8 ozone data are first averaged spatially over the MERRA-2 grid (Fig. 2) and then averaged
nationally (China) and over four megacity clusters: the North China Plan (NCP),
the Yangtze River Delta (YRD), the Pearl River Delta (PRD), and the Sichuan Basin (SCB).
b Meteorologically driven trends are obtained by fitting the ozone data
to a multiple linear regression (MLR) model with the three most important
meteorological covariates (see text).
c The anthropogenically driven trends are obtained by ordinary linear
regression of the residual ozone after removing the MLR-fitted value.
d p values for the trends are in italics; trends in bold are those with a
p value smaller than 0.1.
Figure 2b shows the meteorologically driven ozone trends, as determined by fitting ozone to meteorological variables with the MLR model. We find an average meteorologically driven trend of 0.7 ppb a−1 (p<0.01) for China. Ozone trends over the 2013–2019 period in the NCP and PRD are significantly contributed by meteorology, and this is particularly driven by 2018–2019 (Table 1). Similar to our previous study for 2013–2017 (Li et al., 2019a), the most important meteorological predictor variables in the MLR model are daily maximum temperature for the NCP and meridional wind at 850 hPa for the PRD (Fig. S1). These dominant meteorological parameters are also consistent with the findings of other studies (Gong and Liao, 2019; Wang T. et al., 2019; Han et al., 2020). Hot weather is the main meteorological driver for high ozone in the NCP, and we will elaborate on this in the next section. The main meteorological driver for the ozone increase in the PRD is the weakening of the summer monsoonal flow (Fig. 3) that ventilates the PRD with marine air.
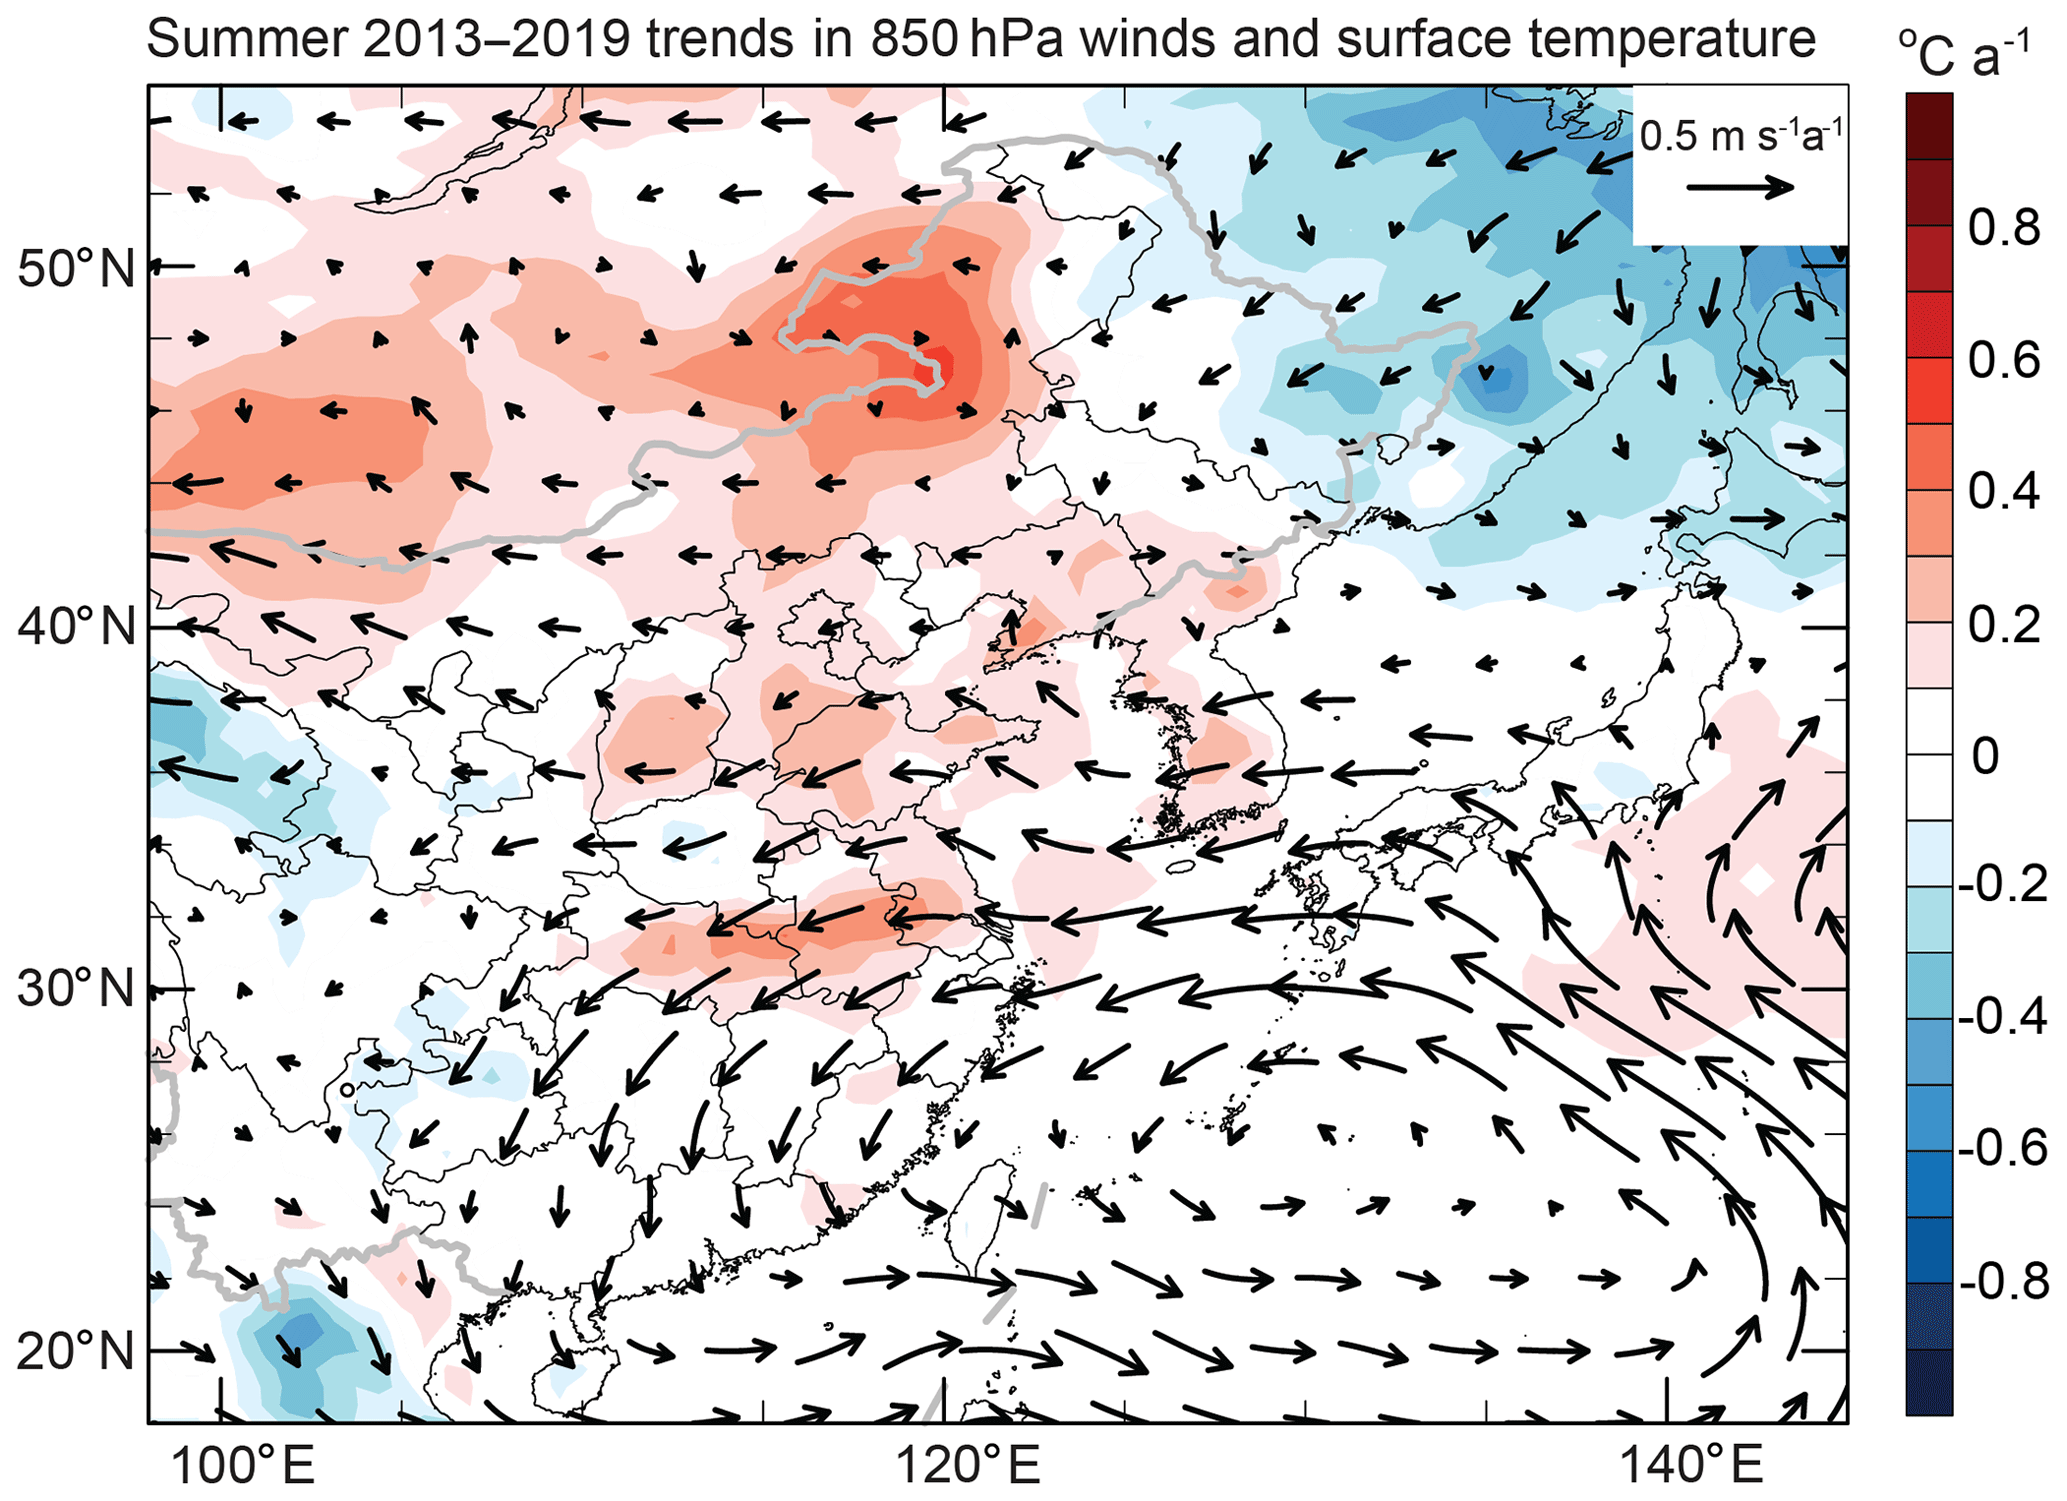
Figure 3Summer mean trends of 850 hPa wind vectors (m s−1 a−1) and surface daily maximum temperature (∘C a−1, shaded) over the period from 2013 to 2019. Data are from the MERRA-2 reanalysis. The trends are obtained by ordinary linear regression of mean JJA data for individual years.
On the other hand, we find that meteorology mitigated ozone pollution over northeastern China and the Shandong Peninsula. Summer ozone over the Shandong Peninsula is strongly affected by maritime inflow (Fig. S2; J. Zhang et al., 2019; Han et al., 2020) which increased over the 2013–2019 period (Fig. 3). Temperature decreased over northeastern China (Fig. 3).
Removing the meteorological contribution in the ozone trend leaves a residual trend that we interpret as anthropogenic (Fig. 2c), following Li et al. (2019a) and Zhai et al. (2019). This anthropogenic trend is more uniformly positive at a national scale than the observed and meteorologically driven trends. It averages 1.2 ppb a−1 (p<0.01) for all of China, compared with 0.7 ppb a−1 (p<0.01) for the meteorologically driven trend. The observed 2013–2019 ozone increase in all of the megacity clusters except the PRD is dominated by the anthropogenic contribution, averaging 1.9 ppb a−1 (p<0.01), 0.9 ppb a−1 (p<0.01), and 1.0 ppb a−1 (p<0.01) for the NCP, YRD, and SCB, respectively. This result of estimated trends still stands if only continuous records throughout 2013–2019 are used in the analysis (Fig. S5). The ozone increase in the PRD is mainly meteorologically driven due to reduced monsoonal winds (Fig. 3). The following sections present further analysis of the 2013–2019 ozone trend in the NCP, where both meteorological and anthropogenic contributions are particularly large.
3.2 The meteorologically driven 2013–2019 ozone increase in the North China Plain
Separating the observed 2013–2019 ozone trends by month shows that the seasonal JJA trend of 3.3 ppb a−1 (p<0.01) over the NCP (Fig. 2a) is driven by June and July. Observed trends are 5.5 ppb a−1 (p<0.01) for June, 3.7 ppb a−1 (p<0.01) for July, and 0.9 ppb a−1 (p=0.34) for August. This month-to-month difference is mainly driven by meteorology. As derived from the MLR model, the meteorologically driven ozone trend of 1.4 ppb a−1 (p=0.02) for JJA breaks down to 3.1 ppb a−1 (p<0.01) for June, 2.2 ppb a−1 (p=0.08) for July, and −1.0 ppb a−1 (p=0.16) for August. The residual anthropogenic trend is much more similar across months (2.4 ppb a−1, p=0.02, in June; 1.5 ppb a−1, p=0.07, in July; and 1.9 ppb a−1, p<0.01, in August), as would be expected after removing the meteorological influence.
Figure 4 shows the monthly mean time series of daily maximum temperature averaged over the NCP for 1980–2019, with 2013–2019 highlighted using gray shading. Temperature is the principal driver of the meteorologically driven ozone trend, as indicated by the MLR model. We find a large increase in temperature for 2013–2019 in June (0.42 ∘C a−1), a lesser increase in July (0.22 ∘C a−1), and a decrease in August (−0.18 ∘C a−1), reflected in the meteorologically driven ozone trend for each month. When placed in the context of the 1980–2019 record, we see that the 2013–2019 temperature trends reflect interannual climate variability rather than a long-term warming trend.

Figure 4Time series of JJA daily maximum surface air temperatures over the North China Plain (NCP) for 1980–2019. Values are monthly means from the MERRA-2 reanalysis. The 2013–2019 period for the ozone trend analysis is shaded in gray.
Hot weather in the NCP in the summer is generally driven by large-scale anticyclonic conditions, and this has been viewed as the principal predictor of ozone pollution days (Gong and Liao, 2019). Foehn wind conditions, featuring warm and dry air subsiding from the mountains to the north and west of the NCP (Chen and Lu, 2016), also lead to high ozone pollution in the NCP. Foehn winds are most important in June. Following Chen and Lu (2016), we diagnosed foehn conditions in the NCP using a foehn index defined by the 850 hPa northwesterly wind averaged along a section from 42∘ N, 108∘ E to 38∘ N, 112∘ E; see Fig. 5. The days with a positive (negative) foehn index are taken as foehn (non-foehn) conditions, and one-third of summer days have a positive foehn index. We find that foehn conditions are largely responsible for the 2013–2019 increase in temperature in June (Figure 5). The frequency of foehn conditions on hot days (>30 ∘C) in June increased by 85 % over the 2013–2019 period (driven mainly by the increased frequency in 2018–2019), and ozone increase under foehn conditions was 1.2 ppb a−1 larger than under non-foehn conditions. Our result highlights the previously unrecognized effect of foehn winds on ozone pollution in the NCP.

Figure 5June mean trends in meteorological variables over 2013–2019 under foehn (a, b) and non-foehn (c, d) conditions. (a) Trends in 850 hPa winds (m s−1 a−1) and surface daily maximum temperature (∘C a−1, shaded) under foehn conditions. (b) Trends in 500 hPa winds (m s−1 a−1) and surface relative humidity (% a−1, shaded) under foehn conditions. Panels (c) and (d) are the same as panels (a) and (b), respectively, but for non-foehn conditions. Data are from the MERRA-2 reanalysis, and trends are obtained by ordinary linear regression. Foehn conditions are diagnosed using a foehn index defined by the 850 hPa northwesterly wind averaged along a section from 42∘ N, 108∘ E to 38∘ N, 112∘ E, shown using the green line in panel (a). The days with a positive (negative) foehn index are taken as foehn (non-foehn) conditions.
3.3 The anthropogenically driven 2013–2019 ozone increase in the North China Plain
Figure 6a shows the observed time series of monthly mean JJA MDA8 ozone anomalies for 2013–2019 relative to the JJA 2013–2019 mean, averaged over all MEE sites in the NCP and including sites with partial records. We see large month-to-month variability superimposed on the long-term trend. Much of this month-to-month variability can be attributed to meteorological factors using the MLR model (blue line), as discussed in the previous section. The residual anthropogenic trend (red line) shows a 2013–2019 increasing trend with much less month-to-month variability than the original observed time series. The standard deviation decreases from 8.8 ppb to 5.3 ppb after the removal of the meteorological influence.
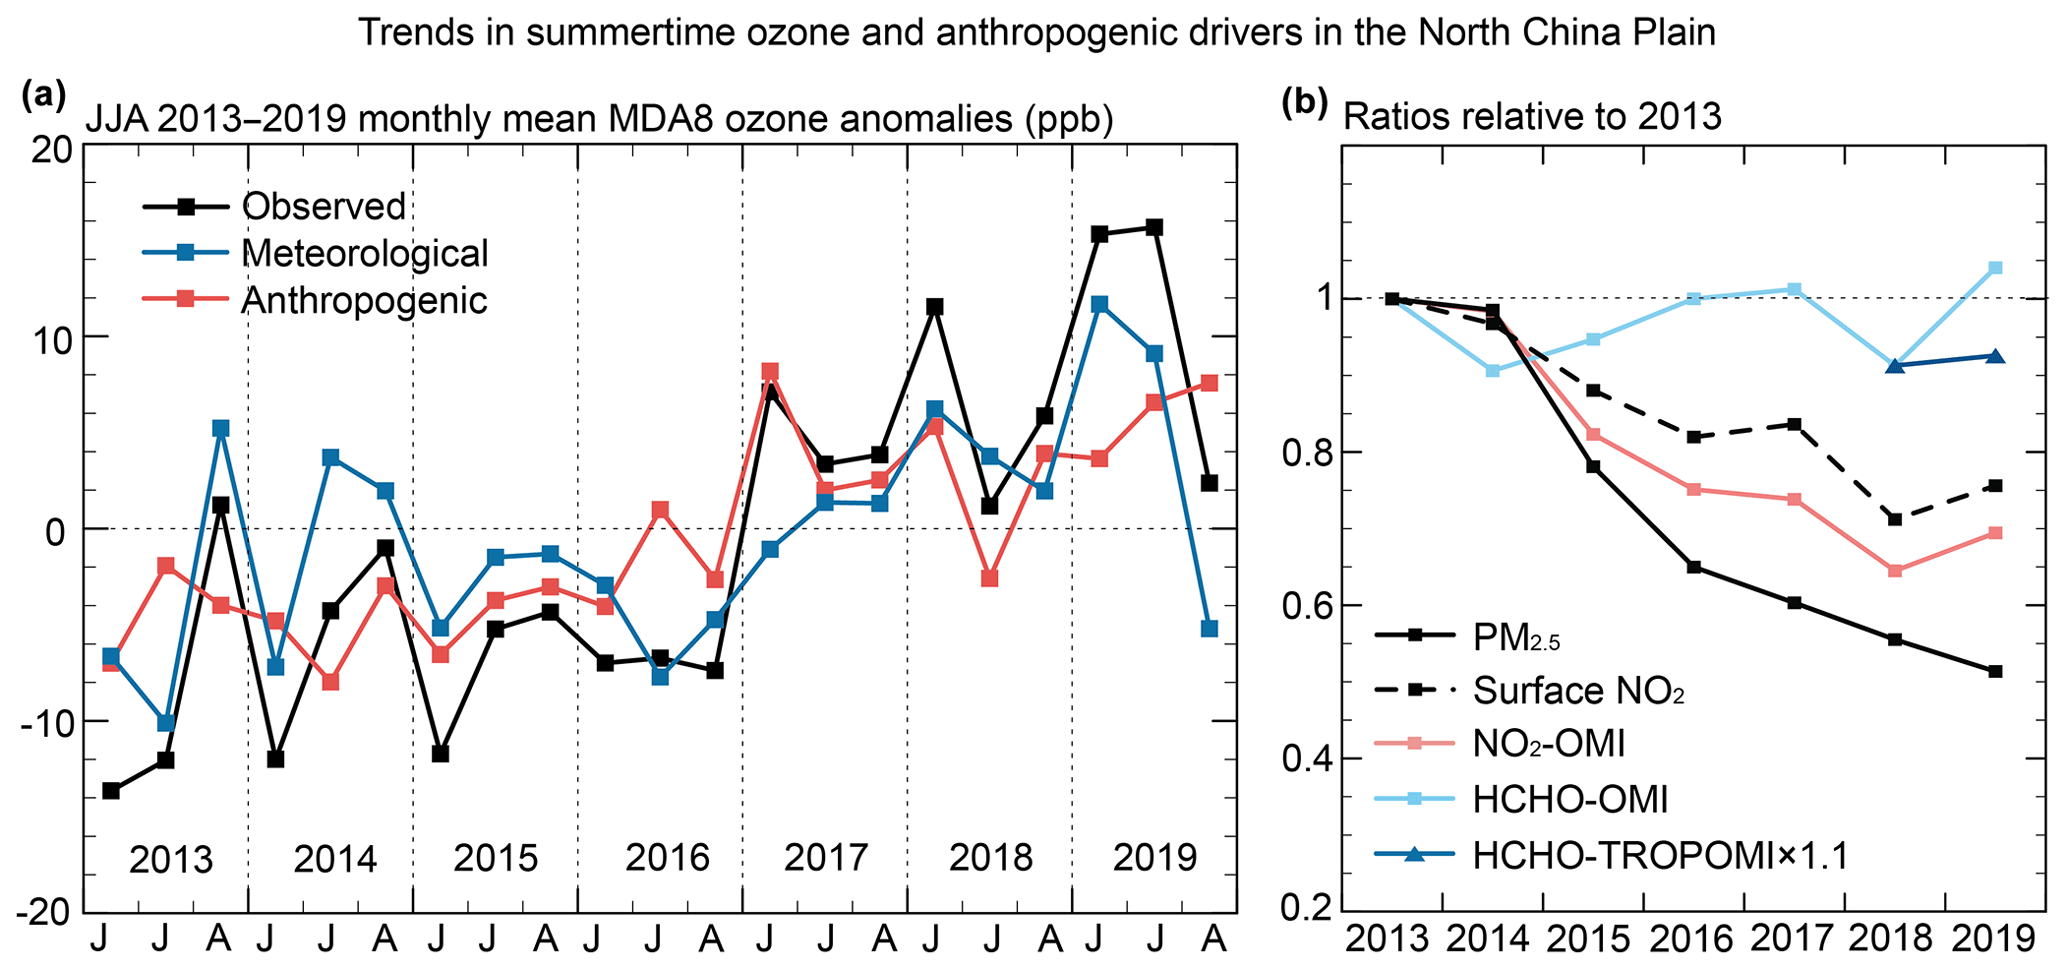
Figure 6Trends in summertime ozone and related anthropogenic drivers in the North China Plain (NCP). Panel (a) shows time series of monthly mean MDA8 ozone (ppb) anomalies averaged over the MEE sites relative to the 2013–2019 summer (JJA) mean. Values are shown as anomalies for individual JJA months (three points per year). Observed trends are compared to the meteorologically driven trends diagnosed by the MLR model and to the residuals determining the anthropogenically driven trend. Panel (b) shows time series of observed JJA mean quantities averaged over the NCP: PM2.5 (black, solid) and NO2 (black, dashed) concentrations from the MEE sites, tropospheric NO2 (pink, solid) and HCHO (light blue, solid) column densities from the OMI satellite instrument, and HCHO column density from the TROPOMI satellite instrument (dark blue, solid). Values are presented as ratios relative to 2013. The TROPOMI HCHO data for 2018 have been scaled to the OMI data for that year with the multiplicative factor indicated in legend.
Figure 6b shows the 2013–2019 observed trends of different quantities relevant to the anthropogenic ozone trend over the NCP: PM2.5 and NO2 from the MEE network as well as NO2 and HCHO tropospheric columns from satellites. PM2.5 shows a steady decrease of 49 % over the 2013–2019 period. NO2 (a proxy for NOx emissions; Zheng et al., 2018) shows a 25 %–30 % decrease with some interannual variability that is consistent between the OMI satellite data and the surface MEE network. HCHO (a proxy for VOC emissions) shows no significant trend for the 2013–2019 period, with some interannual variability that could reflect noise in the measurement (Shen et al., 2019b).
Of particular interest are the trends for 2017–2019, extending beyond the currently available MEIC emission inventory (Zheng et al., 2018) and during which we find a continued increase in ozone. Relative to 2017, we find a 15 % decrease in PM2.5, a 6 %–10 % decrease in NOx emissions (depending on which proxy record we use), and flat VOC emissions for 2019. Phase 2 of the Chinese government's Clean Air Action Plan (China State Council, 2018) called for a 18 % decrease in PM2.5, a 15 % decrease in NOx emissions, and a 10 % decrease in VOC emissions over the 2015–2020 period. Taking the 2015–2017 gains in PM2.5 and NOx emissions into account, Li et al. (2019b) inferred that those targets would require 2017–2020 decreases of 8 % for PM2.5, 9 % for NOx emissions, and 10 % for VOCs emissions. Using model simulations, they found that the decrease in PM2.5 would cause a further increase in ozone but that decreasing VOC emissions would compensate for this and would enable net improvement, with NOx emission changes having relatively little effect. Here, we find that the observed 2017–2019 decrease in PM2.5 goes beyond the Clean Air Action Plan target, whereas the satellite HCHO data show no evidence of a decrease in VOC emissions. The combination of these two effects is consistent with the observed anthropogenically driven increase in ozone over the 2017–2019 period. A decrease in VOC emissions is the key to reversing the ozone increase (Li et al., 2019b). Strict control measures on solvent use and industrial sectors (e.g., oil-related processes and chemical industry; Zheng et al., 2018) should be implemented to reduce VOC emissions.
Surface ozone data from the Chinese Ministry of Environment and Ecology (MEE) network show a sustained nationwide increase in ozone over the 2013–2019 period, with a few exceptions (Shandong Province and northeastern China), and with particularly high concentrations in 2018–2019. Correction for meteorologically driven trends with a multiple linear regression (MLR) model shows a general pattern of anthropogenically driven ozone increase across China, although meteorological influences are also significant. The mean summer (JJA) 2013–2019 increase in maximum daily 8 h average (MDA8) ozone over China is 1.9 ppb a−1 (p<0.01), including 0.7 ppb a−1 (p<0.01) from meteorologically driven trends (mostly temperature and circulation) and 1.2 ppb a−1 (p<0.01) from anthropogenic influence. Ozone concentrations are highest in the North China Plain (NCP), where the summer mean MDA8 ozone averaged across sites was 83 ppb in 2019, and the summer maximum MDA8 ozone averaged across sites was 129 ppb. In comparison, the Chinese air quality standard for annual maximum MDA8 ozone is 82 ppb. Mean summer MDA8 ozone increased by 3.3 ppb a−1 (p<0.01) in the NCP over the 2013–2019 period: we attribute 1.4 ppb a−1 (p=0.02) to be meteorologically driven and 1.9 ppb a−1 (p<0.01) to be anthropogenically driven.
Further investigation of the NCP trends shows that hot weather in June–July 2018–2019 was a major driver for the high ozone concentrations in those summers. Such hot weather does not relate to long-term warming but to interannual variability driven principally by northwesterly foehn winds. Removing this meteorological variability shows a sustained anthropogenic ozone increase over the NCP over the 2013–2019 record that persists into 2018–2019. Examination of ozone-relevant anthropogenic variables from the MEE network and from satellites shows a 49 % decrease in PM2.5 for 2013–2019 (15 % for 2017–2019), a 25 %–30 % decrease in NOx emissions for 2013–2019 (6 %–10 % for 2017–2019), and flat VOC emissions. The sustained anthropogenic increase in ozone over the 2017–2019 period may be explained by the continued decrease in PM2.5, which scavenges the radical precursors of ozone, combined with flat emissions of VOCs. Reducing VOC emissions should be the top priority with respect to reversing the increase in ozone in the NCP and in other urban areas of China.
Hourly surface concentrations of air pollutants are archived at https://quotsoft.net/air (X. L. Wang, 2020). The MERRA-2 reanalysis data are from http://geoschemdata.computecanada.ca/ExtData/GEOS_0.5x0.625_AS/MERRA2 (GMAO, 2020). The L3 OMI satellite data for NO2 and HCHO are available at http://www.qa4ecv.eu/ecvs (QA4ECV team, 2020). The L2 TROPOMI data for HCHO are available at https://s5phub.copernicus.eu/dhus (TROPOMI team, 2020). The data used in this study can be accessed via https://doi.org/10.7910/DVN/T6D7YY (Li, 2020).
The supplement related to this article is available online at: https://doi.org/10.5194/acp-20-11423-2020-supplement.
KL and DJJ designed the study. KL performed the analysis. LS and IDS provided the TROPOMI data. LS, XL, and HL contributed to the interpretation of the results. KL and DJJ wrote the paper with contributions from all co-authors.
The authors declare that they have no conflict of interest.
We appreciate the efforts of the China Ministry of Ecology and Environment with respect to supporting the nationwide observation network and the publishing of hourly air pollutant concentrations. We acknowledge the QA4ECV project for the NO2 and HCHO data. We appreciate the efforts of NASA GMAO with respect to providing the MERRA-2 reanalysis data.
This research has been supported by the Harvard–NUIST Joint Laboratory for Air Quality and Climate (JLAQC) and the National Natural Science Foundation of China (grant no. 91744311).
This paper was edited by Bryan N. Duncan and reviewed by two anonymous referees.
Boersma, K. F., Eskes, H. J., Richter, A., De Smedt, I., Lorente, A., Beirle, S., van Geffen, J. H. G. M., Zara, M., Peters, E., Van Roozendael, M., Wagner, T., Maasakkers, J. D., van der A, R. J., Nightingale, J., De Rudder, A., Irie, H., Pinardi, G., Lambert, J.-C., and Compernolle, S. C.: Improving algorithms and uncertainty estimates for satellite NO2 retrievals: results from the quality assurance for the essential climate variables (QA4ECV) project, Atmos. Meas. Tech., 11, 6651–6678, https://doi.org/10.5194/amt-11-6651-2018, 2018.
Chen, R. and Lu, R.: Role of Large-Scale Circulation and Terrain in Causing Extreme Heat in Western North China, J. Climate, 29, 2511–2527, https://doi.org/10.1175/jcli-d-15-0254.1, 2016.
Chen, Z., Chen, D., Kwan, M.-P., Chen, B., Gao, B., Zhuang, Y., Li, R., and Xu, B.: The control of anthropogenic emissions contributed to 80 % of the decrease in PM2.5 concentrations in Beijing from 2013 to 2017, Atmos. Chem. Phys., 19, 13519–13533, https://doi.org/10.5194/acp-19-13519-2019, 2019.
Chinese State Council: Action Plan on Air Pollution Prevention and Control (in Chinese), available at: http://www.gov.cn/zwgk/2013-09/12/content_2486773.htm (last access: 28 February 2020), 2013.
Chinese State Council: Three-Year Action Plan on Defending the Blue Sky (in Chinese), available at: http://www.gov.cn/zhengce/content/2018-07/03/content_5303158.htm (last access: 28 February 2020), 2018.
Dang, R. and Liao, H.: Radiative Forcing and Health Impact of Aerosols and Ozone in China as the Consequence of Clean Air Actions over 2012–2017, Geophys. Res. Lett., 46, 12511–12519, https://doi.org/10.1029/2019GL084605, 2019.
De Smedt, I., Stavrakou, T., Hendrick, F., Danckaert, T., Vlemmix, T., Pinardi, G., Theys, N., Lerot, C., Gielen, C., Vigouroux, C., Hermans, C., Fayt, C., Veefkind, P., Müller, J.-F., and Van Roozendael, M.: Diurnal, seasonal and long-term variations of global formaldehyde columns inferred from combined OMI and GOME-2 observations, Atmos. Chem. Phys., 15, 12519–12545, https://doi.org/10.5194/acp-15-12519-2015, 2015.
De Smedt, I., Theys, N., Yu, H., Danckaert, T., Lerot, C., Compernolle, S., Van Roozendael, M., Richter, A., Hilboll, A., Peters, E., Pedergnana, M., Loyola, D., Beirle, S., Wagner, T., Eskes, H., van Geffen, J., Boersma, K. F., and Veefkind, P.: Algorithm theoretical baseline for formaldehyde retrievals from S5P TROPOMI and from the QA4ECV project, Atmos. Meas. Tech., 11, 2395–2426, https://doi.org/10.5194/amt-11-2395-2018, 2018.
Ding, D., Xing, J., Wang, S., Chang, X., and Hao, J.: Impacts of Emissions and Meteorological Changes on China's Ozone Pollution in the Warm Seasons of 2013 and 2017, Front. Environ. Sci. Eng., 13, 76, https://doi.org/10.1007/s11783-019-1160-1, 2019.
Fan, H., Zhao, C., and Yang, Y.: A Comprehensive Analysis of the Spatio-Temporal Variation of Urban Air Pollution in China During 2014–2018, Atmos. Environ., 220, 117066, https://doi.org/10.1016/j.atmosenv.2019.117066, 2020.
Fu, Y. and Tai, A. P. K.: Impact of climate and land cover changes on tropospheric ozone air quality and public health in East Asia between 1980 and 2010, Atmos. Chem. Phys., 15, 10093–10106, https://doi.org/10.5194/acp-15-10093-2015, 2015.
Fu, Y., Liao, H., and Yang, Y.: Interannual and Decadal Changes in Tropospheric oOzone in China and the Associated Chemistry-Climate Interactions: A Review, Adv. Atmos. Sci., 36, 975–993, https://doi.org/10.1007/s00376-019-8216-9, 2019.
Gelaro, R., McCarty, W., Suarez, M. J., Todling, R., Molod, A., Takacs, L., Randles, C., Darmenov, A., Bosilovich, M. G., Reichle, R., Wargan, K., Coy, L., Cullather, R., Draper, C., Akella, S., Buchard, V., Conaty, A., da Silva, A., Gu, W., Kim, G. K., Koster, R., Lucchesi, R., Merkova, D., Nielsen, J. E., Partyka, G., Pawson, S., Putman, W., Rienecker, M., Schubert, S. D., Sienkiewicz, M., and Zhao, B.: The Modern-Era Retrospective Analysis for Research and Applications, Version 2 (MERRA-2), J. Climate, 30, 5419–5454, https://doi.org/10.1175/JCLI-D-16-0758.1, 2017.
GMAO: Modern-Era Retrospective analysis for Research and Applications, Version 2, available at: http://geoschemdata.computecanada.ca/ExtData/GEOS_0.5x0.625_AS/MERRA2, last access: 28 February 2020.
Gong, C. and Liao, H.: A typical weather pattern for ozone pollution events in North China, Atmos. Chem. Phys., 19, 13725–13740, https://doi.org/10.5194/acp-19-13725-2019, 2019.
Guenther, A. B., Jiang, X., Heald, C. L., Sakulyanontvittaya, T., Duhl, T., Emmons, L. K., and Wang, X.: The Model of Emissions of Gases and Aerosols from Nature version 2.1 (MEGAN2.1): an extended and updated framework for modeling biogenic emissions, Geosci. Model Dev., 5, 1471–1492, https://doi.org/10.5194/gmd-5-1471-2012, 2012.
Han, H., Liu, J., Shu, L., Wang, T., and Yuan, H.: Local and synoptic meteorological influences on daily variability in summertime surface ozone in eastern China, Atmos. Chem. Phys., 20, 203–222, https://doi.org/10.5194/acp-20-203-2020, 2020.
Jacob, D. J. and Winner, D. A.: Effect of Climate Change on Air Quality, Atmos. Environ., 43, 51–63, https://doi.org/10.1016/j.atmosenv.2008.09.051, 2009.
Li, G., Bei, N., Cao, J., Wu, J., Long, X., Feng, T., Dai, W., Liu, S., Zhang, Q., and Tie, X.: Widespread and persistent ozone pollution in eastern China during the non-winter season of 2015: observations and source attributions, Atmos. Chem. Phys., 17, 2759–2774, https://doi.org/10.5194/acp-17-2759-2017, 2017.
Li, K.: Replication Data for: 2013–2019 increases of surface ozone pollution in China: meteorological and anthropogenic influences, Harvard Dataverse, V1, https://doi.org/10.7910/DVN/T6D7YY, 2020.
Li, K., Jacob, D. J., Liao, H., Shen, L., Zhang, Q., and Bates, K. H.: Anthropogenic Drivers of 2013–2017 Trends in Summer Surface Ozone in China, P. Natl. Acad. Sci. USA, 116, 422–427, https://doi.org/10.1073/pnas.1812168116, 2019a.
Li, K., Jacob, D. J., Liao, H., Zhu, J., Shah, V., Shen, L., Bates, K. H., Zhang, Q., and Zhai, S.: A Two-Pollutant Strategy for Improving Ozone and Particulate Air Quality in China, Nat. Geosci., 12, 906–910, https://doi.org/10.1038/s41561-019-0464-x, 2019b.
Liu, J., Wang, L., Li, M., Liao, Z., Sun, Y., Song, T., Gao, W., Wang, Y., Li, Y., Ji, D., Hu, B., Kerminen, V.-M., Wang, Y., and Kulmala, M.: Quantifying the impact of synoptic circulation patterns on ozone variability in northern China from April to October 2013–2017, Atmos. Chem. Phys., 19, 14477–14492, https://doi.org/10.5194/acp-19-14477-2019, 2019.
Liu, Y. and Wang, T.: Worsening urban ozone pollution in China from 2013 to 2017 – Part 1: The complex and varying roles of meteorology, Atmos. Chem. Phys., 20, 6305–6321, https://doi.org/10.5194/acp-20-6305-2020, 2020.
Lu, X., Hong, J., Zhang, L., Cooper, O. R., Schultz, M. G., Xu, X., Wang, T., Gao, M., Zhao, Y., and Zhang, Y.: Severe Surface Ozone Pollution in China: A Global Perspective, Environ. Sci. Technol. Lett., 5, 487–494, https://doi.org/10.1021/acs.estlett.8b00366, 2018.
Lu, X., Zhang, L., Zhao, Y., Jacob, D. J., Hu, Y., Hu, L., Gao, M., Liu, X., Petropavlovskikh, I., McClure-Begley, A., and Querel, R.: Surface and tropospheric ozone trends in the Southern Hemisphere since 1990: possible linkages to poleward expansion of the Hadley circulation, Sci. Bull., 64, 400–409, https://doi.org/10.1016/j.scib.2018.12.021, 2019.
Lu, X., Zhang, L., Wang, X., Gao, M., Li, K., Zhang, Y., Yue, X., and Zhang, Y.: Rapid Increases in Warm-Season Surface Ozone and Resulting Health Impact in China since 2013, Environ. Sci. Technol. Lett., 7, 240–247, https://doi.org/10.1021/acs.estlett.0c00171, 2020.
Ma, J., Xu, X., Zhao, C., and Yan, P.: A Review of Atmospheric Chemistry Research in China: Photochemical Smog, Haze Pollution, and Gas-Aerosol Interactions, Adv. Atmos. Sci., 29, 1006–1026, https://doi.org/10.1007/s00376-012-1188-7, 2012.
Ministry of Ecology and Environment (MEE): Revision of the Ambien air quality standards (GB 3095-2012) (in Chinese), available at: http://www.mee.gov.cn/xxgk2018/xxgk/xxgk01/201808/t20180815_629602.html (last access: 28 February 2020), 2018.
Otero, N., Sillmann, J., Mar, K. A., Rust, H. W., Solberg, S., Andersson, C., Engardt, M., Bergström, R., Bessagnet, B., Colette, A., Couvidat, F., Cuvelier, C., Tsyro, S., Fagerli, H., Schaap, M., Manders, A., Mircea, M., Briganti, G., Cappelletti, A., Adani, M., D'Isidoro, M., Pay, M.-T., Theobald, M., Vivanco, M. G., Wind, P., Ojha, N., Raffort, V., and Butler, T.: A multi-model comparison of meteorological drivers of surface ozone over Europe, Atmos. Chem. Phys., 18, 12269–12288, https://doi.org/10.5194/acp-18-12269-2018, 2018.
Palmer, P. I., Abbot, D. S., Fu, T.-M., Jacob, D. J., Chance, K., Kurosu, T. P., Guenther, A., Wiedinmyer, C., Stanton, J. C., Pilling, M. J., Pressley, S. N., Lamb, B., and Sumner, A. L.: Quantifying the Seasonal and Interannual Variability of North American Isoprene Emissions Using Satellite Observations of the Formaldehyde Column, J. Geophys. Res., 111, D12315, https://doi.org/10.1029/2005jd006689, 2006.
QA4ECV team: The QA4ECV L3 OMI satellite data for NO2 and HCHO, available at: http://www.qa4ecv.eu/ecvs, last access: 28 February 2020.
Shah, V., Jacob, D. J., Li, K., Silvern, R. F., Zhai, S., Liu, M., Lin, J., and Zhang, Q.: Effect of changing NOx lifetime on the seasonality and long-term trends of satellite-observed tropospheric NO2 columns over China, Atmos. Chem. Phys., 20, 1483–1495, https://doi.org/10.5194/acp-20-1483-2020, 2020.
Shen, L., Mickley, L. J., and Gilleland, E.: Impact of increasing heat waves on US ozone episodes in the 2050s: Results from a multimodel analysis using extreme value theory, Geophys. Res. Lett., 43, 4017–4025, https://doi.org/10.1002/2016GL068432, 2016.
Shen, L., Jacob, D. J., Liu, X., Huang, G., Li, K., Liao, H., and Wang, T.: An evaluation of the ability of the Ozone Monitoring Instrument (OMI) to observe boundary layer ozone pollution across China: application to 2005–2017 ozone trends, Atmos. Chem. Phys., 19, 6551–6560, https://doi.org/10.5194/acp-19-6551-2019, 2019a.
Shen, L., Jacob, D. J., Zhu, L., Zhang, Q., Zheng, B., Sulprizio, M. P., Li, K., De Smedt, I., González Abad, G., Cao, H., Fu, T. M., and Liao, H.: The 2005–2016 Trends of Formaldehyde Columns over China Observed by Satellites: Increasing Anthropogenic Emissions of Volatile Organic Compounds and Decreasing Agricultural Fire Emissions, Geophys. Res. Lett., 46, 4468–4475, https://doi.org/10.1029/2019gl082172, 2019b.
Tai, A. P. K., Mickley, L. J., and Jacob, D. J.: Correlations between fine particulate matter (PM2.5) and meteorological variables in the United States: Implications for the sensitivity of PM2.5 to climate change, Atmos. Environ., 44, 3976–3984, 2010.
Tan, Z., Lu, K., Jiang, M., Su, R., Wang, H., Lou, S., Fu, Q., Zhai, C., Tan, Q., Yue, D., Chen, D., Wang, Z., Xie, S., Zeng, L., and Zhang, Y.: Daytime atmospheric oxidation capacity in four Chinese megacities during the photochemically polluted season: a case study based on box model simulation, Atmos. Chem. Phys., 19, 3493–3513, https://doi.org/10.5194/acp-19-3493-2019, 2019.
TROPOMI team: The TROPOMI satellite L2 HCHO data, available at: https://s5phub.copernicus.eu/dhus, last access: 28 February 2020.
Wang, T., Xue, L., Brimblecombe, P., Lam, Y. F., Li, L., and Zhang, L.: Ozone Pollution in China: A Review of Concentrations, Meteorological Influences, Chemical Precursors, and Effects, Sci. Total. Environ., 575, 1582–1596, https://doi.org/10.1016/j.scitotenv.2016.10.081, 2017.
Wang, T., Dai, J., Lam, K. S., Nan Poon, C., and Brasseur, G. P.: Twenty-Five Years of Lower Tropospheric Ozone Observations in Tropical East Asia: The Influence of Emissions and Weather Patterns, Geophys. Res. Lett., 46, 11463–11470, https://doi.org/10.1029/2019GL084459, 2019.
Wang, X. L.: Historical air quality data in China, available at: https://quotsoft.net/air, last access: 30 June 2020.
Yu, Y., Wang, Z., He, T., Meng, X., Xie, S., and Yu, H.: Driving Factors of the Significant Increase in Surface Ozone in the Yangtze River Delta, China, During 2013–2017, Atmos. Pollut. Res., 10, 1357–1364, https://doi.org/10.1016/j.apr.2019.03.010, 2019.
Zhai, S., Jacob, D. J., Wang, X., Shen, L., Li, K., Zhang, Y., Gui, K., Zhao, T., and Liao, H.: Fine particulate matter (PM2.5) trends in China, 2013–2018: separating contributions from anthropogenic emissions and meteorology, Atmos. Chem. Phys., 19, 11031–11041, https://doi.org/10.5194/acp-19-11031-2019, 2019.
Zhang, J., Wang, C., Qu, K., Ding, J., Shang, Y., Liu, H., and Wei, M.: Characteristics of Ozone Pollution, Regional Distribution and Causes During 2014–2018 in Shandong Province, East China, Atmosphere, 10, 501, https://doi.org/10.3390/atmos10090501, 2019.
Zhang, Q., Zheng, Y., Tong, D., Shao, M., Wang, S., Zhang, Y., Xu, X., Wang, J., He, H., Liu, W., Ding, Y., Lei, Y., Li, J., Wang, Z., Zhang, X., Wang, Y., Cheng, J., Liu, Y., Shi, Q., Yan, L., Geng, G., Hong, C., Li, M., Liu, F., Zheng, B., Cao, J., Ding, A., Gao, J., Fu, Q., Huo, J., Liu, B., Liu, Z., Yang, F., He, K., and Hao, J.: Drivers of Improved PM2.5 Air Quality in China from 2013 to 2017, P. Natl. Acad. Sci. USA, 116, 24463–24469, https://doi.org/10.1073/pnas.1907956116, 2019.
Zhang, X., Xu, X., Ding, Y., Liu, Y., Zhang, H., Wang, Y., and Zhong, J.: The impact of meteorological changes from 2013 to 2017 on PM2.5 mass reduction in key regions in China, Sci. China Earth Sci., 62, 1885–1902, https://doi.org/10.1007/s11430-019-9343-3, 2019.
Zheng, B., Tong, D., Li, M., Liu, F., Hong, C., Geng, G., Li, H., Li, X., Peng, L., Qi, J., Yan, L., Zhang, Y., Zhao, H., Zheng, Y., He, K., and Zhang, Q.: Trends in China's anthropogenic emissions since 2010 as the consequence of clean air actions, Atmos. Chem. Phys., 18, 14095–14111, https://doi.org/10.5194/acp-18-14095-2018, 2018.
Zhu, L., Mickley, L. J., Jacob, D. J., Marais, E. A., Sheng, J., Hu, L., González Abad, G., and Chance, K.: Long-term (2005–2014) trends in formaldehyde (HCHO) columns across North America as seen by the OMI satellite instrument: Evidence of changing emissions of volatile organic compounds, Geophys. Res. Lett., 44, 7079–7086, https://doi.org/10.1002/2017GL073859, 2017.