the Creative Commons Attribution 4.0 License.
the Creative Commons Attribution 4.0 License.
 | 30 Sep 2020
Absorption closure in highly aged biomass burning smoke
Jonathan W. Taylor
Huihui Wu
Kate Szpek
Keith Bower
Ian Crawford
Michael J. Flynn
Paul I. Williams
James Dorsey
Justin M. Langridge
Michael I. Cotterell
Cathryn Fox
Nicholas W. Davies
Jim M. Haywood
The optical properties of black carbon (BC) are a major source of uncertainty in regional and global climate studies. In the past, detailed investigation of BC absorption has been hampered by systematic biases in the measurement instrumentation. We present airborne measurements of aerosol absorption and black carbon microphysical properties in highly aged biomass burning plumes measured 4–8 d from their source over the southeast Atlantic Ocean during CLARIFY-2017, using a suite of novel photoacoustic spectrometers to measure aerosol absorption at 405, 514, and 655 nm and a single-particle soot photometer to measure the BC mass concentration, size, and mixing state. These measurements are of sufficient quality and detail to provide constraint on optical schemes used in climate models for the first time in biomass burning plumes far from their source – an aerosol environment that is one of the most important climatically.
The average absorption Ångström exponents (AAE) were 1.38 over the wavelength range from 405 to 514 nm and 0.88 over the range from 514 to 655 nm, suggesting that brown carbon (BrC) contributed to 11±2 % of absorption at 405 nm. The effective organic aerosol (OA) mass absorption coefficient (MAC) was 0.31±0.09 m2 g−1 at 405 nm. The BC particles were universally thickly coated, and almost no externally mixed BC particles were detected. The average MAC of BC was 20±4, 15±3, and 12±2 m2g−1 at wavelengths of 405, 514, and 655 nm respectively, with equivalent absorption enhancements of around 1.85±0.45 at all three wavelengths, suggesting that the thick coatings acted as a lens that enhanced light absorption by the BC.
We compared the measured MAC and AAE values with those calculated using several optical models and absorption parameterisations that took the measured BC mass and mixing state as inputs. Homogeneous grey-sphere Mie models were only able to replicate MAC for some low (real and imaginary) values of the complex BC refractive index (mBC) at the shortest wavelength, but they would have to use unrealistically low values of mBC to accurately replicate the AAE. A core–shell Mie model was able to generate good agreement for MAC in the green–red end of the visible spectrum for most values of mBC. However, there are no possible values of mBC that produce MAC values that agree with our observations at all three wavelengths, due to a wavelength-dependent underestimation of the MAC of the underlying BC core. Four semiempirical parameterisations from the literature were also tested, linking the BC mixing state to either the MAC or absorption enhancement. Two of these schemes produced results that agreed within a few percent with the measured MAC at all three wavelengths, and the AAE agreed well when discounting the effects of BrC.
Our results uniquely demonstrate the validity of absorption parameterisations, as well as the failings of Mie calculations, in this highly aged environment. We recommend that future work should conduct similar analyses in environments where BC has different properties; future studies should also investigate the impact of implementing these types of schemes within climate models as well as the impact of developing equivalent schemes for light scattering by soot particles at visible wavelengths.
- Article
(1354 KB) - Full-text XML
-
Supplement
(453 KB) - BibTeX
- EndNote


Every year, vast plumes of smoke are lofted into the free troposphere by open biomass burning in central and southern Africa. These plumes make their way westward over the ocean and have an important effect on the radiative budget over the southeast Atlantic. Near the African continent, a stratocumulus deck sits atop the boundary layer, presenting a high-albedo surface that reflects solar radiation. Further west, the boundary layer deepens and the cloud deck becomes more broken, revealing the low-albedo sea surface below. Over cloud, the presence of absorbing aerosol in the free troposphere lowers the planetary albedo, but it can potentially thicken the cloud deck by warming the free troposphere and strengthening the trade inversion (Wilcox, 2010). Smoke is also entrained into the boundary layer, where it increases concentrations of cloud condensation nuclei (CCN), brightening the clouds and raising their albedo; however, this entrainment may also reduce cloud cover by warming the boundary layer and weakening the inversion (Zhang and Zuidema, 2019). These counterbalancing effects are all sensitive to the properties of the aerosol, and the radiative effects are particularly sensitive to the aerosol optical properties. More absorbing aerosol could change the sign of the associated radiative forcing for the semi-direct effect from negative to positive (Zhou et al., 2017).
Black carbon (BC) aerosol is the main absorbing component in these smoke plumes, and it is a major climate warming agent globally. Open biomass burning is a major source of global BC emissions, and African fires make up around 40 % of all open burning (Bond et al., 2013). The mass absorption coefficient (MAC, which refers to the ratio of the absorption cross-section to the BC particle mass) is the key variable for characterising the absorbing properties of BC. The MAC of fresh, uncoated BC is relatively well constrained; Bond and Bergstrom (2006) summarised measurements and found the MAC of uncoated BC to be 7.5±1.2 m2 g−1 at a wavelength of 550 nm, with a wavelength-dependence that can be accurately described using an absorption Ångström exponent (AAE) of 1. To date this work remains the most comprehensive summary of the MAC of fresh soot, and scientific effort since then has mostly focused on the modification of the absorbing properties of BC by non-BC species such as organic aerosol (OA) and inorganic salts (e.g. Liu et al., 2017), as well as absorption by brown carbon (BrC; e.g. Forrister et al., 2015; Healy et al., 2015). Where BC is encapsulated by non-BC material, the MAC of the soot may increase due to a lensing effect, which is often quantified using the absorption enhancement (EAbs, which refers to the ratio of the absorption of coated BC to that of uncoated BC). In biomass burning plumes, BC demonstrates some internal mixing in the first few hours after emission (Akagi et al., 2012), but the effects of this mixing in terms of optical properties remain poorly quantified over timescales of both hours and days.
The core–shell Mie model considers encapsulated BC as two concentric spheres, and it predicts that thickly coated particles can have absorption enhanced by a factor of 2–3 (Bond et al., 2006). However, EAbs values in this range have almost exclusively been measured where particles have been artificially aged (Schnaiter et al., 2005; Mikhailov et al., 2006; Peng et al., 2016), and they have not generally been found in atmospheric measurements. Several studies have shown that using the core–shell Mie model can overestimate EAbs (e.g. Cappa et al., 2012; Healy et al., 2015). Liu et al. (2017) summarised measurements of the variable ageing of diesel emissions in Western nations and showed that EAbs was generally below 1.5. However, subsequent measurements have found EAbs values of up to 2 in aged pollution in Beijing in both summer and winter (Xie et al., 2019a, b). Comparisons with Mie models are complicated due to the size-dependent underprediction of the MAC of bare soot at shorter visible wavelengths, the size-dependent overestimation of EAbs, and only a moderate level of constraint on the BC refractive index (Bond and Bergstrom, 2006).
The addition of coatings may also cause fractal soot aggregates to collapse into a quasi-spherical shape, and Li et al. (2003) observed compacted soot particles using transmission electron microscopy on samples of aged haze from biomass burning in southern Africa. This could reduce absorption as less of the soot is exposed to the light (Scarnato et al., 2013), or it could increase absorption due to stronger interactions between neighbouring soot spherules (Liu et al., 2008). The relative importance of these two competing effects is wavelength dependent in complex optical models, but experimental evidence of either effect remains sparse.
BrC is another major absorbing component of combustion aerosol, and this can include absorption by an emerging classification type for BrC referred to as tar balls. Primary emissions of BrC are particularly prevalent in biomass burning smoke, and secondary BrC may form photochemically or by condensation as plumes cool. BrC absorbs strongly at shorter visible wavelengths, but it has a higher AAE than BC (typically greater than 2) and is not a strong absorber at longer visible wavelengths (Lund Myhre and Nielsen, 2004). This means that the AAE may be used to discriminate between the relative contributions of BrC and BC to total absorption. Primary BrC becomes less absorbing with time due to photochemical bleaching. The majority of BrC absorption decays with a half-life in the region of 9–15 h (Lee et al., 2014; Forrister et al., 2015), but laboratory studies have shown that some BrC species are particularly resistant to some bleaching pathways, such as reactions with ozone (Browne et al., 2019). Moreover, aged biomass burning aerosol may also have a significant BrC component arising from consistent mechanisms acting towards secondary BrC formation over the aerosol atmospheric lifetime.
In climate models, optical property schemes are chosen based on the simplicity of implementation and the computational efficiency. Schemes based on Mie theory are relatively simple to implement, requiring only information on particle size and the relative fractions of different components. Optical models that explicitly include particle shape are too complex and computationally expensive to be used in this context, as well as having limited constraint from observations. In many cases, different aerosol components are mixed together to form homogeneous “grey spheres”, with each of these grey spheres having a single complex refractive index that is often estimated through a simple linear volume-weighting mixing rule (e.g. Ghan and Zaveri, 2007; Bellouin et al., 2013). Core–shell bin schemes have also been developed (e.g. Jacobson, 2001; Matsui et al., 2013), but widespread implementation of these schemes is yet to take place; this is due to the fact that they are more computationally expensive than grey spheres, and it is yet to be demonstrated that they necessarily give more accurate results. Bond et al. (2006) discussed the limitations of these two types of schemes and highlighted the potential of each to reach unphysical results under certain circumstances. Recently, several studies have produced parameterisations to calculate the MAC or EAbs for variable internal mixing of BC with other aerosol components (Liu et al., 2017; Chakrabarty and Heinson, 2018; Wu et al., 2018). These have been constructed using some type of empirical fit to the MAC or EAbs, employing real-world measurements and/or calculations from complex optical models. However, none of these schemes have been explicitly tested on highly aged biomass burning smoke under ambient conditions.
The southeast Atlantic is an excellent natural laboratory for studying the properties of aged smoke during the Southern Hemisphere biomass burning season, which spans from roughly May to October (Zuidema et al., 2016). At this time of year, the southeast Atlantic region is devoid of notable convective clouds that would contribute to the removal of aerosol particles from the lofted smoke layers while they remain in the free troposphere. Combined with the high strength of solar radiation in the tropics, this allows the smoke to reach a very high photochemical age. Zuidema et al. (2018) recently reported high MAC values measured using ground-based instruments on Ascension Island, where aged smoke had entrained into the boundary layer, with equivalent EAbs values of 1.7–2.3. In this paper we describe the results from the CLARIFY-2017 field campaign, which involved airborne measurements of black carbon and optical properties in highly aged biomass burning plumes over the southeast Atlantic (Haywood et al., 2020). We quantify the range of values of the measured MAC and AAE and investigate the absorption closure between microphysical and optical properties of BC for highly aged biomass burning plumes.
2.1 CLARIFY-2017 measurement campaign
The CLARIFY-2017 project took place between 16 August and 7 September 2017. The Facility for Airborne Atmospheric Measurements (FAAM) BAe-146 airborne research aircraft was based out of Ascension Island (7.97∘ S, 14.40∘ W). Smoke plumes from the African continent take roughly 4–8 d to travel from the source to the measurement area (Adebiyi and Zuidema, 2016; Gordon et al., 2018). In total, 28 flights were performed, and the total flight duration of all flights amounted to 100 h. Figure 1 shows the aircraft tracks of all flights included in this analysis. All science flights took off and landed on Ascension Island. Full details of the rationale and implementation of the flight campaign are given in Haywood et al. (2020).
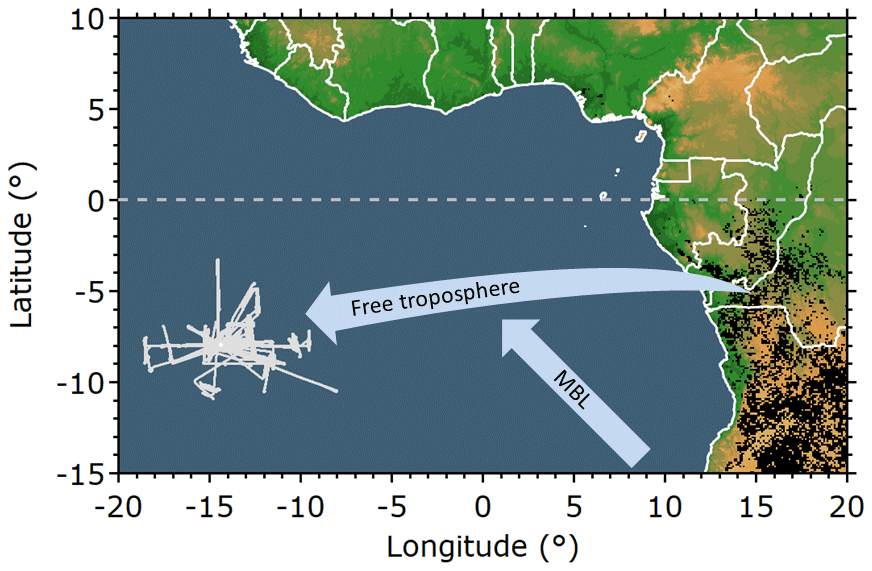
Figure 1Map showing the location of the CLARIFY-2017 aircraft measurements included in this analysis (solid grey trace). The arrows show the approximate mean flow direction in the free troposphere and marine boundary layer (MBL), and the black markers show MODIS fire counts for August–September 2017.
2.2 Instrumentation
The FAAM aircraft was fitted with a suite of instrumentation for making online measurements of the physical and chemical properties of aerosols, cloud microphysics, remote sensing, and meteorological variables such as temperature, pressure, and relative humidity. Only the instrumentation directly relevant to the measurements presented in this study are described here. The black carbon number and mass concentrations and the single-particle mass and mixing state were measured using a single-particle soot photometer (SP2). The instrumental set-up on the aircraft has been described previously (McMeeking et al., 2010). The SP2 measures the scattering cross-section of particles passing though its laser beam, and particles containing refractory black carbon (rBC) are heated to their incandescence temperature. The intensity of the incandescent light emission is proportional to the mass of rBC in the particle. The SP2 alignment was checked using nebulised 200 and 300 nm polystyrene latex spheres, and these measurements were also used to calibrate the scattering channel of the SP2. The instrument response to incandescent rBC was calibrated several times throughout the campaign using nebulised Aquadag, in the manner described by Laborde et al. (2012). In biomass burning plumes the overall uncertainty of the BC mass concentration is ±17 %, which is a combination of 14 % uncertainty due to the uncertainty in the calibration and 9 % variability between instruments (Laborde et al., 2012). The single-particle BC mass was converted to the mass-equivalent BC diameter (DBC) using a BC density (ρBC) of 1.8 g cm−3 (Bond and Bergstrom, 2006). We also used leading-edge only (LEO, Gao et al., 2007; Liu et al., 2015) fits to the scattering measurement from the SP2 to derive the scattering cross-section for BC particles at a wavelength of 1064 nm, and we employed a method similar to that described by Taylor et al. (2015) to quality assure the LEO data. This method is discussed further in Sect. 3. The BC scattering cross-section data can then be combined with an optical model to provide physical properties of the particle, such as the spherical-equivalent shell ∕ core ratio or the mass ratio (MR) of non-BC to BC components. These optical calculations are discussed in more detail in Sect. 4.
For BC mass measurements, the SP2 detection limits are driven by a gradual drop-off in the detection efficiency for particles with a BC content of less than around 1 fg (102 nm mass-equivalent core diameter, DC; Schwarz et al., 2010) and a sharp cut-off at 143 fg (533 nm equivalent DC), where the incandescence detector saturates. For particles that saturate the incandescence detector, we assume that the BC content is 143 fg. Particles with a BC content of less than 1 fg are numerous but contain a negligible fraction of the total BC mass. Particles larger than 143 fg BC are rare, and by examining lognormal fits to the BC mass distribution, we estimate that the uncertainty in the BC mass concentration caused by detector saturation is less than 1 %. The upper cut-off diameter of the SP2 in terms of total particle diameter (DP, i.e. the coated diameter for coated particles) is not affected by detector saturation in any practical sense. It is determined by aerodynamic limitations of particles entering the inlet, and is likely to be in the region of 1 µm. The instrument inlets are discussed further below.
The SP2 single-particle data were also examined for coincidence at high concentrations, which would cause the instrument to undercount the BC number and mass concentrations. The highest BC number concentrations measured were just below 1000 cm−3, and with this high loading, 2 % of particle detection windows showed coincident particles. To correct for this small bias, the coincident particles were included in the concentrations of BC mass and number concentrations but not in the single-particle mixing state analysis, as the leading-edge scattering signal can only be measured for the first particle in a measurement window.
Under certain conditions, charring can occur as weakly absorbing particles enter the laser of the SP2, causing a false black carbon signal. Sedlacek et al. (2018) showed that this can occur for fulvic and humic acids (BrC surrogates) but only when they had been passed through an external heated tube furnace, which we do not use in our experiment. Artificial tar balls formed through anoxic pyrolysis may also show a false rBC signal, but tar balls formed in real fires have been observed to show no detectable incandescence signal in the SP2 (Adler et al., 2019). Therefore, we do not consider this to be a major concern for our observations.
The non-refractory aerosol composition was measured using a compact time-of-flight aerosol mass spectrometer (AMS), which we used to provide mass concentrations of organic aerosol (OA) as well as the major inorganic species SO4, NO3, and NH4. The AMS detection size range is determined by the transmission of the aerodynamic lens on the instrument's inlet, which has transmission efficiency near 100 % over the size range from 50 to 1000 nm (Liu et al., 2007). The AMS data are used here to provide some context to the black carbon and optical measurements, as well as to calculate the density of the non-BC components. An in-depth discussion of the aerosol chemical composition and vertical profile is presented by Wu et al. (2020). The AMS was calibrated before and after each flight using nebulised ammonium nitrate, and the relative ionisation efficiencies of NH4 and SO4 were also calibrated during the campaign by varying the concentrations of nebulised ammonium nitrate and ammonium sulfate (Allan et al., 2004).
Carbon monoxide (CO) concentrations were measured using a vacuum ultraviolet fluorescence spectroscopy monitor (AL5002). The CO data are used as a measure of the amount of pollution throughout the atmospheric profile. The CO monitor was calibrated and zeroed multiples times per flight at different altitudes and has an overall accuracy of ±3 %.
The aerosol absorption coefficient (BAbs) was measured using three separate photoacoustic spectroscopy (PAS) cells, operating at wavelengths of 405, 514, and 655 nm, as part of the new EXtinction, SCattering and Absorption of Light for AirBorne Aerosol Research (EXSCALABAR) suite of instrumentation (Davies et al., 2019). The PAS instruments sampled behind an impactor with a cut-point of 1.3 µm aerodynamic diameter to remove coarse-mode particles, and a Nafion drier was used to lower the measurement relative humidity (RH) to below 10 % within the PAS detection volume. Davies et al. (2018) describe the PAS instrument and ozone calibrations, which were performed before each flight. For long averaging times, the total uncertainty on the BAbs measurement is 8 % (Davies et al., 2019).
We calculate the MAC by dividing BAbs by the BC mass concentration measured by the SP2, and the systematic uncertainty in MAC of ±19 % is calculated by combining the relative uncertainties of the BAbs and BC mass concentration in quadrature. We also calculate EAbs by dividing the measured MAC by the values reported for fresh BC by Bond and Bergstrom (2006) of 7.5±1.2 m2 g−1 at a wavelength of 550 nm. The uncertainty in EAbs is then 25 %, which is calculated by combining the uncertainty in our measured MAC with the range of MAC values from Bond and Bergstrom (2006). The AAE was calculated by comparing the absorption coefficient at different wavelengths. The 8 % uncertainty in the absorption coefficient applies almost equally to all channels, as it derives from a comparison between ozone calibrations and nebulised nigrosin dye (Davies et al., 2018). Therefore, the uncertainty in the AAE is significantly lower than that of individual single wavelength PAS measurements and is expected to be under 5 %.
All aerosol concentration measurements were corrected to a respective standard temperature and pressure of 273.15 K and 1013.25 hPa. The inboard aerosol instruments all sampled from Rosemount inlets, and the instrumental set-up and detection ranges mean they all sampled a comparable size range of accumulation-mode submicron aerosol (Trembath et al., 2012). The main instruments discussed here have slightly different upper cut-off diameters: 1.3 µm for the PAS, 1 µm for the AMS, and around 1 µm for the SP2. Wu et al. (2020) presents the aerosol size distributions measured at ambient humidity using a passive cavity aerosol spectrometer probe (PCASP, Droplet Measurement Technologies, model SSP-200). Examination of these size distributions determined that the difference between a cut-off of 1.0 and 1.3 µm equated to 1.5 % in terms of the total particle volume distribution.
In-cloud data were removed when the liquid water content measured by a wing-mounted cloud droplet probe exceeded 0.01 g m−3. To prevent noise at low concentrations from affecting our measurements, aerosol data were also removed when the BC mass concentration fell below 0.1 µg m−3 or the absorption coefficient at any wavelength fell below 5 Mm−1.
Figure 2 shows vertical profiles describing the average atmospheric conditions measured during CLARIFY-2017 in terms of the level of pollution, meteorological variables, and the chemical composition of the aerosol. The marine boundary layer (MBL) was capped by an inversion of several degrees Celsius around 1.5–2 km in altitude, although the exact altitude and depth of this inversion varied. The RH in the boundary layer increased from 75 % near the surface to 80 % up towards the top of the boundary layer, where a stratocumulus deck was often present, although it was excluded from our data. Plumes in the free troposphere were much drier, but the RH increased with altitude, from 20 % at 2 km to 50 % at 5 km, and some plumes reached up to 70 %–80 %.
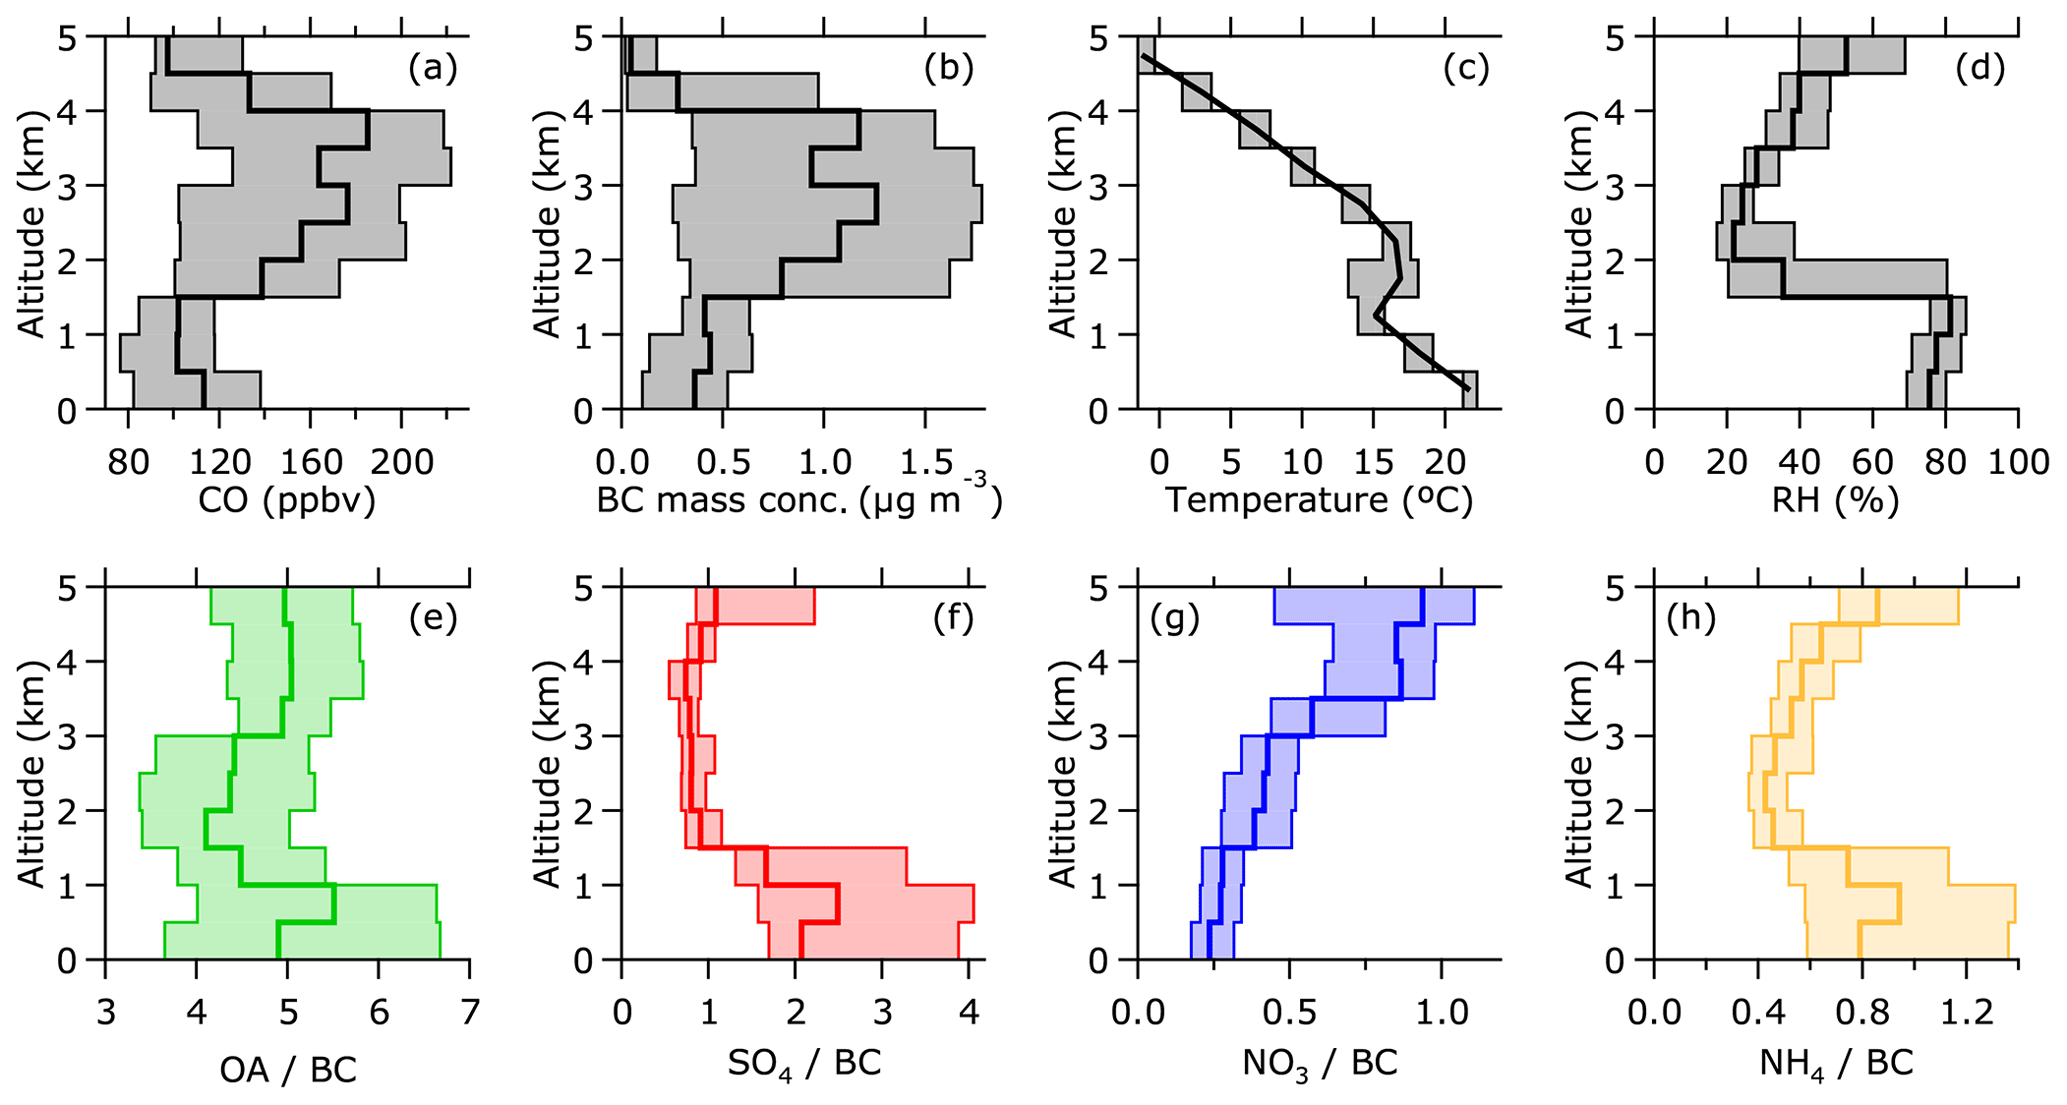
Figure 2Campaign average vertical profiles of pollution levels, thermodynamic variables, and aerosol chemical composition. The solid lines show the median and the shaded areas show the 25th and 75th percentiles. Panels (c)–(h) show the in-plume data only. Panels (e)–(h) show the ratios of the mass concentrations of organic aerosol and the major inorganic ions to the mass concentration of BC.
The CO and BC profiles show the altitudes at which the biomass burning smoke reached the area around Ascension Island. There was considerable variability in the regimes that were experienced during the aircraft deployment with the pollution confined to either the MBL or free troposphere or with pollution in both the MBL and free troposphere at any particular time (Wu et al., 2020). However, for the purposes of the analysis presented here, where we focus on aerosol intrinsic properties, we simply present average vertical profiles. The highest smoke concentrations were found between the inversion top and around 4.5 km, and no significant concentrations of smoke were intercepted above 5 km. The variability in the free troposphere CO and BC profiles shows the average of many discrete plumes at variable altitudes. The aged smoke particles were in the accumulation-mode size range (Wu et al., 2020). Comparing the BC number concentration to the accumulation-mode number concentration measured by the PCASP, the BC number fraction was 39±7 %. Comparing the BC number concentration to the scattering particle concentration from the SP2 (which has a more limited detection range) alone, this fraction was 55±7 %. The exact numbers are sensitive to the lower detection limits of the various measurements, so they may vary from probe to probe. Nevertheless, it is clear that a significant fraction of particles contained BC but also that a significant fraction contained little to no BC.
Figure 2e–h show the ratios of non-refractory aerosol components measured by the AMS, relative to the BC mass concentration, which give an indication of the composition of BC coatings if the particles are internally mixed, as well as the composition of particles that contain little to no BC. OA dominated the aerosol mass. Although the OA∕BC ratio profile was relatively constant throughout the profile compared with ratios of some of the inorganic components to BC, it was larger and more variable in the MBL than in the free troposphere. In the free troposphere, the NO3∕BC and NH4∕BC ratios all increased between 2 and 5 km; the OA∕BC ratio also increased, although to a much lesser extent. This is consistent with a change in the equilibrium of semi-volatile species to favour the condensed phase at lower temperatures, which is discussed in more detail by Wu et al. (2020). However, these differences may also be related to different ageing and/or sources of the smoke layers measured at different altitudes. The increased sulfate and ammonium in the MBL compared with the free troposphere suggests a marine influence on the aerosol, and the variability of these components in the MBL is due to the variation in the relative contributions of biomass burning smoke and marine aerosol.
Figure 3 shows average vertical profiles of BC properties and the MAC. The average values of the BC core mass median diameter (MMD) are slightly smaller than most field measurements of biomass burning (e.g. Kondo et al., 2011; Sahu et al., 2012; Taylor et al., 2014), which tend to be in the range from 190 to 215 nm, but they are still larger than laboratory burns by May et al. (2014), which were in the 170±20 nm range. Holder et al. (2016) also reported that the MMD of fresh BC from biomass burning was source dependant, showing that grass such as that from savannah sources in southern and central Africa produced smaller BC cores. The count median diameter (CMD) values are also reported here, as they can be a useful indicator of different sources or be an indication of cloud processing. Comparisons of the CMD with values from the literature are difficult, as the CMD is sensitive to the lower cut-off diameter of the instrument, which varies between instruments (Laborde et al., 2012). The vertical profiles show no strong trends in the CMD or MMD, although both distributions were shifted a few nanometres lower in the boundary layer compared with the free troposphere. This shift could be due to different source regions or wet removal processes in the boundary layer preferentially removing the largest particles, although to a much lesser extent than described by Taylor et al. (2014).
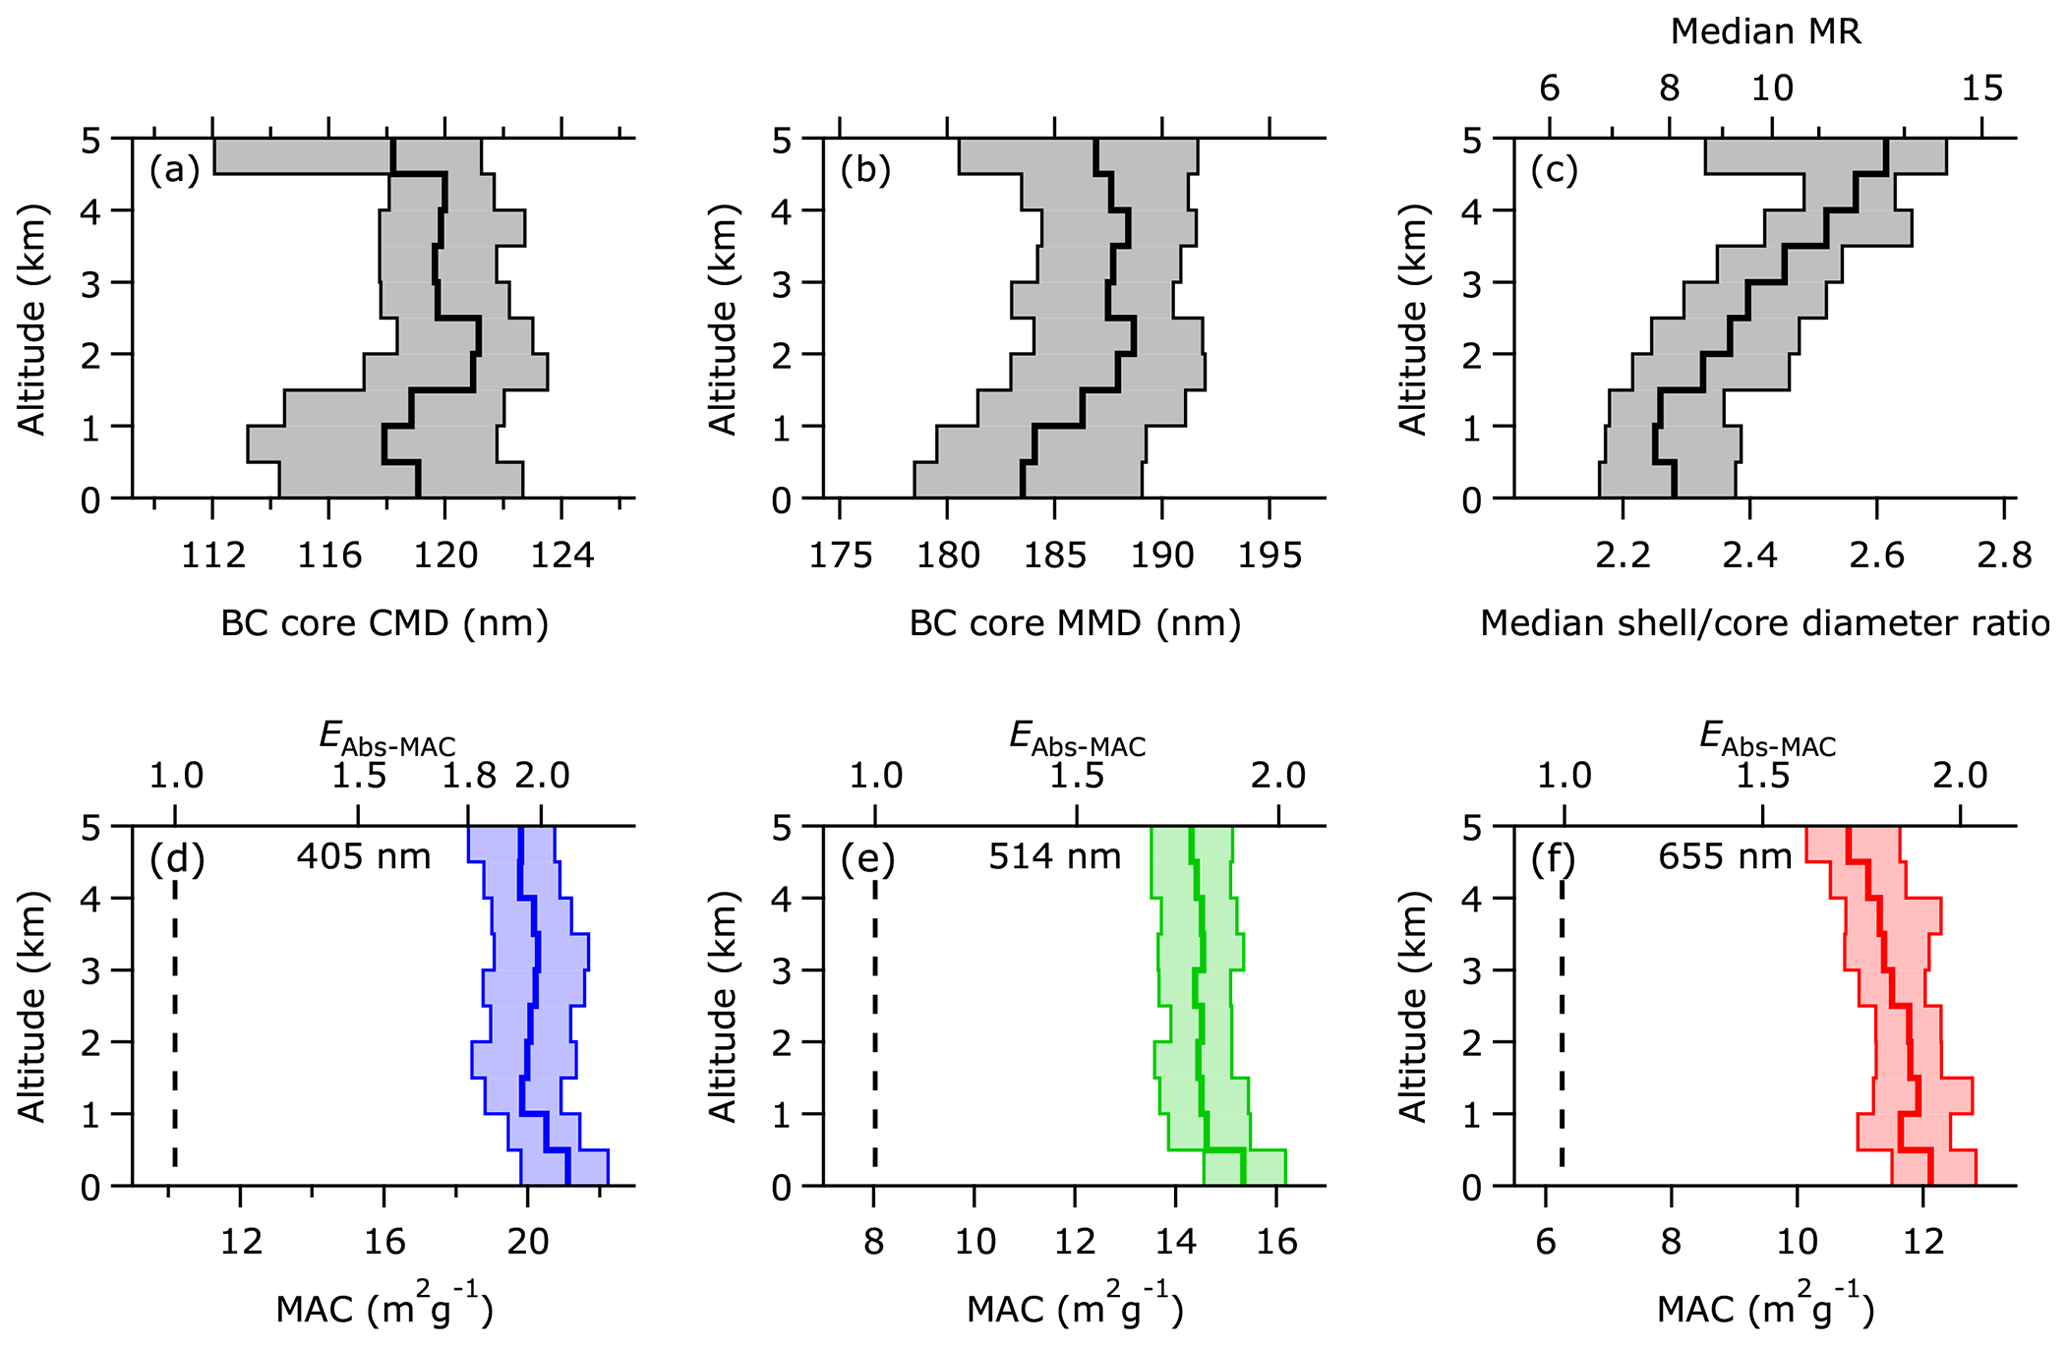
Figure 3Campaign average vertical profiles of BC properties and MAC. The solid lines show the median and the shaded areas show the 25th and 75th percentiles. Panels (a) and (b) show the count median diameter (CMD) and mass median diameter (MMD) of BC core size distributions, and panel (c) shows the vertical profile of the SP2 shell ∕ core ratio. The EAbs scale in panels (d)–(f) are calculated by dividing the measured MAC by the MAC for uncoated BC reported by Bond and Bergstrom (2006), which is represented by the vertical dashed lines. The uncertainties in the average values are ±19 % for MAC and ±25 % for EAbs.
Figure 3c shows the profile of the median BC MR and the spherical-equivalent shell ∕ core ratios, assuming a concentric core–shell geometry of a BC core coated by non-BC material. The average values show significant internal mixing throughout the profile, and they compare well to previous measurements of aged biomass burning smoke (e.g. Taylor et al., 2014, and references therein). The equivalent median absolute coating thicknesses were around 90 nm in the boundary layer, which is similar to aged smoke in Amazonia (Darbyshire et al., 2019), and up to 120 nm in the free troposphere. BC coatings increased with altitude: the median shell ∕ core ratios were around 2.3 in the boundary layer and increased up to around 2.6 between 4 and 5 km. This trend is likely to be related to the increase of condensed-phase semi-volatiles, such as ammonium nitrate, in the free troposphere with altitude, as shown in Fig. 2.

Figure 4Average measured MAC as at different wavelengths, showing the calculation of the BrC absorption fraction at 405 nm. The black markers are the average CLARIFY-2017 measurements, the dashed black line is the BC absorption reported by Bond and Bergstrom (2006), the coloured solid lines represent the wavelength-dependent MAC based on the measured AAE between the two wavelength pairs, and the dashed red line represents the predicted MAC if the measured AAE from the 514–655 nm wavelength pair is extrapolated to shorter visible wavelengths.
Figure 3d–f show the average vertical profiles of the MAC at the three measurement wavelengths, and the campaign average values are also shown as a function of wavelength in Fig. 4. The average values were 20±4, 15±3, and 12±2 m2g−1 at wavelengths of 405, 514, and 655 nm respectively. These values are around a factor of 1.85±0.45 higher than that expected of fresh, externally mixed BC, reported by Bond and Bergstrom (2006). This high absorption enhancement (EAbs-MAC, which refers to the ratio of the measured MAC to the values reported by Bond and Bergstrom, 2006) is conceptually consistent with the high measured coating thicknesses, although the exact modelled values will depend on which optical model is used. The vertical variability in the MAC was of the order of a few percent and was smaller than the uncertainty of ±19 % associated with the MAC calculation.
Alongside the mean MAC, Fig. 4 also shows the mean AAE calculated between the three wavelength pairs (AAE405−514, AAE514−655, and AAE405−655 between 405–514, 514–655, and 405–655 nm respectively). The rationale behind examining the different wavelength pairs is that AAE405−514 is most sensitive to BrC absorption at the shorter wavelengths, whereas AAE514−655 is less sensitive to BrC, and AAE405−655 is most useful for comparison with the literature. AAE514−655 was just below unity, which is within the range expected from absorption by black carbon, with no significant absorption by BrC at these wavelengths. An AAE405−514 of around 1.4 suggests a small contribution from BrC to absorption at the shorter wavelengths. There are some uncertainties associated with this approach in that optical models do not always predict that the AAE of BC is invariant with wavelength. We revisit this calculation in Sect. 4.3, including model estimates of the AAE of BC, and show that this calculation is robust to first order. By extrapolating the BC absorption from the longer wavelengths, we estimate the fractional contribution of BrC to absorption at 405 nm using the following equation:
where FBrC-405 is the fraction of absorption at a wavelength of 405 nm due to BrC, and MAC405 and MAC514 are the measured MAC at wavelengths of 405 and 514 nm respectively.
The average value of FBrC-405 was 11±2 %, and it is likely that the BrC fraction of absorption will increase at even shorter wavelengths in the UV spectrum, although these are less relevant for climatic absorption due to the shape of the solar spectrum. The uncertainty here is only extrapolated from the relative uncertainties between the different PAS absorption wavelengths (<5 % for the AAE values), as the BC mass concentration scales the MAC equally at all wavelengths, and drops out of the calculation. Therefore, the error bars in Fig. 4 are not representative of the uncertainty in this calculation.
It is useful to calculate the effective MAC of the mixture of BrC and non-absorbing OA components, by dividing the calculated BrC absorption by the measured OA mass concentration, as this allows for comparison between different projects. The equation here is of the form
using the campaign average ratio of the BC and OA mass concentrations, which was 0.13.
This calculation yields the effective MAC for OA at 405 nm of 0.31±0.09 m2 g−1. The uncertainty is propagated from the relative uncertainties between the different PAS absorption wavelengths and the uncertainty in the OA mass concentration, and again the BC mass concentration drops out of the calculation. The measurement size ranges of the AMS, SP2, and PAS are all limited to the submicron accumulation mode, so the uncertainty due to a mismatch in measurement range should be small. This value is not the MAC of BrC – it is the effective MAC of the mixture of BrC and non-absorbing OA components. A comparison with the literature is difficult here as many studies use different wavelengths and different methods to quantify the OA or BrC mass. Two studies using a similar measurement method and wavelength as those described here reported values of 0.5–1.5 m2 g−1 (Lack et al., 2012) and 0.53–0.6 m2 g−1 (Zhang et al., 2016) for BrC absorption fractions of around 30 % at similar blue wavelengths. Our calculated effective OA MAC is significantly lower than these studies, which is consistent with the lower BrC absorption fraction measured for this work.
In the previous section, we presented an overview of the vertical profiles and properties of aged smoke over the southeast Atlantic measured during the CLARIFY-2017 campaign. In this section, we describe the steps required to simulate the MAC from the single-particle measurements of BC mass and the scattering cross-section, and we compare results from a variety of optical models to the measured properties of the aerosol. The framework is built upon a combination of previous work by Taylor et al. (2015) and Liu et al. (2017) and is made up of two distinct halves. The previous work focused on relating the instrument response of the SP2 to physical properties of the particles. Taylor et al. (2015) detailed how to account for the limited detection range of the instrument and also explored the sensitivities to assumptions about the BC density and refractive index (mBC). Liu et al. (2017) then compared optical models to extensive sets of lab and field measurements to produce a semiempirical relationship relating BC particles' optical scattering to their size and mixing state, essentially characterising how real particles deviate from the core–shell Mie model. Applying these steps generates a set of physical properties of the BC-containing particles, similar to what may exist within a climate model. For the first half of this framework, previous work has determined a well-characterised route to determine the size and mixing state of the BC particles with a degree of accuracy (Liu et al., 2017).
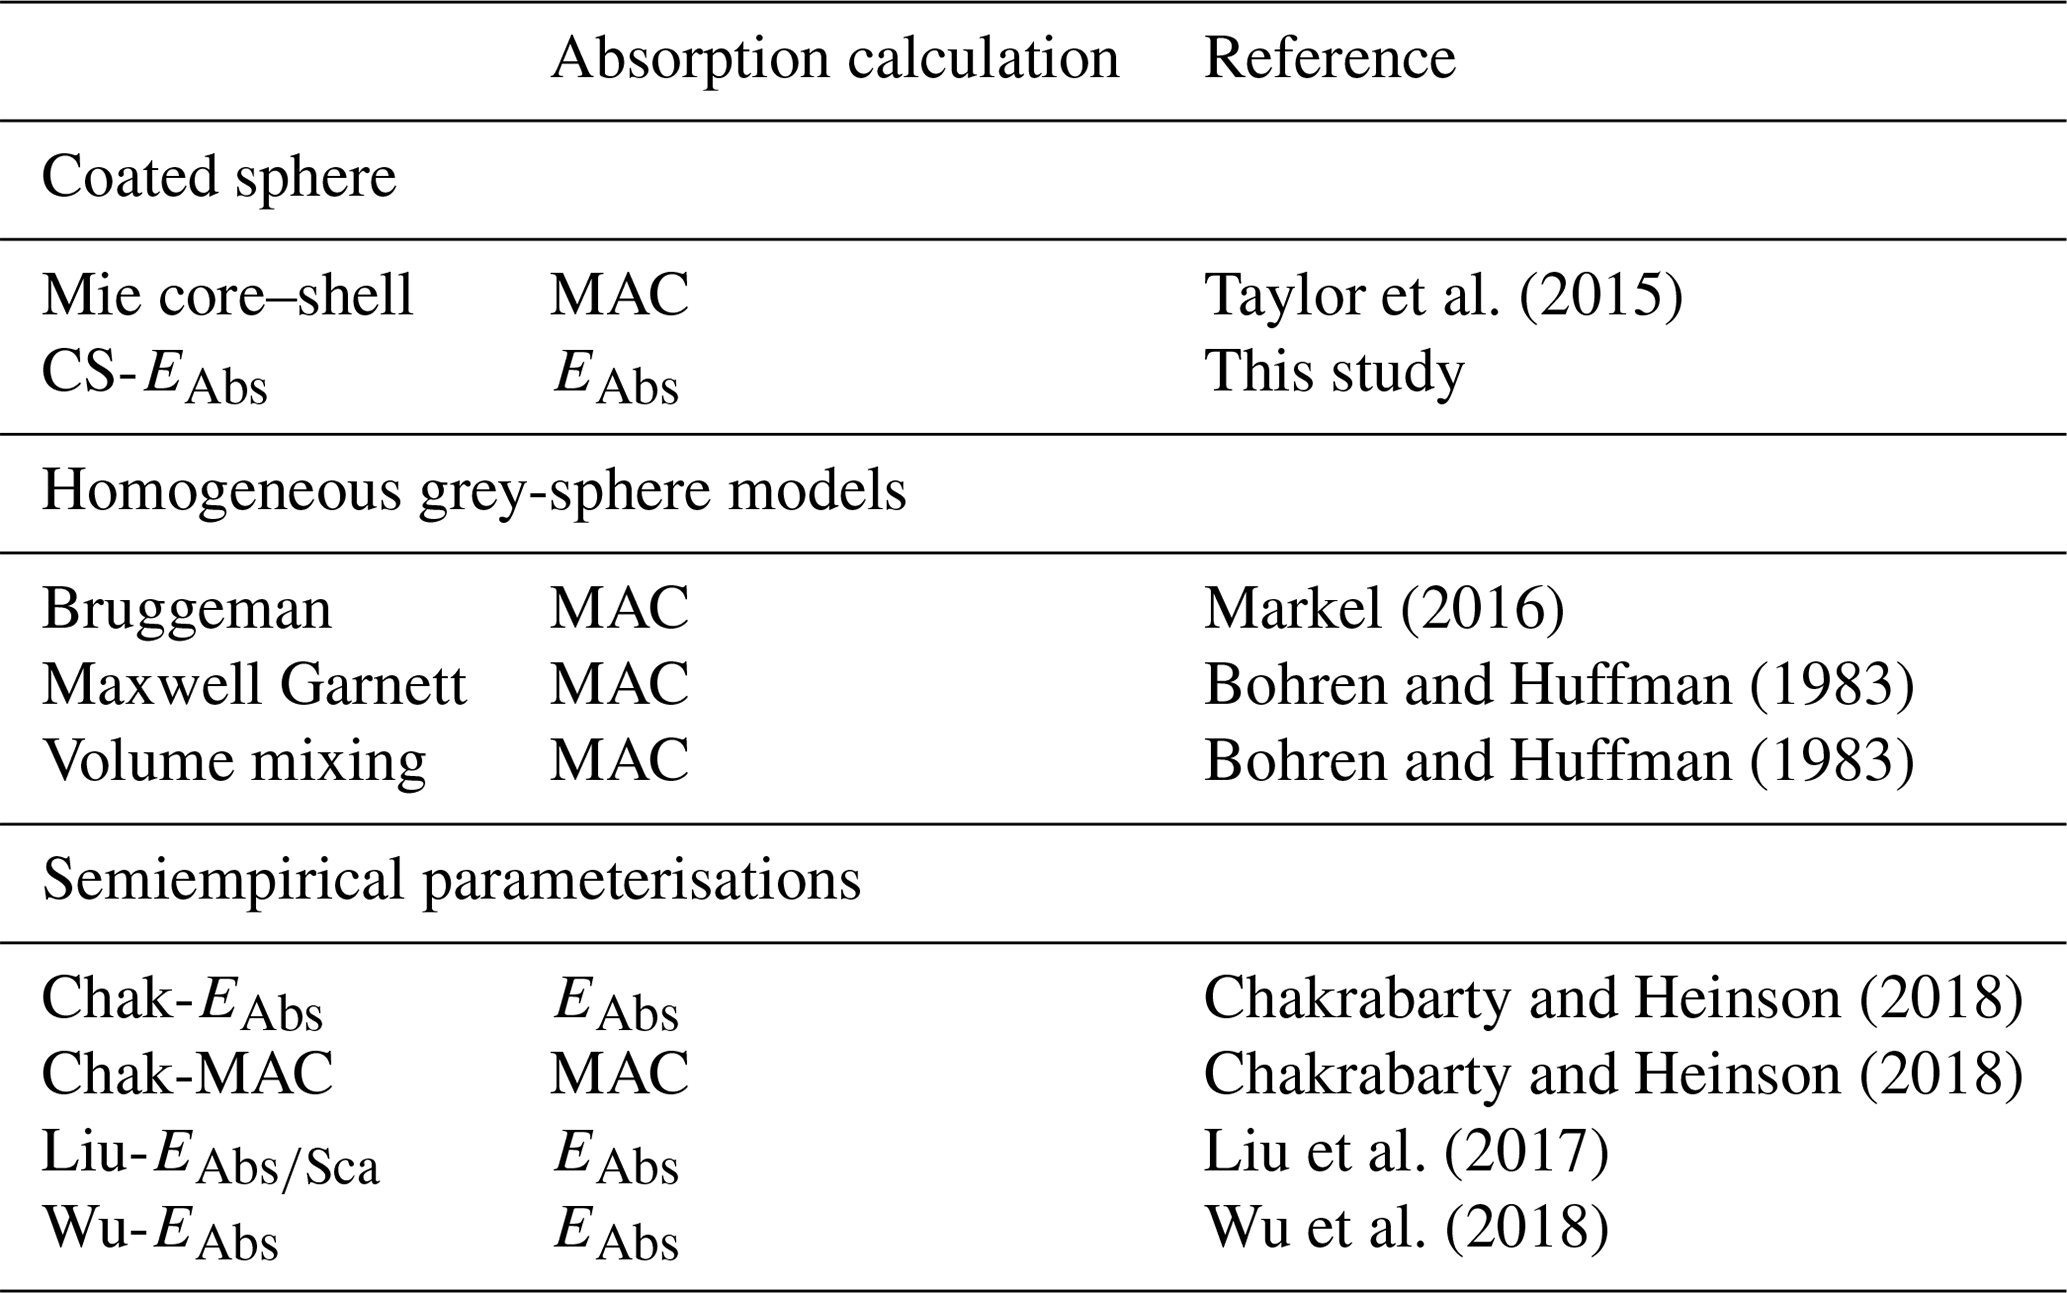
These physical properties are then used to test different optical schemes that could be implemented in such a climate model, given the in situ optical property observations of MAC and AAE above. Here we have freedom to vary the optical model and the underlying assumptions, including parameters such as mBC, as would be possible in a climate model. The optical models and parameterisations tested in this analysis are listed in Table 1 and are described in detail in Sect. S1 in the Supplement. We have tested the core–shell Mie model, as well as several homogeneous grey-sphere models, which utilise a Mie model with a sphere of one single complex refractive index, calculated using different rules to account for the mixing between BC and non-BC components. The different mixing rules are as follows: (i) volume mixing, where the refractive index is calculated using the volume of each component as the weights in a weighted average; (ii) the Maxwell Garnett approximation (Markel, 2016), which considers the mixing of small particles of BC dispersed throughout a non-BC host medium; and (iii) the Bruggeman mixing rule (Markel, 2016), which computes the refractive index of two components dispersed evenly within a particle. We have also tested several parameterisations of either MAC or EAbs (Liu et al., 2017; Chakrabarty and Heinson, 2018; Wu et al., 2018), which are based on empirical or semiempirical fits to MAC or EAbs for particles with different mixing states using real and/or modelled particle data.
Taylor et al. (2015)Markel (2016)Bohren and Huffman (1983)Bohren and Huffman (1983)Chakrabarty and Heinson (2018)Chakrabarty and Heinson (2018)Liu et al. (2017)Wu et al. (2018)Table 1List of the different optical models used in this analysis. The absorption calculation column refers to whether the models and parameterisations calculate MAC or EAbs. For those that only calculate EAbs, MAC is calculated by multiplying EAbs by the fresh MAC value from Bond and Bergstrom (2006).
4.1 Deriving a 2-D size and mixing state distribution
The SP2 measures the per-particle BC mass (MBC) and scattering cross-section over a specified collection angle. In studies of the BC mixing state, a lookup table is often used to estimate some metric of internal mixing, such as the coated diameter assuming a spherical core–shell morphology. This process is summarised in Fig. 2 of Taylor et al. (2015) and the associated discussion. Some recent work has focused on the mass ratio (MR) as an alternative metric, defined here as MR (Liu et al., 2017). The advantage of using the MR as a metric is that it does not assume anything about particle morphology; the disadvantage is that explicit optical models do not use the MR. Commonly used Mie models work in terms of diameter (or more specifically, the size parameter , where λ is the wavelength); thus, some measurements or assumptions regarding the densities of both the core and coating are needed to convert the MR into diameter. The process for generating a 2-D mixing state distribution requires several steps, which are shown as a schematic in Fig. S2 in the Supplement and are detailed in the following:
-
Perform core–shell Mie scattering calculations at 1064 nm to create a 2-D lookup table of the scattering cross-section vs. the core diameter and coated diameter.
-
Correct this Mie table to represent light scattering by real BC particles using the empirical correction described in Liu et al. (2017), by calculating the equivalent MR using the diameters and densities of the core and coating. This empirical correction to the core–shell Mie model accounts for the fact that particles with an MR <3 do not scatter light at 1064 nm exactly as described by the core–shell Mie model.
-
Convert the single-particle MBC measured by the SP2 to the spherical-equivalent DBC, giving single-particle data of the DBC and the scattering cross-section.
-
Process the single-particle data through the table to calculate the single-particle spherical-equivalent shell diameters, including the Liu et al. (2017) correction.
-
Convert the single-particle shell ∕ core ratio to the MR, and bin the data into a 2-D distribution of MR vs. MBC.
-
Correct this distribution for the limited detection range of the SP2, which is described in further detail in Sect. S3 in the Supplement.
Steps 1 and 2 are purely theoretical calculations, whereas steps 3–6 involve processing the measured data. These steps require knowledge of several intrinsic properties of the particles. A BC density of ρBC=1.8 g cm−3 is generally accepted as the best estimate following the review by Bond and Bergstrom (2006). Previous work has shown that using the Mie core–shell model with this density and a BC refractive index produces good agreement for externally mixed BC particles for scattering at 1064 nm (Moteki et al., 2010; Taylor et al., 2015). These values were also used to derive the empirical correction by Liu et al. (2017). For the refractive index of the shell's non-BC components (mShell), we used a value of 1.5−0i as in previous work (e.g. Schwarz et al., 2008; Taylor et al., 2015; Liu et al., 2017). Using a non-absorbing coating assumes that BrC makes no direct contribution to absorption. The impact of this assumption will be discussed in the next section. The density of non-BC components was calculated by volume mixing using the relative fractions of the AMS composition, applying densities of 1.2 g cm−3 for OA and 1.77 g cm−3 for inorganic components (Cross et al., 2007), assuming there is no chemical difference between the BC coating and the bulk non-BC mass of the aerosol.
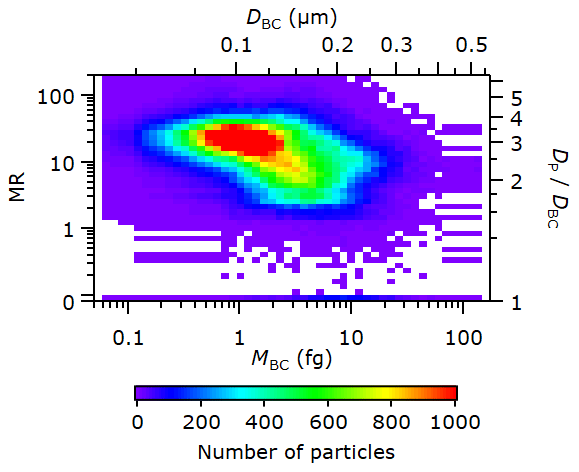
Figure 5Example 2-D distribution of BC mass and mixing state, corrected for the size-dependent detection efficiency of the instrument (see Sect. S3). This distribution was taken from one straight and level run on 4 September 2017. The data shown are in terms of the MBC and MR on the respective bottom and left axes, and equivalent values of the DBC and shell ∕ core ratio are shown on the respective top and right axes, assuming ρBC=1.8 g cm−3 and ρShell=1.34 g cm−3.
Figure 5 shows an example 2-D distribution of the BC mass and mixing state (MR vs. MBC), which was generated by taking the SP2 measurements and applying the semiempirical Liu-EAbs∕Sca scheme (steps 4 and 5 above). Equivalent distributions were generated for each straight and level run during the campaign, and the broad features were similar across all the distributions showing biomass burning aerosol. The MR distribution was centred around 20 for 1 fg cores, but it was around 7–8 for BC larger than a few femtograms. Few particles were in the bottom bin of MR = 0 for externally mixed particles. The distribution has been corrected for the size-dependent detection efficiency of the SP2 instrument (step 6 above), using the approach described by Taylor et al. (2015), and is discussed in more detail in Sect. S3. Previous studies have used a core–shell Mie model to relate the light scattering properties of particles to their coating properties. The Liu-EAbs∕Sca is an empirical correction to the core–shell Mie model that accounts for the fact that particles with an MR <3 do not scatter light exactly as described by the core–shell Mie model at 1064 nm. In our dataset, the vast majority of particles had an MR >3 and, therefore, were in the regime where the Liu-EAbs∕Sca parameterisation shows that light scattering at 1064 nm is well represented by the core–shell Mie model.
Taylor et al. (2015) investigated the effect of uncertainties associated with assumed parameters on the derived coating thicknesses. Here, we performed a Monte Carlo analysis to calculate the combined uncertainty in the derived coating properties and MR. A description of the Monte Carlo approach as well as a summary of the results is presented in Sect. S4. While the uncertainties in the shell ∕ core ratios and the absolute coating thicknesses were around 6 %–8 %, the uncertainty in the average MR was around 20 %. This larger uncertainty is likely due to the larger uncertainty in the density of the coating material. In the next section, we use the 2-D distributions of the MR vs. MBC as input for various optical models to generate absorption properties, and we discuss the uncertainty associated with these calculations.
4.2 MAC and AAE calculations
Having established the properties of the measured particles in terms of the MBC and MR, it is then possible to use the different optical models in Table 1 to calculate the MAC of the BC particles. In some ways the overall process is conceptually similar to the last section, but it starts with the 2-D distribution of MR vs. MBC rather than the single-particle data, and it outputs the ensemble mean absorption coefficient. The different optical models described in Sect. S1 were used to calculate tables of the absorption cross-section on the same grid as the 2-D particle distributions, converting them to spherical-equivalent diameters where necessary using the same densities as in the previous section. We employed a full 2-D bin scheme because absorption calculations using modal schemes (which use only a single representative value of MBC) may show significant deviations from explicit calculations. The uncertainties associated with the MAC and AAE calculations from the different optical models were calculated using the Monte Carlo analysis described in Sect. S4.
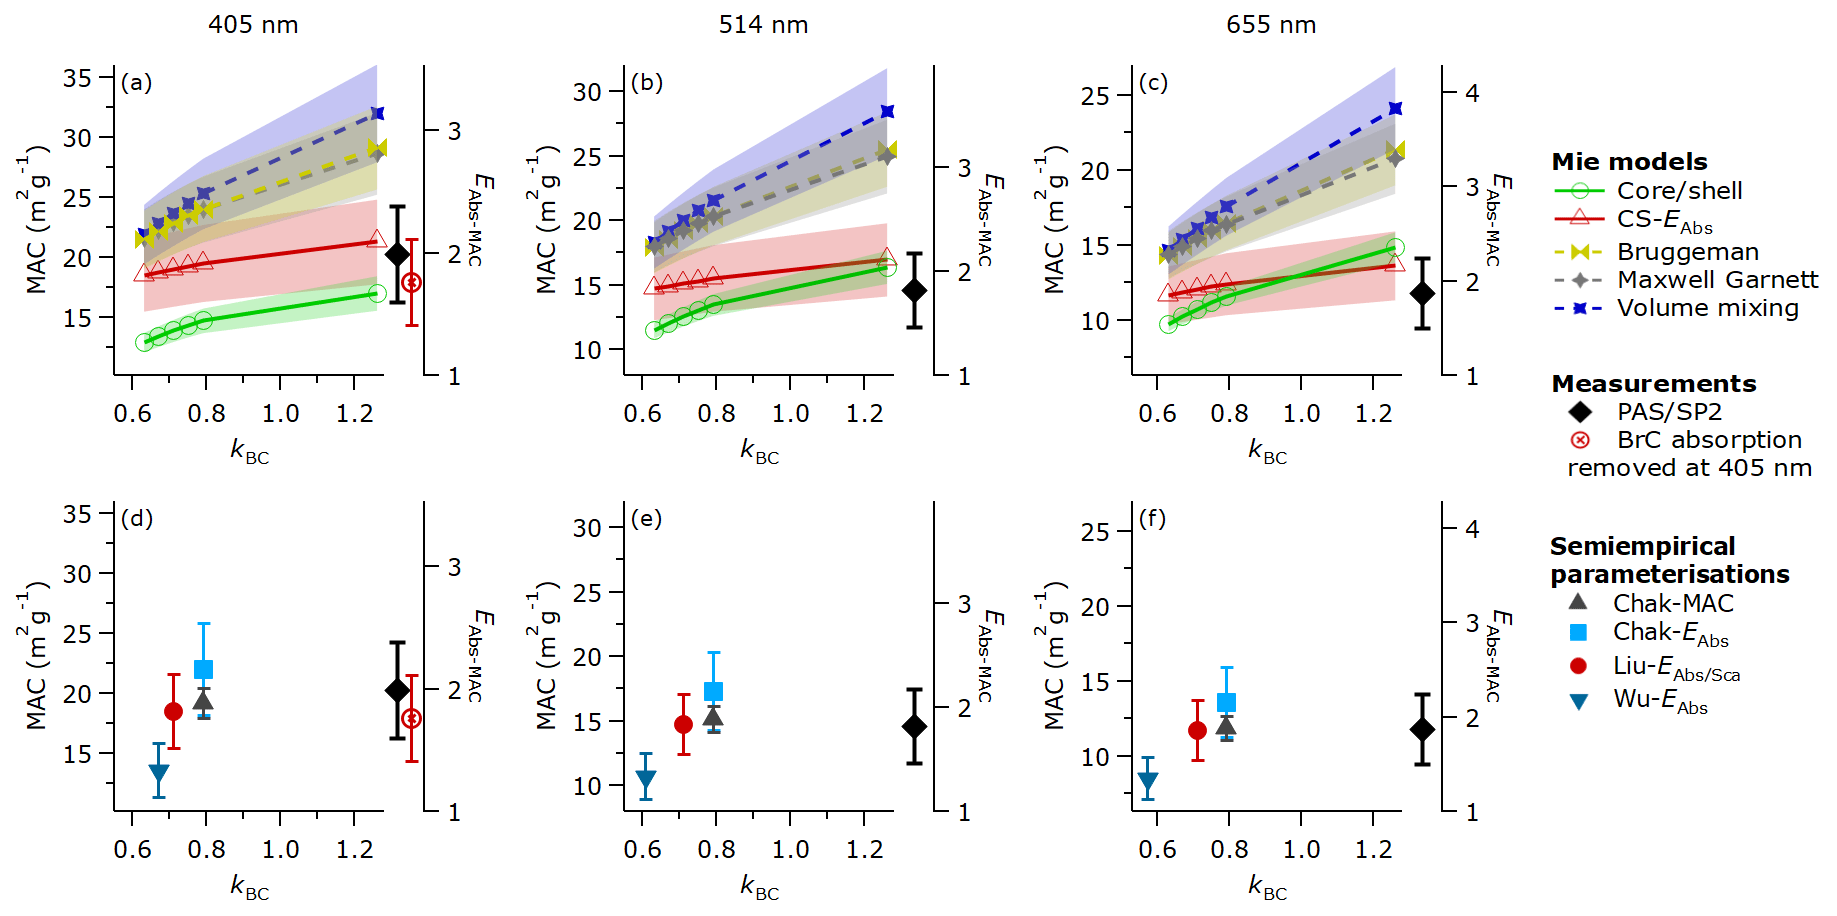
Figure 6Comparison of the measured MAC with values calculated using different optical models at three visible wavelengths. Panels (a)–(c) show different Mie models evaluated at various values of mBC, plotted against kBC on the horizontal axis. Panels (d)–(f) show parameterisations that are plotted at the values of kBC at which the parameterisations were developed. The right-hand axes show the equivalent values of EAbs by comparing values to the fresh MAC reported by Bond and Bergstrom (2006). The measured data, displayed as black diamonds to the right of each x axis, show the weighted mean from the various straight and level runs during CLARIFY-2017, and the errors bars are the systematic uncertainty of 19 %. The red markers at 405 nm show the calculated BC MAC with no BrC, extrapolated from the longer wavelengths (see text for further details). The model and parameterisation data show the mean (unweighted) and error bars that are taken from the Monte Carlo analysis described in Sect. S4, as well as the uncertainty in the fresh MAC reported by Bond and Bergstrom (2006) for the EAbs parameterisations.
For calculating absorption at visible wavelengths, various values of mBC were tested in the Mie models, and these are listed in Table S1. For the parameterisations we only used the values used in their derivation. The rationale behind varying the mBC in this way is simply to explore the sensitivity to this parameter. There is no consensus on the best value of mBC (or if there is one fixed value), and different studies use different values – often with little explanation as to why a particular value has been chosen. Bulk measurements of visible absorption suggest values in the range specified by Bond and Bergstrom (2006), and these values are also used in some climate models (e.g. Conley et al., 2012). The aim of our study is to investigate the performance of different models within the framework of how they are currently implemented or could be implemented in the future, rather than to use our results to determine the best value of mBC. As these particles are unlikely to be perfectly spherical, any Mie model of their optical properties is an approximation, so it is feasible that absorption and scattering could vary from model predictions in different ways at different wavelengths.
For each of the three measurement wavelengths, Figs. 6 and 7 show the average values of MAC and AAE for 71 straight and level runs measured during CLARIFY-2017 at altitudes between 50 and 5700 m, calculated using the various aforementioned optical models, alongside the average of the ambient observations. The use of straight and level runs allows us to have longer averaging times (typically 5–15 min), minimising statistical uncertainties and negating any possible data misalignments due to different length sample lines. The x axes in Fig. 6 are kBC, the imaginary component of mBC, but it is important to recognise that the real part of the refractive index was varied simultaneously according to Table S1. Run-to-run variability in the modelled and measured values was of the order a few percent, so comparing the campaign average values is appropriate here.
Modelled MAC values varied significantly between models as well as different assumed mBC. The grey-sphere models (the dashed lines in Figs. 6 and 7) universally produced MAC values that were higher than the measured values, other than for the smallest values of mBC at the blue wavelength. At the green and red wavelengths the modelled MAC was around 20 % higher than the measurements for the smallest values of mBC, and it was up to 100 % higher for the largest values of mBC.

Figure 7Similar to Fig. 6 but showing the AAE from different optical models and parameterisations compared to CLARIFY-2017 measurements. Panels (a) and (c) show the AAE between the 405 and 514 nm wavelength pair, and panels (b) and (d) show the AAE between the 514 and 655 nm wavelength pair. The error bars are the Monte Carlo errors described in Sect. S4 and are plotted for all data points, although they are too small to see in some cases. Both schemes by Chakrabarty and Heinson (2018) have a fixed AAE of exactly 1; thus, they are listed and plotted together and have no error bars.
Meanwhile, at the blue wavelength, the grey-sphere models overestimated the MAC by 7 %–60 % (dependent on the mBC), although this overestimation increased to values in the range of 18 %–77 % once the effect of BrC had been removed from the MAC estimation. The AAE514−655 values from the grey-sphere models agreed well with the measurements for the lowest values of mBC, but they were too low for the highest values. AAE405−514 was well below unity for all values of mBC for all of the grey-sphere models, and the values produced were outside the range expected for BC even in the absence of BrC (i.e. close to 1).
The core–shell Mie model (green lines in Figs. 6 and 7) consistently underestimated the MAC at the blue wavelength, but it was within the uncertainty of the measurements at the green and red wavelengths for most values of mBC. The blue MAC value was 16 %–36 % lower than the measured values depending on the value of mBC, whereas the green MAC value ranged from 21 % below to 13 % above the measurements, and the red MAC value ranged from 16 % below to 29 % above the measurements. When the calculated BrC absorption was subtracted, the core–shell Mie values for the blue MAC were still up to 29 % lower than the measurements. For most values of mBC, the core–shell Mie model calculations were within the experimental uncertainty of the measured MAC at green and red wavelengths.
The wavelength dependence of the relationship between the core–shell model MACs and the measured values manifests as low AAE values, as shown in Fig. 7. The underprediction of the MAC at short wavelengths in the core–shell model is explained in Sect. S5 in the Supplement. In short, the underprediction by core–shell Mie theory arises because the mixing state and morphology of the measured aerosol is different to that assumed in the derivation of Mie theory. In the Mie and core–shell Mie models, the skin-depth effect prevents light from interacting fully with all the light absorbing BC, as the surface of the sphere absorbs and scatters light and shields the centre, which is then less effective at absorption (Wang et al., 2015). The reality is that the BC is likely a nonspherical aggregate with a high surface-to-volume ratio, and this high surface area relative to the total BC mass allows light to interact fully with the BC component; thus, the skin-depth effect is negligible. Therefore, the skin-depth effect causes Mie models to underpredict the light absorption properties for the BC aerosols under investigation here. See Fig. 4d vs. 4f in Chakrabarty and Heinson (2018) for the model calculations that demonstrate this interplay between shielding and the fractal surface-to-volume ratio.
To explicitly demonstrate the effect of the skin-depth shielding, we calculated the MAC based on the EAbs from the core–shell Mie model multiplied by the baseline BC MAC from Bond and Bergstrom (2006), and we termed this calculation CS-EAbs. Here, EAbs refers to the ratio of the coated MAC to the uncoated MAC within the Mie model, rather than EAbs-MAC which is the ratio of coated MAC to the Bond and Bergstrom (2006) values. In contrast to the core–shell Mie model results, the use of CS-EAbs gave MAC values that agreed with the measurements within 18 % at all wavelengths and mBC values, which was within the experimental uncertainties, irrespective of whether the calculated BrC absorption had been subtracted. The MAC from CS-EAbs was dependent on mBC, but the range of mBC tested in Fig. 6 gave only up to 15 % variation in the MAC, which was much less sensitive than the other Mie models. The AAE values using CS-EAbs were 0.91–0.97, with a very weak dependence on mBC. This range agrees well with the aircraft measurements of AAE514−655, but it was well below the measurements of AAE405−514 – as expected as the effect of BrC is not accounted for in the model.
The parameterisations shown in Fig. 6d–f were generally more successful than the pure Mie models, and the Chak-EAbs, Chak-MAC, and Liu-EAbs∕Sca schemes all gave results within the uncertainty range of the measured MAC. The Chak-MAC parameterisation values of MAC agreed within 6 % with the measurements at all wavelengths; Chak-EAbs predicted MAC values that were 18 %–21 % larger than the measured values when the calculated BrC absorption was removed at 405 nm, whereas the predicted values were 9 %–18 % larger if BrC absorption was not removed. The results from Liu-EAbs∕Sca agreed within 2 % at all wavelengths when the calculated BrC absorption was removed, whereas they agreed with 9 % if BrC absorption was not removed. The MAC calculations using the Wu-EAbs scheme were around 25 % below the measurements at all wavelengths, and there was only a small overlap in the uncertainty ranges between the model and measured values. In terms of the AAE, the Liu-EAbs∕Sca and Wu-EAbs parameterisations produced values that were in excellent agreement with the measured AAE514−655, and the Chak-MAC and Chak-EAbs schemes both have AAE fixed at exactly 1, which was also close to the measured value. All parameterisations underestimated AAE405−514 by some margin, which is expected as they are strictly applicable to black carbon aerosols only and do not account for absorption by BrC.
4.3 Model estimations of the BrC absorption fraction at 405 nm
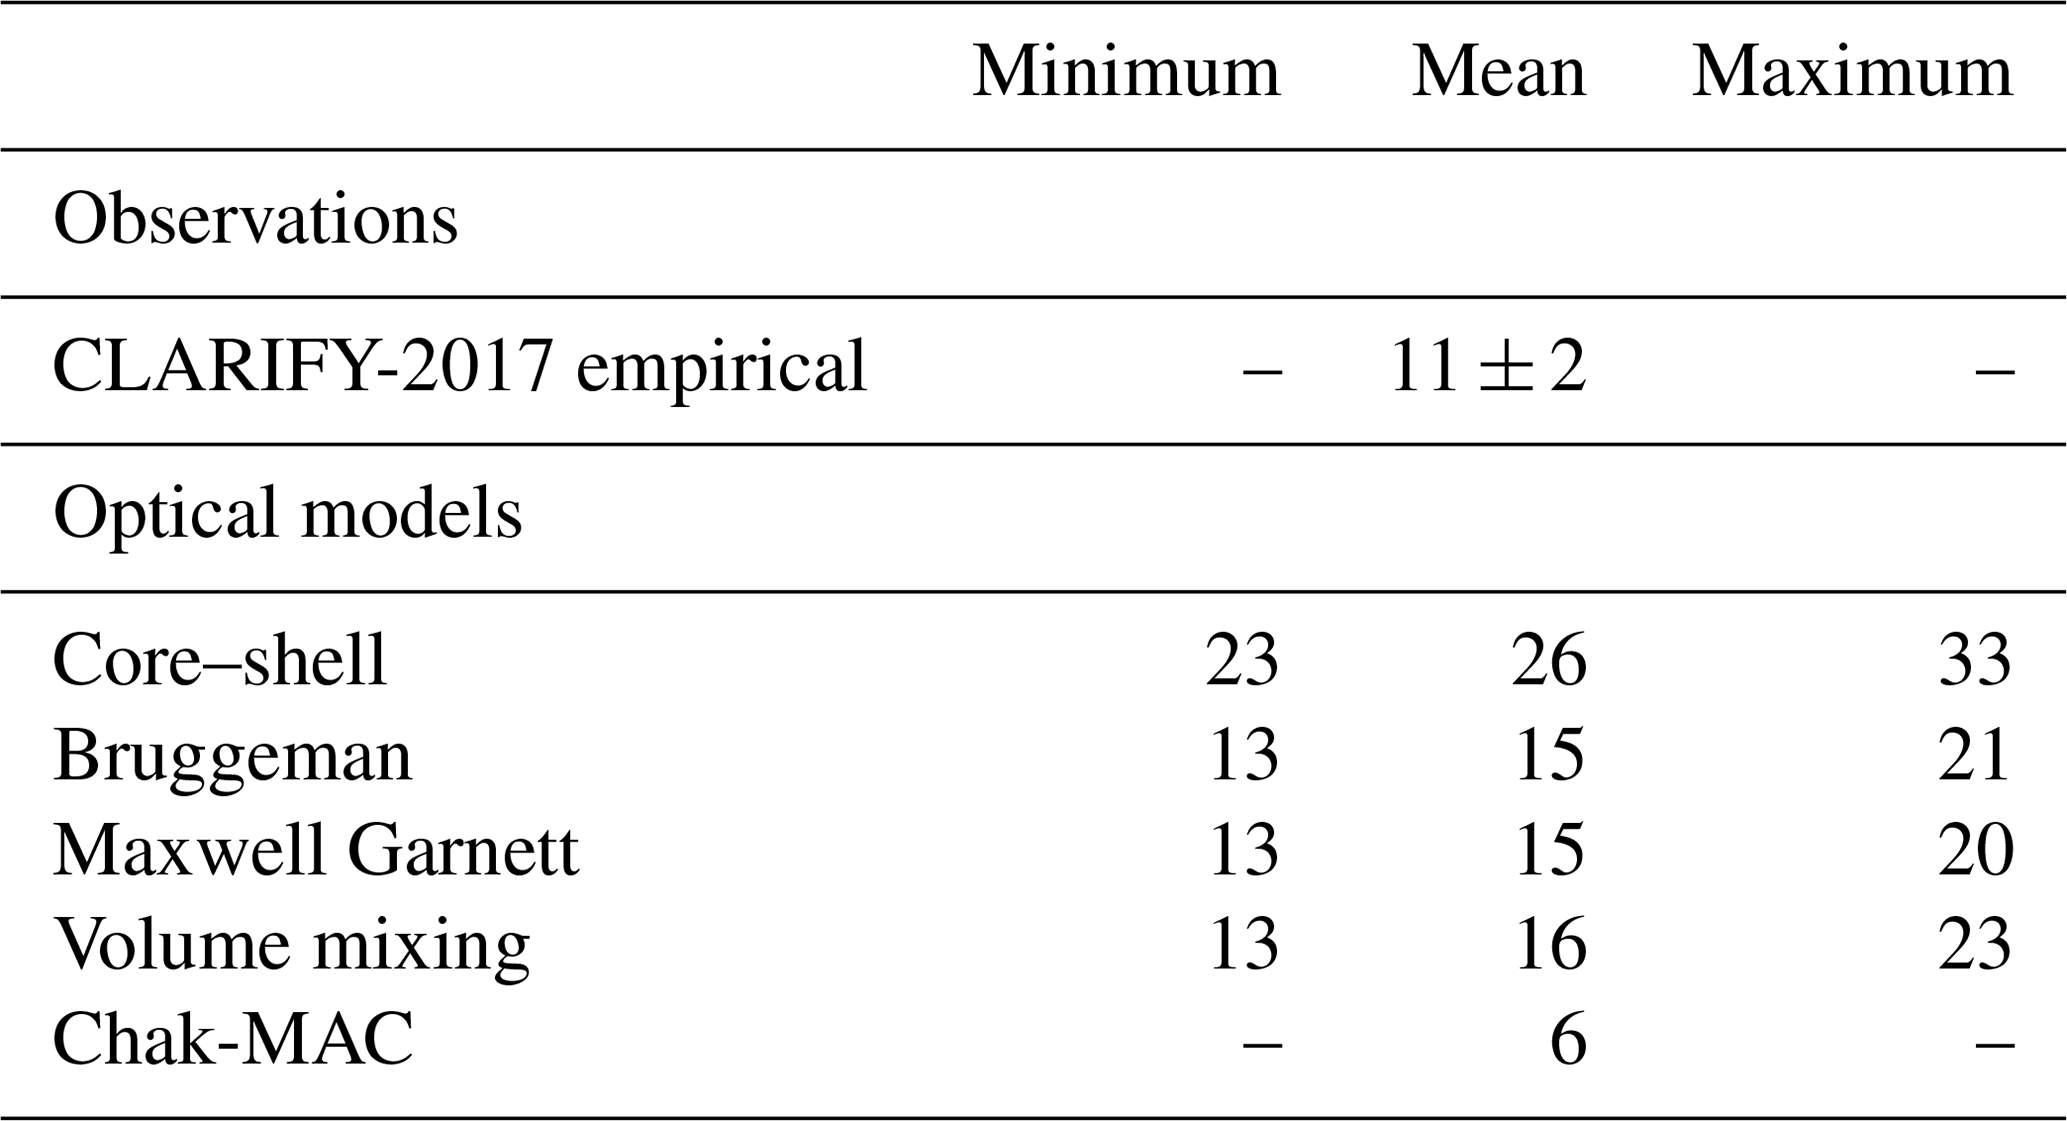
In the calculations shown in Sect. 3 and Fig. 4, we presented an estimate of the fraction of the absorption at 405 nm that was due to the presence of BrC, not BC. This estimate relied on the assumption that the AAE of BC was invariant with wavelength within the visible spectrum. Mie models predict that the AAE of BC is highly dependent on the size of the particles (Lack and Cappa, 2010). When considering a polydisperse BC size distribution, much of this variability will average out; however, we conducted some additional calculations to test the robustness of our empirical estimate. The MAC of BC at 405 nm was recalculated by extrapolating the measured MAC at 655 nm, using the AAE provided by the optical models described earlier in this section, with the full 2-D mixing state of the BC-containing particles. These AAE values are the ones previously presented in Fig. 7. By using only the models' wavelength dependence of absorption, this approach accounts for the over- or underprediction of the MAC of BC at the longer wavelengths, which would otherwise have a large effect on the calculated BrC absorption fraction. As in Fig. 4, any absorption in excess of this extrapolation is ascribed to BrC. The results of these calculations are shown in Table 2. The model results were broadly consistent with our empirical calculation in that they showed that the large majority of absorption was due to BC at this short wavelength. The model-to-model variability was large and was similar in size to the calculated BrC absorption fraction.
Table 2BrC absorption fraction at 405 nm (expressed as a percentage) calculated empirically or using the AAE from optical models. The minimum, mean, and maximum refer to the range of results from using the different mBC values.
5.1 Physical and optical properties of highly aged biomass burning soot
The main focus of this paper has been the measurement of the physical and optical properties of black carbon in heavily aged biomass burning plumes, as well as a comparison of the ability of different optical schemes to utilise these physical properties to predict the optical properties. One of the key questions in the field of aerosol absorption is the relative importance of black and brown carbon. This is particularly important in biomass burning plumes, where BrC is thought to have a strong effect near the source that diminishes with age (Forrister et al., 2015).
Our measurements have shown that the AAE405−655 values in smoke plumes over the southeast Atlantic were always close to 1 (with a mean AAE405−655 of 1.13), which was consistent between our airborne measurements in 2017 and ground-based measurements taken on Ascension Island the previous year over a similar wavelength range (Zuidema et al., 2018). Previous measurements of savannah fires in southern Africa showed AAE values across the whole visible wavelength range of ≈1.8 in relatively fresh plumes, but this was reduced to 1.2 in regional haze layers (Kirchstetter et al., 2004). Our measurements are consistent with this picture of aged haze having a reduced BrC contribution compared with freshly emitted aerosol. Other recent studies have also shown AAE values close to 1 in African biomass burning smoke that had been aged for several days (Zuidema et al., 2018; Denjean et al., 2020). These optical properties are also in a similar range to measurements by Saturno et al. (2018), who measured smoke from southern Africa once it had reached Amazonia after a 10 d transport period. Their measurements found average AAE values of ≈0.9, and a MAC of 12.3 m2 g−1 at 637 nm, equivalent to an EAbs-MAC of 1.9. One of the key features of these African smoke plumes is their long lifetime. After several days ageing in the tropical sun, visible absorption by BrC is dwarfed by absorption by BC.
From a modelling perspective, the BC number fraction is important as it has a large impact on the amount of material assumed to be internally mixed with BC. For example, in the modal aerosol scheme described by Bellouin et al. (2013), as smoke ages it moves almost entirely into what they refer to as a “soluble accumulation mode”. Consequently, not only do ∼100 % of particles contain BC, but all non-BC accumulation-mode aerosol is internally mixed with that BC, and this has an important impact on optical properties (Matsui et al., 2018). The exact values for the BC number fraction are difficult to determine due to the different detection limits of the various probes; however, the values here (∼40 % from SP2 and PCASP and ∼55 % from the SP2 alone) are high compared with our previous measurements of 10 % from the SP2 alone in boreal smoke plumes (Taylor et al., 2014), but they are less than measurements from fresh diesel emissions or flaming plumes which reach 100 %. It is important to note that the majority of particles by number contain little to no BC in these aged plumes, and it is essential to ensure that this is replicated in any mixing state scheme used in climate models. The fraction of BC-containing particles is variable in different environments and this is important for calculating the optical properties. However, this number is not widely reported in the literature as it is operationally defined by the measurements and varies from experiment to experiment. In the future, we recommend that effort is given to constraining this number in a range of different environments.
The BC particles measured during CLARIFY-2017 were universally thickly coated, with median MR values in the range from 8 to 12. The concept of “coatings”, and the use of optical techniques to measure them, is not always appropriate to describe the internal mixing of BC with other material. Recent evidence from laboratory studies and multiple field campaigns (Liu et al., 2017; Pei et al., 2018) has shown that internal mixing with non-BC material takes the form of filling in voids between the soot spherules for low values of MR, and the process of encapsulation only begins for higher values of MR once the voids have already been filled. Liu et al. (2017) determined that the threshold value of MR, above which particles begin to behave optically in a way that resembles the core–shell model (in terms of EAbs and ESca), is around 3. Our median MR values were within the range where Liu et al. (2017) showed that particles behave like core–shell calculations in terms of light scattering at a wavelength of 1064 nm. Therefore, the concept of BC coatings does seem to be appropriate for particles with MR values this high, although it does not necessarily mean that the core–shell Mie model is capable of accurately predicting any or all aspects of optical properties at visible wavelengths. These values of MR, and equivalent shell ∕ core ratios, are higher than most measurements of fossil fuel BC (summarised by Pan et al., 2017), but they are similar to some previous measurements of aged biomass and solid fuel burning emissions (e.g. Liu et al., 2014; Taylor et al., 2014) as well as aged pollution in several different regions of China (Gong et al., 2016; Xu et al., 2018; Zhao et al., 2020), and they fall short of the shell ∕ core ratios >3 reported in the stratosphere by Ditas et al. (2018).
Xu et al. (2018) provide a useful summary of previous measurements of EAbs, based on the MAC comparison method used here, thermodenuder comparisons, and an aerosol filtration–dissolution method. Measurements towards the green–red end of the visible spectrum (where BrC has minimal absorption) seem to show a dichotomy between environments where coatings on BC cause a considerable lensing effect and those where either the BC is largely externally mixed or the limited internal mixing does not cause a significant lensing effect. Ambient measurements with a strong lensing effect (i.e. with long-wavelength EAbs around 1.5 or greater) tend to be from sites measuring high levels of highly aged pollution (days rather than hours) and particularly from highly polluted environments in Asia; Xu et al. (2018) list several examples from the literature as well as primary measurements of their own, and other more recent studies have also found similar values of EAbs in Beijing (Xie et al., 2019a, b). Our measurements show that highly aged biomass burning soot from southern Africa universally falls into this category, as we found EAbs values of around 1.85 that were invariant with wavelength, indicating that the absorption enhancement is caused by a lensing effect.
One possible alternative to a lensing effect would be that the MAC of BC itself is this high. However, these values of MAC are well in excess of the range of MAC for externally mixed BC reported in the literature (Bond and Bergstrom, 2006), so this explanation is not plausible. Another possibility is that the absorption is significantly affected by particles that are essentially dark brown spherical balls which may be closely related to tar balls – so-called “intermediate absorbers” (IAs) described by Adler et al. (2019). By comparing untreated and thermodenuded absorption measurements, the authors demonstrated laboratory measurements of IAs with an AAE of 2.4 between 401 and 661 nm, and they argued that the presence of IA particles explains their field measurements of an apparent EAbs of 3 at 661 nm. Let us consider a theoretical external mixture of coated BC with an AAE of 1 and IAs with an AAE of 2.4. If, for example, the EAbs of BC at 655 nm was actually 1.5, and the other 25 % of red absorption came from IAs, this would propagate to 40 % of absorption at 405 nm, and the resultant total AAE405−655 would be 1.45. The apparent blue EAbs-MAC would then be 2.5. Therefore, this situation is not consistent with our observations, as our measured EAbs-MAC was 2.0 at 405 nm, and our measured AAE405−655 from Fig. 4 was 1.13.
It is important to note that all of our measurements took place at dry humidities, and our modelling did not include the effects of aerosol water. Haslett et al. (2019) used a core–shell Mie model to calculate that the condensation of water at relative humidities up to 98 % at the top of an aerosol layer could cause the aerosol optical depth to increase by a factor of over 1.8 in aged plumes measured over southern West Africa. Experimental studies of absorption at these high humidities are rare, although Brem et al. (2012) observed that the absorption of organic matter (OM) generated by wood pyrolysis increased by over a factor of 2 as the RH increased from 32 % to 95 %, whereas scattering only increased by a factor of ∼1.4. However, there was little change in absorption at humidities below 80 %, and both absorption and scattering showed steep rises at RH values greater than 90 %. In our dataset, these humidities were not reached throughout the bulk of the aerosol plume in the atmospheric column, as shown in Fig. 2, but they were sometimes observed under clear-sky conditions near the top of the boundary layer. The effects of high relative humidity on aerosol absorption are poorly constrained, and although we are not able to provide any further constraint from our measurements, we recommend further study on this topic.
5.2 Optical modelling of highly aged biomass burning soot
The Mie models had mixed success in replicating the measured optical properties. The volume mixing scheme produced MAC values that were too high at long wavelengths for all values of mBC. The Bruggeman and Maxwell Garnett mixing schemes produced results that were almost identical and only narrowly fell within the uncertainty of the measurements for the lowest mBC index tested, 1.75−0.63i, and only at 405 nm when the BrC absorption had been subtracted. However, Bond and Bergstrom (2006) demonstrated that using such a low value of mBC externally mixed BC produced a MAC that was too low. For uncoated BC, the skin-depth shielding effect would also become more significant, manifesting as low AAE values. To produce agreement for AAE, mBC would have to be lowered to physically unrealistic values that fall outside the range of previous measurements. For the core–shell Mie model, there were several values of mBC that gave MAC values at the red and green wavelengths that agreed within the measurement uncertainties, but only the highest values of mBC generated MAC values that fell within the measurement uncertainties at 405 nm, even when the BrC absorption had been subtracted. The wavelength dependence of this level of agreement is primarily due to the stronger skin-depth shielding effect at this shorter wavelength. We explore the sensitivity of the MAC to mBC in an illustrative example in Fig. 8, using a representative BC size distribution and coating thickness. In fact, within our illustrative example there are no values of mBC that produce a MAC at all three wavelengths that agree with our observations when used in the core–shell model. Absorption initially increases with mBC, but skin-depth shielding limits the maximum MAC value to a value lower than the measurements at 405 nm. Figure 8 also shows that while higher values of mBC give higher MAC values, up to a point, they also give lower AAE values. For all values of mBC that fall within the region of measurements from the literature, the AAE from core–shell Mie theory was well below the range of measured values in CLARIFY-2017. One way around this could be to use a wavelength-dependent mBC, tuned to give realistic AAE values, but this would still struggle to be able to produce high enough MAC values at 405 nm. For particles of these sizes, there are no values of mBC that can generate agreement with measured MAC and AAE values within the framework of the core–shell Mie model.
The semiempirical parameterisations were generally more successful at replicating both MAC and AAE514−655. These schemes generated AAE514−655 close to 1, as they either have AAE fixed at exactly 1 (Chak-MAC) or they use EAbs multiplied by the MAC from Bond and Bergstrom (2006), which is fixed at exactly 1. As EAbs has no strong wavelength dependence, all parameterisations gave AAE values close to 1, and the Liu-EAbs∕Sca and Wu-EAbs schemes gave values just below 1, which agreed with the measured values. All schemes generated AAE405−514 values well below the measured values, primarily because they do not include the effects of BrC in the calculations. Compared with the literature, the values are well within the range typically associated with BC absorption and are outside the range commonly measured for freshly emitted aerosol containing a high level of BrC (e.g. the AAE values of 2.5 measured by Lack and Langridge, 2013).
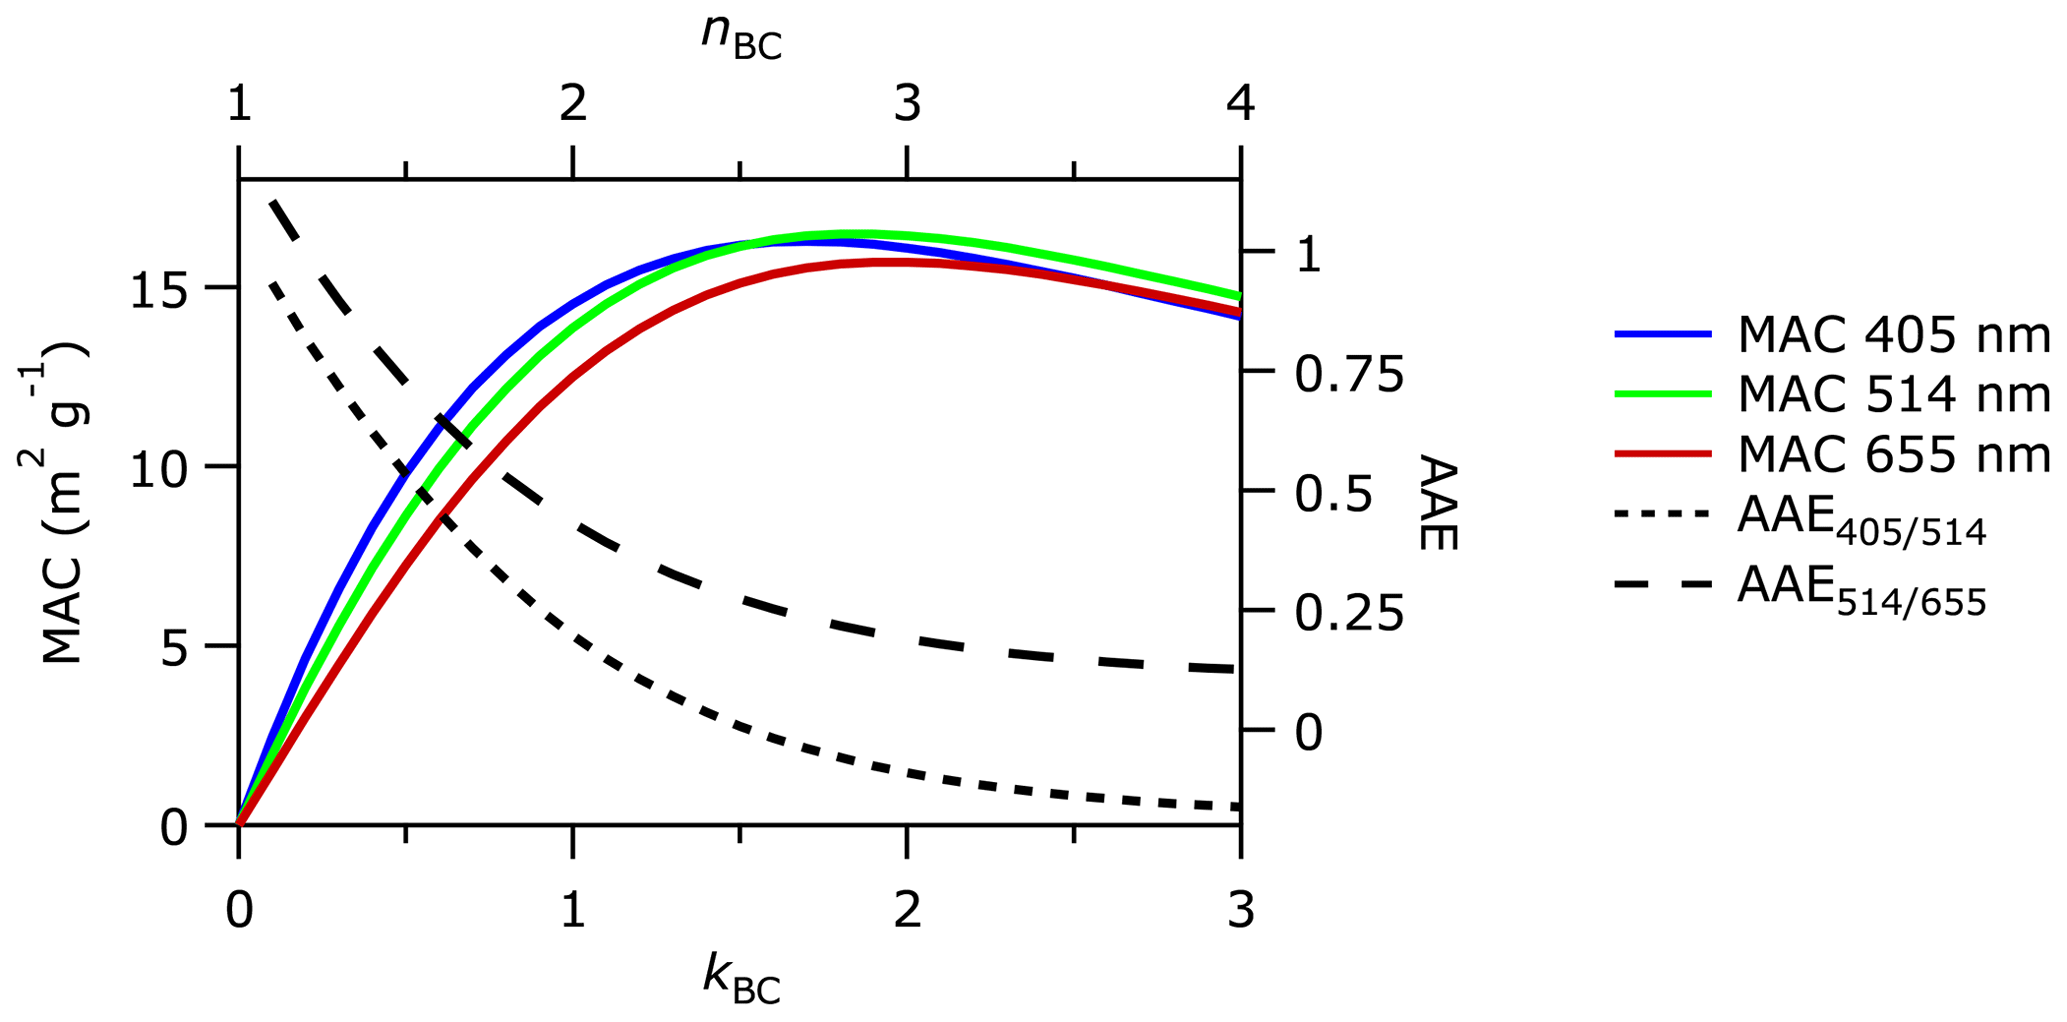
Figure 8MAC and AAE as a function of mBC for typical core–shell particles measured during CLARIFY-2017. The DC distribution was taken from Fig. S3a, and representative shell ∕ core ratios of 2.4 were used. Example mBC values follow the rule of , where nBC and kBC are the real and imaginary components of mBC. A value of 1.5−0i was also used for the shell refractive index.
While we calculated a number for the effective MAC of bulk OA (including BC coatings and particles containing no detectable amount of BC, as a mixture of BrC and non-absorbing OA), we have stopped short of determining a value for the imaginary component of the OA refractive index. The MAC of OA can be calculated purely from the absorption and concentration measurements, whereas the refractive index determination requires detailed optical modelling. The implication of such modelling would be that every data point in Figs. 6 and 7 would give a different number. These numbers could only be accurately used in conjunction with the exact assumed BC optical properties associated with the relevant data point. This argument was made by Liu et al. (2015), and it is still valid in the context of this study. For some of the models, the BrC absorption would have to be negative to agree with the MAC measurements. We would have no confidence in the reliability of any estimates of the imaginary component of OA refractive index generated in this way using this dataset.
In terms of the MAC, all of the parameterisations gave values that agreed within the experimental uncertainties of the measurements, apart from Wu-EAbs. The best agreement was with the Chak-MAC and Liu-EAbs∕Sca schemes, which came within a few percent of the measurements at all three wavelengths. It is not immediately clear why there is a difference between the Chak-EAbs and Wu-EAbs schemes, as they are conceptually similar in the way they were generated. We speculate that it may either be related to some detail of the morphology of the particles used in their simulations or due to some particular details of the optical models or refractive indices used; however, it is beyond the scope of this paper to make in-depth comparisons of simulations from the literature.
The apparent dependence of the EAbs parameterisations in Fig. 6 on the refractive index is potentially misleading. The CS-EAbs points show that EAbs is not strongly dependent on mBC, meaning that this apparent trend is not strongly related to mBC. For values of mBC in the same region of the horizontal axis in Fig. 6, the CS-EAbs and Liu-EAbs∕Sca schemes came out with almost identical MAC values. In this environment, with thick BC coatings and high MR values, these two schemes are essentially the same.
Nevertheless, we urge caution. In low-MR environments such as fossil fuel emissions close to the source, the core–shell model is likely to overestimate EAbs, as it assumes that all non-BC material takes the form of a coating; however, for low MR values, evidence shows that this non-BC material is more likely to fill internal voids in the soot structure (Pei et al., 2018), which causes minimal absorption enhancement. The Liu-EAbs∕Sca scheme is an empirical fit to correct for this overestimation of EAbs, and the work by Chakrabarty and Heinson (2018) also included fits to particles with low MR values; thus, these schemes should give better results than the core–shell model in a low-MR environment.
Given the known inaccuracies in Mie models when calculating the optical properties of atmospheric soot and the success of some of the parameterisations in replicating the absorption properties of highly aged biomass burning aerosol, we recommend future work should investigate how to implement these types of schemes in a climate model. However, the parameterisations we have used remain incomplete for this purpose. A significant fraction, sometimes the majority, of visible light scattering in aged biomass burning plumes comes from particles containing black carbon. The scattering enhancement from coatings on BC-containing particles is an order of magnitude larger than the absorption enhancement, particularly at high humidities (Wu et al., 2018). Liu et al. (2017) considered ESca at 1064 nm, but visible scattering for these size particles is more sensitive to shape than at 1064 nm. Wu et al. (2018) performed scattering calculations at 532 nm but only produced a parameterisation for absorption. The ways in which scattering and absorption deviate from Mie calculations are not necessarily the same, and both should be investigated with equal importance if the end goal is to calculate variables like single scattering albedo for radiative forcing calculations.
We have presented a series of measurements of aerosol optical properties in southern African biomass burning smoke taken over the southeast Atlantic Ocean 4–8 d after emission as well as a detailed investigation of the ability of different optical models to replicate these optical properties. Our dataset and analysis are unique in that they are the first set of measurements using high-quality absorption and black carbon instruments and the most detailed investigation of aerosol optical properties in this type of environment. Our measurements also describe some of the thickest BC coatings, highest absorption enhancements, and most aged smoke plumes ever studied under ambient conditions. Smoke plumes that remain in the free troposphere over the southeast Atlantic have no deposition process, so they have a long lifetime as well as affecting the climate over a vast area thousands of kilometres wide. The high degree of ageing also represents an important real-world test of absorption calculations, which are normally based either on modelled particles or on observations much closer to the source or in the laboratory. Plumes were intercepted in the boundary layer and free troposphere up to altitudes of around 5 km, and the smoke was relatively homogeneous in composition and optical properties. Based on measurements of the wavelength dependence of absorption, we estimate that BrC contributed around 11±2 % of absorption at 405 nm, with an effective OA MAC of 0.31±0.09 m2 g−1, but there was no BrC absorption at 514 and 655 nm. Absorption was dominated by black carbon, and thick coatings caused a wavelength-independent absorption enhancement of a factor of 1.85±0.45 compared with uncoated BC.
Mie models were able to successfully replicate some aspects of BC absorption but failed at others, and absorption in all models was strongly sensitive to the assumed refractive index of the BC. To agree with the measured MAC and AAE values, homogeneous grey-sphere models would be required to use an unrealistically low value of the BC refractive index. The core–shell model produced a MAC in the right range at the green–red end of the visible spectrum, but it was unable to produce high enough values at blue wavelengths for any value of mBC and it underestimated the AAE by a significant margin. Some previous studies have shown that the core–shell model overestimates absorption enhancement for soot particles with lower levels of non-refractory material, where coating is not an accurate description of the mixing state. Instead, our studies on thickly coated particles demonstrate that the core–shell Mie model underestimates the MAC of the underlying BC at short wavelengths, with this underestimation in MAC caused by the optical skin depth of BC preventing light interaction with the total BC mass in a core–shell model that would otherwise occur in the true agglomerate structure of soot. There is no guarantee that the best implementation of a Mie model for our dataset would be the same for different environments, such as urban measurements closer to the source. We recommend that any Mie model be used with caution, if at all, when calculating aerosol absorption.
Two of the four semiempirical absorption parameterisations we tested produced results that agreed with our observations for MAC within a few percent at all wavelengths, and three parameterisations agreed within the experimental uncertainties of the field measurements. Two parameterisations produced AAE values in the range of the aircraft measurements at the green–red end of the visible spectrum, but all parameterisations underestimated the AAE in the blue–green range as they did not include the contribution of BrC. Almost all of the Mie calculations gave values below the range of measured AAE. This work has been unique in testing the validity of these parameterisations for highly aged, thickly coated particles using real-world observations, and we have shown a good level of success for these schemes. Similar parameterisations should be developed for light scattering by internally mixed BC particles, and together these schemes may then be used to improve estimates of the aerosol direct and semi-direct effects.
Airborne measurements are available from the Centre for Environmental Data Analysis (https://catalogue.ceda.ac.uk/uuid/38ab7089781a4560b067dd6c20af3769, Facility for Airborne Atmospheric Measurements et al., 2017).
The supplement related to this article is available online at: https://doi.org/10.5194/acp-20-11201-2020-supplement.
JWT prepared the paper and performed the bulk of the data analysis, with input from all co-authors. JWT, KB, IC, MF, PIW, JD, JML, MIC, CF, NWD, JMH, and HC carried out the airborne measurements. JWT, HW, KS, IC, and JML processed the aircraft data. JML, MIC, and HC advised on the data analysis. JMH, JML, and HC are lead PIs and led the funding application and directed the research.
The author declares that there is no conflict of interest.
This article is part of the special issue “New observations and related modelling studies of the aerosol–cloud–climate system in the Southeast Atlantic and southern Africa regions (ACP/AMT inter-journal SI)”. It is not associated with a conference.
We thank everyone involved in the planning and execution of the CLARIFY-2017 project as well as our hosts on Ascension Island. The BAe-146-301 atmospheric research aircraft was flown by Airtask and managed by the Facility for Airborne Atmospheric Measurements (FAAM), which is a joint entity of the Natural Environment Research Council (NERC) and the Met Office. Finally, we thank the editor and three anonymous reviewers.
This research has been supported by the Natural Environment Research Council (grant nos. NE/L013584/1 and NE/L013797/1).
This paper was edited by Joshua Schwarz and reviewed by three anonymous referees.
Adebiyi, A. A. and Zuidema, P.: The role of the southern African easterly jet in modifying the southeast Atlantic aerosol and cloud environments, Q. J. Roy. Meteor. Soc., 142, 1574–1589, https://doi.org/10.1002/qj.2765, 2016. a
Adler, G., Wagner, N. L., Lamb, K. D., Manfred, K. M., Schwarz, J. P., Franchin, A., Middlebrook, A. M., Washenfelder, R. A., Womack, C. C., Yokelson, R. J., and Murphy, D. M.: Evidence in biomass burning smoke for a light-absorbing aerosol with properties intermediate between brown and black carbon, Aerosol Sci. Tech., 53, 976–989, https://doi.org/10.1080/02786826.2019.1617832, 2019. a, b
Akagi, S. K., Craven, J. S., Taylor, J. W., McMeeking, G. R., Yokelson, R. J., Burling, I. R., Urbanski, S. P., Wold, C. E., Seinfeld, J. H., Coe, H., Alvarado, M. J., and Weise, D. R.: Evolution of trace gases and particles emitted by a chaparral fire in California, Atmos. Chem. Phys., 12, 1397–1421, https://doi.org/10.5194/acp-12-1397-2012, 2012. a
Allan, J. D., Delia, A. E., Coe, H., Bower, K. N., Alfarra, M., Jimenez, J. L., Middlebrook, A. M., Drewnick, F., Onasch, T. B., Canagaratna, M. R., Jayne, J. T., and Worsnop, D. R.: A generalised method for the extraction of chemically resolved mass spectra from Aerodyne aerosol mass spectrometer data, J. Aerosol Sci., 35, 909–922, https://doi.org/10.1016/j.jaerosci.2004.02.007, 2004. a
Bellouin, N., Mann, G. W., Woodhouse, M. T., Johnson, C., Carslaw, K. S., and Dalvi, M.: Impact of the modal aerosol scheme GLOMAP-mode on aerosol forcing in the Hadley Centre Global Environmental Model, Atmos. Chem. Phys., 13, 3027–3044, https://doi.org/10.5194/acp-13-3027-2013, 2013. a, b
Bohren, C. F. and Huffman, D. R.: Absorption and scattering of light by small particles, Wiley, New York, 1983. a, b
Bond, T. C. and Bergstrom, R. W.: Light absorption by carbonaceous particles: An investigative review, Aerosol Sci. Tech., 40, 27–67, https://doi.org/10.1080/02786820500421521, 2006. a, b, c, d, e, f, g, h, i, j, k, l, m, n, o, p, q, r
Bond, T. C., Habib, G., and Bergstrom, R. W.: Limitations in the enhancement of visible light absorption due to mixing state, J. Geophys. Res., 111, D20211, https://doi.org/10.1029/2006JD007315, 2006. a, b
Bond, T. C., Doherty, S. J., Fahey, D. W., Forster, P. M., Berntsen, T., DeAngelo, B. J., Flanner, M. G., Ghan, S., Kärcher, B., Koch, D., Kinne, S., Kondo, Y., Quinn, P. K., Sarofim, M. C., Schultz, M. G., Schulz, M., Venkataraman, C., Zhang, H., Zhang, S., Bellouin, N., Guttikunda, S. K., Hopke, P. K., Jacobson, M. Z., Kaiser, J. W., Klimont, Z., Lohmann, U., Schwarz, J. P., Shindell, D., Storelvmo, T., Warren, S. G., and Zender, C. S.: Bounding the role of black carbon in the climate system: A scientific assessment, J. Geophys. Res.-Atmos., 118, 1–173, 2013. a
Brem, B. T., Gonzalez, F. C., Meyers, S. R., Bond, T. C., and Rood, M. J.: Laboratory-measured optical properties of inorganic and organic aerosols at relative humidities up to 95 %, Aerosol Sci. Tech., 46, 178–190, https://doi.org/10.1080/02786826.2011.617794, 2012. a
Browne, E. C., Zhang, X., Franklin, J. P., Ridley, K. J., Kirchstetter, T. W., Wilson, K. R., Cappa, C. D., and Kroll, J. H.: Effect of heterogeneous oxidative aging on light absorption by biomass burning organic aerosol, Aerosol Sci. Tech., 53, 663–674, https://doi.org/10.1080/02786826.2019.1599321, 2019. a
Cappa, C. D., Onasch, T. B., Massoli, P., Worsnop, D. R., Bates, T. S., Cross, E. S., Davidovits, P., Hakala, J., Hayden, K. L., Jobson, B. T., Kolesar, K. R., Lack, D. A., Lerner, B. M., Li, S.-M., Mellon, D., Nuaaman, I., Olfert, J. S., Petäjä, T., Quinn, P. K., Song, C., Subramanian, R., Williams, E. J., and Zaveri, R. A.: Radiative absorption enhancements due to the mixing state of atmospheric black carbon, Science, 337, 1078–1081, https://doi.org/10.1126/science.1223447, 2012. a
Chakrabarty, R. K. and Heinson, W. R.: Scaling Laws for Light Absorption Enhancement Due to Nonrefractory Coating of Atmospheric Black Carbon Aerosol, Phys. Rev. Lett., 121, 218701, https://doi.org/10.1103/PhysRevLett.121.218701, 2018. a, b, c, d, e, f, g
Conley, A. J., Garcia, R., Kinnison, D., Lamarque, J.-F., Marsh, D., M., M., Smith, A. K., Tilmes, S., Vitt, F., and Morrison, H.: Description of the NCAR Community Atmosphere Model (CAM 5.0), NCAR Technical Note, NCAR/TN-48, https://doi.org/10.1515/9783111358611-006, 2012. a
Cross, E. S., Slowik, J. G., Davidovits, P., Allan, J. D., Worsnop, D. R., Jayne, J. T., Lewis, D. K., Canagaratna, M., and Onasch, T. B.: Laboratory and ambient particle density determinations using light scattering in conjunction with aerosol mass spectrometry, Aerosol Sci. Tech., 41, 343–359, https://doi.org/10.1080/02786820701199736, 2007. a
Darbyshire, E., Morgan, W. T., Allan, J. D., Liu, D., Flynn, M. J., Dorsey, J. R., O'Shea, S. J., Lowe, D., Szpek, K., Marenco, F., Johnson, B. T., Bauguitte, S., Haywood, J. M., Brito, J. F., Artaxo, P., Longo, K. M., and Coe, H.: The vertical distribution of biomass burning pollution over tropical South America from aircraft in situ measurements during SAMBBA, Atmos. Chem. Phys., 19, 5771–5790, https://doi.org/10.5194/acp-19-5771-2019, 2019. a
Davies, N. W., Cotterell, M. I., Fox, C., Szpek, K., Haywood, J. M., and Langridge, J. M.: On the accuracy of aerosol photoacoustic spectrometer calibrations using absorption by ozone, Atmos. Meas. Tech., 11, 2313–2324, https://doi.org/10.5194/amt-11-2313-2018, 2018. a, b
Davies, N. W., Fox, C., Szpek, K., Cotterell, M. I., Taylor, J. W., Allan, J. D., Williams, P. I., Trembath, J., Haywood, J. M., and Langridge, J. M.: Evaluating biases in filter-based aerosol absorption measurements using photoacoustic spectroscopy, Atmos. Meas. Tech., 12, 3417–3434, https://doi.org/10.5194/amt-12-3417-2019, 2019. a, b
Denjean, C., Bourrianne, T., Burnet, F., Mallet, M., Maury, N., Colomb, A., Dominutti, P., Brito, J., Dupuy, R., Sellegri, K., Schwarzenboeck, A., Flamant, C., and Knippertz, P.: Overview of aerosol optical properties over southern West Africa from DACCIWA aircraft measurements, Atmos. Chem. Phys., 20, 4735–4756, https://doi.org/10.5194/acp-20-4735-2020, 2020. a
Ditas, J., Ma, N., Zhang, Y., Assmann, D., Neumaier, M., Riede, H., Karu, E., Williams, J., Scharffe, D., Wang, Q., Saturno, J., Schwarz, J. P., Katich, J. M., McMeeking, G. R., Zahn, A., Hermann, M., Brenninkmeijer, C. A., Andreae, M. O., Pöschl, U., Su, H., and Cheng, Y.: Strong impact of wildfires on the abundance and aging of black carbon in the lowermost stratosphere, P. Natl. Acad. Sci. USA, 115, E11595–E11603, https://doi.org/10.1073/pnas.1806868115, 2018. a
Facility for Airborne Atmospheric Measurements, Natural Environment Research Council, and Met Office: CLARIFY: in-situ airborne observations by the FAAM BAE-146 aircraft, Centre for Environmental Data Analysis, date of citation, available at: http://catalogue.ceda.ac.uk/uuid/38ab7089781a4560b067dd6c20af3769 (last access: 26 August 2020), 2017. a
Fierce, L., Onasch, T. B., Cappa, C. D., Mazzoleni, C., China, S., Bhandari, J., Davidovits, P., Al Fischer, D., Helgestad, T., Lambe, A. T., Sedlacek, A. J., Smith, G. D., and Wolff, L.: Radiative absorption enhancements by black carbon controlled by particle-to-particle heterogeneity in composition, P. Natl. Acad. Sci. USA, 117, 5196–5203, https://doi.org/10.1073/pnas.1919723117, 2020.
Forrister, H., Liu, J., Scheuer, E., Dibb, J., Ziemba, L., Thornhill, K. L., Anderson, B., Diskin, G., Perring, A. E., Schwarz, J. P., Campuzano-Jost, P., Day, D. A., Palm, B. B., Jimenez, J. L., Nenes, A., and Weber, R. J.: Evolution of brown carbon in wildfire plumes, Geophys. Res. Lett., 42, 4623–4630, https://doi.org/10.1002/2015GL063897, 2015. a, b, c
Gao, R. S., Schwarz, J. P., Kelly, K. K., Fahey, D. W., Watts, L. A., Thompson, T. L., Spackman, J. R., Slowik, J. G., Cross, E. S., Han, J.-H. H., Davidovits, P., Onasch, T. B., and Worsnop, D. R.: A Novel Method for Estimating Light-Scattering Properties of Soot Aerosols Using a Modified Single-Particle Soot Photometer, Aerosol Sci. Tech., 41, 125–135, https://doi.org/10.1080/02786820601118398, 2007. a
Ghan, S. J. and Zaveri, R. A.: Parameterization of optical properties for hydrated internally mixed aerosol, J. Geophys. Res.-Atmos., 112, D10201, https://doi.org/10.1029/2006JD007927, 2007. a
Gong, X., Zhang, C., Chen, H., Nizkorodov, S. A., Chen, J., and Yang, X.: Size distribution and mixing state of black carbon particles during a heavy air pollution episode in Shanghai, Atmos. Chem. Phys., 16, 5399–5411, https://doi.org/10.5194/acp-16-5399-2016, 2016. a
Gordon, H., Field, P. R., Abel, S. J., Dalvi, M., Grosvenor, D. P., Hill, A. A., Johnson, B. T., Miltenberger, A. K., Yoshioka, M., and Carslaw, K. S.: Large simulated radiative effects of smoke in the south-east Atlantic, Atmos. Chem. Phys., 18, 15261–15289, https://doi.org/10.5194/acp-18-15261-2018, 2018. a
Haslett, S. L., Taylor, J. W., Deetz, K., Vogel, B., Babić, K., Kalthoff, N., Wieser, A., Dione, C., Lohou, F., Brito, J., Dupuy, R., Schwarzenboeck, A., Zieger, P., and Coe, H.: The radiative impact of out-of-cloud aerosol hygroscopic growth during the summer monsoon in southern West Africa, Atmos. Chem. Phys., 19, 1505–1520, https://doi.org/10.5194/acp-19-1505-2019, 2019. a
Haywood, J. M., Abel, S. J., Barrett, P. A., Bellouin, N., Blyth, A., Bower, K. N., Brooks, M., Carslaw, K., Che, H., Coe, H., Cotterell, M. I., Crawford, I., Cui, Z., Davies, N., Dingley, B., Field, P., Formenti, P., Gordon, H., de Graaf, M., Herbert, R., Johnson, B., Jones, A. C., Langridge, J. M., Malavelle, F., Partridge, D. G., Peers, F., Redemann, J., Stier, P., Szpek, K., Taylor, J. W., Watson-Parris, D., Wood, R., Wu, H., and Zuidema, P.: Overview: The CLoud-Aerosol-Radiation Interaction and Forcing: Year-2017 (CLARIFY-2017) measurement campaign, Atmos. Chem. Phys. Discuss., https://doi.org/10.5194/acp-2020-729, in review, 2020. a, b
Healy, R. M., Wang, J. M., Jeong, C. H., Lee, A. K., Willis, M. D., Jaroudi, E., Zimmerman, N., Hilker, N., Murphy, M., Eckhardt, S., Stohl, A., Abbatt, J. P., Wenger, J. C., and Evans, G. J.: Light-absorbing properties of ambient black carbon and brown carbon from fossil fuel and biomass burning sources, J. Geophys. Res., 120, 6619–6633, https://doi.org/10.1002/2015JD023382, 2015. a, b
Holder, A. L., Hagler, G. S., Aurell, J., Hays, M. D., and Gullett, B. K.: Particulate matter and black carbon optical properties and emission factors from prescribed fires in the southeastern United States, J. Geophys. Res., 121, 3465–3483, https://doi.org/10.1002/2015JD024321, 2016. a
Jacobson, M. Z.: Strong radiative heating due to the mixing state of black carbon in atmospheric aerosols, Nature, 409, 695–697, 2001. a
Kirchstetter, T. W., Novakov, T., and Hobbs, P. V.: Evidence that the spectral dependence of light absorption by aerosols is affected by organic carbon, J. Geophys. Res.-Atmos., 109, D21208, https://doi.org/10.1029/2004jd004999, 2004. a
Kondo, Y., Matsui, H., Moteki, N., Sahu, L., Takegawa, N., Kajino, M., Zhao, Y., Cubison, M. J., Jimenez, J. L., Vay, S., Diskin, G. S., Anderson, B., Wisthaler, A., Mikoviny, T., Fuelberg, H. E., Blake, D. R., Huey, G., Weinheimer, A. J., Knapp, D. J., and Brune, W. H.: Emissions of black carbon, organic, and inorganic aerosols from biomass burning in North America and Asia in 2008, J. Geophys. Res., 116, D08204, https://doi.org/10.1029/2010JD015152, 2011. a
Laborde, M., Schnaiter, M., Linke, C., Saathoff, H., Naumann, K.-H., Möhler, O., Berlenz, S., Wagner, U., Taylor, J. W., Liu, D., Flynn, M., Allan, J. D., Coe, H., Heimerl, K., Dahlkötter, F., Weinzierl, B., Wollny, A. G., Zanatta, M., Cozic, J., Laj, P., Hitzenberger, R., Schwarz, J. P., and Gysel, M.: Single Particle Soot Photometer intercomparison at the AIDA chamber, Atmos. Meas. Tech., 5, 3077–3097, https://doi.org/10.5194/amt-5-3077-2012, 2012. a, b, c
Lack, D. A. and Cappa, C. D.: Impact of brown and clear carbon on light absorption enhancement, single scatter albedo and absorption wavelength dependence of black carbon, Atmos. Chem. Phys., 10, 4207–4220, https://doi.org/10.5194/acp-10-4207-2010, 2010. a
Lack, D. A. and Langridge, J. M.: On the attribution of black and brown carbon light absorption using the Ångström exponent, Atmos. Chem. Phys., 13, 10535–10543, https://doi.org/10.5194/acp-13-10535-2013, 2013. a
Lack, D. A., Langridge, J. M., Bahreini, R., Cappa, C. D., Middlebrook, A. M., and Schwarz, J. P.: Brown carbon and internal mixing in biomass burning particles, P. Natl. Acad. Sci. USA, 109, 14802–14807, https://doi.org/10.1073/pnas.1206575109, 2012. a
Lee, H. J., Aiona, P. K., Laskin, A., Laskin, J., and Nizkorodov, S. A.: Effect of solar radiation on the optical properties and molecular composition of laboratory proxies of atmospheric brown carbon, Environ. Scie. Technol., 48, 10217–10226, https://doi.org/10.1021/es502515r, 2014. a
Li, J., Pósfai, M., Hobbs, P. V., and Buseck, P. R.: Individual aerosol particles from biomass burning in southern Africa: 2, Compositions and aging of inorganic particles, J. Geophys. Res.-Atmos., 108, 8484, https://doi.org/10.1029/2002JD002310, 2003. a
Liu, D., Allan, J. D., Young, D. E., Coe, H., Beddows, D., Fleming, Z. L., Flynn, M. J., Gallagher, M. W., Harrison, R. M., Lee, J., Prevot, A. S. H., Taylor, J. W., Yin, J., Williams, P. I., and Zotter, P.: Size distribution, mixing state and source apportionment of black carbon aerosol in London during wintertime, Atmos. Chem. Phys., 14, 10061–10084, https://doi.org/10.5194/acp-14-10061-2014, 2014. a
Liu, D., Taylor, J. W., Young, D. E., Flynn, M. J., Coe, H., and Allan, J. D.: The effect of complex black carbon microphysics on the determination of the optical properties of brown carbon, Geophys. Res. Lett., 42, 613–619, https://doi.org/10.1002/2014GL062443, 2015. a, b
Liu, D., Whitehead, J., Alfarra, M. R., Reyes-Villegas, E., Spracklen, D. V., Reddington, C. L., Kong, S., Williams, P. I., Ting, Y.-C., Haslett, S., Taylor, J. W., Flynn, M. J., Morgan, W. T., McFiggans, G., Coe, H., and Allan, J. D.: Black-carbon absorption enhancement in the atmosphere determined by particle mixing state, Nat. Geosci., 10, 184–188, https://doi.org/10.1038/ngeo2901, 2017. a, b, c, d, e, f, g, h, i, j, k, l, m, n, o, p, q
Liu, L., Mishchenko, M. I., and Patrick Arnott, W.: A study of radiative properties of fractal soot aggregates using the superposition T-matrix method, J. Quant. Spectrosc. Ra., 109, 2656–2663, https://doi.org/10.1016/j.jqsrt.2008.05.001, 2008. a
Liu, P. S., Deng, R., Smith, K. A., Williams, L. R., Jayne, J. T., Canagaratna, M. R., Moore, K., Onasch, T. B., Worsnop, D. R., and Deshler, T.: Transmission efficiency of an aerodynamic focusing lens system: Comparison of model calculations and laboratory measurements for the aerodyne aerosol mass spectrometer, Aerosol Sci. Tech., 41, 721–733, https://doi.org/10.1080/02786820701422278, 2007. a
Lund Myhre, C. E. and Nielsen, C. J.: Optical properties in the UV and visible spectral region of organic acids relevant to tropospheric aerosols, Atmos. Chem. Phys., 4, 1759–1769, https://doi.org/10.5194/acp-4-1759-2004, 2004. a
Markel, V. A.: Introduction to the Maxwell Garnett approximation: tutorial, J. Opt. Soc. Am., 33, 1244, https://doi.org/10.1364/josaa.33.001244, 2016. a, b, c
Matsui, H., Koike, M., Kondo, Y., Moteki, N., Fast, J. D., and Zaveri, R. A.: Development and validation of a black carbon mixing state resolved three-dimensional model: Aging processes and radiative impact, J. Geophys. Res.-Atmos., 118, 2304–2326, https://doi.org/10.1029/2012JD018446, 2013. a
Matsui, H., Hamilton, D. S., and Mahowald, N. M.: Black carbon radiative effects highly sensitive to emitted particle size when resolving mixing-state diversity, Nat. Commun., 9, 3446, https://doi.org/10.1038/s41467-018-05635-1, 2018. a
May, A. A., McMeeking, G. R., Lee, T., Taylor, J. W., Craven, J. S., Burling, I., Sullivan, A. P., Akagi, S., Collett, J. L., Flynn, M., Coe, H., Urbanski, S. P., Seinfeld, J. H., Yokelson, R. J., and Kreidenweis, S. M.: Aerosol emissions from prescribed fires in the United States: A synthesis of laboratory and aircraft measurements, J. Geophys. Res.-Atmos., 119, 11,826–11,849, https://doi.org/10.1002/2014JD021848, 2014. a
McMeeking, G. R., Hamburger, T., Liu, D., Flynn, M., Morgan, W. T., Northway, M., Highwood, E. J., Krejci, R., Allan, J. D., Minikin, A., and Coe, H.: Black carbon measurements in the boundary layer over western and northern Europe, Atmos. Chem. Phys., 10, 9393–9414, https://doi.org/10.5194/acp-10-9393-2010, 2010. a
Mikhailov, E. F., Vlasenko, S. S., Podgorny, I. A., Ramanathan, V., and Corrigan, C. E.: Optical properties of soot-water drop agglomerates: An experimental study, J. Geophys. Res.-Atmos., 111, D07209, https://doi.org/10.1029/2005jd006389, 2006. a
Moteki, N., Kondo, Y., and Nakamura, S.: Method to measure refractive indices of small nonspherical particles: Application to black carbon particles, J. Aerosol Sci., 41, 513–521, https://doi.org/10.1016/j.jaerosci.2010.02.013, 2010. a
Pan, X., Kanaya, Y., Taketani, F., Miyakawa, T., Inomata, S., Komazaki, Y., Tanimoto, H., Wang, Z., Uno, I., and Wang, Z.: Emission characteristics of refractory black carbon aerosols from fresh biomass burning: a perspective from laboratory experiments, Atmos. Chem. Phys., 17, 13001–13016, https://doi.org/10.5194/acp-17-13001-2017, 2017. a
Pei, X., Hallquist, M., Eriksson, A. C., Pagels, J., Donahue, N. M., Mentel, T., Svenningsson, B., Brune, W., and Pathak, R. K.: Morphological transformation of soot: investigation of microphysical processes during the condensation of sulfuric acid and limonene ozonolysis product vapors, Atmos. Chem. Phys., 18, 9845–9860, https://doi.org/10.5194/acp-18-9845-2018, 2018. a, b
Peng, J., Hu, M., Guo, S., Du, Z., Zheng, J., Shang, D., Zamora, M. L., Zeng, L., Shao, M., Wu, Y. S., Zheng, J., Wang, Y., Glen, C. R., Collins, D. R., Molina, M. J., and Zhang, R.: Markedly enhanced absorption and direct radiative forcing of black carbon under polluted urban environments, P. Natl. Acad. Sci. USA, 113, 4266–4271, https://doi.org/10.1073/pnas.1602310113, 2016. a
Sahu, L. K., Kondo, Y., Moteki, N., Takegawa, N., Zhao, Y., Cubison, M. J., Jimenez, J. L., Vay, S., Diskin, G. S., Wisthaler, A., Mikoviny, T., Huey, L. G., Weinheimer, A. J., and Knapp, D. J.: Emission characteristics of black carbon in anthropogenic and biomass burning plumes over California during ARCTAS-CARB 2008, J. Geophys. Res., 117, D16302, https://doi.org/10.1029/2011JD017401, 2012. a
Saturno, J., Holanda, B. A., Pöhlker, C., Ditas, F., Wang, Q., Moran-Zuloaga, D., Brito, J., Carbone, S., Cheng, Y., Chi, X., Ditas, J., Hoffmann, T., Hrabe de Angelis, I., Könemann, T., Lavrič, J. V., Ma, N., Ming, J., Paulsen, H., Pöhlker, M. L., Rizzo, L. V., Schlag, P., Su, H., Walter, D., Wolff, S., Zhang, Y., Artaxo, P., Pöschl, U., and Andreae, M. O.: Black and brown carbon over central Amazonia: long-term aerosol measurements at the ATTO site, Atmos. Chem. Phys., 18, 12817–12843, https://doi.org/10.5194/acp-18-12817-2018, 2018. a
Scarnato, B. V., Vahidinia, S., Richard, D. T., and Kirchstetter, T. W.: Effects of internal mixing and aggregate morphology on optical properties of black carbon using a discrete dipole approximation model, Atmos. Chem. Phys., 13, 5089–5101, https://doi.org/10.5194/acp-13-5089-2013, 2013. a
Schnaiter, M., Linke, C., Mohler, O., Naumann, K.-H., Saathoff, H., Wagner, R., Schurath, U., and Wehner, B.: Absorption amplification of black carbon internally mixed with secondary organic aerosol, J. Geophys. Res., 110, D19204, https://doi.org/10.1029/2005JD006046, 2005. a
Schwarz, J. P., Spackman, J. R., Fahey, D. W., Gao, R. S., Lohmann, U., Stier, P., Watts, L. A., Thomson, D. S., Lack, D. A., Pfister, L., Mahoney, M. J., Baumgardner, D., Wilson, J. C., and Reeves, J. M.: Coatings and their enhancement of black carbon light absorption in the tropical atmosphere, J. Geophys. Res., 113, D03203, https://doi.org/10.1029/2007JD009042, 2008. a
Schwarz, J. P., Spackman, J. R., Gao, R. S., Perring, A. E., Cross, E., Onasch, T. B., Ahern, A., Wrobel, W., Davidovits, P., Olfert, J., Dubey, M. K., Mazzoleni, C., and Fahey, D. W.: The Detection Efficiency of the Single Particle Soot Photometer, Aerosol Sci. Tech., 44, 612–628, https://doi.org/10.1080/02786826.2010.481298, 2010. a
Sedlacek, A. J., Onasch, T. B., Nichman, L., Lewis, E. R., Davidovits, P., Freedman, A., and Williams, L.: Formation of refractory black carbon by SP2-induced charring of organic aerosol, Aerosol Sci. Technol., 52, 1345–1350, https://doi.org/10.1080/02786826.2018.1531107, 2018. a
Taylor, J. W., Allan, J. D., Allen, G., Coe, H., Williams, P. I., Flynn, M. J., Le Breton, M., Muller, J. B. A., Percival, C. J., Oram, D., Forster, G., Lee, J. D., Rickard, A. R., Parrington, M., and Palmer, P. I.: Size-dependent wet removal of black carbon in Canadian biomass burning plumes, Atmos. Chem. Phys., 14, 13755–13771, https://doi.org/10.5194/acp-14-13755-2014, 2014. a, b, c, d, e
Taylor, J. W., Allan, J. D., Liu, D., Flynn, M., Weber, R., Zhang, X., Lefer, B. L., Grossberg, N., Flynn, J., and Coe, H.: Assessment of the sensitivity of core / shell parameters derived using the single-particle soot photometer to density and refractive index, Atmos. Meas. Tech., 8, 1701–1718, https://doi.org/10.5194/amt-8-1701-2015, 2015. a, b, c, d, e, f, g, h, i
Trembath, J., Bart, M., and Brooke, J.: Efficiencies of Modified Rosemount Housings for sampling Aerosol on a Fast Atmospheric Research Aircraft, available at: https://old.faam.ac.uk/index.php/faam-documents/science-instruments/1673-inlet-efficiency/file (last access: 26 August 2020), 2012. a
Wang, G., Chakrabarti, A., and Sorensen, C. M.: Effect of the imaginary part of the refractive index on light scattering by spheres, J. Opt. Soc. Am. A, 32, 1231, https://doi.org/10.1364/josaa.32.001231, 2015. a
Wilcox, E. M.: Stratocumulus cloud thickening beneath layers of absorbing smoke aerosol, Atmos. Chem. Phys., 10, 11769–11777, https://doi.org/10.5194/acp-10-11769-2010, 2010. a
Wu, H., Taylor, J. W., Szpek, K., Langridge, J., Williams, P. I., Flynn, M., Allan, J. D., Abel, S. J., Pitt, J., Cotterell, M. I., Fox, C., Davies, N. W., Haywood, J., and Coe, H.: Vertical variability of the properties of highly aged biomass burning aerosol transported over the southeast Atlantic during CLARIFY-2017, Atmos. Chem. Phys. Discuss., https://doi.org/10.5194/acp-2020-197, in review, 2020. a, b, c, d, e
Wu, Y., Cheng, T., Liu, D., Allan, J. D., Zheng, L., and Chen, H.: Light Absorption Enhancement of Black Carbon Aerosol Constrained by Particle Morphology, Environ. Sci. Technol., 52, 6912–6919, https://doi.org/10.1021/acs.est.8b00636, 2018. a, b, c, d, e
Xie, C., Xu, W., Wang, J., Liu, D., Ge, X., Zhang, Q., Wang, Q., Du, W., Zhao, J., Zhou, W., Li, J., Fu, P., Wang, Z., Worsnop, D., and Sun, Y.: Light absorption enhancement of black carbon in urban Beijing in summer, Atmos. Environ., 213, 499–504, https://doi.org/10.1016/j.atmosenv.2019.06.041, 2019a. a, b
Xie, C., Xu, W., Wang, J., Wang, Q., Liu, D., Tang, G., Chen, P., Du, W., Zhao, J., Zhang, Y., Zhou, W., Han, T., Bian, Q., Li, J., Fu, P., Wang, Z., Ge, X., Allan, J., Coe, H., and Sun, Y.: Vertical characterization of aerosol optical properties and brown carbon in winter in urban Beijing, China, Atmos. Chem. Phys., 19, 165–179, https://doi.org/10.5194/acp-19-165-2019, 2019b. a, b
Xu, X., Zhao, W., Qian, X., Wang, S., Fang, B., Zhang, Q., Zhang, W., Venables, D. S., Chen, W., Huang, Y., Deng, X., Wu, B., Lin, X., Zhao, S., and Tong, Y.: The influence of photochemical aging on light absorption of atmospheric black carbon and aerosol single-scattering albedo, Atmos. Chem. Phys., 18, 16829–16844, https://doi.org/10.5194/acp-18-16829-2018, 2018. a, b, c
Zhang, J. and Zuidema, P.: The diurnal cycle of the smoky marine boundary layer observed during August in the remote southeast Atlantic, Atmos. Chem. Phys., 19, 14493–14516, https://doi.org/10.5194/acp-19-14493-2019, 2019. a
Zhang, X., Kim, H., Parworth, C. L., Young, D. E., Zhang, Q., Metcalf, A. R., and Cappa, C. D.: Optical Properties of Wintertime Aerosols from Residential Wood Burning in Fresno, CA: Results from DISCOVER-AQ 2013, Environ. Sci. Technol., 50, 1681–1690, https://doi.org/10.1021/acs.est.5b04134, 2016. a
Zhao, D., Liu, D., Yu, C., Tian, P., Hu, D., Zhou, W., Ding, S., Hu, K., Sun, Z., Huang, M., Huang, Y., Yang, Y., Wang, F., Sheng, J., Liu, Q., Kong, S., Li, X., He, H., and Ding, D.: Vertical evolution of black carbon characteristics and heating rate during a haze event in Beijing winter, Sci. Total Environ., 709, 136251, https://doi.org/10.1016/j.scitotenv.2019.136251, 2020. a
Zhou, X., Ackerman, A. S., Fridlind, A. M., Wood, R., and Kollias, P.: Impacts of solar-absorbing aerosol layers on the transition of stratocumulus to trade cumulus clouds, Atmos. Chem. Phys., 17, 12725–12742, https://doi.org/10.5194/acp-17-12725-2017, 2017. a
Zuidema, P., Redemann, J., Haywood, J., Wood, R., Piketh, S., Hipondoka, M., and Formenti, P.: Smoke and clouds above the southeast Atlantic: Upcoming field campaigns probe absorbing aerosol's impact on climate, B. Am. Meteorol. Soc., 97, 1131–1135, https://doi.org/10.1175/BAMS-D-15-00082.1, 2016. a
Zuidema, P., Sedlacek, A. J., Flynn, C., Springston, S., Delgadillo, R., Zhang, J., Aiken, A. C., Koontz, A., and Muradyan, P.: The Ascension Island Boundary Layer in the Remote Southeast Atlantic is Often Smoky, Geophys. Res. Lett., 45, 4456–4465, https://doi.org/10.1002/2017GL076926, 2018. a, b, c