the Creative Commons Attribution 4.0 License.
the Creative Commons Attribution 4.0 License.
 | 30 Sep 2020
Elucidating the pollution characteristics of nitrate, sulfate and ammonium in PM2.5 in Chengdu, southwest China, based on 3-year measurements
Liuwei Kong
Miao Feng
Yafei Liu
Yingying Zhang
Chen Zhang
Chenlu Li
Yu Qu
Junling An
Xingang Liu
Qinwen Tan
Nianliang Cheng
Yijun Deng
Ruixiao Zhai
Zheng Wang
Nitrate, sulfate and ammonium (NSA) are the main secondary inorganic aerosols of PM2.5 and play an important role in air pollution. In this study, a 3-year observational experiment was conducted from 1 January 2015 to 31 December 2017, in Chengdu, southwest China. NSA pollution characteristics, chemical conversion generation, emission reduction control sensitivity and pollutant regional transport characteristics were analyzed. NSA are the most important chemical compositions of particles with aerodynamic equivalent diameter ≤2.5 µm in ambient air (PM2.5), and the contribution of nitrate to the accumulation of PM2.5 concentration is greater than that of sulfate and ammonium. NSA also have obvious characteristics of annual, monthly, seasonal, diurnal and weekly variations. Through observation data and model simulation, it was also found that the existence of an aerosol aqueous environment plays an important role in the formation and existence of NSA. Sensitivity analysis between NSA found that controlling and plays an important role in reducing the contribution of NSA to PM2.5, which also implies that the current control of NOx and SO2 is important for improving air pollution. Combined with meteorological conditions and potential source contribution function (PSCF) analysis, local emissions and regional emissions of pollutants are found to have important impacts on Chengdu's atmospheric environment. This research result not only provides an assessment of the current atmospheric emission reduction effect but also provides an important reference for atmospheric pollution control.
- Article
(9278 KB) - Full-text XML
-
Supplement
(16881 KB) - BibTeX
- EndNote


In recent years, with the rapid development of China's domestic economy and acceleration of urbanization, energy consumption and pollutant emissions have also increased, which increases the burden on the atmospheric environment, and severe air pollution has become a focus of social concern (X. G. Liu et al., 2013; An et al., 2019; Fu et al., 2014; Zhao et al., 2017). When air pollution forms, mass concentrations of particles with aerodynamic equivalent diameter ≤2.5 µm in ambient air (PM2.5, also known as fine particles) can reach a higher pollution level, which not only reduces atmospheric visibility but also carries a large number of toxic species into the human lungs, increasing the risks of cardiovascular and cerebrovascular diseases (Chang et al., 2018; Tie et al., 2009; Kong et al., 2019; Zhao et al., 2018; Y. R. Yang et al., 2015). Nitrate, sulfate, ammonium, organic matter and elemental carbon are the main compositions of PM2.5, among which nitrate, sulfate and ammonium (NSA) are the main secondary inorganic aerosols in PM2.5 (Ji et al., 2019; Zheng et al., 2016). NSA mainly originates from the secondary aerosols produced by complex chemical reactions of NOx, SO2 and NH3 from coal combustion, vehicle exhaust emissions and agricultural sources (X. Liu et al., 2013; Wang et al., 2016; Tian et al., 2017).
Because China's current main energy resource is still fossil fuels, which are widely used in industry, for vehicles and residentially, the emission reduction space of NSA is still restricted by a large number of gaseous precursors of NSA (Zhao et al., 2018; Tong et al., 2019). In addition, the chemical conversion of NO2, SO2 and NH3 to form NSA is still very complex, and both homogeneous and heterogeneous reactions involve the chemical conversion of secondary inorganic aerosols, such as photochemical reactions, aqueous phase oxidation environments of aerosols and catalysis of mineral dust (Cheng et al., 2016; Sun et al., 2014; Wang et al., 2016; Ohta and Okita, 1990; He et al., 2014). The formation of sulfate can increase the acidity of aerosols (Sun et al., 2014). In contrast, the presence of NH3 can play a role in neutralization and maintain the acid–base balance of aerosols (Wang et al., 2016). If improper control measures are taken in pollution reduction control, such as further ammonia emission reduction, the acidification of aerosols and environmental problems of acid rain may be aggravated (M. Liu et al., 2019). In addition to the air pollution caused by the local emission of pollutants, the regional transportation of pollutants from the surrounding cities also has an important impact on the urban air quality. Determination of regional transport sources of pollutants, taking regional joint prevention and control measures, and jointly reducing the emissions of pollutants will enable better air control effects, particularly in the Beijing–Tianjin–Hebei region of northern China (L. Chen et al., 2019).
Higher concentrations of NSA in PM2.5 were also found in regions with more serious air pollution in China, such as Beijing–Tianjin–Hebei, the Yangtze River Delta, the Pearl River Delta, the Fenwei Plain and the Chengdu–Chongqing region (An et al., 2019; Li et al., 2017; Y. Liu et al., 2019). In response to this situation, the Chinese government issued an Air Pollution Prevention and Control Action Plan (2013–2017) in 2013 to reduce pollutant emissions and improve air quality (the Sate Council, 2013, last access: 17 June 2020). A large number of treatment measures have been taken regarding coal combustion, motor vehicle emissions and outdated industrial capacities, and by 2017, China's ambient air quality control measures had achieved good results (K. Liu et al., 2019; Z. Chen et al., 2019; Cheng et al., 2019; Li et al., 2019). In Beijing, PM2.5, NO2 and SO2 decreased by 35.2 %, 17.9 % and 69.8 %, respectively, in 2017 compared with 2013 (Beijing Municipal Ecology and Environment Bureau, 2018, last access: 17 June 2020). In Chengdu, PM2.5, NO2 and SO2 decreased by 42.3 %, 15.9 % and 64.5 %, respectively, in 2017 compared with 2013 (Chengdu Municipal Ecology and Environment Bureau, 2018, last access: 17 June 2020). To continue to promote air quality improvement, the Chinese government launched the “Three-Year Action Plan for Winning the Blue Sky Defense Battle” in 2018, which puts forward stricter requirements on how to further promote the implementation of emission reduction plans (the Sate Council, 2018, last access: 17 June 2020). Through long-term observations, a comprehensive analysis of PM2.5 chemical compositions and source characteristics is carried out to verify the current implementation effects of emission reduction, and in-depth analyses of pollution reduction control characteristics are of great significance for the next step in air pollution control. However, these analyses may be affected by the experimental equipment, observation stations and other conditions, and the time span of these atmospheric observations usually includes several pollution processes or lasts for weeks or months. Thus, it is difficult to analyze the long-term variations in characteristics of air pollution through comprehensive observation. In particular, there are few high-time-resolution (1 h) observation experiments carried out with online automatic observation systems (Sun et al., 2013; Tie et al., 2017; Guo et al., 2014). Especially in the Sichuan Basin of southwest China, there are few long-term observational experiments on NSA, which are the main chemical compositions of PM2.5.
The Sichuan Basin is among the most important areas of air pollution in China (Qiao et al., 2019; Gui et al., 2019; Zhong et al., 2019). Although there are many studies in this area, there are few long-term studies of the hourly concentration data resolution of PM2.5 chemical compositions. In this study, through 3 years of observations (from 1 January 2015 to 31 December 2017), we analyzed the pollution characteristics of NSA, as well as their formation mechanism and pollution control sensitivity. Finally, combined with local emissions and regional transport characteristics, we analyzed the air pollution transport characteristics of Chengdu air pollution.
2.1 Observation site

Figure 1Observation site in Chengdu. The image on the top shows the aerosol optical depth (AOD, 550 nm) from 2015 to 2017 (National Aeronautics and Space Administration, 2019, last access: 17 June 2020). The black dot in the image on the bottom shows the location of the observation site in Chengdu (background map from © Google Maps, last access: 17 June 2020).
Comprehensive observations were carried out at the Chengdu comprehensive observation station of atmospheric combined pollution (30.63∘ N, 104.08∘ E). The observation equipment was placed on the top of a building, approximately 25 m from the ground, and there was no obvious pollution source within approximately 200 m. The site is located in south section 1 of Yihuan Road, Wuhou District, Chengdu (Fig. 1), and traffic emission sources may be the main pollution emission source around the observation station. This is a typical residential, traffic and commercial mixed area that represents the characteristics of the urban atmospheric environment. Chengdu is also a megacity in the Sichuan Basin of southwest China, as well as an important part of the Chengdu–Chongqing region, which is among the regions with serious air pollution in China. As shown in Fig. 1, the Sichuan Basin also has high aerosol optical depth (AOD).
2.2 Instruments
Table 1The experimental instruments used in this study.
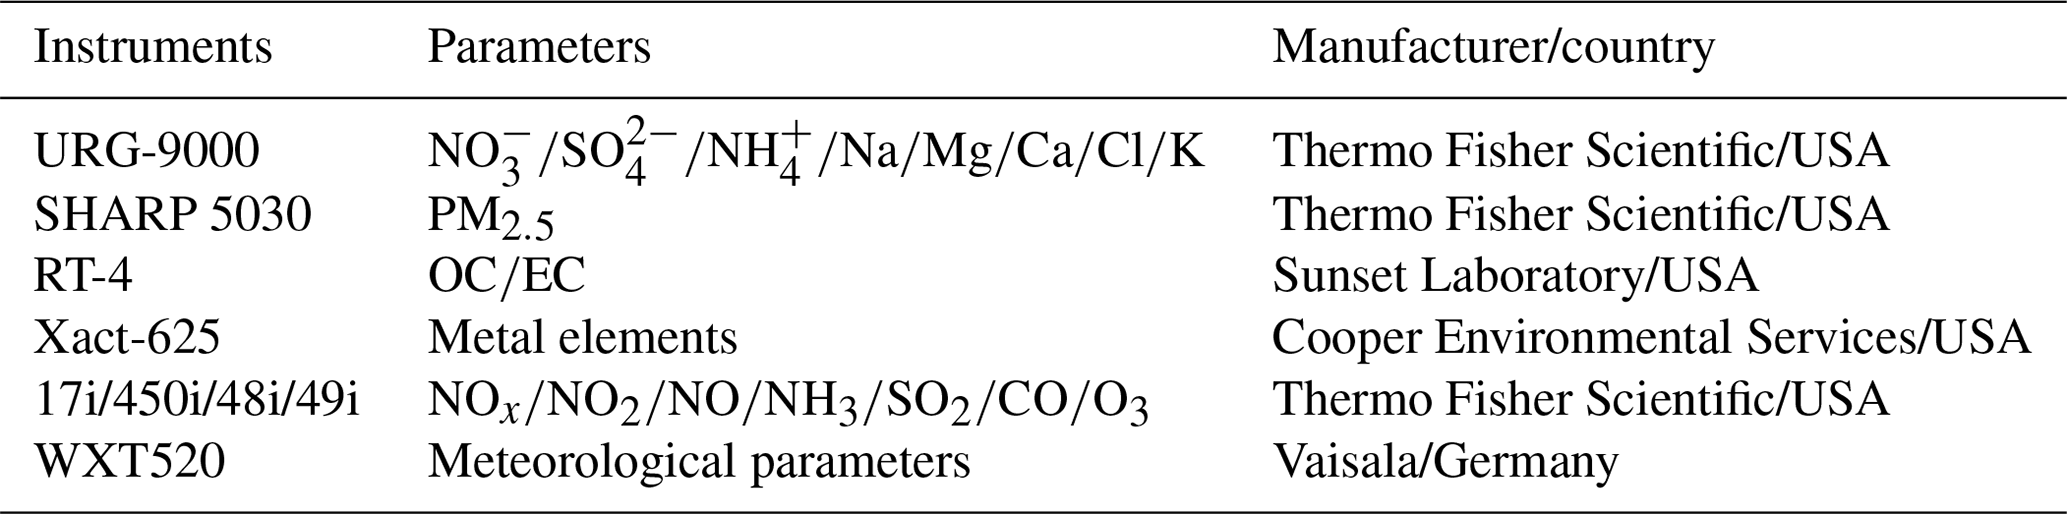
OC: organic carbon; EC: element carbon.
During the research period, online experimental monitoring instruments were used to obtain the observation data with an hourly resolution (1 h). The equipment list is shown in Table 1. Data quality control and assurance are an important part of the atmospheric comprehensive observation experiment, and this result is described in detail in the Supplement (Fig. S1–S4 in the Supplement).
2.3 Chemical conversions and model methods
To clarify the conversion of gaseous pollutants to secondary aerosols, the nitrogen oxidation ratio (NOR) and sulfur oxidation ratio (SOR) were used to reflect the conversions of NO2 and SO2 to and , respectively (Sun et al., 2014; Y. R. Yang et al., 2015). These ratios can be calculated using Eqs. (1) and (2):
where n is the molar concentration.
The ISORROPIA-II thermodynamic model was used to analyze the variation in interaction characteristics among aerosol chemical compositions (Fountoukis and Nenes, 2007; Guo et al., 2017; Ding et al., 2019). Temperature (T), relative humidity (RH) and the concentrations of Na, , NH3, , Cl, Ca, K and Mg were input into the ISORROPIA-II thermodynamic equilibrium model. In this study, we used the “forward problems” mode to run the model, assuming that the aerosols were in a “metastable” state (salts do not precipitate under supersaturated conditions). At the time of data input, NH3 data were the sum of NH3 and . Previous studies had shown that the model has better performance when the RH is greater than 30 %, and some studies also believe that the model performance is greater than 40 %, so this study maintains the RH at higher than 40 % when data are input (Ding et al., 2019; Guo et al., 2016). The simulated data and observed data were compared and analyzed, and the observation data of NH3 were consistent with the input data of the model. The linear regression fitting slope of NH3 was 0.96 (R2=0.98), which showed that the run result of the model had good reliability and performance (Ding et al., 2019). Simultaneously, the aerosol water content (AWC) was calculated, and the sensitivity of the interaction between aerosol chemical compositions (NSA) and the pH of aerosols was analyzed (Ding et al., 2019; Fountoukis et al., 2009). The pH was calculated using Eq. (3):
where (mol L−1) is the concentration of hydronium ions in liquid water of atmospheric particulate matter, which can be calculated by the and AWC (µg m−3) outputs from the ISORROPIA-II thermodynamic equilibrium model (Ding et al., 2019; Guo et al., 2017).
2.4 CPF and PSCF methods
We used the conditional probability function (CPF) to analyze the characteristics of pollutants under the influence of wind direction (WD) and wind speed (WS). The analysis results using CPF were obtained using the R programming language, named openair. This function can be defined as , where mθ,j is the number of samples in the WD interval θ and WS interval j with mixing ratios greater than some “high” pollution concentration, and nθ,j is the total number of samples in the same WD–WS interval (Uria-Tellaetxe and Carslaw, 2014). Usually, a higher given high pollution concentration (percentile) is chosen, such as the 90th percentile, which will mask the lower percentile pollution concentration source contributions. In this work, to obtain a more complete contribution of pollution sources, a range of percentile values, 0–25, 25–50, 50–75 and 75–100, were selected for the CPF calculation.
The potential source contribution function (PSCF) is based on an analysis of pollution sources given the air mass backward trajectory and can be used to judge the long-distance regional transport of pollutants (Ji et al., 2019). In this study, MeteoInfoMap and TrajStat (Wang et al., 2009) were used, and the model simulation data input model was provided by the National Oceanic and Atmospheric Administration (National Oceanic and Atmospheric Administration, 2019, last access: 17 June 2020); these data were calculated to the 24 h backward trajectories at the observation site at a height of 500 m every 1 h from 1 January 2015 to 31 December 2017 (UTC+8). The calculated domain for PSCF was a range of 20–50∘ N, 75–115∘ E, and a grid cell with a resolution of was divided. The PSCF could be defined using Eq. (4):
where PSCFij is the value for the ijth grid cell and Mij is the total number of endpoints in the ijth grid cell, with pollution concentrations at the observation site (30.63∘ N, 104.08∘ E) that are greater than a given threshold value (the 75th percentile was selected for gaseous pollutants). Nij is the number of backward trajectory endpoints in the ijth grid cell () during the simulation period. Therefore, the PSCF reflects the two-dimensional planar position distribution characteristics of potential sources, not the three-dimensional characteristics that reflect the transmission of pollution. To reduce the uncertainty in Nij, the empirical weight function Wij was introduced in Eq. (5), where Nave is the average of Nij during the simulation period (Ji et al., 2019; Zhang et al., 2017; Wang et al., 2009).
3.1 Pollution characteristics of the interannual and entire observation periods
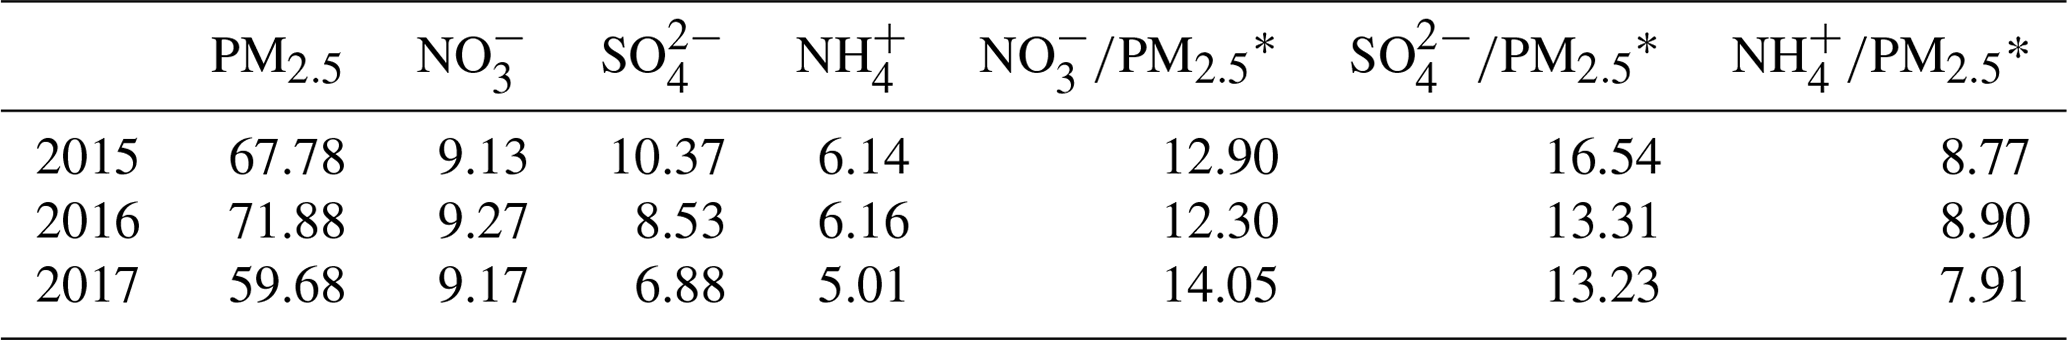
Table 2Comparison of annual mass averages (µg m−3) and proportions (%) for NSA (nitrate, sulfate and ammonium) from 2015 to 2017.
∗ Average of sample proportions.
The annual average mass concentration of NSA and its proportion in PM2.5 are shown in Table 2. The annual averages of PM2.5 were 67.78, 71.88 and 59.68 µg m−3, corresponding to 2015, 2016 and 2017, respectively. However, the pollution of PM2.5 in Chengdu was much higher than the annual secondary guideline value (35 µg m−3, Ambient air quality standards/GB3095-2012) and the World Health Organization annual guideline value (10 µg m−3). The same PM2.5 pollution problem was also a serious problem in Beijing and Nanjing (Ji et al., 2019; Zheng et al., 2019). The annual average mass concentration of NSA also changed significantly, and the difference was large. The Mann–Whitney U test showed that the variation in was nonsignificant (p>0.05), and and had obvious significance from 2015 to 2017 (p<0.05), indicating that had not decreased significantly, and there was an increase in 2017 compared to 2015. continued to decline, and was also lower in 2017 than in 2016. Notably, and decreased significantly in 2017 compared with 2015, but the variation in was nonsignificant. Meanwhile, the annual averages of were 0.95, 1.02 and 1.45 for 2015, 2016 and 2017, respectively, indicating that the contribution of NOx emissions sources to PM2.5 was increased compared with that of SO2 emissions sources (Li et al., 2017; Wang et al., 2015). As shown in Table S1 in the Supplement, from 2013 to 2017, the emissions of NO2 in Chengdu were obviously higher than those of SO2, but PM2.5, NO2 and SO2 all decreased due to the implementation of the Air Pollution Prevention and Control Action Plan launched by the Chinese government and a more detailed pollution control plan launched by Sichuan Province. From 2015 to 2017, the measures taken by Sichuan Province in the coordinated reduction of multiple pollutants have been continuously strengthened, and the scope of management and control has been continuously expanded, for example, in the improvement of desulfurization, denitrification and dust removal technologies in key industries, from accelerated improvement in 2015 to deeper improvement in 2017. The process of eliminating small coal-fired boilers began in 2015 and was completed in 2017, when the ultra-low-emission coal-fired power plant transformation was promoted. In terms of vehicle emission control, we accelerated the elimination of yellow label vehicles (general term for gasoline vehicles with emission levels lower than the national I emission standard and diesel vehicles with emission levels lower than the national III emission standard when new vehicles are finalized) and “old vehicles” (the emission level does not meet the national stage IV emission standard) in 2015 and basically completed the elimination of “yellow label” vehicles in 2017. The quality supervision of oil products has also been improved, and non-road mobile machinery pollution control requirements were proposed in the 2017 plan (The People's Government of Sichuan Province, 2015, 2016, 2017, last access: 17 June 2020). Compared with 2015, NOx and SO2 decreased by 5.98 % and 32.35 %, respectively, in 2017, which shows that the treatment of NOx and SO2 emissions has achieved remarkable results, of which the SO2 emission reduction effect is the best, followed by that of NOx. The effect of this emission reduction is due to air pollution prevention measures, especially measures of “electricity instead of coal” and “natural gas instead of coal” (refers to increased use of electricity and natural gas in the residential sector to reduce coal combustion).
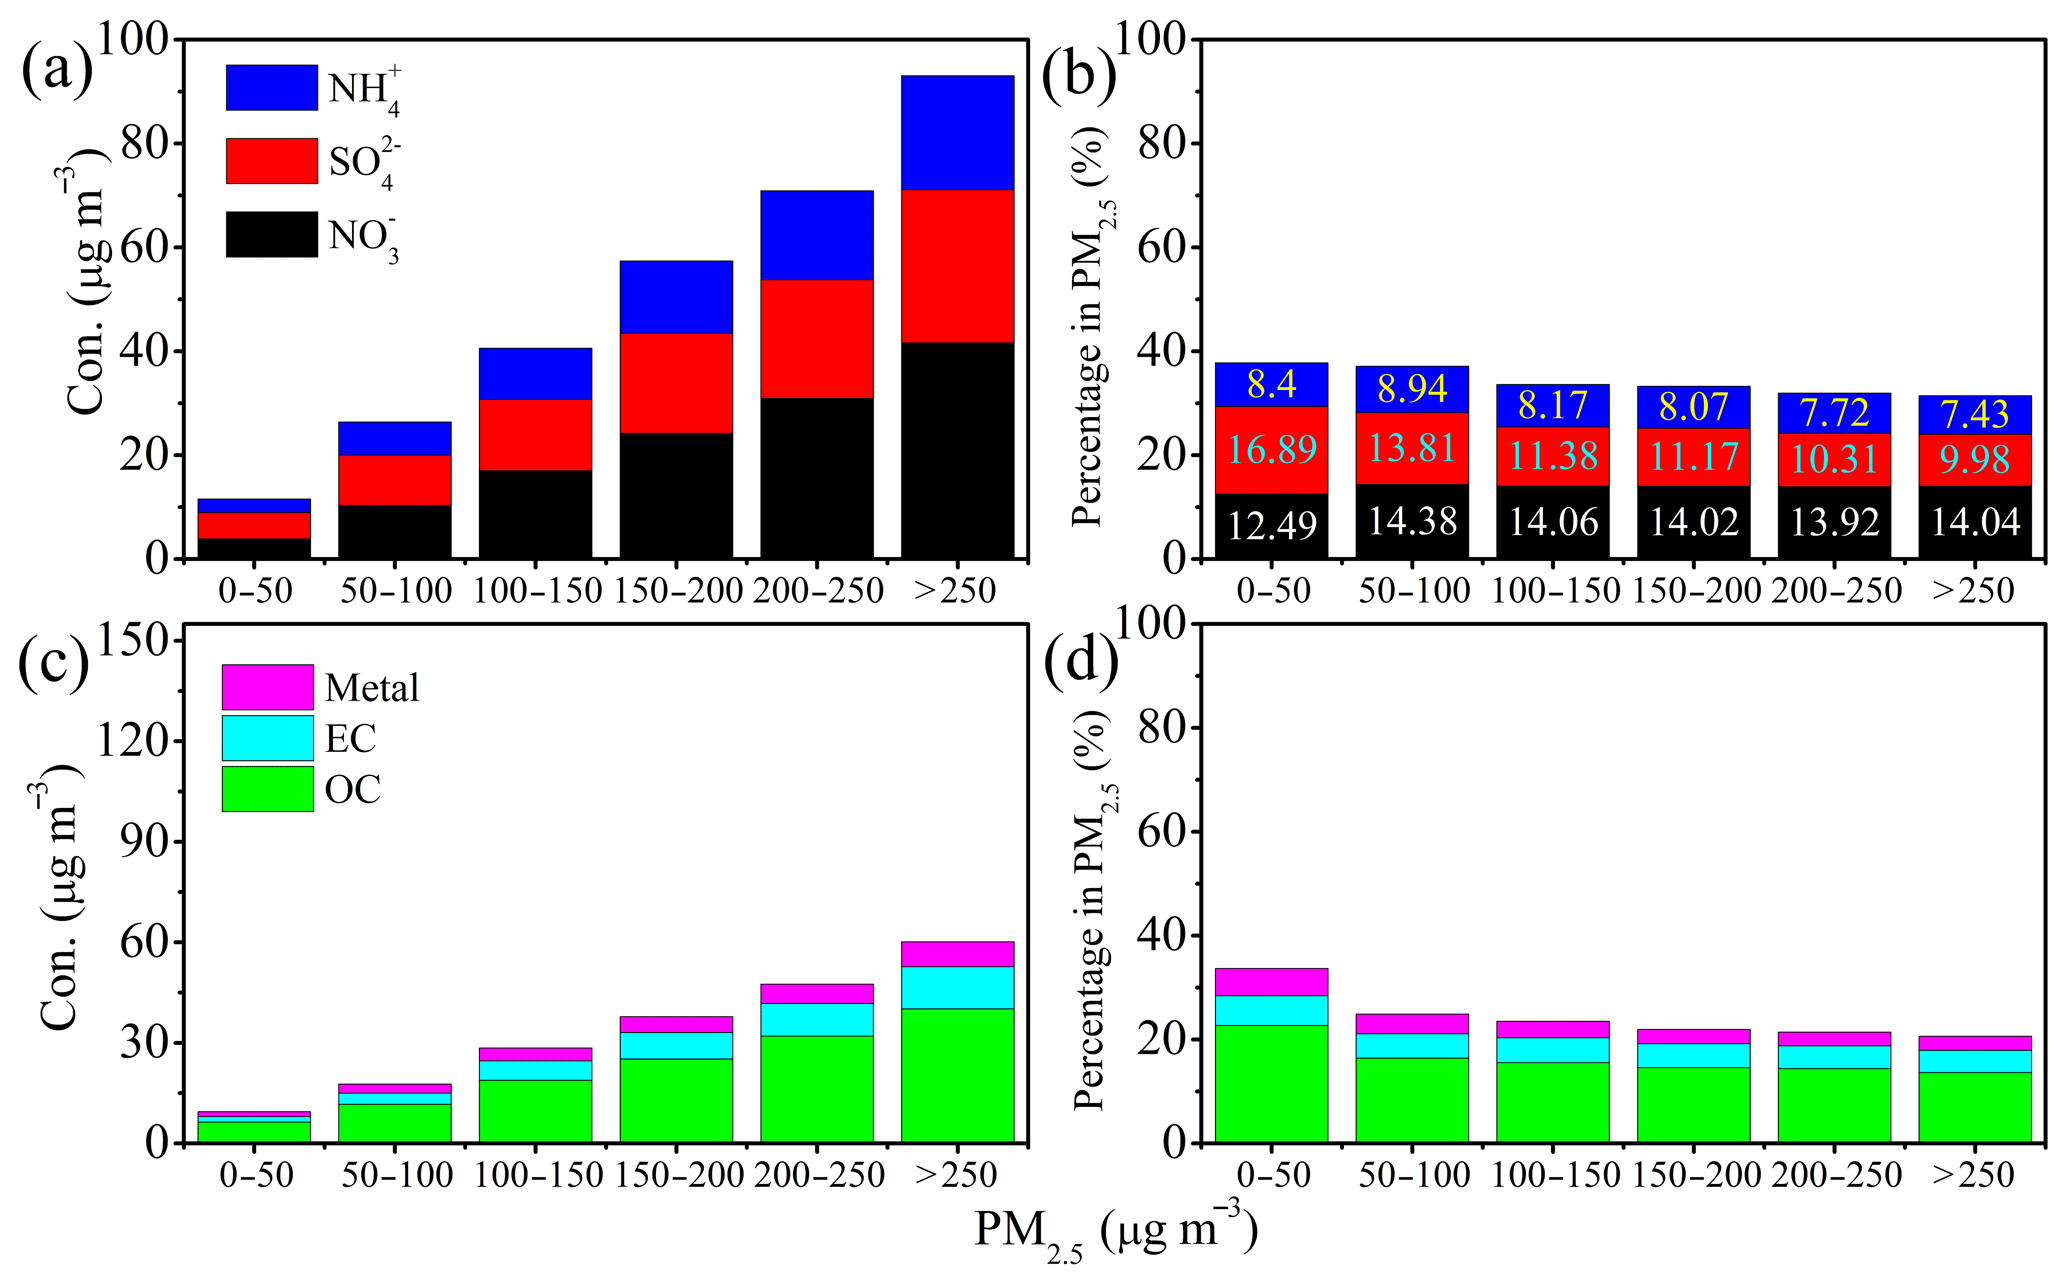
Figure 2Variation characteristics of the NSA (nitrate, sulfate and ammonium) and other chemical compositions with different concentrations of PM2.5. (a) NSA mass concentration. (b) Percentage of NSA in PM2.5. (c) Chemical compositions of organic carbon (OC), elemental carbon (EC) and metal elements. (d) Percentage of OC, EC and metal elements in PM2.5.
The chemical compositions of PM2.5 from 2015 to 2017 vary with concentration, as shown in Fig. 2. With the accumulation of PM2.5 in the atmosphere, the concentration of NSA also increased significantly, but the proportion of NSA in PM2.5 decreased (Fig. 2a and b). The variation trend of OC, EC and metal elements with increasing PM2.5 concentration is similar to that of NSA (Fig. 2c and d), and this variation trend of OC and EC is consistent with the results of long-term observation research carried out in Beijing (Ji et al., 2019). With the accumulation of PM2.5 concentration, NSA, OC, EC and metal element concentrations have an increasing trend, but their ratio with PM2.5 gradually decreases, indicating that other compositions have a higher contribution. This result, on the one hand, may be since some chemical compositions such as ions and dust have not been included in the statistics; on the other hand, the unknown component may also have a high contribution characteristic to PM2.5 (Zhang et al., 2015; Huang et al., 2014). For the contribution characteristics of unknown components of PM2.5, studies in some regions of China show that the contribution of higher PM2.5 concentration is higher than that of lower PM2.5 concentration (Huang et al., 2014; Li et al., 2017; Geng et al., 2019). When PM2.5 was less than 50 µg m−3 and greater than 250 µg m−3, the mass concentrations of NSA were 11.57 and 90.06 µg m−3, respectively, and the proportions were 37.78 % and 31.45 %, respectively. Comparing Fig. 2b and d, it was found that NSA was always the main contributor in the entire process of PM2.5 accumulation, which was significantly higher than the proportions of OC and EC (Ji et al., 2019; K. Liu et al., 2019). In the accumulation process of PM2.5 concentrations greater than 50 µg m−3, accounts for a high proportion in NSA and is stable at approximately 14 %, and the proportion of and continues to decrease (M. Liu et al., 2019; Wang et al., 2016). When the PM2.5 concentration was less than 50 µg m−3, the concentration of was higher than that of , and the concentration of was lower than the concentration of PM2.5 at 50 to 100 µg m−3, possibly due to concentration being higher than the concentration, forming more chemically stable (NH4)2SO4 (Guo et al., 2017). In addition, when the PM2.5 was less than 50 µg m−3, low RH and strong solar radiation were also important ways to generate sulfate (Yao et al., 2018).
3.2 Monthly and seasonal variations

Figure 3Monthly variations in NSA (nitrate, sulfate and ammonium) concentrations from 2015 to 2017. (a) . (b) . (c) .

Figure 4Monthly variations in NOx, SO2 and NH3 concentrations from 2015 to 2017. (a) NOx. (b) SO2. (c) NH3.
The monthly variation characteristics of NSA from 2015 to 2017 are shown in Fig. 3. At the beginning and end of each year, the pollutant concentration is relatively high and relatively low in the middle of each year. The meteorological conditions also have obvious monthly variation characteristics (Fig. S5a, b in the Supplement); from April to August, they have higher WS and lower RH, which is not only conducive to the dilution and diffusion of pollutants but also reduces the chemical conversions of pollutants by aqueous phase and influences the formation of secondary inorganic aerosols (Wang et al., 2016; Ji et al., 2019). Overall, the concentrations are higher in January and December and lower in July and August. The highest monthly average reached 19.98 µg m−3 in January 2017, and the highest monthly average and were 22.08 and 12.66 µg m−3 in January 2015, respectively. The lowest concentrations of NSA appeared in August 2017, which were 1.96, 3.07 and 1.62 µg m−3. The gaseous precursors of NSA also have obvious monthly variations, and the NOx and SO2 trends were similar to those of and (Figs. 3 and 4). NH3 emissions were significantly different, with increases in warmer months (April–July) and colder months (September–December). On the one hand, NH3 volatilization was promoted by relatively high Ts (Fig. S5c); on the other hand, the use of agricultural fertilizers and livestock farming were also important sources of NH3 in China. Second, from urban regions, fossil fuel combustion and motor vehicle emissions also contribute significantly (X. Liu et al., 2013; Pan et al., 2016). Notably, NH3 increased significantly from April to December 2017 compared with 2015 and 2016, especially during low-T months (Fig. 4c). The results of an analysis of the monthly concentration variation in pollutants indicate that the implementation of pollution reduction and control measures should be strengthened at the beginning of each year (January to March) and the end of the year (October to December).
The seasonal variation in NSA is shown in Fig. S6 in the Supplement, and the concentration in winter was much higher than that in summer. only declined in spring and summer from 2015 to 2017, with an increase in autumn and winter (Fig. S6a). Seasonal variations in were similar to those of , with higher concentrations in winter and the lowest in summer (Fig. S6c). This may be because higher Ts and WSs can not only promote the decomposition of NH4NO3 in summer but also promote the dilution and diffusion of pollutant concentrations (Guo et al., 2017; An et al., 2019). There is a significant downward trend in , which continues to decrease in spring, summer and winter from 2015 to 2017 (Fig. S6b). In autumn, the concentration was the highest in 2016, and it was significantly lower in 2017 than in 2015 and 2016. The variation amplitude of NSA and gaseous pollutants in cold months was significantly higher than that in warm months (Figs. 3, 4 and S6). This higher variation amplitude may be due to the differences in pollutant accumulation and scavenging processes. This finding also indicates that the instability of local pollutant emissions and regional transport during cold months was affected by meteorological conditions (Li et al., 2017; Ji et al., 2018). The large variation amplitude of pollutants in different months, similar to the changes in the Beijing–Tianjin–Hebei region of northern China and Chengdu, is due to the accumulation and removal of pollution by meteorological conditions and pollutant emissions (Ji et al., 2019; Qin et al., 2019; H. Zhang et al., 2019).
3.3 Diurnal and weekly variations
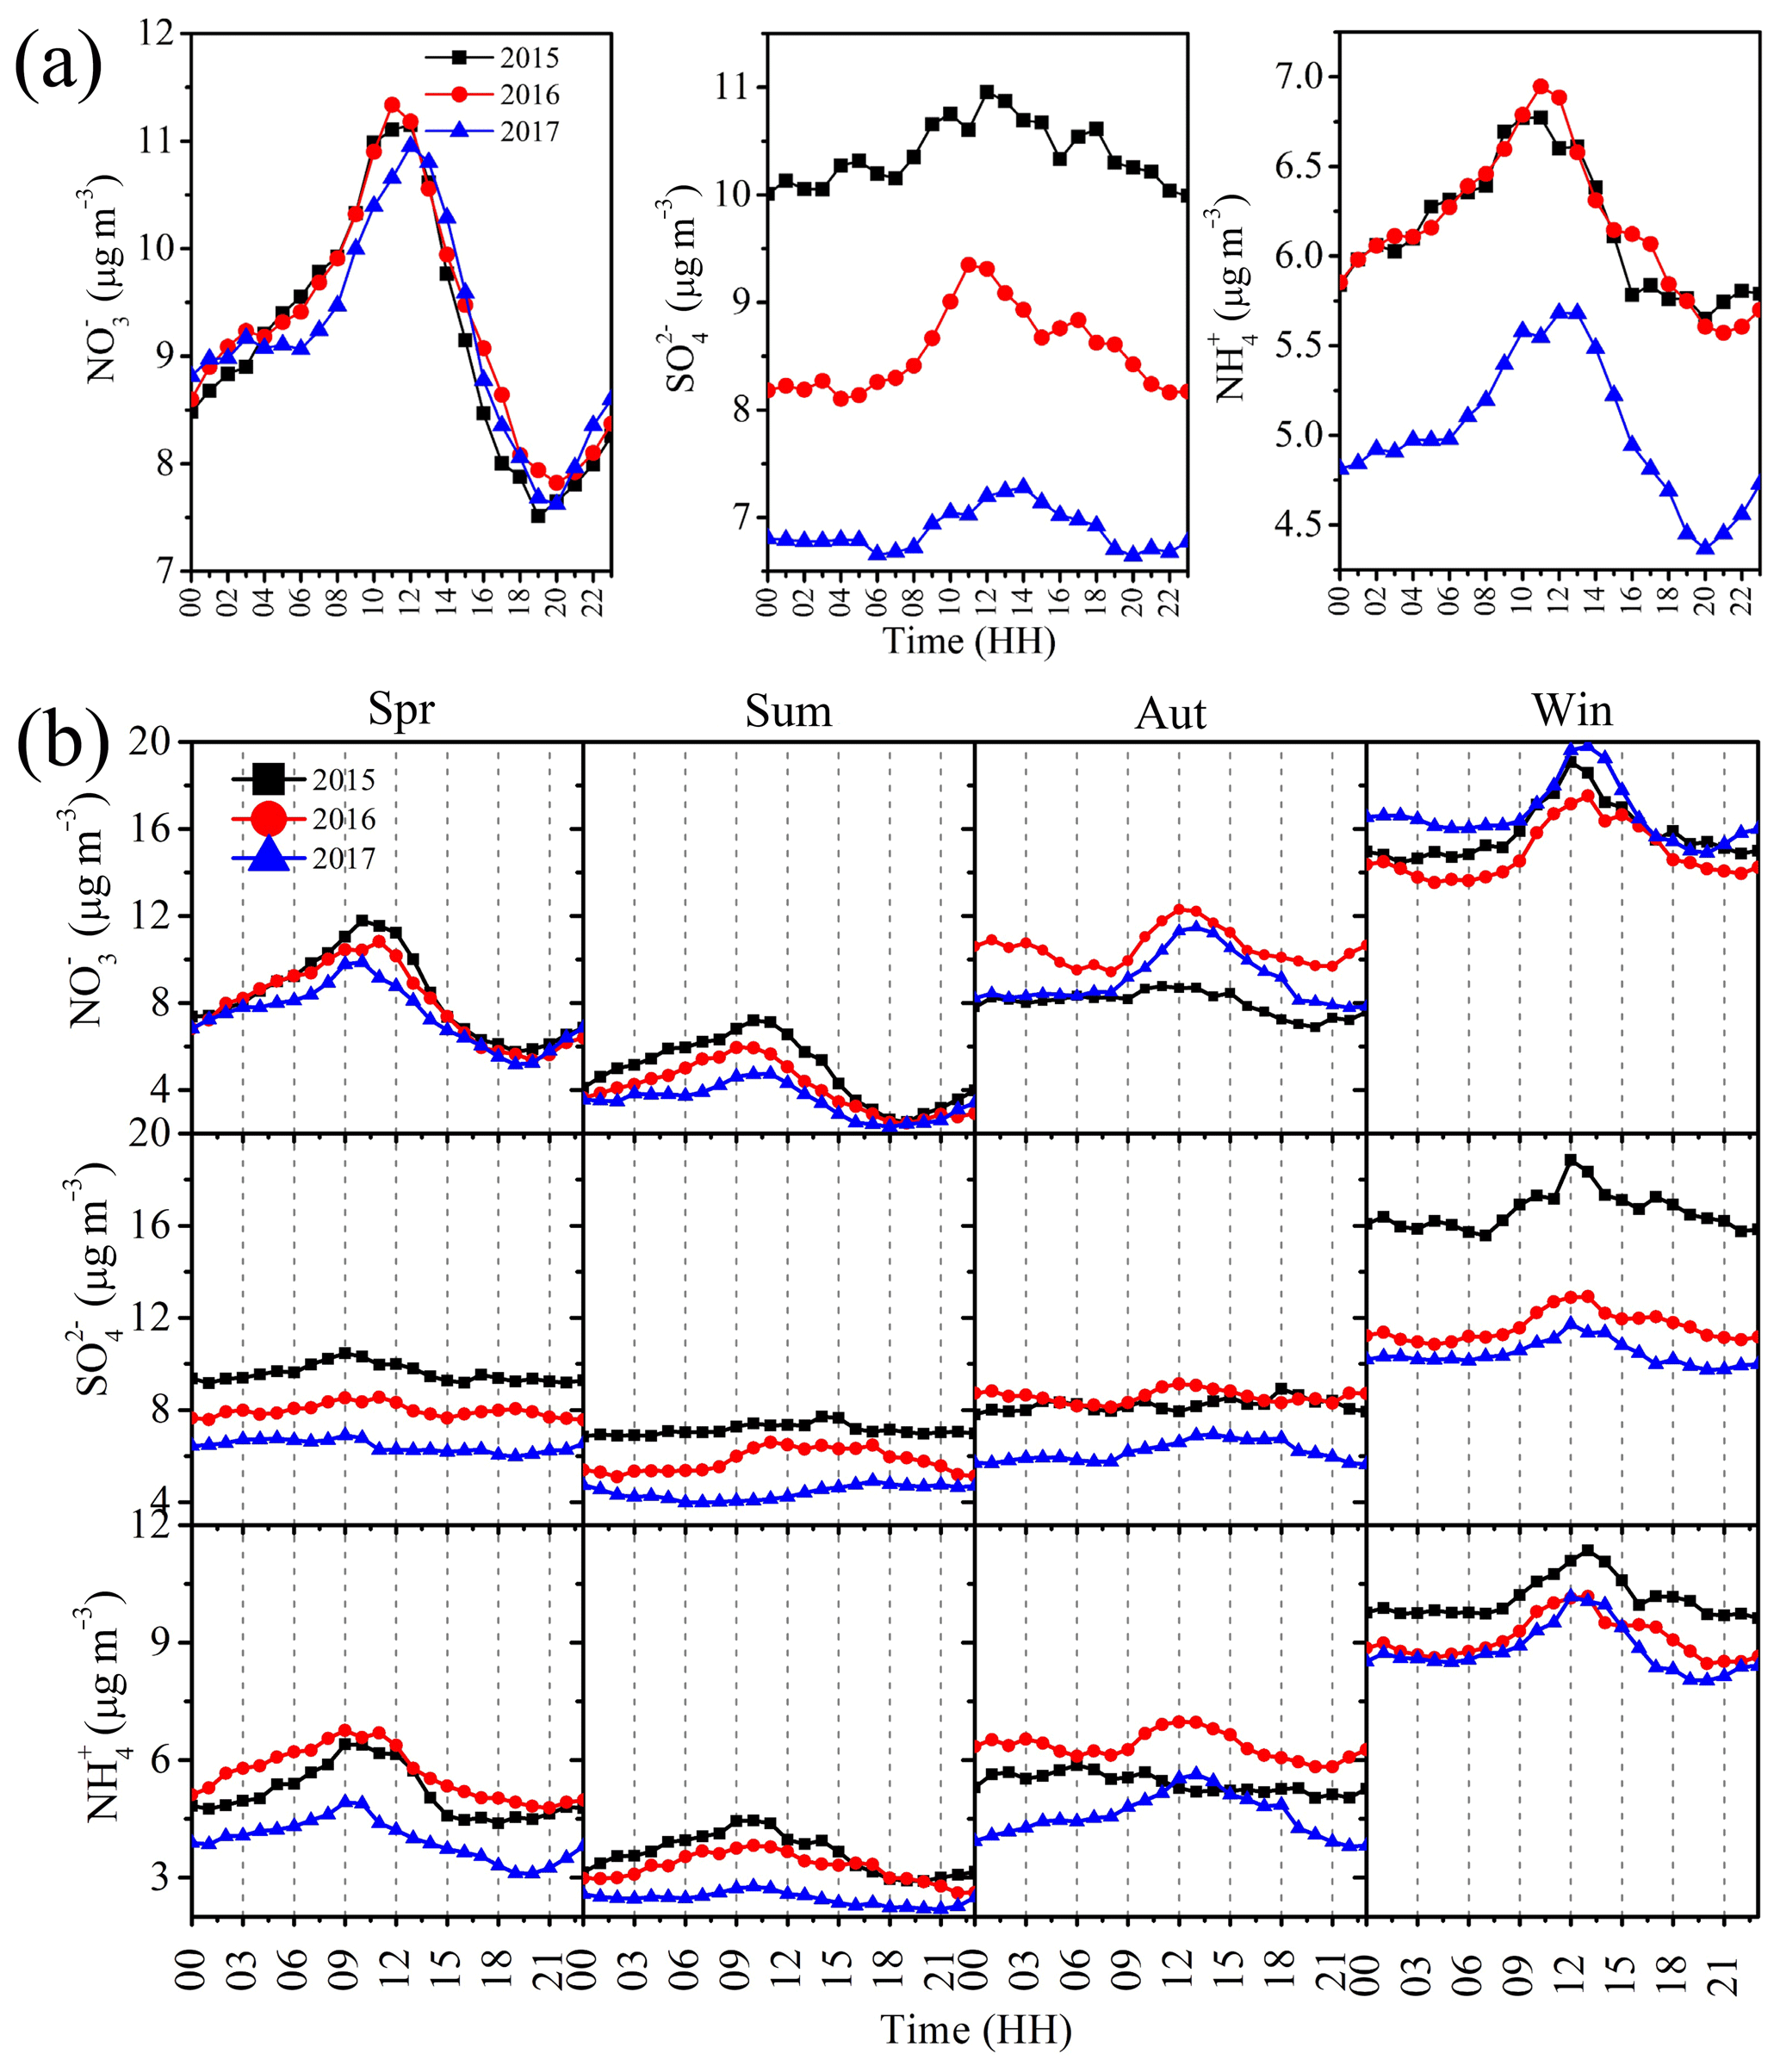
Figure 5Diurnal variations in NSA (nitrate, sulfate and ammonium) from 2015 to 2017. (a) Annual average. (b) Seasonal average.
From 2015 to 2017, the concentration of NSA was higher in the daytime than in the evening (Fig. 5a), and similar results were found in different seasons (Fig. 5b), which may be due to the combination of pollutant emissions and meteorological conditions. As shown in Fig. S7 in the Supplement, from 09:00 to 11:00 UTC+8, the concentrations of SO2, NOx, NH3 and CO increased significantly, indicating that the primary emission of pollutants was relatively strong. At this time, although RH is in a declining stage, it still has a relatively high atmospheric humidity (approximately 65 %), and O3 and NO2∕NO also occasionally show an increasing trend, indicating that the atmospheric oxidizability has also increased (Figs. S7 and S8 in the Supplement). This situation also provides favorable conditions for the formation of secondary aerosols and promotes the accumulation of NSA (Cheng et al., 2016; Wang et al., 2016; Sun et al., 2014). In addition, before 10:00, relatively low WS will enable easy pollutant concentration accumulation. In contrast, the higher WS in the afternoon may be the main factor for the decrease in pollutant concentration (Figs. 5 and S8). Photochemical reactions may also be one of the factors in the formation of NSA, and the concentration of O3 peaks at approximately 15:00, which may be affected by the free radicals generated by photochemistry. At approximately 19:00, the ratio of NO2∕NO reached its highest value, and the concentration of NO2 also increased significantly (Song et al., 2018; Zhu et al., 2019). At night, with the increase in RH (Fig. S8), dissolved ozone, free radicals, hydrogen peroxide and NO2 can catalyze SO2 to form secondary aerosols through an aqueous phase reaction (Zhang et al., 2015; An et al., 2019). The seasonal diurnal variation in NSA is shown in Fig. 5b. The concentration of NSA in winter was obviously higher than that in summer, and the diurnal variation range was larger. The concentrations in spring and autumn were closer, but the diurnal variation in spring was larger than that in autumn. The larger diurnal variation range not only indicates serious pollution but also indicates the importance of other factors affecting air quality, such as meteorological conditions and secondary aerosol conversion conditions (Ji et al., 2019; Y. Yang et al., 2015). The peak value of the NSA seasonal diurnal variation also varies in different seasons. The peak value appears at approximately 13:00 in winter, approximately 10:00 in spring and summer, and approximately 12:00 in autumn, possibly due to the influence of meteorological conditions. In previous studies in Beijing–Tianjin–Hebei and the Pearl River Delta, the concentration of pollutants was affected by meteorological factors, and it was usually lower in the daytime than at night. In the Yangtze River Delta, the peak usually occurs in the morning, but in our study, the concentration was higher in the daytime than at night (Peng et al., 2011; Wang et al., 2018; J. Guo et al., 2017). In addition to the diurnal variations in WS and atmospheric humidity, some studies have shown that due to the unique topographical structure of the Sichuan Basin, the atmospheric circulation between the Qinghai–Tibetan Plateau, Yunnan-Guizhou Plateau and Sichuan Basin and the meteorological conditions of the Chengdu region are affected, such as the characteristics of air mass transport and typical “night rain” (more precipitation at night than in the day) under the influence of atmospheric circulation (Y. Zhang et al., 2019; L. Zhang et al., 2019).
The weekly variation in NSA is shown in Fig. S9 in the Supplement. During the overall observational period, workdays (Monday to Friday) showed higher variations than weekends (Saturday and Sunday), with the highest variation being on Tuesday and the lowest being on Sunday. Despite the difference in mean values between Tuesday and Sunday, nonparametric tests show that the difference in mean values was nonsignificant (Mann–Whitney U test, P>0.05). As shown in Fig. S9, the average trends of and were consistent from Monday to Sunday. The correlation coefficient was 0.94 (P<0.01) from 2015 to 2017, which indicates that they have a common source and that vehicle emissions also have an important contribution to (Pan et al., 2016). The average , and concentrations from 2015 to 2017 were 9.21, 8.64 and 5.64 µg m−3 on workdays and 8.56, 8.33 and 5.29 µg m−3 on weekends, respectively. The average values of NOx, SO2 and NH3 were 42.43, 4.35 and 20.39 ppb on weekdays and 39.60, 4.34 and 19.67 ppb on weekends, respectively. Similarly, the mean difference between NSA and gaseous precursors (NOx, SO2 and NH3) was not significant by the Mann–Whitney U test on weekdays and weekends. Population standard deviation comparisons of , and showed that workdays had higher standard deviations than did weekends, with 7.96, 6.04 and 4.35 on weekdays and 6.76, 5.69 and 3.88 on weekends, respectively. It could also be seen from the box plot of NSA weekly variation that the concentration range on working days was slightly larger than that on weekends (Fig. S10 in the Supplement). Analysis of the diurnal variation in NSA gaseous precursors on weekdays and weekends shows that the variation trend is relatively consistent (Fig. S11 in the Supplement), and the concentration of NOx on weekdays will be slightly higher at the peak of 09:00 to 10:00 than on weekends, which may be affected by the morning rush hour of vehicles. In this study, NSA and gaseous precursors are also slightly higher on weekdays than on weekends, which indicates that in Chengdu's air pollution prevention and control actions, the management of relevant industries and departments should be strengthened on weekdays.
3.4 Chemical characteristics of NSA
3.4.1 Chemical conversion characteristics of NSA
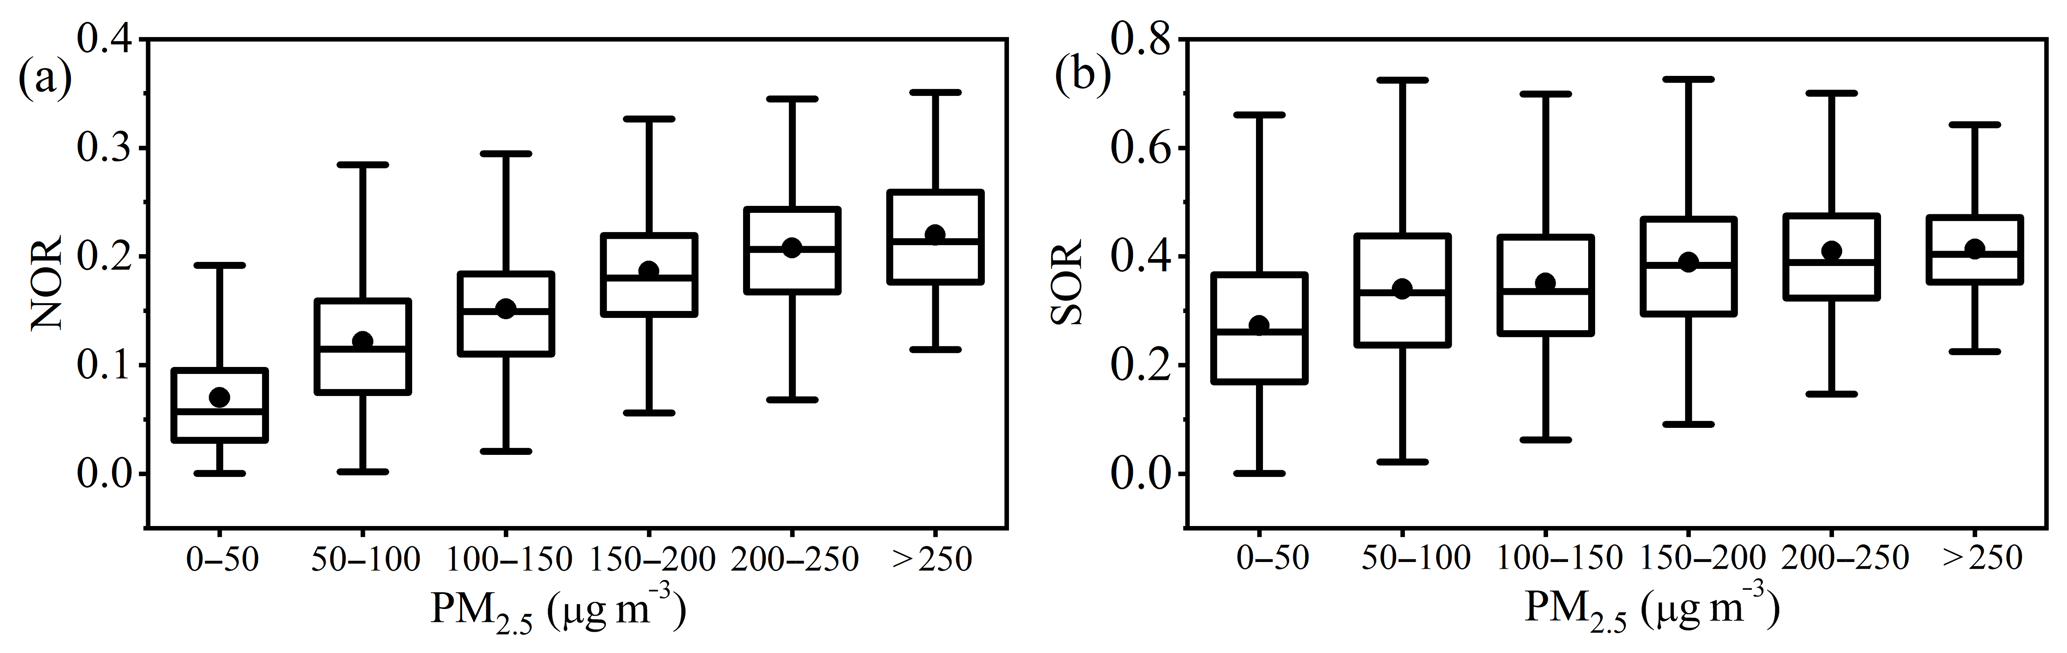
Figure 6Analysis of atmospheric chemical conversion ability at different PM2.5 concentrations. (a) NOR (nitrogen oxidation ratio). (b) SOR (sulfur oxidation ratio).
Figure 6 shows the abilities of NO2 and SO2 to chemically convert to and at different PM2.5 concentrations. With the increase in PM2.5 concentration, NOR and SOR gradually increased, indicating that the formation ability of and increased during the formation of air pollution. In this study, when the PM2.5 concentration was ≤50 µg m−3, the average NOR and SOR were 0.07 and 0.27, respectively, and when the PM2.5 concentration was greater than 250 µg m−3, the average NOR and SOR increased to 0.22 and 0.41, respectively, indicating that the chemical conversion and formation ability of secondary inorganic aerosols was obviously enhanced when air pollution was aggravated. Previous studies suggested that when NOR and SOR were greater than 0.1 and 0.2, respectively, it has intense conversions and forms secondary inorganic aerosols (Y. R. Yang et al., 2015).
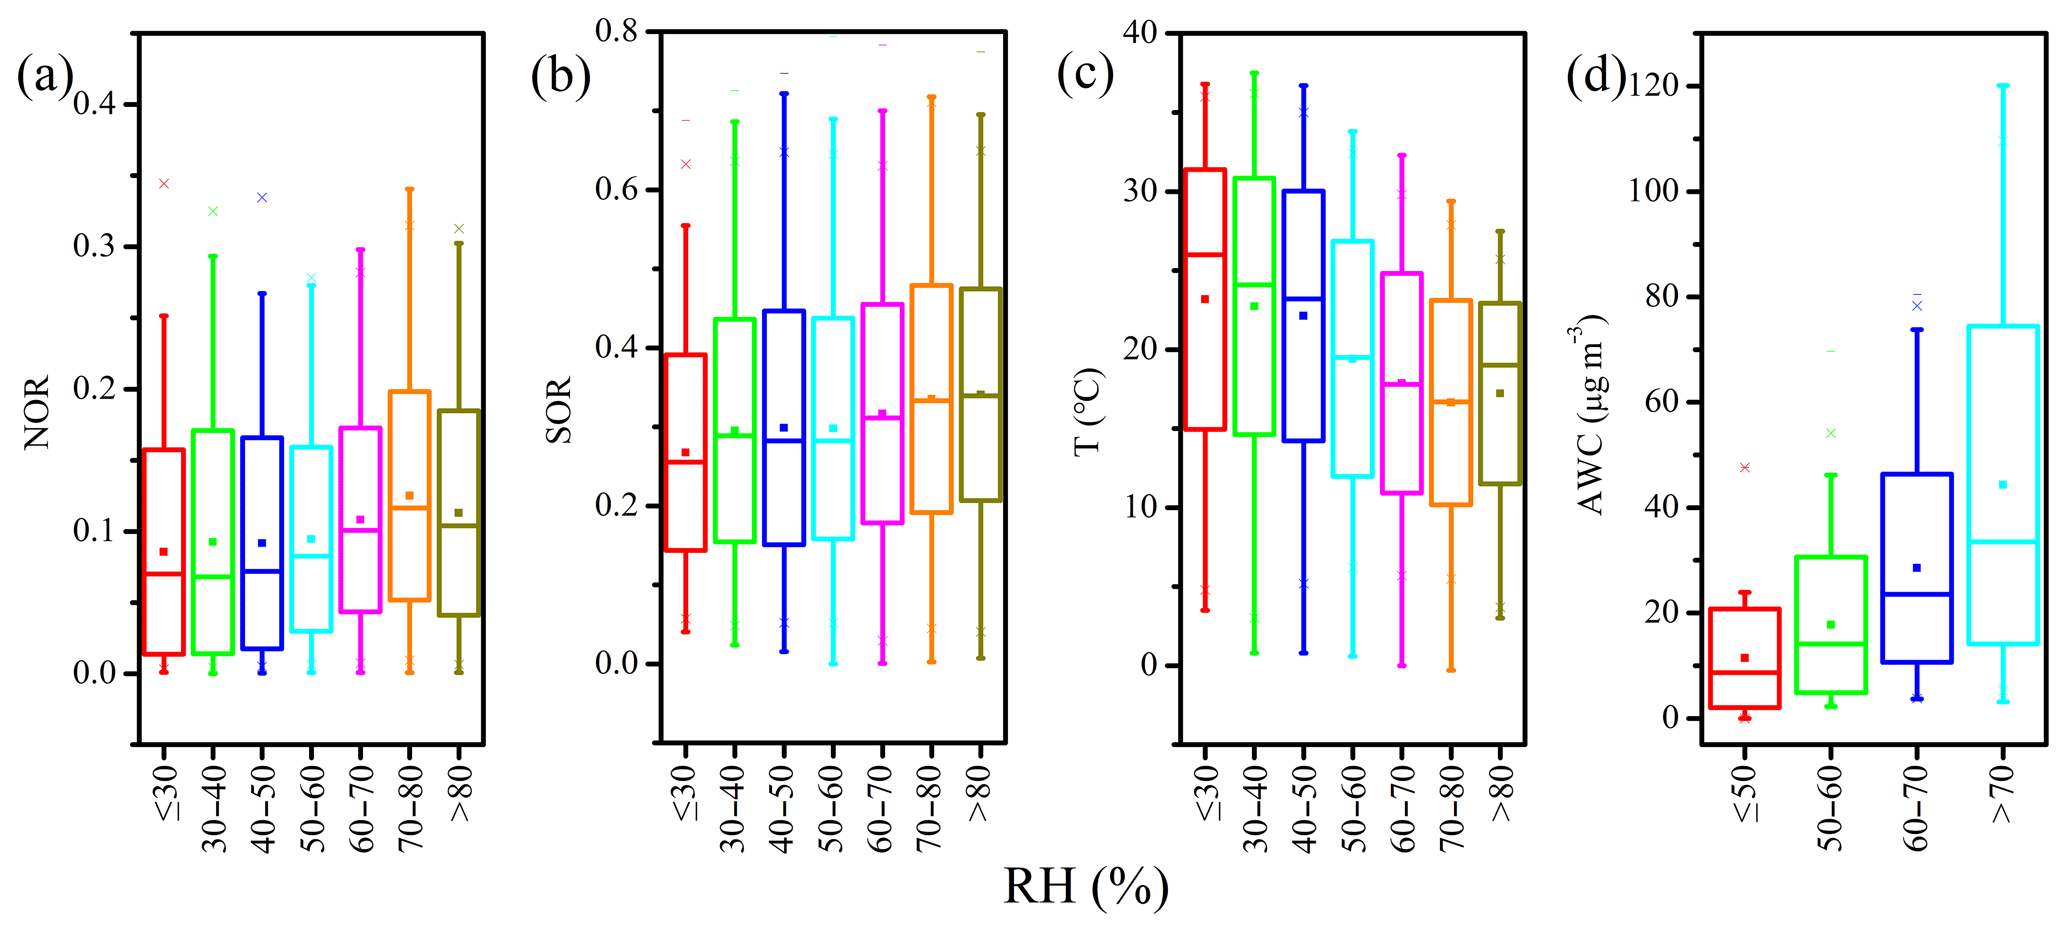
Figure 7Effects of RH on the chemical conversion of NSA (nitrate, sulfate and ammonium). (a) NOR (nitrogen oxidation ratio). (b) SOR (sulfur oxidation ratio). (c) Temperature (T). (d) AWC (aerosol water content).
Figure 7 shows the variation characteristics of NSA chemical conversions with increasing RH. NOR and SOR increased with increasing RH, suggesting that NO2 and SO2 were more likely to produce and under higher-RH conditions. Previous studies have shown that the presence of NH3 and NO2 can promote the chemical conversion of SO2 to in the aqueous phase (Wang et al., 2016). In an aerosol aqueous phase environment, alkaline aerosol (NH3) components can promote the dissolution of SO2 and the formation of under the oxidation of NO2 (Cheng et al., 2016). Especially when the atmosphere is polluted, the formation of by SO2 through the aqueous phase environment can contribute most of the (Sun et al., 2013). When the RH is greater than 80 %, the NOR appears to decline, possibly because HNO3 is semivolatile, and the T increases at this time (Fig. 7c), which is not conducive to the condensation of gaseous HNO3 to particulate matter, which affects the amount of in PM2.5 (H. Guo et al., 2017). According to the ISORROPIA-II thermodynamic equilibrium model simulation, AWC also increases with RH (Fig. 7 d), and the increase in AWC can provide a liquid environment for aerosols, which is conducive to the dissolution and conversion of gaseous precursors of NO2, SO2 and NH3 and promotes the formation of more NSA. The Pearson's correlation coefficients of RH and NOR and SOR were 0.12 and 0.16 (p<0.01), and the AWC and NOR and SOR were 0.73 and 0.37 (p<0.01), respectively, showing a significant positive correlation, indicating that the increase in AWC may be beneficial to the conversion of NO2 and SO2 to and . As shown in Fig. S12 in the Supplement, the simulated values of NSA (metastable state, liquid phase components) are compared with the observed data. The linear regression fitting slope is approximately 1 (p<0.01), indicating that the effect of the liquid phase environment in PM2.5 is obvious; in addition, stable state simulation is also performed, and the linear regression fitting slopes of the NSA liquid phase state data output from the model and the observation data are 0.73, 0.63 and 0.74, and the Pearson's correlations are 0.82, 0.71 and 0.80 (p<0.01), indicating that they are more often combined with AWC in the aerosol aqueous phase environment at a stable state. Previous studies have also confirmed that the aqueous phase environment of aerosols plays an important role in the formation of secondary inorganic aerosols (Wang et al., 2016; Cheng et al., 2016).
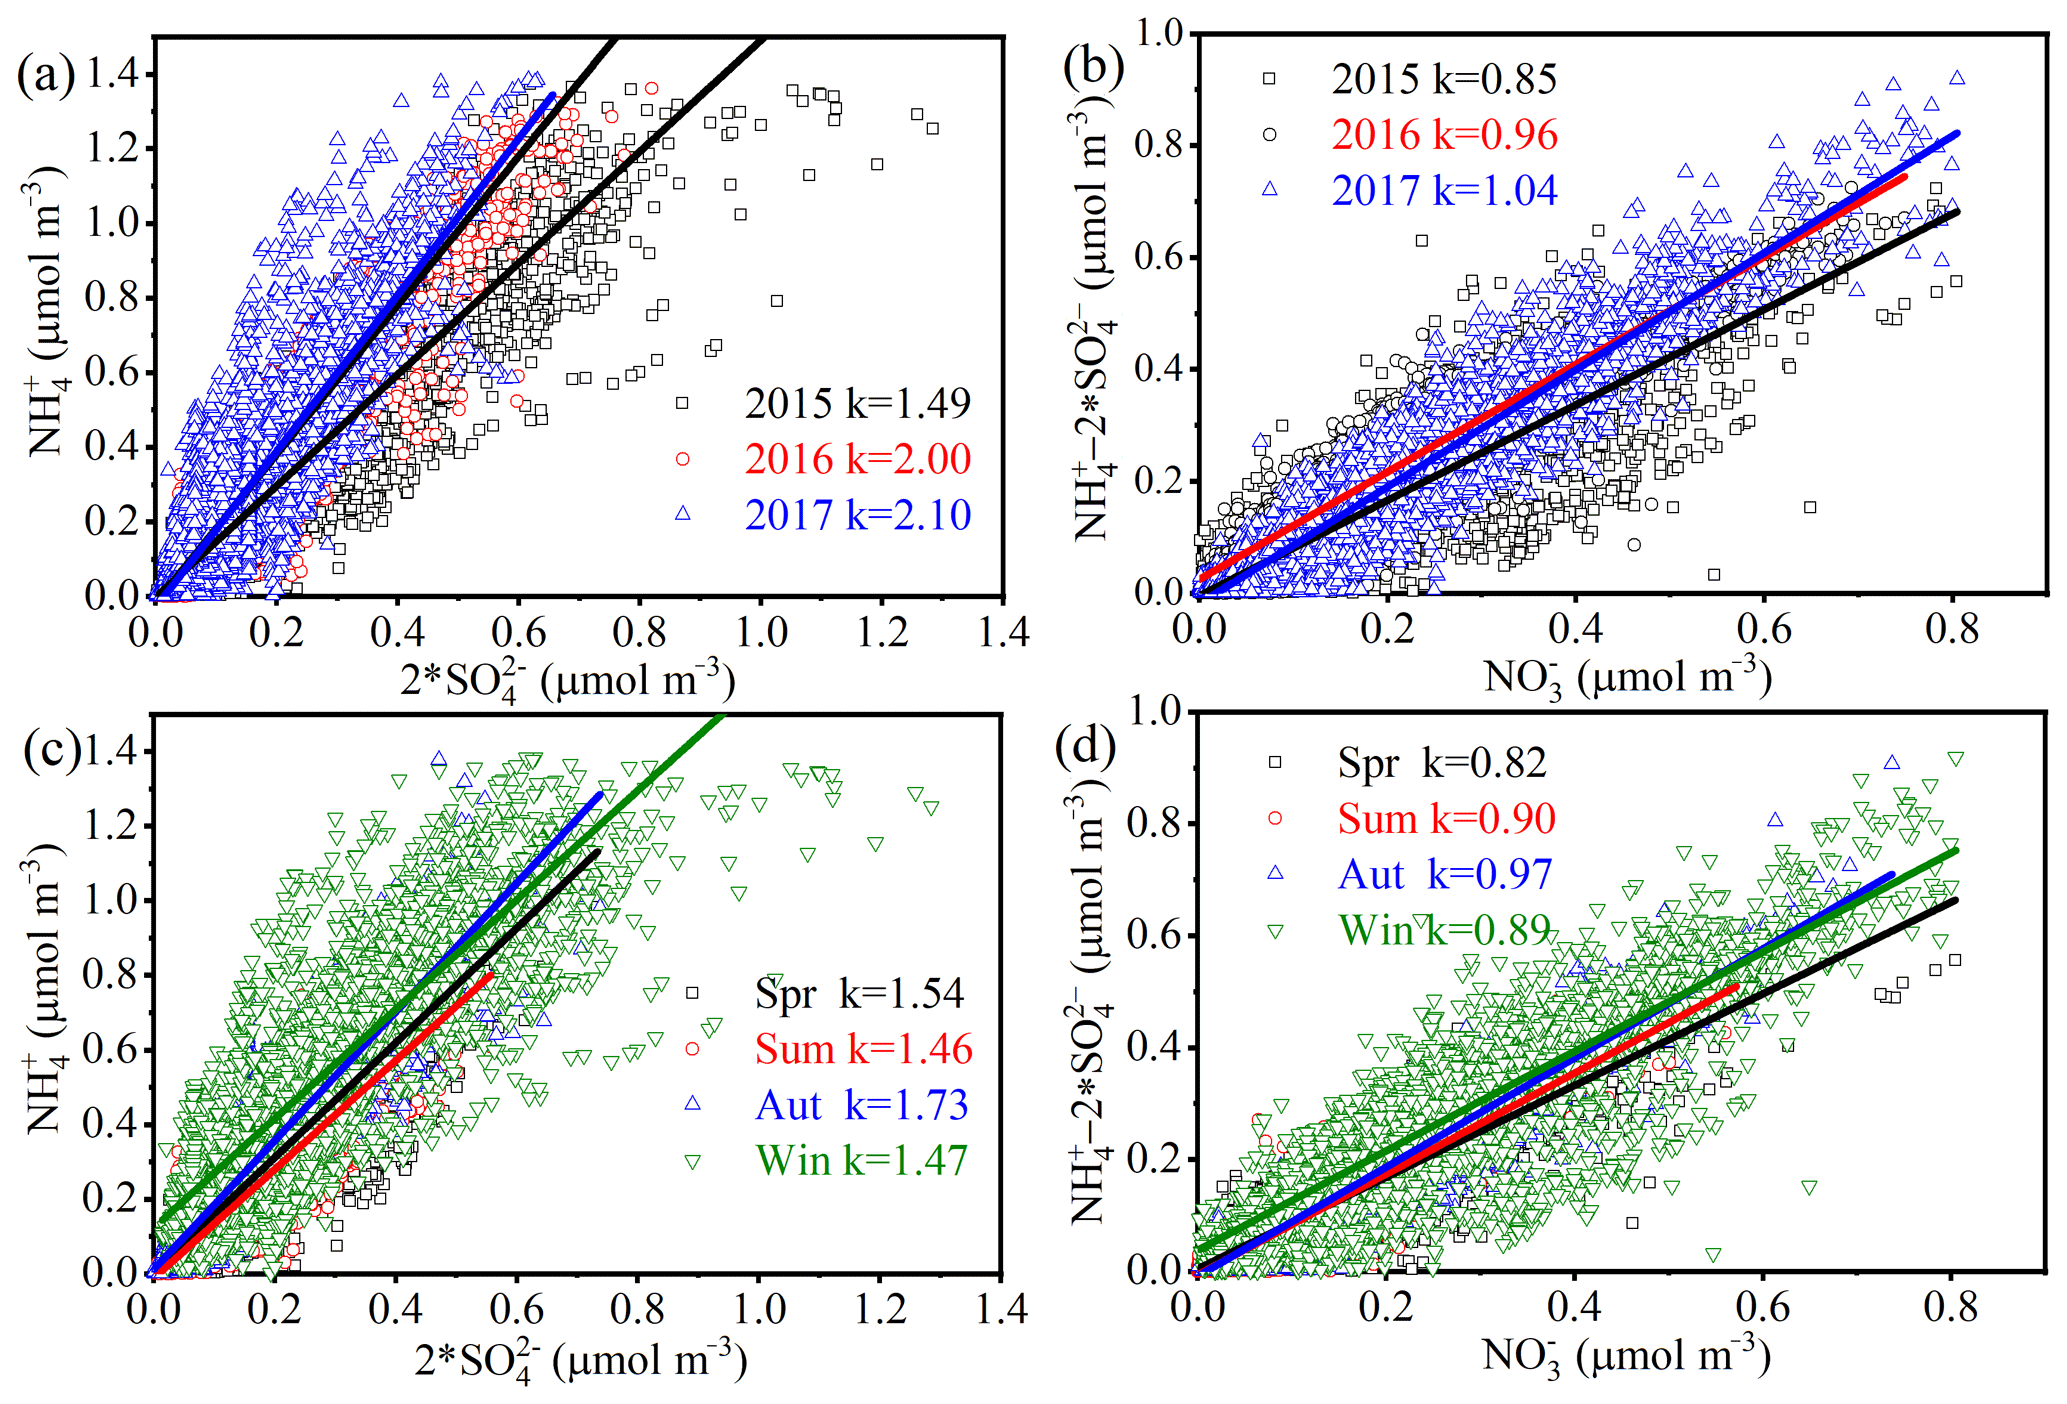
Figure 8Molar ratio analysis of NSA (nitrate, sulfate and ammonium). (a) Interannual variation in the molar ratio of and . (b) Interannual variation in the molar ratio of and . (c) Seasonal variation in the molar ratio of and . (d) Seasonal variation in the molar ratio of and . k: fitting slope of linear regression.
3.4.2 Sensitivity analysis
The molar ratio analysis of NSA shown in Fig. 8 was used to analyze the chemical relationships among NSA. (NH4)2SO4 and NH4NO3 are mainly composed of , and in particulate matter (Malm and Hand, 2007; Meier et al., 2009). Because (NH4)2SO4 has better stability than NH4NO3, will first combine with and then with (Liu et al., 2012). The annual average molar ratio of to was more than 1, which indicates that can be completely neutralized by (Fig. 8a). The molar ratios of residual () to were 0.85, 0.96 and 1.04 in 2015, 2016 and 2017, respectively. As shown in Fig. 8a and b, the gradual increase in the ratio (slope k) from 2015 to 2017 indicates that there is an increase in in aerosol compared with and , especially in 2017, with a ratio of 1.04, indicating the presence of other forms of , such as NH4Cl and (NH4)2C2O4 (Sun et al., 2006). Seasonal variations in , and are shown in Fig. 8c and d. The higher molar ratio in autumn indicates that the intensity of ammonia emission in autumn was higher than that in other seasons. This result also shows that the proportion of relative to and in PM2.5 has increased. Therefore, while currently controlling NOx and SO2 emissions, it is also necessary to strengthen NH3 emissions control.
Table 3Sensitivity analysis of NSA (nitrate, sulfate and ammonium) concentration variations during the different observation periods.
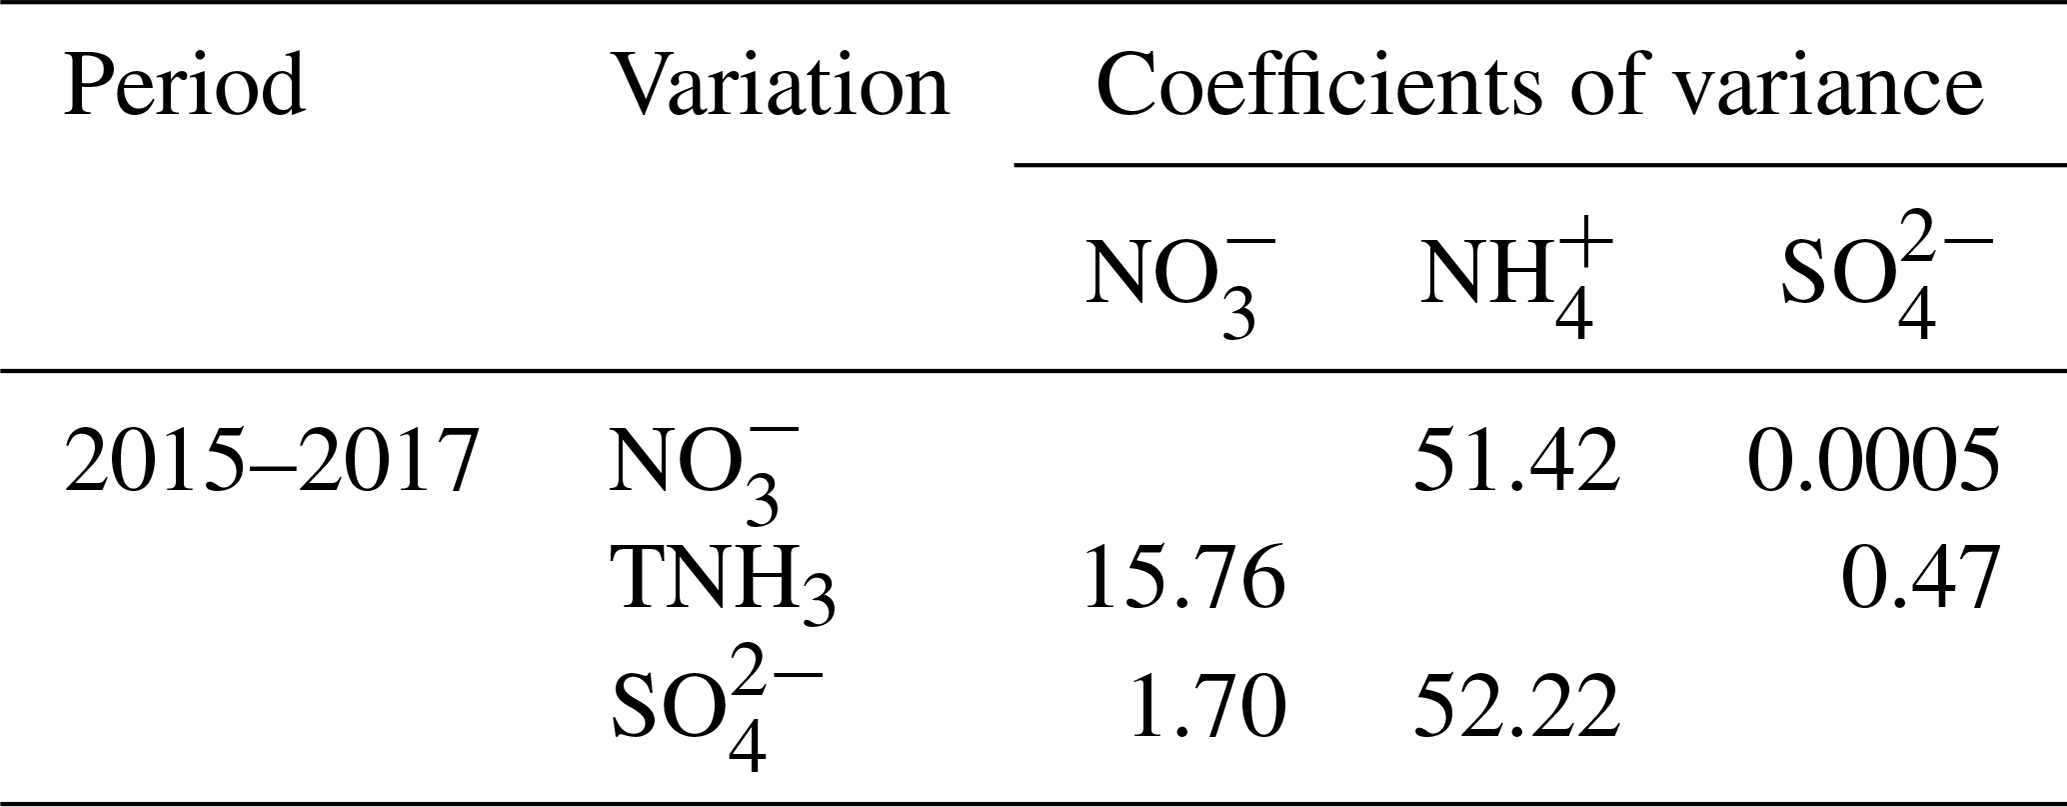
Coefficients of variance: standard deviation/average ×100 %. Variation TNH3: NH3+ (µg m−3). Variation and units are µg m−3.
Table 3 shows the sensitivity analysis of the concentration variations in , and . ISORROPIA-II thermodynamic equilibrium model sensitivity analysis is described in detail in the Supplement. The coefficient of variance represents the response of the species to variations in other components. The coefficients of variance for and produced by changes were 52.22 and 1.70, respectively. Similarly, the coefficients of variance for and produced by changes were 51.42 and 0.0005, respectively. The large coefficient of variance for indicates that the changes in and can affect the presence of , which also indicates that NH4NO3 and (NH4)2SO4 were the main states of (Liu et al., 2012). The coefficients of variance for and produced by TNH3 (NH3+NH4) changes were 0.47 and 15.76, respectively, and the effect of TNH3 on was less than that of , which indicates that experienced a surplus over and that first combines with to form stable (NH4)2SO4, and the remaining and will combine to form NH4NO3.
Through the implementation of the Air Pollution Prevention and Control Action Plan, the reduction in in PM2.5 has achieved good results. Therefore, while continuing to promote “electricity instead of coal” and “natural gas instead of coal” to reduce coal combustion pollution, more stringent control measures should be added for and emissions. To further improve air quality, the Chinese government launched a “Three-Year Action Plan for Winning the Blue Sky Defense Battle” in 2018 and proposed emission reduction targets for NOx and SO2 emissions, which will be 15 % lower in 2020 than in 2015 (the Sate Council, 2018, last access: 17 June 2020). The results of using the ISORROPIA-II thermodynamic equilibrium model to simulate , and TNH3 emission reduction control effects of 5 %, 10 %, 15 % and 20 % are shown in Table S3 in the Supplement, showing that controlling the concentration of and is also helpful to reduce the concentration of and indicating that controlling its precursor NOx and SO2 is of great significance to reduce the secondary inorganic aerosol in PM2.5 (the detailed results are described in the Supplement). Previous studies have also shown that the conversion of SO2 to in the aqueous phase not only increases the conversion of but also enhances the formation of in the aqueous phase (Wang et al., 2016). Therefore, SO2 emission reduction may play a key role in the process of controlling emission reduction in NSA pollution, as it not only reduces the presence of ((NH4)2SO4) in particulate matter but also affects the formation of NH4NO3 by influencing the formation of . NO2 and NH3 can also promote the conversion of SO2 to through an aqueous phase environment (Wang et al., 2016). Therefore, priority control of NOx and SO2 emissions is an important way to reduce NSA in particulate matter.
The increase in NSA can increase the hygroscopicity properties of aerosols, and more AWC can increase the pH by diluting the hydrogen ion concentration (Kong et al., 2020; Ding et al., 2019). Previous studies have also shown that formation reduces aerosol pH (Sun et al., 2014). The effects of , and TNH3 on pH when using the ISORROPIA-II thermodynamic equilibrium model to simulate pollutant concentration reduction are shown in Table S3. With the decrease in and , the pH value increases, but has no obvious effect on the pH value. has an obvious effect on the pH value, which indicates that the formation of in the aerosol can increase the acidity of the aerosol (Sun et al., 2014). The greater the reduction of TNH3, the lower the pH value is, which shows that the presence of NH3 as an alkaline gas can alleviate some of the acidity produced by (Cheng et al., 2016). When the synergistic control of pollutants is reduced, it also has a certain effect on pH, increasing from 4.07 to 4.16. Some studies believe that if ammonia emissions are reduced significantly, the risk of acid rain may increase (M. Liu et al., 2019). As shown in Fig. S13 in the Supplement, the acid rain problem in China is mainly concentrated in southern China, especially in southwestern China, southern China and the Yangtze River Delta in eastern China. Therefore, how to adjust the emission reduction ratio in combination with the characteristics of regional air pollution and energy consumption and thus help reduce the problem of aerosol acidity changes caused by air pollution reduction is a problem worthy of in-depth study. Therefore, when controlling NOx, SO2 and NH3 emissions, it is necessary to consider the aerosol acid and alkali changes caused by emission reduction.
3.5 Characteristics of local emissions and regional transport
3.5.1 Local emissions
The concentration of pollutants is obviously affected by meteorological conditions; for example, WS and WD can affect the accumulation and removal of pollutants (Li et al., 2016). Figures S14–S16 in the Supplement show the annual variation characteristics of NSA and gas precursors affected by the WS and WD using CPF. Overall, the higher WS was accompanied by a lower pollutant concentration. As the WS decreased, the pollution became serious, and the pollution hotspots were gradually concentrated. On the whole, when the WS was usually greater than 2 m s−1, the pollution was light (pollutant concentration percentile was between 0 and 25). When WS was usually less than 1 m s−1, the pollution was heavy (pollutant concentration percentile was between 75 and 100), which also reflects the distance and orientation between the emission source and the observation station, indicating that when the pollution was serious, the contribution of local source emissions was more prominent.
and NOx have similar distributions of pollution hotspots in the polar plot diagram (Fig. S14), and when the concentration percentile was 0–25, the hotspots were concentrated in the northeast and southeast directions and widely distributed. When the concentration percentile was 25–50, the sources of and NOx were distributed west, southwest and northeast of the observation site, and there were important contribution sources in the northwest direction (WS was approximately 3–4 m s−1) in 2017. When the WS was approximately 1–2 m s−1 and the concentration percentile was 50–75, the important NOx source was in the northwest direction. When the accumulation of pollution concentration was high (concentration percentile was 75–100), the source was mainly concentrated in the east and southeast of the observation site, and NOx was distributed in the south and southeast, with WSs of less than 1 m s−1. Additionally, the distribution of pollution hotspots was relatively wide in 2016 (the annual mean values of NOx were 42.15, 43.99 and 39.63 ppb in 2015, 2016 and 2017, respectively), indicating that the source was relatively wide, which may be one of the reasons for the relatively high concentration. The and SO2 pollution sources affected by meteorological conditions also have similar distribution characteristics (Fig. S15). At a higher concentration of pollutants, the pollution hotspots of were distributed in the east and southeast of the observation site, and SO2 was distributed in the northeast, southeast and west. Compared with 2017 and 2016, the distribution of SO2 pollution sources in 2016 was also more extensive, mainly in the west and northeast. The NH3 emissions were slightly different from those of NOx and SO2 (Fig. S16). Under conditions of high pollution concentration (concentration percentile was 75–100), the pollution hotspots were distributed in the west in 2015 (WS was approximately 2–3 m s−1), in the north in 2016 (WS was approximately 1 and 3 m s−1) and in the near distance in 2017 (WS was approximately 0.5 m s−1). The higher pollution concentration was accompanied by a relatively higher WS (2015 and 2016), which indicates that the NH3 emission transport in the surrounding area was more obvious, which may come from the surrounding agricultural source distribution area (L. Liu et al., 2019; Liu et al., 2013). The annual mean value of NH3 emissions in 2017 was 27.91 ppb, which is significantly higher than those in 2015 and 2016 at 17.93 and 16.55 ppb, respectively. During the 25–50 concentration percentile period of NH3, there was a WS of approximately 2 m s−1 east of the observation site, and during the 50–75 concentration percentile period, there was an obvious source northwest of the observation site, with a WS of approximately 4 m s−1. During the 75–100 concentration percentile periods, the pollution sources were mainly local. This shows that in 2017, in addition to the pollution sources being distributed in the east and northwest, the higher NH3 emissions were also contributed by the surrounding emission sources northwest of Chengdu.
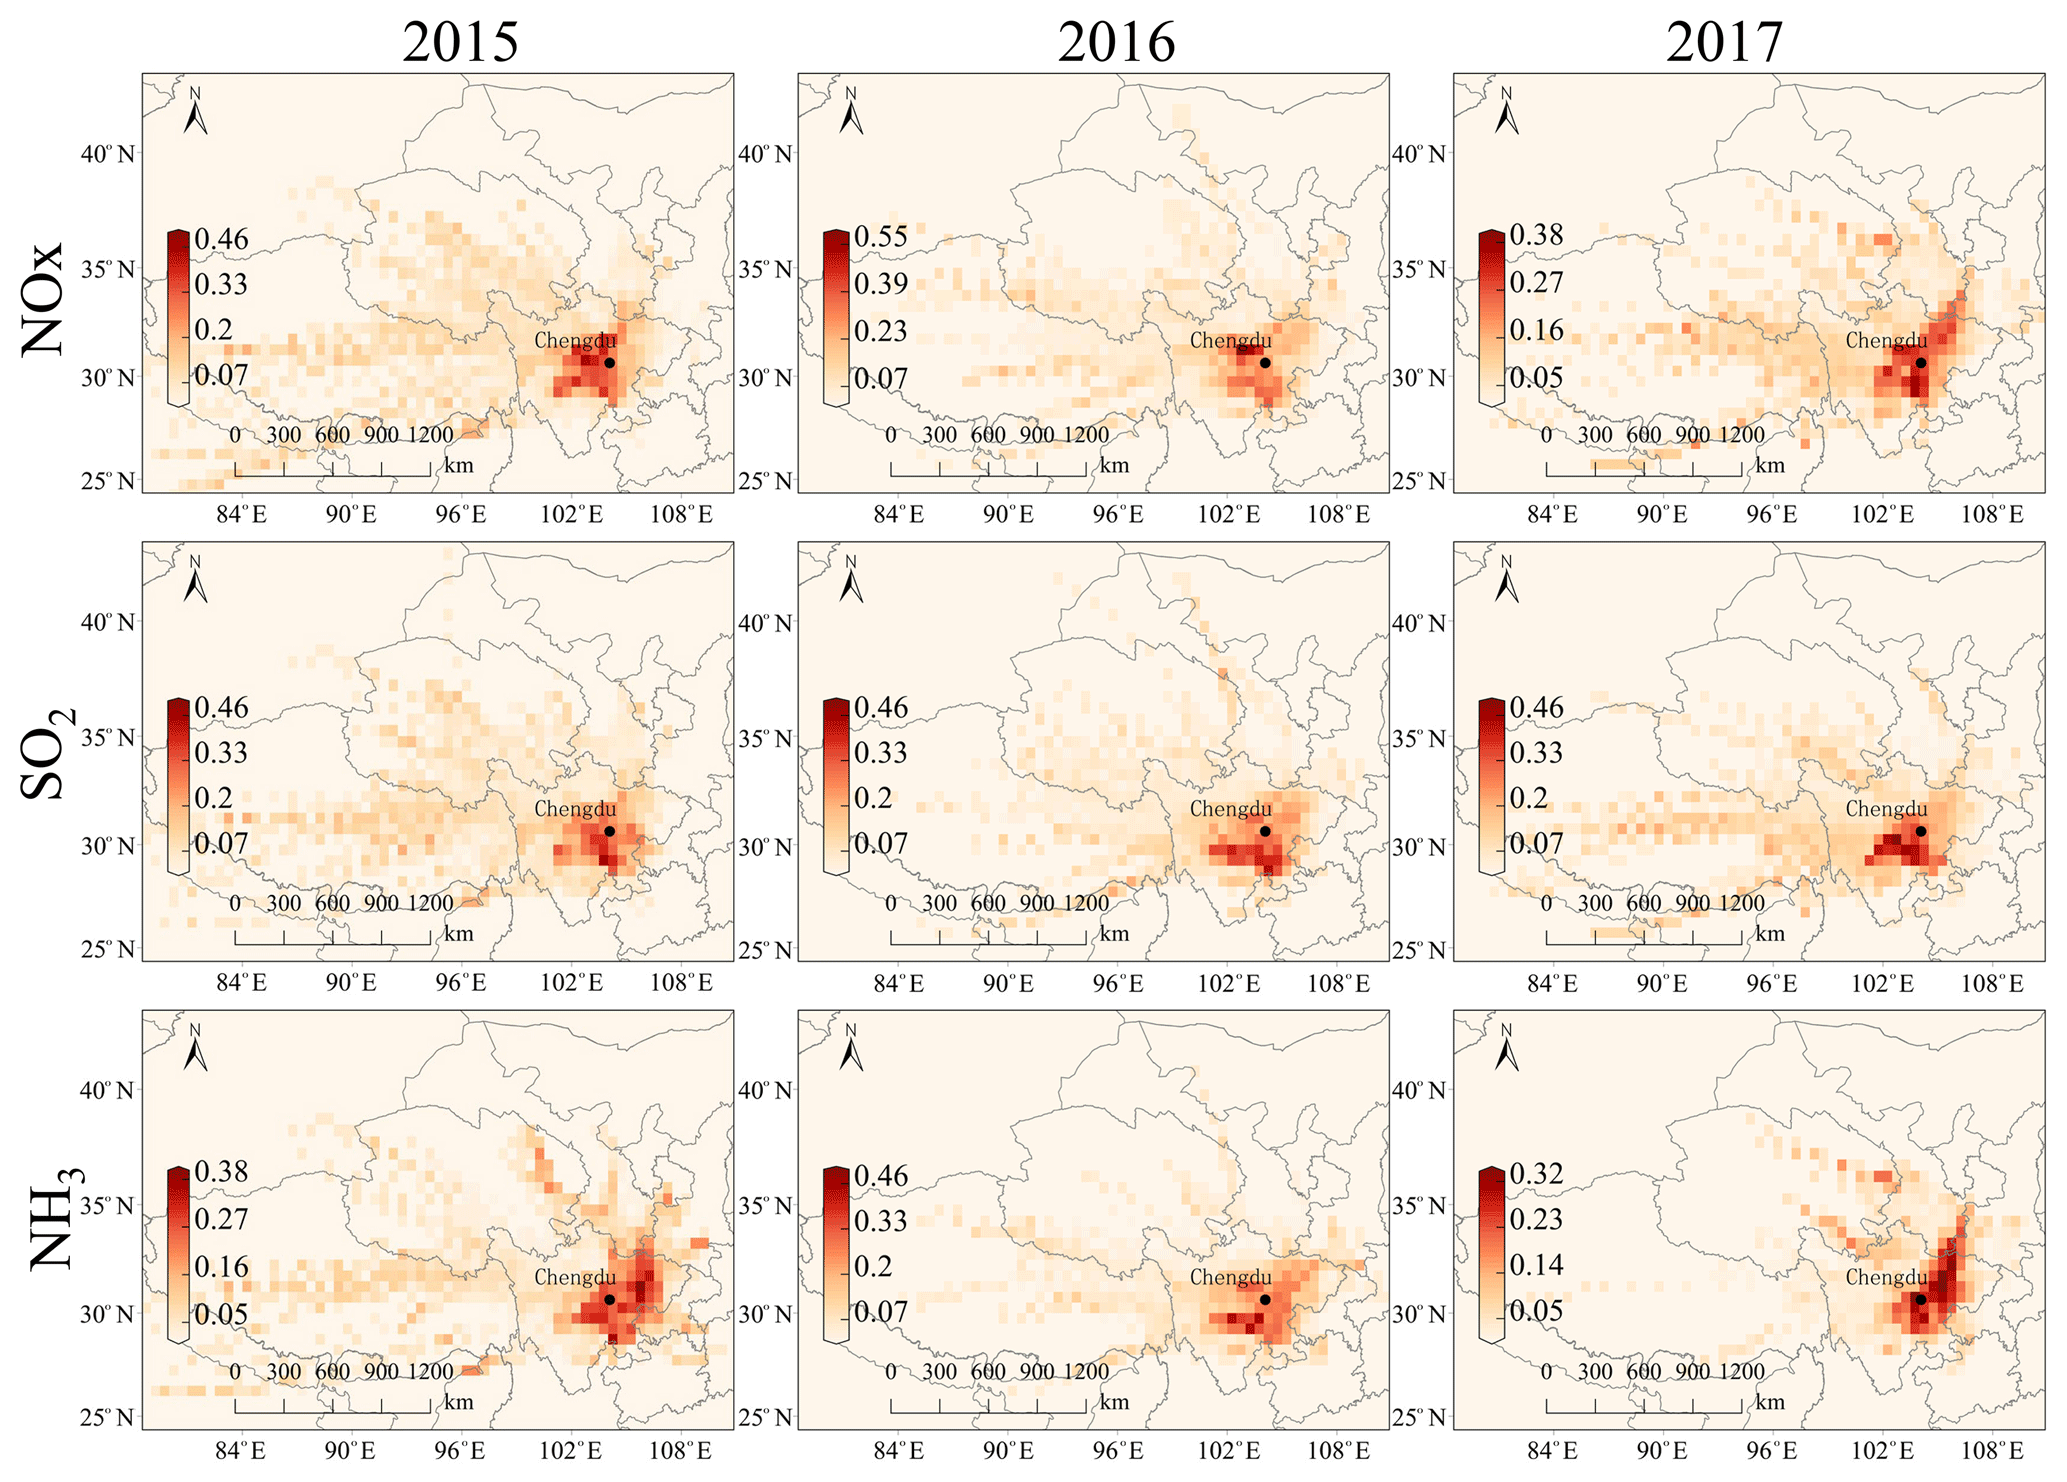
Figure 9PSCF (potential source contribution function) of NOx, SO2 and NH3 in Chengdu from 2015 to 2017.
3.5.2 Gaseous precursors of NSA regional transport
The PSCF is used to analyze the potential source distribution of pollutants to determine the regional transport characteristics of pollutants (Ji et al., 2019). In addition, considering the aerosol lifetime, SO2 (approximately 9.6 d) and NOx (approximately 1 d) are also very different (Guo et al., 2014), and the research also shows that NH3 is significantly contributed by local source emissions (Walker et al., 2004). Therefore, we comprehensively consider selecting a 24 h backward trajectory to carry out PSCF simulation in the Chengdu region. Figure 9 shows the PSCF analysis of NOx, SO2 and NH3, with significant differences in their potential source distributions. The higher PSCF value of NOx was mainly distributed west, northwest and southwest of Chengdu in 2015, northwest and south of Chengdu in 2016, and south, west and northeast of Chengdu in 2017. The PSCF of NO2 and NO (Fig. S17 in the Supplement) also reflects that their potential sources are mainly influenced by the interior of Sichuan Province, especially in the cities around Chengdu. Chengdu is located along the western margin of the Sichuan Basin, and it was also observed through satellite remote sensing data that the higher NO2 emissions in the Sichuan Basin were distributed in Chengdu and Chongqing (Fig. S18a in the Supplement). The SO2 emissions were widely distributed, mainly in the Sichuan Basin. Among them, Leshan City and Meishan City south of Chengdu had higher SO2 emissions, and another higher-emission source was distributed in Chongqing (Fig. S18b). The PSCF analysis of SO2 showed that the higher PSCF values were distributed in southern, western and southwestern Chengdu. Therefore, a comparison of Figs. 9 and S18b shows that the main source of SO2 may be distributed in the southern, western and southwestern margin region of the Sichuan Basin. In particular, Leshan, Ya'an and Meishan were important potential sources. As shown in the PSCF analysis of NH3 in Fig. 9, the higher PSCF was also concentrated in the inner Sichuan Basin, especially in the urban agglomeration around Chengdu. In 2015, the potential source of NH3 was mainly distributed in the southwest and northeast of Chengdu, with higher PSCF in Nanchong and other regions. In the southwest, it was concentrated in Ya'an, Meishan and Leshan. In 2016, potential sources were mainly distributed in the southwest of Ya'an, Meishan, Leshan and the southern part of the Garzê Tibetan Autonomous Prefecture. There were two characteristics of potential sources in 2017. A relatively light source was relatively close to Chengdu, and the high PSCF was in Chengdu, which can be considered the contribution of local emissions. The other contribution is obvious as a long-distance potential source contribution, mainly in some cities in the northeast, Nanchong, Guangyuan and Mianyang, and to a certain extent at the junction of Shaanxi, Gansu and Sichuan. In 2017, in addition to the contribution of local emissions, the contribution of regional transport in the northeast may also be an important reason for the higher NH3 concentration. Figure S19 in the Supplement shows satellite remote sensing data of NH3. Overall, the higher NH3 column concentration is distributed in the Sichuan Basin, mainly concentrated in the region near Chengdu, showing that NH3 is more discharged in the Sichuan Basin, especially in the surrounding areas of Chengdu. In addition, through the analysis of the Multi-resolution Emission Inventory for China (MEIC), it is also found that the higher NOx, SO2 and NH3 emissions in Sichuan Basin are mainly concentrated in Sichuan Basin, as shown in Fig. S20 in the Supplement. It can also be seen that NOx is mainly concentrated in more-developed Chengdu and Chongqing, SO2 emissions are obvious in Chengdu and western Chongqing, NH3 emissions are widely distributed, and there are higher emission characteristics in Chengdu and its surrounding areas. Therefore, according to the analysis of pollution emissions and PSCF in Chengdu, it is necessary to strengthen regional air pollution control and take regional joint prevention and control measures to reduce the impact of air pollutant regional transport.
The 3-year observation experiment with hourly resolution of NSA from 1 January 2015 to 31 December 2017 was carried out in Chengdu in southwest China, which is in the Sichuan Basin. The pollution characteristics of NSA's annual, monthly, seasonal, diurnal and weekly variations were demonstrated. The characteristics of chemical conversion and the sensitivity of emission reduction control were analyzed. Finally, combined with meteorological parameters and PSCF simulation, the local emission and regional transport characteristics of NSA gaseous precursors were also illustrated. The main conclusions were as follows.
- 1.
With the increase in PM2.5 concentration, the NSA mass concentration increased, accounting for 31.45 %–37.78 % of PM2.5, and the contribution of NSA was higher than that of carbon aerosol (OC and EC). From 2015 to 2017, the contribution of to PM2.5 increased, and in 2017, it became the main contribution component of NSA, and it plays an important role in the concentration accumulation of PM2.5. Higher and lower NSA concentrations were seen in winter and summer, respectively, and higher concentrations were seen more during the day than at night. Although the NSA concentration on weekdays was slightly higher than that on weekends, the mean difference between them was nonsignificant.
- 2.
With the increase in PM2.5 concentration, there is an increasing trend of NOR and SOR, which indicates that the formation of and increases obviously, and the increase in RH will promote the formation of and . Using the ISORROPIA-II thermodynamic equilibrium model, it is found that NSA in aerosols are more likely to combine with AWC, which indicates that the aqueous environment of aerosols plays an important role in promoting the formation of NSA. The analysis of the interaction between NSA also confirmed that will first combine with to form (NH4)2SO4, and the remaining will combine with to form NH4NO3. The sensitivity analysis of NSA concentration shows that reducing NOx and SO2 is beneficial to reducing NSA contribution in PM2.5, but their changes also have an important impact on the pH of aerosols.
- 3.
Local emissions and regional transport of NSA gaseous precursors have an important impact on air pollution in Chengdu. When pollution is aggravated, the contributions of NOx and SO2 to local emissions are relatively obvious. In addition to the local emission of NH3, the contribution of pollution sources around Chengdu is also relatively obvious. PSCF analysis shows that the potential sources of pollution transmission in Chengdu are mainly distributed in Sichuan Province, and the most prominent contribution is made in Sichuan Basin, especially among the cities around Chengdu. The analysis of local emissions and regional transport shows that it is necessary to implement joint prevention and control of air pollution in the Sichuan Basin.
The data are available on request to the corresponding author.
The supplement related to this article is available online at: https://doi.org/10.5194/acp-20-11181-2020-supplement.
XL, QT and LK designed and led this study. QT and MF were responsible for the observations. LK, MF, YL, YZ, CZ and CL analyzed the data. LK, YQ, JA, NC, YD, RZ and ZW discussed the results. LK and XL wrote the paper. All authors commented on the paper.
The authors declare that they have no conflict of interest.
This article is part of the special issue “Multiphase chemistry of secondary aerosol formation under severe haze”. It does not belong to a conference.
This work was supported by the People's Republic of China Science and Technology Department (no. 2018YFC0214001, no. 2016YFC0202000 and no. 2019YFC0214200).
This research has been supported by the People's Republic of China Science and Technology Department (grant no. 2018YFC0214001), the People's Republic of China Science and Technology Department (grant no. 2016YFC0202000) and the People's Republic of China Science and Technology Department (grant no. 2019YFC0214200).
This paper was edited by Daniel Knopf and reviewed by two anonymous referees.
An, Z., Huang, R. J., Zhang, R., Tie, X., Li, G., Cao, J., Zhou, W., Shi, Z., Han, Y., Gu, Z., and Ji, Y.: Severe haze in northern China: A synergy of anthropogenic emissions and atmospheric processes, P. Natl. Acad. Sci. USA, 116, 8657–8666, https://doi.org/10.1073/pnas.1900125116, 2019.
Beijing Municipal Ecology and Environment Bureau: Beijing Environmental Statement, available at: http://sthjj.beijing.gov.cn/ (last access: 17 June 2020), 2018
Chang, X., Wang, S., Zhao, B., Cai, S., and Hao, J.: Assessment of inter-city transport of particulate matter in the Beijing–Tianjin–Hebei region, Atmos. Chem. Phys., 18, 4843–4858, https://doi.org/10.5194/acp-18-4843-2018, 2018.
Chen, L., Zhu, J., Liao, H., Gao, Y., Qiu, Y., Zhang, M., Liu, Z., Li, N., and Wang, Y.: Assessing the formation and evolution mechanisms of severe haze pollution in the Beijing–Tianjin–Hebei region using process analysis, Atmos. Chem. Phys., 19, 10845–10864, https://doi.org/10.5194/acp-19-10845-2019, 2019.
Chen, Z., Chen, D., Wen, W., Zhuang, Y., Kwan, M.-P., Chen, B., Zhao, B., Yang, L., Gao, B., Li, R., and Xu, B.: Evaluating the “2+26” regional strategy for air quality improvement during two air pollution alerts in Beijing: variations in PM2.5 concentrations, source apportionment, and the relative contribution of local emission and regional transport, Atmos. Chem. Phys., 19, 6879–6891, https://doi.org/10.5194/acp-19-6879-2019, 2019.
Cheng, J., Su, J., Cui, T., Li, X., Dong, X., Sun, F., Yang, Y., Tong, D., Zheng, Y., Li, Y., Li, J., Zhang, Q., and He, K.: Dominant role of emission reduction in PM2.5 air quality improvement in Beijing during 2013–2017: a model-based decomposition analysis, Atmos. Chem. Phys., 19, 6125–6146, https://doi.org/10.5194/acp-19-6125-2019, 2019.
Cheng, Y., Zheng, G., Wei, C., Mu, Q., Zheng, B., Wang, Z., Gao, M., Zhang, Q., He, K., Carmichael, G., Poschl, U., and Su, H.: Reactive nitrogen chemistry in aerosol water as a source of sulfate during haze events in China, Science Advances, 2, e1601530, https://doi.org/10.1126/sciadv.1601530, 2016.
Chengdu Municipal Ecology and Environment Bureau: Ambient air quality report, available at: http://sthj.chengdu.gov.cn/ (last access: 17 June 2020), 2018.
Ding, J., Zhao, P., Su, J., Dong, Q., Du, X., and Zhang, Y.: Aerosol pH and its driving factors in Beijing, Atmos. Chem. Phys., 19, 7939–7954, https://doi.org/10.5194/acp-19-7939-2019, 2019.
Fountoukis, C. and Nenes, A.: ISORROPIA II: a computationally efficient thermodynamic equilibrium model for K+–Ca2+–Mg2+––Na+–––Cl−-H2O aerosols, Atmos. Chem. Phys., 7, 4639–4659, https://doi.org/10.5194/acp-7-4639-2007, 2007.
Fountoukis, C., Nenes, A., Sullivan, A., Weber, R., Van Reken, T., Fischer, M., Matías, E., Moya, M., Farmer, D., and Cohen, R. C.: Thermodynamic characterization of Mexico City aerosol during MILAGRO 2006, Atmos. Chem. Phys., 9, 2141–2156, https://doi.org/10.5194/acp-9-2141-2009, 2009.
Fu, G. Q., Xu, W. Y., Yang, R. F., Li, J. B., and Zhao, C. S.: The distribution and trends of fog and haze in the North China Plain over the past 30 years, Atmos. Chem. Phys., 14, 11949–11958, https://doi.org/10.5194/acp-14-11949-2014, 2014.
Geng, G., Xiao, Q., Zheng, Y., Tong, D., Zhang, Y., Zhang, X., Zhang, Q., He, K., and Liu, Y.: Impact of China's Air Pollution Prevention and Control Action Plan on PM2.5 chemical composition over eastern China, Sci. China Earth Sci., 62, 1872–1884, https://doi.org/10.1007/s11430-018-9353-x, 2019.
Gui, K., Che, H., Wang, Y., Wang, H., Zhang, L., Zhao, H., Zheng, Y., Sun, T., and Zhang, X.: Satellite-derived PM2.5 concentration trends over Eastern China from 1998 to 2016: Relationships to emissions and meteorological parameters, Environ. Pollut., 247, 1125–1133, https://doi.org/10.1016/j.envpol.2019.01.056, 2019.
Guo, H., Sullivan, A. P., Campuzano-Jost, P., Schroder, J. C., Lopez-Hilfiker, F. D., Dibb, J. E., Jimenez, J. L., Thornton, J. A., Brown, S. S., Nenes, A., and Weber, R. J.: Fine particle pH and the partitioning of nitric acid during winter in the northeastern United States, J. Geophys. Res.-Atmos., 121, 10355–10376, https://doi.org/10.1002/2016JD025311, 2016.
Guo, H., Liu, J., Froyd, K. D., Roberts, J. M., Veres, P. R., Hayes, P. L., Jimenez, J. L., Nenes, A., and Weber, R. J.: Fine particle pH and gas–particle phase partitioning of inorganic species in Pasadena, California, during the 2010 CalNex campaign, Atmos. Chem. Phys., 17, 5703–5719, https://doi.org/10.5194/acp-17-5703-2017, 2017.
Guo, J., Xia, F., Zhang, Y., Liu, H., Li, J., Lou, M., He, J., Yan, Y., Wang, F., Min, M., and Zhai, P.: Impact of diurnal variability and meteorological factors on the PM2.5-AOD relationship: Implications for PM2.5 remote sensing, Environ. Pollut., 221, 94–104, https://doi.org/10.1016/j.envpol.2016.11.043, 2017.
Guo, S., Hu, M., Zamora, M. L., Peng, J., Shang, D., Zheng, J., Du, Z., Wu, Z., Shao, M., Zeng, L., Molina, M. J., and Zhang, R.: Elucidating severe urban haze formation in China, P. Natl. Acad. Sci. USA, 111, 17373–17378, https://doi.org/10.1073/pnas.1419604111, 2014.
He, H., Wang, Y., Ma, Q., Ma, J., Chu, B., Ji, D., Tang, G., Liu, C., Zhang, H., and Hao, J.: Mineral dust and NOx promote the conversion of SO2 to sulfate in heavy pollution days, Sci. Rep.-UK, 4, 4172, https://doi.org/10.1038/srep04172, 2014.
Huang, R. J., Zhang, Y., Bozzetti, C., Ho, K. F., Cao, J. J., Han, Y., Daellenbach, K. R., Slowik, J. G., Platt, S. M., Canonaco, F., Zotter, P., Wolf, R., Pieber, S. M., Bruns, E. A., Crippa, M., Ciarelli, G., Piazzalunga, A., Schwikowski, M., Abbaszade, G., Schnelle-Kreis, J., Zimmermann, R., An, Z., Szidat, S., Baltensperger, U., El Haddad, I., and Prevot, A. S.: High secondary aerosol contribution to particulate pollution during haze events in China, Nature, 514, 218–222, https://doi.org/10.1038/nature13774, 2014.
Ji, D., Yan, Y., Wang, Z., He, J., Liu, B., Sun, Y., Gao, M., Li, Y., Cao, W., Cui, Y., Hu, B., Xin, J., Wang, L., Liu, Z., Tang, G., and Wang, Y.: Two-year continuous measurements of carbonaceous aerosols in urban Beijing, China: Temporal variations, characteristics and source analyses, Chemosphere, 200, 191–200, https://doi.org/10.1016/j.chemosphere.2018.02.067, 2018.
Ji, D., Gao, W., Maenhaut, W., He, J., Wang, Z., Li, J., Du, W., Wang, L., Sun, Y., Xin, J., Hu, B., and Wang, Y.: Impact of air pollution control measures and regional transport on carbonaceous aerosols in fine particulate matter in urban Beijing, China: insights gained from long-term measurement, Atmos. Chem. Phys., 19, 8569–8590, https://doi.org/10.5194/acp-19-8569-2019, 2019.
Kong, L., Hu, M., Tan, Q., Feng, M., Qu, Y., An, J., Zhang, Y., Liu, X., Cheng, N., Deng, Y., Zhai, R., and Wang, Z.: Key role of atmospheric water content in the formation of regional haze in southern China, Atmos. Environ., 216, 116918, https://doi.org/10.1016/j.atmosenv.2019.116918, 2019.
Kong, L., Hu, M., Tan, Q., Feng, M., Qu, Y., An, J., Zhang, Y., Liu, X., and Cheng, N.: Aerosol optical properties under different pollution levels in the Pearl River Delta (PRD) region of China, J. Environ. Sci.-China, 87, 49–59, https://doi.org/10.1016/j.jes.2019.02.019, 2020.
Li, K., Jacob, D. J., Liao, H., Zhu, J., Shah, V., Shen, L., Bates, K. H., Zhang, Q., and Zhai, S.: A two-pollutant strategy for improving ozone and particulate air quality in China, Nat. Geosci., 12, 906–910, https://doi.org/10.1038/s41561-019-0464-x, 2019.
Li, L., Tan, Q., Zhang, Y., Feng, M., Qu, Y., An, J., and Liu, X.: Characteristics and source apportionment of PM2.5 during persistent extreme haze events in Chengdu, southwest China, Environ. Pollut., 230, 718–729, https://doi.org/10.1016/j.envpol.2017.07.029, 2017.
Li, M., Wang, T., Xie, M., Li, S., Zhuang, B., Huang, X., Chen, P., Zhao, M., and Liu, J.: Formation and Evolution Mechanisms for Two Extreme Haze Episodes in the Yangtze River Delta Region of China During Winter 2016, J. Geophys. Res.-Atmos, 124, 3607–3623, https://doi.org/10.1029/2019JD030535, 2019.
Li, Y., Ye, C., Liu, J., Zhu, Y., Wang, J., Tan, Z., Lin, W., Zeng, L., and Zhu, T.: Observation of regional air pollutant transport between the megacity Beijing and the North China Plain, Atmos. Chem. Phys., 16, 14265–14283, https://doi.org/10.5194/acp-16-14265-2016, 2016.
Liu, K., Wu, Q., Wang, L., Wang, S., Liu, T., Ding, D., Tang, Y., Li, G., Tian, H., Duan, L., Wang, X., Fu, X., Feng, X., and Hao, J.: Measure-Specific Effectiveness of Air Pollution Control on China's Atmospheric Mercury Concentration and Deposition during 2013–2017, Environ. Sci. Technol., 53, 8938–8946, https://doi.org/10.1021/acs.est.9b02428, 2019.
Liu, L., Zhang, X., Wong, A. Y. H., Xu, W., Liu, X., Li, Y., Mi, H., Lu, X., Zhao, L., Wang, Z., Wu, X., and Wei, J.: Estimating global surface ammonia concentrations inferred from satellite retrievals, Atmos. Chem. Phys., 19, 12051–12066, https://doi.org/10.5194/acp-19-12051-2019, 2019.
Liu, M., Huang, X., Song, Y., Tang, J., Cao, J., Zhang, X., Zhang, Q., Wang, S., Xu, T., Kang, L., Cai, X., Zhang, H., Yang, F., Wang, H., Yu, J. Z., Lau, A. K. H., He, L., Huang, X., Duan, L., Ding, A., Xue, L., Gao, J., Liu, B., and Zhu, T.: Ammonia emission control in China would mitigate haze pollution and nitrogen deposition, but worsen acid rain, P. Natl. Acad. Sci. USA, 116, 7760–7765, https://doi.org/10.1073/pnas.1814880116, 2019.
Liu, X., Zhang, Y., Cheng, Y., Hu, M., and Han, T.: Aerosol hygroscopicity and its impact on atmospheric visibility and radiative forcing in Guangzhou during the 2006 PRIDE-PRD campaign, Atmos. Environ., 60, 59–67, https://doi.org/10.1016/j.atmosenv.2012.06.016, 2012.
Liu, X. G., Li, J., Qu, Y., Han, T., Hou, L., Gu, J., Chen, C., Yang, Y., Liu, X., Yang, T., Zhang, Y., Tian, H., and Hu, M.: Formation and evolution mechanism of regional haze: a case study in the megacity Beijing, China, Atmos. Chem. Phys., 13, 4501–4514, https://doi.org/10.5194/acp-13-4501-2013, 2013.
Liu, X., Zhang, Y., Han, W., Tang, A., Shen, J., Cui, Z., Vitousek, P., Erisman, J. W., Goulding, K., Christie, P., Fangmeier, A., and Zhang, F.: Enhanced nitrogen deposition over China, Nature, 494, 459–462, https://doi.org/10.1038/nature11917, 2013.
Liu, Y., Zheng, M., Yu, M., Cai, X., Du, H., Li, J., Zhou, T., Yan, C., Wang, X., Shi, Z., Harrison, R. M., Zhang, Q., and He, K.: High-time-resolution source apportionment of PM2.5 in Beijing with multiple models, Atmos. Chem. Phys., 19, 6595–6609, https://doi.org/10.5194/acp-19-6595-2019, 2019.
Malm, W. C., and Hand, J. L.: An examination of the physical and optical properties of aerosols collected in the IMPROVE program, Atmos. Environ., 41, 3407–3427, https://doi.org/10.1016/j.atmosenv.2006.12.012, 2007.
Meier, J., Wehner, B., Massling, A., Birmili, W., Nowak, A., Gnauk, T., Brüggemann, E., Herrmann, H., Min, H., and Wiedensohler, A.: Hygroscopic growth of urban aerosol particles in Beijing (China) during wintertime: a comparison of three experimental methods, Atmos. Chem. Phys., 9, 6865–6880, https://doi.org/10.5194/acp-9-6865-2009, 2009.
Ministry of Ecology and Environment of the People's Republic of China: Detailed regulations for the implementation of air pollution control action plan in Beijing, Tianjin, Hebei and surrounding areas, available at: http://www.mee.gov.cn/gkml/hbb/bwj/201309/t20130918_260414.htm (last access: 17 June 2020), 2013.
National Aeronautics and Space Administration: Giovanni data, available at: https://giovanni.gsfc.nasa.gov/giovanni/ (last access: 17 June 2020), 2019.
National Oceanic and Atmospheric Administration: HYSPLIT data, available at: ftp://arlftp.arlhq.noaa.gov/pub/archives/gdas1 (last access: 17 June 2020), 2019.
Ohta, S., and Okita, T.: A chemical characterization of atmospheric aerosol in Sapporo, Atmos. Environ. A-Gen, 24, 815–822, https://doi.org/10.1016/0960-1686(90)90282-R, 1990.
Pan, Y., Tian, S., Liu, D., Fang, Y., Zhu, X., Zhang, Q., Zheng, B., Michalski, G., and Wang, Y.: Fossil Fuel Combustion-Related Emissions Dominate Atmospheric Ammonia Sources during Severe Haze Episodes: Evidence from 15N-Stable Isotope in Size-Resolved Aerosol Ammonium, Environ. Sci. Technol., 50, 8049–8056, https://doi.org/10.1021/acs.est.6b00634, 2016.
Peng, G., Wang, X., Wu, Z., Wang, Z., Yang, L., Zhong, L., and Chen, D.: Characteristics of particulate matter pollution in the Pearl River Delta region, China: an observational-based analysis of two monitoring sites, J. Environ. Monitor., 13, 1927–1934, https://doi.org/10.1039/C0EM00776E, 2011.
Qiao, X., Guo, H., Tang, Y., Wang, P., Deng, W., Zhao, X., Hu, J., Ying, Q., and Zhang, H.: Local and regional contributions to fine particulate matter in the 18 cities of Sichuan Basin, southwestern China, Atmos. Chem. Phys., 19, 5791–5803, https://doi.org/10.5194/acp-19-5791-2019, 2019.
Qin, W., Zhang, Y., Chen, J., Yu, Q., Cheng, S., Li, W., Liu, X., and Tian, H.: Variation, sources and historical trend of black carbon in Beijing, China based on ground observation and MERRA-2 reanalysis data, Environ. Pollut., 245, 853–863, https://doi.org/10.1016/j.envpol.2018.11.063, 2019.
Song, M., Tan, Q., Feng, M., Qu, Y., Liu, X., An, J., and Zhang, Y.: Source apportionment and secondary transformation of atmospheric nonmethane hydrocarbons in Chengdu, southwest China, J. Geophys. Res.-Atmos, 123, 9741–9763, https://doi.org/10.1029/2018JD028479, 2018.
Sun, Y., Zhuang, G., Tang, A. A., Wang, Y., and An, Z.: Chemical characteristics of PM2.5 and PM10 in haze-fog episodes in Beijing, Environ. Sci. Technol., 40, 3148–3155, https://doi.org/10.1021/es051533g, 2006.
Sun, Y., Wang, Z., Fu, P., Jiang, Q., Yang, T., Li, J., and Ge, X.: The impact of relative humidity on aerosol composition and evolution processes during wintertime in Beijing, China, Atmos. Environ., 77, 927–934, https://doi.org/10.1016/j.atmosenv.2013.06.019, 2013.
Sun, Y., Jiang, Q., Wang, Z., Fu, P., Li, J., Yang, T., and Yin, Y.: Investigation of the sources and evolution processes of severe haze pollution in Beijing in January 2013, J. Geophys. Res.-Atmos, 119, 4380–4398, https://doi.org/10.1002/2014JD021641, 2014.
The People's Government of Sichuan Province: Detailed rules for the implementation of the action plan for the prevention and control of air pollution in Sichuan Province 2015 annual implementation plan, available at: http://www.sc.gov.cn/10462/10883/11066/2015/4/22/10333390.shtml (last access: 17 June 2020), 2015.
The People's Government of Sichuan Province: Detailed rules for the implementation of the action plan for the prevention and control of air pollution in Sichuan Province 2016 annual implementation plan, available at: http://www.sc.gov.cn/zcwj/xxgk/NewT.aspx?i=20160401095908-612769-00-000 (last access: 17 June 2020), 2016.
The People's Government of Sichuan Province: Detailed rules for the implementation of the action plan for the prevention and control of air pollution in Sichuan Province 2017 annual implementation plan, available at: http://www.sc.gov.cn/zcwj/xxgk/NewT.aspx?i=20170527091543-450025-00-000 (last access: 17 June 2020), 2017.
the Sate Council: Three-Year Action Plan for Winning the Blue Sky Defense Battle, available at: http://www.gov.cn/zhengce/content/2018-07/03/content_5303158.htm (last access: 17 June 2020), 2018.
Tian, Y., Xiao, Z., Wang, H., Xing, P., Liao, G., Huangfu, Y., Shi, G., Chen, K., Bi, X., and Feng, Y.: Influence of the sampling period and time resolution on the PM source apportionment: Study based on the high time-resolution data and long-term daily data, Atmos. Environ., 165, 301–309, https://doi.org/10.1016/j.atmosenv.2017.07.003, 2017.
Tie, X., Wu, D., and Brasseur, G.: Lung cancer mortality and exposure to atmospheric aerosol particles in Guangzhou, China, Atmos. Environ., 43, 2375–2377, https://doi.org/10.1016/j.atmosenv.2009.01.036, 2009.
Tie, X., Huang, R. J., Cao, J., Zhang, Q., Cheng, Y., Su, H., Chang, D., Poschl, U., Hoffmann, T., Dusek, U., Li, G., Worsnop, D. R., and O'Dowd, C. D.: Severe Pollution in China Amplified by Atmospheric Moisture, Sci. Rep.-UK, 7, 15 760, https://doi.org/10.1038/s41598-017-15909-1, 2017.
Tong, D., Geng, G., Jiang, K., Cheng, J., Zheng, Y., Hong, C., Yan, L., Zhang, Y., Chen, X., Bo, Y., Lei, Y., Zhang, Q., and He, K.: Energy and emission pathways towards PM2.5 air quality attainment in the Beijing-Tianjin-Hebei region by 2030, Sci. Total Environ., 692, 361–370, https://doi.org/10.1016/j.scitotenv.2019.07.218, 2019.
Uria-Tellaetxe, I., and Carslaw, D. C.: Conditional bivariate probability function for source identification, Environ. Modell. Softw., 59, 1–9, https://doi.org/10.1016/j.envsoft.2014.05.002, 2014.
Walker, J. T., Whitall, D. R., Robarge, W., and Paerl, H. W.: Ambient ammonia and ammonium aerosol across a region of variable ammonia emission density, Atmos. Environ., 38, 1235–1246, https://doi.org/10.1016/j.atmosenv.2003.11.027, 2004.
Wang, G., Zhang, R., Gomez, M. E., Yang, L., Levy, Z. M., Hu, M., Lin, Y., Peng, J., Guo, S., Meng, J., and Li, J.: Persistent sulfate formation from London Fog to Chinese haze, Proceedings of the National Academy Ofences of the United States of America, 48, 13630–13635, https://doi.org/10.1073/pnas.1616540113, 2016.
Wang, L., Li, W., Sun, Y., Tao, M., Xin, J., Song, T., Li, X., Zhang, N., Ying, K., and Wang, Y.: PM2.5 Characteristics and Regional Transport Contribution in Five Cities in Southern North China Plain, During 2013–2015, Atmosphere, 9, 157, https://doi.org/10.3390/atmos9040157, 2018.
Wang, Q., Zhuang, G., Kan, H., Liu, T., Deng, C., Jian, X., Lin, Y., Guo, Z., Ying, C., and Fu, Q.: Probing the severe haze pollution in three typical regions of China: Characteristics, sources and regional impacts, Atmos. Environ., 120, 76–88, https://doi.org/10.1016/j.atmosenv.2015.08.076, 2015.
Wang, Y., Li, W., Gao, W., Liu, Z., Tian, S., Shen, R., Ji, D., Wang, S., Wang, L., Tang, G., Song, T., Cheng, M., Wang, G., Gong, Z., Hao, J., and Zhang, Y.: Trends in particulate matter and its chemical compositions in China from 2013–2017, Sci. China Earth Sci., 62, 1857–1871, https://doi.org/10.1007/s11430-018-9373-1, 2019.
Wang, Y. Q., Zhang, X. Y., and Draxler, R. R.: TrajStat: GIS-based software that uses various trajectory statistical analysis methods to identify potential sources from long-term air pollution measurement data, Environmental Modelling and Software, 24, 938–939, https://doi.org/10.1016/j.envsoft.2009.01.004, 2009.
Yang, Y. R., Liu, X. G., Qu, Y., An, J. L., Jiang, R., Zhang, Y. H., Sun, Y. L., Wu, Z. J., Zhang, F., Xu, W. Q., and Ma, Q. X.: Characteristics and formation mechanism of continuous hazes in China: a case study during the autumn of 2014 in the North China Plain, Atmos. Chem. Phys., 15, 8165–8178, https://doi.org/10.5194/acp-15-8165-2015, 2015.
Yang, Y., Liu, X., Qu, Y., Wang, J., An, J., Zhang, Y., and Zhang, F.: Formation mechanism of continuous extreme haze episodes in the megacity Beijing, China, in January 2013, Atmos. Res., 155, 192–203, https://doi.org/10.1016/j.atmosres.2014.11.023, 2015.
Yao, L., Garmash, O., Bianchi, F., Zheng, J., Yan, C., Kontkanen, J., Junninen, H., Mazon, S. B., Ehn, M., Paasonen, P., Sipila, M., Wang, M., Wang, X., Xiao, S., Chen, H., Lu, Y., Zhang, B., Wang, D., Fu, Q., Geng, F., Li, L., Wang, H., Qiao, L., Yang, X., Chen, J., Kerminen, V.-M., Petaja, T., Worsnop, D. R., Kulmala, M., and Wang, L.: Atmospheric new particle formation from sulfuric acid and amines in a Chinese megacity, Science, 361, 278–281, https://doi.org/10.1126/science.aao4839, 2018.
Zhang, H., Cheng, S., Li, J., Yao, S., and Wang, X.: Investigating the aerosol mass and chemical components characteristics and feedback effects on the meteorological factors in the Beijing-Tianjin-Hebei region, China, Environmental Pollution, 244, 495–502, https://doi.org/10.1016/j.envpol.2018.10.087, 2019.
Zhang, L., Guo, X., Zhao, T., Gong, S., Xu, X., Li, Y., Luo, L., Gui, K., Wang, H., Zheng, Y., and Yin, X.: A modelling study of the terrain effects on haze pollution in the Sichuan Basin, Atmos. Environ., 196, 77–85, https://doi.org/10.1016/j.atmosenv.2018.10.007, 2019.
Zhang, R., Wang, G., Guo, S., Zamora, M. L., Ying, Q., Lin, Y., Wang, W., Hu, M., and Wang, Y.: Formation of urban fine particulate matter, Chemical Reviews, 115, 3803–3855, https://doi.org/10.1021/acs.chemrev.5b00067, 2015.
Zhang, Y., Chen, J., Yang, H., Li, R., and Yu, Q.: Seasonal variation and potential source regions of PM2.5-bound PAHs in the megacity Beijing, China: Impact of regional transport, Environ. Pollut., 231, 329–338, https://doi.org/10.1016/j.envpol.2017.08.025, 2017.
Zhang, Y., Xue, M., Zhu, K., and Zhou, B.: What Is the Main Cause of Diurnal Variation and Nocturnal Peak of Summer Precipitation in Sichuan Basin, China? The Key Role of Boundary Layer Low-Level Jet Inertial Oscillations, J. Geophys. Res.-Atmos, 124, 2643–2664, https://doi.org/10.1029/2018JD029834, 2019.
Zhao, B., Zheng, H., Wang, S., Smith, K. R., Lu, X., Aunan, K., Gu, Y., Wang, Y., Ding, D., Xing, J., Fu, X., Yang, X., Liou, K.-N., and Hao, J.: Change in household fuels dominates the decrease in PM2.5 exposure and premature mortality in China in 2005–2015, P. Natl. Acad. Sci. USA, 115, 12401–12406, https://doi.org/10.1073/pnas.1812955115, 2018.
Zhao, H., Li, X., Zhang, Q., Jiang, X., Lin, J., Peters, G. P., Li, M., Geng, G., Zheng, B., Huo, H., Zhang, L., Wang, H., Davis, S. J., and He, K.: Effects of atmospheric transport and trade on air pollution mortality in China, Atmos. Chem. Phys., 17, 10367–10381, https://doi.org/10.5194/acp-17-10367-2017, 2017.
Zheng, G., Duan, F., Ma, Y., Zhang, Q., Huang, T., Kimoto, T., Cheng, Y., Su, H., and He, K.: Episode-Based Evolution Pattern Analysis of Haze Pollution: Method Development and Results from Beijing, China, Environ. Sci. Technol., 50, 4632–4641, https://doi.org/10.1021/acs.est.5b05593, 2016.
Zheng, H., Kong, S. F., Yan, Q., Wu, F. Q., Cheng, Y., Zheng, S. R., Wu, J., Yang, G. W., Zheng, M. M., Tang, L. L., Yin, Y., Chen, K., Zhao, T. L., Liu, D. T., Li, S. L., Qi, S. H., Zhao, D. L., Zhang, T., Ruan, J. J., and Huang, M. Z.: The impacts of pollution control measures on PM2.5 reduction: Insights of chemical composition, source variation and health risk, Atmos. Environ., 197, 103–117, https://doi.org/10.1016/j.atmosenv.2018.10.023, 2019.
Zhong, J., Zhang, X., Wang, Y., Wang, J., Shen, X., Zhang, H., Wang, T., Xie, Z., Liu, C., Zhang, H., Zhao, T., Sun, J., Fan, S., Gao, Z., Li, Y., and Wang, L.: The two-way feedback mechanism between unfavorable meteorological conditions and cumulative aerosol pollution in various haze regions of China, Atmos. Chem. Phys., 19, 3287–3306, https://doi.org/10.5194/acp-19-3287-2019, 2019.
Zhu, J., Chen, L., Liao, H., and Dang, R.: Correlations between PM2.5 and Ozone over China and Associated Underlying Reasons, Atmosphere, 10, 352, https://doi.org/10.3390/atmos10070352, 2019.