the Creative Commons Attribution 4.0 License.
the Creative Commons Attribution 4.0 License.
 | 15 Sep 2020
Measurements of carbonyl compounds around the Arabian Peninsula: overview and model comparison
Achim Edtbauer
Christof Stönner
Andrea Pozzer
Efstratios Bourtsoukidis
Lisa Ernle
Dirk Dienhart
Bettina Hottmann
Horst Fischer
Jan Schuladen
John N. Crowley
Jean-Daniel Paris
Jos Lelieveld
Jonathan Williams
Volatile organic compounds (VOCs) were measured around the Arabian Peninsula using a research vessel during the AQABA campaign (Air Quality and Climate Change in the Arabian Basin) from June to August 2017. In this study we examine carbonyl compounds, measured by a proton transfer reaction mass spectrometer (PTR-ToF-MS), and present both a regional concentration distribution and a budget assessment for these key atmospheric species. Among the aliphatic carbonyls, acetone had the highest mixing ratios in most of the regions traversed, varying from 0.43 ppb over the Arabian Sea to 4.5 ppb over the Arabian Gulf, followed by formaldehyde (measured by a Hantzsch monitor, 0.82 ppb over the Arabian Sea and 3.8 ppb over the Arabian Gulf) and acetaldehyde (0.13 ppb over the Arabian Sea and 1.7 ppb over the Arabian Gulf). Unsaturated carbonyls (C4–C9) varied from 10 to 700 ppt during the campaign and followed similar regional mixing ratio dependence to aliphatic carbonyls, which were identified as oxidation products of cycloalkanes over polluted areas. We compared the measurements of acetaldehyde, acetone, and methyl ethyl ketone to global chemistry-transport model (ECHAM5/MESSy Atmospheric Chemistry – EMAC) results. A significant discrepancy was found for acetaldehyde, with the model underestimating the measured acetaldehyde mixing ratio by up to an order of magnitude. Implementing a photolytically driven marine source of acetaldehyde significantly improved the agreement between measurements and model, particularly over the remote regions (e.g. Arabian Sea). However, the newly introduced acetaldehyde source was still insufficient to describe the observations over the most polluted regions (Arabian Gulf and Suez), where model underestimation of primary emissions and biomass burning events are possible reasons.
- Article
(2786 KB) - Full-text XML
-
Supplement
(2235 KB) - BibTeX
- EndNote


Carbonyl compounds (aldehydes and ketones) can be released into the air directly from a variety of primary biogenic and anthropogenic sources. These include biomass burning (Holzinger et al., 1999, 2005; Koss et al., 2018), fossil fuel combustion (Reda et al., 2014; Huang et al., 2018) including vehicles (Erickson et al., 2014; Dong et al., 2014), industrial solvent use (Kim et al., 2008), and natural sources including plants and plankton (Zhou and Mopper, 1997; Warneke et al., 1999; Jacob et al., 2002; Fall, 2003; Williams et al., 2004; Bourtsoukidis et al., 2014). However, secondary production via the atmospheric oxidation of hydrocarbons is considered to be more important for many carbonyl compounds including acetone and acetaldehyde (Jacob et al., 2002; Millet et al., 2010).
Carbonyls have several important roles in the atmosphere. They form as stable intermediates directly after hydrocarbon oxidation by hydroxyl radicals, O3, or NO3 when the peroxy radicals initially formed react with each other (permutation reactions) or with NO. Their production is linked to tropospheric ozone formation (Carlier et al., 1986), and their loss, through oxidation and photolysis, is an important source of hydroxyl and hydroperoxyl radicals (HOx) in the dry upper troposphere (Colomb et al., 2006). Carbonyls serve as precursors of peroxyacetyl nitrates (PANs), which are important atmospheric NOx (NO and NO2) reservoir species (Finlayson-Pitts and Pitts, 1997; Edwards et al., 2014; Williams et al., 2000). Carbonyl compounds are also important for the growth of atmospheric particles (Kroll et al., 2005), thereby indirectly impacting the Earth's radiative balance. The atmospheric lifetimes of carbonyl compounds vary considerably, from less than 1 d for acetaldehyde (Millet et al., 2010) to more than 15 d for acetone (Jacob et al., 2002; Khan et al., 2015) in terms of tropospheric mean lifetime. A multi-day lifetime means that carbonyl compounds can impact the air chemistry on local, regional, and even hemispheric scales. The numerous primary and secondary sources of carbonyl compounds as well as their multiple loss routes (photolysis, OH, NO3, and O3 oxidation) make budget assessments difficult.
The most predominant atmospheric carbonyl compounds besides formaldehyde are acetaldehyde and acetone. They have been reported to vary from tens or hundreds of ppt in remote areas (Warneke and de Gouw, 2001; Wisthaler, 2002; Lewis et al., 2005; White et al., 2008; Colomb et al., 2009; Read et al., 2012; Sjostedt et al., 2012; Tanimoto et al., 2014; Yang et al., 2014; Hornbrook et al., 2016; Wang et al., 2019) to several ppb in urban and polluted areas (Dolgorouky et al., 2012; Guo et al., 2013; Stoeckenius and McNally, 2014; Koss et al., 2015; Sahu et al., 2017; Sheng et al., 2018). Generally, secondary photochemical formation from various precursors is the main source of those carbonyl compounds. However, several recent studies have shown that acetaldehyde mixing ratios in both the remote marine boundary layer and the free troposphere could not be explained by known photochemistry as implemented in various atmospheric chemistry models, which consistently underestimated the measurements by an order of magnitude or more (Singh et al., 2003; Read et al., 2012; Wang et al., 2019). Several potential additional acetaldehyde sources have been proposed, including new hydrocarbon oxidation mechanisms, aerosol-related sources, and oceanic sources. One possible source of acetaldehyde in the remote marine boundary layer is oceanic emission from the photodegradation of coloured dissolved organic matter (CDOM) in sea-surface water, where acetaldehyde could be produced together with other low-molecular-weight carbonyl compounds (Kieber et al., 1990; Zhou and Mopper, 1997; Sinha et al., 2007; Dixon et al., 2013). Nevertheless, due to both limited airborne and seawater measurements of acetaldehyde, the importance of oceanic emission is still under debate (Millet et al., 2010; Wang et al., 2019). In order to better understand the atmospheric budgets of acetaldehyde (and the other carbonyl compounds), it is informative to analyse a dataset of multiple carbonyl compounds in both polluted and clean environments, with influence from marine emissions, varying particulate loadings, and high rates of oxidation as shown in Fig. 1, which demonstrates the main formation pathways of acetaldehyde during this campaign.
During the AQABA (Air Quality and Climate Change in the Arabian Basin) shipborne research campaign, carbonyl compounds were continuously measured by PTR-ToF-MS onboard a research vessel that circumnavigated the Arabian Peninsula. During the campaign, chemically distinct air masses were sampled, which had been influenced by primary emissions of hydrocarbons and inorganic pollutants (NOx, SO2, and CO) from petroleum industries and marine transport (Bourtsoukidis et al., 2019; Celik et al., 2019), by pollution from urban areas (Pfannerstill et al., 2019), and clean marine-influenced air (Edtbauer et al., 2020). It is a unique dataset of carbonyl compounds encompassing starkly different environmental conditions from a region with few (or no) available in situ measurements to date.
In this study, we provide an overview of carbonyl compound mixing ratios (aliphatic, unsaturated, and aromatic) over the Mediterranean Sea, Suez, Red Sea, Arabian Sea, and Arabian Gulf. Using an empirical method based on measured hydrocarbon precursors, we have analysed the relative importance of the photochemical sources of the carbonyl compounds observed. The analysis is then extended to include sources and transport by using an EMAC global model (5th generation European Centre – Hamburg general model, ECHAM5, coupled to the modular earth submodel system, MESSy, applied to atmospheric chemistry). Model measurement differences are investigated in both clean and polluted regions, with particular emphasis on acetaldehyde.
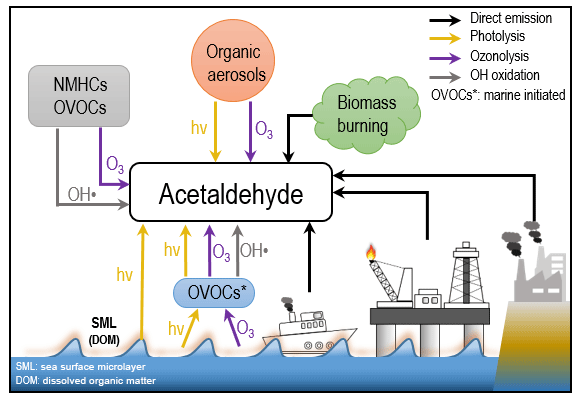
Figure 1Diagram of possible sources and formation pathways of acetaldehyde during the AQABA campaign.
2.1 AQABA campaign
The AQABA campaign was conducted onboard R/V Kommandor Iona (KI) from the end of June to the end of August 2017. The ship started from southern France, proceeded across the Mediterranean, through the Suez Canal, around the Arabian Peninsula into the Arabian Gulf, and on to Kuwait, thereafter returning along the same route. Five laboratory containers were loaded onto the vessel, containing multiple gas- and particle-phase measurement instruments as well as a weather station.
2.2 PTR-ToF-MS
2.2.1 Sampling and instrument set-up
A high-flow inlet (stainless steel tubing, 0.2 m diameter, 5.5 m tall, and 3 m above the top of the containers and the front deck) was installed at the front of the ship where the laboratory containers were located. A high flow of air (approximately 10 m3 min−1) was drawn through the inlet, which provided a common attachment point for sub-sampling lines for all gas-phase measurement instruments. An air flow of 5 standard L min−1 for the first leg and 3.5 standard L min−1 for the second leg was pumped into the onboard lab container through an (O.D. = 1.27 cm) FEP (fluorinated ethylene propylene) tubing (about 10 m long) insulated and heated to 50–60 ∘C. A PTFE (polytetrafluoroethylene) filter was placed at the beginning of the inlet to prevent insects, dust, and particles from entering the instruments. Every 2–5 d, the filter was replaced depending on the degree of pollution encountered. Inside the volatile organic compound (VOC) instrument container, the PTR-ToF-MS (8000, Ionicon Analytik GmbH Innsbruck, Austria) sampled a sub-flow at 80–100 sccm through (0.3175 cm) FEP tubing (∼10 m in length, insulated and heated to 60 ∘C) from the main fast air flow and then to the instrument's PEEK (polyether ether ketone) inlet which was likewise heated to 60 ∘C. The inlet system was shared with total OH reactivity measurement (Pfannerstill et al., 2019).
The working principle of PTR-MS has been described in detail in previous studies (Lindinger et al., 1998; Ellis and Mayhew, 2013; Yuan et al., 2017). In brief, H3O+ primary ions are generated in the ion source and then drawn into the drift tube where they interact with sampled ambient air. Inside the drift tube, VOCs with a proton affinity greater than that of H2O (691 kJ mol−1) are protonated by proton transfer from H3O+. The resulting secondary ions are transferred to the detector, in this case a time-of-flight mass spectrometer with mass resolution around 3500 for the first leg and 4500 for the second leg at mass 96 amu. An internal standard of trichlorobenzene (C6H3Cl3) was continuously introduced into the instrument to ensure accurate mass calibration. Every minute a spectrum with mass range (m∕z) 0–450 was generated. The data reported in this study are all at 1 min resolution unless otherwise specified.
2.2.2 Instrument characterization
The instrument background was determined every 3 h for 10 min with synthetic air. Four-point calibrations were performed five times during the whole campaign using a standard gas mixture (Apel-Riemer Environmental inc., Broomfield, USA) containing 14 compounds (methanol, acetonitrile, acetaldehyde, acetone, dimethyl sulfide, isoprene, methyl vinyl ketone, methacrolein, methyl ethyl ketone, benzene, toluene, xylene, 1,3,5-trimethylbenzene, and α-pinene). It has been previously reported that the sensitivities of some compounds measured by PTR-MS are humidity dependent (de Gouw and Warneke, 2007). As the relative humidity (RH) was expected to be high and varying (marine boundary layer with occasional desert air influence), humidity calibration was combined with four-point calibration by humidifying the gas mixture at different levels from 0 % to 100 % RH.
2.2.3 Data analysis
The data were initially processed by the PTR Analyzer software (Müller et al., 2013) to identify and integrate the peaks. After obtaining the raw data (counts per second for each mass identified), a custom-developed python-based program was used to further process the data to final mixing ratios. For compounds present in the standard gas cylinder, interpolated sensitivities based on the five in-campaign calibrations were applied to derive the mixing ratios, while mixing ratios of the other masses were calculated by using a proton transfer reaction rate constant (kPTR) of cm3 s−1. The uncertainty associated with the mixing ratios of the calibrated compounds was around 6 %–17 % (see Table S1). For the mixing ratios derived by assuming kPTR, the accuracy was around ±50 % (Zhao and Zhang, 2004). The detection limit (LOD) was calculated from the background measurement with 3 times the standard deviation (3σ), 52±26 ppt for acetaldehyde, 22±9 ppt for acetone, and 9±6 ppt for methyl ethyl ketone (MEK) (Table S1 in the Supplement). Data below LOD were kept as determined for further statistical analysis (Fig. 2 and Table 1).
In this study, we have interpreted ion masses with the exact masses corresponding to CnH2nO, CnH2n−2O, and CnH2n−8O as aliphatic, unsaturated, and aromatic carbonyls, respectively (see the exact protonated m∕z in Table S2). Carbonyl compounds with a carbon number of three and above can be either aldehydes or ketones, which are not distinguishable with PTR-ToF-MS using H3O+ as the primary ion. However, laboratory experiments have shown that protonated aldehydic ions with carbon atoms more than three tend to lose a H2O molecule and fragment to other masses (Buhr et al., 2002; Spanel et al., 2002). Moreover, although both ketones and aldehydes can be produced via atmospheric oxidation processes, ketones tend to have longer atmospheric lifetimes and higher photochemical yields than aldehydes, as mentioned in the introduction. The ratio of measured propanal to acetone was 0.07 in the western Pacific coastal region (Schlundt et al., 2017), 0.06 in urban Los Angeles (Borbon et al., 2013), and 0.17–0.22 in oil and gas production regions (summarized by Koss et al., 2017). Therefore, signals on the exact mass of carbonyl compounds from the PTR-ToF-MS are expected to be dominated by ketones, particularly in regions remote from the sources.
2.3 Meteorological data and other trace gases
The meteorological data were obtained by using a commercial weather station (Sterela) which monitored wind speed, wind direction, RH, temperature, speed of the vessel, GPS, etc. The actinic flux was measured by a spectral radiometer (Metcon GmbH; Meusel et al., 2016). Non-methane hydrocarbon (NMHC) mixing ratios were measured by a gas chromatograph with a flame ionization detector (GC–FID) online with a time resolution of 50 min. It measured hydrocarbons (C2–C8) and aromatics (C6–C8) with an average LOD<10 ppt for most of the compounds. For a detailed instrumental description, see Bourtsoukidis et al. (2019). Formaldehyde mixing ratios were determined by a modified and optimized version of the commercially available AL4021 (Aero-Laser, Germany), which utilizes the Hantzsch technique (Stickler et al., 2006). Methane and carbon monoxide (CO) levels were monitored by a cavity ring-down spectroscopy analyser (Picarro G2401). Ozone was measured with an absorption photometer (Model 202 Ozone Monitor, 2B Technologies, Boulder, Colorado). Due to the potential interference from sampling our own ship exhaust in which carbonyl compounds may be present (Reda et al., 2014), a filter was applied to the dataset based on the wind direction and NOx, SO2, and ethene levels.
2.4 Model simulations
The EMAC model was used to simulate atmospheric mixing ratios of several carbonyl compounds along the cruise track covered during the AQABA campaign. The EMAC model is an atmospheric chemistry-general circulation model simulating the process of tropospheric air by considering processes which could influence trace-gas mixing ratios, such as transport, chemistry, interaction with ocean/land, and dry deposition (Pozzer et al., 2007, 2012; Lelieveld et al., 2016). The model applied in this study is a combination of the 5th generation of the European Centre Hamburg general circulation model (ECHAM5) (Roeckner et al., 2006) and the 2nd version of the Modular Earth Submodel System (MESSy2) (Jöckel et al., 2010), where a comprehensive chemistry mechanism, MOM (Mainz Organic Mechanism), was deployed (Sander et al., 2019). The model considers direct emissions (such as anthropogenic, biogenic, biomass burning), atmospheric transport and mixing, photochemical production of carbonyls (by OH, O3, and NO3), as well as physical and chemical removal processes. The global fire assimilation system was used for biomass burning emissions (Kaiser et al., 2012). The exchange of organic compounds between ocean and atmosphere was considered in EMAC via the AIRSEA submodel, described in detail in Pozzer et al. (2006). The transfer velocity is calculated online and the concentration in the water is prescribed by the user. For acetone, a constant water concentration of 15 nmol L−1 is used, following the suggestion of Fischer et al. (2012). The model configuration in the study is the same as the model applied in Bourtsoukidis et al. (2020), where a natural non-methane hydrocarbon source (ethane and propane) was implemented. The model is at the resolution of T106L31 (i.e. horizontal resolution and 31 vertical hybrid pressure levels up to 10 hPa) and the time resolution of 10 min. The measurement data of PTR-ToF-MS were averaged to 10 min resolution to match the model data resolution for further comparison.
Around the Arabian Peninsula, the mixing ratios of individual carbonyl compounds varied over a wide range, from tens of ppt to ppb levels. In this study, we divided the dataset geographically into eight regions (Fig. 2, middle graph) to classify and characterize the primary and secondary origins of carbonyl compounds. The regional delineations were the Mediterranean Sea (MS), Suez, Red Sea North (RSN), Red Sea South (RSS), Gulf of Aden (GA), Arabian Sea (AS), Gulf of Oman (GO), and Arabian Gulf (AG), the same as those described by Bourtsoukidis et al. (2019). Figure 2 shows the abundance of aliphatic, aromatic, and unsaturated carbonyl compounds (carbonyls) for each region. Generally, aliphatic carbonyls were present at much higher mixing ratios than aromatic and unsaturated carbonyls, with smaller carbonyl compounds (formaldehyde, acetaldehyde, C3 and C4 carbonyls) dominating the distribution. The mixing ratios of aliphatic carbonyls decreased dramatically from C5 carbonyls with increasing carbon number. The box plots (Fig. 2) also show that carbonyl compounds were measured at higher mixing ratios and were more variable over the Suez region and the Arabian Gulf. The abundance of carbonyl compounds varied markedly from region to region, with the highest and lowest values found in the Arabian Gulf and the Arabian Sea, respectively. Table 1 shows the mean, standard deviation, and the median values for carbonyls in each region. In the following sections, each class of carbonyl compounds is investigated in greater detail.
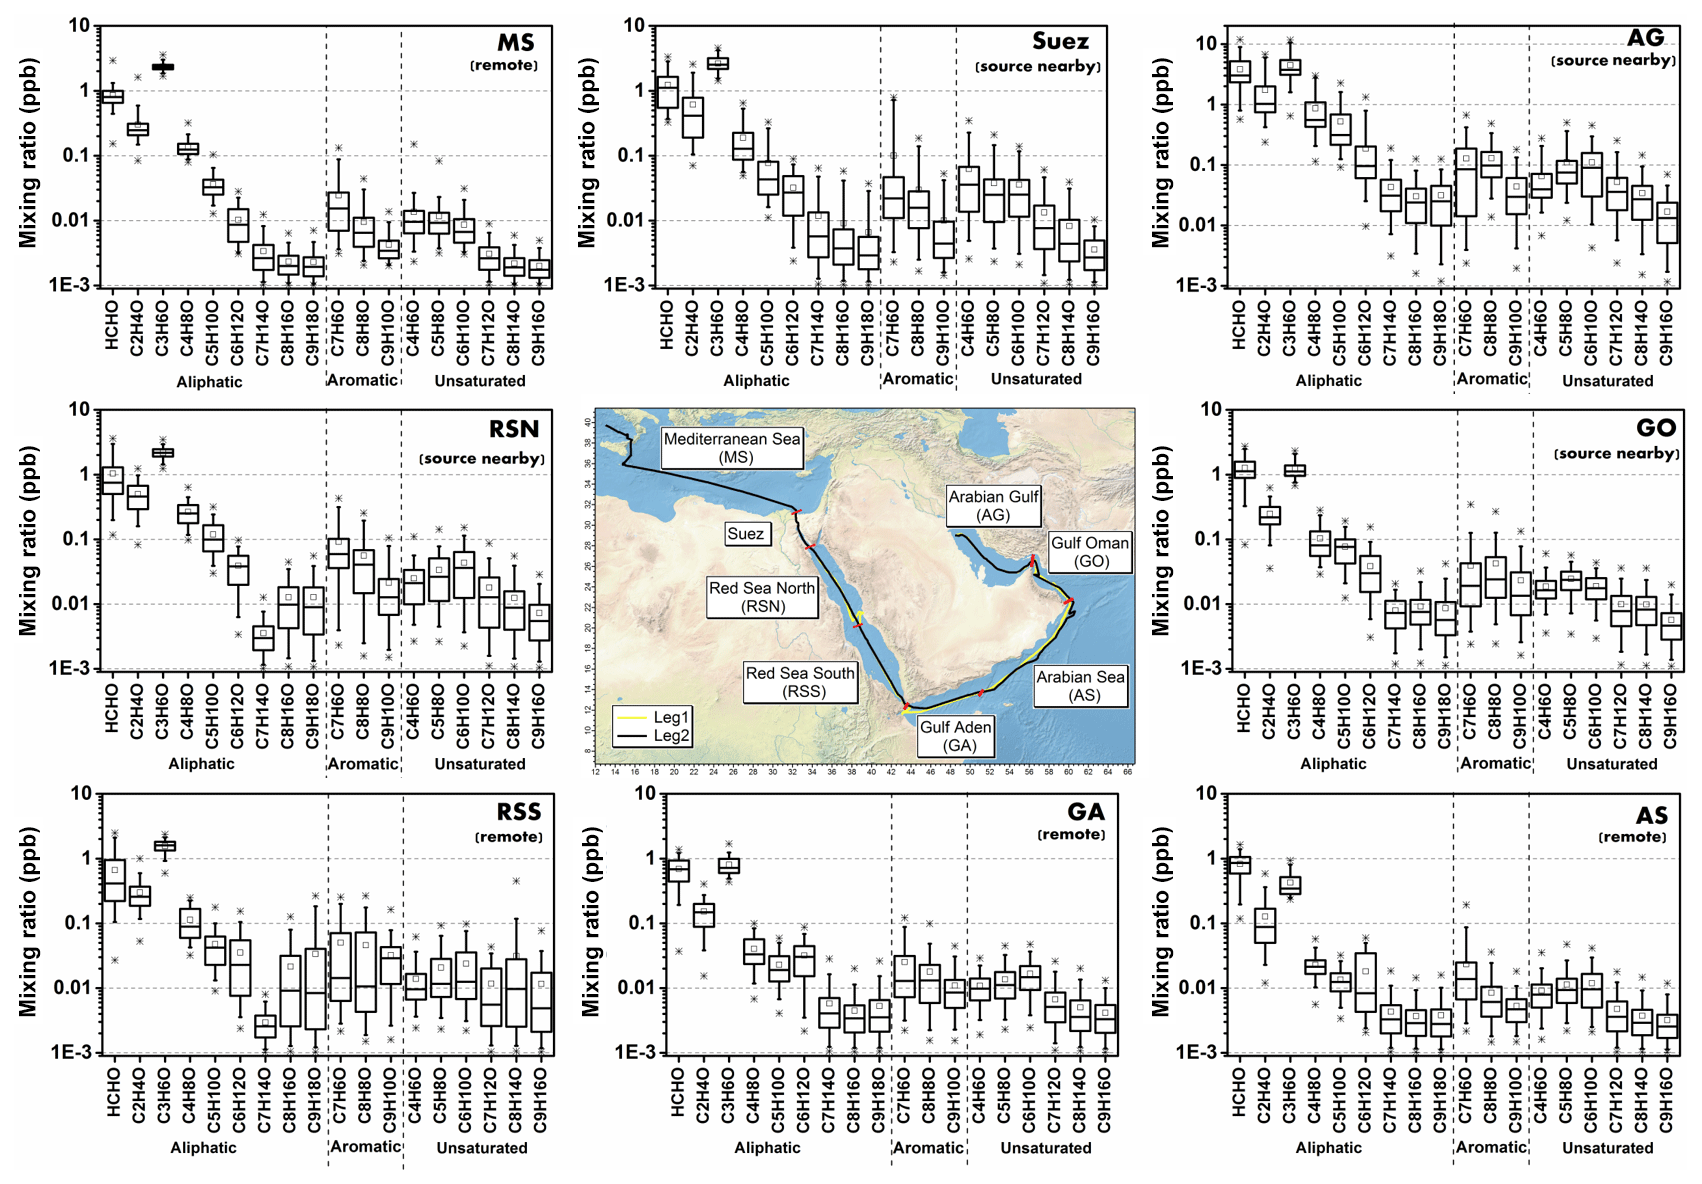
Figure 2Overview of mixing ratios for aliphatic, aromatic, and unsaturated carbonyl compounds (CxHyO). The boxes represent 25 % to 75 % of the data, with the central line and square indicating the median and the mean values, respectively. The whiskers show data from 5 % to 95 %, and stars were drawn for the minimum and maximum data points within 1 % to 99 % of the dataset. Within brackets under the region acronyms the main characteristics of the air masses are indicated, based on non-methane hydrocarbon variability-lifetime results (b factor) from Bourtsoukidis et al. (2019). The data used for map plotting were from public domain GIS data found on the Natural Earth website (http://www.naturalearthdata.com, last access: 23 January 2019) and were read into Igor using the IgorGIS XOP beta.
3.1 Aliphatic carbonyls (CnH2nO)
3.1.1 Overview
Relatively high mean mixing ratios of aliphatic carbonyls were observed over the Arabian Gulf, the highest being acetone (C3 carbonyl compound) at 4.50±2.40 ppb (median: 3.77 ppb), followed by formaldehyde at 3.83±2.55 ppb (median: 3.02 ppb), acetaldehyde at 1.73±1.61 ppb (median: 1.02 ppb), and MEK (C4 carbonyl compound) at 0.87±0.71 ppb (median: 0.56 ppb). As the Arabian Gulf is highly impacted by the oil and gas industry, we compared the measurements of the four aforementioned carbonyl compounds with those measured in the oil and gas region (Table 2). Except for formaldehyde, acetaldehyde, acetone, and MEK were lower than the mixing ratios measured in the Uintah Basin, which was influenced by intensive oil and natural gas activities (Koss et al., 2015). The general distribution of the aliphatic carbonyls in the Uintah Basin is similar to the Arabian Gulf, with acetone levels being approximately twice those of acetaldehyde. The carbonyl mixing ratios in the Arabian Gulf were comparable to those measured in Hickory (PA, USA) surrounded by natural gas wells (Swarthout et al., 2015). Koss et al. (2017) reported the maximum boundary layer enhancement of carbonyl compounds (C2–C7) measured during an aircraft measurement above the most productive oil field in the United States (Permian Basin). Within the boundary layer of the Permian Basin, C5–C7 aliphatic carbonyls had mixing ratios of 0.34, 0.08, and 0.03 ppb, which are of the same magnitude but lower than the levels measured over the Arabian Gulf for C5 (0.52±0.48 ppb), C6 (0.19±0.25 ppb), and C7 (0.04±0.04 ppb) carbonyl compounds. The sources of the major carbonyls in the Arabian Gulf will be discussed in detail in Sect. 3.1.2 and 3.4.3.
In contrast, aliphatic carbonyls had much lower average mixing ratios over the Arabian Sea and the Gulf of Aden, especially for C7–C9 carbonyls with mean mixing ratios below the detection limit for most of the time. During the summertime AQABA campaign, the prevailing wind direction over the Arabian Sea was south-west (Fig. S1 in the Supplement). Four-day back trajectories indicate the air was transported from the Arabian Sea (north-western Indian Ocean), passing the eastern Africa coast, which brought relatively clean, photochemically aged air masses (Bourtsoukidis et al., 2019). The mean level of acetone over the Arabian Sea (0.43±0.18 ppb, median: 0.34 ppb) is close to the level measured in the marine boundary layer of the western Indian Ocean (0.49 ppb) (Warneke and de Gouw, 2001) and comparable to other reported values from open-sea air measurement (see Table 2). Acetaldehyde was measured at relatively low mixing ratios over the Arabian Sea (0.13±0.12 ppb, median: 0.09 ppb), which is comparable than the levels reported by the measurements done in the Northern Hemisphere open ocean (see Table 2). Over the Gulf of Aden, acetaldehyde, acetone, and MEK had slightly higher mixing ratios than those over the Arabian Sea.
The Mediterranean Sea had somewhat higher levels of aliphatic carbonyls than the clean regions (the Arabian Sea and the Gulf of Aden) but with acetone (above 2 ppb) dominating the distribution. A much higher acetone level than the acetaldehyde level was also observed for some coastal site measurements, which were impacted by continental air (White et al., 2008; Schlundt et al., 2017; see Table 2). Larger aliphatic carbonyls (C6–C9) were below the detection limit most of the time. The aliphatic carbonyl levels over the Gulf of Oman were higher than the clean regions, while C1–C5 carbonyls were more variable over the Gulf of Oman compared to those over the Mediterranean Sea. This is probably because the Gulf of Oman connects to the Arabian Gulf, where intense oil and gas industrial activities are located. Over the Gulf of Oman, polluted air from the nearby sources of the Arabian Gulf is occasionally mixed with the clean air from the open sea (the Arabian Sea) under south-easterly wind conditions (Fig. S1).
Another region where abundant aliphatic carbonyls were observed was the Suez region. The air in this region was mainly influenced by nearby cities and marine transportation (ship emissions within the Suez Canal) (Bourtsoukidis et al., 2019; Pfannerstill et al., 2019). Therefore abundant precursors were available in the Suez region, producing more carbonyls regionally, especially for shorter-lived compounds (formaldehyde and acetaldehyde). Besides the local-scale emissions and photochemical production contribution to the carbonyls over the Suez, the longer-lived carbonyls (e.g. acetone) could also be transported from the Mediterranean Sea (where acetone was high). Four-day back trajectories indicate the air reaching the Suez region mostly originated from the European continent, passing over the Mediterranean Sea (Bourtsoukidis et al., 2019). Meanwhile, ocean uptake of acetone from the air due to polluted continental outflow (Marandino et al., 2005) as well as dilution and mixing with free tropospheric air during transport can modulate acetone mixing ratios. Although the mean mixing ratios of aliphatic carbonyls over the Suez were much lower than those over the Arabian Gulf, the variations were still more significant than other regions (not including the Arabian Gulf; see Table 1).
Over the Red Sea, acetone was the most abundant aliphatic carbonyl, followed by formaldehyde and acetaldehyde. The mixing ratios of acetaldehyde and acetone over the northern part of the Red Sea were similar to those levels measured in western Pacific coastal regions (South China Sea, Table 2). It is worth noticing that the levels of aliphatic carbonyls in the northern part of the Red Sea were almost 2 times higher than the southern part of the Red Sea. According to the 4 d back trajectories reported by Bourtsoukidis et al. (2019), the measured air masses that travelled to the northern part were from southern Europe and north-eastern Africa, while the southern part was more influenced by air from the northern part of the Red Sea mixed with the air masses from desertic areas of central Africa. Therefore, fewer primary precursors as well as carbonyls were transported to the southern part of the Red Sea compared to the northern part. Moreover, the unexpected sources of hydrocarbons (ethane and propane) from northern Red Sea deep water reported by Bourtsoukidis et al. (2020) would lead to higher carbonyl levels in the northern part compared with the southern part due to the additional precursors in the Red Sea North. However, acetaldehyde was still found to be significantly underestimated compared to the model results, even taking the deep-water source into consideration (Sect. 3.3). This indicates that extra sources of acetaldehyde may exist, which will be discussed in detail in Sect. 3.4.
Table 1Mean, standard deviation (SD), and median mixing ratios of aliphatic, unsaturated, and aromatic carbonyls in different regions.
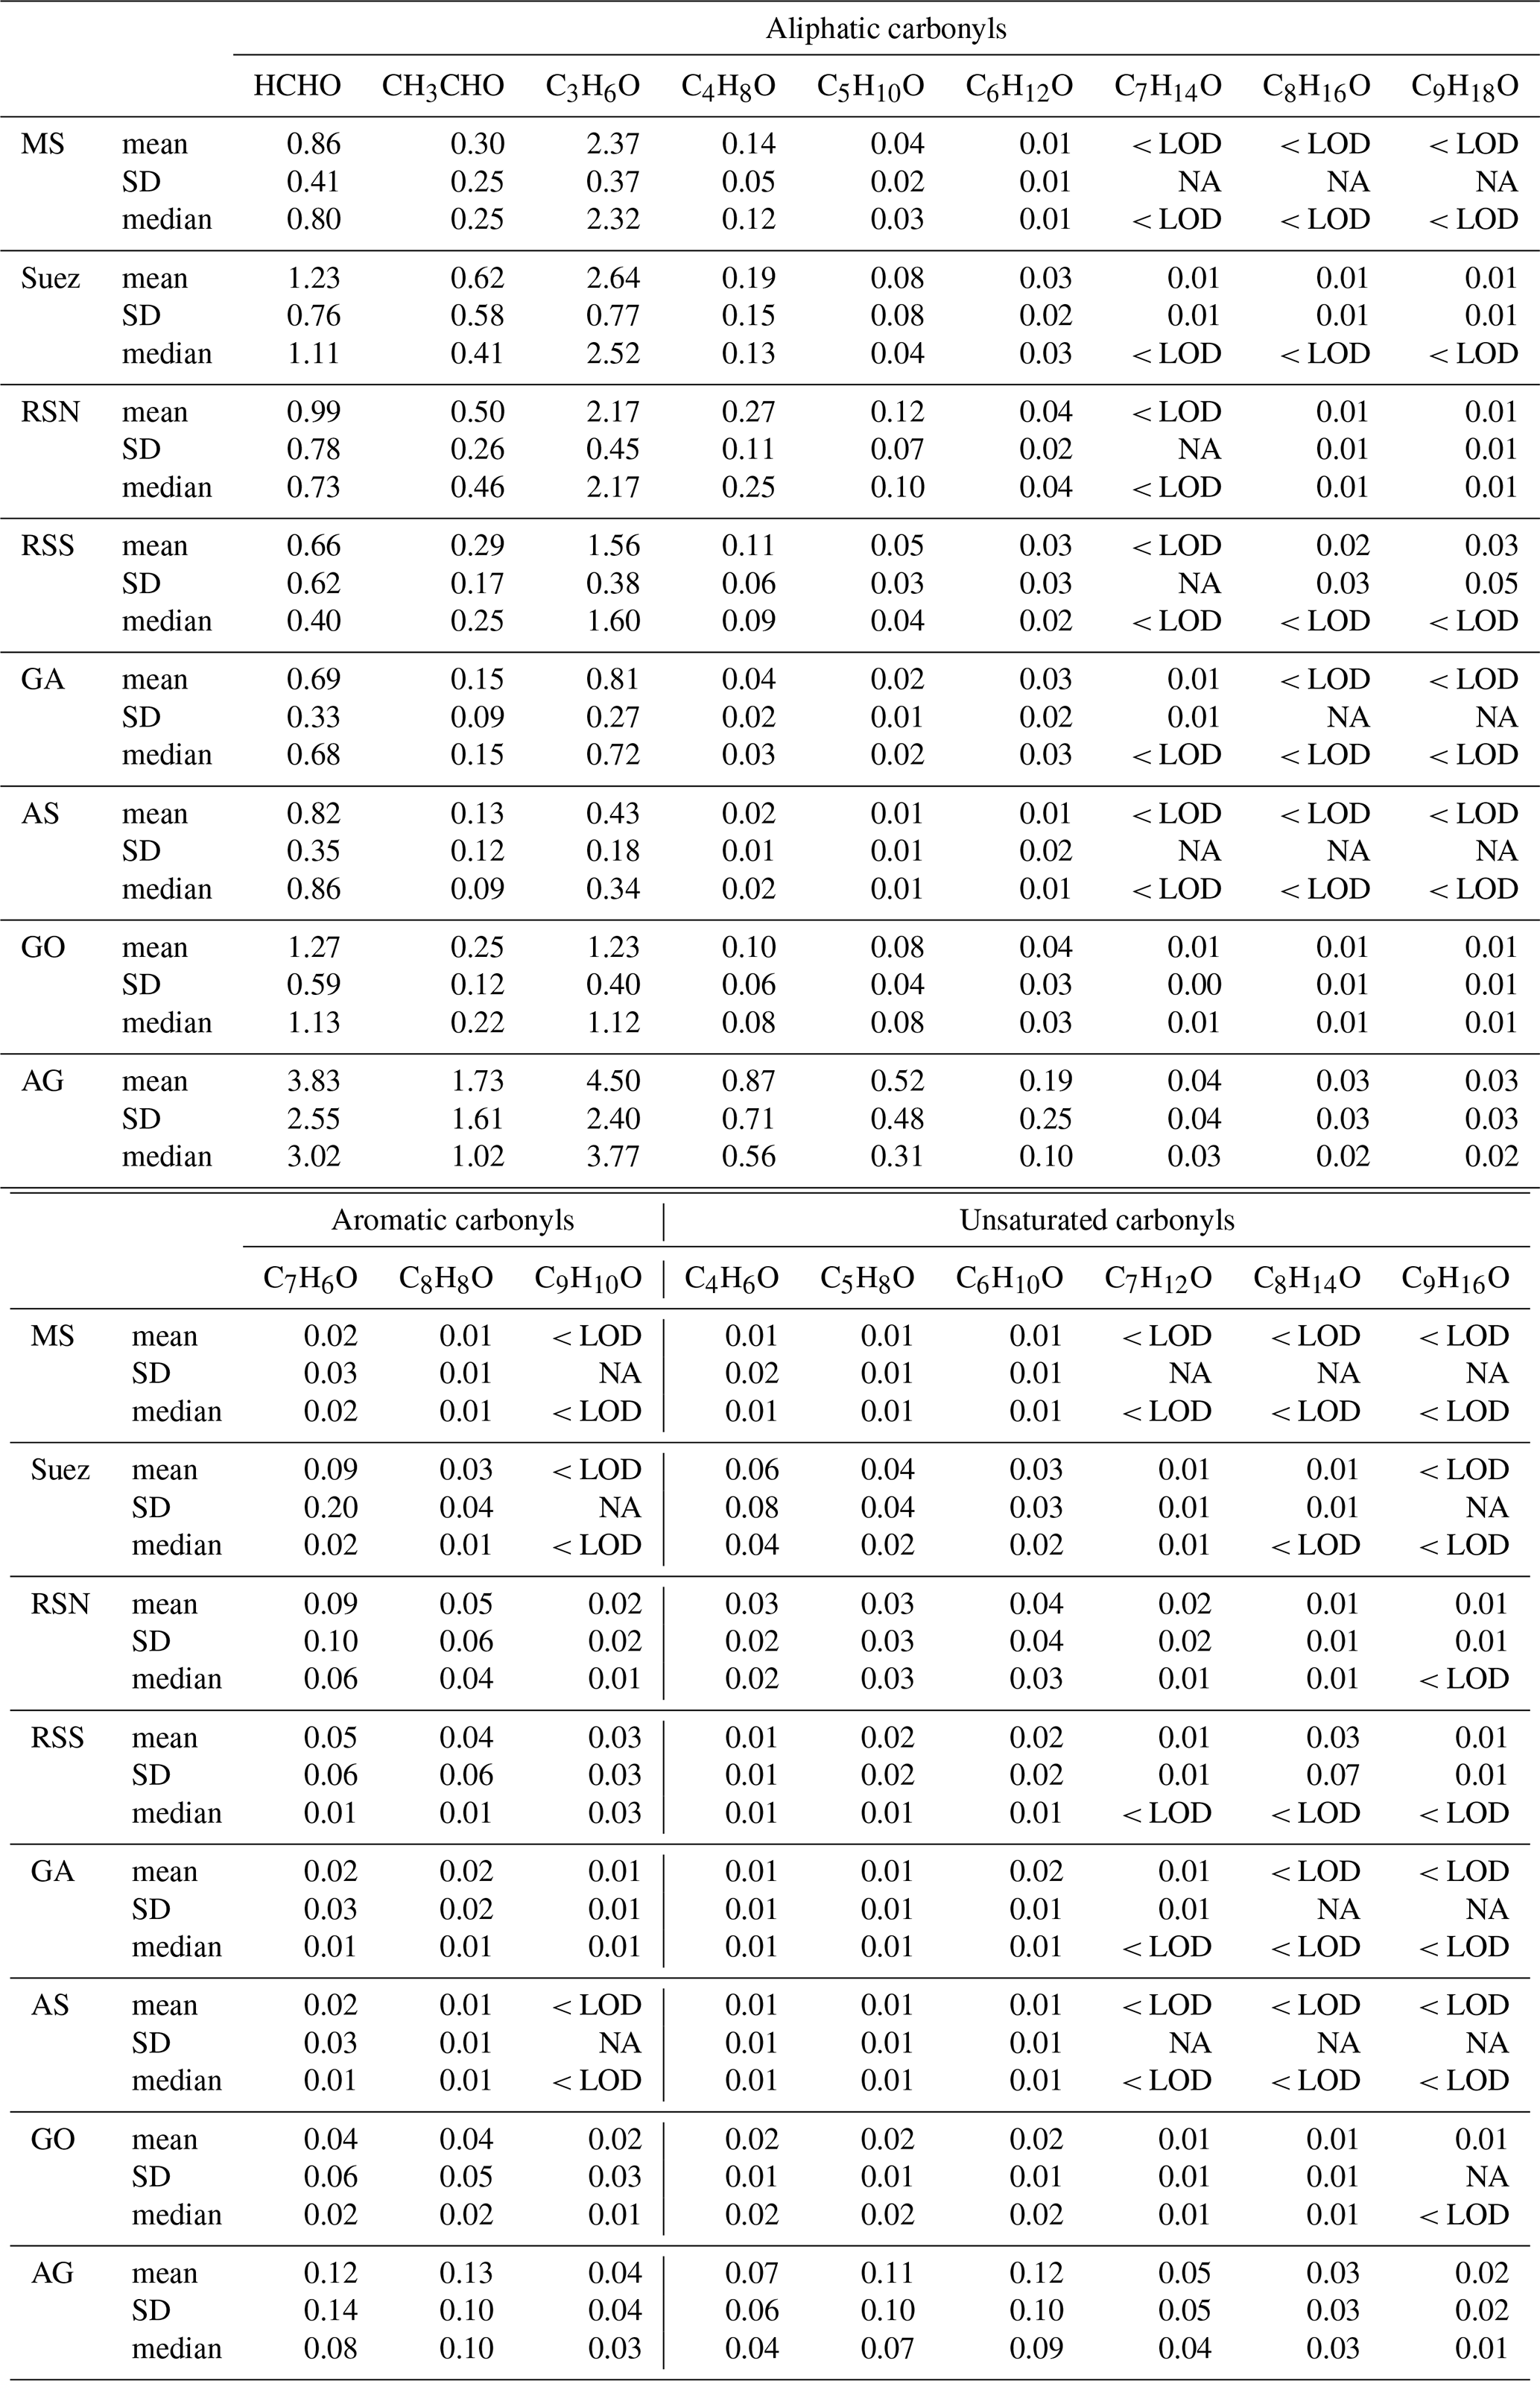
< LOD: the mixing ratios were lower than the limit of detection. NA: not available.
Table 2Mixing ratios (ppb) of OVOCs reported in previous observation in the literature.
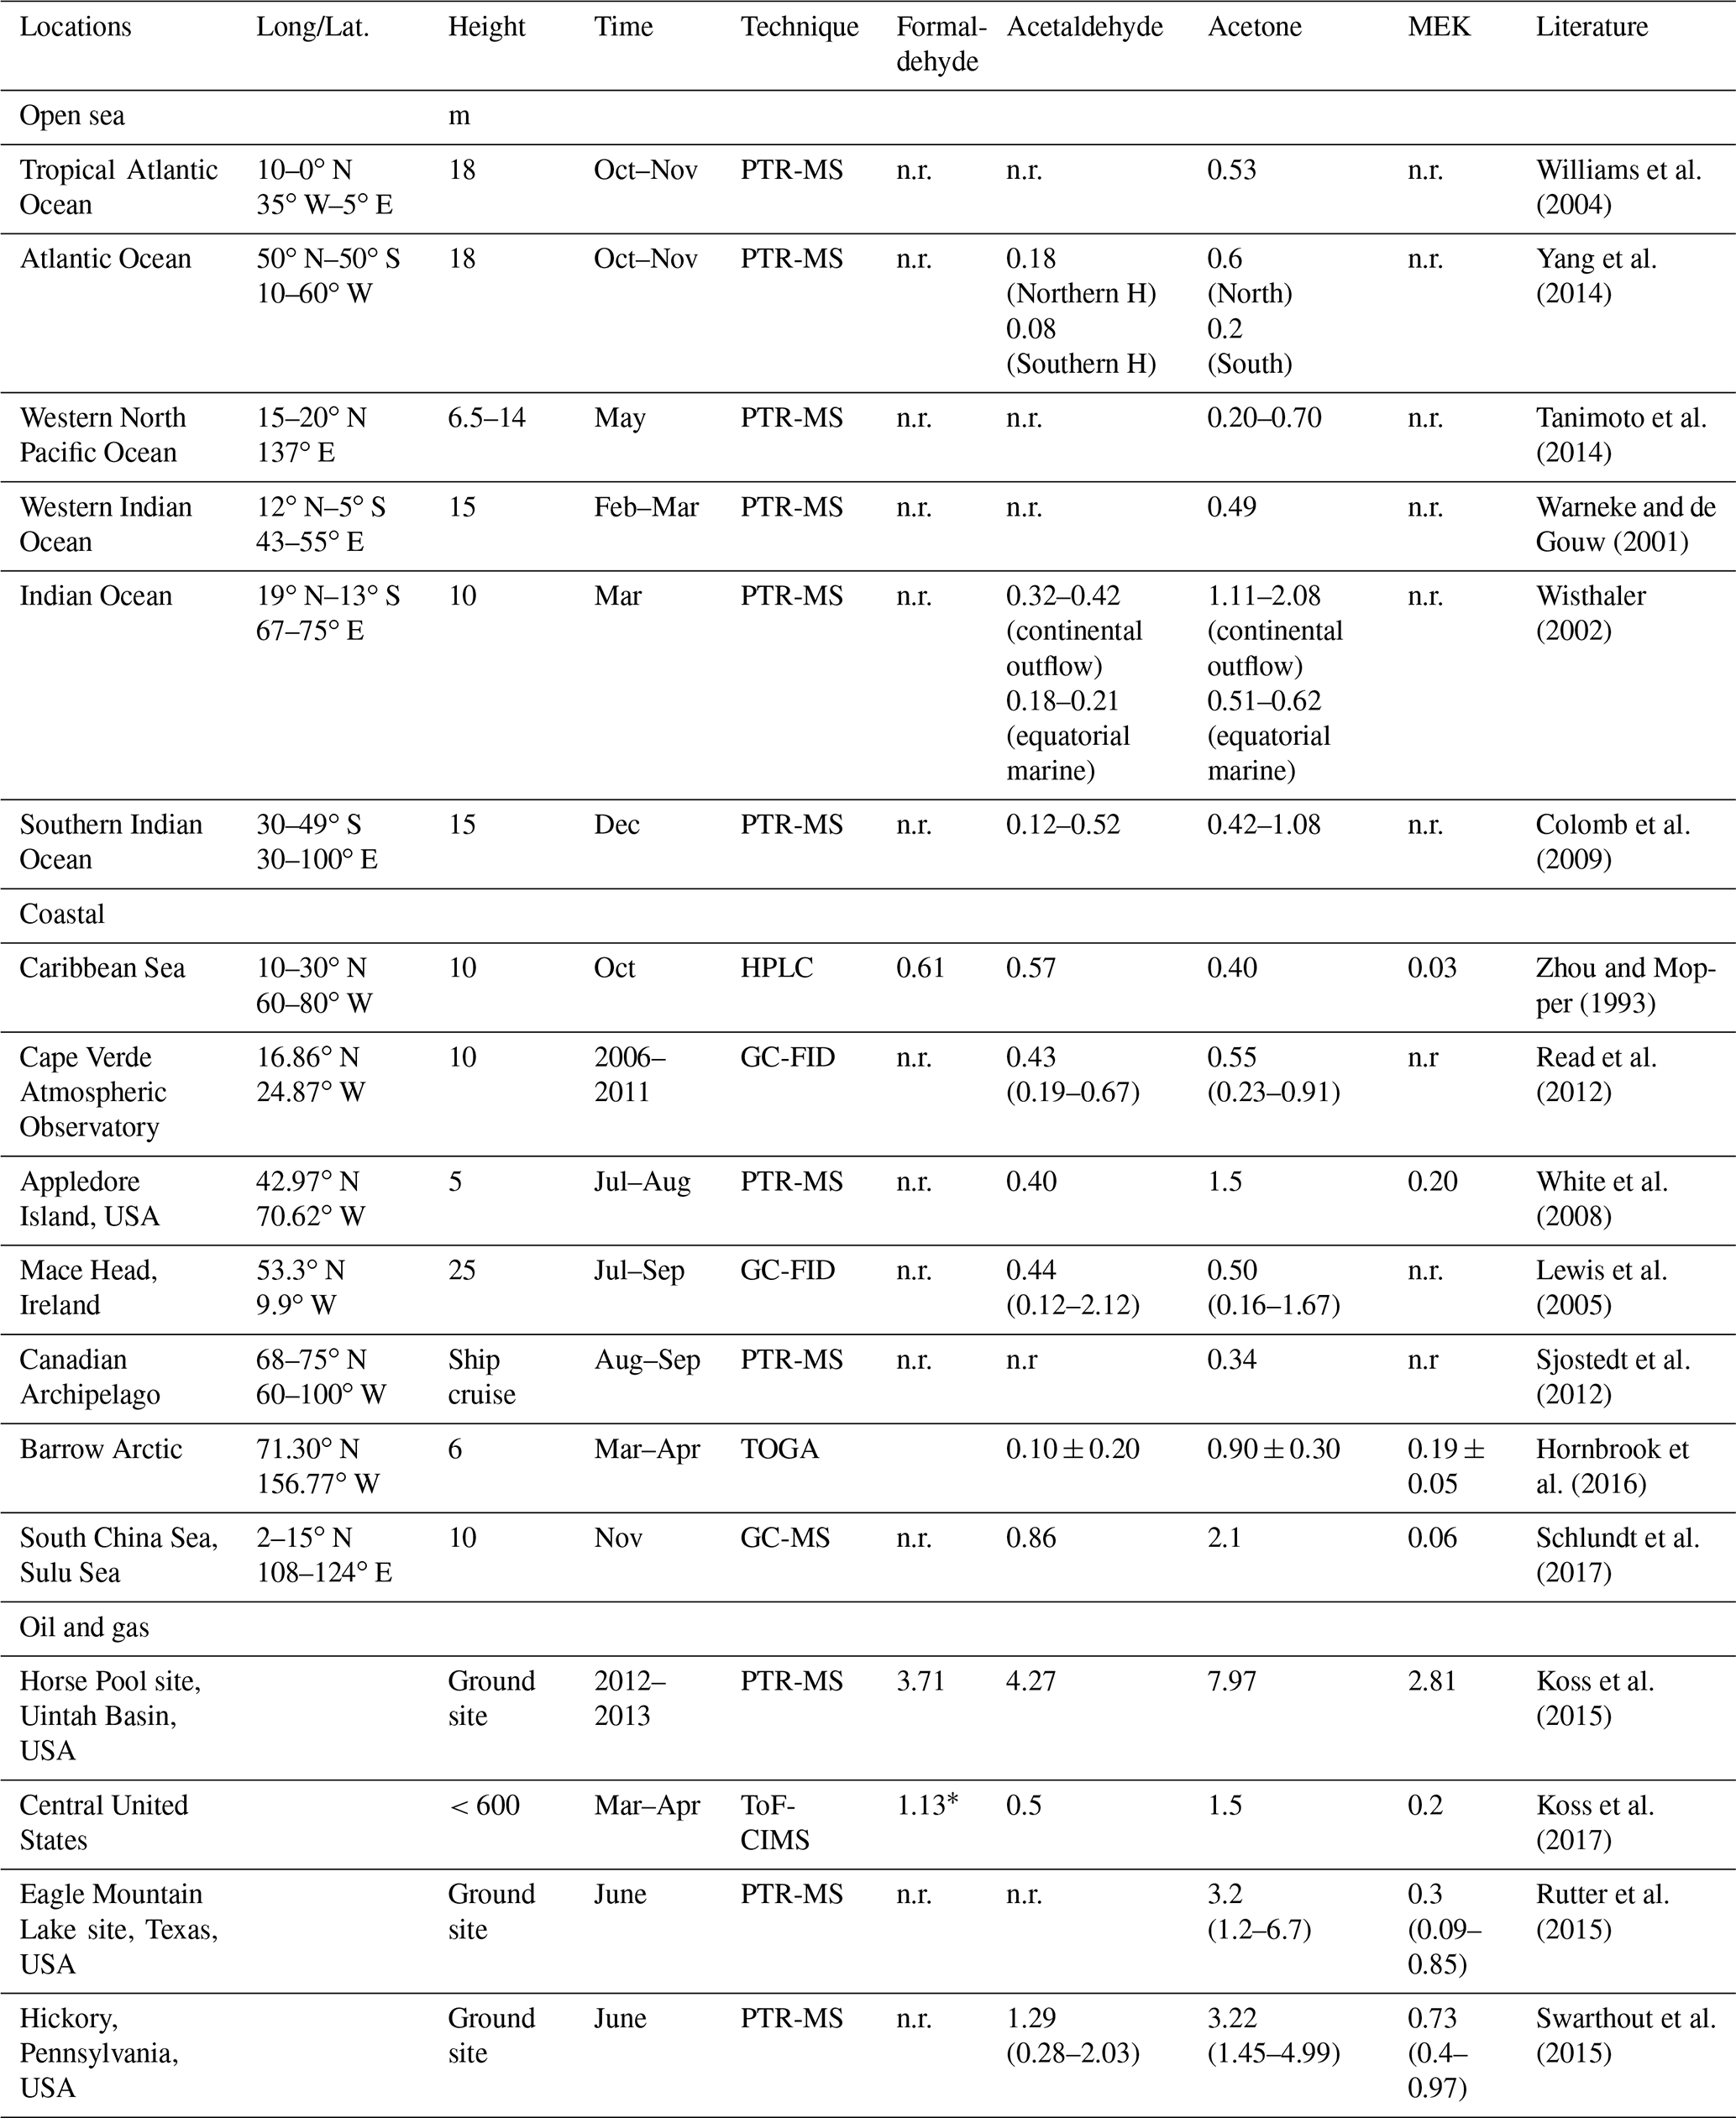
n.r.: not reported in the literature. * Formaldehyde was measured by laser-induced fluorescence (LIF).
3.1.2 Case studies of polluted regions: the Arabian Gulf and Suez
The primary emission sources in the Arabian Gulf and Suez regions are quite different. While the Arabian Gulf is dominated by oil and gas operations, the Suez is more influenced by ship emissions and urban areas (Bourtsoukidis et al., 2019). Carbonyl compounds were most abundant in these two areas. For further insight, we focused on a time series of selected trace gases and their inter-correlations to better identify the sources of the major aliphatic carbonyls. Meanwhile, we calculated the OH exposure ([OH]Δt) based on hydrocarbon ratios (Roberts et al., 1984; de Gouw et al., 2005; Yuan et al., 2012) for the polluted regions (Arabian Gulf and Suez) where primary emissions have been identified (Bourtsoukidis et al., 2019; Bourtsoukidis et al., 2020), to better understand the photochemical aging of the major carbonyls using the following equation:
where X and Y refer to two hydrocarbon compounds with different rates of reaction with the OH radical (k). For this study, we chose toluene (kOH+toluene: cm3 molec.−1 s−1) and benzene (kOH+benzene: cm3 molec.−1 s−1) (Atkinson and Arey, 2003), because both compounds were measured by PTR-ToF-MS at high frequency and these values showed good agreement with values measured by GC-FID (Fig. S2). The approach detailed by Yuan et al. (2012) was applied to determine the initial emission ratio in those two regions by only including nighttime data of benzene and toluene. We obtained initial emission ratios (toluene-to-benzene ratios) of 1.38 for the Arabian Gulf and 2.12 for the Suez region. Koss et al. (2017) summarized the toluene-to-benzene ratios observed in various locations and showed that urban and vehicle sources tend to have higher toluene-to-benzene ratios (mean ∼2.5) than the ratios of oil and gas sources (mean ∼1.2). Therefore, the toluene-to-benzene ratios obtained for those two regions agreed well with other studies done with similar emission sources. The corresponding correlation plots of toluene and benzene for those two regions can be found in Fig. S3.
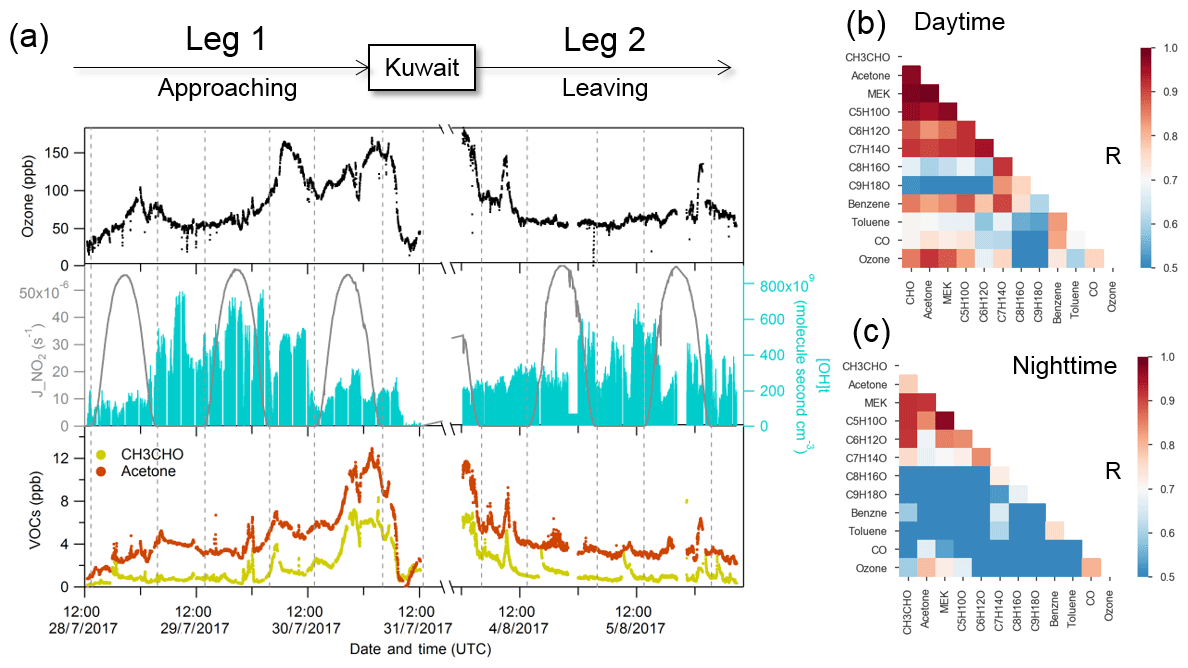
Figure 3Case study of the Arabian Gulf. (a) Time series of selected species measured over the Arabian Gulf; (b) daytime correlation heat map of selected species; (c) nighttime correlation heat map of selected species.
Figure 3a shows the time series of acetaldehyde and acetone over the Arabian Gulf along with OH exposure ([OH]t) and ozone. We further separated the data into daytime and nighttime and calculated correlations among the carbonyls and other selected species (see Fig. 4b and c). Aliphatic carbonyls were well correlated with each other during the daytime, and ozone had a generally good correlation with C2–C7 carbonyls (r>0.7) during the daytime but a much lower correlation during the night, indicating ozone and carbonyls were co-produced via photochemical oxidation. Tadic et al. (2020) reported that the net ozone production rate over the Arabian Gulf (32 ppb d−1) was greatest over the Arabian Peninsula. They show that strong ozone-forming photochemistry occurred in this region, which would lead to abundant secondary photochemically produced products (including carbonyls). However, it should be noted that the good correlation between ozone and carbonyls could in part be due to carbonyls co-emitted with ozone precursors (hydrocarbons) as primary emissions. In Fig. 3a, the calculated OH exposure was high during the first night in leg 1, where an elevation of the acetone mixing ratio was observed, while the mixing ratio of acetaldehyde remained relatively constant. With limited OH radical abundance during the nighttime, the increased OH exposure indicates that the air reaching the ship was photochemically processed (aged). Therefore, the increase in acetone was mainly from long-distance transport as acetone has a much longer atmospheric lifetime than acetaldehyde. As the ship approached Kuwait, the calculated OH exposure was low (starting from 30 July 2017, 00:00 UTC), which is an indicator of nearby emission sources. The lifetime of the OH radical derived from the measured OH reactivity also decreased from ∼0.1 to ∼0.04 s during the same period (Pfannerstill et al., 2019). Oil fields and associated refineries are densely distributed in the north-west of the Arabian Gulf region (United States Central Intelligence Agency). The air reaching the ship when mixing ratios of acetone and acetaldehyde were highest was mainly from the north-west (Iraq oil field region) according to the back trajectories (Bourtsoukidis et al., 2019). This suggests that the air masses encountered in the north-western Arabian Gulf were a combination of fresh emissions from nearby sources and photochemically processed air transported from elsewhere. During the second leg, relatively low mixing ratios were identified in the same region (north-western Arabian Gulf), which was mainly due to a greater influence of air masses originating from less populated desert regions of north-eastern Iran (Bourtsoukidis et al., 2019), with much less influence from the oil field emissions, meaning fewer precursors were available for carbonyl production. Several plumes (extending over 2–3 h) of elevated carbonyls with increased ozone were observed during the nighttime for both legs (Fig. 4a), indicating transport of highly polluted air.
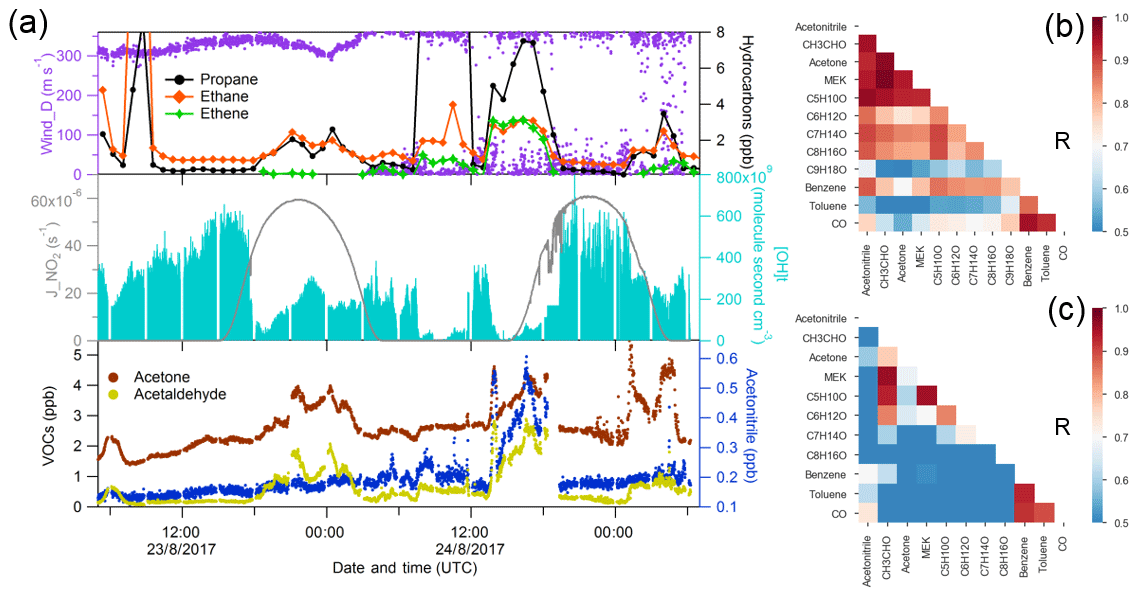
Figure 4Case study of Suez. (a) Time series of selected species measured over Suez; (b) correlation heat map of selected species during biomass burning plume (01:00–06:00 UTC, 24 August 2017); (c) correlation heat map of selected species without the period of biomass burning plume.
For the Suez region (Gulf of Suez and Suez Canal), data were only available for the second leg. A significant increase in acetonitrile (over 400 ppt) was observed just before entering the Great Bitter Lake (see Fig. 4a), indicating an increasing influence of biomass burning on the air composition (Lobert et al., 1990). Carbonyl compounds are important primary emissions in fresh biomass burning plumes (Holzinger et al., 1999, 2001; Schauer et al., 2001; Koss et al., 2018) as well as being formed as secondary products in more aged plumes (Holzinger et al., 2005). We further investigated the correlation coefficient among carbonyls during the biomass burning plume (Fig. 4b) in the Suez. Carbonyls had a high correlation with acetonitrile, benzene, and themselves, particularly for smaller carbonyls (acetaldehyde, C3–C5 carbonyls). The biomass burning emissions were probably transported by the prevailing northerly wind (Fig. S1) above north-eastern Egypt, where crop residues, especially rice straw, are often directly burned in the open fields (Abdelhady et al., 2014; Said et al., 2013; Youssef et al., 2009). Besides the direct biomass burning emission, the high mixing ratios and the good correlations of carbonyls could also have resulted from other sources such as hydrocarbons (alkanes, alkenes, and aromatics) which were elevated at the same time. Similar to conditions identified over the Arabian Gulf, elevated OH exposure accompanied by an increasing acetone mixing ratio was observed during the first night over the Gulf of Suez, indicating aged air-mass transportation. The OH exposure was then significantly lower during the daytime, when mixing ratios of carbonyls and alkanes increased as well. This indicates the presence of emission sources nearby. Oil refineries located on the coastal side of the Suez and oil tank terminals located in the northern part of the Gulf of Suez are likely sources.
3.2 Unsaturated and aromatic carbonyls (CnH2n−2O), (CnH2n−8O)
3.2.1 Overview
The mixing ratios of unsaturated carbonyls were generally ∼10 ppt or lower than the LOD over the Mediterranean Sea and the clean regions (the Arabian Sea and the Gulf of Aden). The Red Sea region and the Gulf of Oman had slightly higher levels (LOD–40 ppt). The highest values were again observed in the Arabian Gulf (20–110 ppt), followed by the Suez (LOD–60 ppt). The numbers represent the range of the mean mixing ratios of unsaturated carbonyls in each region. In terms of the mixing ratio distribution (Fig. 2), the peak value was usually observed at C5 or C6 unsaturated carbonyls over most regions except for the Suez, where C4 carbonyl had the highest mixing ratio. Based on chemical formulas, unsaturated carbonyls can be either cyclic carbonyl compounds or carbonyls containing a carbon–carbon double bond. Therefore, the air chemistry could differ considerably depending on the compound assignment. A detailed analysis of the chemistry of the unsaturated carbonyls measured will be given in the following Sect. 3.2.2.
Regional variability was also observed for aromatic carbonyls, with the highest levels observed over the Arabian Gulf and Suez and much lower mixing ratios over the Arabian Sea, Mediterranean Sea, and Gulf of Aden (Table 1). Several studies using PTR-MS have reported values for m∕z 107.049 (C7 aromatic carbonyls) attributed to benzaldehyde (Brilli et al., 2014; Koss et al., 2017, 2018), m∕z 121.065 (C8 aromatic carbonyls) attributed to tolualdehyde (Koss et al., 2018) or acetophenone (Brilli et al., 2014), and m∕z 135.080 (C9 aromatic carbonyls) attributed to methyl acetophenone (Koss et al., 2018) or benzyl methyl ketone (Brilli et al., 2014) or 3,5-dimethylbenzaldehyde (Müller et al., 2012). Atmospheric aromatic carbonyls are produced via photochemical oxidation of aromatic hydrocarbons (Finlayson-Pitts and Pitts, 1999; Wyche et al., 2009; Müller et al., 2012), and benzaldehyde was reported as having primary sources from biomass burning and anthropogenic emissions (Cabrera-Perez et al., 2016). Around the Arabian Peninsula, the level of aromatic carbonyls declined with increasing carbon number over most of the regions except in the Red Sea South, Gulf of Oman, and Arabian Gulf, where C7 carbonyls were comparable to C8 carbonyls (Fig. 2). Interestingly, only in the Suez region were the C7 aromatic carbonyls more abundant than other aromatic carbonyls, whereby the mean value (90±200 ppt) was much higher than the median value (20 ppt), indicating strong primary sources of benzaldehyde in the Suez. Otherwise, toluene was found to be more abundant over the Suez, with mean mixing ratios of 271±459 ppt than over other regions (the mean over the Arabian Gulf: 130±160 ppt), which would also lead to higher benzaldehyde as it is one of the OH-induced oxidation products of toluene via H abstraction (Ji et al., 2017).
3.2.2 Potential precursors and sources of unsaturated carbonyls
Unsaturated carbonyls measured by PTR-MS have only rarely been reported in the atmosphere, with the exception of methyl vinyl ketone and methacrolein (C4 carbonyls), which are frequently reported as the oxidation products of isoprene (Williams et al., 2001; Fan and Zhang, 2004; Wennberg et al., 2018). According to the GC-FID measurement, isoprene was below the detection limit for most of the time during the AQABA cruise, with the highest values observed in the Suez (10–350 ppt). This shows that the AQABA campaign was little influenced by either terrestrial or marine isoprene emissions. However, we observed unexpected high levels on mass 69.070, which is usually interpreted as isoprene for PTR-MS measurements. Significant enhancements were even identified while sampling our own ship exhaust (in PTR-MS but not GC-FID), suggesting the presence of an anthropogenic interference at that mass under these extremely polluted conditions. Several studies have reported possible fragmentations of cyclic alkanes giving mass (m∕z) 69.070. These include a laboratory study on gasoline hydrocarbon measurements by PTR-MS (Gueneron et al., 2015), a GC-PTR-MS study of an oil spill site combined with analysis of crude oil samples (Yuan et al., 2014), and an inter-comparison of PTR-MS and GC in an O&G industrial site (Warneke et al., 2014). From those studies, other fragmentations from C5 to C9 cycloalkanes, including m∕z 43, m∕z 57, m∕z 83, m∕z 111, and m∕z 125, were identified together with m∕z 69. Cyclic alkanes were directly measured in oil and gas fields (Simpson et al., 2010; Gilman et al., 2013; Li et al., 2017; Aklilu et al., 2018), vehicle exhaust (Gentner et al., 2012; Erickson et al., 2014), and vessel exhaust (Xiao et al., 2018), accounting for a non-negligible amount of the total VOC mass depending on the fuel type. Koss et al. (2017) reported enhancement of cyclic alkane fragment signals and increased levels of unsaturated carbonyls measured by PTR-ToF-MS over the O&G region in the US. The unsaturated carbonyls (C5–C9) were assigned as oxidation products of cycloalkanes. Therefore, we examined the correlations between m∕z 69.070 and other cycloalkane fragments over the Arabian Gulf and Suez, where anthropogenic primary emissions were significant. As shown in Fig. 5, m∕z 83 was the most abundant fragment, and it correlated better with m∕z 69 than the other two masses, strongly supporting the presence of C6 cycloalkanes (methylcyclopentane and cyclohexane). The other two masses are distributed in two or three clusters, suggesting compositions of different cycloalkanes. m∕z 43 and m∕z 57 (fragments of C5 cycloalkanes) had lower correlations with other fragments (not shown in the graph) as they are also fragments of other higher hydrocarbons. Thereby we could assign those unsaturated carbonyls as photochemical oxidation products (i.e. cyclic ketones or aldehydes) from their precursor cycloalkanes.

Figure 5Scatter plots of m∕z 69.070 and other cycloalkane fragment masses over the (a) Arabian Gulf and (b) Suez region.
As shown in Fig. 2 and Table 1, C6 unsaturated carbonyls displayed higher mixing ratios than any other unsaturated carbonyls over the Arabian Gulf, while C5 unsaturated carbonyl was slightly higher than C6 in the Suez. Bourtsoukidis et al. (2019) derived enhancement ratio slopes from pentane isomers and established that the Arabian Gulf is dominated by oil and gas operations and that the Suez is more influenced by ship emissions. Therefore, as the Arabian Gulf had much more active O&G activities than the Suez, our findings agree with Koss et al. (2017), who showed that C6 unsaturated carbonyls should be more abundant than C5 carbonyls since more precursors for C6 unsaturated carbonyls are emitted from active oil fields. It is worth mentioning that in Fig. 5b one cluster at the bottom showed m∕z 69.070 had no correlation with the other three masses. Those points correspond to the time when the GC measured significantly elevated isoprene while passing through the narrow Suez Canal where some vegetation (e.g. palms and some agriculture) was present close to the shore, meaning m∕z 69.070 during this period was isoprene. At the same time, m∕z 71.049 (C4 unsaturated carbonyl) increased from 20 to 220 ppt. Isoprene oxidation products (MVK and methacrolein) were probably the major contribution to the C4 unsaturated carbonyls in this period. This also explains why C4 carbonyl dominated the distribution of unsaturated carbonyls over the Suez.
In the other regions (especially more remote areas), the cyclic alkane fragmentation masses had much lower abundance, leading to much less unsaturated carbonyls due to lack of precursors. Meanwhile, m∕z 69.070 (C5H8H+), m∕z 83.086 (C6H10H+), and m∕z 97.101 (C7H12H+) could also be fragmentations from corresponding aldehydes losing one water molecule as mentioned in Sect. 2.3.3. Missing information on the chemical structure of unsaturated carbonyls and knowledge of their precursors preclude detailed investigation of the sources of large unsaturated carbonyls in these areas.
3.3 Model comparison of acetaldehyde, acetone, and MEK
We compared our measurement results of acetaldehyde, acetone, and MEK to those predicted by the EMAC global model (ECHAM5/MESSy2 for Atmospheric Chemistry). From the results shown in Fig. 6, the model predicted acetone much better than acetaldehyde and MEK. In general, the model broadly captured the major features identified during the campaign, such as much higher levels of carbonyl mixing ratios over the Arabian Gulf and Suez and relatively low levels over the Arabian Sea. The mean measurement-to-model ratios indicated that acetone was overestimated by a factor within 1.5 over the Arabian Sea, Gulf of Aden, and Gulf of Oman and underestimated by a factor within 2.5 over the other regions. In contrast, the model underestimated MEK within a factor of 4 over most of the regions except for the Gulf of Oman, where MEK was overestimated (median values were taken here as the mean values substantially deviated from the medians over the Suez, Gulf of Oman, and Arabian Gulf). The model underestimation was most significant for acetaldehyde, which is underpredicted by a factor (median values) of more than 6 over the Red Sea North, ∼4 over the Arabian Sea and Arabian Gulf, and between 1 and 4 over other regions. A strong natural non-methane hydrocarbon source from deep water in the northern Red Sea was implemented in the model (Bourtsoukidis et al., 2020). Although the model representation of acetaldehyde and other carbonyls was clearly improved after including the deep-water source of ethane and propane (Fig. S4), the underestimation of acetaldehyde was still significant over the Red Sea North as shown in Fig. 6a, indicating further missing sources. For acetaldehyde and MEK, the discrepancy was also significant over the Arabian Sea, where acetone was, in contrast, overestimated. Since acetaldehyde had the biggest bias from the model prediction, we further investigate the possible missing sources of acetaldehyde.
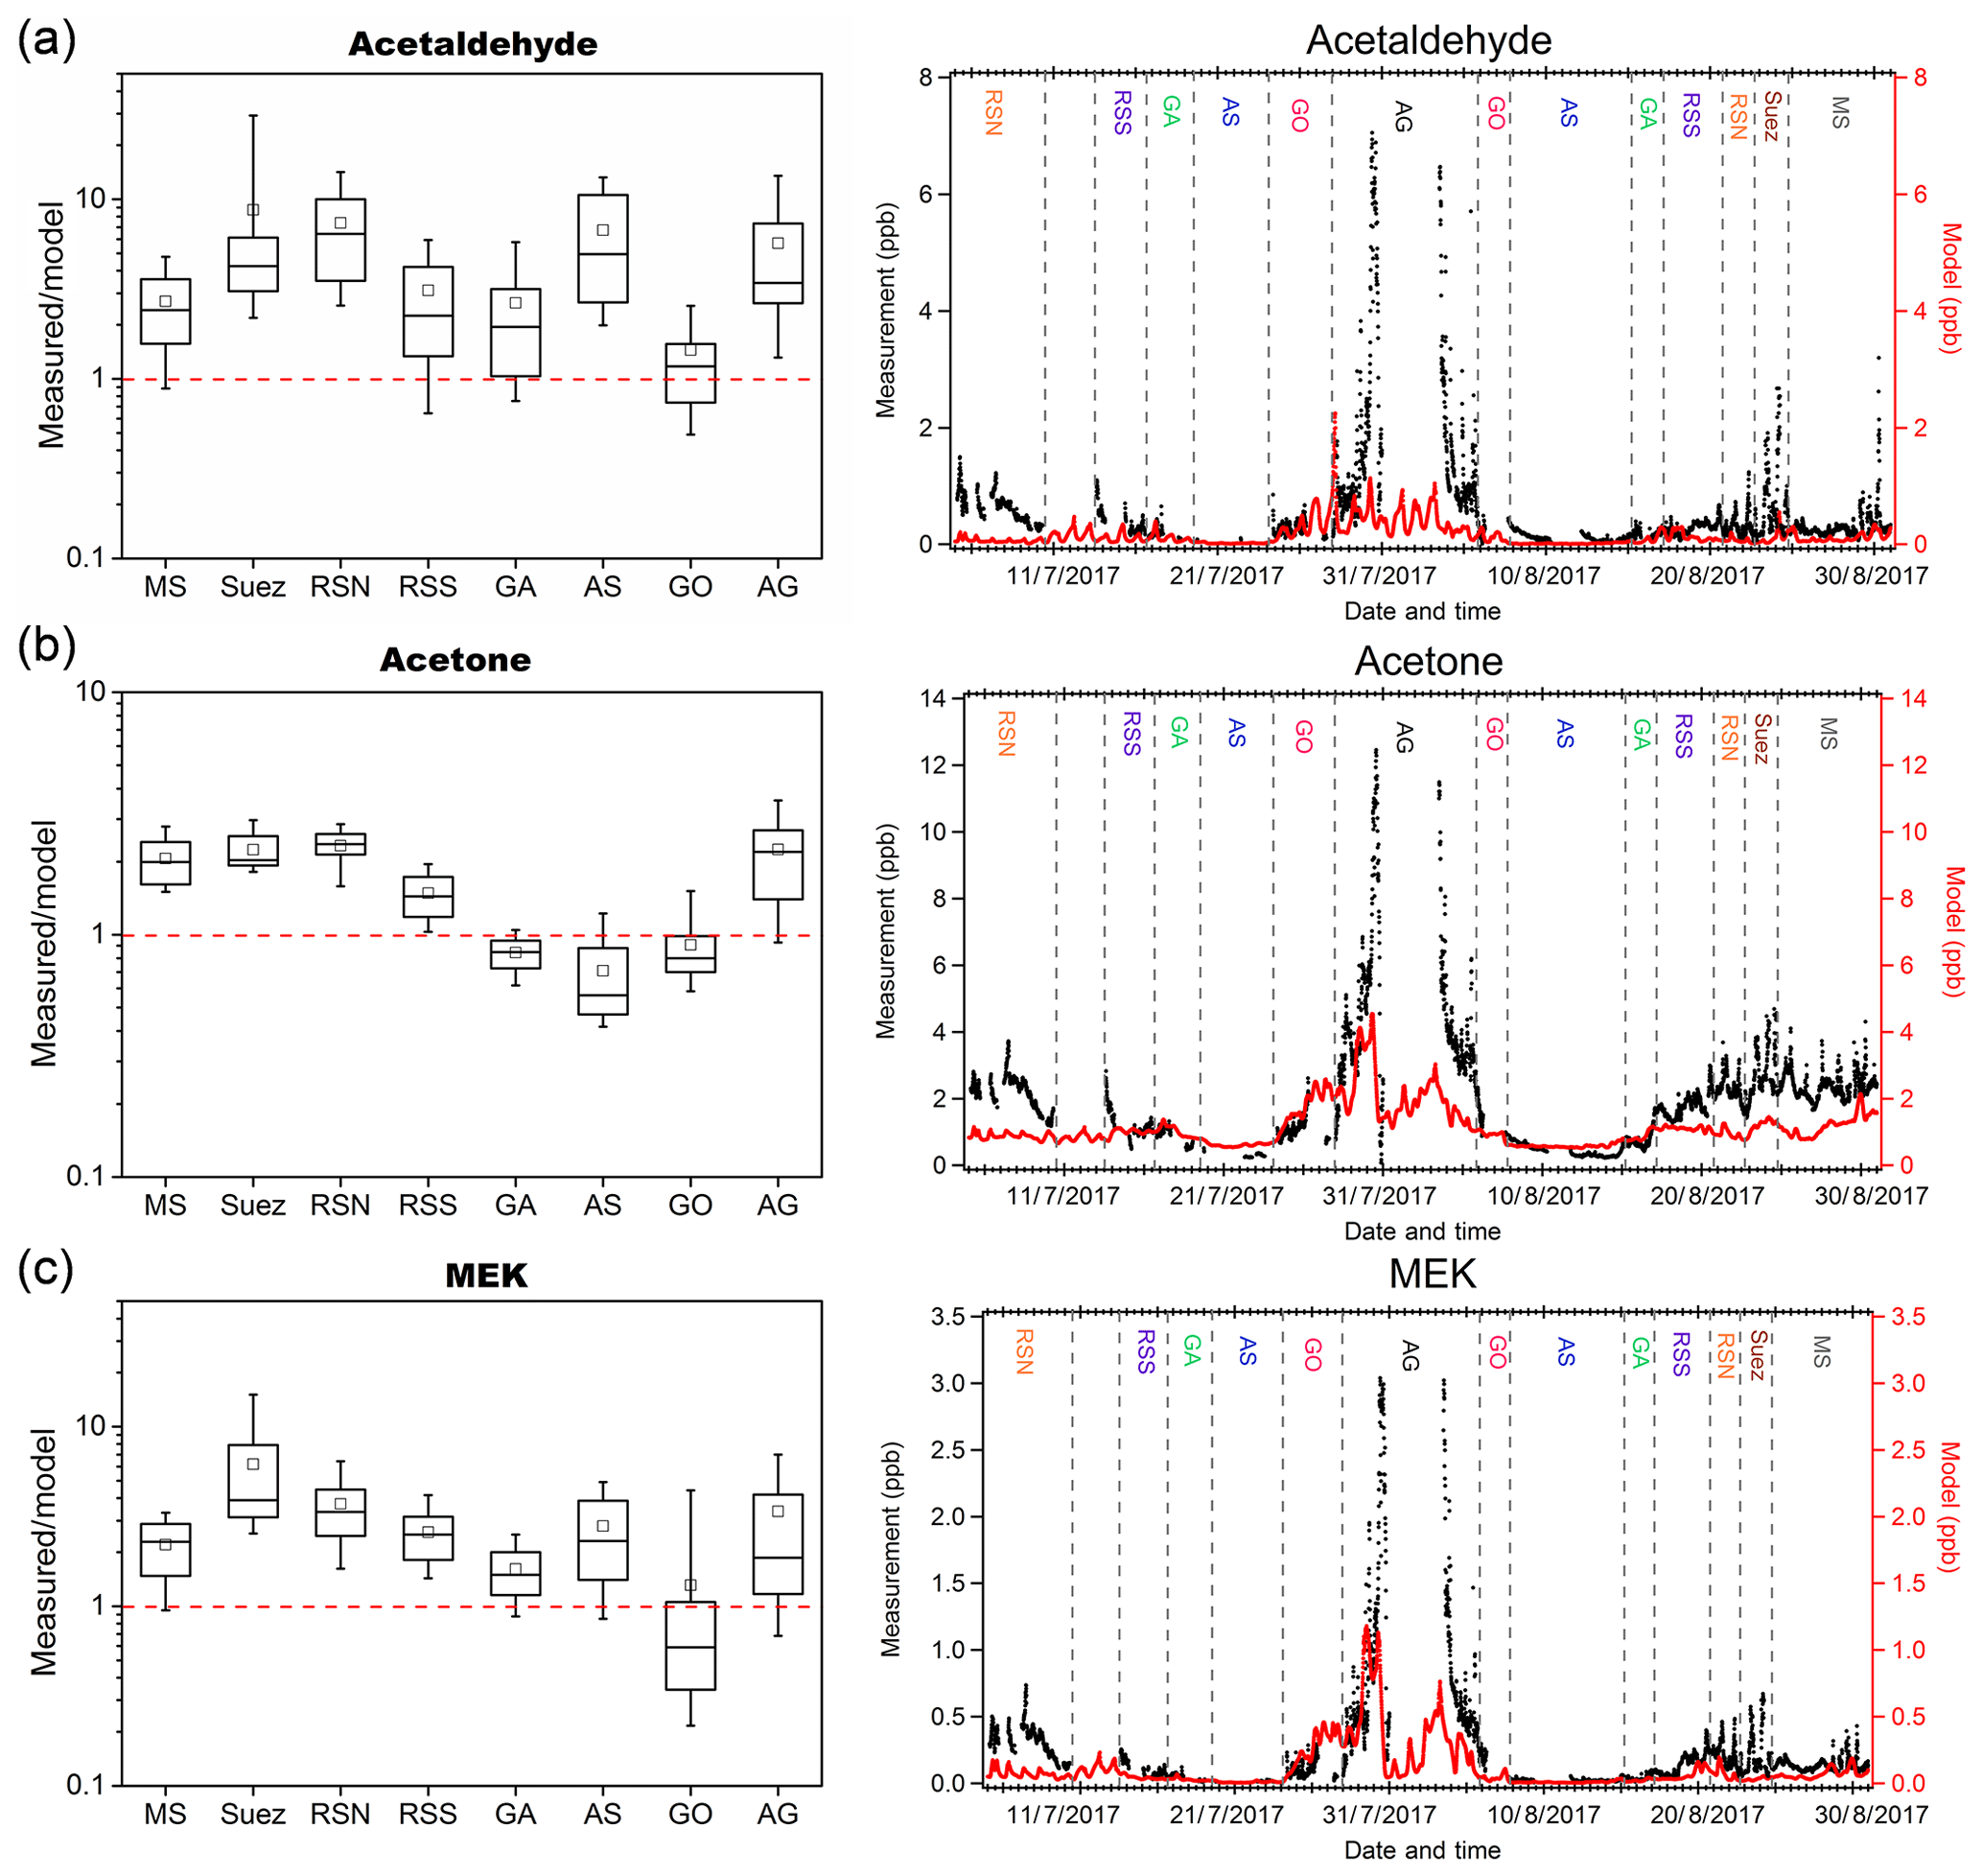
Figure 6Measurement-to-model ratios (left) and time series (right) of measurements (in black) and model simulation (in red) of (a) acetaldehyde; (b) acetone; and (c) MEK in each area. In each box plot, the box represents 25 % to 75 % of the dataset, with the central line and square indicating the median value and the mean value, respectively. The whiskers show data from 10 % to 90 %. The red dashed lines represent the 1 : 1 ratio.
3.4 Missing sources of acetaldehyde
In this section we investigate the following processes as potential sources of acetaldehyde: (1) production as an inlet artifact, (2) oceanic emission of acetaldehyde, (3) anthropogenic primary sources, (4) biomass burning sources, and (5) other possible secondary formation pathways.
3.4.1 Inlet artifact
Northway et al. (2004) and Apel et al. (2008) reported that heterogeneous reactions of unsaturated organic species with ozone on the wall of the Teflon inlet can cause artifact signals of acetaldehyde but not of acetone. During AQABA, the highest and most variable ozone mixing ratios were observed during the campaign over the Arabian Gulf (mean: 80±34 ppb) and the Red Sea North (66±12 ppb), where a modest correlation was found between acetaldehyde and ozone over the Arabian Gulf (r2=0.54) and no significant correlation over the Red Sea North (r2=0.40). However, larger correlation coefficients were identified between ozone and other carbonyls over the Arabian Gulf (see Fig. S5), which suggests that the correlation was due to atmospheric photochemical production rather than artifacts. Moreover, acetaldehyde was found to have a much worse correlation with ozone during the nighttime compared to the correlation during the daytime over the Arabian Gulf (Fig. 3b and c), which also indicates that inlet generation of acetaldehyde was insignificant. Over other regions, especially the remote area (the Arabian Sea and Gulf of Aden), ozone was relatively constant and low, with poor correlation with acetaldehyde mixing ratios. Although we cannot completely exclude the possible existence of artifacts, the interference is likely to be insignificant in this dataset.
3.4.2 Oceanic emission
A bias between measured acetaldehyde and global model simulations has been observed in previous studies conducted in the remote troposphere (Singh et al., 2003; Singh, 2004; Wang et al., 2019) and in the marine boundary layer (Read et al., 2012). The aforementioned studies emphasized the potential importance of the seawater acting as a source of acetaldehyde emission via air–sea exchange. No significant correlation was found between acetaldehyde and DMS (dimethyl sulfide), a marker of marine biogenic emission which is produced by phytoplankton in seawater (Bates et al., 1992) (see Fig. S6). This indicates that the direct biogenic acetaldehyde emissions from the ocean are probably insufficient to explain the measured acetaldehyde. More likely, acetaldehyde and other small carbonyl compounds can be formed in the sea, especially in the surface microlayer (SML) via photodegradation of coloured dissolved organic matter (CDOM) (Kieber et al., 1990; Zhou and Mopper, 1997; Ciuraru et al., 2015). Zhou and Mopper (1997) calculated the exchange direction of small carbonyls based on measurement results and identified that the net flux of acetaldehyde was from the sea to the air, whereas formaldehyde was taken up by the sea. Sinha et al. (2007) characterized air–sea flux of several VOCs in a mesocosm experiment and found that acetaldehyde emissions were in close correlation with light intensity (r=0.7). By using a 3-D model, Millet et al. (2010) estimated the net oceanic emission of acetaldehyde to be as high as 57 Tg a−1 (in a global total budget: 213 Tg a−1), being the second largest global source. A similar approach was applied in a recent study done by Wang et al. (2019), reporting the upper limit of the net ocean emission of acetaldehyde to be 34 Tg a−1. Yang et al. (2014) quantified the air–sea fluxes of several OVOCs (oxygenated volatile organic compounds) over the Atlantic Ocean by eddy covariance measurements, showing the ocean is a net source of acetaldehyde. Although Schlundt et al. (2017) reported uptake of acetaldehyde by the ocean from measurement-inferred fluxes in western Pacific coastal regions, to our knowledge, there is no direct experimental evidence showing the ocean to be a sink for acetaldehyde.
In order to test the importance of the oceanic emission of acetaldehyde, we implemented this source in the EMAC model. The measured seawater concentration of acetaldehyde was not available for the water area around the Arabian Peninsula. Wang et al. (2019) estimated the global average acetaldehyde surface seawater concentrations of the ocean mixed layer using a satellite-based approach similar to Millet et al. (2010), where the model estimation agreed well with limited reported measurements. From the Wang et al. (2019) results, the averaged seawater concentration of acetaldehyde around the Arabian Peninsula was generally much higher from June to August. As the photodegradation of CDOM is highly dependent on sunlight, the air–sea submodel (Pozzer et al., 2006) was augmented to include throughout the campaign a scaled acetaldehyde seawater concentration in the range of 0 ∼50 nM according to the solar radiation (Fig. S7). With this approach, the average of acetaldehyde seawater concentration estimated by the model is 13.4 nM, a reasonable level compared to the predicted level by Wang et al. (2019).
After adding the oceanic source of acetaldehyde, the model estimation was significantly improved (Fig. 7). As the oceanic source in the model is scaled according to the solar radiation, the measurement-to-model ratios were more strongly reduced during the day compared to the night. With oceanic emission included, the model underestimation was less significant, within a factor of 3 during the day and 4 during the night over the Mediterranean Sea, Red Sea, and Gulf of Aden. The most significant improvement was identified over the Red Sea North. As shown in Fig. 8, the model had much better agreement with the measurement after adding the oceanic source. The scatter plots for other regions can be found in Fig. S8. Over the Arabian Sea, the model significantly overestimated acetaldehyde mixing ratios, indicating the input seawater concentration of acetaldehyde might be too high. The SML layer starts to be effectively destroyed by the wave breaking when the wind speed exceeds 8 m s−1 (Gantt et al., 2011). As the average wind speed over the Arabian Sea was highest among the cruised areas (8.1±2.4 m s−1, Fig. S1), less contribution from the CDOM photodegradation to acetaldehyde in the surface seawater would be expected. For the Suez region, due to the limited model resolution (), little seawater was identified in the model, leading to negligible influence from the oceanic source.
Model underestimation of acetaldehyde, especially over the Suez, Red Sea, and Arabian Gulf, is also likely to be related to the coarse model resolution () (Fischer et al., 2015). Where model grid points contain areas of land, the higher and more variable terrestrial boundary layer height impacts the model prediction, whereas the measurements may only by influenced by a shallower and more stable marine boundary layer.

Figure 7Acetaldehyde measurement-to-model ratios without the oceanic source (white boxes) and with the oceanic source (blue boxes) in the model during (a) daytime and (b) nighttime in different regions. The boxes represent 25 % to 75 % of the dataset, with the central line and square indicating the median and mean values, respectively. The whiskers show data from 10 % to 90 %. The red dashed lines represent the 1 : 1 ratio.
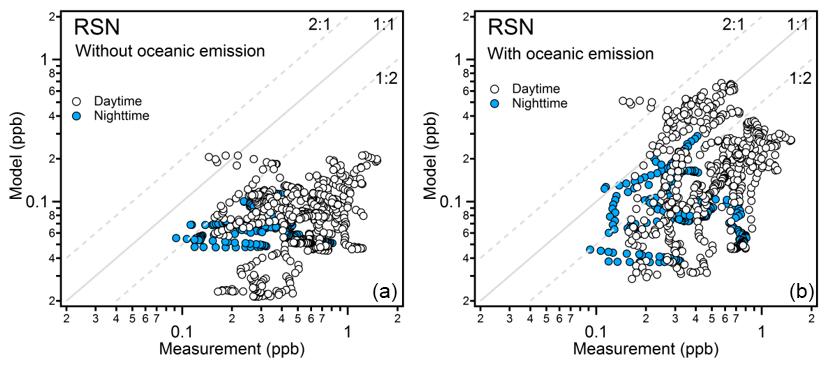
Figure 8Observed and simulated mixing ratios of acetaldehyde over the Red Sea North without oceanic emission (a) and with oceanic emission (b). The data points are separated into daytime and nighttime according to solar radiation.
3.4.3 Anthropogenic primary sources
Over the Arabian Gulf and Suez, the intensive photochemical production of carbonyls is apparent. Bourtsoukidis et al. (2020) compared measured hydrocarbons (ethane, propane, and butane) with the results from model simulations (the same model used in this study with the newly discovered deep water source implemented). The model was able to reproduce the measurement over most regions expect for some significant model underestimations in the Suez and Arabian Gulf, in which local and small-scale emissions were difficult for the model to capture. Therefore, an underestimation of the precursor hydrocarbons, as well as those large alkanes, alkenes, and cyclic hydrocarbons which were not measured (> C8) or included in the model (> C5), could be a reason for the model underestimation of acetaldehyde, especially in polluted regions. In addition, as mentioned in the previous case studies, high-ozone mixing ratios were observed over the Arabian Gulf, especially during the nighttime. Ethene and propene were found to be significantly underestimated during the nighttime high-ozone period by a factor over 10 (Fig. S9), which indicates that the nighttime ozonolysis of alkenes could be another important source of acetaldehyde, formaldehyde, and other carbonyls (Atkinson et al., 1995; Altshuller, 1993) in the Arabian Gulf.
Acetaldehyde, an oxygenated VOC, is not generally considered an important primary emission from oil and gas fields, but instead a photochemical product of hydrocarbon oxidation (Yuan et al., 2014; Koss et al., 2015, 2017). In contrast, primary sources of formaldehyde from oil and gas production processes, including both combustion and non-combustion processes, have been ascertained (Vaught, 1991). Le Baron and Stoeckenius (2015) concluded in their report on the Uinta Basin winter ozone study that besides formaldehyde, the other carbonyls were poorly understood in terms of their primary sources. Acetaldehyde and other carbonyls (aldehydes and ketones) have been reported as primary emissions from fossil fuel combustion, including ship emissions (Reda et al., 2014; Xiao et al., 2018; Huang et al., 2018) and vehicle emissions (Nogueira et al., 2014; Erickson et al., 2014; Dong et al., 2014). A possible explanation for the measurement–model discrepancy is that the active petroleum industry located in the Arabian Gulf and intensive marine transportation in the Suez are primary sources of acetaldehyde and other carbonyls which were not well constrained in the model. The Suez region, where the largest acetaldehyde discrepancy was identified, had a significant influence from biomass burning (see Sect. 3.2.2). Biomass burning emissions are notoriously difficult to model as they are highly variable in both time and space. In this study, the model failed to reproduce the acetonitrile level, with a range of only 40–50 ppt rather than 100–550 ppt measured over the Suez. Thus, besides the possibility of seawater emission from the Gulf of Suez and the Suez Canal, the underestimated biomass burning source in the model over the Suez will lead to an underestimation of acetaldehyde as well as other carbonyl compounds in this region.
3.4.4 Other possible secondary formation pathways
Although the model estimation was generally improved with the addition of an oceanic source, the model to measured ratios still varied over a wide range. As mentioned above, photodegradation of CDOM on the surface of seawater is a known source of acetaldehyde, although some studies focusing on real seawater samples did not observe clear diel cycles of seawater acetaldehyde (Beale et al., 2013; Yang et al., 2014). Fast microbial oxidation could be a reason (Dixon et al., 2013), while other non-light-driven sources of acetaldehyde could be an alternative explanation. In a recent study, Zhou et al. (2014) reported enhanced gas-phase carbonyl compounds including acetaldehyde during a laboratory experiment of ozone reacting with SML samples, indicating acetaldehyde could also be produced under non-light-driven heterogeneous oxidation. Wang et al. (2019) ventured a hypothetical source that organic aerosol can be an extra source of unattributed acetaldehyde in the free troposphere through light-driven production and ozonolysis. However, since the yield of acetaldehyde from such reactions is unknown, large uncertainties remain. Previous studies have shown that the organic matter fraction was highest in smaller sea spray aerosols and that the aerosols contain both saturated and unsaturated fatty acids originating from the seawater surface (i.e. SML) (Mochida et al., 2002; Cochran et al., 2016). Thus, for the AQABA campaign, both photodegradation and heterogeneous oxidation could occur on the surface of sea spray and pollution-associated aerosols, even over the remote open ocean, therefore being an extra source of acetaldehyde and other carbonyl compounds.
Another acetaldehyde formation pathway reported is gas-phase photolysis of pyruvic acid (Eger et al., 2020; Reed Harris et al., 2016), a compound mainly of biogenic origin. Pyruvic acid has been also observed in seawater (Kieber and Mopper, 1987; Zhou and Mopper, 1997) and was found up to 50 nM in the surface water of the eastern Pacific Ocean (Steinberg and Bada, 1984), while acetaldehyde was not the major product of aqueous-phase photolysis of pyruvic acid (Griffith et al., 2013). Zhou and Mopper (1997) pointed out that the net exchange direction for pyruvic acid is expected to be from the air to the sea due to high solubility, with a Henry's law constant of 3.1×10³ mol m−3 Pa−1 (Sander, 2015). Moreover, partitioning to aerosols could be an important sink for pyruvic acid (Reed et al., 2014; Griffith et al., 2013): an increasing concentration trend of pyruvic acid was observed in marine aerosols over the western North Pacific Ocean (Boreddy et al., 2017). Therefore, due to limited terrestrial biogenic sources of pyruvic acid for the AQABA campaign, the gas-phase level of pyruvic acid was expected to be low. Limited studies reported pyruvic acid level in the marine boundary layer and Baboukas et al. (2000) measured 1.1±1.0 ppt of pyruvic acid above the Atlantic Ocean. Pyruvic acid was measured by Jardine et al. (2010) using a PTR-MS at m∕z 89 in a forested environment. For the AQABA PTR-ToF-MS dataset, enhanced signals were observed at m∕z 89.024, with a mean mixing ratio of 35–110 ppt over different regions (Table S4), which is much more abundant than reported pyruvic acid levels by Baboukas et al. (2000). This might be due to the uncertainty associated with the theoretical methods of quantification used here or the presence of isomeric compounds on that mass, since pyruvic acid was not calibrated with the standard. Even if we assume the m∕z 89.024 to be entirely pyruvic acid, with a 60 % yield of acetaldehyde via photolysis (IUPAC, 2019), it gave a maximum of 13 ppt of acetaldehyde over the Arabian Gulf and 5–9 ppt over other regions, which were only 0.8 %–6 % of the mean mixing ratios (Table S4). Detailed information on the calculation can be found in the Supplement. Therefore, we conclude that the contribution from the photolysis of pyruvic acid is not an important source of the unattributed acetaldehyde during the AQABA campaign.
Observations of carbonyl compounds around the Arabian Peninsula were investigated in terms of mixing ratio abundance over different areas. Aliphatic carbonyl compounds were generally more abundant than the unsaturated and aromatic carbonyl compounds and were dominated by low-molecular-weight compounds (carbon number less than five). Aliphatic carbonyl compounds were found at the highest mixing ratios over the Arabian Gulf followed by the Suez region, while the lowest mixing ratios were observed over the Arabian Sea and the Gulf of Aden. Over the Mediterranean Sea, aliphatic carbonyls were low except for acetone, which was much higher compared to the levels observed over clean remote areas (i.e. Arabian Sea). The atmospheric composition over the Red Sea showed obvious differences between the northern and southern parts, with higher mixing ratios in the north. Similar region-dependent distributions were observed for unsaturated and aromatic carbonyls. Generally, the mixing ratios of aromatic carbonyl compounds decreased as the carbon number increased. Particularly over the Suez region, benzaldehyde (C7 aromatic carbonyls) was much more abundant than other aromatic carbonyls, indicating direct sources as well as abundant oxidation precursors. For unsaturated carbonyl compounds, C5 and C6 carbonyl compounds dominated the mixing ratio distribution, while the air chemistry highly depends on the chemical structure assignment of those masses.
Further case studies showed that the carbonyl compounds were highly correlated with the high ozone levels during daytime over the Arabian Gulf, while the air chemistry in the Suez region was strongly influenced by regional biomass burning. Due to the unexpectedly high loading of m∕z 69 (usually assigned as isoprene) observed in highly polluted regions, we further identified the correlations between m∕z 69 and other fragmentation masses of cycloalkanes according to previous studies conducted in oil and gas regions (Warneke et al., 2014; Yuan et al., 2014; Koss et al., 2017). The high correlations among fragments implied the existence of cycloalkanes in the polluted regions, which could be further oxidized to unsaturated carbonyl compounds (cyclic ketones or aldehydes).
As acetaldehyde was identified as having important additional sources, we further compared the measurements of major carbonyl species (acetaldehyde, acetone, and MEK) with a comprehensive global atmospheric chemistry model (EMAC). Acetaldehyde was found to have the highest discrepancy between the observations and model simulations, with the simulated values lower by up to a factor of 10. By adding an oceanic source of acetaldehyde produced via light-driven photodegradation of CDOM in the seawater, the model estimation improved significantly, especially over the Red Sea North. With the oceanic source added, modelled acetaldehyde became slightly overestimated in clean regions, suggesting that the emission rate employed represents an upper limit. The results indicate that the ocean plays an important role in the atmospheric acetaldehyde budget, under both clean and polluted conditions. The underestimated acetaldehyde in the model is significant as it will influence the atmospheric budget of e.g. PAN. As shown in Fig. 1, multiple sources and formation pathways need to be considered to better understand the atmospheric budget of acetaldehyde. Additional laboratory experiments and field measurements are necessary in order to verify all possible atmospheric formation mechanisms and to improve model simulations.
The data used in this study are available to all scientists agreeing to the AQABA protocol at https://doi.org/10.5281/zenodo.3974228 (Wang et al., 2020).
The supplement related to this article is available online at: https://doi.org/10.5194/acp-20-10807-2020-supplement.
AE and CS performed PTR-ToF-MS measurement and preliminary data processing. NW conducted data analysis and drafted the article. AP performed EMAC model simulation. EB and LE were responsible for NMHC measurements and data. DD, BH, and HF provided formaldehyde data. Ozone and actinic flux data were contributed by JS and JNC. Methane and carbon monoxide data were provided by JDP. JL designed and realized the campaign. JW supervised the study. All the authors contributed to editing the draft and approved the submitted version.
The authors declare that they have no conflict of interest.
We are grateful for the collaboration with the King Abdullah University of Science and Technology (KAUST), the Kuwait Institute for Scientific Research (KISR), and the Cyprus Institute (CyI) to fulfill the campaign. We would like to thank Captain Pavel Kirzner and the crew for their full support onboard the Kommandor Iona, Hays Ships Ltd. We are grateful for the support from all members involved in the AQABA campaign, especially Hartwig Harder for his general organization onboard the campaign, and Marcel Dorf, Claus Koeppel, Thomas Klüpfel, and Rolf Hofmann for logistical organization and their help with preparation and set-up. We would like to express our gratitude to Ivan Tadic and Philipp Eger for the use of a ship exhaust contamination flag.
The position of Nijing Wang was funded by the European Commission, H2020 Research Infrastructures (IMPACT (grant no. 674911)).
The article processing charges for this open-access
publication were covered by the Max Planck Society.
This paper was edited by Robert Harley and reviewed by two anonymous referees.
Abdelhady, S., Borello, D., Shaban, A., and Rispoli, F.: Viability Study of Biomass Power Plant Fired with Rice Straw in Egypt, Enrgy Proced., 61, 211–215, https://doi.org/10.1016/j.egypro.2014.11.1072, 2014.
Aklilu, Y.-A., Cho, S., Zhang, Q., and Taylor, E.: Source apportionment of volatile organic compounds measured near a cold heavy oil production area, Atmos. Res., 206, 75–86, https://doi.org/10.1016/j.atmosres.2018.02.007, 2018.
Altshuller, A. P.: Production of aldehydes as primary emissions and from secondary atmospheric reactions of alkenes and alkanes during the night and early morning hours, Atmos. Environ. A-Gen., 27, 21–32, https://doi.org/10.1016/0960-1686(93)90067-9, 1993.
Apel, E. C., Brauers, T., Koppmann, R., Bandowe, B., Boßmeyer, J., Holzke, C., Tillmann, R., Wahner, A., Wegener, R., Brunner, A., Jocher, M., Ruuskanen, T., Spirig, C., Steigner, D., Steinbrecher, R., Gomez Alvarez, E., Müller, K., Burrows, J. P., Schade, G., Solomon, S. J., Ladstätter-Weißenmayer, A., Simmonds, P., Young, D., Hopkins, J. R., Lewis, A. C., Legreid, G., Reimann, S., Hansel, A., Wisthaler, A., Blake, R. S., Ellis, A. M., Monks, P. S., and Wyche, K. P.: Intercomparison of oxygenated volatile organic compound measurements at the SAPHIR atmosphere simulation chamber, J. Geophys. Res., 113, D20307, https://doi.org/10.1029/2008jd009865, 2008.
Atkinson, R. and Arey, J.: Atmospheric Degradation of Volatile Organic Compounds, Chem. Rev., 103, 4605–4638, https://doi.org/10.1021/cr0206420, 2003.
Atkinson, R., Tuazon, E. C., and Aschmann, S. M.: Products of the Gas-Phase Reactions of a Series of 1-Alkenes and 1-Methylcyclohexene with the OH Radical in the Presence of NO, Environ. Sci. Technol., 29, 1674–1680, https://doi.org/10.1021/es00006a035, 1995.
Baboukas, E. D., Kanakidou, M., and Mihalopoulos, N.: Carboxylic acids in gas and particulate phase above the Atlantic Ocean, J. Geophys. Res.-Atmos., 105, 14459–14471, https://doi.org/10.1029/1999jd900977, 2000.
Bates, T. S., Lamb, B. K., Guenther, A., Dignon, J., and Stoiber, R. E.: Sulfur emissions to the atmosphere from natural sourees, J. Atmos. Chem., 14, 315–337, https://doi.org/10.1007/bf00115242, 1992.
Beale, R., Dixon, J. L., Arnold, S. R., Liss, P. S., and Nightingale, P. D.: Methanol, acetaldehyde, and acetone in the surface waters of the Atlantic Ocean, J. Geophys. Res.-Oceans, 118, 5412–5425, https://doi.org/10.1002/jgrc.20322, 2013.
Borbon, A., Gilman, J. B., Kuster, W. C., Grand, N., Chevaillier, S., Colomb, A., Dolgorouky, C., Gros, V., Lopez, M., Sarda-Esteve, R., Holloway, J., Stutz, J., Petetin, H., McKeen, S., Beekmann, M., Warneke, C., Parrish, D. D., and de Gouw, J. A.: Emission ratios of anthropogenic volatile organic compounds in northern mid-latitude megacities: Observations versus emission inventories in Los Angeles and Paris, J. Geophys. Res.-Atmos., 118, 2041–2057, https://doi.org/10.1002/jgrd.50059, 2013.
Bourtsoukidis, E., Williams, J., Kesselmeier, J., Jacobi, S., and Bonn, B.: From emissions to ambient mixing ratios: online seasonal field measurements of volatile organic compounds over a Norway spruce-dominated forest in central Germany, Atmos. Chem. Phys., 14, 6495–6510, https://doi.org/10.5194/acp-14-6495-2014, 2014.
Bourtsoukidis, E., Ernle, L., Crowley, J. N., Lelieveld, J., Paris, J.-D., Pozzer, A., Walter, D., and Williams, J.: Non-methane hydrocarbon (C2–C8) sources and sinks around the Arabian Peninsula, Atmos. Chem. Phys., 19, 7209–7232, https://doi.org/10.5194/acp-19-7209-2019, 2019.
Bourtsoukidis, E., Pozzer, A., Sattler, T., Matthaios, V. N., Ernle, L., Edtbauer, A., Fischer, H., Konemann, T., Osipov, S., Paris, J. D., Pfannerstill, E. Y., Stonner, C., Tadic, I., Walter, D., Wang, N., Lelieveld, J., and Williams, J.: The Red Sea Deep Water is a potent source of atmospheric ethane and propane, Nat. Commun., 11, 447, https://doi.org/10.1038/s41467-020-14375-0, 2020.
Boreddy, S. K. R., Kawamura, K., and Tachibana, E.: Long-term (2001–2013) observations of water-soluble dicarboxylic acids and related compounds over the western North Pacific: trends, seasonality and source apportionment, Sci. Rep.-UK, 7, 8518, https://doi.org/10.1038/s41598-017-08745-w, 2017.
Brilli, F., Gioli, B., Ciccioli, P., Zona, D., Loreto, F., Janssens, I. A., and Ceulemans, R.: Proton Transfer Reaction Time-of-Flight Mass Spectrometric (PTR-TOF-MS) determination of volatile organic compounds (VOCs) emitted from a biomass fire developed under stable nocturnal conditions, Atmos. Environ., 97, 54–67, https://doi.org/10.1016/j.atmosenv.2014.08.007, 2014.
Buhr, K., van Ruth, S., and Delahunty, C.: Analysis of volatile flavour compounds by Proton Transfer Reaction-Mass Spectrometry: fragmentation patterns and discrimination between isobaric and isomeric compounds, Int. J. Mass Spectrom., 221, 1–7, https://doi.org/10.1016/S1387-3806(02)00896-5, 2002.
Cabrera-Perez, D., Taraborrelli, D., Sander, R., and Pozzer, A.: Global atmospheric budget of simple monocyclic aromatic compounds, Atmos. Chem. Phys., 16, 6931–6947, https://doi.org/10.5194/acp-16-6931-2016, 2016.
Carlier, P., Hannachi, H., and Mouvier, G.: The chemistry of carbonyl compounds in the atmosphere – A review, Atmos. Environ., 20, 2079–2099, https://doi.org/10.1016/0004-6981(86)90304-5, 1986.
Celik, S., Drewnick, F., Fachinger, F., Brooks, J., Darbyshire, E., Coe, H., Paris, J.-D., Eger, P. G., Schuladen, J., Tadic, I., Friedrich, N., Dienhart, D., Hottmann, B., Fischer, H., Crowley, J. N., Harder, H., and Borrmann, S.: Influence of vessel characteristics and atmospheric processes on the gas and particle phase of ship emission plumes: in situ measurements in the Mediterranean Sea and around the Arabian Peninsula, Atmos. Chem. Phys., 20, 4713–4734, https://doi.org/10.5194/acp-20-4713-2020, 2020.
Ciuraru, R., Fine, L., van Pinxteren, M., D'Anna, B., Herrmann, H., and George, C.: Photosensitized production of functionalized and unsaturated organic compounds at the air-sea interface, Sci. Rep.-UK, 5, 12741, https://doi.org/10.1038/srep12741, 2015.
Cochran, R. E., Laskina, O., Jayarathne, T., Laskin, A., Laskin, J., Lin, P., Sultana, C., Lee, C., Moore, K. A., Cappa, C. D., Bertram, T. H., Prather, K. A., Grassian, V. H., and Stone, E. A.: Analysis of Organic Anionic Surfactants in Fine and Coarse Fractions of Freshly Emitted Sea Spray Aerosol, Environ. Sci. Technol., 50, 2477–2486, https://doi.org/10.1021/acs.est.5b04053, 2016.
Colomb, A., Williams, J., Crowley, J., Gros, V., Hofmann, R., Salisbury, G., Klüpfel, T., Kormann, R., Stickler, A., Forster, C., and Lelieveld, J.: Airborne Measurements of Trace Organic Species in the Upper Troposphere Over Europe: the Impact of Deep Convection, Environ. Chem., 3, 244–259, https://doi.org/10.1071/en06020, 2006.
Colomb, A., Gros, V., Alvain, S., Sarda-Esteve, R., Bonsang, B., Moulin, C., Klüpfel, T., and Williams, J.: Variation of atmospheric volatile organic compounds over the Southern Indian Ocean (30–49∘ S), Environ. Chem., 6, 70–82, https://doi.org/10.1071/en08072, 2009.
de Gouw, J. and Warneke, C.: Measurements of volatile organic compounds in the earth's atmosphere using proton-transfer-reaction mass spectrometry, Mass Spectrom. Rev., 26, 223–257, 2007.
de Gouw, J. A., Middlebrook, A. M., Warneke, C., Goldan, P. D., Kuster, W. C., Roberts, J. M., Fehsenfeld, F. C., Worsnop, D. R., Canagaratna, M. R., Pszenny, A. A. P., Keene, W. C., Marchewka, M., Bertman, S. B., and Bates, T. S.: Budget of organic carbon in a polluted atmosphere: Results from the New England Air Quality Study in 2002, J. Geophys. Res.-Atmos., 110, D16305, https://doi.org/10.1029/2004JD005623, 2005.
Dixon, J. L., Beale, R., and Nightingale, P. D.: Production of methanol, acetaldehyde, and acetone in the Atlantic Ocean, Geophys. Res. Lett., 40, 4700–4705, https://doi.org/10.1002/grl.50922, 2013.
Dolgorouky, C., Gros, V., Sarda-Esteve, R., Sinha, V., Williams, J., Marchand, N., Sauvage, S., Poulain, L., Sciare, J., and Bonsang, B.: Total OH reactivity measurements in Paris during the 2010 MEGAPOLI winter campaign, Atmos. Chem. Phys., 12, 9593–9612, https://doi.org/10.5194/acp-12-9593-2012, 2012.
Dong, D., Shao, M., Li, Y., Lu, S., Wang, Y., Ji, Z., and Tang, D.: Carbonyl emissions from heavy-duty diesel vehicle exhaust in China and the contribution to ozone formation potential, J. Environ. Sci., 26, 122–128, https://doi.org/10.1016/S1001-0742(13)60387-3, 2014.
Edtbauer, A., Stönner, C., Pfannerstill, E. Y., Berasategui, M., Walter, D., Crowley, J. N., Lelieveld, J., and Williams, J.: A new marine biogenic emission: methane sulfonamide (MSAM), dimethyl sulfide (DMS), and dimethyl sulfone (DMSO2) measured in air over the Arabian Sea, Atmos. Chem. Phys., 20, 6081–6094, https://doi.org/10.5194/acp-20-6081-2020, 2020.
Edwards, P. M., Brown, S. S., Roberts, J. M., Ahmadov, R., Banta, R. M., deGouw, J. A., Dube, W. P., Field, R. A., Flynn, J. H., Gilman, J. B., Graus, M., Helmig, D., Koss, A., Langford, A. O., Lefer, B. L., Lerner, B. M., Li, R., Li, S. M., McKeen, S. A., Murphy, S. M., Parrish, D. D., Senff, C. J., Soltis, J., Stutz, J., Sweeney, C., Thompson, C. R., Trainer, M. K., Tsai, C., Veres, P. R., Washenfelder, R. A., Warneke, C., Wild, R. J., Young, C. J., Yuan, B., and Zamora, R.: High winter ozone pollution from carbonyl photolysis in an oil and gas basin, Nature, 514, 351–354, https://doi.org/10.1038/nature13767, 2014.
Eger, P. G., Schuladen, J., Sobanski, N., Fischer, H., Karu, E., Williams, J., Riva, M., Zha, Q., Ehn, M., Quéléver, L. L. J., Schallhart, S., Lelieveld, J., and Crowley, J. N.: Pyruvic acid in the boreal forest: gas-phase mixing ratios and impact on radical chemistry, Atmos. Chem. Phys., 20, 3697–3711, https://doi.org/10.5194/acp-20-3697-2020, 2020.
Ellis, A. M. and Mayhew, C. A.: Proton transfer reaction mass spectrometry: principles and applications, John Wiley & Sons, UK, 2013.
Erickson, M. H., Gueneron, M., and Jobson, B. T.: Measuring long chain alkanes in diesel engine exhaust by thermal desorption PTR-MS, Atmos. Meas. Tech., 7, 225–239, https://doi.org/10.5194/amt-7-225-2014, 2014.
Fall, R.: Abundant Oxygenates in the Atmosphere:? A Biochemical Perspective, Chem. Rev., 103, 4941–4952, https://doi.org/10.1021/cr0206521, 2003.
Fan, J. and Zhang, R.: Atmospheric Oxidation Mechanism of Isoprene, Environ. Chem., 1, 140–149, https://doi.org/10.1071/EN04045, 2004.
Finlayson-Pitts, B. J. and Pitts, J. N.: Tropospheric Air Pollution: Ozone, Airborne Toxics, Polycyclic Aromatic Hydrocarbons, and Particles, Science, 276, 1045, https://doi.org/10.1126/science.276.5315.1045, 1997.
Finlayson-Pitts, B. J. and Pitts Jr., J. N.: Chemistry of the upper and lower atmosphere: theory, experiments, and applications, Elsevier, USA, 1999.
Fischer, E. V., Jacob, D. J., Millet, D. B., Yantosca, R. M., and Mao, J.: The role of the ocean in the global atmospheric budget of acetone, Geophys. Res. Lett., 39, L01807, https://doi.org/10.1029/2011gl050086, 2012.
Fischer, H., Pozzer, A., Schmitt, T., Jöckel, P., Klippel, T., Taraborrelli, D., and Lelieveld, J.: Hydrogen peroxide in the marine boundary layer over the South Atlantic during the OOMPH cruise in March 2007, Atmos. Chem. Phys., 15, 6971–6980, https://doi.org/10.5194/acp-15-6971-2015, 2015.
Gantt, B., Meskhidze, N., Facchini, M. C., Rinaldi, M., Ceburnis, D., and O'Dowd, C. D.: Wind speed dependent size-resolved parameterization for the organic mass fraction of sea spray aerosol, Atmos. Chem. Phys., 11, 8777–8790, https://doi.org/10.5194/acp-11-8777-2011, 2011.
Gentner, D. R., Isaacman, G., Worton, D. R., Chan, A. W. H., Dallmann, T. R., Davis, L., Liu, S., Day, D. A., Russell, L. M., Wilson, K. R., Weber, R., Guha, A., Harley, R. A., and Goldstein, A. H.: Elucidating secondary organic aerosol from diesel and gasoline vehicles through detailed characterization of organic carbon emissions, P. Natl. Acad. Sci. USA, 109, 18318, https://doi.org/10.1073/pnas.1212272109, 2012.
Gilman, J. B., Lerner, B. M., Kuster, W. C., and de Gouw, J. A.: Source signature of volatile organic compounds from oil and natural gas operations in northeastern Colorado, Environ. Sci. Technol., 47, 1297–1305, https://doi.org/10.1021/es304119a, 2013.
Griffith, E. C., Carpenter, B. K., Shoemaker, R. K., and Vaida, V.: Photochemistry of aqueous pyruvic acid, P. Natl. Acad. Sci. USA, 110, 11714, https://doi.org/10.1073/pnas.1303206110, 2013.
Gueneron, M., Erickson, M. H., VanderSchelden, G. S., and Jobson, B. T.: PTR-MS fragmentation patterns of gasoline hydrocarbons, Int. J. Mass Spectrom., 379, 97–109, https://doi.org/10.1016/j.ijms.2015.01.001, 2015.
Guo, H., Ling, Z. H., Cheung, K., Wang, D. W., Simpson, I. J., and Blake, D. R.: Acetone in the atmosphere of Hong Kong: Abundance, sources and photochemical precursors, Atmos. Environ., 65, 80–88, https://doi.org/10.1016/j.atmosenv.2012.10.027, 2013.
Holzinger, R., Warneke, C., Hansel, A., Jordan, A., Lindinger, W., Scharffe, D. H., Schade, G., and Crutzen, P. J.: Biomass burning as a source of formaldehyde, acetaldehyde, methanol, acetone, acetonitrile, and hydrogen cyanide, Geophys. Res. Lett., 26, 1161–1164, https://doi.org/10.1029/1999gl900156, 1999.
Holzinger, R., Jordan, A., Hansel, A., and Lindinger, W.: Automobile Emissions of Acetonitrile: Assessment of its Contribution to the Global Source, J. Atmos. Chem., 38, 187–193, https://doi.org/10.1023/A:1006435723375, 2001.
Holzinger, R., Williams, J., Salisbury, G., Klüpfel, T., de Reus, M., Traub, M., Crutzen, P. J., and Lelieveld, J.: Oxygenated compounds in aged biomass burning plumes over the Eastern Mediterranean: evidence for strong secondary production of methanol and acetone, Atmos. Chem. Phys., 5, 39–46, https://doi.org/10.5194/acp-5-39-2005, 2005.
Hornbrook, R. S., Hills, A. J., Riemer, D. D., Abdelhamid, A., Flocke, F. M., Hall, S. R., Huey, L. G., Knapp, D. J., Liao, J., Mauldin III, R. L., Montzka, D. D., Orlando, J. J., Shepson, P. B., Sive, B., Staebler, R. M., Tanner, D. J., Thompson, C. R., Turnipseed, A., Ullmann, K., Weinheimer, A. J., and Apel, E. C.: Arctic springtime observations of volatile organic compounds during the OASIS-2009 campaign, J. Geophys. Res.-Atmos., 121, 9789–9813, https://doi.org/10.1002/2015jd024360, 2016.
Huang, C., Hu, Q., Wang, H., Qiao, L., Jing, S., Wang, H., Zhou, M., Zhu, S., Ma, Y., Lou, S., Li, L., Tao, S., Li, Y., and Lou, D.: Emission factors of particulate and gaseous compounds from a large cargo vessel operated under real-world conditions, Environ. Pollut., 242, 667–674, https://doi.org/10.1016/j.envpol.2018.07.036, 2018.
IUPAC: Task Group on Atmospheric Chemical Kinetic Data Evaluation, available at: http://iupac.pole-ether.fr (last access: 14 July 2020), 2019.
Jacob, D. J., Field, B. D., Jin, E. M., Bey, I., Li, Q., Logan, J. A., Yantosca, R. M., and Singh, H. B.: Atmospheric budget of acetone, J. Geophys. Res.-Atmos., 107, ACH 5-1–ACH 5-17, https://doi.org/10.1029/2001jd000694, 2002.
Jardine, K. J., Sommer, E. D., Saleska, S. R., Huxman, T. E., Harley, P. C., and Abrell, L.: Gas Phase Measurements of Pyruvic Acid and Its Volatile Metabolites, Environ. Sci. Technol., 44, 2454–2460, https://doi.org/10.1021/es903544p, 2010.
Ji, Y., Zhao, J., Terazono, H., Misawa, K., Levitt, N. P., Li, Y., Lin, Y., Peng, J., Wang, Y., Duan, L., Pan, B., Zhang, F., Feng, X., An, T., Marrero-Ortiz, W., Secrest, J., Zhang, A. L., Shibuya, K., Molina, M. J., and Zhang, R.: Reassessing the atmospheric oxidation mechanism of toluene, P. Natl. Acad. Sci. USA, 114, 8169, https://doi.org/10.1073/pnas.1705463114, 2017.
Jöckel, P., Kerkweg, A., Pozzer, A., Sander, R., Tost, H., Riede, H., Baumgaertner, A., Gromov, S., and Kern, B.: Development cycle 2 of the Modular Earth Submodel System (MESSy2), Geosci. Model Dev., 3, 717–752, https://doi.org/10.5194/gmd-3-717-2010, 2010.
Khan, M. A. H., Cooke, M. C., Utembe, S. R., Archibald, A. T., Maxwell, P., Morris, W. C., Xiao, P., Derwent, R. G., Jenkin, M. E., Percival, C. J., Walsh, R. C., Young, T. D. S., Simmonds, P. G., Nickless, G., O'Doherty, S., and Shallcross, D. E.: A study of global atmospheric budget and distribution of acetone using global atmospheric model STOCHEM-CRI, Atmos. Environ., 112, 269–277, https://doi.org/10.1016/j.atmosenv.2015.04.056, 2015.
Kieber, D. J. and Mopper, K.: Photochemical formation of glyoxylic and pyruvic acids in seawater, Mar. Chem., 21, 135–149, https://doi.org/10.1016/0304-4203(87)90034-X, 1987.
Kieber, R. J., Zhou, X., and Mopper, K.: Formation of carbonyl compounds from UV-induced photodegradation of humic substances in natural waters: Fate of riverine carbon in the sea, Limnol. Oceanogr., 35, 1503–1515, https://doi.org/10.4319/lo.1990.35.7.1503, 1990.
Kim, K.-H., Hong, Y.-J., Pal, R., Jeon, E.-C., Koo, Y.-S., and Sunwoo, Y.: Investigation of carbonyl compounds in air from various industrial emission sources, Chemosphere, 70, 807–820, https://doi.org/10.1016/j.chemosphere.2007.07.025, 2008.
Koss, A., Yuan, B., Warneke, C., Gilman, J. B., Lerner, B. M., Veres, P. R., Peischl, J., Eilerman, S., Wild, R., Brown, S. S., Thompson, C. R., Ryerson, T., Hanisco, T., Wolfe, G. M., Clair, J. M. St., Thayer, M., Keutsch, F. N., Murphy, S., and de Gouw, J.: Observations of VOC emissions and photochemical products over US oil- and gas-producing regions using high-resolution H3O+ CIMS (PTR-ToF-MS), Atmos. Meas. Tech., 10, 2941–2968, https://doi.org/10.5194/amt-10-2941-2017, 2017.
Koss, A. R., de Gouw, J., Warneke, C., Gilman, J. B., Lerner, B. M., Graus, M., Yuan, B., Edwards, P., Brown, S. S., Wild, R., Roberts, J. M., Bates, T. S., and Quinn, P. K.: Photochemical aging of volatile organic compounds associated with oil and natural gas extraction in the Uintah Basin, UT, during a wintertime ozone formation event, Atmos. Chem. Phys., 15, 5727–5741, https://doi.org/10.5194/acp-15-5727-2015, 2015.
Koss, A. R., Sekimoto, K., Gilman, J. B., Selimovic, V., Coggon, M. M., Zarzana, K. J., Yuan, B., Lerner, B. M., Brown, S. S., Jimenez, J. L., Krechmer, J., Roberts, J. M., Warneke, C., Yokelson, R. J., and de Gouw, J.: Non-methane organic gas emissions from biomass burning: identification, quantification, and emission factors from PTR-ToF during the FIREX 2016 laboratory experiment, Atmos. Chem. Phys., 18, 3299–3319, https://doi.org/10.5194/acp-18-3299-2018, 2018.
Kroll, J. H., Ng, N. L., Murphy, S. M., Varutbangkul, V., Flagan, R. C., and Seinfeld, J. H.: Chamber studies of secondary organic aerosol growth by reactive uptake of simple carbonyl compounds, J. Geophys. Res., 110, D23207, https://doi.org/10.1029/2005jd006004, 2005.
Lelieveld, J., Gromov, S., Pozzer, A., and Taraborrelli, D.: Global tropospheric hydroxyl distribution, budget and reactivity, Atmos. Chem. Phys., 16, 12477–12493, https://doi.org/10.5194/acp-16-12477-2016, 2016.
Lewis, A. C., Hopkins, J. R., Carpenter, L. J., Stanton, J., Read, K. A., and Pilling, M. J.: Sources and sinks of acetone, methanol, and acetaldehyde in North Atlantic marine air, Atmos. Chem. Phys., 5, 1963–1974, https://doi.org/10.5194/acp-5-1963-2005, 2005.
Li, S.-M., Leithead, A., Moussa, S. G., Liggio, J., Moran, M. D., Wang, D., Hayden, K., Darlington, A., Gordon, M., Staebler, R., Makar, P. A., Stroud, C. A., McLaren, R., Liu, P. S. K., O'Brien, J., Mittermeier, R. L., Zhang, J., Marson, G., Cober, S. G., Wolde, M., and Wentzell, J. J. B.: Differences between measured and reported volatile organic compound emissions from oil sands facilities in Alberta, Canada, P. Natl. Acad. Sci. USA, 114, E3756, https://doi.org/10.1073/pnas.1617862114, 2017.
Lindinger, W., Hansel, A., and Jordan, A.: On-line monitoring of volatile organic compounds at pptv levels by means of proton-transfer-reaction mass spectrometry (PTR-MS) medical applications, food control and environmental research, Int. J. Mass Spectrom., 173, 191–241, 1998.
Lobert, J. M., Scharffe, D. H., Hao, W. M., and Crutzen, P. J.: Importance of biomass burning in the atmospheric budgets of nitrogen-containing gases, Nature, 346, 552–554, https://doi.org/10.1038/346552a0, 1990.
Marandino, C. A., De Bruyn, W. J., Miller, S. D., Prather, M. J., and Saltzman, E. S.: Oceanic uptake and the global atmospheric acetone budget, Geophys. Res. Lett., 32, L15806, https://doi.org/10.1029/2005GL023285, 2005.
Millet, D. B., Guenther, A., Siegel, D. A., Nelson, N. B., Singh, H. B., de Gouw, J. A., Warneke, C., Williams, J., Eerdekens, G., Sinha, V., Karl, T., Flocke, F., Apel, E., Riemer, D. D., Palmer, P. I., and Barkley, M.: Global atmospheric budget of acetaldehyde: 3-D model analysis and constraints from in-situ and satellite observations, Atmos. Chem. Phys., 10, 3405–3425, https://doi.org/10.5194/acp-10-3405-2010, 2010.
Mochida, M., Kitamori, Y., Kawamura, K., Nojiri, Y., and Suzuki, K.: Fatty acids in the marine atmosphere: Factors governing their concentrations and evaluation of organic films on sea-salt particles, J. Geophys. Res.-Atmos., 107, AAC 1-1–AAC 1-10, https://doi.org/10.1029/2001jd001278, 2002.
Müller, M., Graus, M., Wisthaler, A., Hansel, A., Metzger, A., Dommen, J., and Baltensperger, U.: Analysis of high mass resolution PTR-TOF mass spectra from 1,3,5-trimethylbenzene (TMB) environmental chamber experiments, Atmos. Chem. Phys., 12, 829–843, https://doi.org/10.5194/acp-12-829-2012, 2012.
Müller, M., Mikoviny, T., Jud, W., D'Anna, B., and Wisthaler, A.: A new software tool for the analysis of high resolution PTR-TOF mass spectra, Chemometr. Intell. Lab., 127, 158–165, https://doi.org/10.1016/j.chemolab.2013.06.011, 2013.
Meusel, H., Kuhn, U., Reiffs, A., Mallik, C., Harder, H., Martinez, M., Schuladen, J., Bohn, B., Parchatka, U., Crowley, J. N., Fischer, H., Tomsche, L., Novelli, A., Hoffmann, T., Janssen, R. H. H., Hartogensis, O., Pikridas, M., Vrekoussis, M., Bourtsoukidis, E., Weber, B., Lelieveld, J., Williams, J., Pöschl, U., Cheng, Y., and Su, H.: Daytime formation of nitrous acid at a coastal remote site in Cyprus indicating a common ground source of atmospheric HONO and NO, Atmos. Chem. Phys., 16, 14475–14493, https://doi.org/10.5194/acp-16-14475-2016, 2016.
Nogueira, T., Dominutti, P. A., de Carvalho, L. R. F., Fornaro, A., and Andrade, M. d. F.: Formaldehyde and acetaldehyde measurements in urban atmosphere impacted by the use of ethanol biofuel: Metropolitan Area of Sao Paulo (MASP), 2012–2013, Fuel, 134, 505–513, https://doi.org/10.1016/j.fuel.2014.05.091, 2014.
Northway, M. J., de Gouw, J. A., Fahey, D. W., Gao, R. S., Warneke, C., Roberts, J. M., and Flocke, F.: Evaluation of the role of heterogeneous oxidation of alkenes in the detection of atmospheric acetaldehyde, Atmos. Environ., 38, 6017–6028, https://doi.org/10.1016/j.atmosenv.2004.06.039, 2004.
Pfannerstill, E. Y., Wang, N., Edtbauer, A., Bourtsoukidis, E., Crowley, J. N., Dienhart, D., Eger, P. G., Ernle, L., Fischer, H., Hottmann, B., Paris, J.-D., Stönner, C., Tadic, I., Walter, D., Lelieveld, J., and Williams, J.: Shipborne measurements of total OH reactivity around the Arabian Peninsula and its role in ozone chemistry, Atmos. Chem. Phys., 19, 11501–11523, https://doi.org/10.5194/acp-19-11501-2019, 2019.
Pozzer, A., Jöckel, P., Sander, R., Williams, J., Ganzeveld, L., and Lelieveld, J.: Technical Note: The MESSy-submodel AIRSEA calculating the air-sea exchange of chemical species, Atmos. Chem. Phys., 6, 5435–5444, https://doi.org/10.5194/acp-6-5435-2006, 2006.
Pozzer, A., Jöckel, P., Tost, H., Sander, R., Ganzeveld, L., Kerkweg, A., and Lelieveld, J.: Simulating organic species with the global atmospheric chemistry general circulation model ECHAM5/MESSy1: a comparison of model results with observations, Atmos. Chem. Phys., 7, 2527–2550, https://doi.org/10.5194/acp-7-2527-2007, 2007.
Pozzer, A., de Meij, A., Pringle, K. J., Tost, H., Doering, U. M., van Aardenne, J., and Lelieveld, J.: Distributions and regional budgets of aerosols and their precursors simulated with the EMAC chemistry-climate model, Atmos. Chem. Phys., 12, 961–987, https://doi.org/10.5194/acp-12-961-2012, 2012.
Read, K. A., Carpenter, L. J., Arnold, S. R., Beale, R., Nightingale, P. D., Hopkins, J. R., Lewis, A. C., Lee, J. D., Mendes, L., and Pickering, S. J.: Multiannual observations of acetone, methanol, and acetaldehyde in remote tropical atlantic air: implications for atmospheric OVOC budgets and oxidative capacity, Environ. Sci. Technol., 46, 11028–11039, https://doi.org/10.1021/es302082p, 2012.
Reda, A. A., Schnelle-Kreis, J., Orasche, J., Abbaszade, G., Lintelmann, J., Arteaga-Salas, J. M., Stengel, B., Rabe, R., Harndorf, H., Sippula, O., Streibel, T., and Zimmermann, R.: Gas phase carbonyl compounds in ship emissions: Differences between diesel fuel and heavy fuel oil operation, Atmos. Environ., 94, 467–478, https://doi.org/10.1016/j.atmosenv.2014.05.053, 2014.
Reed Harris, A. E., Ervens, B., Shoemaker, R. K., Kroll, J. A., Rapf, R. J., Griffith, E. C., Monod, A., and Vaida, V.: Photochemical kinetics of pyruvic acid in aqueous solution, J. Phys. Chem. A, 118, 8505–8516, https://doi.org/10.1021/jp502186q, 2014.
Reed Harris, A. E., Doussin, J.-F., Carpenter, B. K., and Vaida, V.: Gas-Phase Photolysis of Pyruvic Acid: The Effect of Pressure on Reaction Rates and Products, J. Phys. Chem. A, 120, 10123–10133, https://doi.org/10.1021/acs.jpca.6b09058, 2016.
Roberts, J. M., Fehsenfeld, F. C., Liu, S. C., Bollinger, M. J., Hahn, C., Albritton, D. L., and Sievers, R. E.: Measurements of aromatic hydrocarbon ratios and NOx concentrations in the rural troposphere: Observation of air mass photochemical aging and NOx removal, Atmos. Environ., 18, 2421–2432, https://doi.org/10.1016/0004-6981(84)90012-X, 1984.
Roeckner, E., Brokopf, R., Esch, M., Giorgetta, M., Hagemann, S., Kornblueh, L., Manzini, E., Schlese, U., and Schulzweida, U.: Sensitivity of Simulated Climate to Horizontal and Vertical Resolution in the ECHAM5 Atmosphere Model, J. Climate, 19, 3771–3791, https://doi.org/10.1175/JCLI3824.1, 2006.
Rutter, A. P., Griffin, R. J., Cevik, B. K., Shakya, K. M., Gong, L., Kim, S., Flynn, J. H., and Lefer, B. L.: Sources of air pollution in a region of oil and gas exploration downwind of a large city, Atmos. Environ., 120, 89–99, https://doi.org/10.1016/j.atmosenv.2015.08.073, 2015.
Sahu, L. K., Tripathi, N., and Yadav, R.: Contribution of biogenic and photochemical sources to ambient VOCs during winter to summer transition at a semi-arid urban site in India, Environ. Pollut., 229, 595–606, https://doi.org/10.1016/j.envpol.2017.06.091, 2017.
Said, N., El-Shatoury, S. A., Díaz, L. F., and Zamorano, M.: Quantitative appraisal of biomass resources and their energy potential in Egypt, Renew. Sust. Energ. Rev., 24, 84–91, https://doi.org/10.1016/j.rser.2013.03.014, 2013.
Sander, R.: Compilation of Henry's law constants (version 4.0) for water as solvent, Atmos. Chem. Phys., 15, 4399–4981, https://doi.org/10.5194/acp-15-4399-2015, 2015.
Sander, R., Baumgaertner, A., Cabrera-Perez, D., Frank, F., Gromov, S., Grooß, J.-U., Harder, H., Huijnen, V., Jöckel, P., Karydis, V. A., Niemeyer, K. E., Pozzer, A., Riede, H., Schultz, M. G., Taraborrelli, D., and Tauer, S.: The community atmospheric chemistry box model CAABA/MECCA-4.0, Geosci. Model Dev., 12, 1365–1385, https://doi.org/10.5194/gmd-12-1365-2019, 2019.
Schauer, J. J., Kleeman, M. J., Cass, G. R., and Simoneit, B. R. T.: Measurement of Emissions from Air Pollution Sources. 3. C1–C29 Organic Compounds from Fireplace Combustion of Wood, Environ. Sci. Technol., 35, 1716–1728, https://doi.org/10.1021/es001331e, 2001.
Schlundt, C., Tegtmeier, S., Lennartz, S. T., Bracher, A., Cheah, W., Krüger, K., Quack, B., and Marandino, C. A.: Oxygenated volatile organic carbon in the western Pacific convective center: ocean cycling, air–sea gas exchange and atmospheric transport, Atmos. Chem. Phys., 17, 10837–10854, https://doi.org/10.5194/acp-17-10837-2017, 2017.
Sheng, J., Zhao, D., Ding, D., Li, X., Huang, M., Gao, Y., Quan, J., and Zhang, Q.: Characterizing the level, photochemical reactivity, emission, and source contribution of the volatile organic compounds based on PTR-TOF-MS during winter haze period in Beijing, China, Atmos. Res., 212, 54–63, https://doi.org/10.1016/j.atmosres.2018.05.005, 2018.
Simpson, I. J., Blake, N. J., Barletta, B., Diskin, G. S., Fuelberg, H. E., Gorham, K., Huey, L. G., Meinardi, S., Rowland, F. S., Vay, S. A., Weinheimer, A. J., Yang, M., and Blake, D. R.: Characterization of trace gases measured over Alberta oil sands mining operations: 76 speciated C2–C10 volatile organic compounds (VOCs), CO2, CH4, CO, NO, NO2, NOy, O3 and SO2, Atmos. Chem. Phys., 10, 11931–11954, https://doi.org/10.5194/acp-10-11931-2010, 2010.
Singh, H. B.: Analysis of the atmospheric distribution, sources, and sinks of oxygenated volatile organic chemicals based on measurements over the Pacific during TRACE-P, J. Geophys. Res., 109, D15S07, https://doi.org/10.1029/2003jd003883, 2004.
Singh, H. B., O'hara, D., Herlth, D., Sachse, W., Blake, D., Bradshaw, J., Kanakidou, M., and Crutzen, P.: Acetone in the atmosphere: Distribution, sources, and sinks, J. Geophys. Res.-Atmos., 99, 1805–1819, 1994.
Singh, H. B., Tabazadeh, A., Evans, M. J., Field, B. D., Jacob, D. J., Sachse, G., Crawford, J. H., Shetter, R., and Brune, W. H.: Oxygenated volatile organic chemicals in the oceans: Inferences and implications based on atmospheric observations and air-sea exchange models, Geophys. Res. Lett., 30, 1862, https://doi.org/10.1029/2003gl017933, 2003.
Sinha, V., Williams, J., Meyerhöfer, M., Riebesell, U., Paulino, A. I., and Larsen, A.: Air-sea fluxes of methanol, acetone, acetaldehyde, isoprene and DMS from a Norwegian fjord following a phytoplankton bloom in a mesocosm experiment, Atmos. Chem. Phys., 7, 739–755, https://doi.org/10.5194/acp-7-739-2007, 2007.
Sjostedt, S. J., Leaitch, W. R., Levasseur, M., Scarratt, M., Michaud, S., Motard-Côté, J., Burkhart, J. H., and Abbatt, J. P. D.: Evidence for the uptake of atmospheric acetone and methanol by the Arctic Ocean during late summer DMS-Emission plumes, J. Geophys. Res.-Atmos., 117, D12303, https://doi.org/10.1029/2011jd017086, 2012.
Spanel, P., Doren, J., and Smith, D.: A selected ion flow tube study of the reactions of H3O+, NO+, and with saturated and unsaturated aldehydes and subsequent hydration of the product ions, Int. J. Mass Spectrom., 213, 163–176, https://doi.org/10.1016/S1387-3806(01)00531-0, 2002.
Steinberg, S. M. and Bada, J. L.: Oxalic, glyoxalic and pyruvic acids in eastern Pacific Ocean waters, J. Mar. Res., 42, 697–708, https://doi.org/10.1357/002224084788506068, 1984.
Stickler, A., Fischer, H., Williams, J., de Reus, M., Sander, R., Lawrence, M. G., Crowley, J. N., and Lelieveld, J.: Influence of summertime deep convection on formaldehyde in the middle and upper troposphere over Europe, J. Geophys. Res., 111, D14308, https://doi.org/10.1029/2005jd007001, 2006.
Swarthout, R. F., Russo, R. S., Zhou, Y., Miller, B. M., Mitchell, B., Horsman, E., Lipsky, E., McCabe, D. C., Baum, E., and Sive, B. C.: Impact of Marcellus Shale natural gas development in southwest Pennsylvania on volatile organic compound emissions and regional air quality, Environ. Sci. Technol., 49, 3175–3184, https://doi.org/10.1021/es504315f, 2015.
Tadic, I., Crowley, J. N., Dienhart, D., Eger, P., Harder, H., Hottmann, B., Martinez, M., Parchatka, U., Paris, J.-D., Pozzer, A., Rohloff, R., Schuladen, J., Shenolikar, J., Tauer, S., Lelieveld, J., and Fischer, H.: Net ozone production and its relationship to nitrogen oxides and volatile organic compounds in the marine boundary layer around the Arabian Peninsula, Atmos. Chem. Phys., 20, 6769–6787, https://doi.org/10.5194/acp-20-6769-2020, 2020.
Tanimoto, H., Kameyama, S., Iwata, T., Inomata, S., and Omori, Y.: Measurement of air-sea exchange of dimethyl sulfide and acetone by PTR-MS coupled with gradient flux technique, Environ. Sci. Technol., 48, 526–533, https://doi.org/10.1021/es4032562, 2014.
Vaught, C.: Locating and estimating air emissions from sources of formaldehyde (revised), Midwest Research Inst., Cary, NC, United States, 1991.
United States Central Intelligence Agency: Middle East oil and gas, Central Intelligence Agency, Washington, D.C., available at: https://www.loc.gov/item/2007631392/ (last access: 26 November 2019), 2007.
Utah Division of Air Quality: Final Report: Uinta Basin Winter Ozone Study, ENVIRON International Corporation, Novato, California, 2014.
Wang, S., Hornbrook, R. S., Hills, A., Emmons, L. K., Tilmes, S., Lamarque, J. F., Jimenez, J. L., Campuzano-Jost, P., Nault, B. A., Crounse, J. D., Wennberg, P. O., Kim, M., Allen, H., Ryerson, T. B., Thompson, C. R., Peischl, J., Moore, F., Nance, D., Hall, B., Elkins, J., Tanner, D., Huey, L. G., Hall, S. R., Ullmann, K., Orlando, J. J., Tyndall, G. S., Flocke, F. M., Ray, E., Hanisco, T. F., Wolfe, G. M., St. Clair, J., Commane, R., Daube, B., Barletta, B., Blake, D. R., Weinzierl, B., Dollner, M., Conley, A., Vitt, F., Wofsy, S. C., Riemer, D. D., and Apel, E. C.: Atmospheric Acetaldehyde: Importance of Air-Sea Exchange and a Missing Source in the Remote Troposphere, Geophys. Res. Lett., 46, 5601–5613, https://doi.org/10.1029/2019gl082034, 2019.
Warneke, C. and de Gouw, J. A.: Organic trace gas composition of the marine boundary layer over the northwest Indian Ocean in April 2000, Atmos. Environ., 35, 5923–5933, https://doi.org/10.1016/S1352-2310(01)00384-3, 2001.
Warneke, C., Karl, T., Judmaier, H., Hansel, A., Jordan, A., Lindinger, W., and Crutzen, P. J.: Acetone, methanol, and other partially oxidized volatile organic emissions from dead plant matter by abiological processes: Significance for atmospheric HOx chemistry, Global Biogeochem. Cy., 13, 9–17, https://doi.org/10.1029/98GB02428, 1999.
Warneke, C., Geiger, F., Edwards, P. M., Dube, W., Pétron, G., Kofler, J., Zahn, A., Brown, S. S., Graus, M., Gilman, J. B., Lerner, B. M., Peischl, J., Ryerson, T. B., de Gouw, J. A., and Roberts, J. M.: Volatile organic compound emissions from the oil and natural gas industry in the Uintah Basin, Utah: oil and gas well pad emissions compared to ambient air composition, Atmos. Chem. Phys., 14, 10977–10988, https://doi.org/10.5194/acp-14-10977-2014, 2014.
Wennberg, P. O., Bates, K. H., Crounse, J. D., Dodson, L. G., McVay, R. C., Mertens, L. A., Nguyen, T. B., Praske, E., Schwantes, R. H., Smarte, M. D., St Clair, J. M., Teng, A. P., Zhang, X., and Seinfeld, J. H.: Gas-Phase Reactions of Isoprene and Its Major Oxidation Products, Chem. Rev., 118, 3337–3390, https://doi.org/10.1021/acs.chemrev.7b00439, 2018.
Williams, J., Roberts, J. M., Bertman, S. B., Stroud, C. A., Fehsenfeld, F. C., Baumann, K., Buhr, M. P., Knapp, K., Murphy, P. C., Nowick, M., and Williams, E. J.: A method for the airborne measurement of PAN, PPN, and MPAN, J. Geophys. Res.-Atmos., 105, 28943–28960, https://doi.org/10.1029/2000JD900373, 2000.
Williams, J., Pöschl, U., Crutzen, P. J., Hansel, A., Holzinger, R., Warneke, C., Lindinger, W., and Lelieveld, J.: An Atmospheric Chemistry Interpretation of Mass Scans Obtained from a Proton Transfer Mass Spectrometer Flown over the Tropical Rainforest of Surinam, J. Atmos. Chem., 38, 133–166, 10.1023/A:1006322701523, 2001.
Williams, J., Holzinger, R., Gros, V., Xu, X., Atlas, E., and Wallace, D. W. R.: Measurements of organic species in air and seawater from the tropical Atlantic, Geophys. Res. Lett., 31, L23S06, https://doi.org/10.1029/2004gl020012, 2004.
Wisthaler, A.: Organic trace gas measurements by PTR-MS during INDOEX 1999, J. Geophys. Res., 107, INX2 23-1–INX2 23-11, https://doi.org/10.1029/2001jd000576, 2002.
White, M. L., Russo, R. S., Zhou, Y., Mao, H., Varner, R. K., Ambrose, J., Veres, P., Wingenter, O. W., Haase, K., Stutz, J., Talbot, R., and Sive, B. C.: Volatile organic compounds in northern New England marine and continental environments during the ICARTT 2004 campaign, J. Geophys. Res., 113, D08S90, https://doi.org/10.1029/2007jd009161, 2008.
Wyche, K. P., Monks, P. S., Ellis, A. M., Cordell, R. L., Parker, A. E., Whyte, C., Metzger, A., Dommen, J., Duplissy, J., Prevot, A. S. H., Baltensperger, U., Rickard, A. R., and Wulfert, F.: Gas phase precursors to anthropogenic secondary organic aerosol: detailed observations of 1,3,5-trimethylbenzene photooxidation, Atmos. Chem. Phys., 9, 635–665, https://doi.org/10.5194/acp-9-635-2009, 2009.
Xiao, Q., Li, M., Liu, H., Fu, M., Deng, F., Lv, Z., Man, H., Jin, X., Liu, S., and He, K.: Characteristics of marine shipping emissions at berth: profiles for particulate matter and volatile organic compounds, Atmos. Chem. Phys., 18, 9527–9545, https://doi.org/10.5194/acp-18-9527-2018, 2018.
Yang, M., Beale, R., Liss, P., Johnson, M., Blomquist, B., and Nightingale, P.: Air–sea fluxes of oxygenated volatile organic compounds across the Atlantic Ocean, Atmos. Chem. Phys., 14, 7499–7517, https://doi.org/10.5194/acp-14-7499-2014, 2014.
Youssef, M. A., Wahid, S. S., Mohamed, M. A., and Askalany, A. A.: Experimental study on Egyptian biomass combustion in circulating fluidized bed, Appl. Energ., 86, 2644–2650, https://doi.org/10.1016/j.apenergy.2009.04.021, 2009.
Yuan, B., Shao, M., de Gouw, J., Parrish, D. D., Lu, S., Wang, M., Zeng, L., Zhang, Q., Song, Y., Zhang, J., and Hu, M.: Volatile organic compounds (VOCs) in urban air: How chemistry affects the interpretation of positive matrix factorization (PMF) analysis, J. Geophys. Res.-Atmos., 117, D24302, https://doi.org/10.1029/2012jd018236, 2012.
Yuan, B., Warneke, C., Shao, M., and de Gouw, J. A.: Interpretation of volatile organic compound measurements by proton-transfer-reaction mass spectrometry over the deepwater horizon oil spill, Int. J. Mass Spectrom., 358, 43–48, https://doi.org/10.1016/j.ijms.2013.11.006, 2014.
Yuan, B., Koss, A. R., Warneke, C., Coggon, M., Sekimoto, K., and de Gouw, J. A.: Proton-Transfer-Reaction Mass Spectrometry: Applications in Atmospheric Sciences, Chem. Rev., 117, 13187–13229, https://doi.org/10.1021/acs.chemrev.7b00325, 2017.
Zhao, J. and Zhang, R.: Proton transfer reaction rate constants between hydronium ion (H3O+) and volatile organic compounds, Atmos. Environ., 38, 2177–2185, https://doi.org/10.1016/j.atmosenv.2004.01.019, 2004.
Zhou, S., Gonzalez, L., Leithead, A., Finewax, Z., Thalman, R., Vlasenko, A., Vagle, S., Miller, L. A., Li, S.-M., Bureekul, S., Furutani, H., Uematsu, M., Volkamer, R., and Abbatt, J.: Formation of gas-phase carbonyls from heterogeneous oxidation of polyunsaturated fatty acids at the air–water interface and of the sea surface microlayer, Atmos. Chem. Phys., 14, 1371–1384, https://doi.org/10.5194/acp-14-1371-2014, 2014.
Zhou, X. and Mopper, K.: Carbonyl compounds in the lower marine troposphere over the Caribbean Sea and Bahamas, J. Geophys. Res.-Oceans, 98, 2385–2392, https://doi.org/10.1029/92jc02772, 1993.
Zhou, X. and Mopper, K.: Photochemical production of low-molecular-weight carbonyl compounds in seawater and surface microlayer and their air-sea exchange, Mar. Chem., 56, 201–213, https://doi.org/10.1016/S0304-4203(96)00076-X, 1997.