the Creative Commons Attribution 4.0 License.
the Creative Commons Attribution 4.0 License.
 | 09 Sep 2020
Changes in the surface broadband shortwave radiation budget during the 2017 eclipse
Alexander Marshak
Si-Chee Tsay
Jay Herman
Ukkyo Jeong
Nader Abuhassan
Robert Swap
While solar eclipses are known to greatly diminish the visible radiation reaching the surface of the Earth, less is known about the magnitude of the impact. We explore both the observed and modeled levels of change in surface radiation during the eclipse of 2017. We deployed a pyranometer and Pandora spectrometer instrument to Casper, Wyoming, and Columbia, Missouri, to measure surface broadband shortwave (SW) flux and atmospheric properties during the 21 August 2017 solar eclipse event. We performed detailed radiative transfer simulations to understand the role of clouds in spectral and broadband solar radiation transfer in the Earth's atmosphere for the normal (non-eclipse) spectrum and red-shift solar spectra for eclipse conditions. The theoretical calculations showed that the non-eclipse-to-eclipse surface flux ratio depends strongly on the obscuration of the solar disk and slightly on the cloud optical depth. These findings allowed us to estimate what the surface broadband SW flux would be for hypothetical non-eclipse conditions from observations during the eclipse and further to quantify the impact of the eclipse on the surface broadband SW radiation budget. We found that the eclipse caused local reductions of time-averaged surface flux of about 379 W m−2 (50 %) and 329 W m−2 (46 %) during the ∼3 h course of the eclipse at the Casper and Columbia sites, respectively. We estimated that the Moon's shadow caused a reduction of approximately 7 %–8 % in global average surface broadband SW radiation. The eclipse has a smaller impact on the absolute value of surface flux reduction for cloudy conditions than a clear atmosphere; the impact decreases with the increase in cloud optical depth. However, the relative time-averaged reduction of local surface SW flux during a solar eclipse is approximately 45 %, and it is not sensitive to cloud optical depth. The reduction of global average SW flux relative to climatology is proportional to the non-eclipse and eclipse flux difference in the penumbra area and depends on cloud optical depth in the Moon's shadow and geolocation due to the change in solar zenith angle. We also discuss the influence of cloud inhomogeneity on the observed SW flux. Our results not only quantify the reduction of the surface solar radiation budget, but also advance the understanding of broadband SW radiative transfer under solar eclipse conditions.
- Article
(10349 KB) - Full-text XML
- Companion paper
-
Supplement
(345 KB) - BibTeX
- EndNote


On 21 August 2017, a total solar eclipse traversed the continental US from Oregon to South Carolina (Fig. 1) (https://eclipse2017.nasa.gov/eclipse-maps, last access: 21 August 2020). Although the path of totality covered a small swath about 100 km wide, the penumbra extended from the tropics to all of North America up to the Arctic polar limit, about 6400 km in diameter. Thus, the solar eclipse can cause large reductions in both temporally averaged surface broadband shortwave (SW) flux at a given site along the totality path and the spatially averaged global surface SW radiation budget at a given time during the eclipse. The eclipse-induced surface SW flux reduction can lead to a decrease in sensible heat flux and associated changes in wind speed (e.g., Turner et al., 2018). As some geo-engineering ideas suggest the blocking or reflecting of solar radiation back to space, the testing of our quantitative understanding of solar radiation in obscured situations is critically important (National Research Council, 2015). Thus, quantifying and understanding the changes in the surface SW irradiances during a solar eclipse is important in this natural experiment.

Figure 1The eclipse map (from https://eclipse2017.nasa.gov, last access: 21 August 2020) shows the totality path and obscuration levels on 21 August 2017. Radiometers were deployed to make ground-based observations at Casper, Wyoming, and Columbia, Missouri.
Several ground-based radiation experiments and modeling activities have been carried out for understanding radiation in solar eclipse conditions in the past. Sharp et al. (1971) reported that the sky light may be considered attenuated sunlight up to at least 99.8 % obscuration, and the effect of multiple scattering from outside the umbral region dominates the sky brightness close to and during totality (e.g., Mikhalev et al., 1999; Zerefos et al., 2000). Shaw (1978) developed a model to compute sky radiance during a total solar eclipse by including first- and second-order scattering processes that would compute the diffused light scattered into the umbra. Emde and Mayer (2007) performed a full 3D radiative transfer model exercise to simulate surface spectral solar radiance and irradiance change for a cloudless atmosphere during a total eclipse on 29 March 2006, providing a benchmark for studying radiative transfer under solar eclipse conditions.
During the 21 August 2017 solar eclipse, Bernhard and Petkov (2019) made surface spectral solar irradiance observations and performed 3D radiative transfer simulations; Ockenfuß et al. (2019) further simulated 3D radiative transfer in more detail for understanding the impact of surface spectral albedo, ozone vertical distribution, and surrounding mountains on surface spectral irradiance observed by Bernhard and Petkov (2019).
Estimating the impact of an eclipse on surface SW flux is a challenging task. Though one may observe the variation of SW flux variations during an eclipse from ground-based radiometers, it is almost impossible to obtain the observations for the same atmospheric conditions but without a solar eclipse because the atmosphere is often cloudy and cloud properties change rapidly from the beginning to the end of a solar eclipse. In the past, most observations and radiative transfer modeling studies for solar eclipse conditions focused on spectral irradiance change during a solar eclipse. Although there were some surface SW irradiance observations (e.g., Koepke et al., 2001; Calamas et al., 2019), there is a lack of quantification of the solar eclipse's impact on the surface SW flux, mainly because of the complicating presence of clouds.
Clouds cover a large part of the Earth. The average global cloud cover is about 68 % for cloud optical depth > 0.1 and about 56 % for cloud optical depth > 2. Locations on the totality path are often covered by clouds. Quantifying the impact of an eclipse on time-averaged local surface broadband SW flux in cloudy atmospheric conditions and estimating the influence on global surface flux reduction by the Moon's shadow from ground-based observations are the main objectives of this study.
This ground-based measurement paper complements that of Herman et al. (2018) on the reduction of reflected spectral radiance based on DSCOVR/EPIC top of the atmosphere (TOA) observations. In this study, we combined radiometer observations with a radiative transfer model to estimate the impact of the solar eclipse on the temporally averaged SW flux at Casper, Wyoming, and Columbia, Missouri. We further estimated the reduction of the global average surface SW radiation when the totality occurred at the two sites. Since both sites were covered by clouds, this study focuses on understanding the role of cloud in irradiance reduction during the eclipse.
In Sect. 2 of this paper, we describe the ground-based solar radiation experiments. Section 3 describes the radiative transfer modeling experiment. The methodology is presented in Sect. 4. The results are presented in Sect. 5 followed by the summary in Sect. 6.
Two ground sites were carefully selected from the totality path of the 21 August 2017 eclipse. They were Casper, Wyoming (at 42∘50.2′ N, 106∘19.4′ W), and Columbia, Missouri (at 38∘57.1′ N, 92∘20.1′ W); both were near the center of the path of totality and experienced a nearly noon total solar eclipse (local time solar time 10:38 in Casper and 12:04 in Columbia) (see Fig. 1 and Table 1 for detailed information). These two sites are separated by a distance of about 1200 km, a typical synoptic scale, such that the weather at these sites can be quite different, allowing us to study the eclipse-induced surface SW changes under different atmospheric conditions.
Table 1Parameters for the 21 August 2017 eclipse for Casper, Wyoming, and Columbia, Missouri. The first contact (C1), the moment when the Moon first touches the Sun's disk or the beginning of the partial eclipse; the second contact (C2), the beginning of totality; the maximum of the totality (Max); the third contact (C3), the end of totality; the fourth contact (C4), the instant when the Moon just leaves the Sun's disk or the end of the partial eclipse. The elevation of the site (Elev.) and solar zenith angle (SZA) and solar azimuth angle (SAA) at the totality are indicated.

The ground-based instruments include a thermal-dome-effect-corrected (TDE) pyranometer (Ji and Tsay, 2000), a standard Pandora spectrometer instrument system (PSI) for the 280–520 nm wavelength range (with a spectral resolution of 0.42–0.52 nm) (Herman et al., 2009), and an extended-range PSI (PSI-ER) for the 280–820 nm wavelength range (with a spectral resolution of about 1 nm) (Jeong et al., 2018) at both sites. The pyranometer is a broadband radiometer that measures solar radiation reaching Earth's surface with wavelengths approximately from 295 to 2800 nm. Ji and Tsay (2000) found that the fused silica dome's thermal effect on the pyranometer can introduce an error of a few W m−2 to over tens of W m−2 depending on the temperature difference between its thermopile and glass-filter domes. Ji et al. (2011) developed a novel non-intrusive method to correct the pyranometer's TDE and demonstrated a high level of consistency with a NIST-traceable light source maintained in a Class 10 000 clean room at the NASA Goddard Calibration Facility. The reported accuracy of this light source for the calibration is better than 1 %. The pyranometer-observed surface broadband SW flux without TDE correction at the totality is about −13 and −5 W m−2 at the Casper and Columbia sites, respectively. However, these unrealistic negative biases during the totality are improved with the TDE correction (the SW fluxes are 5 W m−2 at Casper and −3 W m−2 at Columbia). Note that according to the results of Emde and Mayer (2007), surface spectral irradiance (and therefore broadband SW flux) for eclipse conditions is 4 orders of magnitude smaller than its counterpart for a non-eclipse condition. Therefore, theoretical broadband SW fluxes at these sites are less than about 0.1 W m−2. Although the TDE corrections during the totality at both sites have largely improved the pyranometer's instantaneous offsets, the remaining fine adjustments of SW fluxes during the eclipse can be attributed to the variabilities of sky conditions (e.g., distribution of scattered clouds, temperature, and wind fields near the pyranometers) coupled with radiometric performance of the sensors and calibration uncertainties (Ji et al., 2011). We subtract the offset from the observations such that the surface SW flux is zero at the totality for both the Casper and Columbia sites.
Both PSI and PSI-ER contain a small Avantes low stray light spectrometer. The optical head consists of a collimator and filter wheels giving rise to a 2.2∘ field of view (FOV) for direct-Sun measurements. The PSI is capable of obtaining NO2 and ozone total column amounts (for details, see Herman et al., 2009, 2015). The PSI-ER has the capability to retrieve aerosol and cloud optical depths within the given wavelength range (Jeong et al., 2018). Note that cloud optical depth is usually much larger than aerosol optical depth. As cloud optical depth increases, the direct sunlight decreases exponentially, leaving a very small signal for an instrument to detect. We used only data with a signal-to-noise ratio (SNR) of greater than 10.
The current PSI does not have an operational scheme for water vapor retrieval. The precipitable water vapor amount observations from the nearest AERONET stations (see Table 2) were used in radiative transfer computations for the Columbia and Casper sites, respectively.
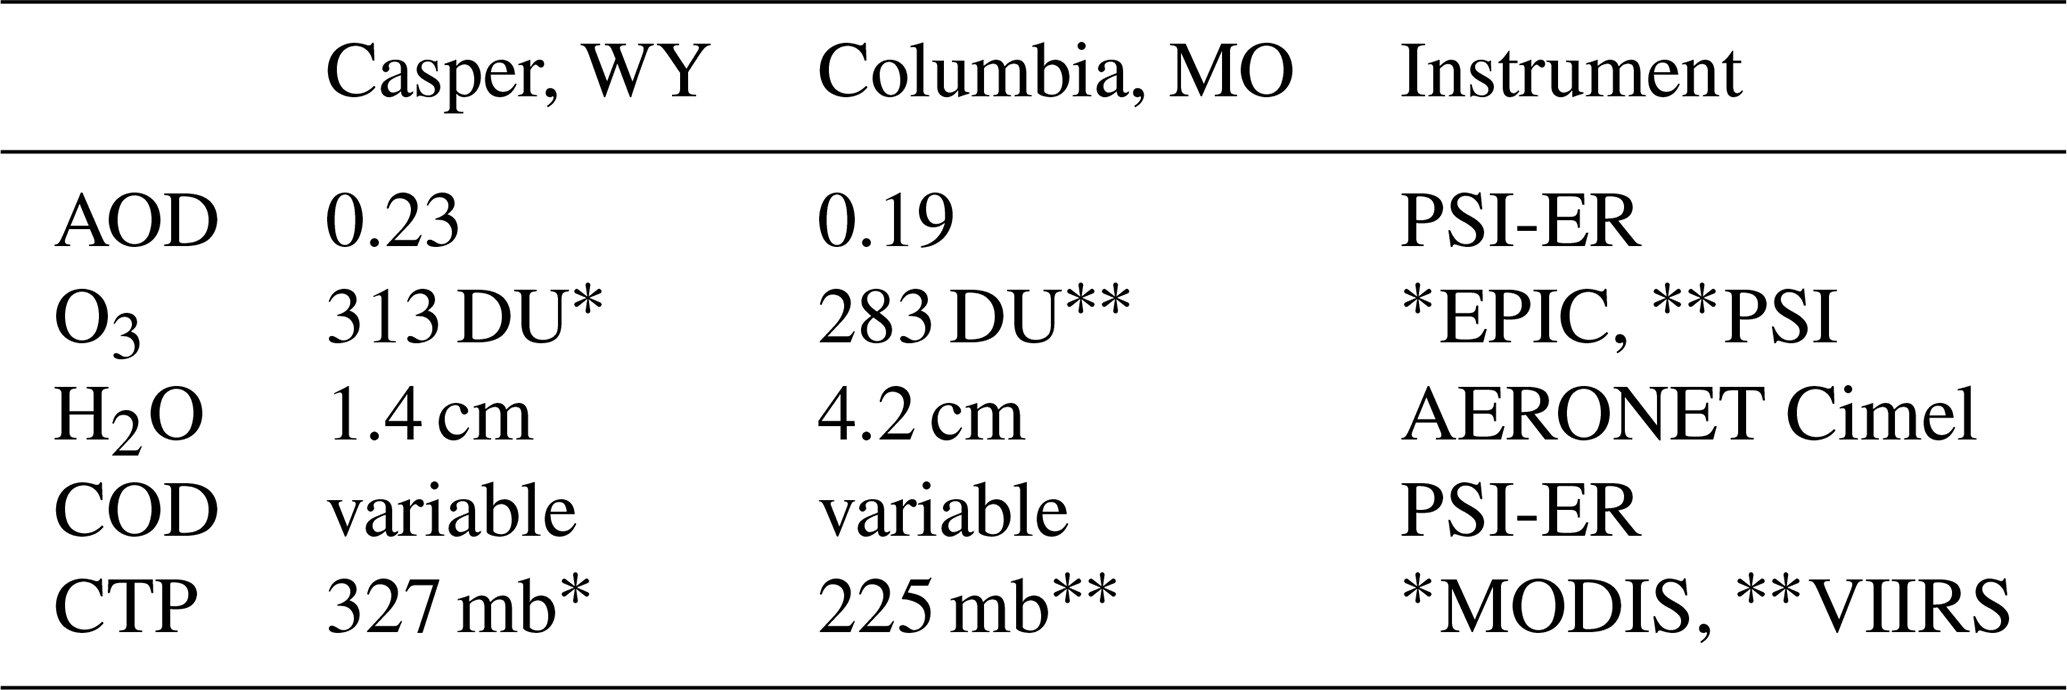
Table 2Atmospheric properties including aerosol optical depth (AOD) at 550 nm, ozone column amount (O3), precipitable water vapor amount (H2O), cloud optical depth (COD) at 550 nm, and cloud top pressure (CTP) for the Casper and Columbia sites. Note that precipitable water vapor amounts are from the nearest AERONET stations at St. Louis University, MO (38∘38.16′ N, 90∘13.9∘′ W), and Spoon Butte, WY (42∘35.76′ N, 104∘26.58′ W), for Columbia and Casper, respectively. (The instruments for O3 and CTP observations are indicated by symbols * and for Casper and Columbia, respectively.)
3.1 The model
The radiative transfer model used is a fast plane-parallel broadband model for both solar shortwave and terrestrial longwave irradiances originally developed by Fu and Liou (1992) and subsequently modified by the SARB (Surface and Atmospheric Radiation Budget) team at NASA's Langley Research Center (Kato et al., 2005; Rose et al., 2006). The SW portion of the model used in this study is a delta-four-stream radiative transfer code with 18 spectral bands from 0.175 to 4.0 µm. The model accounts for gaseous absorption by O3, H2O, O2, CO2 and CH4, molecular scattering, aerosol and cloud absorption, and scattering. We also used the SBDART (Santa Barbara DISORT Atmospheric Radiative Transfer) model (Ricchiazzi et al., 1998) to simulate the surface spectral flux for TOA spectral solar irradiance for both normal and eclipse conditions to understand the role of clouds in transmitted spectral and total shortwave flux.
The assumption of constant incident solar intensity in the 1D model is invalid for the umbra and near the totality region because the surface diffuse component, which depends on the 2D distribution of the TOA incident solar irradiance, dominates under those conditions. Emde and Mayer (2007) performed a rigorous analysis to quantify 1D errors in diffuse spectral radiance and irradiance as a function of the time from the center of the totality. We used their results for spectral irradiance at 500 nm as a surrogate for estimating the error in broadband shortwave irradiance because the solar spectrum peaks near 500 nm.
For a plane-parallel clear atmosphere, one can show that the surface diffuse flux is about 10 % of the direct component at 500 nm for solar zenith angles (SZAs) from 0 to 40∘. Thus, a 10 % 1D error in the diffuse component at time 150 s (about 126 km) from the center of the totality will lead to about 1 % error in the total surface SW flux estimate. Further away from the totality, the direct component gradually dominates, and the 1D error in the diffuse flux decreases quickly with distance (see Fig. 14 in Emde and Mayer, 2007), resulting in an even faster decrease in the 1D error in total surface SW flux. Thus, the error in the average shortwave irradiance from the 1D model is negligible.
Additionally, cloud inhomogeneity can introduce large uncertainties into 1D radiative transfer models and is a major obstacle to computing radiative flux for solar eclipse conditions (e.g., Koepke et al., 2001). We will discuss this issue in Sect. 4.
3.2 Model inputs
3.2.1 TOA spectral solar irradiance during the eclipse
The change in TOA spectral solar irradiance is essential for modeling solar radiation transfer during an eclipse. For normal conditions, the extraterrestrial solar irradiance at each wavelength is given as an average over the whole solar disk. For eclipse conditions one needs to integrate the limb-darkening function weighted spectral irradiance for the non-obscured part of the Sun to obtain the TOA spectral solar irradiance. Here we adopted the analytical expression by Koepke et al. (2001) to compute the spectral solar irradiance emitted from the non-obscured solar disk (or reduced brightness) as a function of the distance between the centers of the disks of the Moon and the Sun with the limb-darkening function from Neckel (2005).
The astronomical aspect of solar eclipse is well understood and the geometry of the problem can be calculated with high accuracy (e.g., Espenak and Anderson, 2004). The parameters for the 21 August 2017 eclipse (Table 1) are calculated by Espenak (results are in the Supplement). We followed the definition of the distance between the center of the disks of the Moon and the Sun, normalized by the sum of the radii of the Moon and Sun in Koepke et al. (2001). To compute the reduced brightness as a function of time for the two sites for the entire course of the eclipse event, we also used the fact that the value of the distance is linearly correlated with time (e.g., Koepke et al., 2001; Emde and Mayer, 2007).
3.2.2 Atmospheric and surface properties
The standard mid-latitude atmosphere is used to describe the temperature, pressure, and trace gas profiles. Two major absorbing gases for shortwave radiation, ozone and water vapor, are based on observations; other less important trace gases are kept at constant levels. Column ozone amount observations from EPIC at 15:44:50 UTC before the eclipse are used for the Casper site. The column ozone from PSI before the eclipse is used for the Columbia site. The precipitable water vapor amounts are from nearby AERONET stations (see Table 2). The ozone and water vapor profiles are scaled to match the observed total column amounts. Aerosol optical depth (AOD) was observed by PSI-ER before the eclipse and the aerosol type is assumed to be continental aerosol with a scale height of 3 km. All trace gases and AODs are assumed constant in radiative transfer calculations.
PSI-ER was operating continuously at both sites to provide optical depth observations. Using Beer's law for a constant TOA monochromatic direct solar irradiance (I0), one can obtain apparent optical depth from Eq. (1):
where I(t), τapp(t), and μ0(t) are the PSI-ER-observed spectral irradiance at 550 nm, the apparent optical depth, and cosine of solar zenith angle at time t, respectively. Without considering the decrease in TOA solar irradiance during solar eclipse, Eq. (1) will lead to a much larger apparent optical depth than it should be. Thus, one has to use the reduced TOA spectral solar irradiance that accounts for limb-darkening effects to derive the true optical depth in Eq. (2):
where I0,eclipse(t) and τ′(t) are the true TOA spectral solar irradiance and eclipse-corrected optical depth. From Eqs. (1) and (2) one can derive the eclipse-corrected optical depth as a function of apparent optical depth and the ratio of solar irradiances with and without solar eclipse in Eq. (3):
Subtracting the molecular scattering optical depth and aerosol optical depth from the total optical depth, we derive cloud optical depth (). Note that is not true cloud optical depth since the instrument observes both the direct and diffuse radiation, resulting in a smaller apparent cloud optical depth than it should be. The diffuse radiation from ice cloud has a large impact on radiation entering into the FOV of the Sun-pointing instrument due to the strong forward peak of the scattering phase function of ice crystals, resulting in a much smaller apparent cloud optical depth than the true optical depth.
For Sun-photometer observations, Shiobara and Asano (1994) suggested the apparent optical depth can be simply related to the true optical depth τc as
with
where ω is the single scattering albedo and is the average scattering phase function in the solid angle ΔΩ subtended by the instrument FOV. Using the ice crystal scattering phase function and ω=1 at 550 nm (Baum et al., 2005) for the average ice crystal diameter of 60 µm from the Moderate-Resolution Imaging Spectroradiometer (MODIS) product with ΔΩ of the Pandora instrument, we estimated k=1.77 and consequently the true optical depth τc at each time step. Adding the molecular optical depth and aerosol optical depth, one can obtain the true atmospheric optical depth. The original apparent, eclipse-corrected, and true total optical depths are presented in Fig. 2. The corrected ice crystal optical depth and aerosol optical depth are used in the modeling calculations presented in later sections.

Figure 2Apparent (black lines), eclipse-corrected (red lines), and diffuse-light-corrected (blue) total optical depths that correspond to spectral radiances at 500 nm observed by Pandora systems at (a) Casper and (b) Columbia during the solar eclipse on 21 August 2017.
From the ground, the authors at the site observed that the atmosphere over the Casper site was mostly clear with some thin cirrus clouds. The visible images from the GOES-16 satellite (Schmit et al., 2005) captured the eclipse and showed a fraction of cirrus cloud near the Casper site before, during, and after the eclipse. Examples of two GOES-16 images are presented in Fig. 3a, b. The GOES-16 images and Sun-pointing PSI-observed cloud optical depth at 550 nm suggest the presence of thin cirrus clouds not shading the direct solar beam for some time before and during a large part of the eclipse, with some thin cirrus fragments passing intermittently through the FOV of the PSI. The photo taken near the totality captured a moment of the sky when the direct solar beam was shaded by a thin cirrus cloud (Fig. 3c). The Terra satellite passed over at 17:45 UTC, the time of totality at the Casper site. The average cloud top pressure from Collection 6 of MODIS thermal channel observations was approximately 327 mb (Baum et al., 2012).
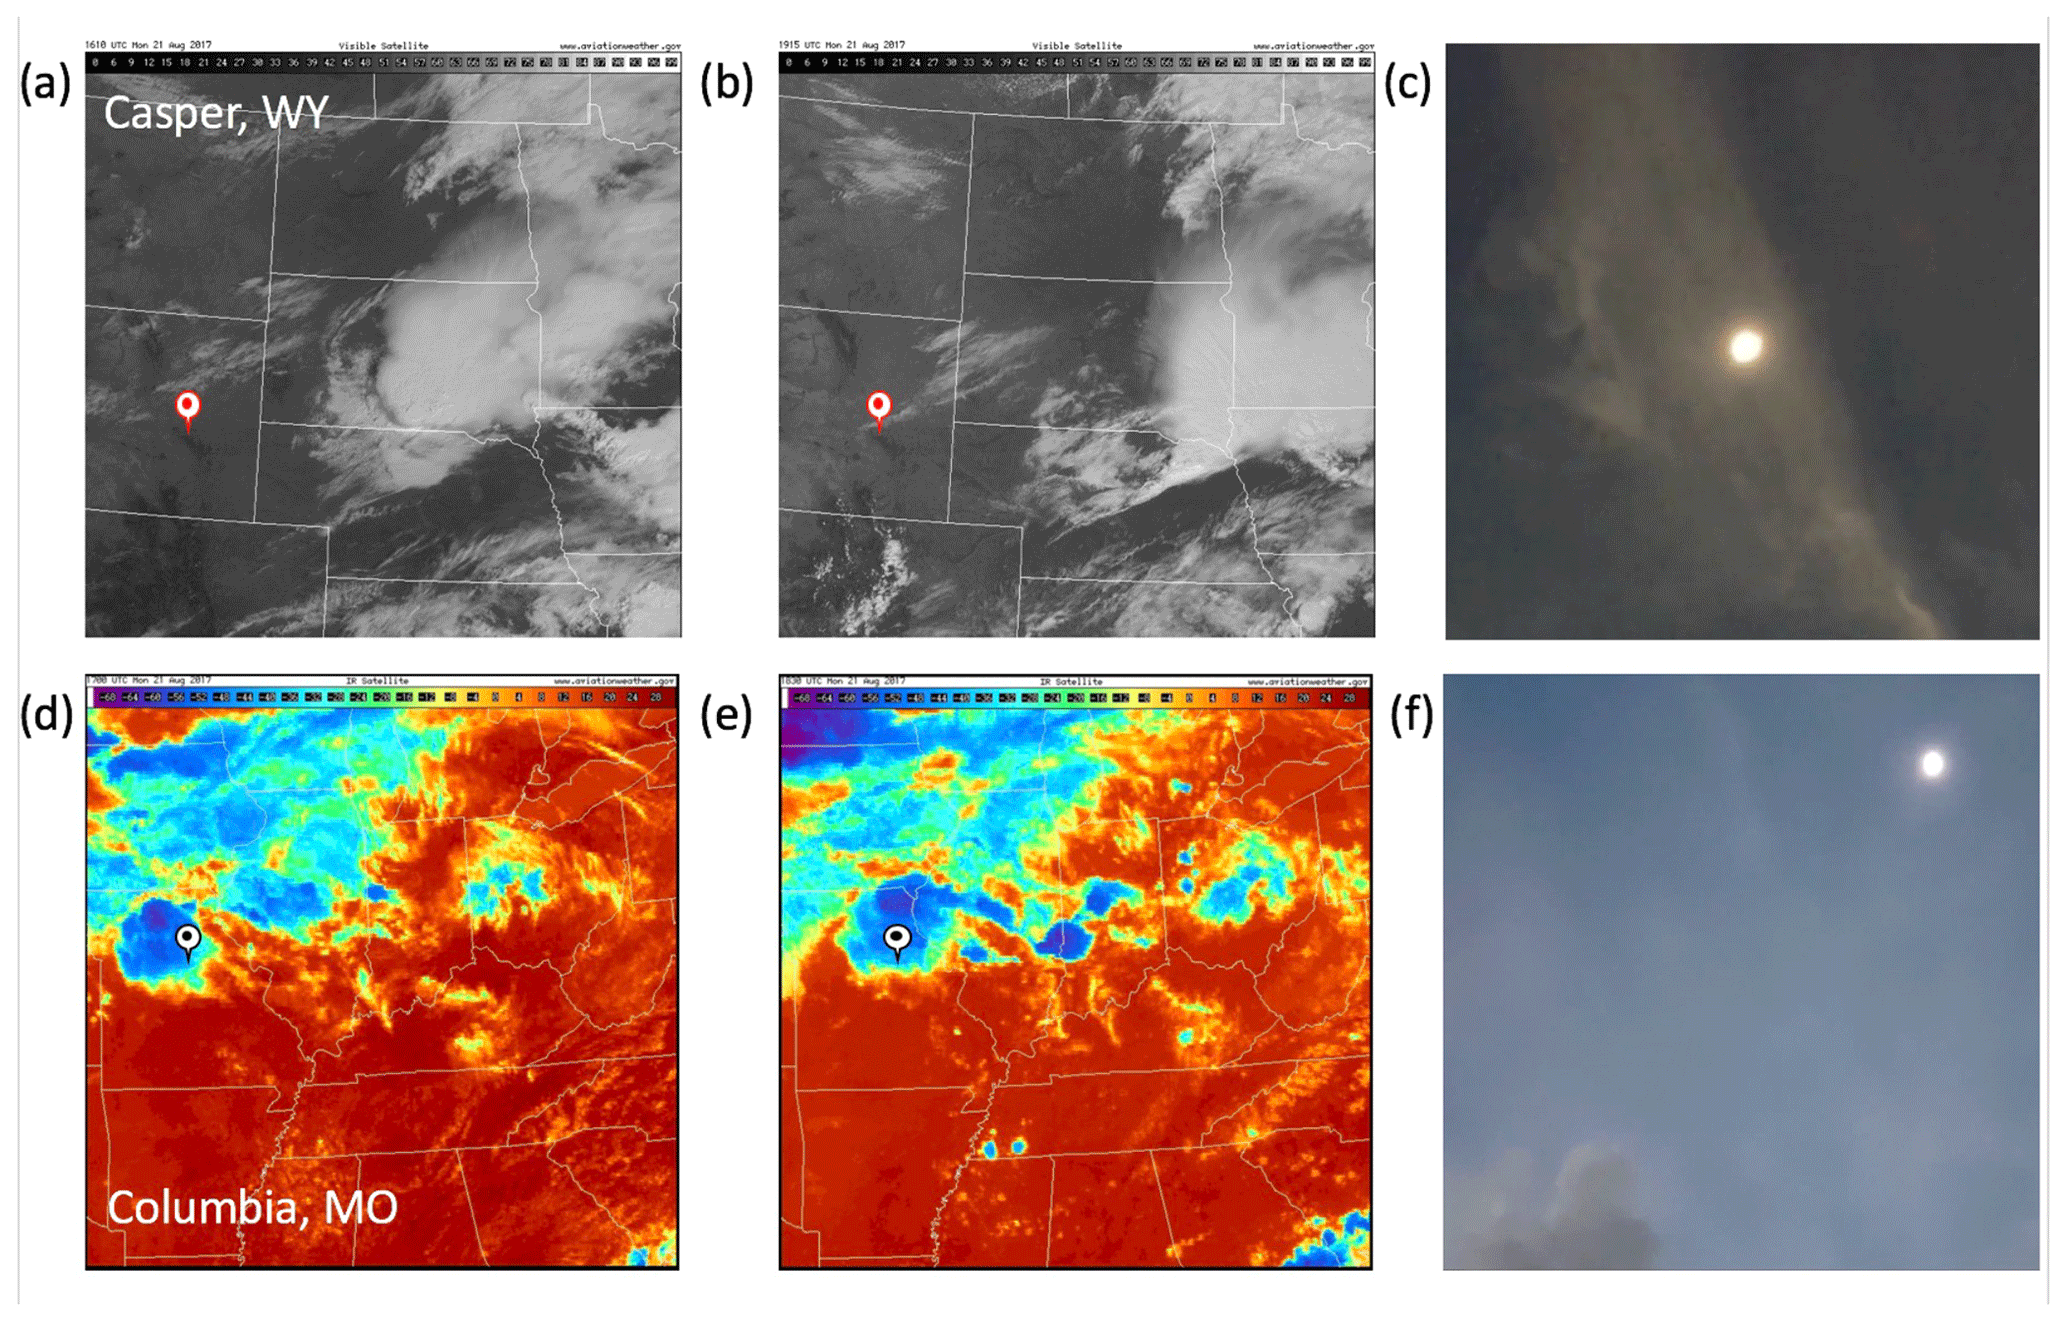
Figure 3(a–c) For Casper, (a) and (b) are geostationary satellite (GOES-16) visible images at 16:10 and 19:15 UTC, showing thin cirrus clouds over the Casper site indicated by the mark; (c) photo taken near the totality. Lower panels for Columbia: (d) and (e) are the thermal infrared images with brightness temperature scale from −68 to 28 ∘C at 17:00 and 18:30 UTC, showing high-level clouds over the Columbia site indicated by the mark; (f) photo taken close to the totality. The satellite images were downloaded from the National Center for Atmospheric Research image archive at http://www2.mmm.ucar.edu/imagearchive/ (last access: 21 August 2020).
As observed by the authors at the site, the sky over the Columbia site was covered by cirrus clouds above some scattered low- and mid-level cumulus clouds (Fig. 3f). The radiosonde relative humidity profile from the nearest station before the eclipse suggests a multi-layer cloud system with cloud tops near 200, 400, and 650 mb (Fig. 4). The GOES-16 satellite thermal infrared images show that the Columbia site was always covered by high-level clouds, as indicated by a very low brightness temperature (about −20 to −40 ∘C) (Fig. 3d, e). The Suomi National Polar-orbiting Partnership (Suomi NPP) satellite (Hillger et al., 2013) overpassed the Columbia site at 18:30 UTC when the site was in partial eclipse. The average cloud-top height from Visible Infrared Imaging Radiometer Suite (VIIRS) thermal infrared retrieval around the Columbia site was about 230 mb.
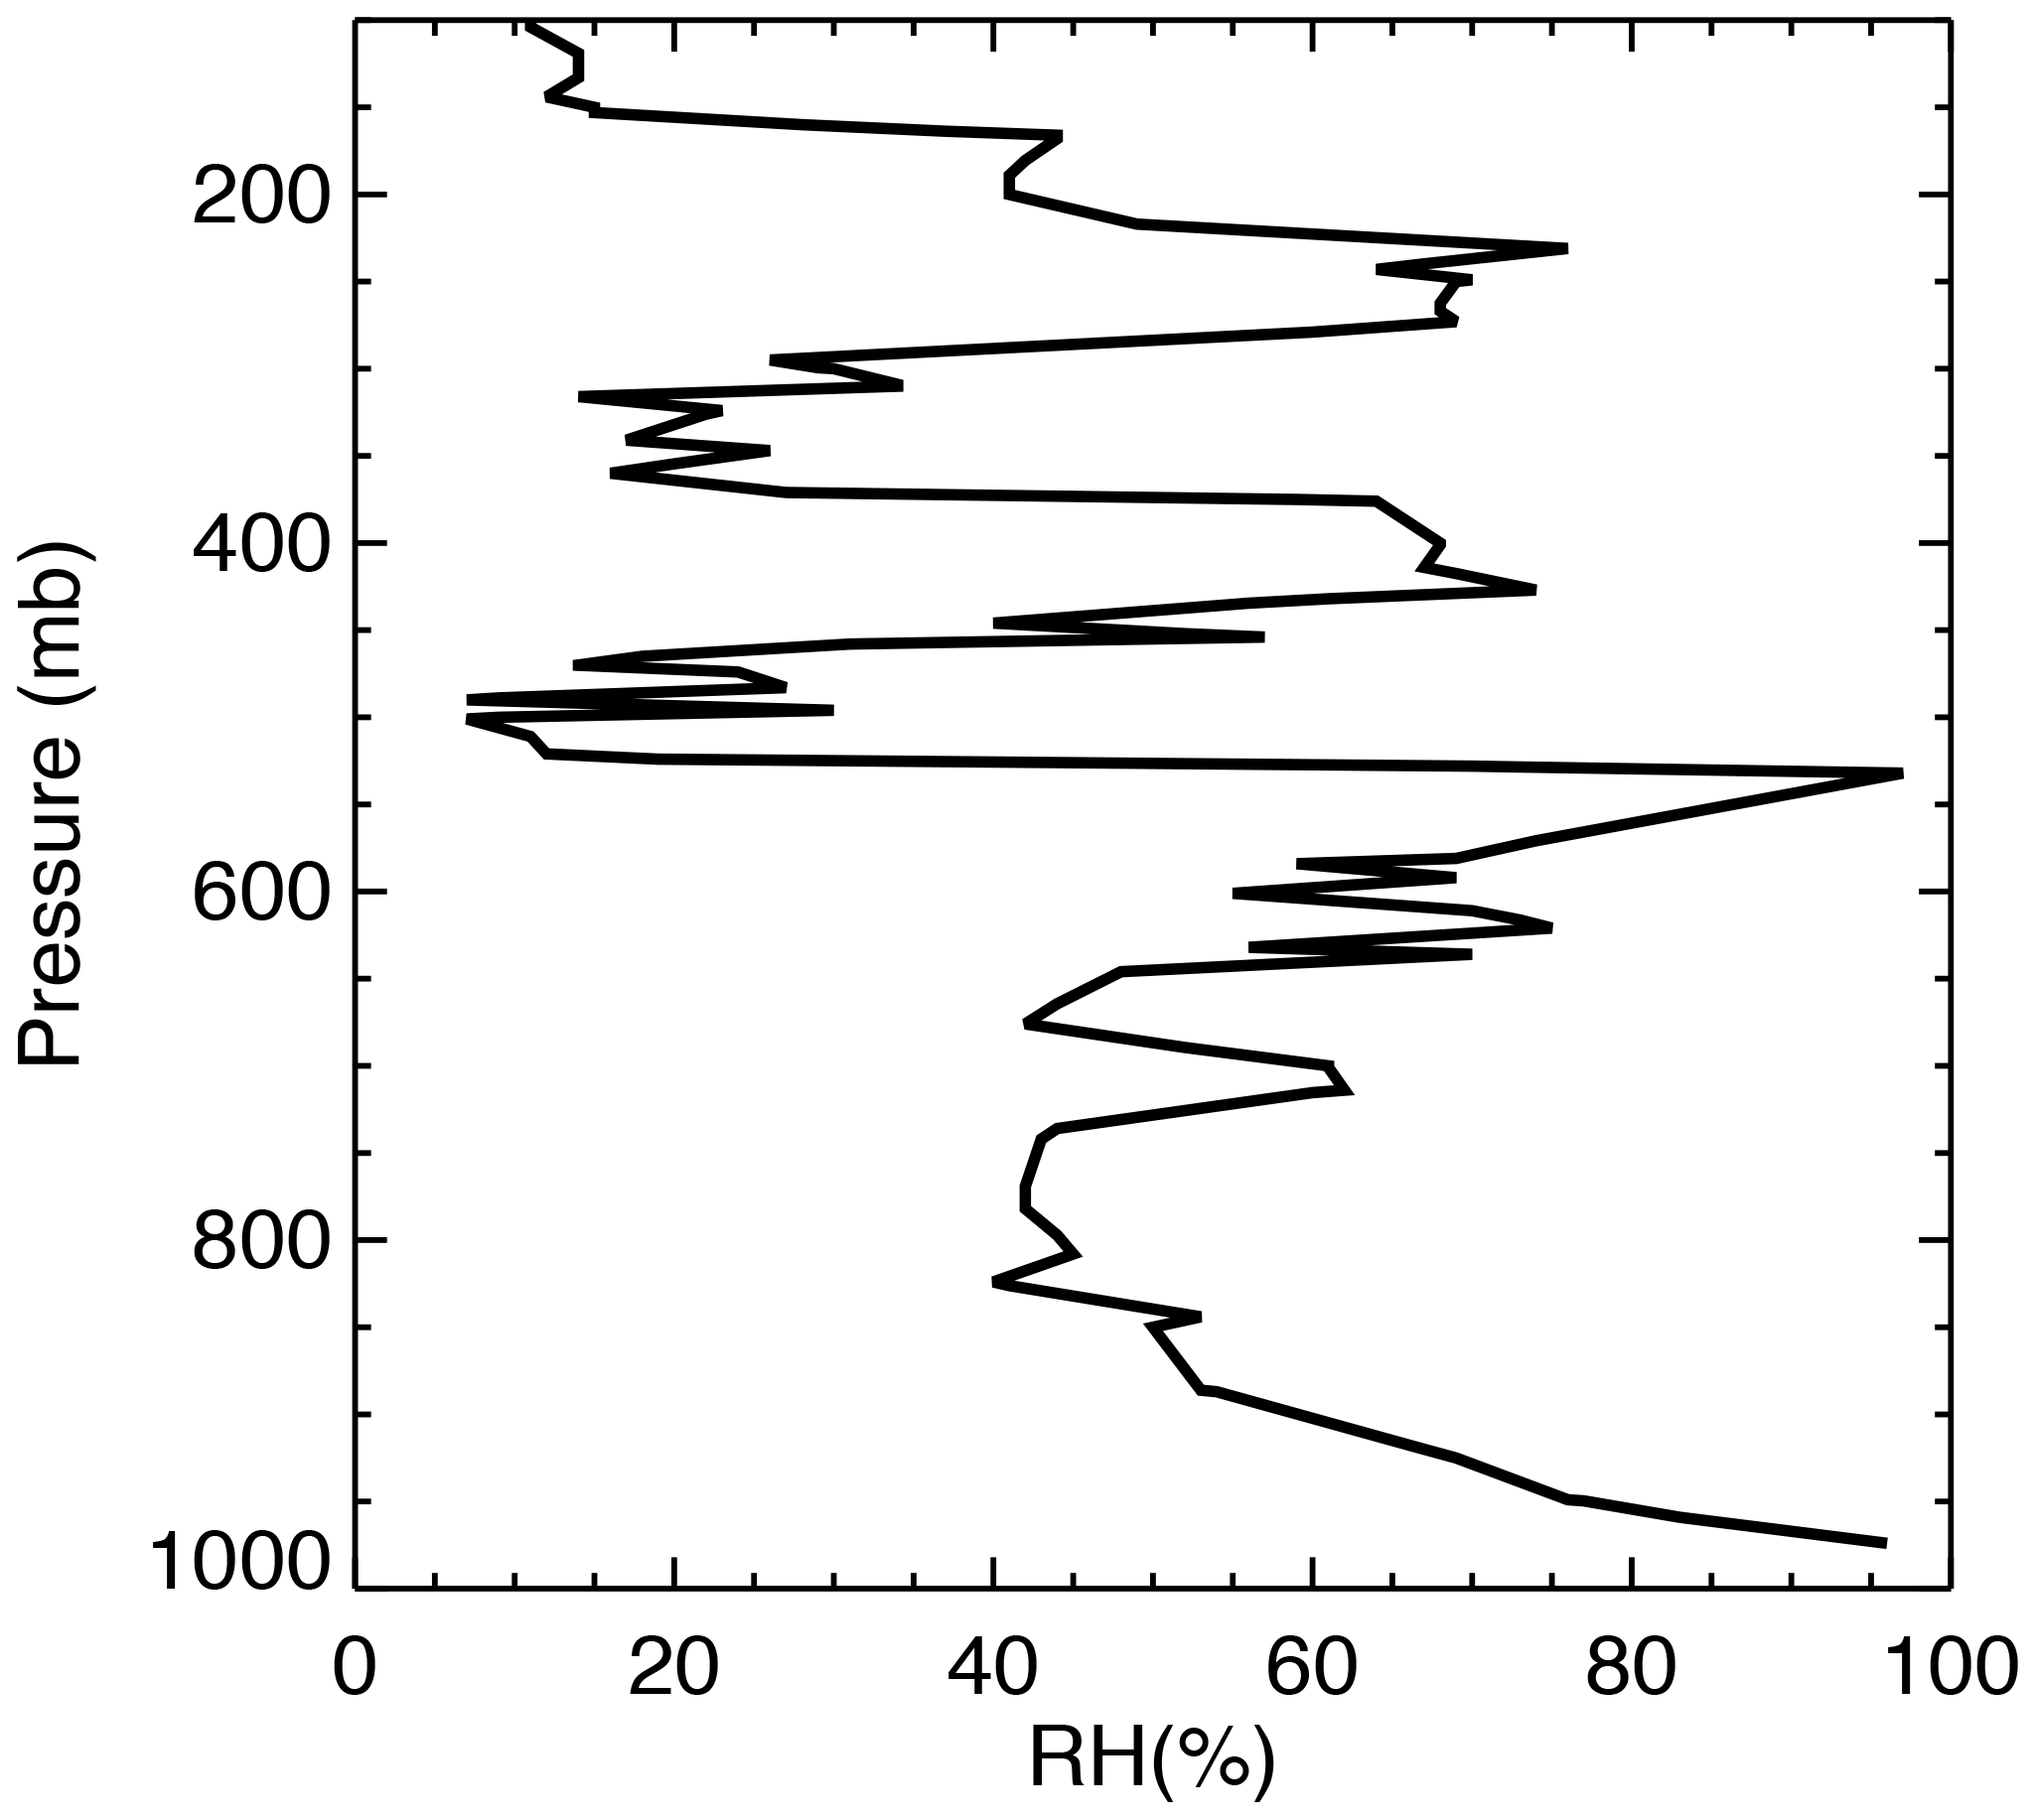
Figure 4Radiosonde-observed vertical profile of relative humidity from Springfield, MO (at 37∘14′ N, 93∘24′ W), the nearest station to the Columbia site, at 12:00 UTC on 21 August 2017 obtained from http://weather.uwyo.edu/upperair/sounding.html (last access: 21 August 2020).
Because the clouds are optically thin during most of the eclipse for both sites except the two large spikes near 17:42 and 18:30 UTC at the Columbia site (Fig. 2b), we assumed one-layer cirrus cloud between 200 and 400 mb with an effective diameter of 60 µm in the Fu and Liou (1992) radiation code for computing the surface SW flux. We will compare the model results with observations and discuss the error in cloud inhomogeneity not accounted for in the 1D model in Sect. 5.
Surface spectral albedo is based on the monthly average value from the MODIS product and International Geosphere-Biosphere Programme (IGBP) albedo. We combine MODIS surface spectral albedo at seven bands from 0.47 to 2.13 µm (Schaaf and Wang, 2015) and albedo from IGBP to get spectral albedo for the 18 bands in the Fu–Liou model. By using these estimates of atmospheric composition and radiative algorithms, we are able to estimate the amount of radiation reaching the Earth's surface during an eclipse.
4.1 Deriving surface irradiance for non-eclipse conditions
Koepke et al. (2001) estimated the photolysis frequencies for non-eclipse conditions using the observed photolysis frequencies during an eclipse divided by the normalized radiance. This method can be applied to estimate surface spectral radiance and irradiance for non-eclipse conditions except the area near the totality. In this section, we will show that the surface broadband SW flux for non-eclipse conditions can be estimated from ground-based pyranometer-observed flux during the eclipse.
The surface broadband SW flux may be expressed as
where I0(λ) and T(λ) are incident TOA spectral solar irradiance and atmospheric transmittance at wavelength λ, respectively.
We demonstrate the effect of an eclipse on the distribution of the TOA spectral solar irradiance and influence of clouds on the transmittance in Fig. 5. Here we define the total normalized spectral irradiance as
where I0,eclipse(λ) and I0,non-eclipse(λ) are TOA spectral solar irradiance at wavelength λ for eclipse and non-eclipse conditions; the spectrally integrated irradiance of I0,norm(λ) is always equal to the TOA total solar irradiance for non-eclipse conditions. Figure 5a shows that there is a red shift in TOA spectral solar irradiance as obscuration increases since the limb darkening has a much stronger effect at shorter wavelengths (e.g., Koepke et al., 2001). The peak of the spectral irradiance shifts from 0.45 µm for a non-eclipse condition to 0.50 and 0.58 µm for 90 % and 99 % obscuration of solar disk, respectively. I0,norm(λ) is also called red-shift spectral solar irradiance. Note that the true TOA irradiance decreases by 1 order of magnitude from normal conditions to 90 % obscuration and from 90 % to 99 % of obscuration during eclipse (see the inset of Fig. 5a).
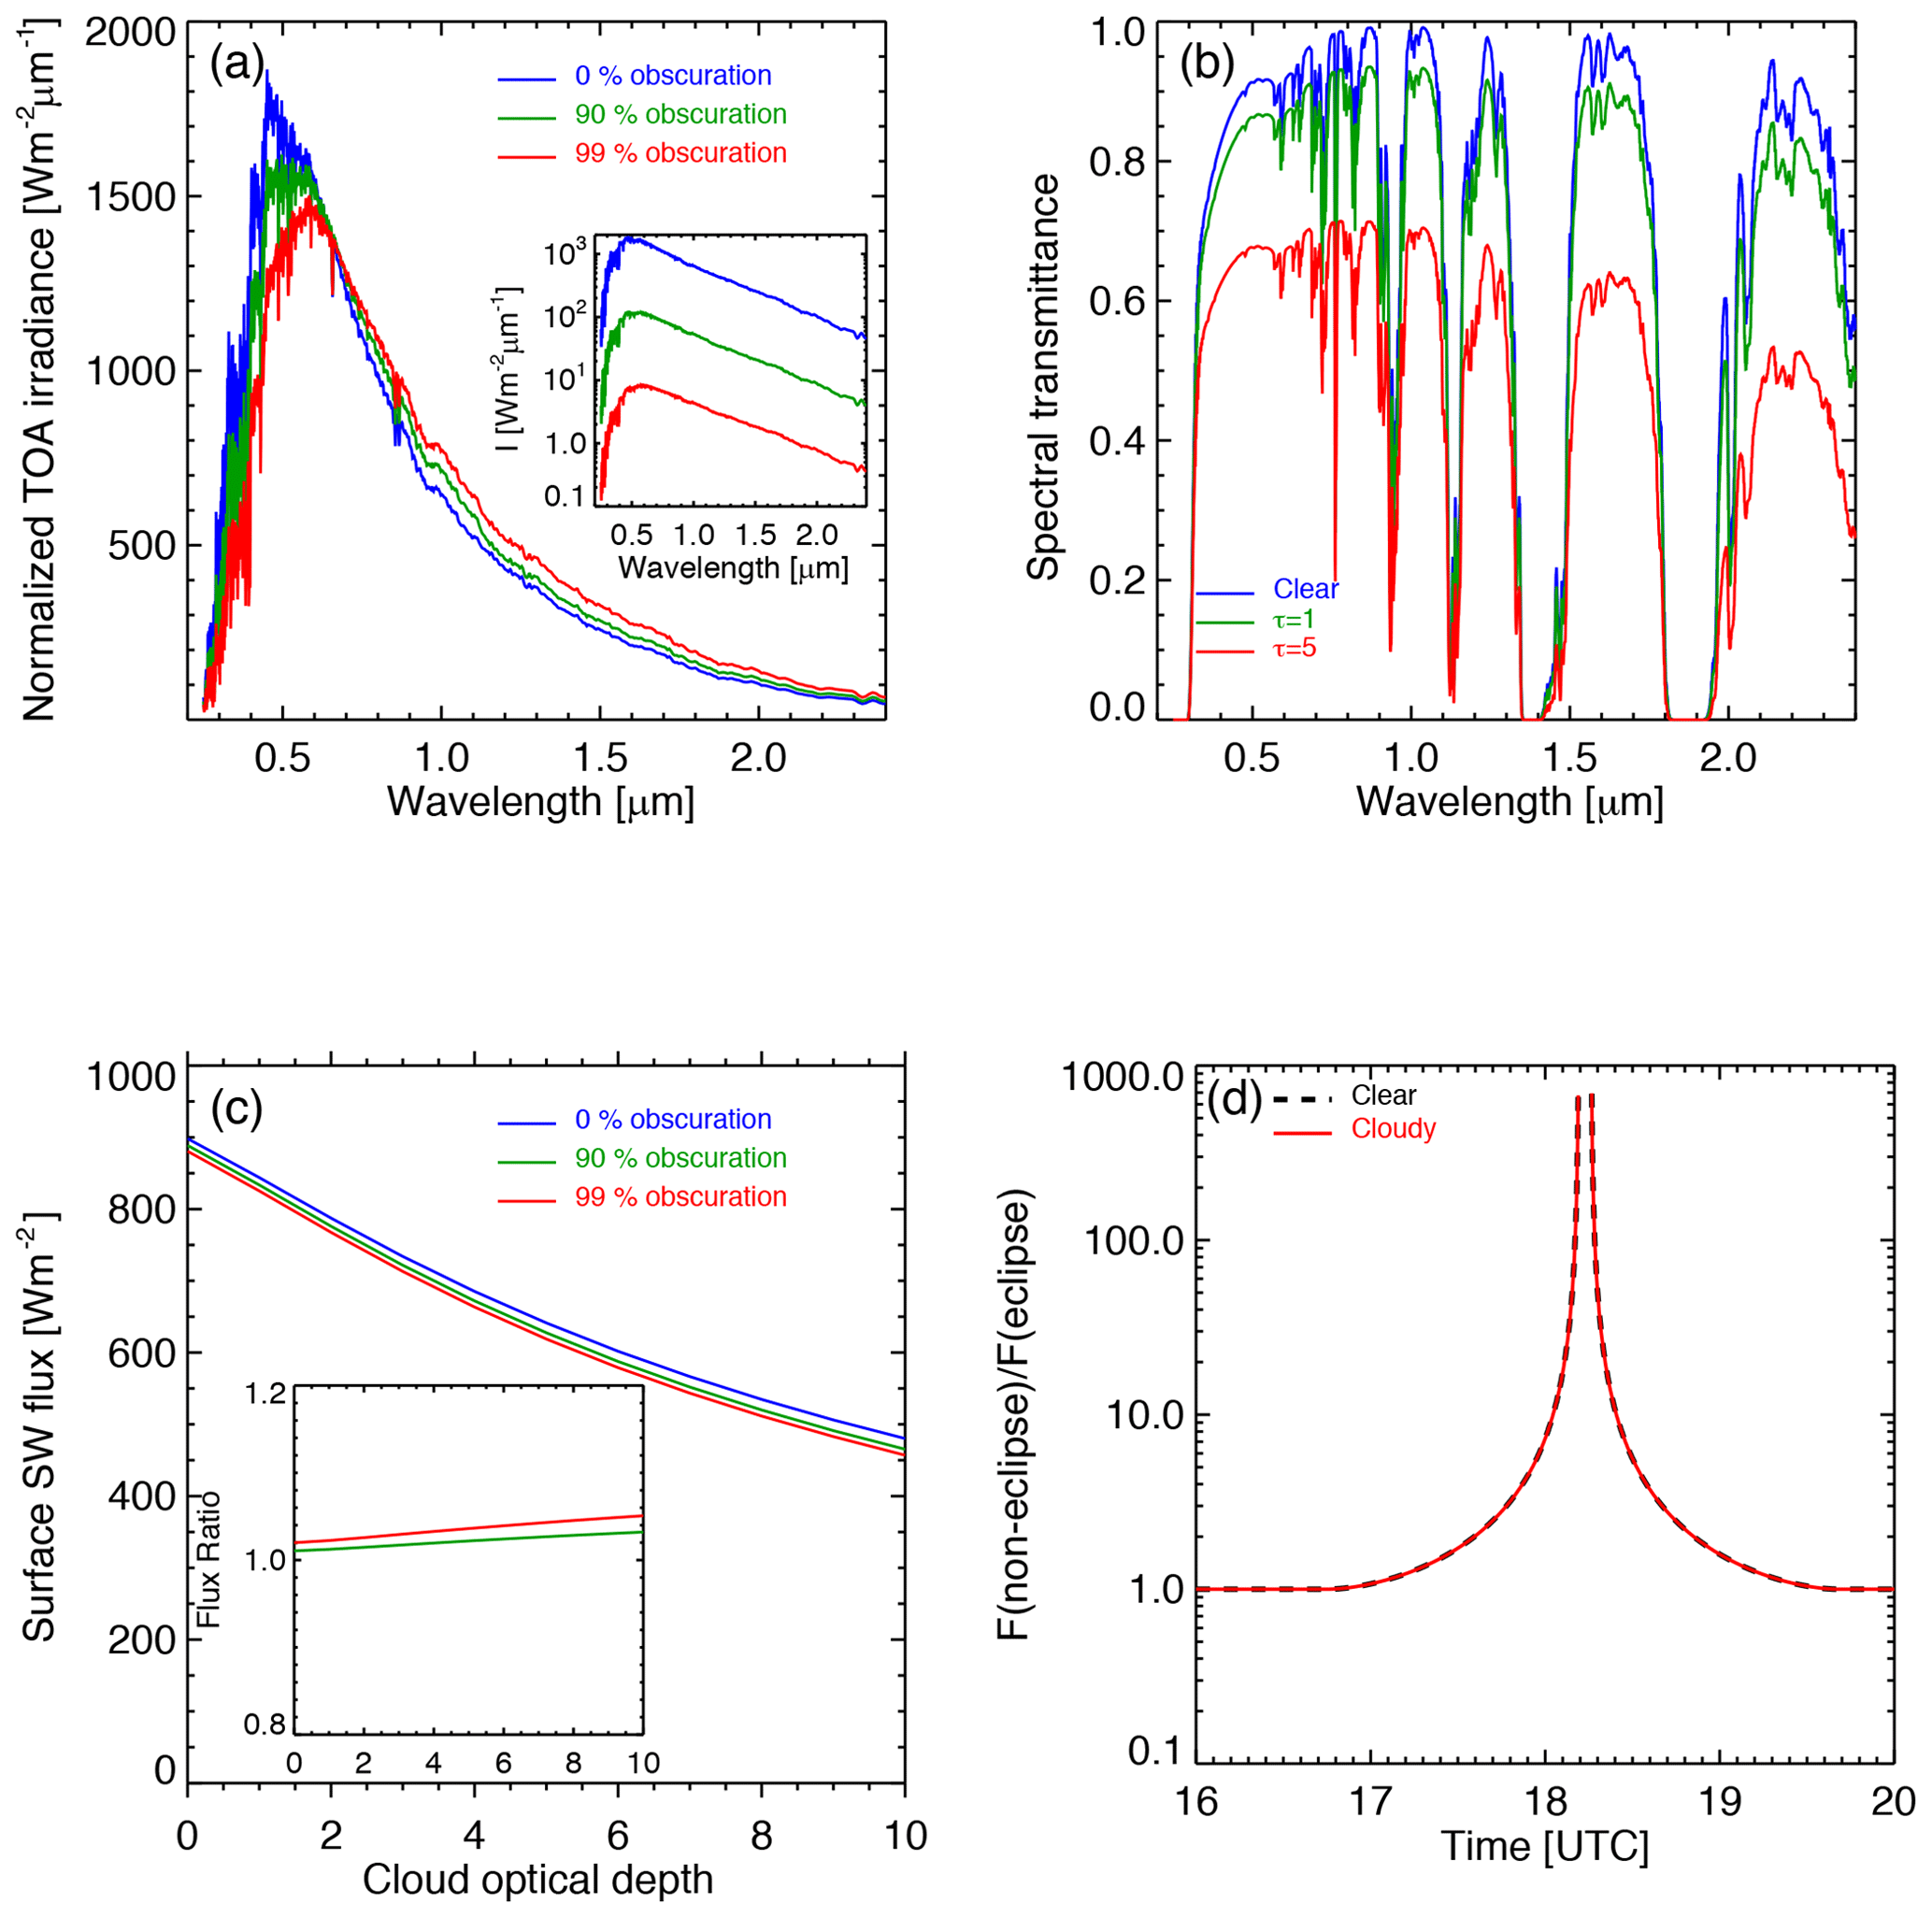
Figure 5(a) Normalized TOA spectral solar irradiance such that the spectrally integrated total irradiances equal that for normal conditions (0 % obscuration), with the true irradiances shown in the inset. The spectra are peaked at 0.45, 0.50, and 0.58 µm for normal conditions (0 % obscuration) and eclipse conditions with 90 % and 99 % of obscuration; (b) spectral transmittance for clear and cloudy atmospheres for SZA =30∘ calculated from the SBDART; (c) the SBDART-modeled surface SW flux as a function of cloud optical depth for different TOA solar spectra in (a) with the ratio of surface SW flux for the normal spectrum to that for a different red-shift spectrum in the inset; (d) the Fu–Liou radiation code modeled non-eclipse-to-eclipse surface SW flux ratios for clear atmosphere (dashed black) and cloudy atmosphere with a cloud optical depth of 2 (red) from 16:00 UTC before the eclipse to 18:11 UTC (99 % obscuration) and from 18:16 UTC (99 % obscuration) to 20:00 UTC after the eclipse.
Clouds play a unique role in modifying spectral solar irradiance reaching the surface. We used the SBDART to compute spectral transmittance (which is defined as , where Is(λ) and I0(λ) are the surface downward spectral irradiance and TOA spectral irradiance at wavelength λ, respectively, and θ is the solar zenith angle) as a function of cloud optical depth for different TOA solar spectra. Figure 5b shows that an increase in cloud optical depth leads to a relatively larger decrease in surface spectral irradiance in near-IR wavelengths compared to near-UV and visible wavelengths. Here we examine the effect of cloud on transmitted flux for red-shift spectral solar irradiance. For the red-shift spectrum, an increase in cloud optical depth leads to a relatively smaller decrease in transmitted surface flux in near-UV and visible wavelengths. There is a relatively larger decrease in near-IR wavelengths compared to the spectrum for the normal conditions simply because of the red shift in the TOA solar spectrum. To some extent, the larger decrease in near-IR wavelengths compensates for the smaller decrease in visible and near-UV wavelengths, resulting in a decrease in spectrally integrated surface SW flux similar to that for the normal TOA spectral solar irradiance.
Figure 5c shows the change in the spectrally integrated SW flux calculated from the SBDART as a function of cloud optical depth at 0.55 µm for the normal solar spectrum and red-shift spectral solar irradiance associated with different obscuration levels (Fig. 5a) and shows that all curves of surface SW flux are similar in shape. For a given cloud optical depth, there is a slightly larger decrease in surface SW flux for a larger red-shift TOA solar spectrum associated with a larger obscuration. The ratio of surface SW flux for the normal TOA solar spectrum to that for the red-shift solar spectrum is presented in the inset in Fig. 5c. It is clear that the flux ratio is not very sensitive to cloud optical depth and the ratios are slightly larger than unity. Note that one needs to multiply a scale factor of to obtain the true non-eclipse-to-eclipse surface SW flux ratio. Thus, the surface SW flux ratio depends on the obscuration of the eclipse and is not very sensitive to cloud optical depth.
Figure 5d shows the time series of the modeled non-eclipse-to-eclipse surface SW flux ratio for clear atmosphere and cloudy atmosphere with a cloud optical depth of 2 for the Columbia site. The difference between the two ratios is less than 1 %. The difference increases slightly with cloud optical depth. For a cloud optical depth of 10, the difference is close to 4 % near to totality at 99 % obscuration.
In this study, we assume that the non-eclipse-to-eclipse surface SW flux ratio for realistic 3D cloudy atmospheric conditions is approximately equal to the 1D model computed flux ratio for clear atmospheric conditions, i.e.,
where Feclipse(t) and Fnon-eclipse(t) are surface SW fluxes observed by the pyranometer and what would be observed without solar eclipse, and Feclipse,model(t) and Fnon-eclipse,model(t) are the counterparts from a 1D model for clear conditions at time t, respectively. Thus, the surface SW flux for non-eclipse conditions can be estimated as
Similar assumption was used to estimate narrowband flux from broadband flux (Wen et al., 2013) and to compute the clear-sky reflectance enhancement in broken cloud fields (Kassianov and Ovtchinnikov, 2008). Kassianov and Ovtchinnikov found that the ratio between the two 1D reflectances at two wavelengths was a good approximation to the 3D ratio of the same wavelengths, although the two reflectances were quite different. It is important to note that the assumption is invalid in the umbra and bordering areas. The scattering outside of the umbra contributes to a small surface flux Feclipse in totality area, a factor of smaller in surface spectral flux at 500 nm compared to non-eclipse conditions (Emde and Mayer, 2007), while the surface flux from the 1D model is zero. This 3D effect due to non-uniform spatial distribution of incident solar irradiance at the TOA during an eclipse on surface radiation was thoroughly studied by Emde and Mayer (2007). They show that the 1D errors decrease quickly away from the totality. Since TOA spectral solar irradiance is peaked near 500 nm, we use their results for 500 nm to estimate the 1D error of broadband surface flux. At 500 nm, the 1D error for surface irradiance decreased to less than 5 % in 200 s (or about 170 km) from the time when centers of the Moon and Sun disks coincide. Since the umbra and the bordering region cover only a tiny fraction of the whole Moon's shadow with a radius of about 3430 km on Earth, the 1D error in these areas will contribute little to the average surface flux estimates.
4.2 Estimating the impact of the eclipse on global average surface broadband SW flux from ground-based observations
In addition to estimating the impact of the eclipse on time-averaged flux at two local sites, we also estimate its influence on the global average surface SW radiation budget. During a solar eclipse, the Moon casts a shadow that extends to an area greater than 3000 km in radius, significantly reducing the global average surface SW radiation budget. Estimating the impact of a solar eclipse on the global shortwave radiation budget from local observations is a major goal of this research. First, we present a method for computing the change in the global averaged surface SW flux from spatially averaged observations. Then we extend these results to global average irradiance reduction.
First, the global average surface SW flux for an eclipse condition is the area-weighted flux inside and outside of the Moon's shadow; it can be written as
where Re is Earth's radius, A is the area of the penumbral shadow projected onto Earth's cross section perpendicular to the Sun–Earth line (the outermost circle in Fig. 6), F′ is the average flux outside of the Moon's shadow, and Feclipse is the average flux in the Moon's shadow. Similarly, for a hypothetical non-eclipse condition, the global average surface SW flux is
where Fnon-eclipse is the average surface SW flux for the Moon's shadow area as if the eclipse were not present.
The eclipse-induced relative reduction of surface SW flux to the global average value (ΔFr) is
or
where F2 is the global average surface SW flux for non-eclipse conditions.
Using the geometric information (i.e., Sun–Earth distance of 1.51×10⁸ km and Moon–Earth distance of 3.73×10⁵ km on 21 August 2017, radii of the Sun, 6.957×10⁵ km, and Moon, 1737.4 km), we calculated the radius (r0) of the Moon's shadow projected onto the plane tangent of the Earth at the totality to be about 3430 km. Note that part of the Moon's shadow falls out of Earth's disk. For the Casper site, ; for the Columbia site, . Thus, ΔF in Eq. (10b) may be estimated by multiplying the TOA average total solar irradiance of 1360.8 W m−2 (Kopp and Lean, 2011) (with adjustment for the Sun–Earth distance) by the global average transmittance of 0.55 (Trenberth et al., 2009), Re=6378 km, and r0=3430 km. Thus, one needs to know the average surface SW flux for both eclipse and non-eclipse conditions to compute the fractional reduction in global average surface SW flux.
We next show that the temporally resolved downward shortwave flux from the pyranometers may be used to estimate the spatial average flux in the penumbra, mainly because the ground sites are in the path of the total eclipse; therefore, the instruments were able to sample the full course of the eclipse.
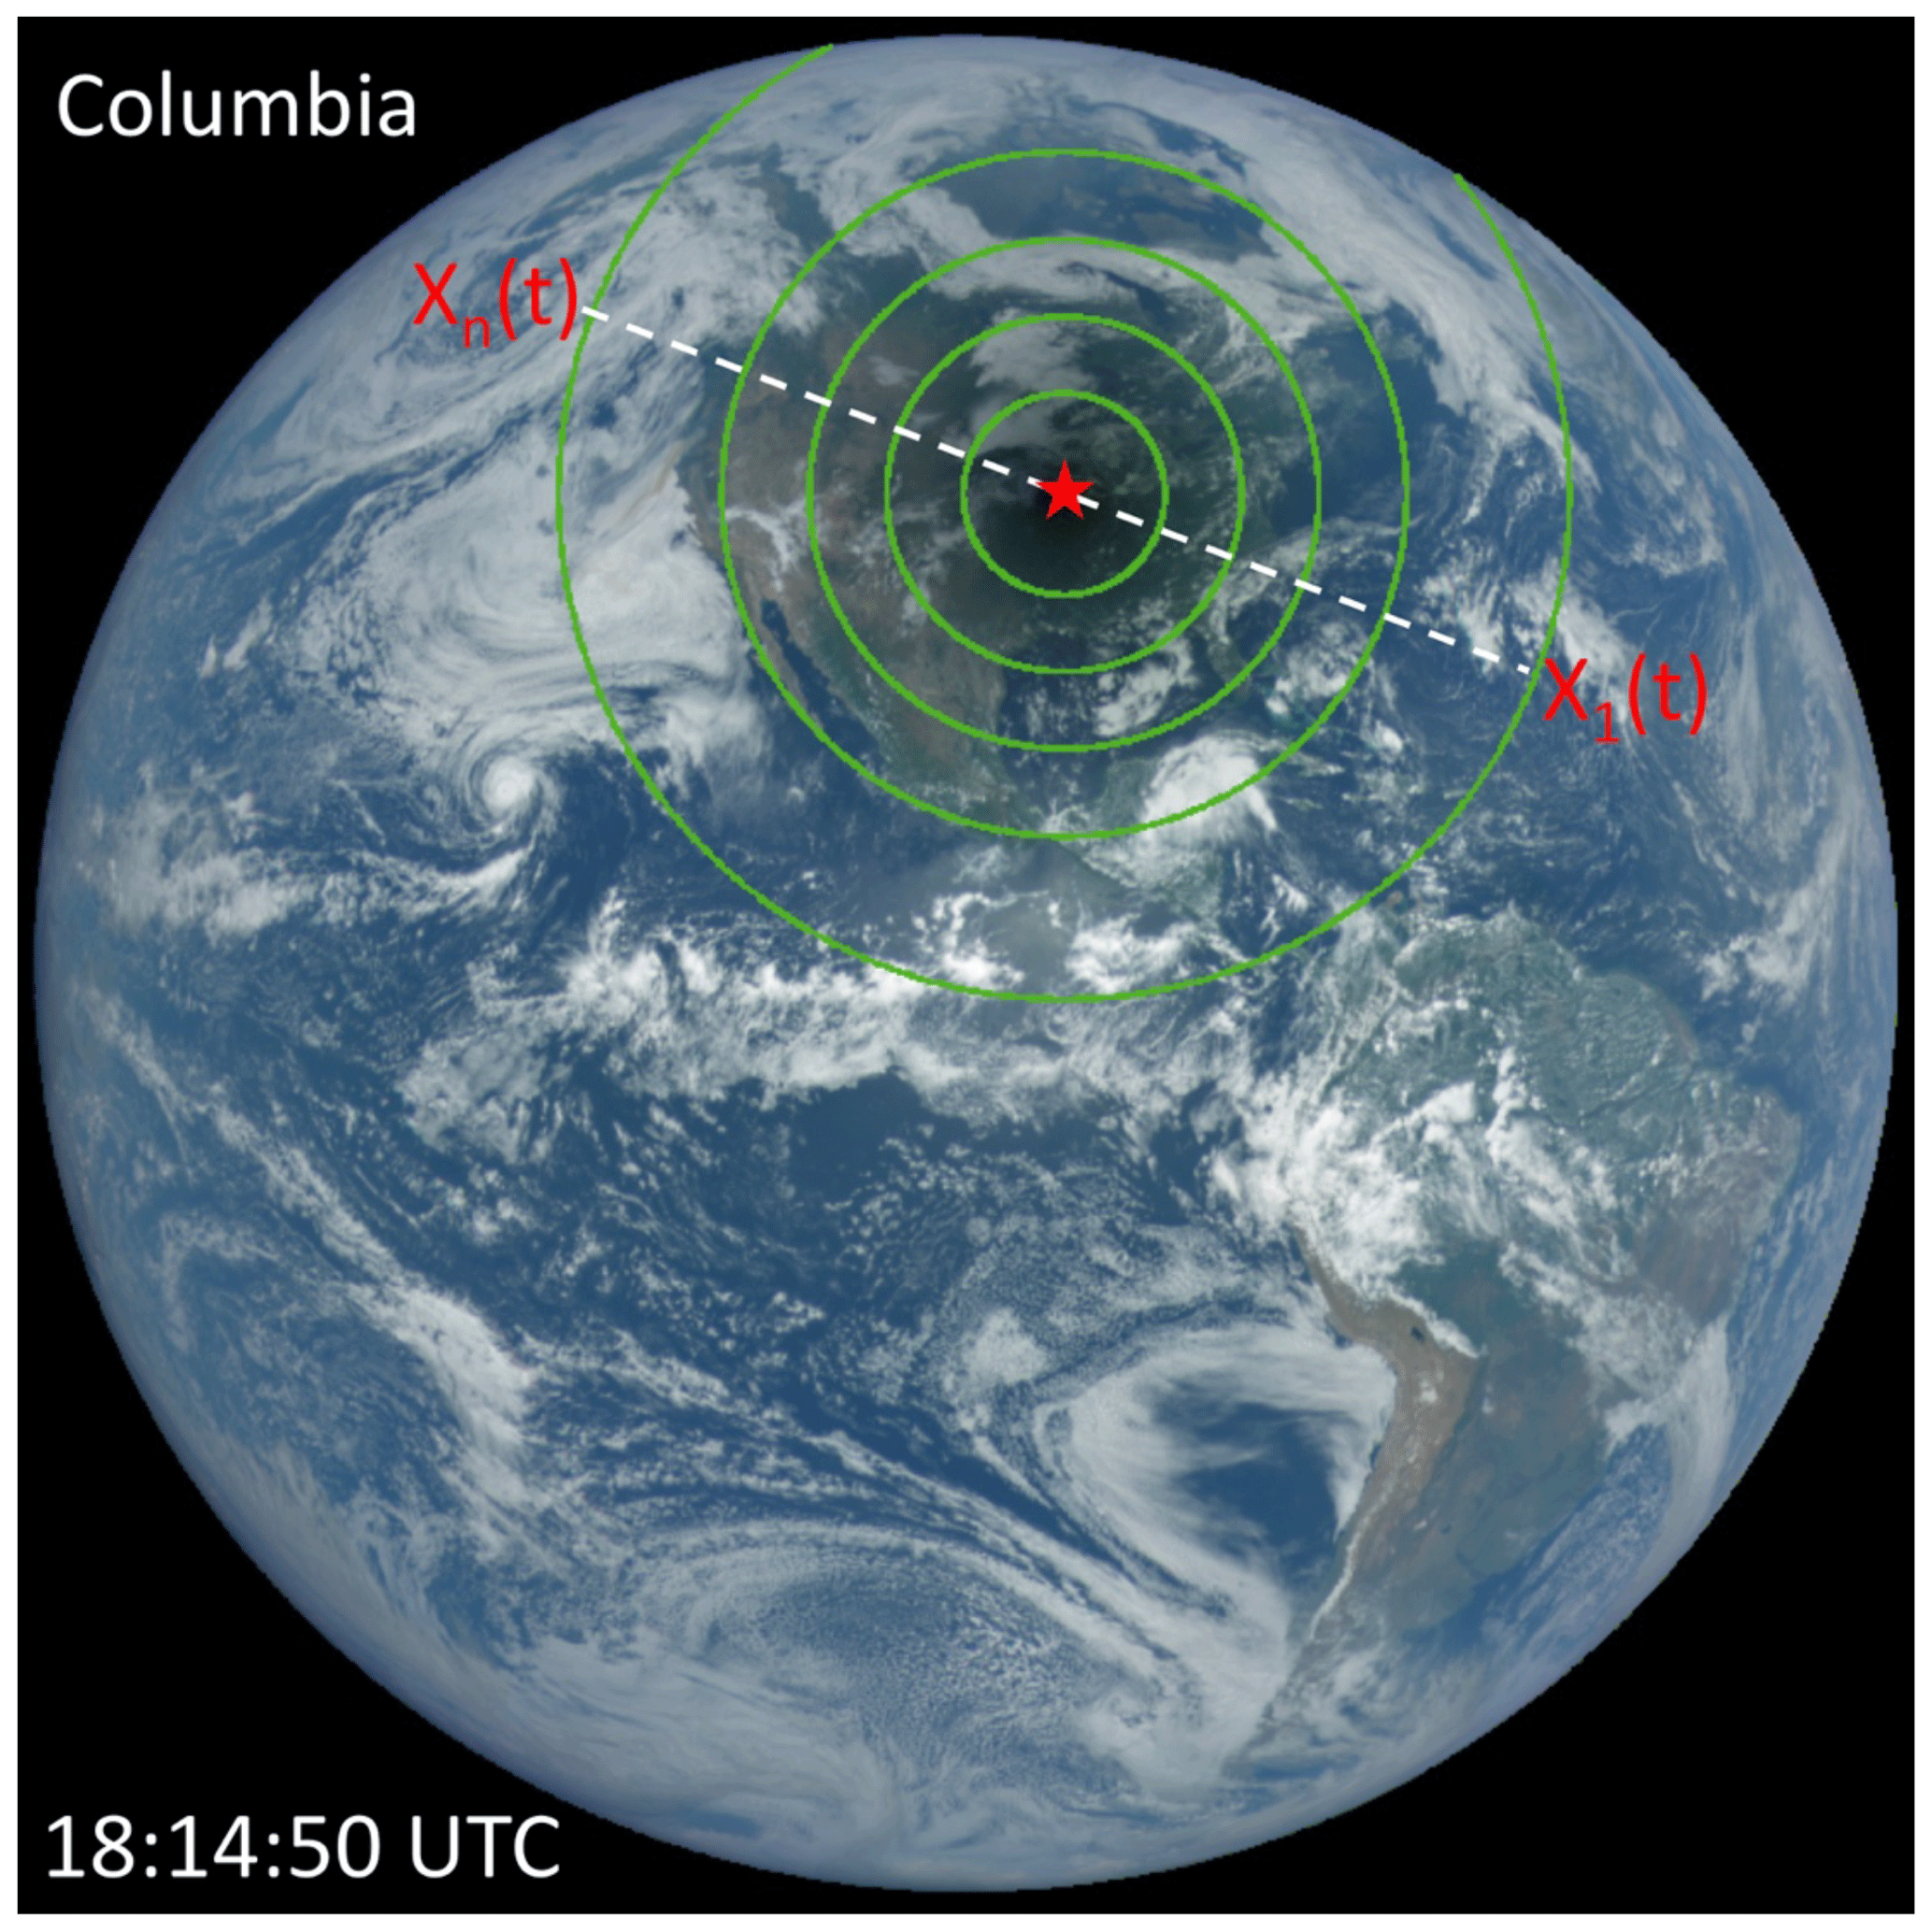
Figure 6A sketch illustrating the conversion from temporal to spatial average. The color image has been adjusted from the images on https://epic.gsfc.nasa.gov (last access: 21 August 2020) by increasing the gamma correction (Cescatti, 2007) to bring out the region of totality over Columbia (red star) and surrounding clouds. The green contours show the levels of obscuration from 0 % for the outmost circle with a decrement of 20 % inward. The dashed line illustrates the totality path.
First, we demonstrate this for an ideal scenario with a horizontal homogeneous atmosphere and constant surface albedo. Figure 6 shows the DSCOVR/EPIC image acquired at 18:14:50 UTC when the Columbia site was experiencing the totality. The average surface SW flux in the penumbra may be estimated by averaging observations ( from a series of n pyranometers uniformly distributed along the totality path (i.e., . At the Columbia site, the pyranometer observed a temporal variation of downward flux with uniform increments of time (i.e., . At time t1 when the eclipse started, the surface radiometer sampled the downward flux F(t1), which would be approximately the same as the observed flux at the eastern edge (i.e., F(X1)) of the penumbra when Columbia was experiencing totality. Similarly, the pyranometer observed the surface SW flux at time ti, which would be the same as that from the pyranometer at Xi in the totality path (the white dashed line in Fig. 6) with the same phase of obscuration (i.e., F(Xi)=F(ti)). Thus, the temporal average of the observed surface SW flux from n time steps from a local site is approximately equal to the spatial average of the surface SW flux observed from a series of n radiometers.
To estimate the surface SW flux reduction in the whole area of the penumbra, one needs to calculate the average flux in the Moon's shadow. For the assumed homogeneous atmosphere and surface properties, the surface SW flux depends only on the radius from the totality, and the relative reduction of the global average flux (ΔFr) can be written as
where the distance r is the distance from the totality and φ is the azimuth angle. The integral is limited to the area of the shadow on the Earth's disk only and the distance r is estimated from the linear relation between r and t such that r=0 at the totality and r=r0 at the beginning and end of the partial eclipse, and and Fnon-eclipse(r) are derived from Feclipse(r) (Eq. 8b). Note that we estimate r from the linear relation with t for the time periods before and after the totality separately because of the asymmetry of the two branches.
We emphasize that the temporal average value from one location represents the spatial average for similar atmosphere and surface conditions in the penumbra. The results from the Casper site represent mostly clear atmospheric conditions. With more cloud cover over the Columbia site, the estimated shortwave irradiance change is closer to realistic atmospheric conditions as described later.
Figure 7 shows both the observed surface SW flux and its derived counterpart for non-eclipse conditions for both sites. It also shows the modeled surface SW fluxes, including the clear-sky flux for both the eclipse and non-eclipse scenarios and the flux for the one-layer cirrus with variable cloud optical depth for non-eclipse conditions.
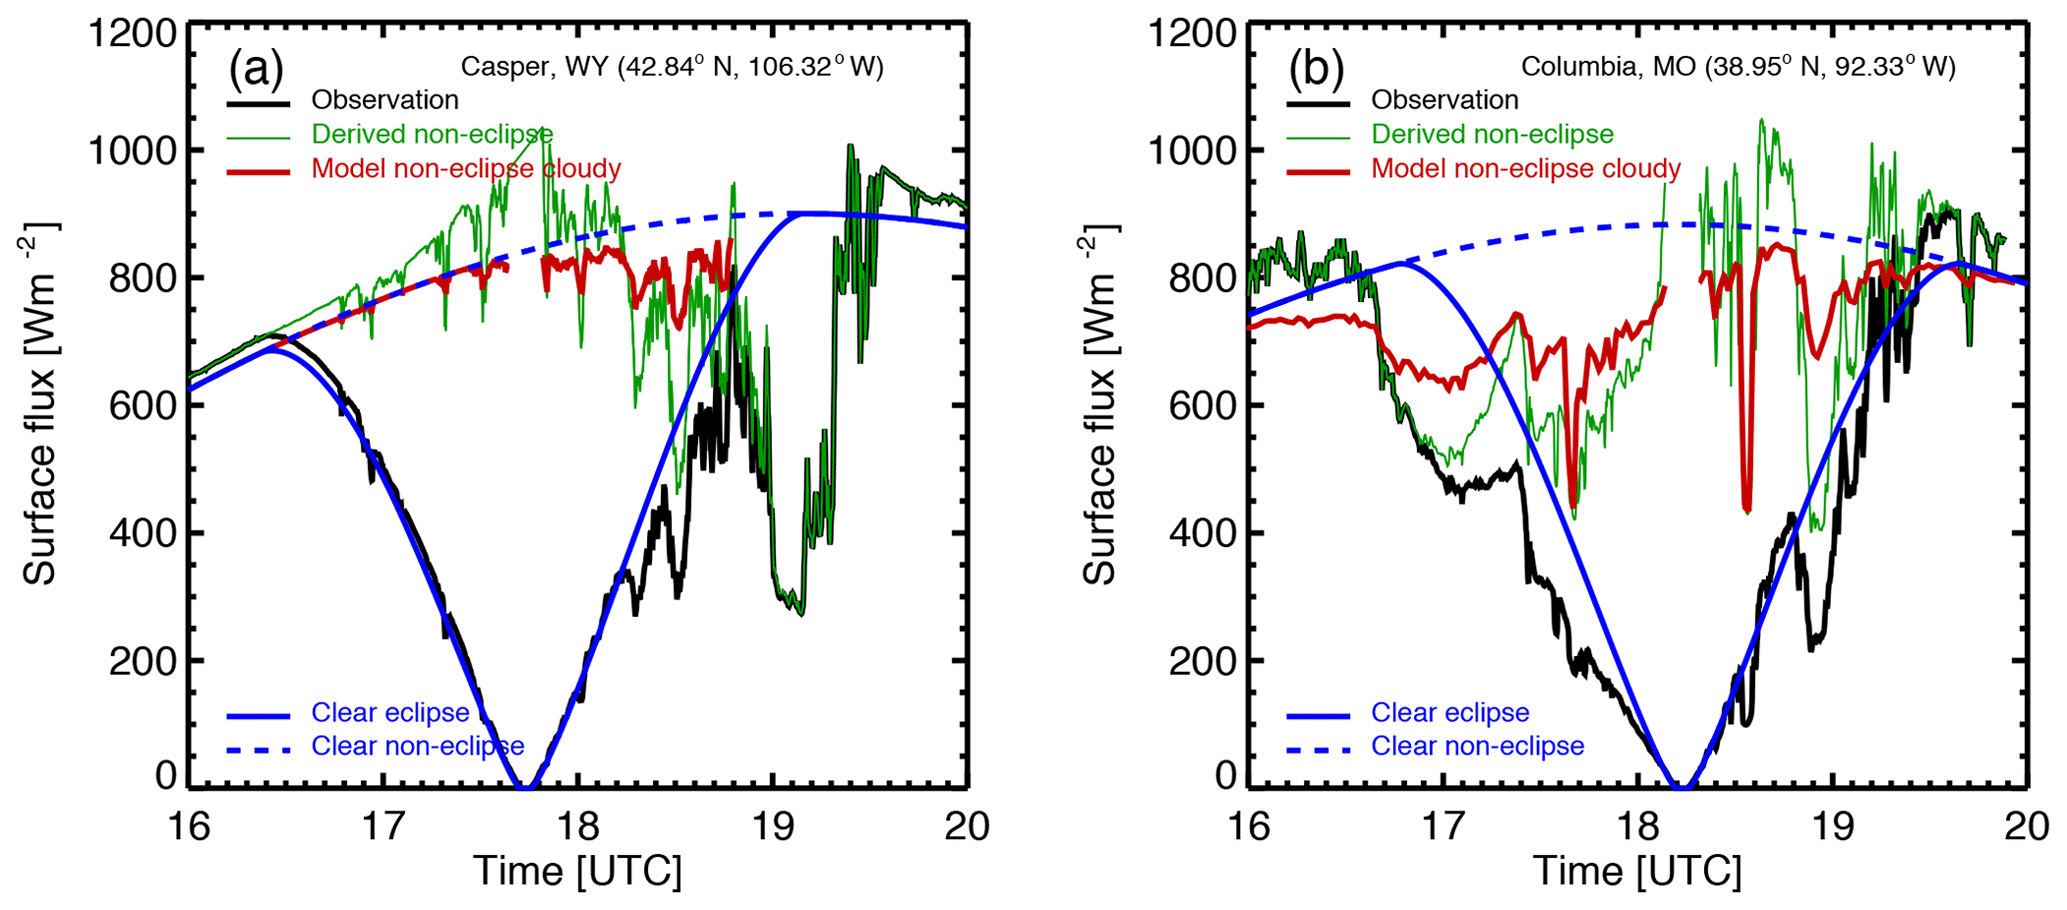
Figure 7(a) Casper; (b) Columbia. Observed surface flux (black), derived surface SW flux for non-eclipse conditions (green), surface flux for clear atmospheric conditions for eclipse (solid blue) and non-eclipse conditions (dashed blue); the modeled surface flux (red) uses observed cloud optical depth assuming 100 % cloud coverage. For the Casper site, the average reduction in local SW flux is 379 W m−2 or 50 % and the average reduction in global surface SW flux is 7.4 %. For the Columbia site, the average reduction in local surface SW flux is 329 W m−2 or 46 % and the average reduction in global surface SW flux is 6.8 %.
For the Casper site (Fig. 7a), in the first period from 16:00 to 18:12 UTC before and during a large part of the eclipse, the observed surface SW flux varies rather smoothly with time, similar in behavior to that for modeled clear-sky flux except for a few tiny dips, which is likely due to fragments of thin cirrus passing through the FOV of PSI, as indicated by small spikes in cloud optical depth observations (Fig. 2). From 16:00 to 16:42 UTC, the observed flux exceeds the modeled one for clear atmospheric conditions by more than 20 W m−2 and by a much smaller amount as time proceeds after 16:42 UTC. This enhancement can be explained by the presence of some thin cirrus clouds not shading the direct solar beam in this time period. Thin cirrus clouds not shading the direct solar beam have no impact on the direct component of surface SW flux but increase the downward diffuse radiation, resulting in an increase in total surface SW flux compared to clear atmospheric conditions. The cirrus cloud-induced surface SW flux enhancement decreases with time towards the totality as the TOA brightness decreases. In the second time period from 18:12 to 19:12 UTC, the dips in the observed flux are much larger and last longer in time compared to the dips in the first period. This is associated with the nature of the clouds that shade the direct solar beam, as indicated by the cloud optical depth observations (see Fig. 2).
For non-eclipse conditions, the cirrus cloud-induced enhancement and the downward dips in the estimated surface SW flux are more pronounced compared to the eclipse scenario. In the first time period (16:00–18:12 UTC), the estimated surface SW flux exceeds that for clear atmospheric conditions by about 20 W m−2 in the beginning of the time series to about 100 W m−2 around 17:18–17:30 UTC, much larger than the counterpart for eclipse conditions. The dips in the second period (18:12–19:12 UTC) are evidently larger than their counterparts for the eclipse conditions. The magnitude of the dips in the estimated surface flux is closely related to the observed cloud optical depth.
In the first time period (16:00–18:12 UTC), the modeled surface SW flux (red curve) is close to the clear-sky flux (dashed blue) because of the small cloud optical depth and underestimates the surface flux accordingly. However, the model overestimates the surface flux (green curve) in the second period (18:12–19:12 UTC). For a given observed cloud optical depth, we expect the model to provide accurate direct surface SW flux. The discrepancy between the model and observations comes from the difference in the diffuse component. The underestimate in the first time period is due to the fact that the 1D model does not consider the cirrus cloud-induced enhancement by the diffuse radiation, which is a 3D effect. The overestimate in the second time period (red curve vs. green one) is because the 1D horizontally extended clouds produce more downward diffuse SW flux than the real cirrus clouds that cover only a fraction of the atmosphere, as shown in GOES-16 images (see Fig. 3a, b).
Using the observed and derived surface SW flux for eclipse and non-eclipse conditions, we estimated the average reduction of the local surface SW flux to be about 379 W m−2 or 50 %, which corresponds to a 7.4 % reduction in the global surface SW radiation when the Moon's shadow was centered at Casper.
Similarly, the variations of the observed surface SW flux at the Columbia site (Fig. 7b) can be understood by comparing it with the modeled flux for clear atmosphere during the eclipse. From 16:36 to 17:06 UTC, the observed flux decreases from 800 to 460 W m−2, which is about a 340 W m−2 decrease compared to a decrease of about 60 W m−2 for clear atmospheric conditions (blue curve). This much larger decrease in the observations is primarily due to the increase in cloud optical depth during this time period (see Figs. 2b, 8b). From 17:06 to 17:24 UTC, there is a slight increase in the observed surface SW flux compared to a continuous decrease in the SW flux for the clear atmospheric conditions. The slight increase in the observed surface SW flux is the combination of the decrease in the cloud optical depth and the decrease in the TOA brightness. Thus, the observed cloud optical depth combined with the TOA brightness can be used to interpret the main features of observed surface SW flux variations. There are time periods when observations exceed the values for clear atmosphere by nearly 50 W m−2 in 18:39–18:48 UTC and 80–100 W m−2 in 19:12–19:36 UTC.
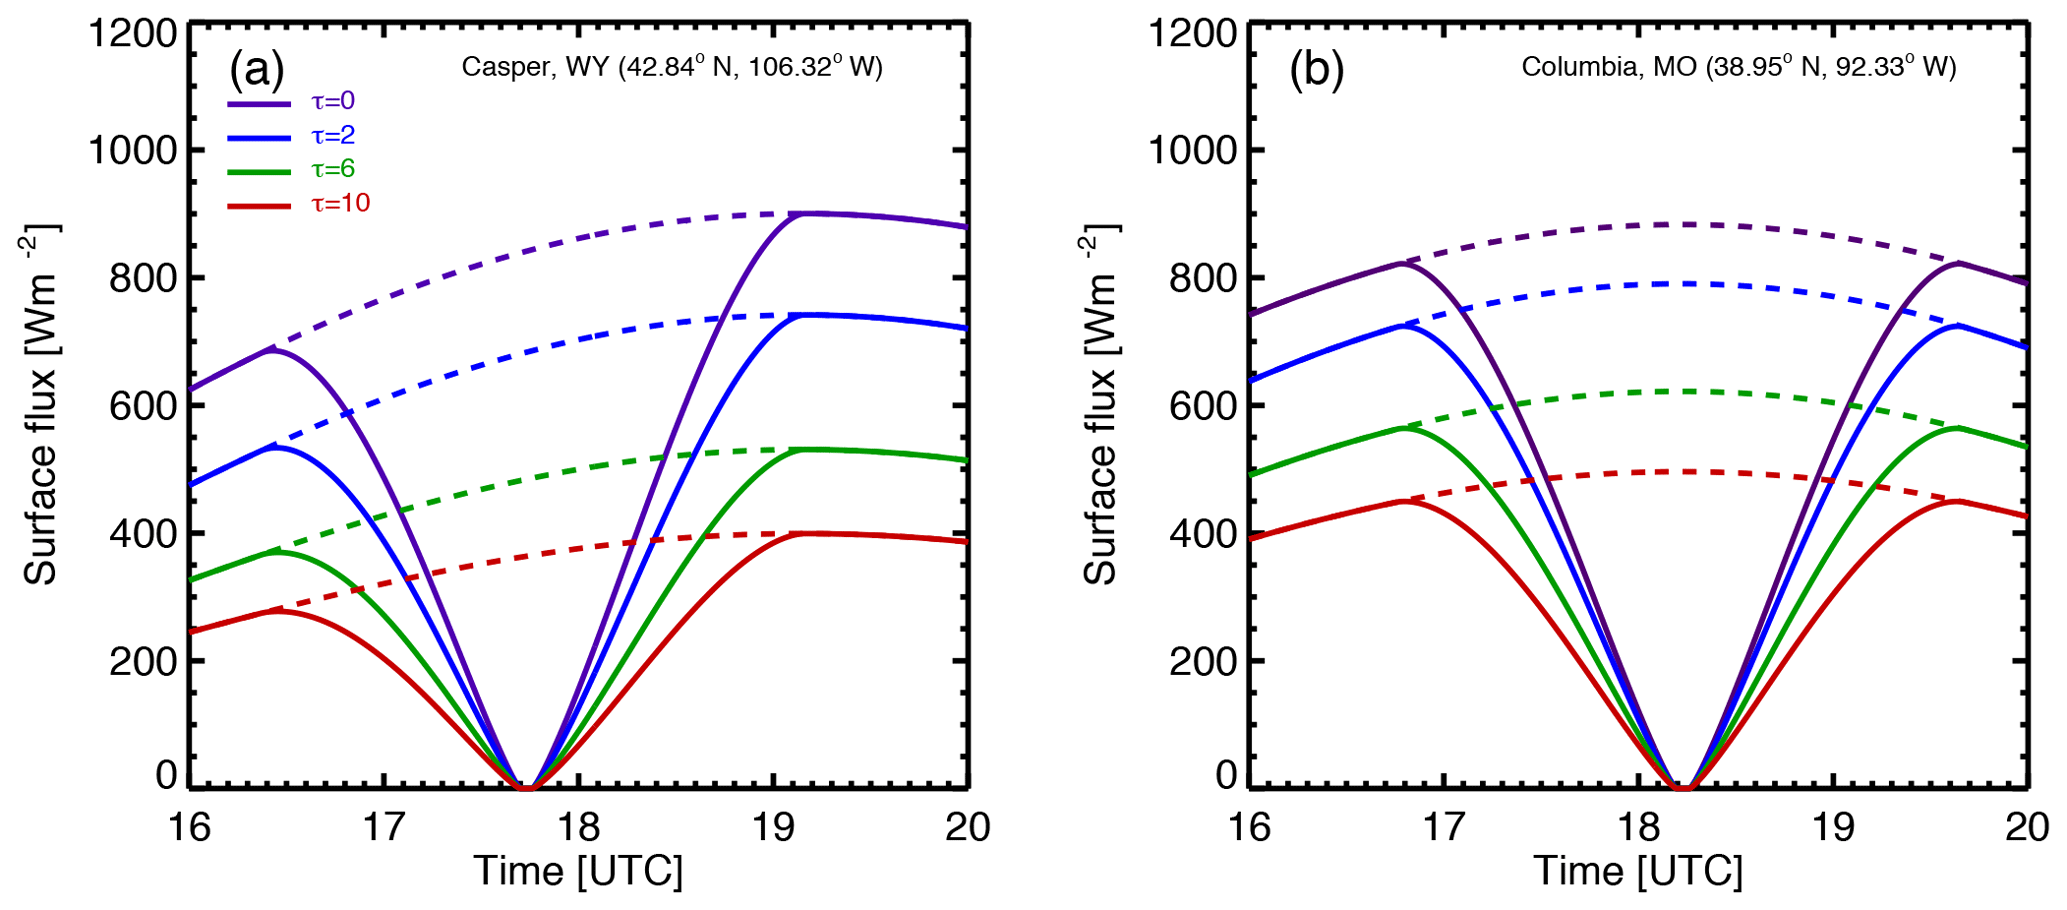
Figure 8(a) Casper; (b) Columbia. The modeled surface SW flux variations for eclipse (solid lines) and non-eclipse (dashed lines) conditions for different cloud optical depths.
For non-eclipse conditions, the cloud effects of reducing and enhancing the surface flux are more pronounced compared to the eclipse conditions, similar to the results for the Casper site. The derived non-eclipse flux exceeds the value for clear atmospheric conditions by 150 W m−2 (18 %) at 18:39–18:48 UTC and near 100 W m−2 (12 %) at the end of the eclipse at 19:12–19:36 UTC. Koepke et al. (2001) suggested that when the direct solar beam is not shaded by a cloud, the additional reflection of solar radiation from vertically extended clouds can increase the incoming surface radiation by up to 25 % above the corresponding cloud-free values. Thus, it is not surprising to see a large enhancement of surface SW flux in a system of cumulus clouds under optically thin cirrus clouds.
In non-eclipse conditions, we found that the 1D model (red curve) overestimates the surface flux (green curve) for most situations. Again, the cloud inhomogeneity is the main cause of the overestimation. The low- and mid-level cumulus clouds that are not accounted for with the 1D model reflect the diffuse radiation scattered by cirrus clouds above them; as a result, a smaller amount of diffuse radiation reaches the detector, and thus a smaller total SW flux is measured compared to a 1D model. Evidently, a 1D model is unable to simulate the enhancement induced by cloud side reflection.
From the observed surface SW flux and estimated flux for non-eclipse conditions, we estimated the average reduction of the local average surface SW flux as about 329 W m−2 or 46 %, corresponding to a 6.8 % reduction in the global average surface SW flux when the Moon's shadow was centered at Columbia.
To understand the role of clouds in eclipse-induced flux reduction, we modeled the surface SW flux for different cloud optical depths. Figure 8 shows that the increase in cloud optical depth leads to a decrease in surface flux for both non-eclipse and eclipse conditions. However, at a given time during the eclipse, the rate of decrease in surface flux to the increase in cloud optical depth for the eclipse (difference between solid curves) is smaller than the rate for non-eclipse conditions (difference between dashed curves). This is primarily due to a smaller TOA-reduced brightness for eclipse conditions.
Figure 9 shows flux difference (i.e., Fnon-eclipse(t)−Feclipse(t)) for different cloud optical depths. It is evident that the flux difference is largest for clear atmospheric conditions, and the difference decreases with the increase in cloud optical depth. Thus, the eclipse has a smaller impact on surface flux under cloudy compared to clear atmospheric conditions; the impact decreases with the increase in cloud optical depth.
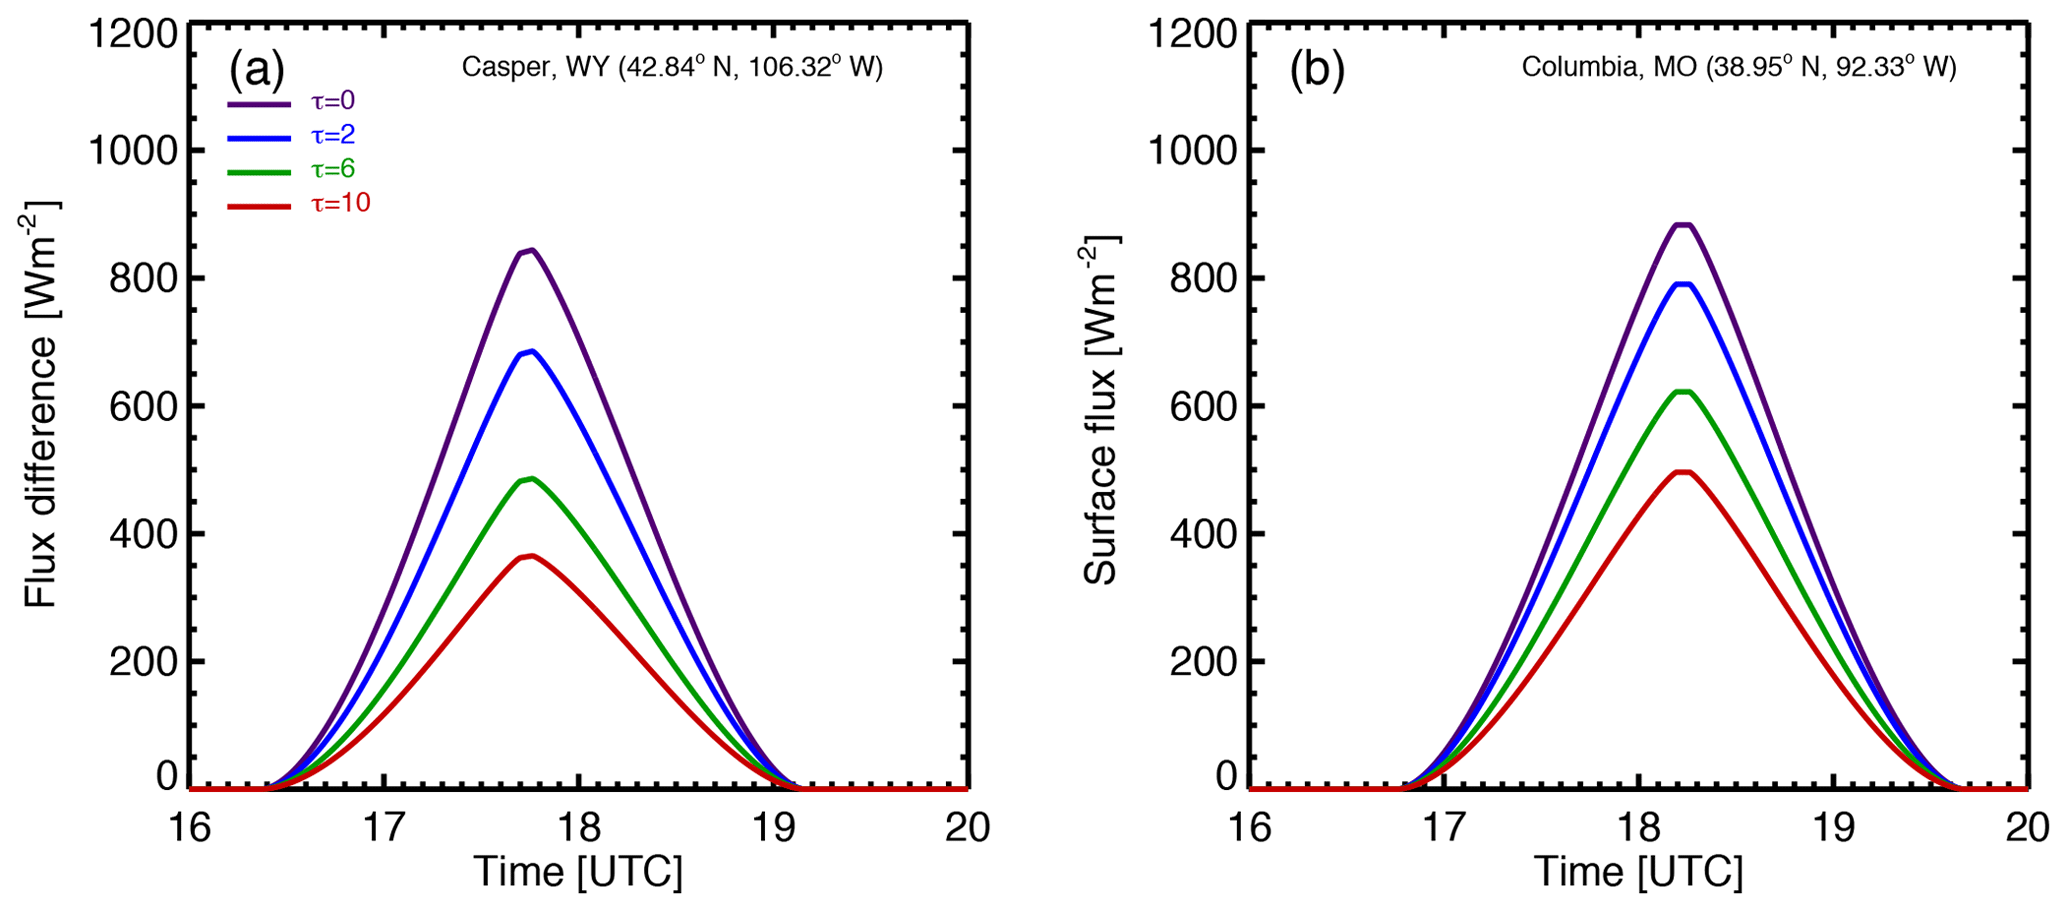
Figure 9(a) Casper; (b) Columbia. The modeled surface SW flux reduction (Fnon-eclipse,model−Feclipse,model) for eclipse (solid lines) and non-eclipse conditions for different cloud optical depths.
Figures 8 and 9 show that both the time-averaged surface flux for non-eclipse conditions (e.g., the area under the dashed curve in Fig. 8) and the average flux reduction (e.g., the area under each curve in Fig. 9) decrease with cloud optical depth; the ratio of the two does not vary much with cloud optical depth. In fact, Fig. 10 (blue curves) shows that the relative reduction of the local surface flux is not very sensitive to cloud optical depth, remaining at around 45 % at Casper and with a slightly larger value at Columbia.

Figure 10(a) Casper; (b) Columbia. The modeled relative reduction of average local surface flux (blue) during the eclipse and estimated impact on global surface SW flux budget (black).
The reduction of global SW radiation relative to climatology of surface flux (F2 in Eq. 8b) depends on the average flux difference between non-eclipse and eclipse conditions in the Moon's shadow area (Feclipse and Fnon-eclipse in Eq. 8b). This flux difference is proportional to the area under each curve in Fig. 9, which always decreases with cloud optical depth. Thus, the relative reduction of global surface radiation, calculated using Eq. (8b), decreases with the cloud optical depth in the Moon's shadow (black curves in Fig. 10).
Figure 10 also shows that, for a given cloud optical depth, the reduction of the average surface SW flux for the Columbia site is larger than for the Casper site. This difference can also be seen from Fig. 9. These differences are mainly due to a smaller SZA at Columbia compared to Casper (see Table 1). The cosine of the SZA for the Columbia site is about 10 % larger than that for the Casper site; thus, the average TOA incident solar irradiance for the Columbia site is also about 10 % larger than that for the Casper site. For the same optical depth, there is a larger surface SW flux at the Columbia site compared to the Casper one for non-eclipse conditions; therefore, the impact of the eclipse on surface flux at the Columbia site is larger than that at the Casper one.
At Casper, the observation-based relative reduction of the local surface SW flux (50 %) is significantly larger than the 1D modeled prediction (45 %); however, the relative reduction of global flux of 7.4 % is close to the modeled value (8.5 %) for the average cloud optical depth. At the Columbia site, the observation-based relative local reduction of the local surface SW flux (46 %) is slightly larger than the model prediction (45 %); on the other hand, the relative reduction of the global flux (6.8 %) is significantly smaller than the modeled one (9 %). These differences between observations and model simulations are mainly due to cloud inhomogeneity not accounted for in the 1D radiative transfer model.
We have conducted a ground-based experiment to observe broadband shortwave irradiance at Casper, Wyoming, and Columbia, Missouri, located in the totality path of the 21 August 2017 solar eclipse. These two sites are separated by a distance of about 1200 km and had different atmospheric conditions. Surface shortwave flux measurements with simultaneous atmospheric observations allow us to study the impact of the solar eclipse on the surface shortwave radiative budget under different atmospheric conditions.
Radiative transfer calculations show that the non-eclipse-to-eclipse surface SW flux ratio primarily depends on the obscuration of the solar disk during eclipse and slightly depends on cloud optical depth. These results allow us to derive non-eclipse surface SW flux under cloudy atmospheric conditions by multiplying the observed SW flux by the modeled surface SW flux ratio.
We found that at the Casper site, the eclipse led to a decrease of 379 W m−2 (50 %) in average local surface SW flux, and the Moon's shadow caused about a 7.4 % reduction in the global average surface SW radiation budget when the totality was at Casper; at the Columbia site, the eclipse led to a decrease of 329 W m−2 (46 %) in average local surface SW flux, and the Moon's shadow caused about a 6.8 % reduction in the global average surface SW radiation budget when the totality was at Columbia.
Clouds play a unique role in modifying the surface flux reduction during an eclipse. The eclipse-induced surface flux reduction is largest when the sky is clear. For opaque clouds, the surface even without eclipse would be already dark to begin with; thus, solar eclipse would have little impact on the surface SW flux. The average flux reduction decreases with the increase in cloud optical depth. However, the relative reduction of local surface flux is about 45 % and not sensitive to cloud optical depth. The relative reduction of global average surface SW flux depends on cloud optical depth in the Moon's shadow and geolocation due to the change in SZA.
We have discussed the 3D effect of clouds on surface radiation. We identified that the presence of cirrus clouds not shading the direct solar beam can significantly enhance the local surface flux; some large flux enhancements may be explained by the reflection of solar radiation by cumulus clouds; some discrepancies between a 1D model and observations may be understood as cloud inhomogeneities not accounted for in a 1D model. The mechanisms of cloud 3D effects on surface radiation enhancement have implications for surface remote-sensing research.
Calibrated pyranometer-observed broadband flux, optical depth data and eclipse parameters are available as a Supplement, the AERONET data are publicly available at https://aeronet.gsfc.nasa.gov (NASA Goddard Space Flight Center, 2020; Holben et al., 1998), and the MODIS and VIIRS data (https://doi.org/10.5067/MODIS/MOD06_L2.061, Platnick et al., 2017a, and https://doi.org/10.5067/VIIRS/CLDPROP_L2_VIIRS_SNPP.011, Platnick et al., 2017b) and DSCOVR/EPIC data (https://doi.org/10.5067/EPIC/DSCOVR/L2_TO3_02, Marshak et al., 2018) are publicly available at https://earthdata.nasa.gov (NASA EarthData, 2020).
The supplement related to this article is available online at: https://doi.org/10.5194/acp-20-10477-2020-supplement.
GW wrote most of the paper and performed most of the analysis with the help of AM. AM, SCT, JH, UJ, and NA participated in the field experiment to collect radiation measurements. RS helped with instrument management and DW helped with data analysis.
The authors declare that they have no conflict of interest.
This research was supported by NASA's Interdisciplinary Science for Eclipse 2017 program managed by M. Guhathakurta and partly supported by NASA to the Sun-Climate research. We thank Fred Espenak for providing eclipse parameter calculations.
This research has been supported by NASA-ROSES (grant no. NNX17AH67G).
This paper was edited by Qiang Fu and reviewed by three anonymous referees.
Baum, B. A., Menzel, W. P., Frey, R. A., Tobin, D., Holz, R. E., Ackerman, S. A., Heidinger, A. K., and Yang, P.: MODIS Cloud-Top Properties Refinements for Collection 6, J. Appl. Meteorol. Clim., 51, 1145–1163, 2012.
Baum, B. A., Yang, P., Heymsfield, A. J., Platnick, S., King, M. D., Hu, Y.-X., and Bedka, S. T.: Bulk scattering models for the remote sensing of ice clouds. Part 2: Narrowband models, J. Appl. Meteorol., 44, 1896–1911, 2005.
Bernhard, G. and Petkov, B.: Measurements of spectral irradiance during the solar eclipse of 21 August 2017: reassessment of the effect of solar limb darkening and of changes in total ozone, Atmos. Chem. Phys., 19, 4703–4719, https://doi.org/10.5194/acp-19-4703-2019, 2019.
Calamas, D. M., Nutter, C., and Guajardo, D. N.: Effect of 21 August 2017 solar eclipse on surface-level irradiance and ambient temperature, International Journal of Energy and Environmental Engineering, 10, 147–156, https://doi.org/10.1007/s40095-018-0290-8, 2019.
Cescatti, A.: Indirect estimates of canopy gap fraction based on the linear conversion of hemispherical photographs: Methodology and comparison with standard thresholding techniques, Agr. Forest Meteorol., 143, 1–12, 2007.
Emde, C. and Mayer, B.: Simulation of solar radiation during a total eclipse: a challenge for radiative transfer, Atmos. Chem. Phys., 7, 2259–2270, https://doi.org/10.5194/acp-7-2259-2007, 2007.
Espenak, F. and Anderson, J.: Total solar eclipse of 2006 March 29, Tech. rep., Goddard Space Flight Centre, Greenbelt, Maryland, 2004.
Fu, Q. and Liou, K.-N.: On the correlated k-distribution method for radiative transfer in nonhomogenous atmospheres, J. Atmos. Sci., 49, 2139–2156, 1992.
Herman, J. R., Cede, A., Spinei, E., Mount, G., Tzortziou, M., and Abuhassan, M.: NO2 Column Amounts from Ground-based Pandora and MFDOAS Spectrometers using the Direct-Sun DOAS Technique: Intercomparisons and Application to OMI Validation, J. Geophys. Res., 114, D13307, https://doi.org/10.1029/2009JD011848, 2009.
Herman, J., Evans, R., Cede, A., Abuhassan, N., Petropavlovskikh, I., and McConville, G.: Comparison of ozone retrievals from the Pandora spectrometer system and Dobson spectrophotometer in Boulder, Colorado, Atmos. Meas. Tech., 8, 3407–3418, https://doi.org/10.5194/amt-8-3407-2015, 2015.
Herman, J., Wen, G., Marshak, A., Blank, K., Huang, L., Cede, A., Abuhassan, N., and Kowalewski, M.: Reduction in 317–780 nm radiance reflected from the sunlit Earth during the eclipse of 21 August 2017, Atmos. Meas. Tech., 11, 4373–4388, https://doi.org/10.5194/amt-11-4373-2018, 2018.
Hillger, D., Kopp, T., Lee, T., Lindsey, D., Seaman, C., Miller, S., Solbrig, J., Kidder, S., Bachmeier, S., Jasmin, T., and Rink, T.: First-light imagery from Suomi NPP VIIRS, B. Am. Meteorol. Soc., 94, 1019–1029, https://doi.org/10.1175/BAMS-D-12-00097.1, 2013.
Holben, B. N., Eck, T. F., Slutsker, I., Tanre, D., Buis, J. P., Setzer, A., Vermote, E., Reagan, J. A., Kaufman, Y. J., Nakajima, T., Lavenu, F., Jankowiak, I., and Smirnov, A.: AERONET-A Federated Instrument Network and Data Archive for Aerosol Characterization, Remote Sens. Environ., 66, 1–16, 1998.
Jeong, U., Tsay, S.-C., Pantina, P., Butler, J. J., Loftus, A. M., Abuhassan, N., Herman, J. R., Dimov, A., Holben, B. N., and Swap, R. J.: Langley calibration analysis of solar spectroradiometric measurements: Spectral aerosol optical thickness retrievals, J. Geophys. Res.-Atmos., 123, 4221–4238, https://doi.org/10.1002/2017JD028262, 2018.
Ji, Q. and Tsay, S.-C.: On the dome effect of Eppley pyrgeometers and pyranometers, Geophys. Res. Lett., 27, 971–974, https://doi.org/10.1029/1999GL011093, 2000.
Ji, Q., Tsay, S.-C., Lau, K. M., Hansell, R. A., Butler, J. J., and Cooper, J. W.: A novel nonintrusive method to resolve the thermal dome effect of pyranometers: Radiometric calibration and implications, J. Geophys. Res., 116, D24105, https://doi.org/10.1029/2011JD016466, 2011.
Kato, S., Rose, F. G., and Charlock, T. P.: Computation of Domain-Averaged Irradiance Using Satellite-Derived Cloud Properties, J. Atmos. Ocean. Tech., 22, 146–164, 2005.
Koepke, P., Reuder, J., and Schween, J.: Spectral variation of the solar radiation during an eclipse, Meteorol. Z., 10, 179–186, 2001.
Kopp, G. and Lean, J. L.: A new, lower value of total solar irradiance: Evidence and climate significance, Geophys. Res. Lett., 38, L01706, https://doi.org/10.1029/2010GL045777, 2011.
Marshak, A., Herman, J., Szabo, A., Blank, K., Cede, A., Carn, S., Geogdzhaev, I., Huang, D., Huang, L.-K., Knyazikhin, Y., Kowalewski, M., Krotkov, N., Lyapustin, A., McPeters, R., Meyer, K., Torres, O., and Yang, Y.: Earth Observations from DSCOVR/EPIC Instrument, B. Am. Meteorol. Soc., 9, 1829–1850, https://doi.org/10.1175/BAMS-D-17-0223.1, 2018.
NASA EarthData: https://earthdata.nasa.gov, last access: August 2020.
NASA Goddard Space Flight Center: AERONET, available at: https://aeronet.gsfc.nasa.gov, last access: August 2020.
Neckel, H.: Analytical Reference Functions F(λ) for the Sun's Limb Darkening and Its Absolute Continuum Intensities (λλ300 to 1100 nm), Sol. Phys., 229, 13–33, https://doi.org/10.1007/s11207-005-4081-z, 2005.
Ockenfuß, P., Emde, C., Mayer, B., and Bernhard, G.: Accurate 3-D radiative transfer simulation of spectral solar irradiance during the total solar eclipse of 21 August 2017, Atmos. Chem. Phys., 20, 1961–1976, https://doi.org/10.5194/acp-20-1961-2020, 2020.
Platnick, S., Ackerman, S., King, M., Wind, G., Meyer, K., Menzel, P., Frey, R., Holz, R., Baum, B., and Yang, P.: MODIS atmosphere L2 cloud product (06_L2), NASA MODIS Adaptive Processing System, Goddard Space Flight Center, https://doi.org/10.5067/MODIS/MOD06_L2.061, 2017a.
Platnick, S., Meyer, K., Wind, G., Arnold, T., Amras- inghe, N., Marchant, B., Wang, C., Ackerman, S., Heidinger, A., Holtz, B., Li, Y., and Frey, R.: Continu- ity VIIRS/SNPP Level-2 (L2) Cloud Properties Product, https://doi.org/10.5067/VIIRS/CLDPROP_L2_VIIRS_SNPP.011, 2017b.
Ricchiazzi, P., Yang, S., Gautier, C., and Sowle, D.: SBDART: A Research and Teaching Software Tool for Plane-Parallel Radiative Transfer in the Earth's Atmosphere, B. Am. Meteorol. Soc., 79, 2101–2114, https://doi.org/10.1175/1520-0477(1998)079<2101:SARATS>2.0.CO;2, 1998.
Rose, F. G., Charlock, T. P., Fu, Q., Kato, S., Rutan, D. A., and Jin, Z.: CERES Proto-Edition 3 Radiative Transfer: Model Tests and Radiative Closure Over Surface Validation Sites, Proceedings 12th Conf. on Atmos. Radiation, Madison, WI, 2006.
Schaaf, C. and Wang, Z.: MCD43A3 MODIS/Terra+Aqua BRDF/Albedo Daily L3 Global – 500 m V006 [Data set], NASA EOSIS Land Processes DAAC, https://doi.org/10.5067/MODIS/MCD43A3.006, 2015.
Schmit, T. J., Gunshor, M. M., Menzel, W. P., Gurka, J. J., Li, J., and Bachmeier, A. S.: Introducing the next-generation ad- vanced baseline imager on GOES-R, B. Am. Meteorol. Soc., 86, 1079–1096, https://doi.org/10.1175/BAMS-86-8-1079, 2005.
Sharp, W. E., Silverman, S. M., and Lloyd, J. W. F.: Summary of sky brightness measurements during eclipses of the sun, Appl. Opt., 10, 1207–1210, 1971.
Shaw, G. E.: Sky radiance during a total solar eclipse: a theoretical model, Appl. Opt., 17, 272–278, 1978.
Shiobara, M. and Asano, S.: Estimation of cirrus optical thickness from Sun-photometer measurements, J. Appl. Meteorol., 33, 672–681, 1994.
Trenberth, K. E., Fasullo, J. T., and Kiehl, J.: Earth's global energy budget, B. Am. Meteorol. Soc., 90, 311–323, https://doi.org/10.1175/2008BAMS2634.1, 2009.
Turner, D. D., Wulfmeyer, V., Behrendt, A., Bonin, T. A., Choukulkar, A., Newsom, R. K. and Cook, D. R.: Response of the Land-Atmosphere System over North-Central Oklahoma during the 2017 Eclipse, Geophys. Res. Lett., 45, 1668–1675, https://doi.org/10.1002/2017GL076908, 2018.
Zerefos, C. S., Bali, D. S., Meleti, C., Bais, A. F., Tourpali,, K., Kourtidis, K., Vanicek, K., Cappellani, F., Kaminski, U., Colombo, T., Stübi, R., Manea, L., Formenti, P., and Andrease, M. O.: Changes in surface UV solar irradiance and ozone over the Balkans during the eclipse of August 11, 1999, J. Geophys. Res., 105, 26463–26473, 2000.