the Creative Commons Attribution 4.0 License.
the Creative Commons Attribution 4.0 License.
 | 03 Sep 2020
Characterization and source apportionment of aerosol light scattering in a typical polluted city in the Yangtze River Delta, China
Dong Chen
Yu Zhao
Jie Zhang
Xingna Yu
Through online observation and offline chemistry analysis of samples at suburban, urban and industrial sites (NJU, PAES and NUIST, respectively) in Nanjing, a typical polluted city in the Yangtze River Delta, we optimized the aerosol light scattering estimation method, identified its influencing factors and quantified the contributions of emission sources to aerosol scattering. The daily average concentration of PM2.5 during the sampling period (November 2015–March 2017) was 163.1±13.6 µg m−3 for the heavily polluted period, 3.8 and 1.6 times those for the clean (47.9±15.8 µg m−3) and lightly polluted (102.1±16.4 µg m−3) periods, respectively. The largest increase in PM concentration and its major chemical components was found at the size range of 0.56–1.0 µm for the heavily polluted period, and the contributions of nitrate and sulfate were the greatest in the 0.56–1.0 µm fraction (19.4 %–39.7 % and 18.1 %–34.7 %, respectively) for all the three periods. The results indicated that the large growth of nitrate and sulfate was one of the major reasons for the polluted periods. Based on measurements at the three sites, the US Interagency Monitoring of Protected Visual Environments (IMPROVE) algorithm was optimized to evaluate aerosol scattering in eastern China. The light absorption capacity of organic carbon (OC) was estimated to account for over half of the methanol-soluble organic carbon (MSOC) at NJU and PAES, whereas the fraction was lower at NUIST. Based on the Mie theory, we found that the high relative humidity (RH) could largely enhance the light scattering effect of accumulation particles, but it had few effects on the mixing state of particles. The scattering coefficients of particles within the 0.56–1.0 µm range contributed the most to the total scattering (28 %–69 %). The mass scattering efficiency (MSE) of sulfate and nitrate increased with the elevated pollution level, whereas a low MSE of organic matter (OM) was found for the heavily polluted period, probably because a proportion of OM had only a light absorption property. A coupled model of positive matrix factorization (PMF) and the Mie theory was developed and applied for the source apportionment of aerosol light scattering. Coal burning, industry and vehicles were identified as the major sources of the reduced visibility in Nanjing, with an estimated collective contribution at 64 %–70 %. The comparison between the clean and polluted period suggested that the increased primary particle emissions from vehicles and industry were the major causes of the visibility degradation in urban and industrial regions, respectively. In addition, secondary aerosols were a great contributor to the reduced visibility.
- Article
(4538 KB) - Full-text XML
-
Supplement
(1759 KB) - BibTeX
- EndNote


Atmospheric aerosols play a great role in visibility degradation, radiative balance variation and climate (Liu et al., 2017; Malm and Hand, 2007; Zhang et al., 2017), resulting largely from their light extinction (Seinfeld and Pandis, 2006). Understanding the contributions of individual chemical species to aerosol light extinction is important for policy making to alleviate the reduced visibility in cities with aerosol pollution. Studies have estimated that the aerosol single-scattering albedo (the fraction of the light scattering coefficient to the total extinction) ranges from 0.81 to 0.93 in urban China (Andreae et al., 2008; Cao et al., 2012; Xu et al., 2002, 2012), implying that the deteriorated visibility primarily results from the scattering effect of aerosols.
Aerosol light scattering is greatly affected by its chemical composition and hygroscopic growth (Liu et al., 2008; J. C. Tao et al., 2014). Based on estimation of the mass scattering efficiency (MSE) of different chemical components, previous studies found that nitrate, sulfate, sea salt and organic matter (OM) are the dominant contributors to aerosol scattering. Developed based on the long-term observations in national parks, the US IMPROVE (Interagency Monitoring of Protected Visual Environments) algorithm has been applied to calculate the light extinction of chemical species in aerosols (Watson, 2002). Two versions of the IMPROVE algorithm (IMPROVE1999 and IMPROVE2007 hereinafter) were deduced successively (Lowenthal and Naresh, 2003; Pitchford et al., 2007), and both assumed that OM has no light absorption capacity and only a light scattering capacity. As part of OM, however, brown carbon (BrC) has been highlighted in recent studies for its light absorption in the near-ultraviolet region (Alexander et al., 2008; Bond and Bergstrom, 2006; Ramanathan et al., 2007; Zhang et al., 2017), and consideration of the light absorption effect of OM in the optimization process of the IMPROVE formula could improve the understanding of aerosol optical capacity by chemical species (Yan et al., 2014). In addition, hygroscopic growth is a key factor influencing aerosol light scattering (Schwartz, 1996). Previous studies have shown that the light scattering of sulfate and nitrate in PM2.5 could be largely enhanced at high relative-humidity (RH) conditions (Titos et al., 2016). Aerosol hygroscopicity is expected to depend largely on the particle size and the abundance of water-soluble chemical components (Swietlicki et al., 2008; Tang, 1996). Through the theoretical calculation, Liu et al. (2014) found that smaller particles were in the highly hygroscopic mode, whereas larger particles were in the nearly hydrophobic mode.
Recently, many studies have been conducted on the relationships between visibility and aerosol light scattering in China (Cheng et al., 2015; J. Tao et al., 2014a, b; Xue et al., 2010; Zhang et al., 2015). They found the abundance of hygroscopic ammonium nitrate (NH4NO3) and ammonium sulfate ((NH4)2SO4) in PM2.5, and their characteristics were an important reason for visibility reduction. However, few studies have analyzed the size distribution of aerosol light scattering or quantified the contributions of different emission source categories to the aerosol light scattering, particularly at the varied air pollution levels. The roles of particles of different sizes and origins on visibility degradation remained unclear. To fill this knowledge gap, this study conducted campaigns at three multifunctional sites in Nanjing, a megacity located in eastern China. Nanjing suffered relatively heavy aerosol pollution in the Yangtze River Delta (YRD) attributed to the massive emissions of anthropogenic air pollutants (Zhao et al., 2015). The mixed sources of primary aerosols (e.g., coal burning) and secondary aerosol precursors (e.g., vehicles and the petrochemical industry) make Nanjing a typical city to study the multiple influential factors of aerosol light scattering (Chen et al., 2019). Combining online and offline techniques at different functional regions, the IMPROVE algorithm was optimized by taking the light absorption OM into account. The influences of aerosol size distributions and pollution levels on the aerosol scattering effect were quantitatively evaluated based on comprehensive analysis of the chemical compositions of particles by size and location. To explore the reasons for the visibility reduction in different functional regions, a new coupled PMF–Mie (positive matrix factorization) model was developed, and the source apportionments of aerosol light scattering were determined for the clean and polluted periods.
2.1 Site description
The campaigns were conducted at three sites in Nanjing, i.e., NJU, PAES and NUIST, representative for the suburban, urban and industrial region, respectively (see the site locations in Fig. S1 in the Supplement). NJU (32.07∘ N, 118.57∘ E) was on the roof (25 m above the ground) of the School of the Environment building on the Nanjing University campus in eastern suburban Nanjing (Chen et al., 2017, 2019). PAES (32.03∘ N, 118.44∘ E) was on the roof (30 m above the ground) of the Jiangsu Provincial Academy of Environmental Science building in western urban Nanjing. The site was surrounded by heavy traffic and commercial and residential buildings (Li et al., 2015). NUIST (32.21∘ N, 118.72∘ E) was on the roof of the School of the Environment building in the Nanjing University of Information Science and Technology campus. There was an industrial-pollution site influenced by the nearby power, iron and steel, and petrochemical industry plants (Wang et al., 2016a).
2.2 Aerosol sampling and chemical analysis
Precombusted (at 500 ∘C for ∼5 h) quartz filters (90 mm in diameter; Whatman International Ltd., UK) were applied for PM2.5 sampling. The filter samples were weighed before and after sampling under constant temperature (23±2 ∘C) and RH (40±3 %) for 24 h conditioning. All the PM2.5 samples were collected using a TH-150C sampler (Wuhan Tianhong Ltd., China) at a flow rate of 100 L min−1. From November 2015 to March 2017, 282 daily PM2.5 samples at the three sites (174 for NJU, 45 for PAES and 63 for NUIST) were collected.
Three sets of 10-stage Micro-Orifice Uniform Deposit Impactors (MOUDI, model 110, MSP Corp., USA) were adopted to collect size-segregated particles. The 50 % cutoff points of the MOUDI 110 were 18, 10, 5.6, 3.2, 1.8, 1.0, 0.56, 0.32, 0.18 and 0.056 µm. Loaded with Teflon and quartz filters (47 mm in diameter; Whatman International Ltd., UK), MOUDI was operated at a flow rate of 30 L min−1. To obtain sufficient particles at each stage for the chemical analysis, every sampling lasted continuously for 24 h from 09:00. All the MOUDI samplers were cleaned using an ultrasonic bath for 30 min before each sampling. The flow rate was calibrated before each sampling and was monitored with the flow meter during the whole sampling process. Those quality control measures assured that the MOUDI samplers were not blocked during the sampling period and the particles collected in the filter were evenly distributed, even for the heavily polluted period with the PM1.8 concentration measured at over 120 µg m−3 (see the samples in Fig. S2 in the Supplement). Attributed to weather condition and aerosol sampler maintenance, the sampling periods for the three sites were different. A total of 75 sets of particle samples were obtained from December 2015 to February 2017 at NJU; 25 sets were obtained from August 2016 to January 2017 at PAES; and 31 sets were obtained from July 2016 to February 2017 at NUIST. Simultaneous samplings were conducted at the three sites from 1 week to 10 days in each season from summer 2016 to winter 2016–2017. For the remaining time, two MOUDI samplers were applied to collect Teflon and quartz filter samples simultaneously at one of the three sites. Besides, blank filters were applied to correct the possible bias in the analysis of aerosol chemical species. In total 19 sets of size-segregated blank filters (10, 4 and 5 for NJU, PAES and NUIST, respectively) and 35 daily blank PM2.5 filters (25, 6 and 9 for NJU, PAES and NUIST, respectively) were obtained at the three sites. All the blank filters were put in the samplers without inlet air flow for 24 h when the field campaigns finished. We took NJU as an example to check the consistency between the two types of samplers. As shown in Fig. S3 in the Supplement, excellent agreement was found between the mass concentrations of PM1.8 collected with quartz fiber in the MOUDI impactor and PM2.5 collected with the TH-150 sampler.
Three anions (, and Cl−) and five cations (Na+, , K+, Mg2+ and Ca2+) in particles were measured in the extracted solution of the filter samples with ion chromatography (DX-120, Dionex Ltd., USA). A CS12A column (Dionex Ltd.) with 20 mM MSA (methanesulfonic acid) eluent and an AS11-HC column (Dionex Corp.) with 8 mM KOH eluent were used to measured cations and anions, respectively (Chen et al., 2019). Elemental carbon (EC) and organic carbon (OC) were measured with an OC–EC aerosol analyzer (Sunset Inc., USA) following the thermal–optical transmittance (TOT) protocol. In addition to thermal EC and OC, the instrument also provides the optical EC and OC by measuring the light attenuation (ATN). As the ATN is determined not only by EC but also by BrC, the optical method may overestimate EC and underestimate OC (Cui et al., 2016; Massabò et al., 2016). The optical EC and OC were thus not adopted in this work. More details on the analyzer operation were described in our previous studies (Chen et al., 2017, 2019). We used the methanol-soluble organic carbon (MSOC) as BrC surrogate. It was believed to be more suitable than water-soluble organic carbon (WSOC), as a large fraction of BrC absorption comes from OC, insoluble in water (Cheng et al., 2016, 2017; Huang et al., 2018; Lei et al., 2018). The analytical procedure was described in detail in Chen et al. (2019). As shown in Fig. S4 in the Supplement, MSOC was measured to account for 88 % of the total OC mass for all the samples in this work, similar to the fraction of 85 % by Cheng et al. (2016). Elements of size-resolved particles collected in the Teflon filters (As, Al, Ba, Cd, Co, Cr, Cu, Fe, Mn, Mo, Ni, Ti, V and Zn) were measured with an inductively coupled plasma-mass spectrometer (ICP-MS, PerkinElmer ELAN 9000, USA) in order to provide further information on the aerosol sources. More detailed information on the instrument was provided by Khan et al. (2016), including the precision, calibration, detection limit and analytical procedures.
2.3 Measurements of real-time aerosol scattering coefficients
The aerosol scattering coefficients were measured using two different types of integrating nephelometers. Two Aurora model 1000G nephelometers (Ecotech Pty Ltd, Australia) were operated at NJU and PAES at the wavelength of 520 nm and one model 3563 nephelometer (TSI Inc., USA) was operated at NUIST at the wavelength of 550 nm. To obtain the dry aerosol scattering coefficient, the three nephelometers controlled the RH of the inflow air under 50 % by the heated inlet to mitigate the impact of water vapor on the scattering coefficient. The nephelometers at NJU and PAES were operated at a flow rate of 5 L min−1, and that at NUIST was operated at 20 L min−1. Routine maintenance including zero calibration and span check was conducted following the instrument manual.
To explore the RH impact on aerosol light scattering, an online monitoring instrument, cavity-attenuated phase shift albedo monitor (CAPS; Shoreline Science Research Inc., Japan), was used to measure the ambient scattering coefficient at NJU in real ambient conditions. The instrument operates at the wavelength of 530 nm (Onasch et al., 2015; Petzold et al., 2013), and more details on its operation during the campaigns were provided by Chen et al. (2019).
2.4 Data analysis
2.4.1 Estimation of the scattering coefficient of aerosol chemical species with different methods
The details of IMPROVE1999 and IMPROVE2007 are summarized in the Supplement Sect. S1. Neglecting the light-absorbing effect of BrC, the two algorithms could overestimate the scattering coefficient of OM (Yan et al., 2014). The major difference between the two versions is that the IMPROVE2007 algorithm considers the variety of mass scattering efficiencies due to particle size for (NH4)2SO4, NH4NO3 and OM. With consideration of the BrC presence, we conducted the multiple linear regression between the measured light scattering components and aerosol scattering coefficient with SPSS 16.0 (Cheng et al., 2011; Tian et al., 2016) to obtain the mass scattering efficiency (MSE). The contributions of sea salt and soil dust were excluded by subtracting their light scattering coefficients from the measured PM2.5 one. The PM2.5 scattering coefficient can then be estimated statistically based on the concentrations of individual chemical species as in Eq. (1):
where bsca is the measured PM2.5 scattering coefficient excluding the contribution of sea salt and soil dust; a, c and e are the MSEs of (NH4)2SO4, NH4NO3 and OM (except for light-absorbing BrC) in the small-size mode, respectively; b, d and f are the MSEs of (NH4)2SO4, NH4NO3 and OM (except for light-absorbing BrC) in the large-size mode, respectively (definitions of small- and large-size modes for various aerosol components can be found in Pitchford et al., 2007); and m and n indicate the mass fractions of light-absorbing BrC to total MSOC in small and large modes, respectively (definitions of small- and large-size modes of MSOC are the same as other species); f(RH) (including fL(RH) and fS(RH)) of sulfate and nitrate indicate the scattering hygroscopic growth factor under a given relative humidity (RH), as obtained from Pitchford et al. (2007).
In addition to PM2.5, the scattering coefficient for particles at a given size (bsca(RH)) is calculated with the Mie theory (Bohren and Huffman, 1998; Cheng et al., 2015):
where m(RH) is the aerosol refractive index; g(RH) is the hygroscopic growth factor; Qsca is the scattering efficiency for a single spherical particle with diameter Dp and can be calculated with the Mie theory by inputting Dp, m(RH) and the incident wavelength (λ); and N(Dp) is the number concentration of particle with diameter Dp. In general, three typical models are proposed to represent the particle mixing state including internal, external and core–shell mixture (Jacobson, 2001; Seinfeld and Pandis, 2006). The methods of calculating the parameters including m(RH) and N(Dp) are different for the three mixed states, and the details can be found in Ding et al. (2015).
2.4.2 Source apportionment of aerosol scattering coefficients with a coupled model of PMF and the Mie theory
Positive matrix factorization (PMF) is an effective technology for source apportionment of atmospheric aerosols (Kim and Hopke, 2004). PMF does not require the source profile (i.e., the aerosol chemistry speciation by source category) as a model input and thus excludes the uncertainty of source profiles which were commonly developed based on studies or measurements across the country in China. In this study, PMF 5.0 software was applied for the source apportionment of accumulation mode particles. In total, 245, 145 and 163 aerosol samples were analyzed at NJU, PAES and NUIST, respectively. It is currently difficult to resolve the sources of secondary organic aerosol (SOA) with PMF. In this study, a simplified method was applied to differentiate the sources of primary and secondary aerosols. Organic carbon is split into primary and secondary organic carbon (POC and SOC), and the SOC concentration was calculated with the EC-tracer method (Chen et al., 2017). The source contributions of primary particles were obtained using the PMF model, and those of secondary inorganic aerosol (SIA) and SOA were further determined based on estimates of the nitrogen oxide (NOx), sulfur dioxide (SO2) and volatile organic compound (VOC) emissions in a local inventory (Huang, 2018; Lang et al., 2017; Wang et al., 2015). The chemical components applied in the PMF model included inorganic ions, carbonaceous components and metallic elements. We followed the method described in the PMF manual and Tian et al. (2016) to calculate the chemical component uncertainties in the measurement dataset. Criteria including the optimum number of factors and the minimization of an objective function Q were determined based on the principles described in previous studies (Moon et al., 2008; Tian et al., 2016; Watson et al., 2015) and applied in the model to obtain the best PMF solution.
A coupled model combining PMF and the Mie theory was developed to evaluate the sources of aerosol light scattering. The procedure of the method was as follows: (1) the EPA (Environmental Protection Agency) PMF model was applied to quantify the contributions of different sources to the mass concentrations of chemical species in size-segregated particles; (2) the contribution (%) of the ith chemical component to the aerosol scattering coefficient at size Dp was estimated based on the Mie theory; (3) the percentage contribution (%) of the ith component in the jth source category to the total scattering at size Dp was calculated as the product of the percentage contribution (%) of the ith chemical species to the total scattering as was that of the jth source category to the mass concentration of the ith species in the particles at size Dp, as indicated in Eq. (3); and (4) the percentage contribution (%) of the jth source to the total scattering at size Dp was estimated by summing , as shown in Eq. (4).
where i and j stand for the number of aerosol chemical components and potential sources, respectively; (%) is the contribution (%) of the ith scattering component in the jth source to the total particle scattering at size Dp; ηj (%) is the contribution (%) of the jth source to the total scattering at size Dp; is the relative contribution (%) of the jth source to the ith chemical component in particles with size Dp from PMF modeling; and is the contribution of the ith chemical component to the total scattering from Mie modeling.
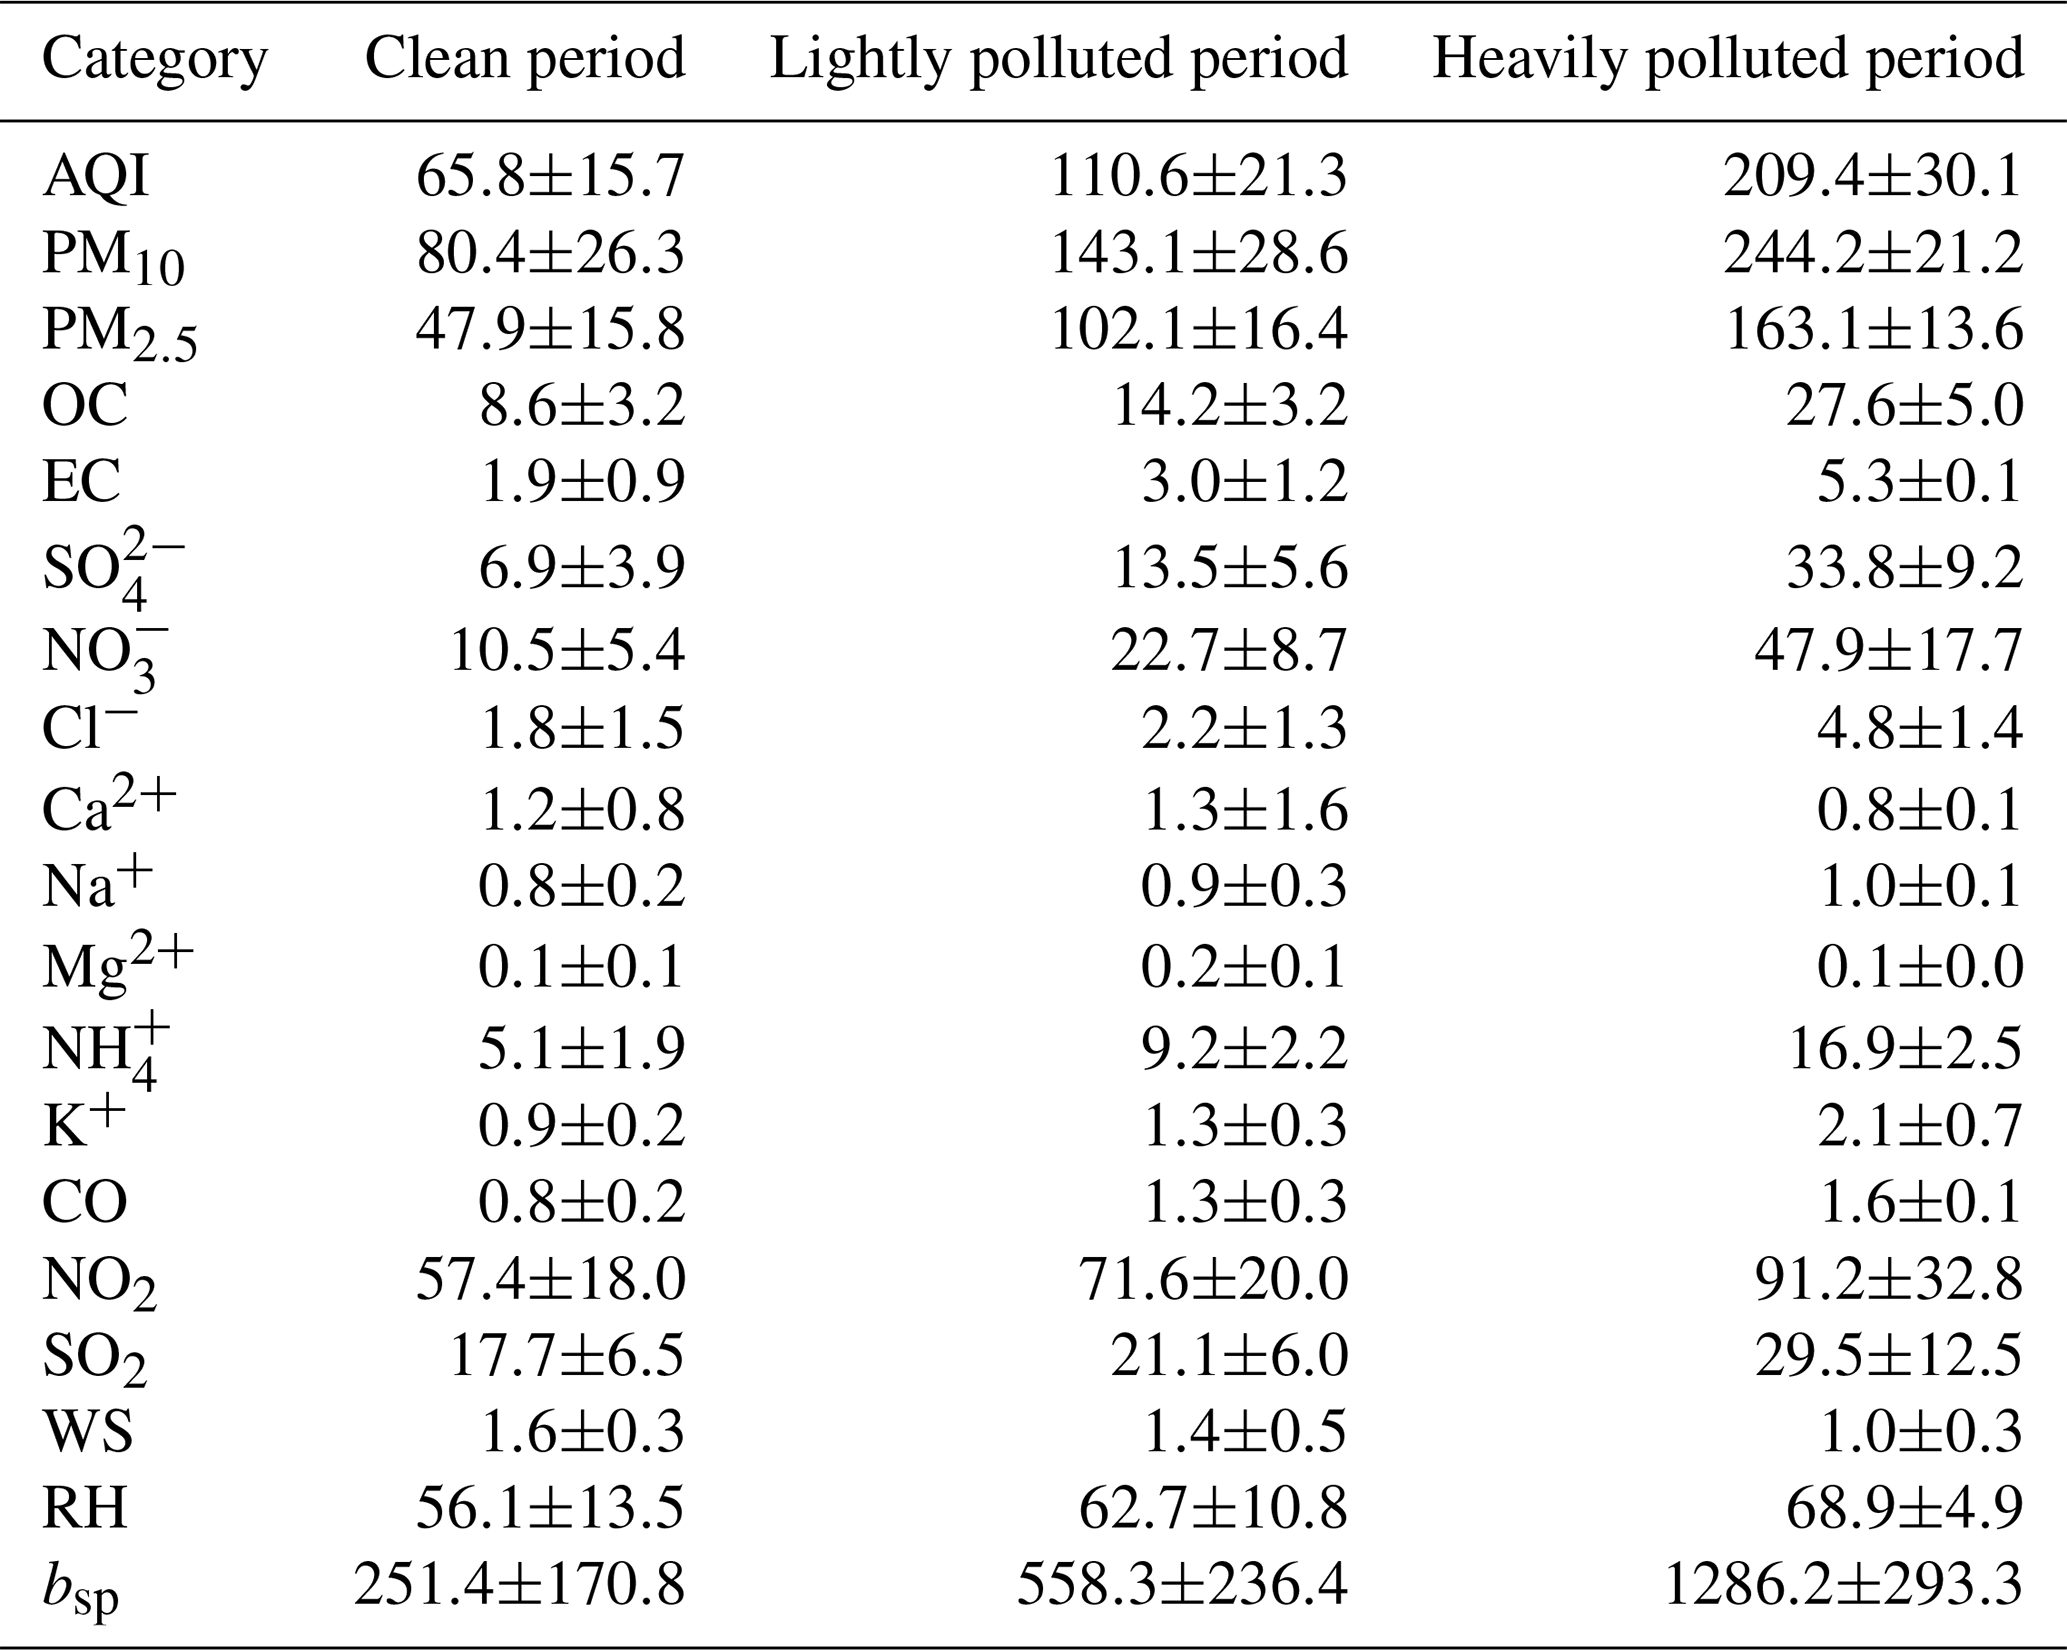
Table 1The concentrations of particulate matter and its chemical components (µg m−3), light scattering coefficients (M m−1), and selected meteorological parameters including wind speed (WS; m s−1) and relative humidity (RH; %) at all the three sites for different pollution levels from November 2015 to January 2017.
3.1 Mass concentrations and size distributions of PM compositions
Based on the national definition of the ambient air quality index (AQI) (MEP, 2012), we divided the whole sampling period into three categories, i.e., the clean period with an AQI value less than 100, the lightly polluted period with an AQI value between 100 and 200, and the heavily polluted period with an AQI value above 200. Note that the AQI is a unitless index calculated based on the daily concentrations of regulated air pollutants including NO2, SO2, CO, O3, PM2.5 and PM10 (MEP, 2012). As summarized in Table 1, the average daily PM2.5 mass concentrations at the three conditions were calculated at 47.9±15.8, 102.1±16.4 and 163.1±13.6 µg m−3, respectively. The mass concentration of secondary inorganic ions (, and ) for the heavily polluted period was 4.4 and 2.2 times those for the clean and lightly polluted periods, respectively. The corresponding values for the carbonaceous aerosols (the sum of OC and EC) were 3.1 and 1.9 times, respectively, and the OC–EC ratios increased from 4.5 for the clean period to 5.2 for the heavy period. In addition to the particulate components, gaseous pollutants such as NO2 and SO2 were also significantly elevated from the clean to the heavy periods. These results imply that secondary aerosol formation was an important source of enhanced PM2.5 for the heavily polluted period.
Figure S5 in the Supplement compares the size distributions of mass concentrations for particles and selected chemical components under three pollution levels. Bimodal size distributions were found for PM and OC mass concentrations, with the two peaks at the ranges of 0.56–1.0 µm and 3.2–5.6 µm, respectively. This bimodal pattern could partly result from the coexistence of primary and secondary sources of OC. POC with larger sizes may contribute largely to the peak in the coarser particles. In contrast, due to chemistry reactions of biogenic and anthropogenic VOCs, SOC was expected to be abundant in the accumulation mode (0.18–1.8 µm) (Cao et al., 2007). The size distributions of and followed a unimodal distribution with the mass concentrations peak at the range of 0.56–1.0 µm, as most of the inorganic aerosols were generated through secondary formation. The mass concentrations of PM, , and OC for all sizes were enhanced from the clean to the polluted periods, and the biggest differences were found in the size bin of 0.56–1.0 µm. As shown in Fig. S5a, the concentrations of PM0.56−1.0 for the heavily and lightly polluted periods were 7.0 and 2.7 times greater than that for the clean period, respectively. Moreover, PM0.56−1.0 contributed 31 %, 23 % and 15 % to the total mass concentrations of particles for the heavily and lightly polluted and clean periods, respectively, implying that the enhanced concentration of PM0.56−1.0 was an important reason for the aggravated pollution. As shown in Fig. S5b–d, the sum of , and OC for the heavily polluted period was 2.9 and 10.7 times greater than those for the lightly polluted and clean periods, respectively. From clean to heavily polluted periods, the collective mass fraction of the three components to PM0.56−1.0 increased from 42 % to 64 %. The results indicated that the increased , and OC at the size bin of 0.56–1.0 µm could be an indicator for the serious air pollution events. As indicated in Table 1, moreover, SNA (sulfate, nitrate and ammonium) was elevated more than OC in the heavily polluted period compared to the clean days. During the heavily polluted episodes in winter, enhancement of and could be more significant than OM because the high relative humidity and precursor emissions promoted the generation of SNA (Tian et al., 2014). During clean periods (commonly in summer), NH4NO3 would dissociate to NH3 and HNO3 at high temperatures, while the SOC concentration might increase due to the high levels of O3 and solar radiation. A similar result was found in Beijing, where the mass fraction of SNA was observed to increase from 19 % on non-haze days to 31 % on haze days, while that of OM decreased from 38 % to 31 % (Tian et al., 2016).
To explore the mass fractions of major chemical species in the particles, the PM mass was reconstructed as (NH4)2SO4 (), NH4NO3 (), OM (1.55×OC), fine soil (FS) and EC (Cheng et al., 2015; Pitchford et al., 2007). As shown in Fig. S6 in the Supplement, strong correlations were found between the reconstructed PM mass concentrations and the measurements for PM1.8 (R2=0.91) and PM10 (R2=0.89) at the three sites. The slope of PM1.8 (0.85) was greater than that of PM10 (0.72), indicating a smaller unidentified fraction in PM1.8. The larger unidentified mass in the reconstructed PM10 was probably due to underestimation in the crustal components (Hueglin et al., 2005).
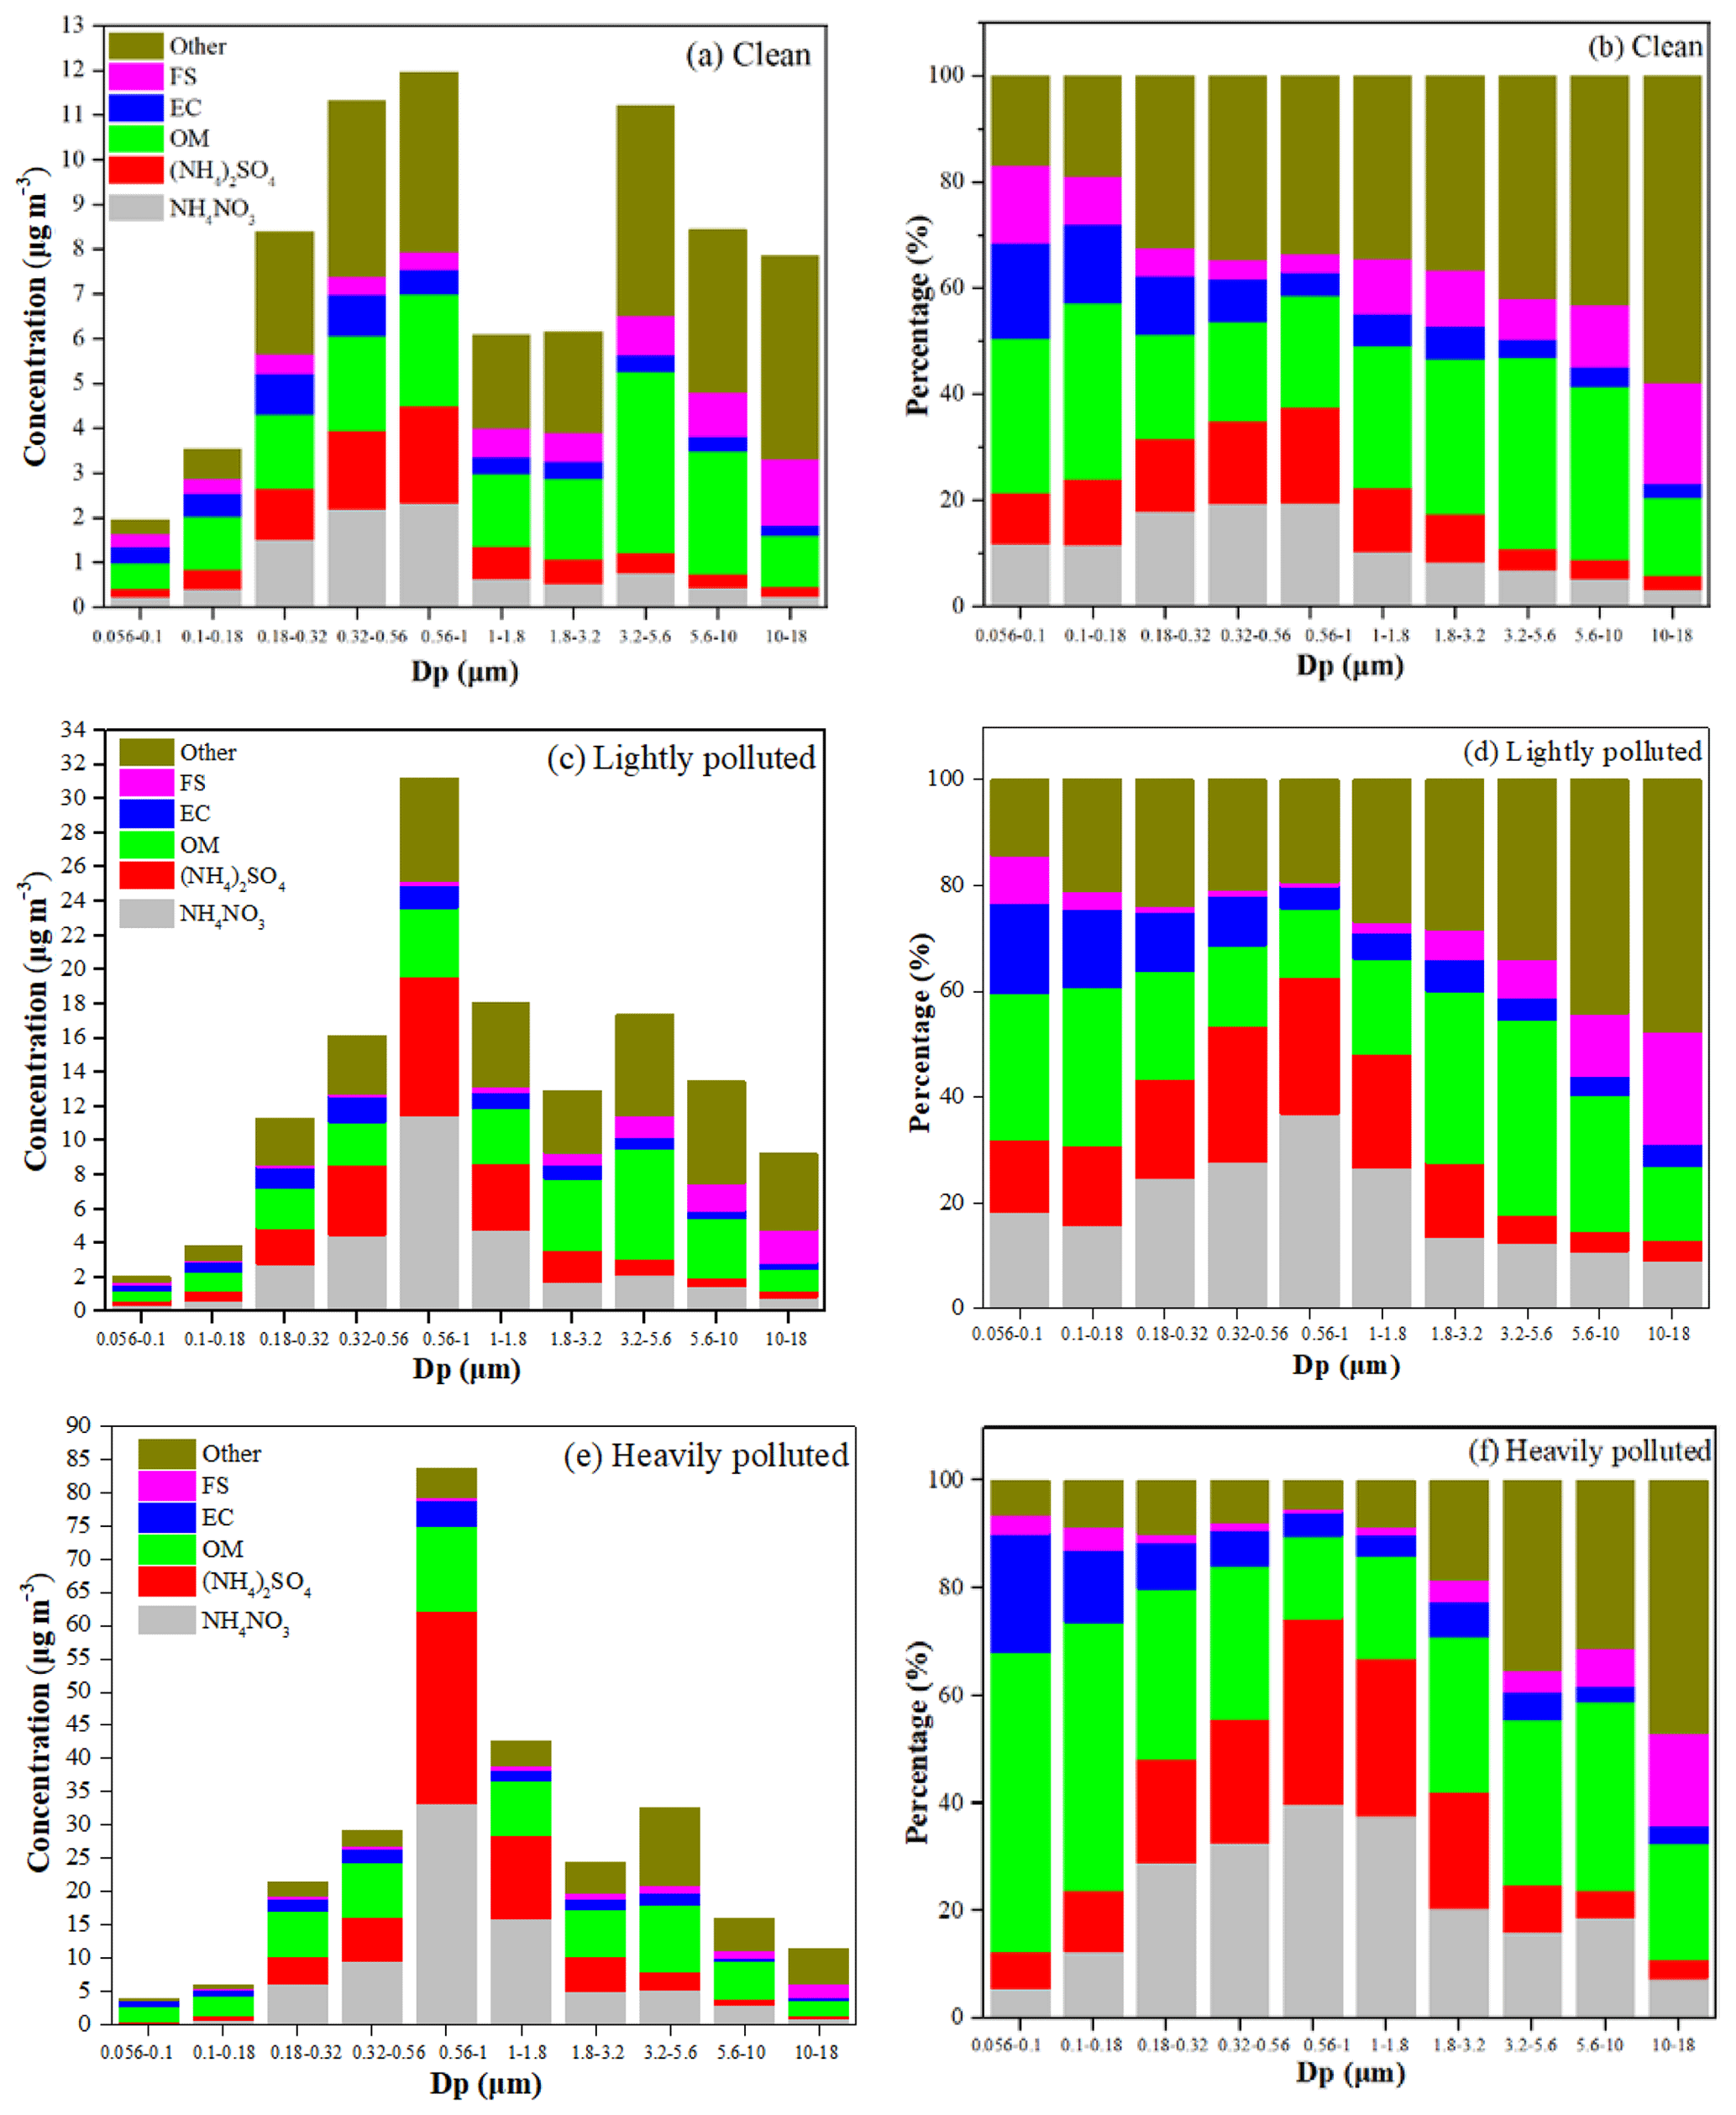
Figure 1The mass concentrations and fractions of the main chemical components of particles with different sizes in Nanjing on clean, lightly polluted and heavily polluted days during the sampling period. Dp refers to the particle diameter.
Figure 1 presents the mass concentrations and fractions of the reconstructed aerosol chemical species by particle size under the three pollution levels. NH4NO3, (NH4)2SO4 and OM were the dominant components in particles. From the clean to heavily polluted periods, their mass fractions to PM1.8 increased from 16.9 % to 35.3 %, from 14.9 % to 28.6 % and from 16.7 % to 22.2 %, respectively (Fig. 1b, d and f). The mass fraction of OM in PM1.8 was 5.4 % and 7.4 % larger than NH4NO3 and (NH4)2SO4 for the clean period, while they were 13.3 % and 6.6 % smaller than those for the heavily polluted period, respectively. The results further confirmed that substantial growth in the mass of NH4NO3 and (NH4)2SO4 was an important reason for the aerosol pollution. The formation of sulfate, nitrate and ammonium (SNA) is mainly affected by the emissions of precursors and the atmospheric oxidation capacity. Due to the great use of fossil fuel consumption, the emissions of precursors SO2 and NOx per unit area in eastern China were estimated to be 2.3 and 3.4 times larger than the national average, respectively (Cheng et al., 2012; Shi et al., 2014). Under high RH, moreover, the SNA formation could significantly be elevated through gas-to-particle heterogeneous reactions for the heavily polluted period (Seinfeld and Pandis, 2006). The sulfate mass concentration, for example, increased from 6.4 µg m−3 for the clean period to 53.3 µg m−3 for the heavily polluted period. Among all the size bins, NH4NO3 and (NH4)2SO4 were estimated to contribute the most to the mass concentrations for 0.56–1.0 µm particles, with their mass fraction ranging from 19.4 % to 39.7 % and from 18.1 % to 34.7 %, respectively, across different pollution levels. In comparison, the largest contributions of OM appeared in the 0.056–0.18 µm fraction and were 31.2 %, 29.0 % and 52.3 % for the clean, lightly polluted and heavily polluted periods, respectively. As the largest PM fraction was found in the 0.56–1.0 µm size bin for the heavily polluted period, the elevated concentrations of NH4NO3 and (NH4)2SO4 in PM0.56−1.0 were the major causes of the increased aerosol pollution.
Figure S7 in the Supplement compares the size distributions of PM mass concentrations and selected chemical species at the three sites. As mentioned above, a bimodal distribution with two peaks at 0.56–1.0 µm and 3.2–5.6 µm was observed for PM and OC at all the three sites, which has attributed to the coexistence of primary and secondary sources. Different from PAES and NUIST, had an obvious small coarse-mode peak at NJU. Previous studies suggested that the chemistry of coarse-mode can vary in different locations, and the components include NH4NO3, NaNO3 and Ca(NO3)2 (Pakkanen et al., 1996). As NJU was close to the G25 highway, the reaction of HNO3 with crustal particles could be an important process for coarse-mode formation. The highest mean concentrations of and at the 0.56–1.0 µm size among the three sites were observed at NJU, followed by NUIST and PAES. As and were the major components of the aerosol light scattering, the variety of their mass concentrations at 0.56–1.0 µm could be a crucial reason for the visibility difference among the three sites. A greater difference was found for the size distribution of OC among the three sites, and the highest concentration at the 0.56–1.8 µm size was observed at NUIST. Our previous work found that NUIST was greatly influenced by VOC emissions of surrounding industrial plants (Chen et al., 2019). Given its capability of light scattering and absorption, the abundant OC in the area could play an important role in visibility.
3.2 Evaluation and optimization of the IMPROVE algorithm
Figure S8 in the Supplement presents the linear regressions between the measured daily aerosol scattering coefficients with nephelometers (bsp−m) and those calculated with IMPROVE algorithms (bsp−1999 and bsp−2007) based on the measured concentrations of particle components at the three sites. At each site, strong correlations were found between the observation and IMPROVE estimation (R2≥0.94), indicating consistency between the different techniques. As shown in Fig. S8a, the calculated aerosol scattering coefficients bsp−1999 were 30 %, 16 % and 19 % smaller than the measured values at NJU, PAES and NUIST, respectively. Similar results were found for other megacities in eastern China. Based on the online analytical methods, for example, Cheng et al. (2015) estimated that the scattering coefficients predicted by the IMPROVE1999 algorithm were 34 % smaller than the measurement for a heavily polluted period in Shanghai. A greater underestimation of the scattering coefficient existed at NJU compared to the other two sites, partly due to the relatively abundance of sulfate and nitrate in particles at NJU. The sum of and accounted for 35.3±13.2 % of the total mass concentrations of PM2.5 at NJU, larger than the fraction at PAES (27.6±12.9 %) and NUIST (24.1±11.6 %) (note the and concentrations at the 0.56–1.0 µm size were the largest at NJU as well, as shown in Fig. S7). J. Tao et al. (2014a) and Cheng et al. (2015) suggested that the relatively small MSE of sulfate and nitrate aerosols in the IMPROVE1999 algorithm might result in underestimation of the scattering coefficient in China, as sulfate and nitrate were the main light scattering components in PM2.5.
As shown in Fig. S8b, bsp−2007 was only 4 % smaller than the measurement at NJU and 4 % and 18 % larger at PAES and NUIST, respectively. Overall, the performance of the IMPROVE2007 algorithm was better than that of the IMPROVE1999 algorithm, although deviation still existed due to the uncertainty in MSEs for chemical species and the presence of light-absorbing organic matter such as BrC. A relatively large deviation between bsp−m and bsp−2007 was found at NUIST compared to NJU and PAES. Chen et al. (2019) and Shao et al. (2016) found a higher annual average concentration of non-methane hydrocarbon at NUIST (34.4 ppbv) than NJU (22.0 ppbv) or PAES (27.1 ppbv). The more VOCs in the atmosphere were expected to increase the SOC formation and to result in a big deviation of bsp−2007, as the OM with a light absorption capability was not considered in IMPROVE2007.
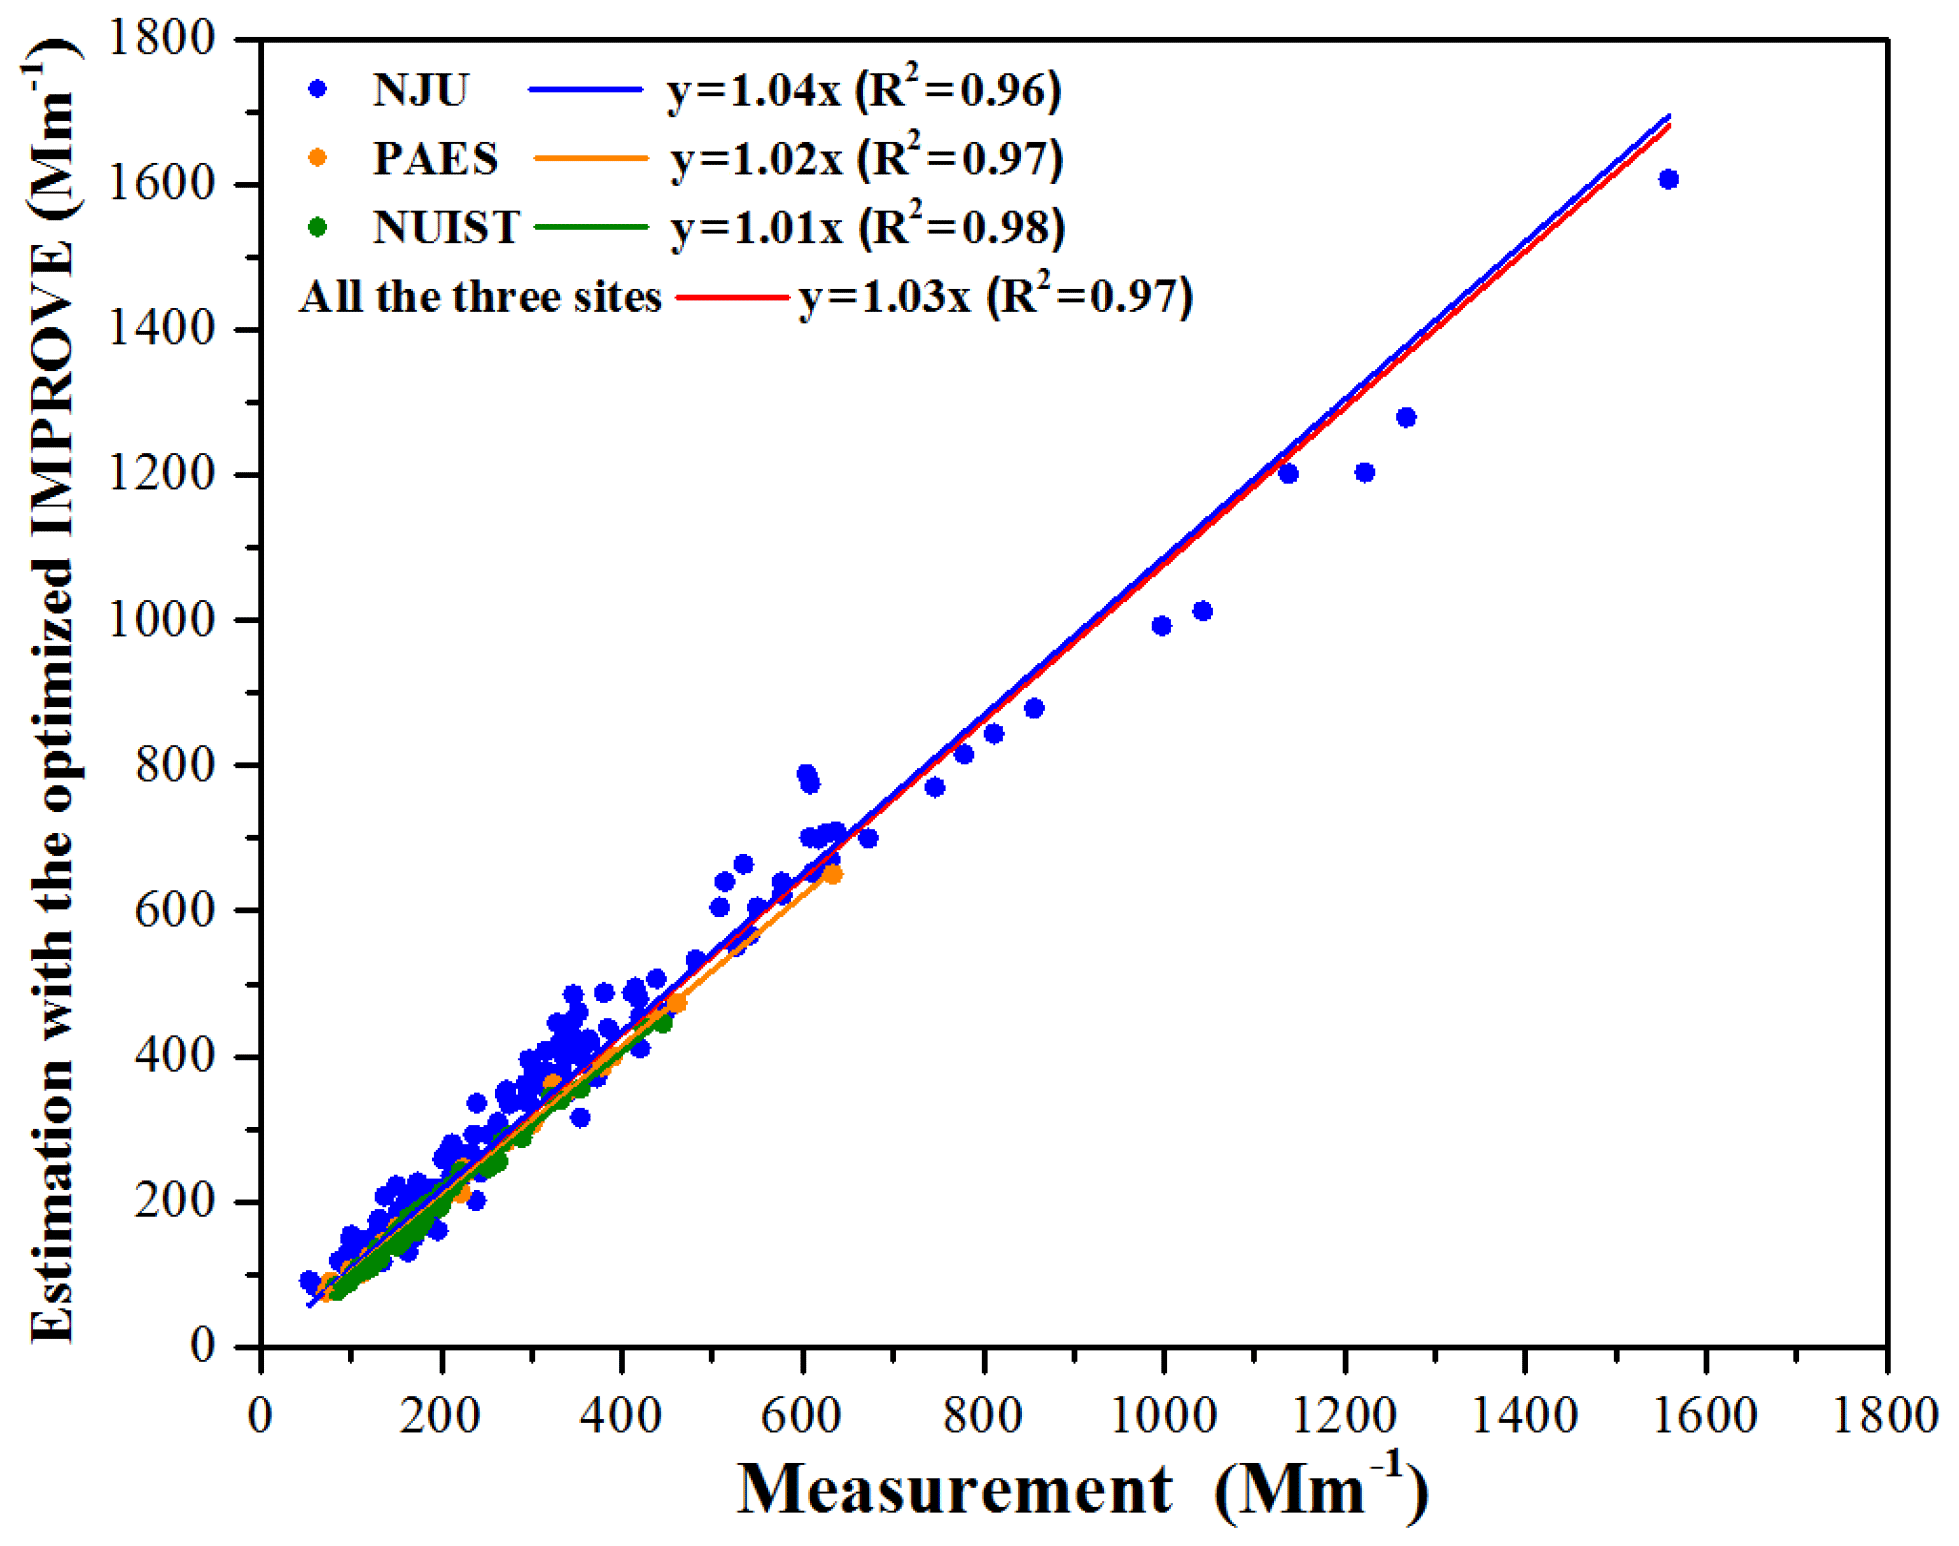
Figure 2Linear regressions between the measured light scattering coefficients and those estimated with the optimized IMPROVE algorithm at NJU, PAES, NUIST and all three sites.
Using the optimized IMPROVE algorithm as described in Sect. 2.4.1, the aerosol scattering coefficients were recalculated and compared against the observation at the three sites, as illustrated in Fig. 2. Good correlations were found between the observed and calculated scattering coefficients at all the sites (R2≥0.96), and the regression slopes were estimated to be much closer to 1 than those between observations and predictions with the IMPROVE1999 or IMPROVE2007 algorithms (Fig. S8). In addition, the MSEs calculated based on the Mie theory were applied to evaluate the results of the IMPROVE algorithms. As presented in Fig. S9 in the Supplement, the MSEs of (NH4)2SO4 and NH4NO3 calculated with the optimized IMPROVE algorithm were closer to the MSE simulated by the Mie theory than those with the IMPROVE2007 algorithm. The results indicated the optimized algorithm had a better performance and could reduce the bias from the US IMPROVE algorithm.
Table 2The mass scattering efficiencies (MSEs; m2 g−1) of chemical species in the optimized and the existing algorithms from the Interagency Monitoring of Protected Visual Environments (IMPROVE). The sample numbers and the mass fractions of light absorption BrC to MSOC for small- and large-size modes (i.e., m and n in Eq. 1) are provided for the optimized algorithm.
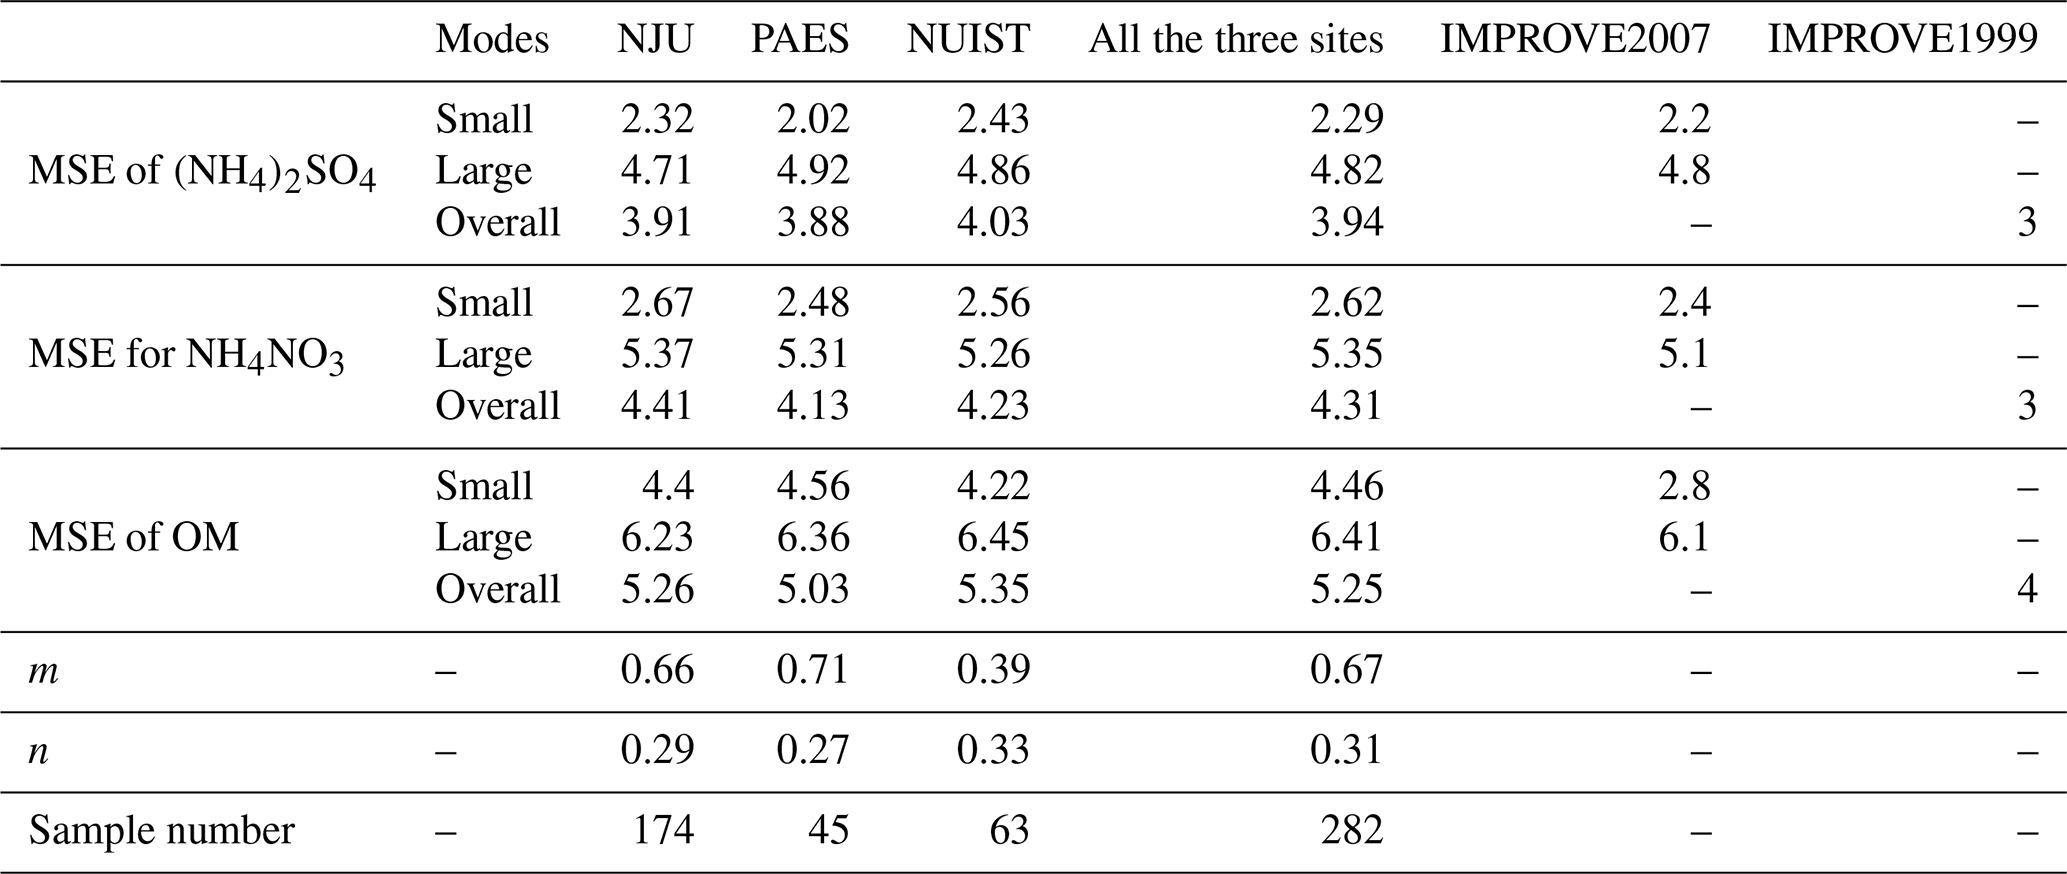
As summarized in Table 2, the MSEs estimated with the optimized IMPROVE algorithm were 2.29, 4.82, 2.62, 5.35, 4.46 and 6.41 m2 g−1 for small sulfate, large sulfate, small nitrate, large nitrate, and small and large OM, respectively. In comparison, the MSEs for the small- and large-size modes using the IMPROVE2007 were 2.2 and 4.8 m2 g−1 for (NH4)2SO4, respectively, and 2.4 and 5.1 m2 g−1 for NH4NO3, respectively. The slightly larger MSEs from the optimized IMPROVE algorithm for (NH4)2SO4 and NH4NO3 implied underestimation of the scattering coefficients of inorganic components when applying the previous algorithm. There were clear differences in the MSEs of OM (especially for fine OM) between the two algorithms, resulting from consideration of the light-absorbed OM in the optimized algorithm. Indicated by the m values in Table 2, the light-absorbed OC accounted for 66 % and 71 % of the fine-MSOC mass at NJU and PAES, respectively, indicating that most of the fine MSOC had only a light absorption capacity. Unlike NJU and PAES, less than half of the fine MSOC (39 %) had a light absorption capacity at NUIST, likely resulting from the varied sources of OM at the three sites. As described in our previous study (Chen et al., 2019), a substantial amount of OC was from the secondary formation in the industrial polluted region, and its light absorption capacity was weaker than that from the primary emissions.
In this study, the optimized IMPROVE algorithm for PM2.5 did not include the contribution of sea salt or soil dust. As illustrated in Fig. S10 in the Supplement, sea salt and soil dust accounted collectively for less than 10 % of the total PM2.5 scattering coefficient, suggesting that the two species should have limited impact on the IMPROVE algorithm optimization. In order to be concise in the optimized formula and to ensure the stability of the multiple linear regression, therefore, only (NH4)2SO4, NH3NO3 and OM were used as independent variables. Through field measurement and data reconstruction in different cities, previous studies explored the concentrations of PM2.5 and its chemical components for various cities in China (Chen et al., 2019; Feng et al., 2012; Lai et al., 2016; Tao et al., 2013, Yang et al., 2011; Zhao et al., 2013). The major components of light scattering in aerosols, SNA, were found to typically account for half of the PM2.5 mass concentrations in eastern Chinese cities like Nanjing, Shanghai and Jinan (Yang et al., 2011). Given the similar SNA levels and strong regional transport of pollution among those cities, the optimized IMPROVE algorithm applied in Nanjing in this work is believed to be more suitable than the previous algorithms for eastern China. Moreover, for other regions with rapidly developing economies and fast industrialization in China including the Beijing–Tianjin–Hebei or Pearl River Delta regions, the current work provides methodology and data support for the studies of aerosol light scattering in cities with relatively serious aerosol pollution. Given the fast changes in emission control and aerosol pollution in those regions, more campaigns on aerosol optical and chemical properties are recommended to further evaluate and improve the applicability of the optimized IMPROVE algorithm.
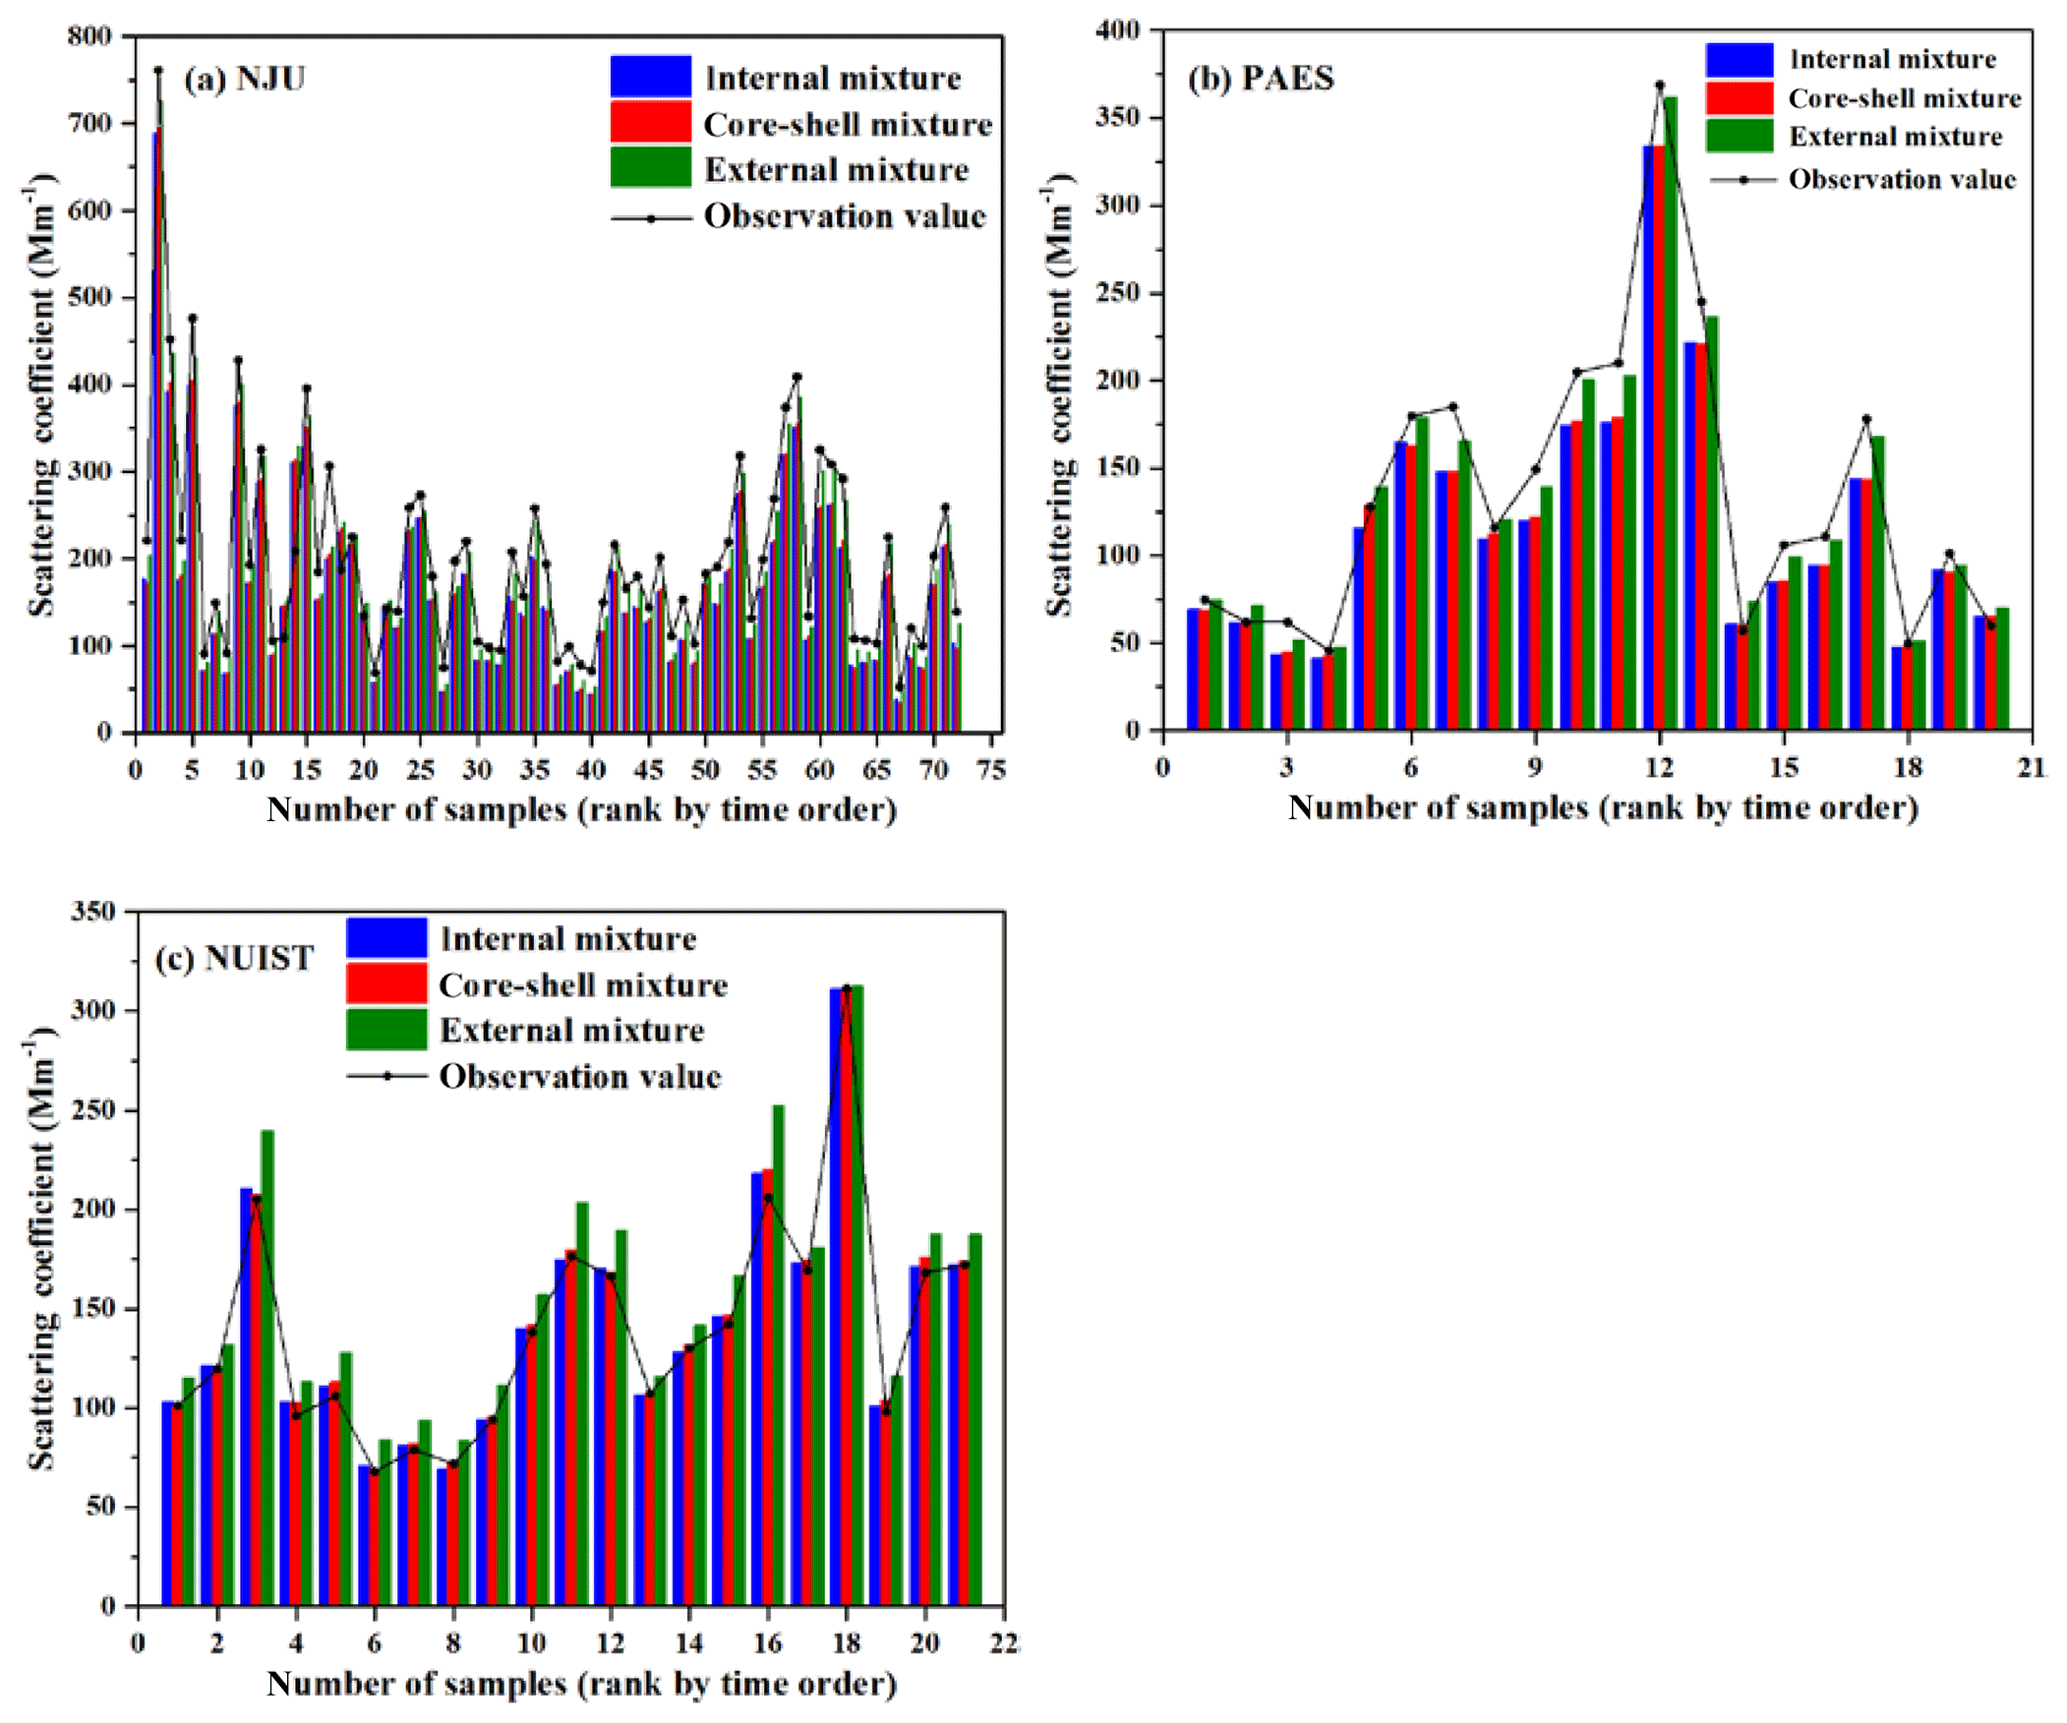
Figure 3The comparison of measured and estimated dry scattering coefficients based on the assumptions of external, internal and core–shell mixture at NJU (a), PAES (b) and NUIST (c).
3.3 Effects of mixing state and relative humidity on aerosol light scattering
Figure 3 presents the scattering coefficients measured by nephelometer and those simulated by the Mie theory at the three sites under dry conditions (RH<40 %). The simulated scattering coefficients based on the assumption of an external mixing state were larger than those based on core–shell and internal mixing states at all the three sites. Compared with the internal and core–shell states, the simulated scattering coefficients in the external mixing state were closer to the measurements at NJU and PAES (Fig. 3a, b), indicating the reasonable assumption of external mixtures as the main mixing state of particles. Similarly, Ma et al. (2012) also suggested that the external mixture was an important particle mixing state in northern China based on a stochastic particle-resolved aerosol box model. Assuming the aerosol components were externally mixed, Cheng et al. (2015) estimated the MSEs of aerosol species in Shanghai and found better agreement between the optimized scattering coefficients and the measurements. At NUIST, the measured scattering coefficients were closer to the simulated values in internal and core–shell states, likely due to the high aging level of SOA at the industrial site (Fig. 3c). Due to the strong atmospheric oxidation and thereby the abundance of SOA coatings at NUIST, our previous study suggested that the aerosol aging process could result in the growth of internally mixed BC (black carbon; Chen et al., 2019). Based on the observation of O3 and percentage of internally mixed BC, Lan et al. (2013) suggested that photochemical production of secondary aerosol components was the main reason for the switching from an external mixing state to an internal mixing state for BC.
In an actual environment, ambient aerosols are typically hygroscopic under the conditions of high RH, and it is an important reason for visibility degradation. Table S1 in the Supplement summarizes the growth factors (GFs) of particle size measured in Nanjing at different RH levels in previous studies. To evaluate the rationality of those GF values, we followed the method by J. Tao et al. (2014a) and calculated the scattering hygroscopic growth factor (f(RH)) at NJU based on the measured ambient scattering coefficients by CAPS and the dry scattering coefficients by nephelometer, as shown in Fig. S11 in the Supplement. The correlation between f(RH) and RH was fitted through the power regression. Figure S12 in the Supplement presents a good agreement between the scattering coefficients estimated by f(RH) and those obtained by the Mie theory (R2=0.95). The results indicate the accuracy of the GF values applied on different particle sizes and RH levels. The estimated and measured scattering coefficients at NJU under ambient conditions are shown in Fig. S13 in the Supplement. Different from the estimation under the dry conditions, the lowest value was found for the external mixing state among the three mixing modes. In the external mixing state, only sulfate and nitrate particles had hygroscopicity under wet conditions, whereas each particle had the capability of hygroscopic growth in the internal mixing and core–shell states, resulting in a significant increment in the scattering coefficient. Similarly, comparing the measured scattering coefficients under the dry and ambient conditions (Figs. 3 and S13), the simulated values based on an external mixing state were closer to the measurements than the other two modes, implying that RH had a limited effect on the particle mixing state.
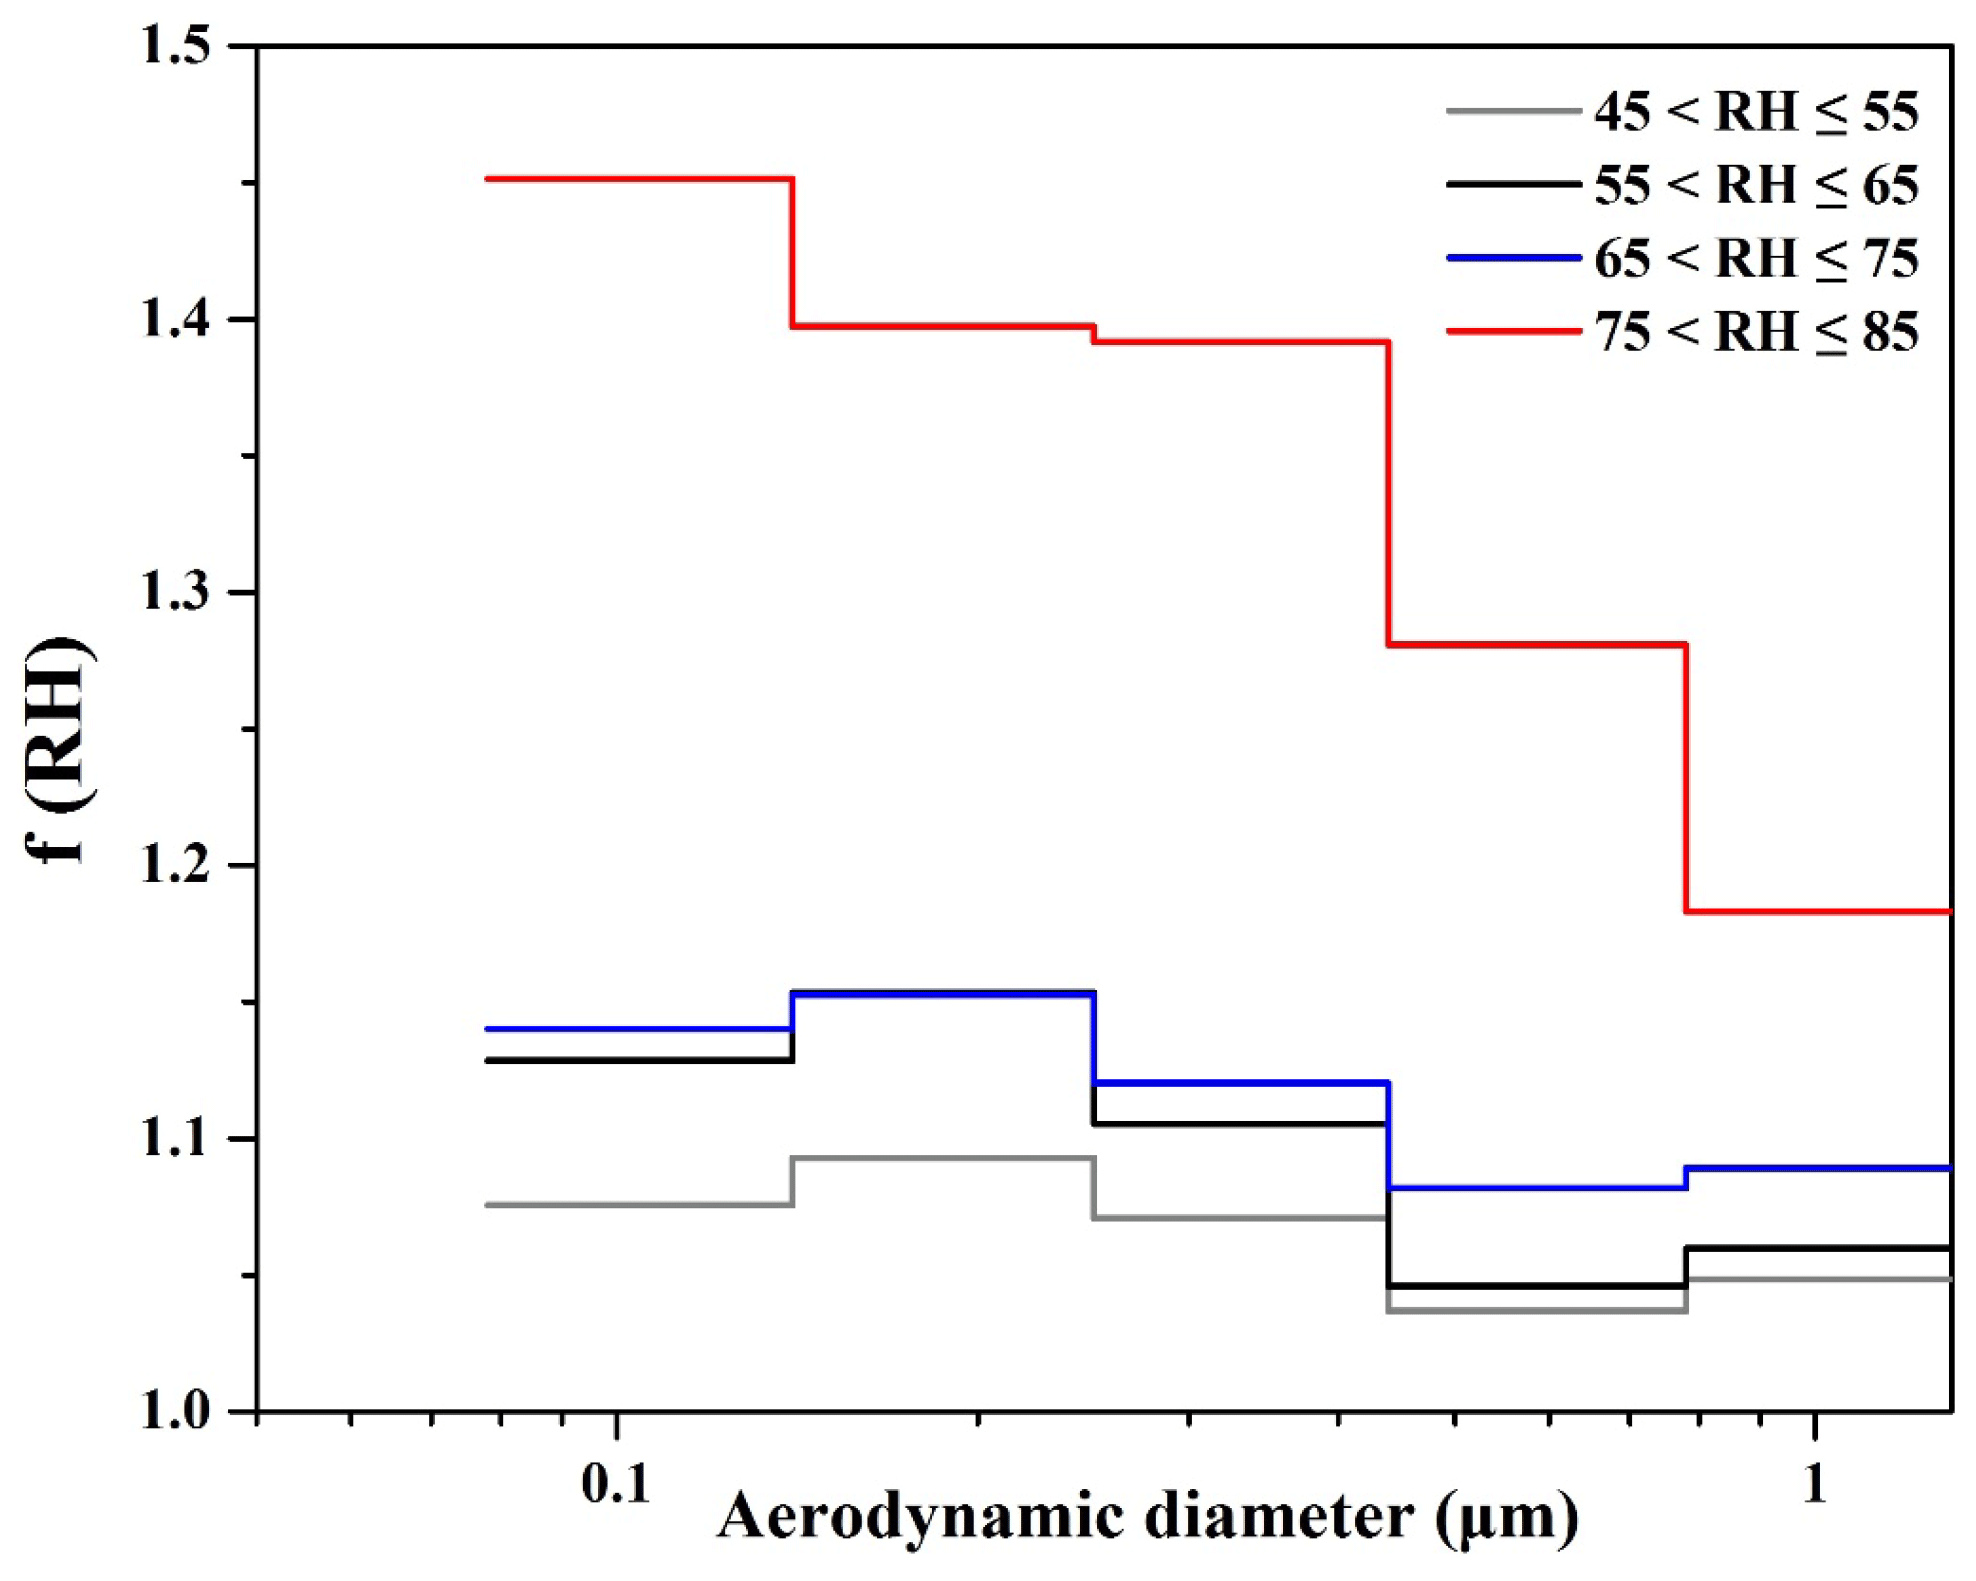
Figure 4The size distribution of hygroscopic scattering growth of particles under varied relative-humidity levels at the three sites.
To explore the impact of RH on the light scattering of particles with different sizes, the size distribution of f(RH) was estimated and shown in Fig. 4. Large differences were found between f(RH) when the RH was above and below 75 %, and high RH enhanced the capacity of scattering hygroscopicity growth of small-size particles. Approximately 140 nm particles had strong hygroscopicity when the RH was below 75 %, whereas a high f(RH) (1.41±0.03) was observed for the accumulation mode particles from 100 to 400 nm when the RH was above 75 %. Similar results were reported for Beijing: larger hygroscopic GF was measured for accumulation mode particles (100–300 nm) with a hygroscopicity tandem differential mobility analyzer (H-TDMA), consistent with the elevated abundance of the light scattering compositions such as sulfate and nitrate (Meier et al., 2009).
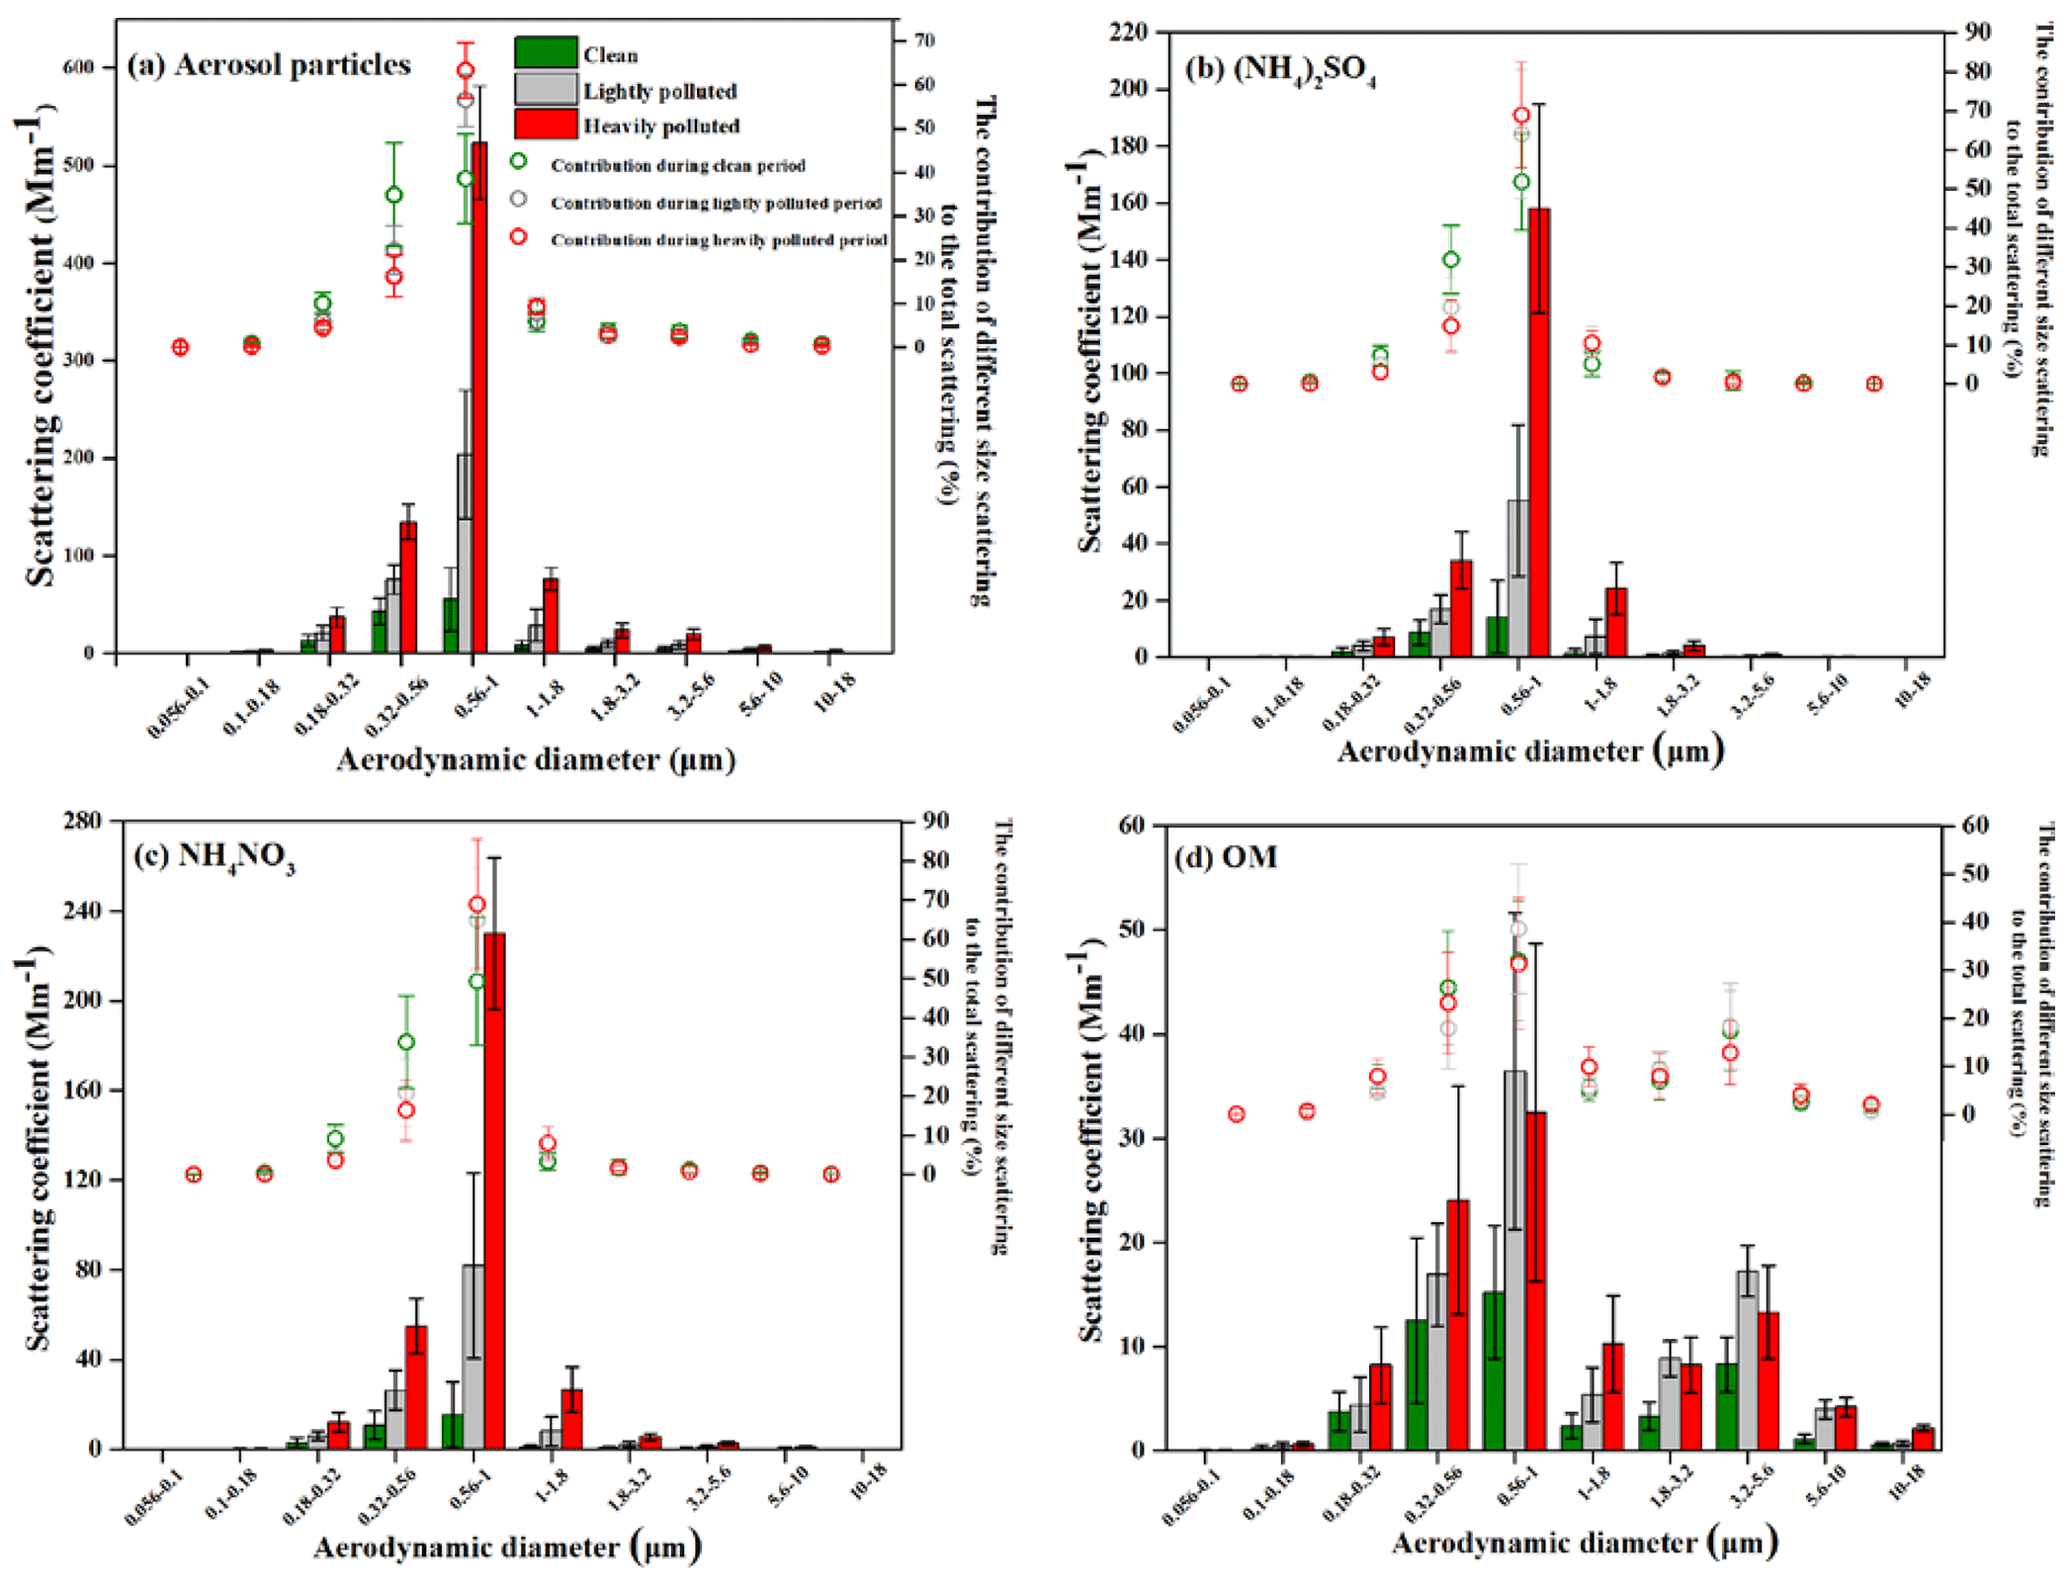
Figure 5The size distribution of scattering coefficients of aerosol particles (a), (NH4)2SO4 (b), NH4NO3 (c) and OM (d) under different pollution levels. The contributions of particles with different sizes to the total scattering coefficient are indicated in the panels as well.
3.4 Size distribution of aerosol light scattering by pollution level
Figure 5 shows the size distribution of the scattering coefficients for particles and given chemical components under the three pollution levels, based on the measurements at all the three sites. Note the result was obtained with the Mie theory under the assumption of external mixing at ambient conditions. Although other mixing states might be more important at a specific site (e.g., internal mixing at NUIST), their influence on scattering coefficient estimation was modest (Fig. 3). The scattering coefficients of particles for all size categories were the largest for the heavily polluted period (Fig. 5a). The accumulation mode particles (0.18–1.8 µm) accounted for 92.9 %, 92.6 % and 93.4 % of the total scattering coefficients for the clean, lightly polluted and heavily polluted periods, respectively. In particular, particles in the size bin of 0.56–1.0 µm accounted for 57 % and 63 % of the scattering coefficient for the heavily and lightly polluted periods, respectively, much larger than that for the clean period, 38 %. From the results of Sect. 3.1, the abundance of particles of different sizes was considered to be an important factor for the variety of scattering coefficients across the whole size range.
As the dominant chemical components of aerosol light scattering, (NH4)2SO4, NH4NO3 and OM collectively contributed 90 %, 76 % and 60 % to the mass concentrations of PM0.56−1.0 for the heavily polluted, lightly polluted and clean periods, respectively (Fig. S5b–d). The scattering coefficients of (NH4)2SO4 and NH4NO3 were the largest in the size bin of 0.56–1.0 µm for the three pollution levels, and their contributions increased along with the aggravation of pollution (Fig. 5b, c). The OM concentration in the size bin of 0.56–1.0 µm was 2.5 µg m−3 for the clean period, and those for the lightly and heavily polluted periods were 160 % and 510 % larger, respectively. The scattering coefficient of OM in the size bin of 0.56–1.0 µm for the heavily polluted period was 15 % less than that for the lightly polluted period, indicating the more important role of OM in the particle scattering effect for the lightly polluted period (Fig. 5d). The large OM scattering contribution could likely be explained by the elevated mass fraction of OM and/or enhancement of the OM MSE. It could be inferred that the low visibility during heavy pollution resulted mainly from the enhancement of the scattering effect of SNA.
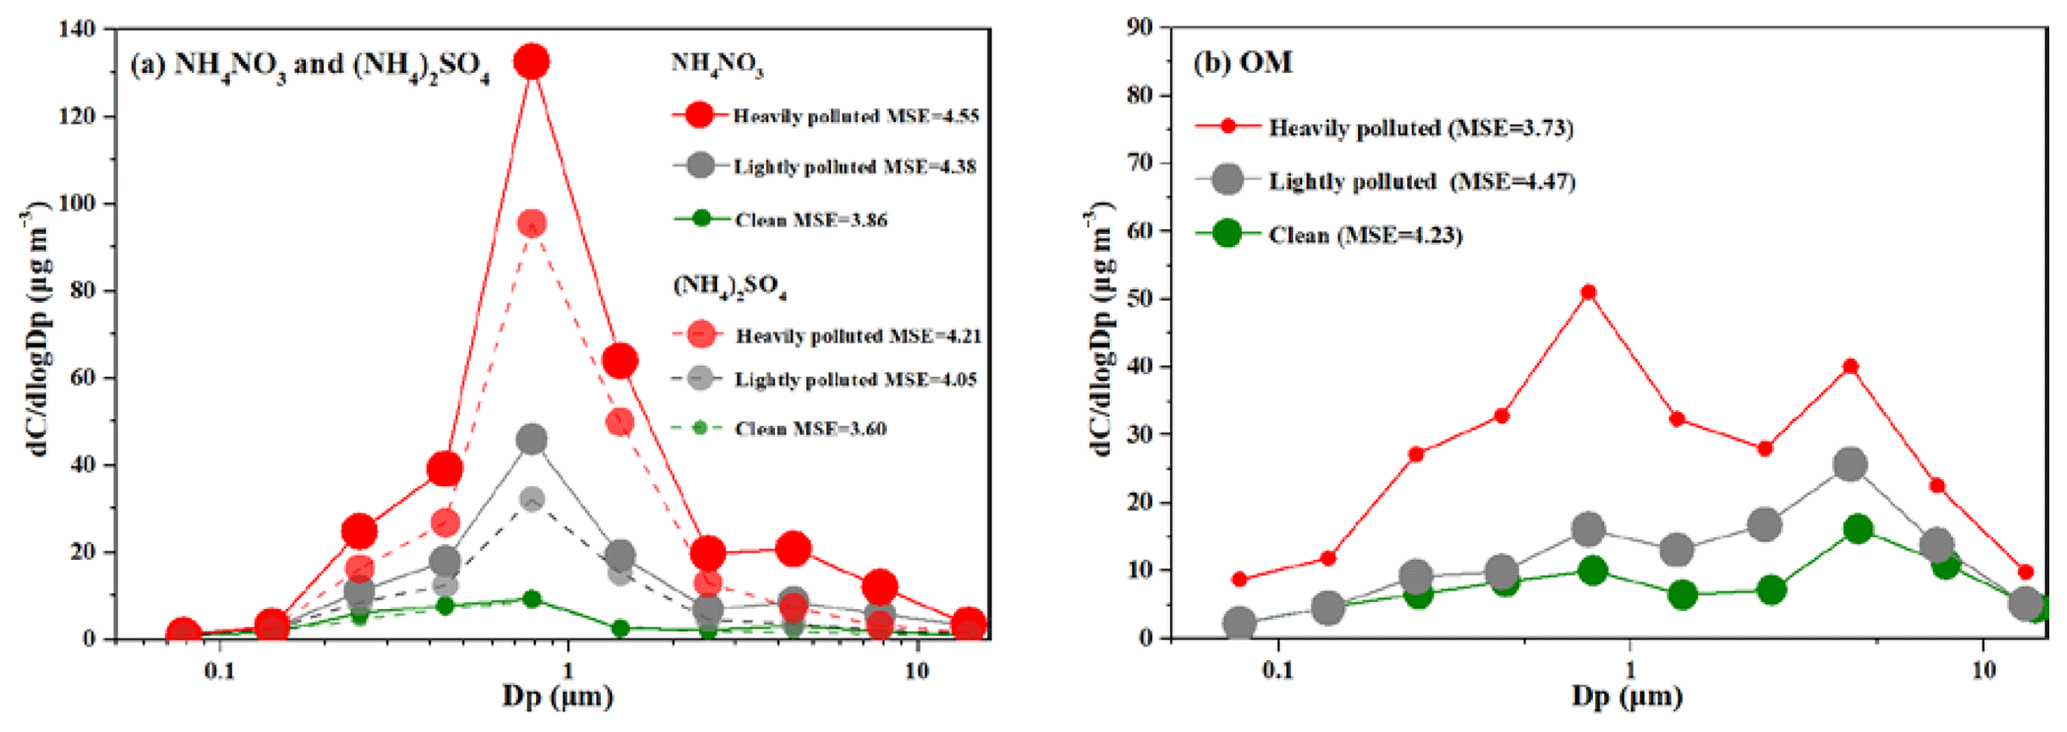
Figure 6The size distribution of mass concentrations of (NH4)2SO4 and NH4NO3 (a) and OM (b) under different pollution levels and mass scattering efficiencies (MSEs) for PM1.8. The size of the dot represents the MSEs of PM1.8 (in units of m2 g−1). Dp refers to the particle diameter, and dC refers to the differential mass concentration.
The MSEs of given chemical components in PM1.8 are presented by pollution level in Fig. 6. Increased MSEs for (NH4)2SO4 and NH4NO3 were found along with the elevated PM2.5 pollution (Fig. 6a). The large contributions of inorganic components and their strong light scattering ability were important reasons for the reduced visibility during the heavily polluted period. Although the largest OM concentrations were observed in each size bin for the heavily polluted period, the smallest MSE of OM in PM1.8 was found for the heavily polluted period (3.73 m2 g−1, Fig. 6b). As discussed in Sect. 3.2, most of the fine MSOC was expected to have only a light absorption effect, whereas large MSOC had light scattering capability. With the optimized IMPROVE algorithm, the mass fraction of light absorption OC to total MSOC mass was estimated at 66.9±5.8 % for the heavily polluted period, much larger than those for clean and lightly polluted periods at 44.3±6.5 % and 50.8±5.9 %, respectively, as shown in Fig. S14 in the Supplement. Therefore, the small MSE of OM for the heavily polluted period was partly attributed to the abundance of light absorption BrC in PM2.5.
For the whole research period, the MSEs of (NH4)2SO4, NH4NO3 and OM in PM1.8 were calculated at 3.95, 4.26 and 4.14 m2 g−1 with the Mie theory, while the analogue numbers in PM2.5 were 3.94, 4.31 and 5.25 with the optimized IMPROVE algorithm, respectively (Table 2). Very good agreement between the two methods was found for SNA, and a clearer discrepancy existed for OM, indicating a larger uncertainty in the evaluation of organic aerosol scattering.
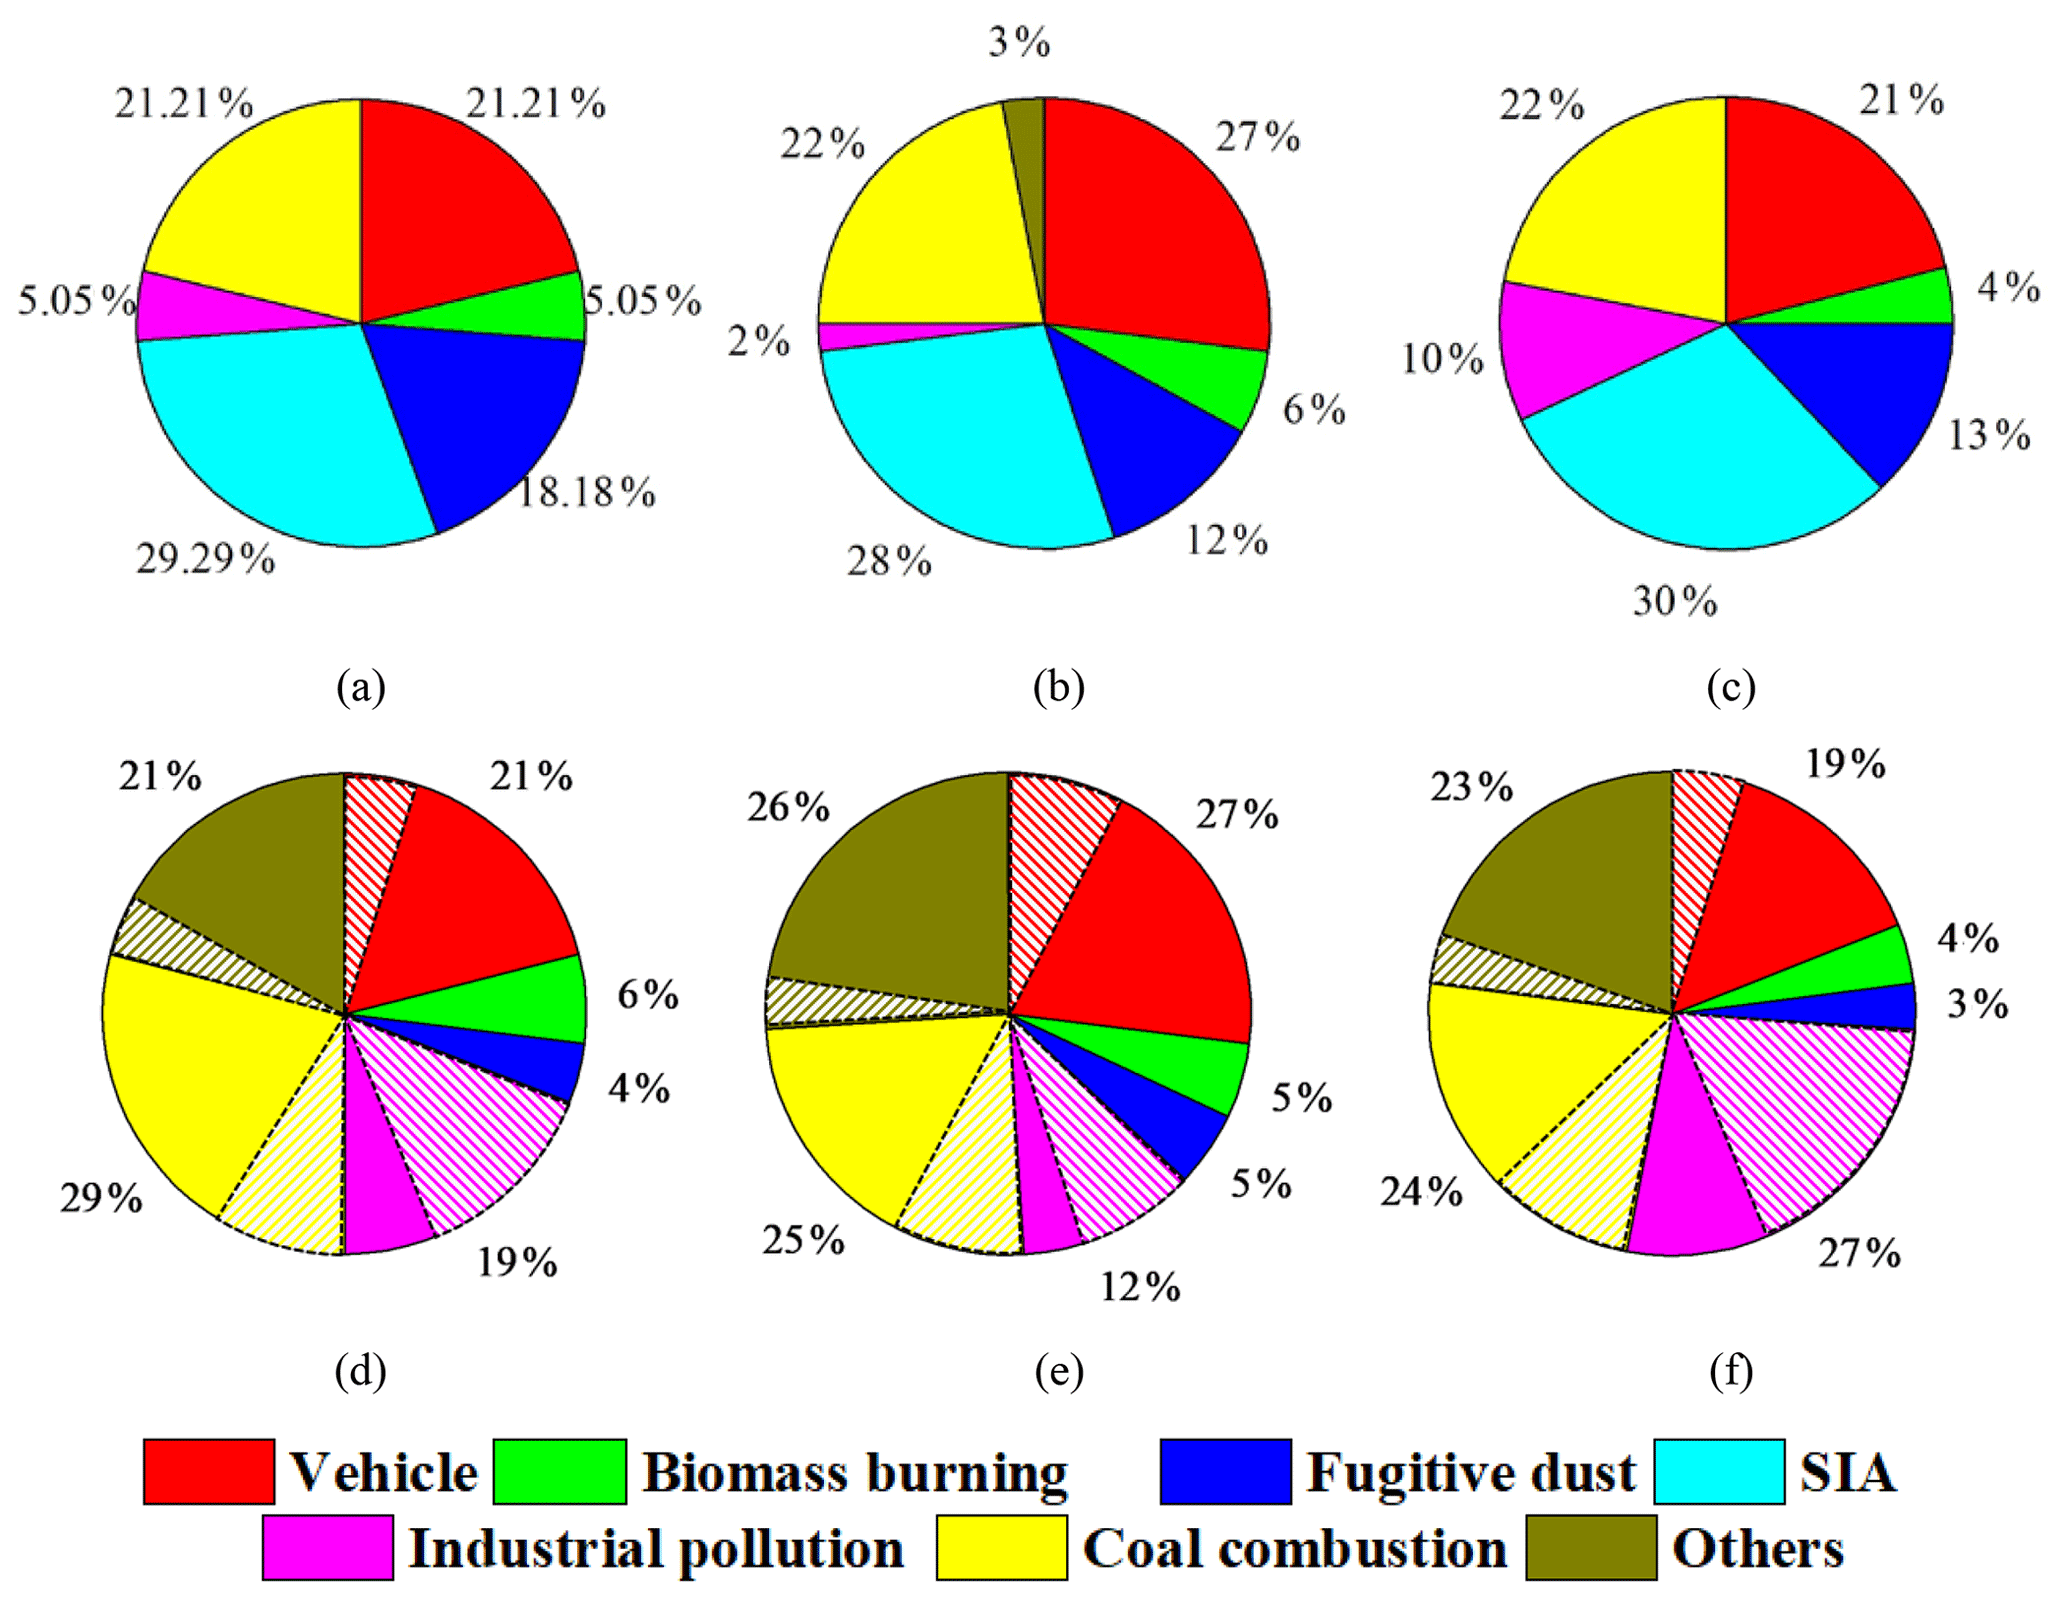
Figure 7Source apportionment of accumulation mode particles at NJU (a), PAES (b) and NUIST (c) and source apportionment of light scattering for accumulation mode particles at NJU (d), PAES (e) and NUIST (f). The shadow represents the contribution of secondary aerosols from each source category.
3.5 Source apportionment of aerosol light scattering with the PMF–Mie coupled model
As illustrated in Fig. 5, the light scattering of the accumulation mode (0.18–1.8 µm) accounted for the largest proportion of the total light scattering. To better understand the causes of visibility degradation, the source apportionment of aerosol light scattering at this size range was conducted for different pollution levels with the PMF and Mie coupled model, as described in Sect. 2.4.2. The PMF model was adopted to identify the potential sources and to estimate their respective contributions to the mass concentration of accumulation mode particles. To resolve the appropriate number of factors, different numbers of identifiable sources were tested. The source profiles and contributions to accumulation mode particles at the three sites are presented in Fig. S15 in the Supplement and Fig. 7a–c, respectively. The main sources identified at the three sites include coal combustion, industrial pollution, vehicles, fugitive dust, biomass burning and SIA (Fig. S15). Compared to NJU and NUIST, vehicles contributed more to accumulated particles at the urban site PAES (Fig. 7b). As stated in Sect. 2.4, we assumed that the contribution of the individual source category to the secondary particle component was proportional to the fraction of that source category to the emissions of corresponding precursors (Lang et al., 2017). Based on the emission inventory of precursors of SOC (VOCs) and SIA (NOx, SO2 and NH3) in Nanjing (Huang, 2018), the source apportionment for primary and secondary particles of the accumulation mode at the three sites were estimated, and the results are presented in Tables S2–S4 in the Supplement. With the source apportionment of secondary components, the contributions of coal combustion and industrial pollution increased 45 %–50 % and 138 %–478 % compared to those for primary particles across the three sites, respectively. The result indicates that the gaseous precursors from coal combustion and industrial pollution greatly elevate the aerosol pollution.
The contributions of different aerosol species to the aerosol light scattering were estimated using the Mie model, and the results are presented in Table S5 in the Supplement. OM contributed the most to the total scattering at the three sites (31 %, 29 % and 33 % for NJU, PAES and NUIST, respectively). Compared to other Chinese megacities, the contribution of OM in Nanjing was close to that for inland cities like Beijing (Tao et al., 2015) and Tianjin (Wang et al., 2016b) but was much larger than that observed in a coastal megacity, Guangzhou (J. Tao et al., 2014b).
Combined with the source apportionment from the PMF model, Fig. 7d–f illustrates the source contribution to aerosol light scattering at the three sites. Coal combustion, industrial plants and vehicles were the major sources of the aerosol light scattering in Nanjing, and the three source categories collectively accounted for 64 %–70 % of the total scattering capacity of aerosols. Given their relatively intensive activities in urban and industrial regions, vehicles and industrial plants were identified as the largest contribution sources at PAES and NUIST, respectively. Indicated by the dashed lines in Fig. 7d–f, the collective contributions of secondary aerosol components were estimated to be 26.7 %–35.2 % of the total scattering at the three sites, suggesting the important role of secondary aerosol formation in visibility reduction.
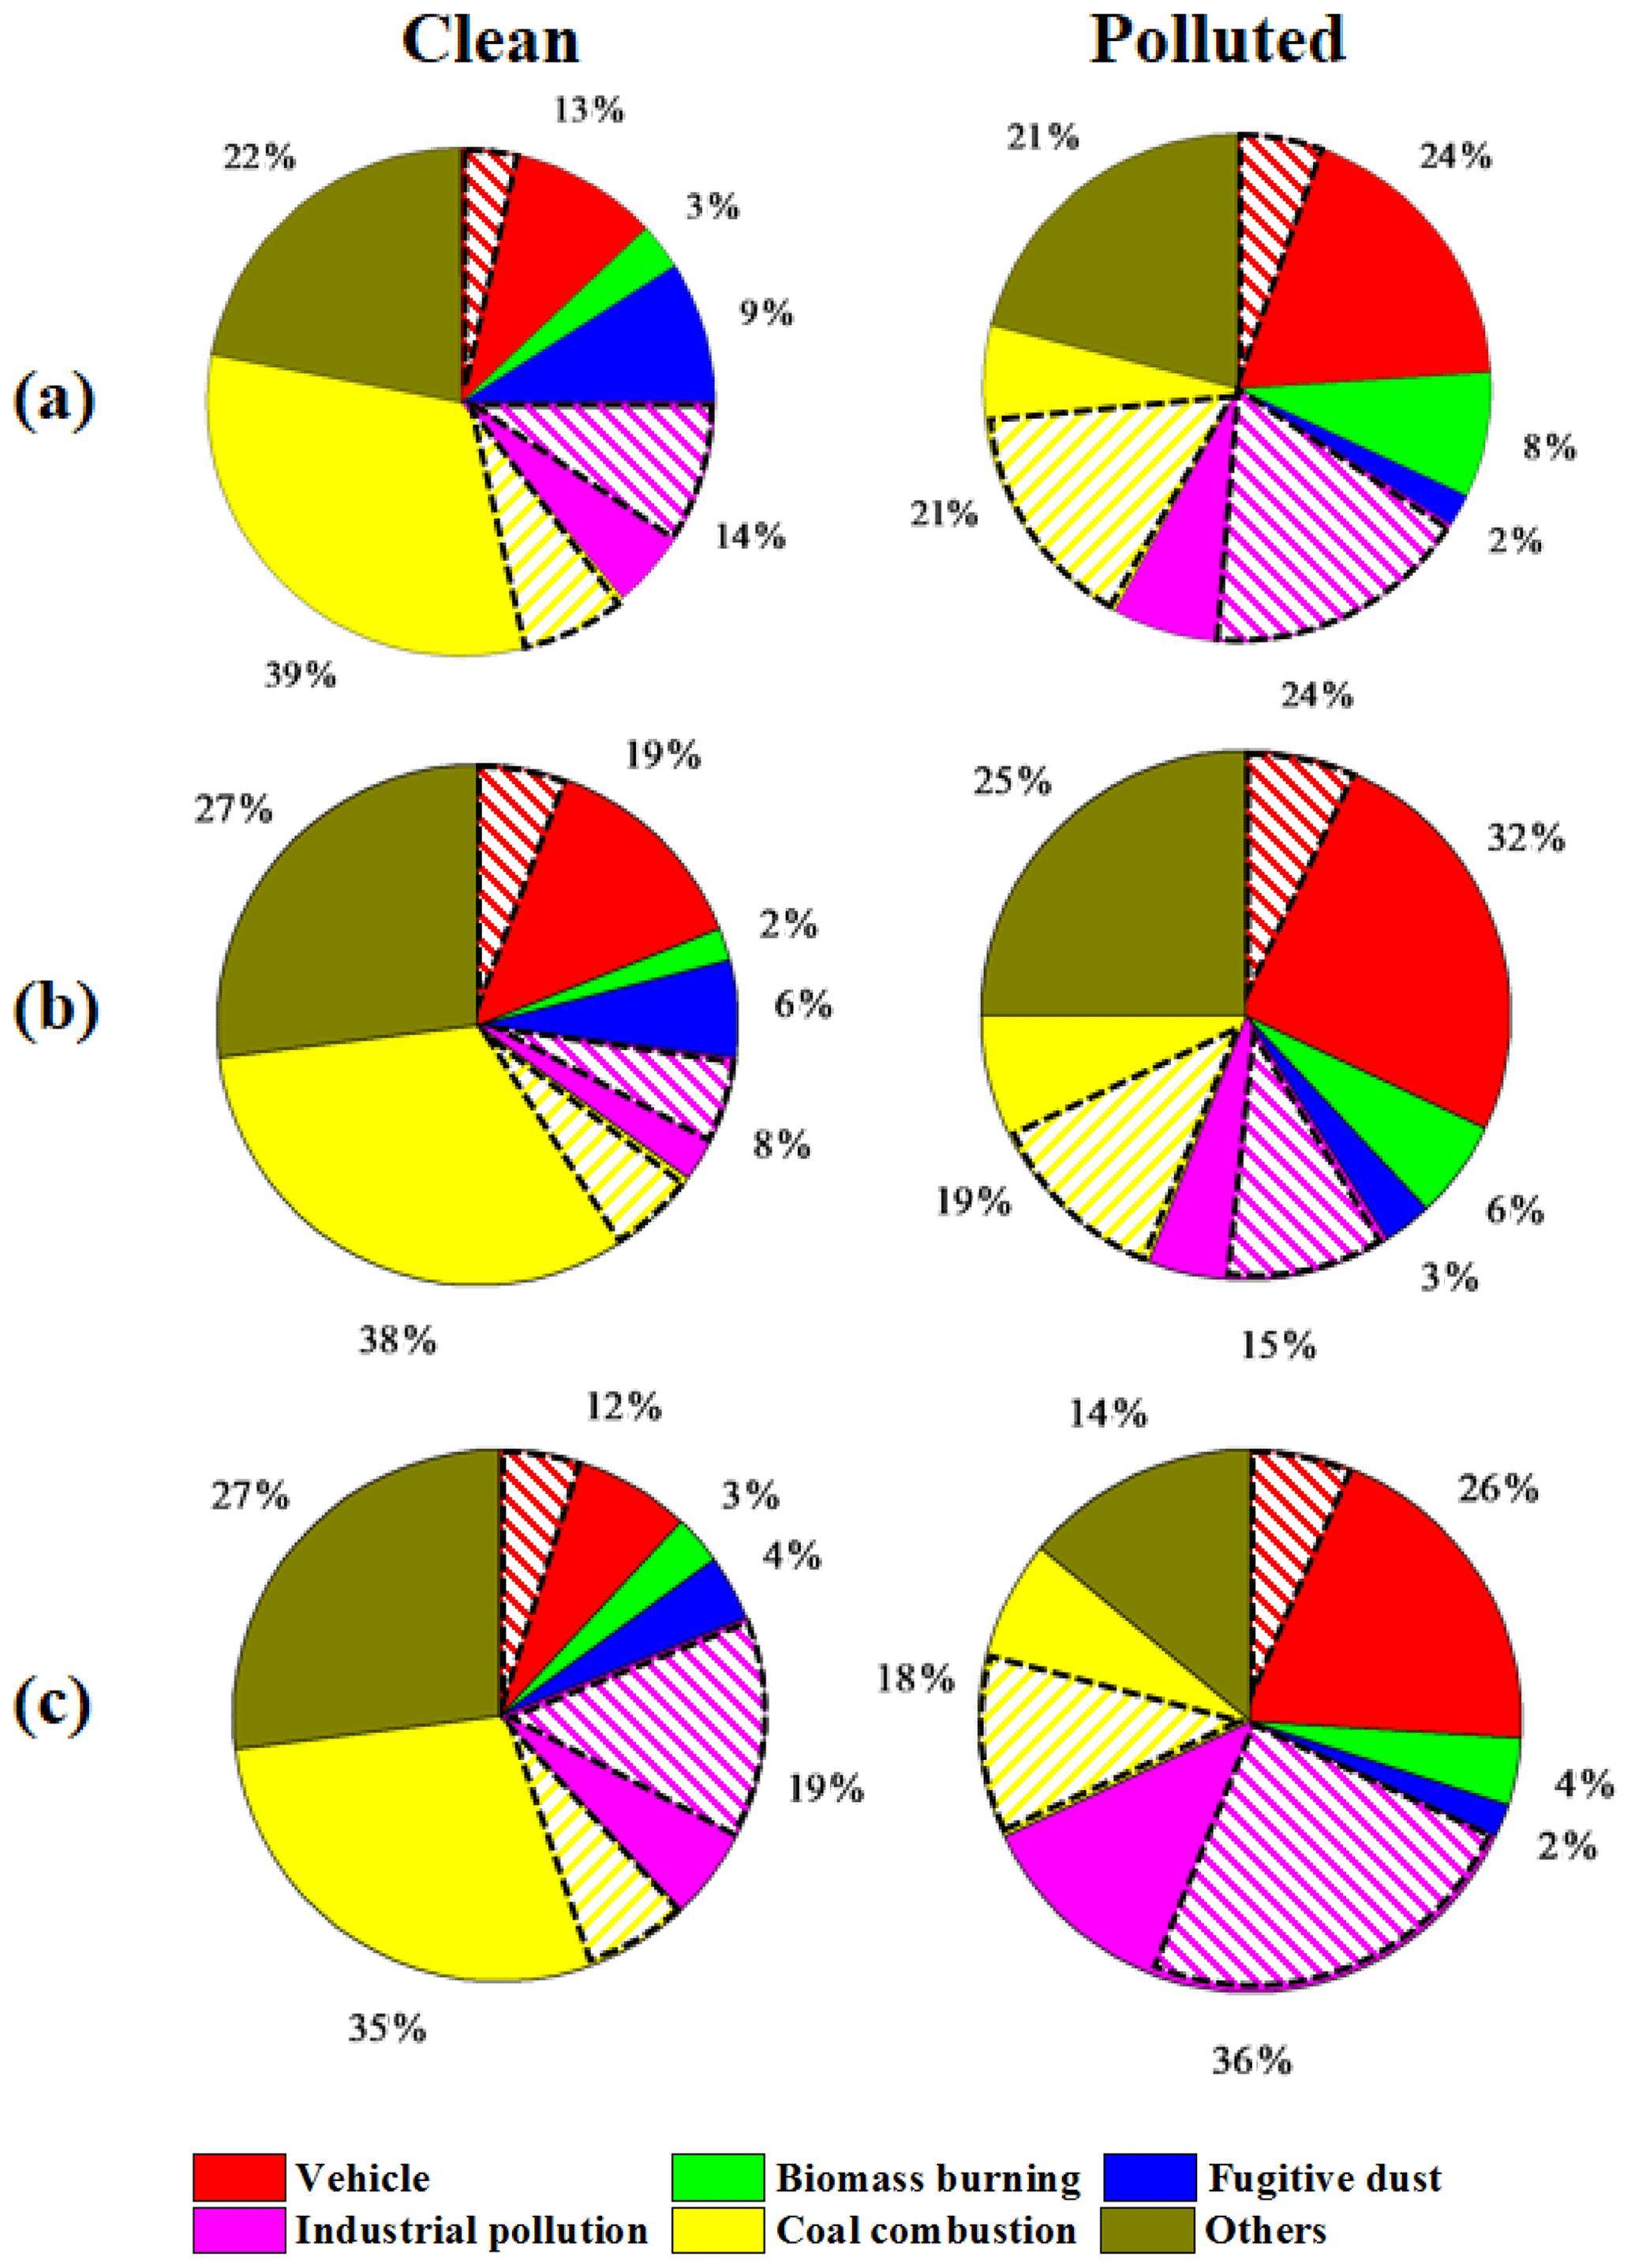
Figure 8Source apportionment of light scattering for accumulation mode particles for the clean and polluted periods at NJU (a), PAES (b) and NUIST (c). The shadow represents the contribution of secondary aerosols from each source category.
Figure 8 illustrates the source apportionment of aerosol light scattering for the clean and polluted periods at the three sites. Coal combustion contributed the most to the total scattering for the clean period, and the contribution declined significantly for the polluted period, from 39 % to 21 %, from 38 % to 19 % and from 35 % to 18 % at NJU, PAES and NUIST, respectively. The results implied that coal combustion might not be the most important reason for visibility degradation in polluted periods. Similarly, the contribution of fugitive dust during the polluted period was estimated to be smaller than that for the clean condition. In contrast, the contributions of vehicles and industrial pollution to light scattering increased from 27 % to 48 %, from 27 % to 47 % and from 31 % to 62 % for the polluted periods compared to the clean period at NJU, PAES and NUIST, respectively. As shown in Fig. 8b and c, particularly, the contribution of primary emissions from vehicles to aerosol scattering was estimated to increase from 11.4 % to 21.5 % at PAES, and that from industrial plants increased from 4.5 % to 13.5 % at NUIST. The primary aerosol emissions from vehicles and industrial plants were thus identified as the main cause of visibility reduction in the urban and industrial areas, respectively. Similarly, Wang et al. (2016b) suggested that vehicles were the dominant source of aerosol light extinction in Hangzhou, with the contribution to the total extinction coefficient of PM2.5 reaching 30.2 %. The present study indicated that more effective measures for reducing the primary particle emissions from vehicles and industrial production should be conducted to avoid severe haze pollution in urban and industrial regions.
Table 3The source contributions of secondary aerosols to aerosol light scattering at the three sites for the clean and polluted periods (%).
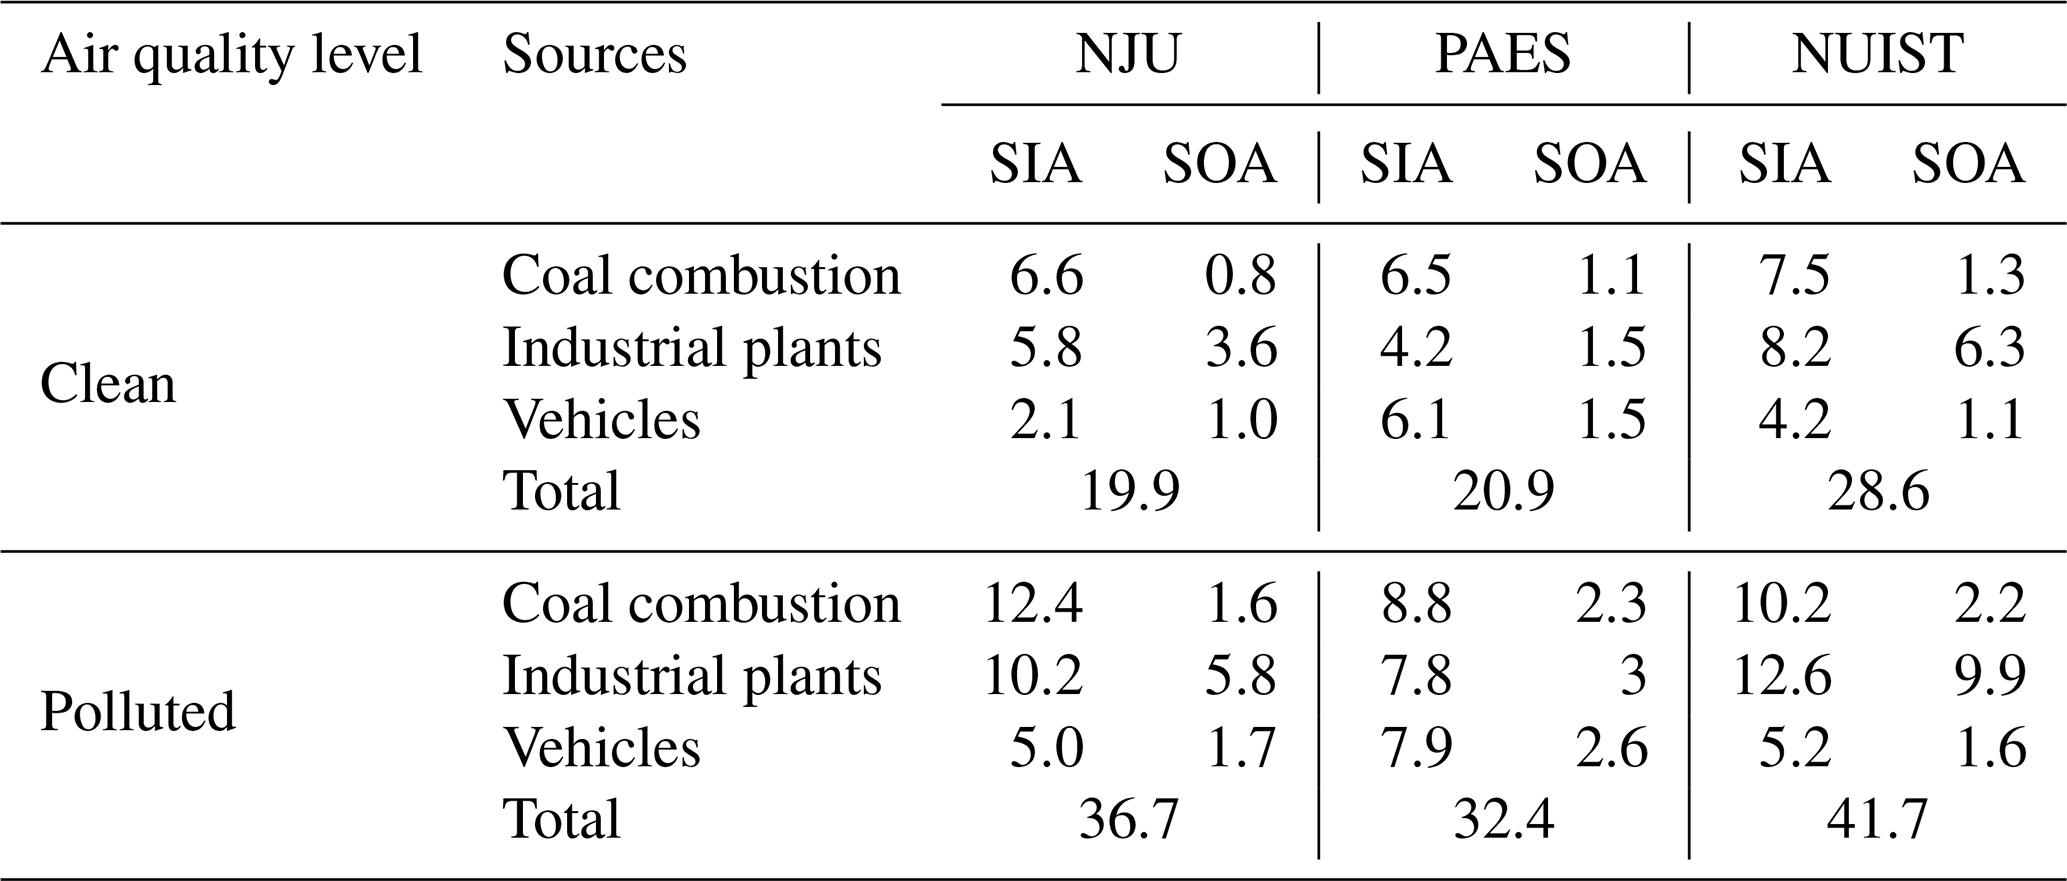
In addition, the results suggest that secondary aerosols were another important contributor to the reduced visibility. From the clean to the heavily polluted periods, as shown in Fig. 8, the contributions of secondary aerosols to the total light scattering increased from 19.9 % to 36.7 %, from 20.9 % to 32.4 % and from 28.6 % to 41.7 % at NJU, PAES and NUIST, respectively. As shown in Table 3, the contributions of SIA to the total scattering at the three sites were 14.5 %–19.9 % and 24.5 %–28.0 %, much more than those of SOA at 4.1 %–8.7 % and 7.9 %–13.7 % for the clean and polluted periods, respectively. The results imply that SIA had a greater impact on visibility degradation. Although the contribution of coal combustion to the total scattering declined from clean to polluted periods, the contributions of SIA from coal combustion for the polluted periods were 88 %, 35 % and 36 % larger than those for the clean period at NJU, PAES and NUIST, respectively. The enhancement of SIA from coal combustion was thus an important cause of polluted days. Moreover, the contribution of SOA to the total scattering coefficient during the polluted periods was estimated at 13.7 % at NUIST, larger than the 7.9 % and 9.1 % at PAES and NJU, respectively, indicating that the contribution of SOA to visibility reduction at industrial polluted areas should not be ignored. Notably, there is uncertainty in the methodology of source apportionment of aerosol scattering coefficients. In particular, the assumption that the secondary components were proportional to the emissions of their precursors is a simplified method and probably led to large bias, as the complicated nonlinear mechanism of secondary aerosol formation is not recognized. To further reduce the uncertainty and to improve the source apportionment, some specific tracers of secondary aerosols like semi-volatile and low-volatile oxygen-containing organic aerosols can be observed with advanced technology such as aerosol mass spectrometry (AMS), and the observation data can then be combined with the receptor models to quantify the source contribution of secondary aerosols. Besides, an air quality model that integrates particle source apportionment technology (PSAT) is recommended to be applied to evaluate and confirm the performance of the source apportionment of secondary aerosols with the receptor model.
A comprehensive investigation of the light scattering properties of atmospheric aerosols was conducted from November 2015 to March 2017 at three functional sites in Nanjing. High concentrations of sulfate and nitrate in PM0.56−1.0 were the major causes of the heavy-particle pollution events. The varied abundance of secondary inorganic components at the three sites was an important reason for the visibility differences, and OC played an important role in the visibility reduction in the industrial area due to its complicated optical effect. Based on the measured aerosol scattering coefficients and the mass concentrations of aerosol components, an optimized algorithm of IMPROVE that considered the light absorption effect of OM was developed to better represent the aerosol optical property.
Compared with internal and core–shell mixing states, the simulated scattering coefficients based on an external mixing assumption were closer to the measurements at NJU and PAES, indicating that externally mixed particles widely existed at urban and suburban areas. At the industrial site NUIST, the high aging level of SOA was the main reason for particle switching from external to internal mixing states. The results for the scattering coefficients under dry and ambient conditions indicated that RH had little effect on the particle mixing state but a large impact on the scattering coefficients. Particles in the size range of 0.56–1.0 µm contributed the most (38 %–63 %) to the total scattering coefficient under different pollution levels. As the dominant light scattering species in aerosols, NH4NO3, (NH4)2SO4 and OM collectively contributed 90 %, 81 % and 76 % of the mass concentrations of PM0.56−1.0 for the heavily polluted, lightly polluted and clean periods, respectively. The low visibility during the heavily polluted period mainly resulted from the enhanced light scattering of SNA. The abundance of light absorption OC was an important reason for the relatively low contribution of OM to light scattering in the heavily polluted period.
Through a coupled model of PMF and the Mie theory, we found coal combustion, industrial plants and vehicles were the main sources of the visibility reduction in Nanjing. Vehicles and industrial plants were the main causes for visibility reduction in urban and industrial areas, respectively. The increased emissions of SIA precursors from coal combustion were an important cause of polluted days, and the contribution of SOA to visibility reduction at industrial-pollution areas should not be ignored. The source apportionment of aerosol light scattering in this work provides scientific evidence for the control of haze pollution in different functional areas of cities in developed eastern China.
All data in this study are available from the authors upon request.
The supplement related to this article is available online at: https://doi.org/10.5194/acp-20-10193-2020-supplement.
DC developed the strategy and methodology of the work and wrote a draft of the paper. YZ improved the methodology and revised the paper. JZ, HY and XY provided observation data of aerosol scattering coefficient.
The authors declare that they have no conflict of interest.
This work was sponsored by the National Natural Science Foundation of China (grant nos. 41922052 and 91644220) and the National Key Research and Development Program of China (grant no. 2017YFC0210106).
This research has been supported by the National Natural Science Foundation of China (grant nos. 41922052 and 91644220) and the National Key Research and Development Program of China (grant no. 2017YFC0210106).
This paper was edited by Yun Qian and reviewed by two anonymous referees.
Alexander, D. T. L., Crozier, P. A., and Anderson, J. R.: Brown carbon spheres in East Asian outflow and their optical properties, Science, 321, 833–836, https://doi.org/10.1126/science.1155296, 2008.
Andreae, M. O., Schmid, O., Yang, H., Chand, D., Yu, J. Z., Zeng, L. M., and Zhang, Y. H.: Optical properties and chemical composition of the atmospheric aerosol in urban Guangzhou, China, Atmos. Environ., 42, 6335–6350, https://doi.org/10.1016/j.atmosenv.2008.01.030, 2008.
Bohren, C. F. and Huffman, D. R.: Absorption and scattering of light by small particles [R], New York: Wiley, Inc., 1998.
Bond, T. C. and Bergstrom, R. W.: Light Absorption by Carbonaceous Particles: An Investigative Review, Aerosol Sci. Technol., 40, 27–67, https://doi.org/10.1080/02786820500421521, 2006.
Cao, J. J., Lee, S. C., Chow, J. C., Watson, J. G., Ho, K. F., Zhang, R. J., Jin, Z. D., Shen, Z. X., Chen, G. C., Kang, Y. M., Zou, S. C., Zhang, L. Z., Qi, S. H., Dai, M. H., Cheng, Y., and Hu, K.: Spatial and seasonal distributions of carbonaceous aerosols over China, J. Geophys. Res., 112, D22S11, https://doi.org/10.1029/2006JD008205, 2007.
Cao, J. J., Wang, Q. Y., Chow, J. C., Watson, J. G., Tie, X. X., Shen, Z. X., Wang, P., and An, Z. S.: Impacts of aerosol compositions on visibility impairment in Xi'an, China, Atmos. Environ., 59, 559–566, https://doi.org/10.1016/j.atmosenv.2012.05.036, 2012.
Chen, D., Cui, H., Zhao, Y., Yin, L., Lu, Y., and Wang, Q.: A two-year study of carbonaceous aerosols in ambient PM2.5 at a regional background site for western Yangtze River Delta, China, Atmos. Res., 183, 351–361, https://doi.org/10.1016/j.atmosres.2016.09.004, 2017.
Chen, D., Zhao, Y., Lyu, R., Wu, R., Dai, L., Zhao, Y., Chen, F., Zhang, J., Yu, H., and Guan, M.: Seasonal and spatial variations of optical properties of light absorbing carbon and its influencing factors in a typical polluted city in Yangtze River Delta, China, Atmos. Environ., 199, 45–54, https://doi.org/10.1016/j.atmosenv.2018.11.022, 2019.
Cheng, M. C., You, C. F., Cao, J., and Jin, Z.: Spatial and seasonal variability of water soluble ions in PM2.5 aerosols in 14 major cities in China, Atmos. Environ., 60, 182–192, https://doi.org/10.1016/j.atmosenv.2012.06.037, 2012.
Cheng, S. H., Yang, L. X., Zhou, X. H., Xue, L. K., Gao, X. M., Zhou, Y., and Wang, W. X.: Size-fractionated water-soluble ions, situ pH and water content in aerosol on hazy days and the influences on visibility impairment in Jinan, China, Atmos. Environ., 45, 4631–4640, https://doi.org/10.1016/j.atmosenv.2011.05.057, 2011.
Cheng, Y., He, K. B., Du, Z. Y., Engling, G., Liu, J. M., Ma, Y. L., Zheng, M., and Weber, R. J.: The characteristics of brown carbon aerosol during winter in Beijing, Atmos. Environ., 127, 355–364, https://doi.org/10.1016/j.atmosenv.2015.12.035, 2016.
Cheng, Y., He, K. B., Engling, G., Weber, R., Liu, J. M., Du, Z. Y., and Dong, S. P.: Brown and black carbon in Beijing aerosol: Implications for the effects of brown coating on light absorption by black carbon, Sci. Total Environ., 599–600, 1047–1055, https://doi.org/10.1016/j.scitotenv.2017.05.061, 2017.
Cheng, Z., Jiang, J., Chen, C., Gao, J., Wang, S., Watson, J. G., Wang, H., Deng, J., Wang, B., and Zhou, M.: Estimation of aerosol mass scattering efficiencies under high mass loading: case study for the megacity of Shanghai, China, Environ. Sci. Technol., 49, 831–838, https://doi.org/10.1021/es504567q, 2015.
Cui, X., Wang, X., Yang, L., Chen, B., Chen, J., Andersson, A., and Gustafsson, Ö.: Radiative absorption enhancement from coatings on black carbon aerosols, Sci. Total Environ., 551–552, 51–56, https://doi.org/10.1016/j.scitotenv.2016.02.026, 2016.
Ding, J., Han, S., Zhang, Y., Feng, Y., Wu, J., Shi, G., and Wang, J.: Chemical characteristics of particles and light extinction effects in winter in Tianjin, Res. Environ. Sci., 28, 1353–1361, https://doi.org/10.13198/j.issn.1001-6929.2015.09.03, 2015.
Feng, J. L., Sun, P., Hu, X. L., Zhao, W., Wu, M. H., and Fu, J. M.: The chemical composition and sources of PM2.5 during the 2009 Chinese New Year's holiday in Shanghai, Atmos. Res., 118, 435–444, https://doi.org/10.1016/j.atmosres.2012.08.012, 2012.
Huang, R. J., Yang, L., Cao, J., Chen, Y., Chen, Q., Li, Y., Duan, J., Zhu, C., Dai, W., and Wang, K.: Brown Carbon Aerosol in Urban Xi'an, Northwest China: The Composition and Light Absorption Properties, Environ. Sci. Technol., 52, 6825–6833, https://doi.org/10.1021/acs.est.8b02386, 2018.
Huang, Y. W.: Effects of changes in emission and meteorological conditions on fine particulate levels in the city scale, Master thesis, Nanjing University, Nanjing, China, 2018.
Hueglin, C., Gehrig, R., Baltensperger, U., Gysel, M., Monn, C., and Vonmont, H.: Chemical characterisation of PM2.5, PM10 and coarse particles at urban, near-city and rural sites in Switzerland, Atmos. Environ., 39, 637–651, https://doi.org/10.1016/j.atmosenv.2004.10.027, 2005.
Jacobson, M. Z.: Strong radiative heating due to the mixing state of black carbon in atmospheric aerosols, Nature, 409, 695–697, https://doi.org/10.1038/35055518, 2001.
Khan, M. F., Latif, M. T., Saw, W. H., Amil, N., Nadzir, M. S. M., Sahani, M., Tahir, N. M., and Chung, J. X.: Fine particulate matter in the tropical environment: monsoonal effects, source apportionment, and health risk assessment, Atmos. Chem. Phys., 16, 597–617, https://doi.org/10.5194/acp-16-597-2016, 2016.
Kim, E. and Hopke, P. K.: Improving source identification of fine particles in a rural northeastern US area utilizing temperature-resolved carbon fractions, J. Geophys. Res.-Atmos., 109, D09204, https://doi.org/10.1029/2003jd004199, 2004.
Lai, S. C., Zhao, Y., Ding, A. J., Zhang, Y. Y., Song, T. L., Zheng, J. Y., Ho, K. F., Lee, S. C., and Zhong, L. J.: Characterization of PM2.5 and the major chemical components during a 1-year campaign in rural Guangzhou, Southern China, Atmos. Res., 167, 208–215, https://doi.org/10.1016/j.atmosres.2015.08.007, 2016.
Lan, Z. J., Huang, X. F., Yu, K. Y., Sun, T. L., Zeng, L. W., and Hu, M.: Light absorption of black carbon aerosol and its enhancement by mixing state in an urban atmosphere in South China, Atmos. Environ., 69, 118–123, https://doi.org/10.1016/j.atmosenv.2012.12.009, 2013.
Lang, J. L., Cheng, S. Y., Wen, W., Liu, C., and Wang, G.: Development and application of a new PM2.5 source apportionment approach, Aerosol Air Qual. Res., 17, 340–350, https://doi.org/10.4209/aaqr.2015.10.0588, 2017.
Lei, Y., Shen, Z., Wang, Q., Zhang, T., Cao, J., Sun, J., Zhang, Q., Wang, L., Xu, H., and Tian, J.: Optical characteristics and source apportionment of brown carbon in winter PM2.5 over Yulin in Northern China, Atmos. Res., 213, 27–33, https://doi.org/10.1016/j.atmosres.2018.05.018, 2018.
Li, B., Zhang, J., Zhao, Y., Yuan, S., Zhao, Q., Shen, G., and Wu, H.: Seasonal variation of urban carbonaceous aerosols in a typical city Nanjing in Yangtze River Delta, China, Atmos. Environ., 106, 223–231, https://doi.org/10.1016/j.atmosenv.2015.01.064, 2015.
Liu, D., Whitehead, J., Alfarra, M. R., Reyesvillegas, E., Spracklen, D. V., Reddington, C. L., Kong, S., Williams, P. I., Ting, Y. C., and Haslett, S.: Black-carbon absorption enhancement in the atmosphere determined by particle mixing state, Nature Geosci., 10, 184–188, https://doi.org/10.1038/ngeo2901, 2017.
Liu, H. J., Zhao, C. S., Nekat, B., Ma, N., Wiedensohler, A., van Pinxteren, D., Spindler, G., Müller, K., and Herrmann, H.: Aerosol hygroscopicity derived from size-segregated chemical composition and its parameterization in the North China Plain, Atmos. Chem. Phys., 14, 2525–2539, https://doi.org/10.5194/acp-14-2525-2014, 2014.
Liu, X., Cheng, Y., Zhang, Y., Jung, J., Sugimoto, N., Chang, S. Y., Kim, Y. J., Fan, S., and Zeng, L.: Influences of relative humidity and particle chemical composition on aerosol scattering properties during the 2006 PRD campaign, Atmos. Environ., 42, 1525–1536, https://doi.org/10.1016/j.atmosenv.2007.10.077, 2008.
Lowenthal, D. H. and Naresh, K.: PM2.5 mass and light extinction reconstruction in IMPROVE, J. Air Waste Manag. Assoc., 53, 1109–1120, https://doi.org/10.1080/10473289.2003.10466264, 2003.
Ma, N., Zhao, C. S., Müller, T., Cheng, Y. F., Liu, P. F., Deng, Z. Z., Xu, W. Y., Ran, L., Nekat, B., van Pinxteren, D., Gnauk, T., Müller, K., Herrmann, H., Yan, P., Zhou, X. J., and Wiedensohler, A.: A new method to determine the mixing state of light absorbing carbonaceous using the measured aerosol optical properties and number size distributions, Atmos. Chem. Phys., 12, 2381–2397, https://doi.org/10.5194/acp-12-2381-2012, 2012.
Malm, W. C. and Hand, J. L.: An examination of the physical and optical properties of aerosols collected in the IMPROVE program, Atmos. Environ., 41, 3407–3427, https://doi.org/10.1016/j.atmosenv.2006.12.012, 2007.
Massabò, D., Caponi, L., Bove, M. C., and Prati, P.: Brown carbon and thermal-optical analysis: A correction based on optical multi-wavelength apportionment of atmospheric aerosols, Atmos. Environ., 125, 119–125, https://doi.org/10.1016/j.atmosenv.2015.11.011, 2016.
Meier, J., Wehner, B., Massling, A., Birmili, W., Nowak, A., Gnauk, T., Brüggemann, E., Herrmann, H., Min, H., and Wiedensohler, A.: Hygroscopic growth of urban aerosol particles in Beijing (China) during wintertime: a comparison of three experimental methods, Atmos. Chem. Phys., 9, 6865–6880, https://doi.org/10.5194/acp-9-6865-2009, 2009.
Ministry of Environmental Protection of China (MEP): Technical regulation on ambient air quality index, China Environ. Sci. Press, Beijing, China, HJ633-2012, 2012.
Moon, K. J., Han, J. S., Ghim, Y. S., and Kim, Y. J.: Source apportionment of fine carbonaceous particles by positive matrix factorization at Gosan background site in East Asia, Environ. Int., 34, 654–664, https://doi.org/10.1016/j.envint.2007.12.021, 2008.
Onasch, T. B., Massoli, P., Kebabian, P. L., Hills, F. B., Bacon, F. W., and Freedman, A.: Single Scattering Albedo Monitor for Airborne Particulates, Aerosol Sci. Technol., 49, 267–279, https://doi.org/10.1080/02786826.2015.1022248, 2015.
Pakkanen, T. A., Kerminen, V. M., Hillamo, R. E., Makinen, M., Makela, T., and Virkkula, A.: Distribution of nitrate over seasalt and soil derived particles implications from a field study, J. Atmos. Chem., 24, 189–205, 1996.
Petzold, A., Onasch, T., Kebabian, P., and Freedman, A.: Intercomparison of a Cavity Attenuated Phase Shift-based extinction monitor (CAPS PMex) with an integrating nephelometer and a filter-based absorption monitor, Atmos. Meas. Tech., 6, 1141–1151, https://doi.org/10.5194/amt-6-1141-2013, 2013.
Pitchford, M., Malm, W., Schichtel, B., Kumar, N., Lowenthal, D., and Hand, J.: Revised algorithm for estimating light extinction from IMPROVE particle speciation data, J. Air Waste Manag. Assoc., 57, 1326–1336, https://doi.org/10.3155/1047-3289.57.11.1326, 2007.
Ramanathan, V., Li, F., Ramana, M. V., Praveen, P. S., Kim, D., Corrigan, C. E., Nguyen, H., Stone, E. A., Schauer, J. J., Carmichael, G. R., Adhikary, B., and Yoon, S. C.: Atmospheric brown clouds: Hemispherical and regional variations in long-range transport, absorption, and radiative forcing, J. Geophys. Res.-Atmos., 112, D22S21, https://doi.org/10.1029/2006JD008124, 2007.
Schwartz, S.: The Whitehouse Effect–Shortwave radiative forcing of climate by anthropogenic aerosols: An overview, J. Aerosol Sci., 27, 359–382, https://doi.org/10.1016/0021-8502(95)00533-1, 1996.
Seinfield, J. H. and Pandis, S. N.: Atmospheric Chemistry and Physics: From Air Pollution to Climate Change, 2nd Edn., John Wiley & Sons Inc., Hoboken, 2006.
Shao, P., An, J., Xin, J., Wu, F., Wang, J., Ji, D., and Wang, Y.: Source apportionment of VOCs and the contribution to photochemical ozone formation during summer in the typical industrial area in the Yangtze River Delta, China, Atmos. Res., 176–177, 64-74, https://doi.org/10.1016/j.atmosres.2016.02.015, 2016.
Shi, Y., Chen, J., Hu, D., Wang, L., Yang, X., and Wang, X.: Airborne submicron particulate (PM1) pollution in Shanghai, China: chemical variability, formation/dissociation of associated semi-volatile components and the impacts on visibility, Sci. Total Environ., 473, 199–206, https://doi.org/10.1016/j.scitotenv.2013.12.024, 2014.
Swietlicki, E., Hansson, H. C., Hämeri, K., Svenningsson, B., Massling, A., McFiggans, G., McMurry, P. H., Petäjä, T., Tunved, P., Gysel, M., Topping, D., Weingartner, E., Baltensperger, U., Rissler, J., Wiedensohler, A., and Kulmala, M.: Hygroscopic properties of submicrometer atmospheric aerosol particles measured with H-TDMA instruments in various environments – a review, Tellus B, 60, 432–469, https://doi.org/10.1111/j.1600-0889.2008.00350.x, 2008.
Tang, I. N.: Chemical and size effects of hygroscopic aerosols on light scattering coefficients, J. Geophys. Res.-Atmos., 101, 19245–19250, https://doi.org/10.1029/96jd03003, 1996.
Tao, J., Cheng, T., and Zhang R.: Chemical composition of PM2.5 at an urban site of Chengdu in southwestern China, Adv. Atmos. Sci., 30, 1070–1084, https://doi.org/10.1007/s00376-012-2168-7, 2013.
Tao, J., Zhang, L., Cao, J., Hsu, S. C., Xia, X., Zhang, Z., Lin, Z., Cheng, T., and Zhang, R.: Characterization and source apportionment of aerosol light extinction in Chengdu, southwest China, Atmos. Environ., 95, 552–562, https://doi.org/10.1016/j.atmosenv.2014.07.017, 2014a.
Tao, J., Zhang, L., Kinfai, H. O., Zhang, R., Lin, Z., Zhang, Z., Lin, M., Cao, J., Liu, S., and Wang, G.: Impact of PM2.5 chemical compositions on aerosol light scattering in Guangzhou – the largest megacity in South China, Atmos. Res., 135–136, 48–58, https://doi.org/10.1016/j.atmosres.2013.08.015, 2014b.
Tao, J., Zhang, L., Gao, J., Wang, H., Chai, F., and Wang, S: Aerosol chemical composition and light scattering during a winter season in Beijing, Atmos. Environ., 110, 36–44, https://doi.org/10.1016/j.atmosenv.2015.03.037, 2015.
Tao, J. C., Zhao, C. S., Ma, N., and Liu, P. F.: The impact of aerosol hygroscopic growth on the single-scattering albedo and its application on the NO2 photolysis rate coefficient, Atmos. Chem. Phys., 14, 12055–12067, https://doi.org/10.5194/acp-14-12055-2014, 2014.
Tian, S. L., Pan, Y. P., Liu, Z., Wen, T., and Wang, Y. S.: Size-resolved aerosol chemical analysis of extreme haze pollution events during early 2013 in urban Beijing, China, J. Hazard. Mater., 279, 452–460, https://doi.org/10.1016/j.jhazmat.2014.07.023, 2014.
Tian, S. L., Pan, Y. P., and Wang, Y. S.: Size-resolved source apportionment of particulate matter in urban Beijing during haze and non-haze episodes, Atmos. Chem. Phys., 16, 1–19, https://doi.org/10.5194/acp-16-1-2016, 2016.
Titos, G., Cazorla, A., Zieger, P., Andrews, E., Lyamani, H., Granados-Muñoz, M. J., Olmo, F. J., and Alados-Arboledas, L.: Effect of hygroscopic growth on the aerosol light-scattering coefficient: A review of measurements, techniques and error sources, Atmos. Environ., 141, 494–507, https://doi.org/10.1016/j.atmosenv.2016.07.021, 2016.
Wang, H., An, J., Cheng, M., Shen, L., Zhu, B., Li, Y., Wang, Y., Duan, Q., Sullivan, A., and Xia, L.: One year online measurements of water-soluble ions at the industrially polluted town of Nanjing, China: Sources, seasonal and diurnal variations, Chemosphere, 148, 526–536, https://doi.org/10.1016/j.chemosphere.2016.01.066, 2016a.
Wang, J., Zhang, Y., Feng, Y., Zheng, X., Li, J., Hong, S., Shen, J., Tan, Z., Jing, D., and Qi, Z.: Characterization and source apportionment of aerosol light extinction with a coupled model of CMB-IMPROVE in Hangzhou, Yangtze River Delta of China, Atmos. Res., 178–179, 570–579, https://doi.org/10.1016/j.atmosres.2016.05.009, 2016b.
Wang, S. R., Yu, Y. Y., Wang, Q. G., Lu, Y., Yin, L. N., Zhang, Y. Y., and Lu, X. B.: Source apportionment of PM2.5 in Nanjing by PMF, China Environ. Sci., 35, 3535–3542, 2015.
Watson, J. G.: Visibility: Science and regulation, J. Air Waste Manage. Assoc., 52, 628–713, 2002.
Watson, J. G., Chow, J. C., Lowenthal, D. H., Chen, L.-W. A., Shaw, S., Edgerton, E. S., and Blanchard, C. L.: PM2.5 source apportionment with organic markers in the Southeastern Aerosol Research and Characterization (SEARCH) study, J. Air Waste Manage. Assoc., 65, 1104–1118, https://doi.org/10.1080/10962247.2015.1063551, 2015.
Xu, J., Bergin, M. H., Yu, X., Liu, G., Zhao, J., Carrico, C. M., and Baumann, K.: Measurement of aerosol chemical, physical and radiative properties in the Yangtze delta region of China, Atmos. Environ., 36, 161–173, https://doi.org/10.1016/s1352-2310(01)00455-1, 2002.
Xu, J., Tao, J., Zhang, R., Cheng, T., Leng, C., Chen, J., Huang, G., Li, X., and Zhu, Z.: Measurements of surface aerosol optical properties in winter of Shanghai, Atmos. Res., 109–110, 25–35, https://doi.org/10.1016/j.atmosres.2012.02.008, 2012.
Xue, L., Ding, A., Gao, J., Wang, T., Wang, W., Wang, X., Lei, H., Jin, D., and Qi, Y.: Aircraft measurements of the vertical distribution of sulfur dioxide and aerosol scattering coefficient in China, Atmos. Environ., 44, 278–282, https://doi.org/10.1016/j.atmosenv.2009.10.026, 2010.
Yan, C. Q., Zheng, M., and Zhang, Y. H.: Research progress and direction of atmospheric brown carbon, Environ. Sci., 35, 4404–4414, https://doi.org/10.13227/j.hjkx.2014.11.050, 2014.
Yang, F., Tan, J., Zhao, Q., Du, Z., He, K., Ma, Y., Duan, F., Chen, G., and Zhao, Q.: Characteristics of PM2.5 speciation in representative megacities and across China, Atmos. Chem. Phys., 11, 5207–5219, https://doi.org/10.5194/acp-11-5207-2011, 2011.
Zhang, L., Sun, J. Y., Shen, X. J., Zhang, Y. M., Che, H., Ma, Q. L., Zhang, Y. W., Zhang, X. Y., and Ogren, J. A.: Observations of relative humidity effects on aerosol light scattering in the Yangtze River Delta of China, Atmos. Chem. Phys., 15, 8439–8454, https://doi.org/10.5194/acp-15-8439-2015, 2015.
Zhang, Y., Forrister, H., Liu, J., Dibb, J., Anderson, B., Schwarz, J. P., Perring, A. E., Jimenez, J. L., Campuzanojost, P., and Wang, Y.: Top-of-atmosphere radiative forcing affected by brown carbon in the upper troposphere, Nature Geosci., 10, 486–489, https://doi.org/10.1038/ngeo2960, 2017.
Zhao, P. S., Dong, F., He, D., Zhao, X. J., Zhang, X. L., Zhang, W. Z., Yao, Q., and Liu, H. Y.: Characteristics of concentrations and chemical compositions for PM2.5 in the region of Beijing, Tianjin, and Hebei, China, Atmos. Chem. Phys., 13, 4631–4644, https://doi.org/10.5194/acp-13-4631-2013, 2013.
Zhao, Y., Qiu, L. P., Xu, R. Y., Xie, F. J., Zhang, Q., Yu, Y. Y., Nielsen, C. P., Qin, H. X., Wang, H. K., Wu, X. C., Li, W. Q., and Zhang, J.: Advantages of a city-scale emission inventory for urban air quality research and policy: the case of Nanjing, a typical industrial city in the Yangtze River Delta, China, Atmos. Chem. Phys., 15, 12623–12644, https://doi.org/10.5194/acp-15-12623-2015, 2015.