the Creative Commons Attribution 4.0 License.
the Creative Commons Attribution 4.0 License.
 | 28 Aug 2020
Apparent dust size discrepancy in aerosol reanalysis in north African dust after long-range transport
Samantha J. Kramer
Claudia Alvarez
Anne E. Barkley
Peter R. Colarco
Lillian Custals
Rodrigo Delgadillo
Cassandra J. Gaston
Ravi Govindaraju
North African dust reaches the southeastern United States every summer. Size-resolved dust mass measurements taken in Miami, Florida, indicate that more than one-half of the surface dust mass concentrations reside in particles with geometric diameters less than 2.1 µm, while vertical profiles of micropulse lidar depolarization ratios show dust reaching above 4 km during pronounced events. These observations are compared to the representation of dust in the Modern-Era Retrospective analysis for Research and Applications, version 2 (MERRA-2) aerosol reanalysis and closely related Goddard Earth Observing System model version 5 (GEOS-5) Forward Processing (FP) aerosol product, both of which assimilate satellite-derived aerosol optical depths using a similar protocol and inputs. These capture the day-to-day variability in aerosol optical depth well, in a comparison to an independent sun-photometer-derived aerosol optical depth dataset. Most of the modeled dust mass resides in diameters between 2 and 6 µm, in contrast to the measurements. Model-specified mass extinction efficiencies equate light extinction with approximately 3 times as much aerosol mass, in this size range, compared to the measured dust sizes. GEOS-5 FP surface-layer sea salt mass concentrations greatly exceed observed values, despite realistic winds and relative humidities. In combination, these observations help explain why, despite realistic total aerosol optical depths, (1) free-tropospheric model volume extinction coefficients are lower than those retrieved from the micro-pulse lidar, suggesting too-low model dust loadings in the free troposphere, and (2) model dust mass concentrations near the surface can be higher than those measured. The modeled vertical distribution of dust, when captured, is reasonable. Large, aspherical particles exceeding the modeled dust sizes are also occasionally present, but dust particles with diameters exceeding 10 µm contribute little to the measured total dust mass concentrations after such long-range transport. Remaining uncertainties warrant a further integrated assessment to confirm this study's interpretations.
- Article
(9371 KB) - Full-text XML
- BibTeX
- EndNote


Africa contributes almost 50 % of the world's dust emissions (Huneeus et al., 2011), with easterly winds transporting the dust over the Atlantic subtropical belt throughout the full seasonal cycle. The impacts of dust span from climate-relevant timescales, which primarily focus on dust's radiative effects, to the shorter timescales important for human endeavors. The latter include dust storms capable of closing airports, disrupting military exercises and agriculture, and having human health impacts. The amount of dust mass in diameters less than 2.5 µm in particular is important for air quality, as these can penetrate human lungs (Wilson and Spengler, 1996), setting the diameter threshold used by the United States Environmental Protection Agency in meeting the conditions of the Clean Air Act. Dust mass concentrations in this size range frequently exceed established standards in the eastern Caribbean (Garrison et al., 2014), if rarely in the southeastern United States (Prospero, 1999b).
The desire for short-term information on dust emissions and their transport has encouraged the dissemination of forecasts through, for example, the World Meteorological Organization's Sand and Dust Storm Warning Advisory and Assessment System. More accurate shorter-term predictions have resulted from a further approach, in which the aerosol forecasts are adjusted by assimilating observed aerosol optical depths (τa), primarily derived from satellite. The data assimilation allows global aerosol models to improve the spatial distribution of aerosol plumes and is particularly valuable further away from aerosol source regions, where models tend to underestimate τa (Kim et al., 2014; Evan et al., 2014).
A leading global aerosol model also used for operational forecasts is the Goddard Earth Observing System model version 5 (GEOS-5), which uses the Goddard Chemistry Aerosol Radiation and Transport (GOCART; Ginoux et al., 2001) scheme. The operational GEOS-5 Forward Processing (FP) model relies on a slightly more mature version of the GEOS-5 model used to produce the global Modern-Era Retrospective analysis for Research and Applications, version 2 (MERRA-2; Randles et al., 2017). For both, the assimilated τa values, with which the simulated aerosol loadings are adjusted, primarily come from the Moderate Resolution Imaging Spectroradiometer (MODIS) satellite sensor. Any τa biases introduced by clouds and other optical inhomogeneities are corrected using a neural network based on surface-based Aerosol Robotic Network (AERONET; Holben et al., 1998) τa values as a reference. The better-documented MERRA-2 reanalysis shows no global bias relative to the surface-derived AERONET τa at 550 nm (Gelaro et al., 2017). The assimilation reduces the presence of spurious trends in MERRA-2 (Gelaro et al., 2017) and clearly improves depicted atmospheric aerosol loadings compared to those in non-aerosol-assimilating simulations (Buchard et al., 2017). Importantly for dust transport, the assimilation corrects for a tendency of GEOS-5 to remove dust too quickly from the atmosphere (Buchard et al., 2017), presumably through either excessive sedimentation of the larger particles or excessive scavenging by clouds.
The assimilated τa must be redistributed into a vertical structure of the aerosol mass mixing ratio, differentiated between diverse aerosol sources, of which two (dust and sea salt) are further distributed over five size ranges. Mass extinction efficiencies are developed using radiative transfer theory for each of the aerosols and parameterized. These allow the second moment of the size distribution, the vertically resolved volume extinction coefficient, to be interpreted as the third moment of the size distribution, namely the aerosol mass mixing ratio fundamental to the model. The assimilation allows the model-specified aerosol mass mixing ratios to approximately match the observed τa, so that the spatial distribution of the aerosol is improved, with the aerosol source and vertical distribution primarily set by the aerosol parameterizations and model physics. The model physics driving the convective transport, cloud microphysics and mixing influence how much of the aerosol is lofted further, how much is captured by precipitation, how much mixes into the boundary layer, and how much is deposited back to the surface. The particle size and vertical structure distributions are not necessarily independent, as smaller particles will be lofted higher and larger particles will settle out of the atmosphere more quickly. The aerosol size parameterizations therefore have ramifications for the subsequent transport, the resulting direct radiative effect, and the model aerosol deposition rates. In one comparison of dust vertical profiles, an Aerosol Comparison between Observations and Models (AeroCom) intercomparison of five emission-based models found significant diversity in the modeled vertical dust profiles, with large discrepancies compared to space-based lidar observations (Koffi et al., 2016).
Further understanding of the global aerosol model forecasts can be gained from their assessment using in situ and space-based observations. This study assesses the depiction of dust properties after long-range transport within the GEOS-5 FP forecasts and MERRA-2 reanalysis at a location slightly offshore of Miami, Florida, or ∼ 6000 km away from the source region. Dust is the dominant aerosol present in the Miami, Florida, atmosphere during the summer months (Fig. 1), with sea salt a distant second, even at a coastal site with a consistent sea salt presence throughout the year (Prospero, 1999a, replotted as the inset in Fig. 1). Anthropogenic (nitrate, non-sea-salt sulfate) and biogenic (potassium, calcium) mass concentrations are low (Fig. 1). As detailed in many previous studies and easily verified with satellite imagery and the GEOS-5 forecasts, most of the dust originates from northern Africa, with the July maximum in the dust mass concentrations in Miami reflecting a combination of the easterly winds over the remote tropical Atlantic and more southerly winds over the Caribbean (Kramer et al., 2020a), and a reduced aerosol removal by precipitation in July compared to August (e.g., van der Does et al., 2020). Variability in sea salt mass concentrations can be more directly related to local surface wind speeds. Overall, the dominance of two aerosol species, dust and sea spray, within the summer aerosol environment of Miami, simplifies this study.
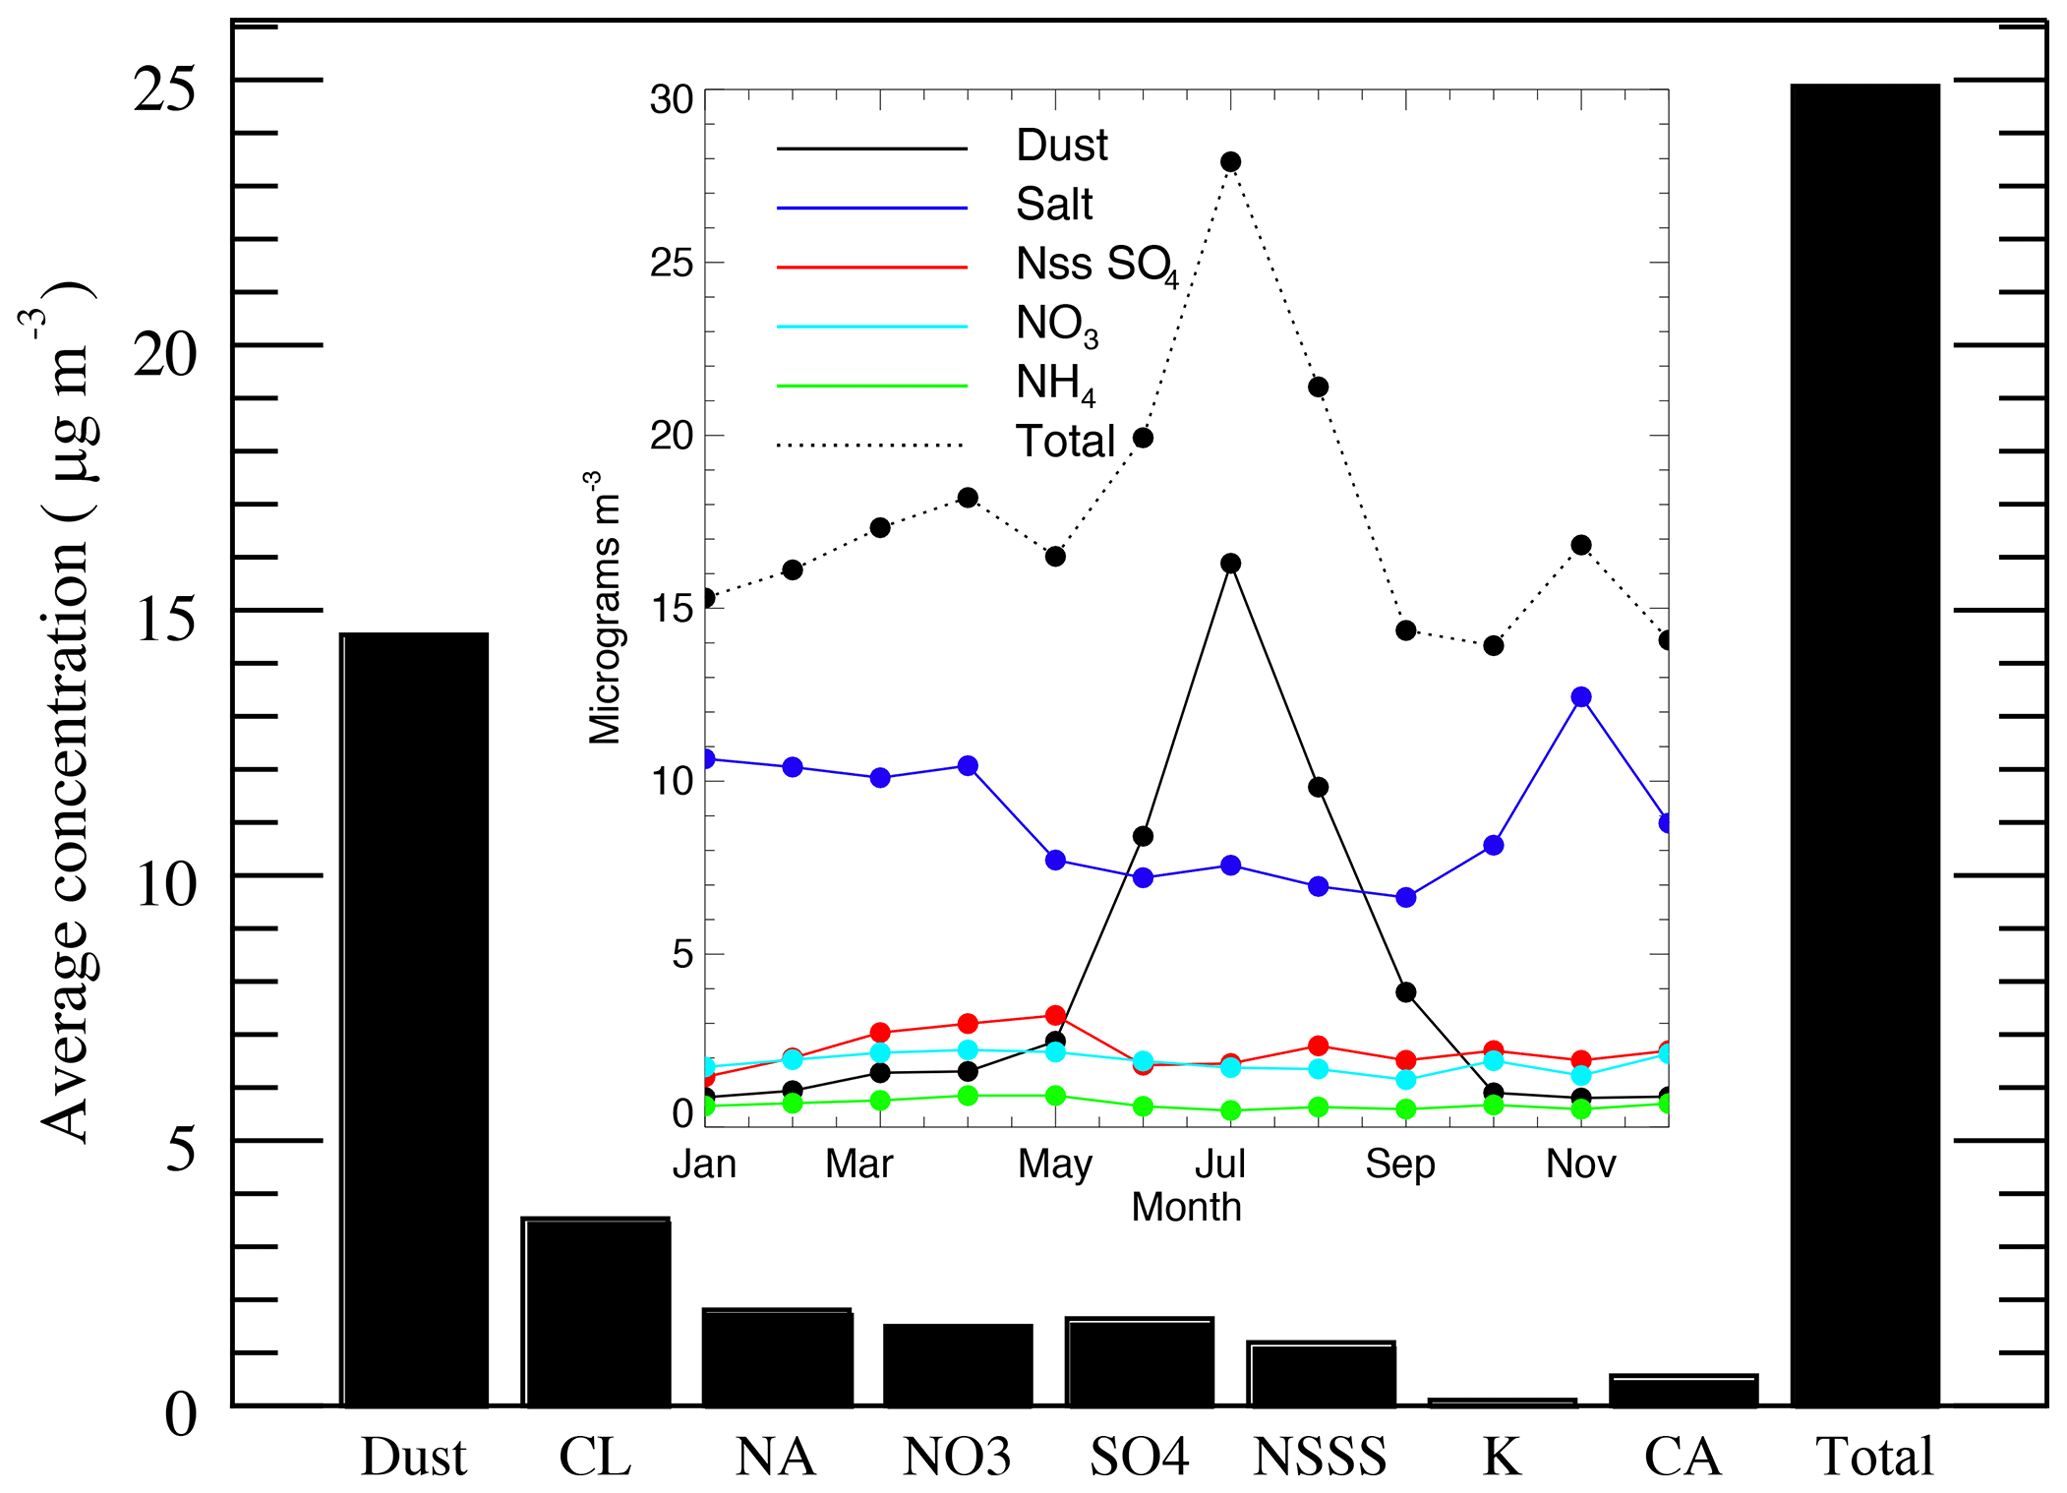
Figure 1Average aerosol concentrations for July–August 2014 of the soluble ions chlorine (CL), sodium (NA), nitrate (NO3), sulfate (SO4), and non-sea-salt sulfate (NSSS), potassium (K), and calcium (CA). Inset plot is the Miami monthly mean aerosol concentration by species from 1989 to 1996, replotted from Prospero (1999a).
Primary observations include ground-based micropulse lidar (MPL) depictions of the dust vertical structure, surface measurements of bulk and size-resolved dust mass concentrations and sea salt mass concentrations. The daily resolved measurements span three consecutive Miami dust seasons, namely June through September of 2014, 2015 and 2016. The filter and lidar data are collected at the Rosenstiel School of Marine and Atmospheric Science campus of the University of Miami, located on Virginia Key at 25.73∘ N, 80.16∘ W, approximately 4 km east of the Florida mainland. Filter measurements of the bulk mass concentration are made daily from May to September, with more details on the protocol available within Zuidema et al. (2019); these basically follow Prospero (1999a). Further analysis, in support of this study, included analysis of extracts containing the major soluble inorganic ions using the samples from July and August of 2014, primarily to ascertain the sodium mass concentrations. This used flame atomic absorption to determine sodium (Na+) and suppressed ion chromatography to determine chloride (Cl−) along with nitrate () and sulfate () (Savoie et al., 1989). The sea salt concentration is computed from the sodium concentration multiplied by 3.256, following Prospero (1999a). Filter-based dust mass measurements discriminated by size are also collected for 17 select days in 2016 encompassing strong synoptic events. Scanning electron microscopy imaging is additionally performed on select filters from this time period. Throughout this time, the daily dust bulk mass measurements at the surface are matched to the higher time resolution of lidar measurements. The dust layers and their vertical extent are identified using the MPL polarization capability, and extinction profiles are retrieved from the lidar backscattered intensities for select cases following Delgadillo et al. (2018), with details relevant to this study provided below.
2.1 Size-resolved dust mass concentrations
Dust size distributions are measured on 17 d in 2016 using a Series 230 high-volume cascade impactor: multistage particulate size fractionator manufactured by Tisch Environmental, Inc., following Li-Jones and Prospero (1998). The impactor is located directly below the bulk filters, using a secondary calibrated airflow. Air flow through three aluminum slots discriminates for particle aerodynamic diameters of 10.2, 4.2, and 2.1 µm (see also Table 1), with one final plate capturing the remaining smaller sizes. This helps eliminate particle bounce, wherein dry particles bounce to the subsequent stage (Wang and John, 1987). The high ambient relative humidity of the Miami summer also increases the sticking efficiency of the dust to the impactor surface (Lawson, 1980). The asphericity of dust may introduce an error in the interpretation of each size range, since the impactor selects for the particle size based on only the two horizontal dimensions. The aerodynamic diameter is related here to the smaller geometric diameter through a factor of 0.75 (Kok et al., 2014).
Table 1Particle geometric diameter range applied within the GEOS-5 dust size parameterization, corresponding mass extinction efficiencies (MEEs) at 550 nm wavelength assuming non-spherical optics (Colarco et al., 2014), and Miami impactor thresholds, in both aerodynamic and geometric diameters (Da and Dg), where Dg=0.75Da (Kok et al., 2014).

∗ Not available.
The size-resolved dust masses are thereafter extracted identically to those on the bulk filters. The total dust masses summed from the sized impactor samples agree well with the dust masses from the bulk samples (Fig. 2), lending confidence to the two independent measures. This contrasts with Li-Jones and Prospero (1998), who report dust masses summed from cascade impactors that are one-half to three-quarters of those derived from the bulk samples. A bias towards smaller summed dust masses from impactor samplers is also documented in a more comprehensive assessment of sizing techniques (J. S. Reid et al., 2003a). The bias is attributed to aerosol deposition upon the impactor surfaces in both studies, behavior that is thought to be more prevalent for the larger particles, and would thereby emphasize the relative contribution of the smaller sizes to the total dust mass (as will be shown). The lack of a bias between the two total dust mass concentrations (Fig. 2) in the present study suggests the lack of bias may be fortuitous, for example, through a difference between the true and assumed air flow.
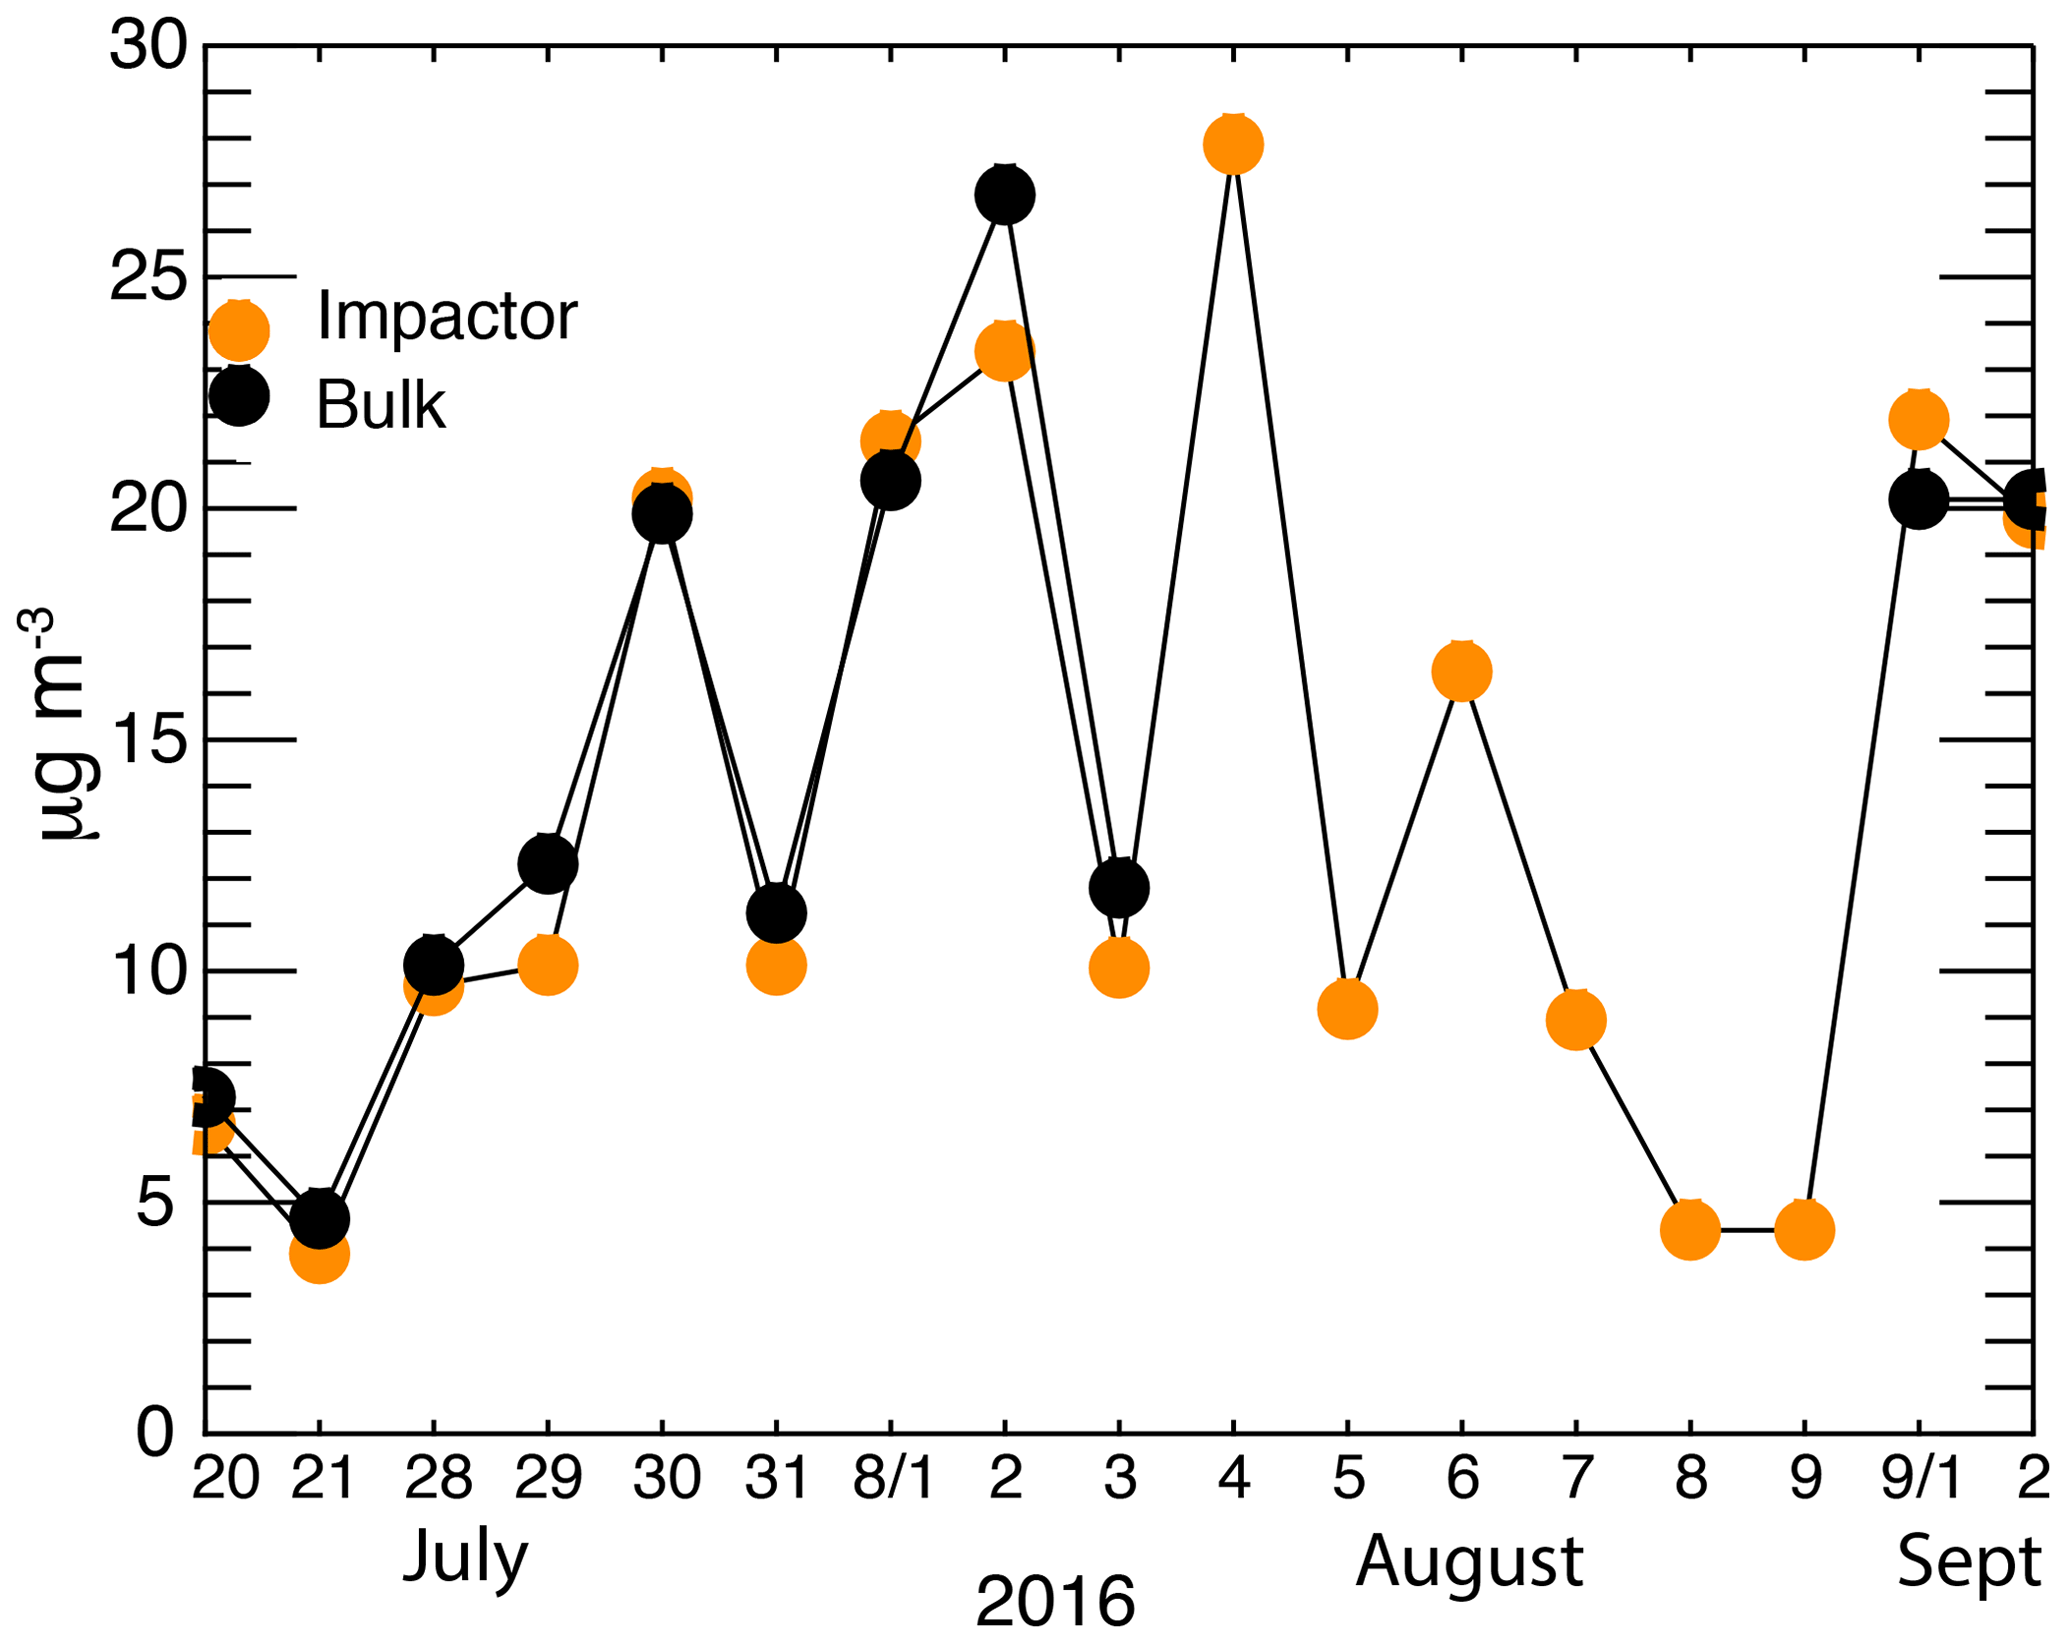
Figure 2Daily bulk filter dust mass concentrations (black-filled circles) and the sum of the impactor dust mass concentrations (orange-filled circles) for 20 July–2 September 2016 (17 d total). No bulk mass concentration data are available for 4–9 August. The statistically significant correlation coefficient of 0.98 is shown.
2.2 Scanning electron microscopy imaging
Scanning electron microscopy imaging is done on filters from 1 and 2 August 2016 to confirm the size of the largest dust particles and provide insight into the dust geometry. The imaging is conducted on a 1 cm by 1 cm area of the original filter. The samples are coated with palladium in a Cressington-108 sputter coater and imaged with a Phillips XL-30/ESEM-FEG at 20 kV and 1.6 nA at University of Miami's Center for Advanced Microscopy. The particle size is obtained using ImageJ (https://imagej.nih.gov/ij/, last access: 17 July 2020). The longest dimension is also referred to as the length (L). The aspect ratio is computed by dividing the L by the width (W) at the longest point that is perpendicular to L (Huang et al., 2020). The aerodynamic diameter (da) is calculated from the projected area diameter and the assumption that the particle is a sphere through the use of a volumetric shape factor, aerodynamic shape factor, and particle density from tables for specified oxides based on the chemical composition (Wagner and Leith, 2001; Ott et al., 2008).
2.3 Micropulse lidar
The MPL depolarization capability relies on a toggling between two modes using a polarizing beam splitter, with the ratio of the perpendicularly polarized to the parallel-polarized radiation at 532 nm wavelength forming the volume linear depolarization ratio (δv). δv can be used to distinguish round particles, such as liquid drops and marine aerosols, from particles with distinctive aspherical shapes such as dust. In the free troposphere, when dust is the dominant aerosol, the measured δv is almost entirely due to dust. For pure near-source dust, Freudenthaler et al. (2009) report a particle linear depolarization ratio (δp; this includes a correction for the measured molecular contribution) ratio of 0.31±0.03 at 532 nm. δp values for north African dust transported to the Caribbean can be slightly lower (0.30 within Burton et al., 2015, and 0.28±0.02 within Haarig et al., 2017), although not significantly so. A relatively consistent δp throughout transport to the Caribbean can reflect a lack of atmospheric processing (Denjean et al., 2015), in which the externally mixed dust particles may even increase in asphericity (Huang et al., 2020), although less is known of the chemical composition and shape of dust arriving in Miami via the Gulf of Mexico and subsequent eastward transport over the southeastern United States (Kramer et al., 2020a).
δv is a volume measurement, and when dust is mixed with other aerosols such as sea salt or sulfate, such as will occur in the boundary layer, the measured total δv values will be reduced. This can be understood through
where
and X is the dust's contribution to the backscattered radiation when no other depolarizing aerosols present (Sugimoto and Lee, 2006). The δp of marine salt is approximately 0.05 (Burton et al., 2012) or much lower than that of dust. δv values for north African dust after long-range transport range from 0.20 to 0.30 (Kanitz et al., 2014), attributed to mixing with other aerosols. Cloud particles, both liquid and ice, can be distinguished from dust by their higher volume backscatter intensities, with visual imagery from collocated cameras used to discriminate cloudy from cloud-free conditions (Delgadillo et al., 2018).
The Miami MPL was calibrated by the vendor, Sigma Space, prior to its delivery to Miami in 2013, and its calibration and overlap function were checked in 2016 using a mirror to horizontally send and receive the lidar laser beam through the atmosphere, on a day chosen for clear, horizontally homogeneous conditions. The correction for the near-field overlap occurring within the laser beam is most significant below 1 km (Delgadillo et al., 2018), and has less influence on measurements of free tropospheric aerosol. The depolarization ratio is not sensitive to the overlap correction. The lidar is kept in a temperature-controlled environment, which reduces fluctuations in the lidar backscatter-to-extinction ratio, and is located approximately 100 m away from where the filter measurements are made. Increases in the volume depolarization ratio from 2015 to 2016 coincide with the incorporation of a new laser diode pump in May 2016. This will increase the laser beam intensity, increasing the beam's ability to penetrate into the atmosphere, increasing the signal to noise of the signal in both channels (cross- and co-polarization) and ultimately increasing the δv value. As such, the volume depolarization ratios reported here serve more as a qualitative indicator for the presence of the dust than a quantitative measure, although more intense dust events are typically associated with higher-volume depolarization ratios (at the same laser intensity), consistent with a higher dust fraction.
The MPL measures a backscattered intensity, which can only be related to the more physically relevant aerosol volume extinction coefficient through a retrieval that is underconstrained. A sun-photometer-derived aerosol optical depth provides a vertically integrated constraint on the extinction retrieval (Delgadillo et al., 2018). The two sun photometers, located near the lidar on a rooftop of a three-story building, are part of the Aerosol Robotic Network (AERONET; Holben et al., 1998). The Miami sun photometer version 2 data were calibrated and cloud filtered (level 2) for 2015 and 2016. The retrieval also produces a column-average ratio of the backscattered intensity to extinction, known as the lidar ratio. This will also vary with particle size. Because the vertical column above the lidar also contains sea salt in the lower atmosphere, the column-average lidar ratio is not that of the dust in the free troposphere. Lidar ratios at 532 nm range from 40 to 60 sr for dust and 15 to 25 sr for sea salt (Burton et al., 2012); a column-average lidar ratio less than that appropriate for dust is consistent with an overestimate in the lidar-retrieved extinction. Optical properties of dust do not vary with relative humidity (Maring et al., 2003a; Denjean et al., 2015), but those for sea salt, a hygroscopic aerosol, will. We estimate the overall uncertainty in the retrieved lidar extinction conservatively with a factor of 3. The lidar vertical resolution is 30 m and the time resolution is 15 s (done to facilitate detection of the small cumulus clouds common to Miami).
2.4 GEOS-5 FP/MERRA-2
The GEOS-5 FP/MERRA-2 products are similar enough that they are used interchangeably within this study, reflecting their incorporation at different times of the study. Aerosol products from the operational GEOS-5 FP model are available at a 25 km grid spacing, slightly finer than the 50 km grid spacing of the global MERRA-2 reanalysis. The GOES-5 model possesses 72 vertical layers, of which the mid-level of the lowest layer is at approximately 69 m. The aerosol assimilation occurs eight times per day, and the output frequency of the full three-dimensional aerosol field is also every 3 h. We primarily consider the dust and sea salt contributions. The GOCART dust emission parameterization depends on a source function, the near-surface wind speeds, and soil moisture (Ginoux et al., 2001). The dust sizes, prescribed at emission, can evolve thereafter during transport, with sedimentation the primary process capable of altering the dust size distribution (the dust is non-hygroscopic). The parameterization of the dust mass distribution by size approximately follows that of Tegen and Lacis (1996) and contains five size categories, extending to a maximum diameter of 20 µm. These are indicated in Table 1 along with the density and mass extinction efficiency (ratio of extinction to mass) corresponding to each size category. Spheroidal particles are assumed, with more details on the dust parameterization available in Colarco et al. (2010).
The flux of sea salt off of the ocean surface is also parameterized into five size bins, but the size is allowed to vary with the surface wind speeds and sea surface temperature, and the sea salt can undergo hygroscopic growth as a function of the relative humidity. The sea salt parameterization is adapted from Gong (2003) and described further in Chin et al. (2002) and Bian et al. (2019).
The clear-sky τa values at a wavelength of 550 nm are primarily assimilated from the Moderate Resolution Imaging Spectroradiometer (MODIS) and secondarily the Multi-Angle Imaging SpectroRadiometer (MISR) satellite instruments (Randles et al., 2017). Data from the surface-based AERONET sites are no longer assimilated (Arlindo da Silva, personal communication), allowing the Miami sun photometer data to independently validate the GEOS-5 FP τa. The lowest model level is assumed to represent surface values. Inspection of the MERRA-2 and GEOS-5 FP dust and sea salt profiles for the cases shown in Fig. 11 revealed little difference between the two products.
2.5 HYSPLIT back trajectories
Daily average back trajectories explore the differences in the integrated air flow for days with high and low dust mass concentrations. The calculations rely on the NOAA Air Resources Laboratory Hybrid Single-Particle Lagrangian Integrated Trajectory (HYSPLIT) model (Stein et al., 2015). These extend for 300 h (12.5 d) and are driven by the NCEP reanalysis Climate Diagnostics Center-1 product. Each day's trajectory is initialized at 00:00 Z and at an altitude of 2000 m. This is a robust height for the presence of dust above Miami, as indicated later. There is some evidence that the NCEP reanalysis lower tropospheric winds may be weaker than observed (e.g., Adebiyi et al., 2015), which would increase the transport time, but this is not investigated further for this study.
A time series of the primary measurements displays the daily surface-based filter-derived dust mass concentrations and the corresponding vertical structure as captured by the lidar volume depolarization ratio, for each of the three dust seasons (Fig. 3). The lidar measurements indicate that dust is often prevalent in the boundary layer, typically extends up to 2–3 km, and occasionally rises above 4 km but not above 5 km. The depolarization ratios indicate that when dust is present, it is typically also present within the boundary layer. This is corroborated by the filter measurements; only during mid-to-late August 2015 is no dust detected within the atmospheric column by either the filters or the lidar. The synoptic and year-to-year variability is clear, with the highest dust mass concentrations occurring on just a few select days of each summer. In 2014, these occur in August, and in 2015 and 2016, during July, dominating the monthly means for those years. Less dust in June than July, in contrast to Barbados (Zuidema et al., 2019), reflects more strongly zonal flow in June (Kramer et al., 2020a), while the decrease in August can also reflect increased removal by precipitation en route (van der Does et al., 2020).

Figure 3Time series of the MPL volume linear depolarization ratios for June–September 2014, 2015, and 2016, interspersed with the corresponding time series of the daily filter-retrieved bulk dust mass concentrations (units of µg m−3 d−1). Subjectively determined dates of the first and last days with significant dust are indicated within the lidar panel titles. Monthly mean surface dust mass concentrations (units of µg m−3) are indicated for each month.
The back trajectories indicate the crucial role of the North Atlantic subtropical high in guiding the atmospheric flow towards Miami (Fig. 4a–c), explored further in Kramer et al. (2020a). Many back trajectories intersect the north African coast, with few continuing further eastward over the African continent. This may indicate a strong influence from the northerly coastal flow on the eastward side of the North Atlantic subtropical high. The HYSPLIT back trajectories disregard explicit mixing with environmental air, but a back trajectory with a large meridional component would imply more mixing of the dusty air with air emanating from the northeast Atlantic and Europe. The separate influence of African versus Atlantic air on Miami and Caribbean thermodynamic profiles is also noted in Dunion (2011).
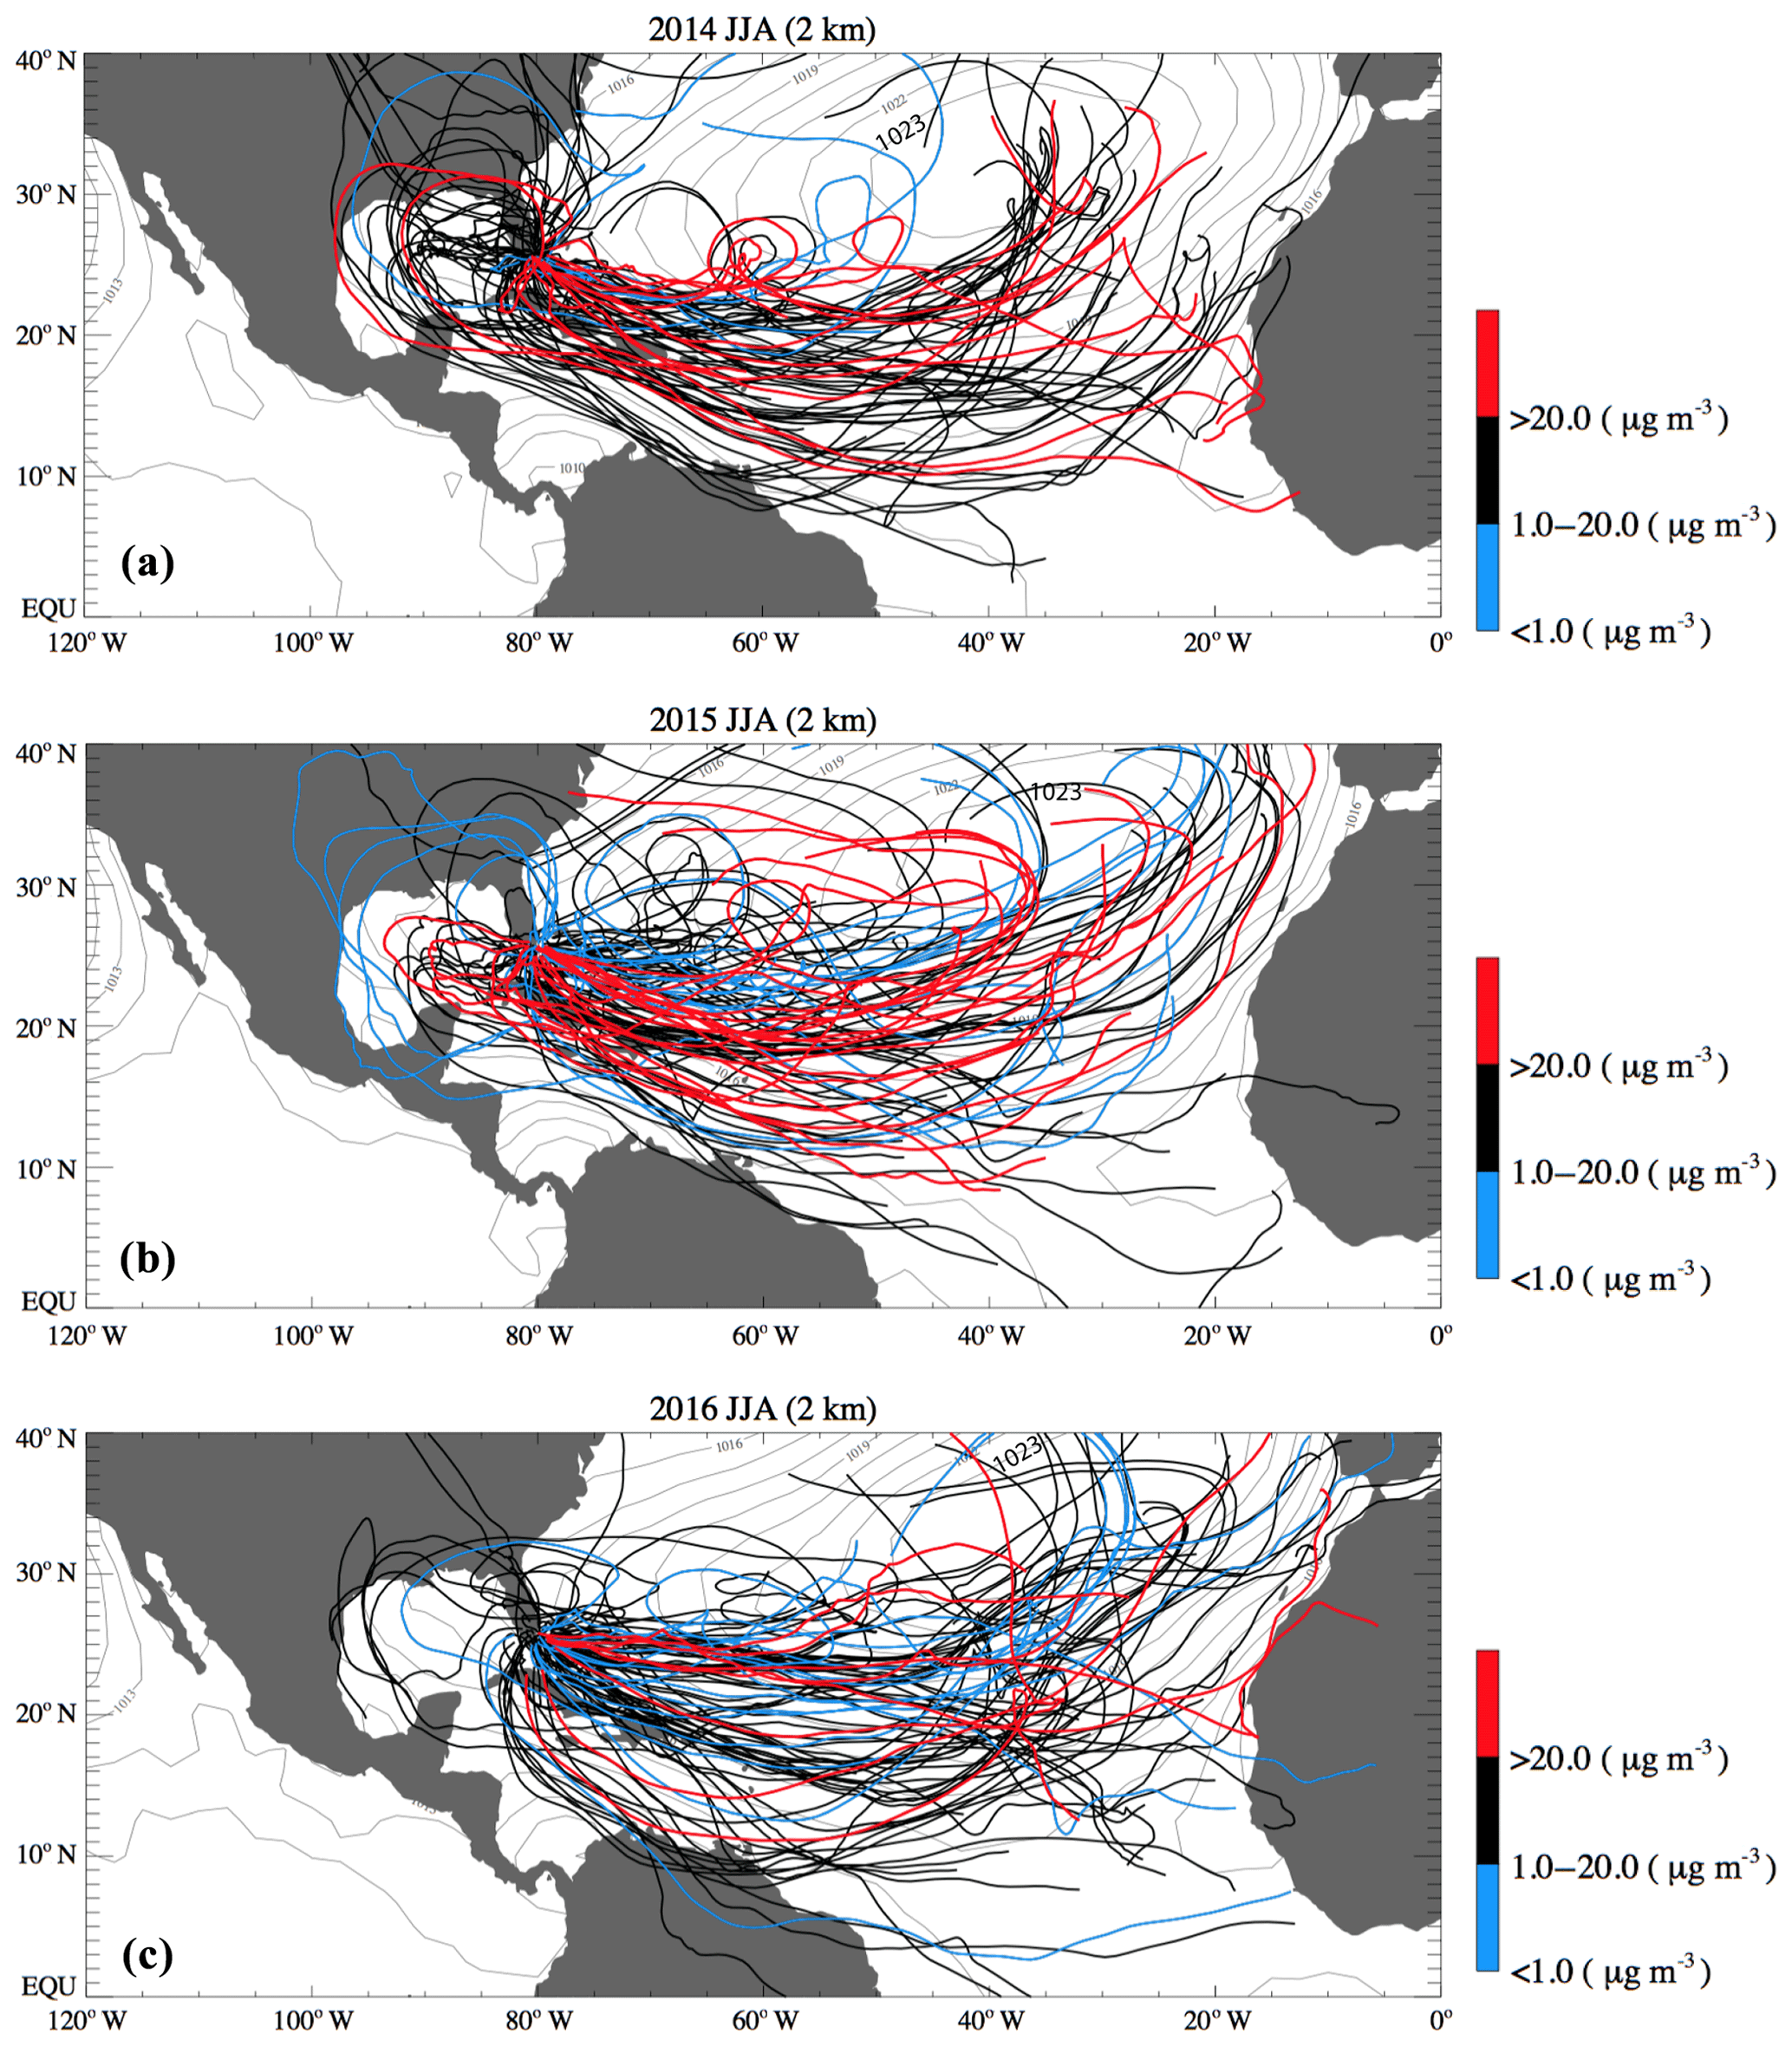
Figure 4Daily HYSPLIT back trajectories for June–August of (a) 2014, (b) 2015, and (c) 2016, extending for 300 h and initialized at a height of 2 km above sea level, with the average seasonal NCEP reanalysis sea level pressure (grey contours). Back trajectories are color coded by the dust mass concentrations measured in Miami: initially exceeding >20 µg m−3 (red), 1–20 µg m−3 (dark blue), and <1 µg m−3 (light blue).
After 12 d, the integration confidence in the trajectories leading to the original location of air parcel is debatable; therefore, we focus more on the trajectory characteristics over the Atlantic. Back trajectories associated with days with dust mass concentrations exceeding 20 µg m−3 are typically more zonal, suggesting less mixing with air originating from the northeastern Atlantic. Back trajectories associated with days with high dust mass concentrations also have a slight preference for a more northerly location. This may indicate less aerosol removal by precipitation en route (the northern boundary of the June–August intertropical convergence zone is at approximately 10∘ N). A notable feature of the back trajectories on days with low (<1 µg m−3) and moderate (1–20 µg m−3) dust mass concentrations in Miami is a less direct transport of dust, with the back trajectories passing over the Gulf of Mexico and then recirculating back to Miami via the lower southeastern United States. This is most evident in 2014 and 2015. This transport pathway is effective at dispersing dust over large areas of southeastern United States, and increases the likelihood of dust interacting with other terrestrial and anthropogenic aerosols en route.
4.1 Aerosol optical depth
The GEOS-5 FP τa values (at 550 nm wavelength) slightly exceed those from the sun photometers (at 500 nm) at optical depths below 0.15, and are slightly less for τa>0.15 (Fig. 5). The slight underestimation at higher τa has previously been attributed to missing emissions (Buchard et al., 2017; Shi et al., 2019). It is also apparent in a comparison of MERRA-2 τa to shipborne τa observations (Fig. 9 of Randles et al., 2017). Surface albedo inhomogeneities at this coastal location could perhaps contribute to the overestimate at the lowest τa, although another interpretation, shown next, is that an overestimate from the sea salt contribution becomes most apparent at the lowest τa. An implication of the positive correlation (coefficient of 0.80), overall, is that the AERONET cloud screening is effective. Although not shown, the day-to-day variations in τa match well, as would be expected given the assimilation and availability of satellite-derived τa.
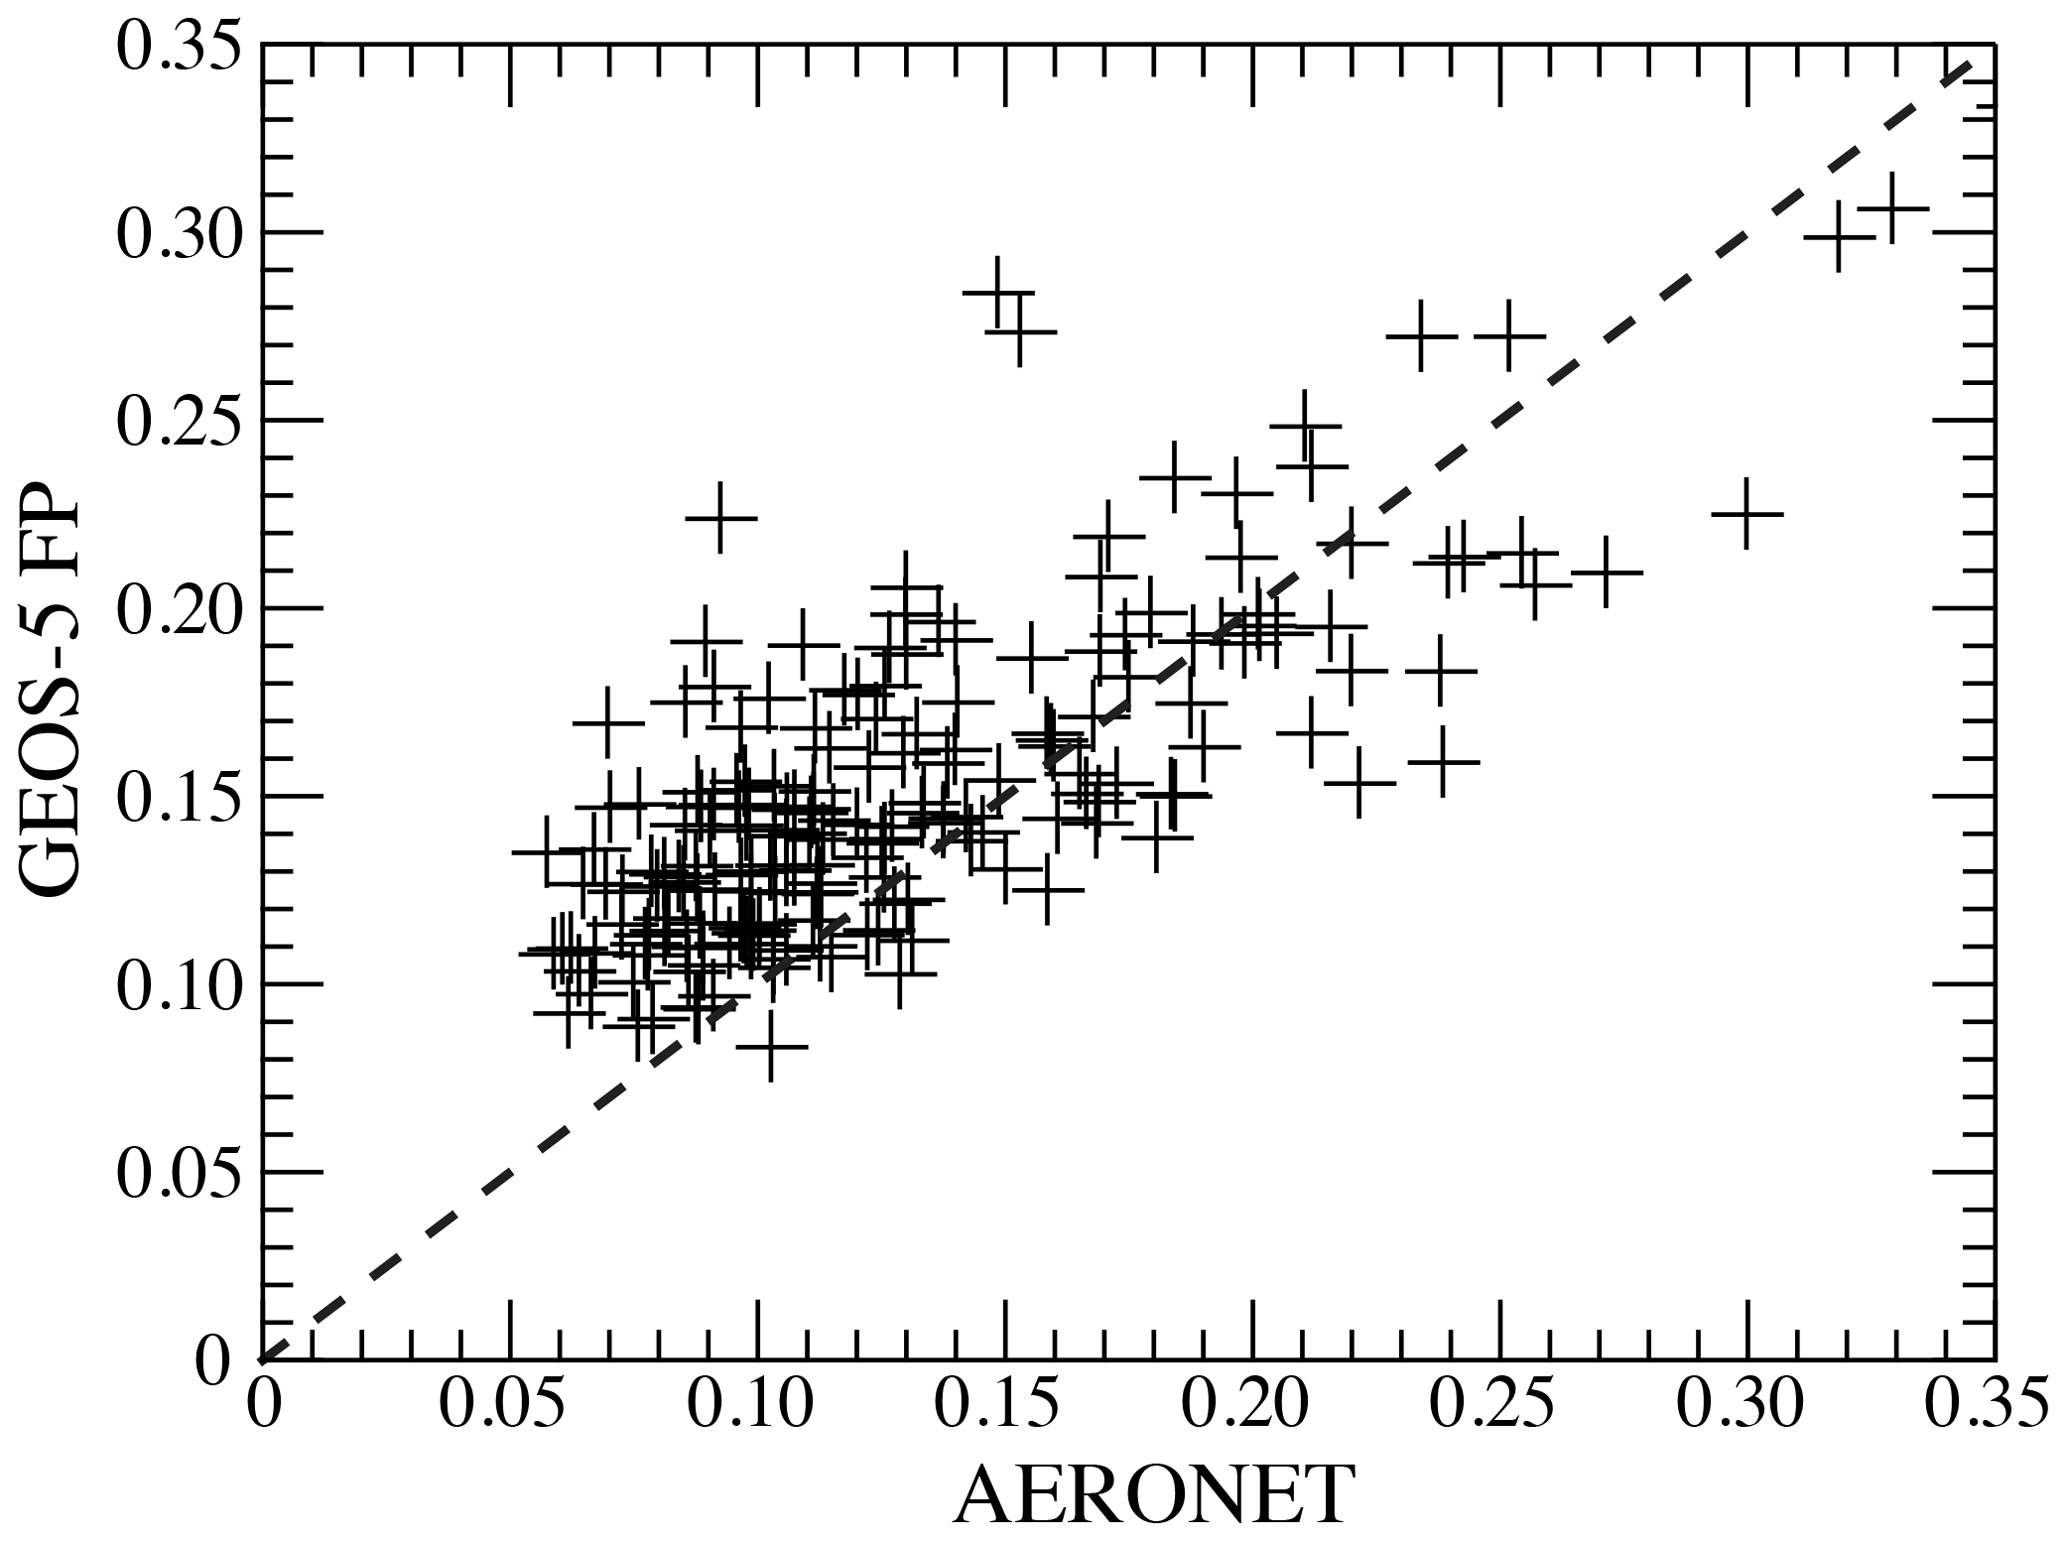
Figure 5Daily mean GEOS-5 FP aerosol optical depths τ550 versus AERONET-derived values τ500 (level 1.5 version 2) at 500 nm wavelength for June–September 2015 and 2016. A correlation coefficient of 0.80 is shown.
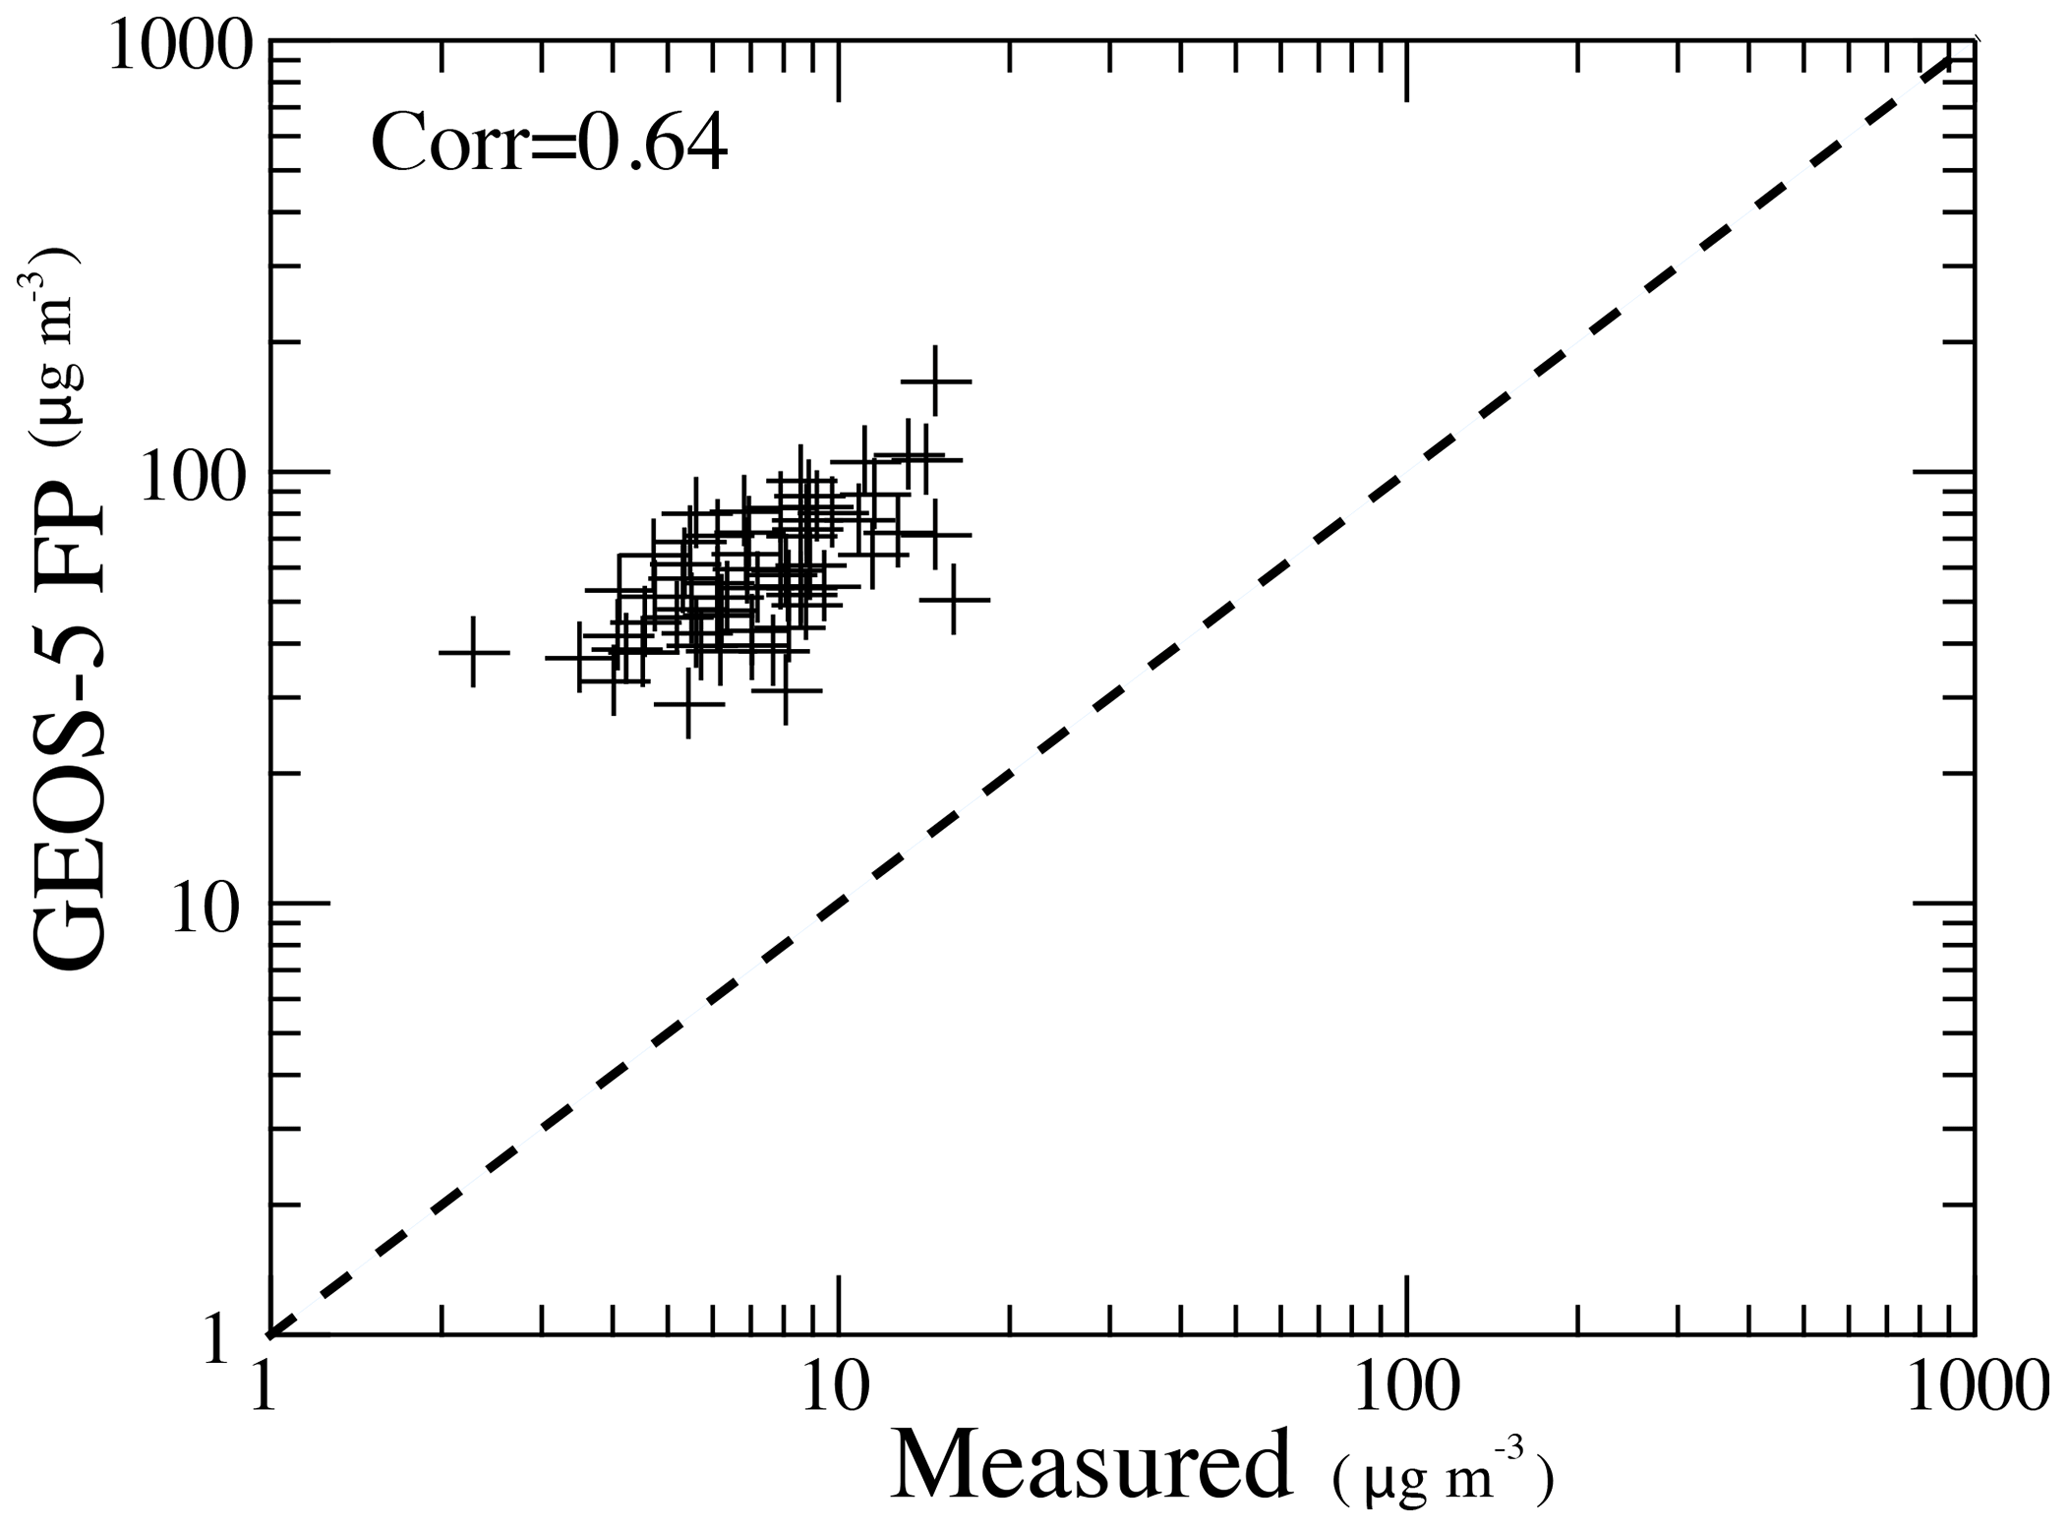
4.2 Surface sea salt mass concentrations
A first step within the assimilation scheme is the aerosol speciation, and how much of the aerosol is partitioned into sea salt will also affect the amount available for dust. The GEOS-5 FP aerosol product overestimates the near-surface salt mass concentration by an order of magnitude, with a model mean value of 61 µg m−3 versus a measured mean salt mass concentration of 7.7 µg m−3 estimated from the sodium measurements (Fig. 6). The latter is consistent with previous measurements (Savoie and Prospero, 1982; Prospero, 1999a). Further assessment of the GEOS-5 wind speeds and relative humidity using surface meteorological data indicate that these are realistic (not shown), suggesting that the underlying size and/or light extinction parameterizations may be the issue. This is consistent with the findings of Bian et al. (2019), in which an inconsistency between an overpredicted salt mass concentration and underpredicted τseasalt in GOES-5 simulations is reconciled through the model adoption of too-large sea salt sizes. As noted by Buchard et al. (2017), the assimilation of aerosol optical depths that exceed those forecast can further exacerbate the discrepancy.
4.3 Surface dust mass concentrations
All else equal, an overestimate of the GEOS-5 FP sea salt mass concentrations might point to GEOS-5 FP dust mass concentrations that are too low, for the same assimilated aerosol optical depth. Instead, the GEOS-5 FP near-surface dust mass concentrations also exceed observed values on almost two-thirds of the days, for a mean bias of 3.46 µg m−3 (Fig. 7). This overestimation is not as pronounced as that for sea salt. A clear correlation (value of 0.63) is apparent, matching that reported in Buchard et al. (2017) based on Barbados measurements; Buchard et al. (2017) did not find a bias between MERRA-2 and the Barbados dust mass concentrations. GEOS-5 FP approximately captures the monthly evolution from July to September, although the GEOS-5 FP overestimate is most pronounced for June, when it is enough to alter the perception of the monthly evolution (i.e., the GEOS-5 FP maximum in 2014 and 2016 occurs in June, in contrast to a July (August) maximum in the observations). The cause for this is unclear.
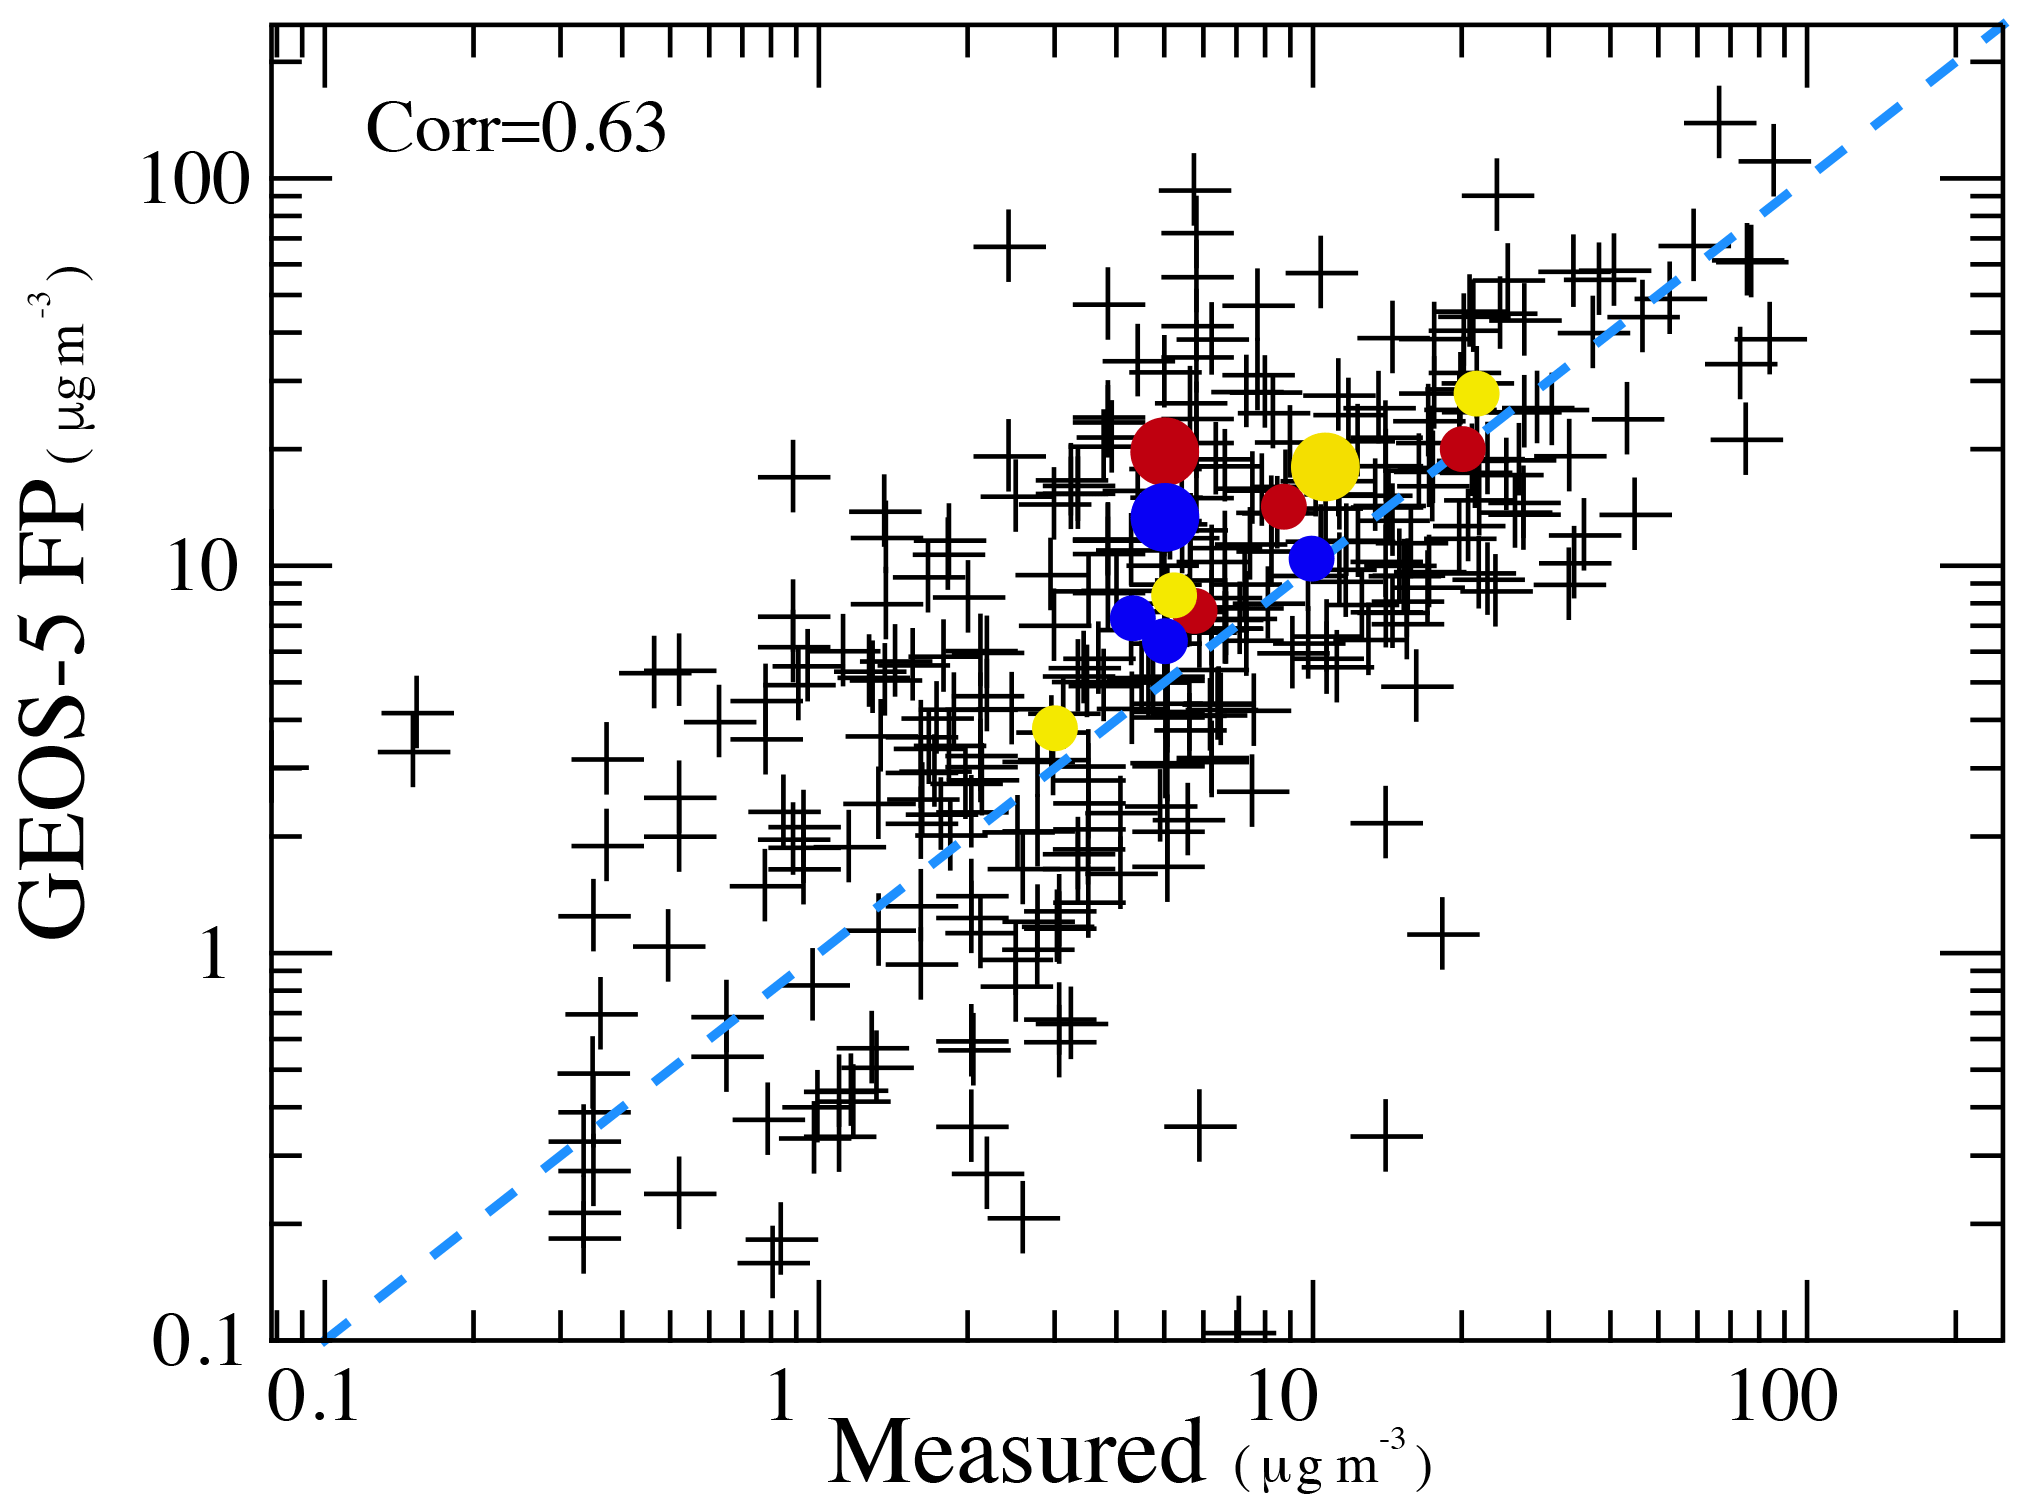
Figure 7Daily mean GEOS-5 FP versus measured near-surface dust mass concentrations for June–September from 2014 to 2016 (366 d), with monthly mean values superimposed for 2014 (dark red), 2015 (dark yellow), and 2016 (blue); a larger filled circle highlights June. The y=x line is indicated. A correlation (in logarithmic space) of 0.63 is shown.
The model overestimate in the surface dust mass concentrations has consequences for inferences of the frequency of high and low dust loading days (Fig. 8). Measured dust mass concentrations exceeding 40 µg m−3 or less than 1 µg m−3 were infrequent, with dust present in the Miami boundary layer at concentrations between 1 and 10 µg m−3 over one-half of the time. In contrast, GEOS-5 FP include more days with concentrations exceeding 10 µg m−3 than are observed, and correspondingly fewer days with concentrations between 1 and 10 µg m−3. GEOS-5 FP overall places too much dust in the boundary layer. The consistent presence of dust in the boundary layer in and of itself is not controversial; see Reid et al. (2002), for example, as well as Fig. 3.
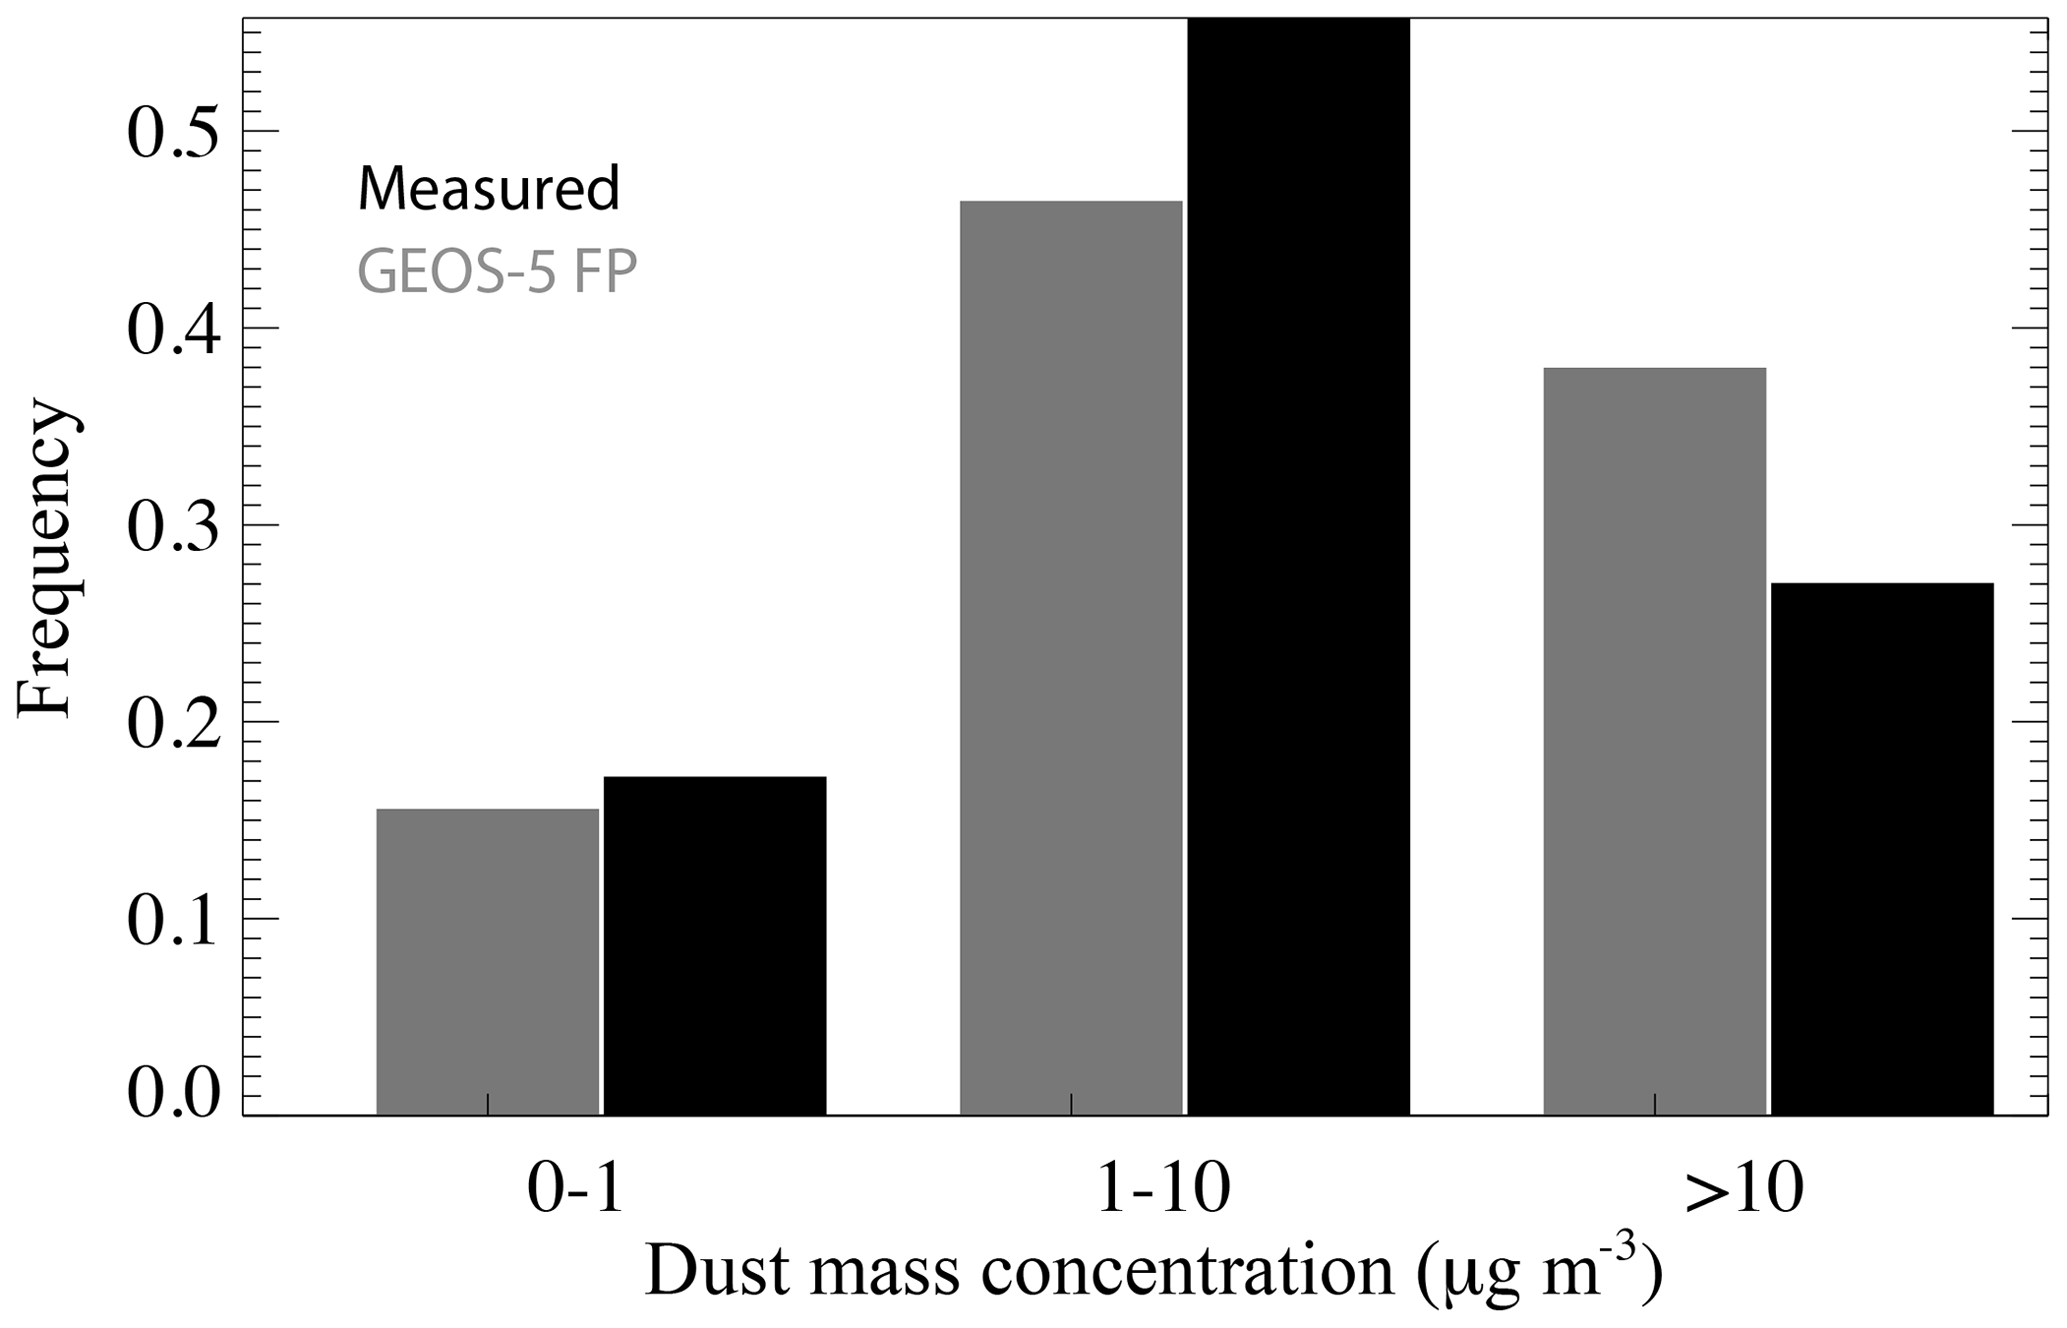
Figure 8Frequency of days with measured (black) and model (grey) daily mean dust mass concentrations in three diameter bins, based on 366 d from June to September 2014–2016.
4.4 Does dust size explain the difference between the GEOS-5 FP/MERRA-2 and measured dust mass concentrations?
The use of a size distribution parameterization that permits a larger mass for the same visible extinction (as is thought to occur for sea salt; Bian et al., 2019) is one explanation for why the MERRA-2 dust mass concentrations near the surface may exceed those observed, despite realistic assimilation-constrained aerosol optical depths. This idea is assessed using the size-resolved dust mass concentrations from 17 d in 2016. The 28 July to 9 August time period included one of the heaviest and longest dust mass concentration events from 2016, and data from another dust event spanning 1–2 September are also included. The trajectories for these days indicate direct dust transport from northern Africa. The subtropical high was strongest and located furthest north in 2016 of the 3 years considered, based on the 1023 hPa sea level pressure contour (Fig. 4). This may have decreased dust transport that year (Kramer et al., 2020a), resulting in relatively fewer days with dust exceeding 20 µg m−3 for that year. The episodic-maximum dust mass concentration of 28 µg m−3 occurred on 4 August 2016 (Fig. 2). The days with the largest size particles (30 July, 2 and 4 August) correspond to high-lidar-volume depolarization ratios and larger total bulk surface dust mass concentrations (Fig. 3).
The comparison is eased by first estimating the geometric diameter corresponding to the measured aerodynamic particle diameter, and thereafter normalizing both size-resolved dust mass concentrations into diameter bins with a 2 µm width (Fig. 9). The measurements place approximately two-thirds of the total dust mass concentrations in particles with geometric diameters <2 µm, with the presence of some larger particles resulting in a mass-weighted mean measured diameter of 3.0 µm. In contrast, GEOS-5 FP places approximately one-fourth of the dust into diameters <2 µm and approximately 45 % into the 2–6 µm diameter range, with almost no mass in larger diameters. The GEOS-5 FP mass-weighted mean diameter is thus larger than observed, at 3.9 µm. An important caveat with the cascade impactor measurements is that the larger dust particles are less likely to be captured (Li-Jones and Prospero, 1998; J. S. Reid et al., 2003a), with other studies concluding that one-third to one-half of the total dust mass is in diameters <2 (or 2.5) µm (Perry et al., 1997; Li-Jones and Prospero, 1998; Prospero et al., 2001).
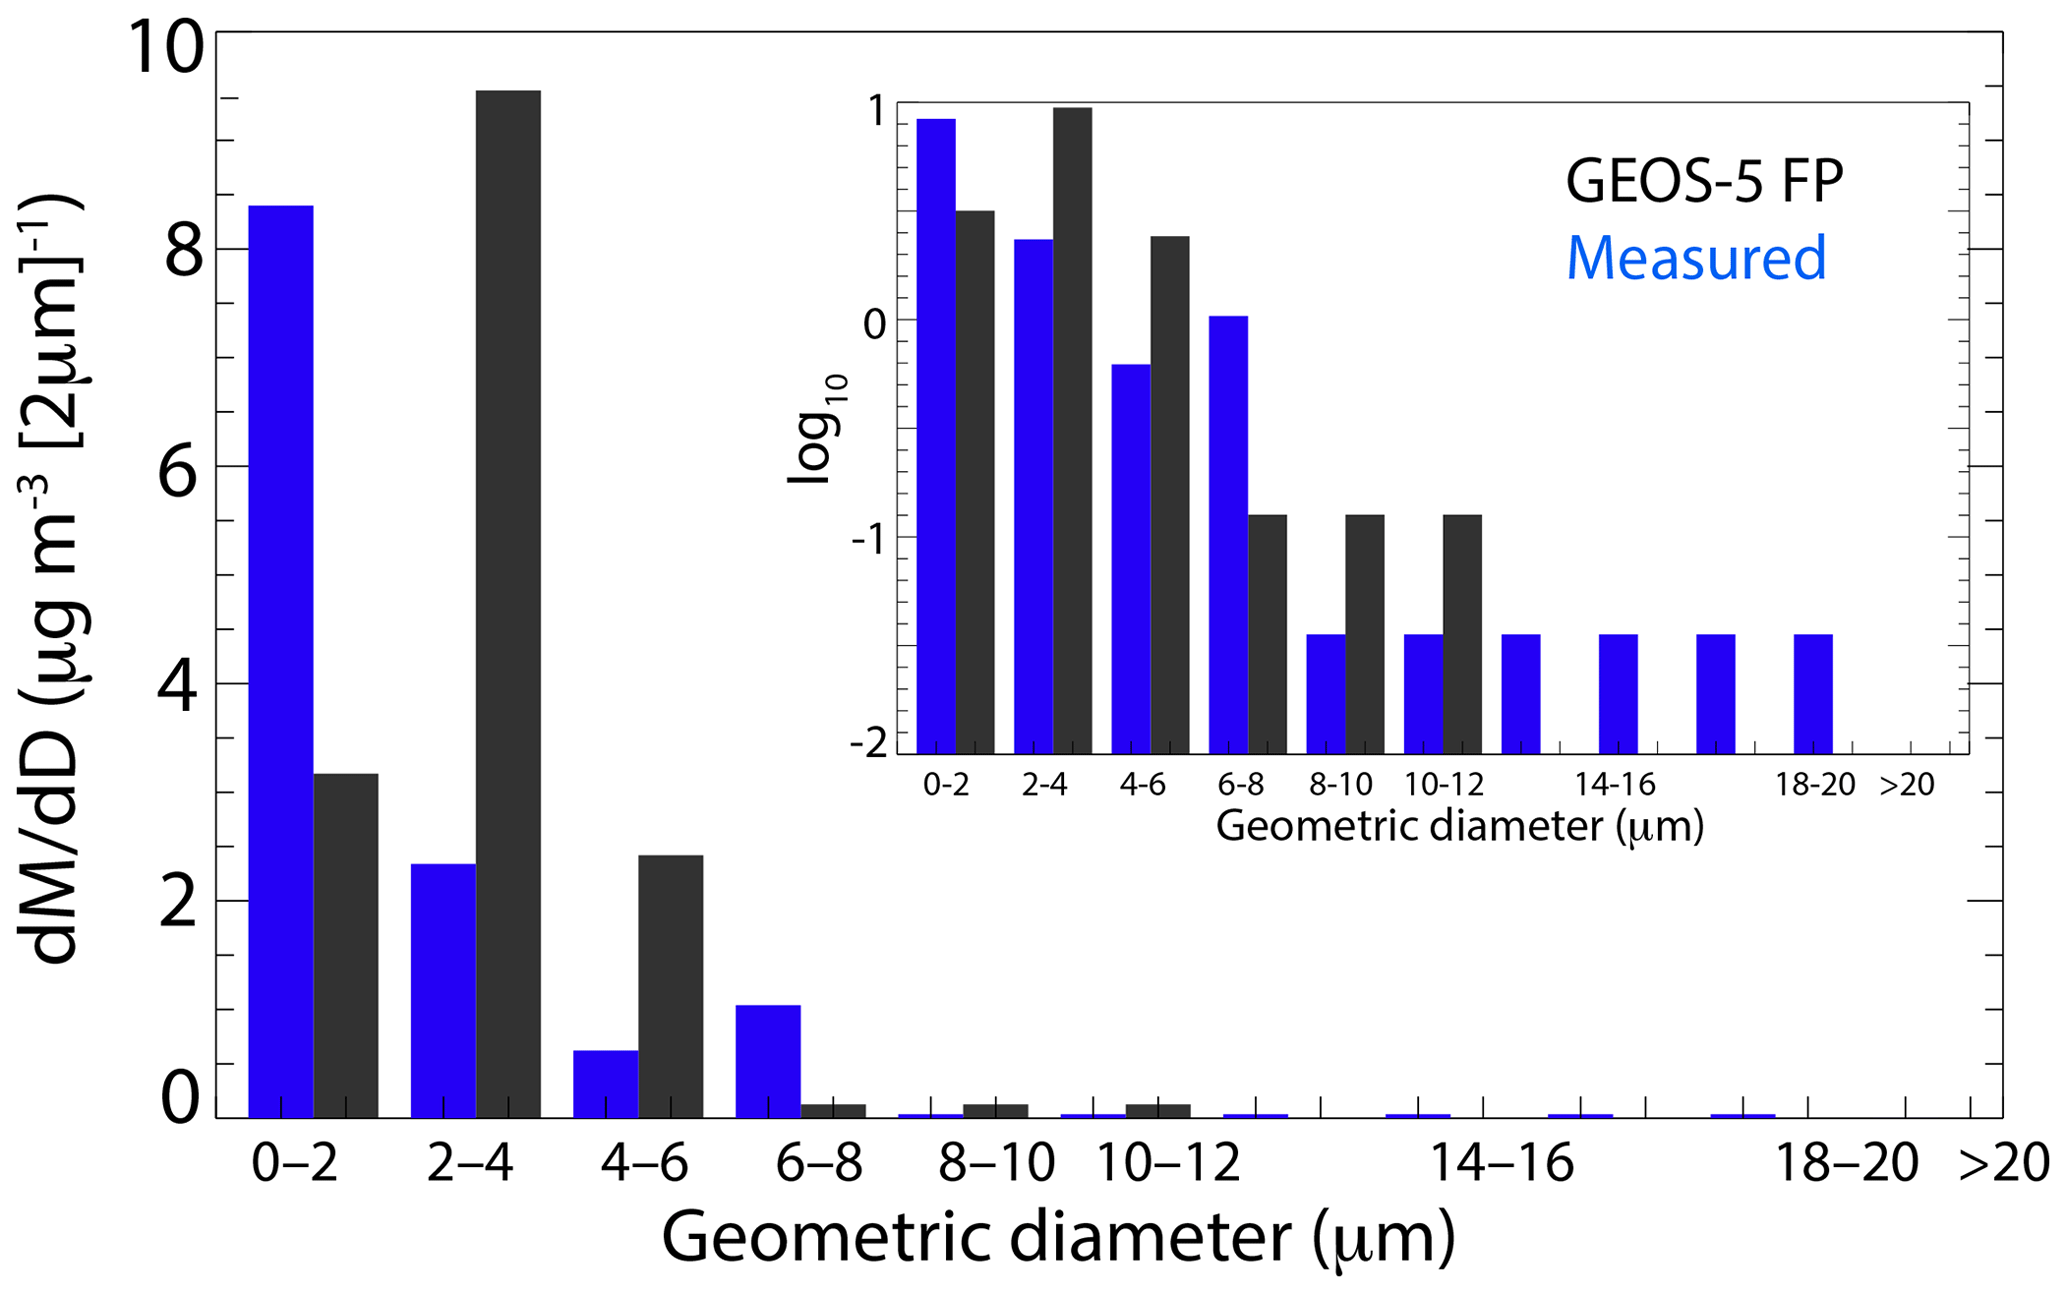
Figure 9The 17 d average dust mass concentration per (2 µm)−1 geometric diameter bin from measurements (blue) and GEOS-5 FP (black).
Even with a relative potential overestimation of the smaller particle sizes, the enhanced ability of particles with diameters <2 µm to scatter sunlight, indicated by mass extinction efficiencies that exceed by at least a factor of 3 those for larger particles (Table 1), implies that more mass is required to produce the same extinction for larger particles than for smaller particles. Figure 9 indicates that one cause for the overestimated near-surface dust mass concentrations in GEOS-5 FP above southern Florida may be a dust size parameterization that distributes more of the dust mass into a larger size, for which the mass extinction efficiency is lower, than is observed.
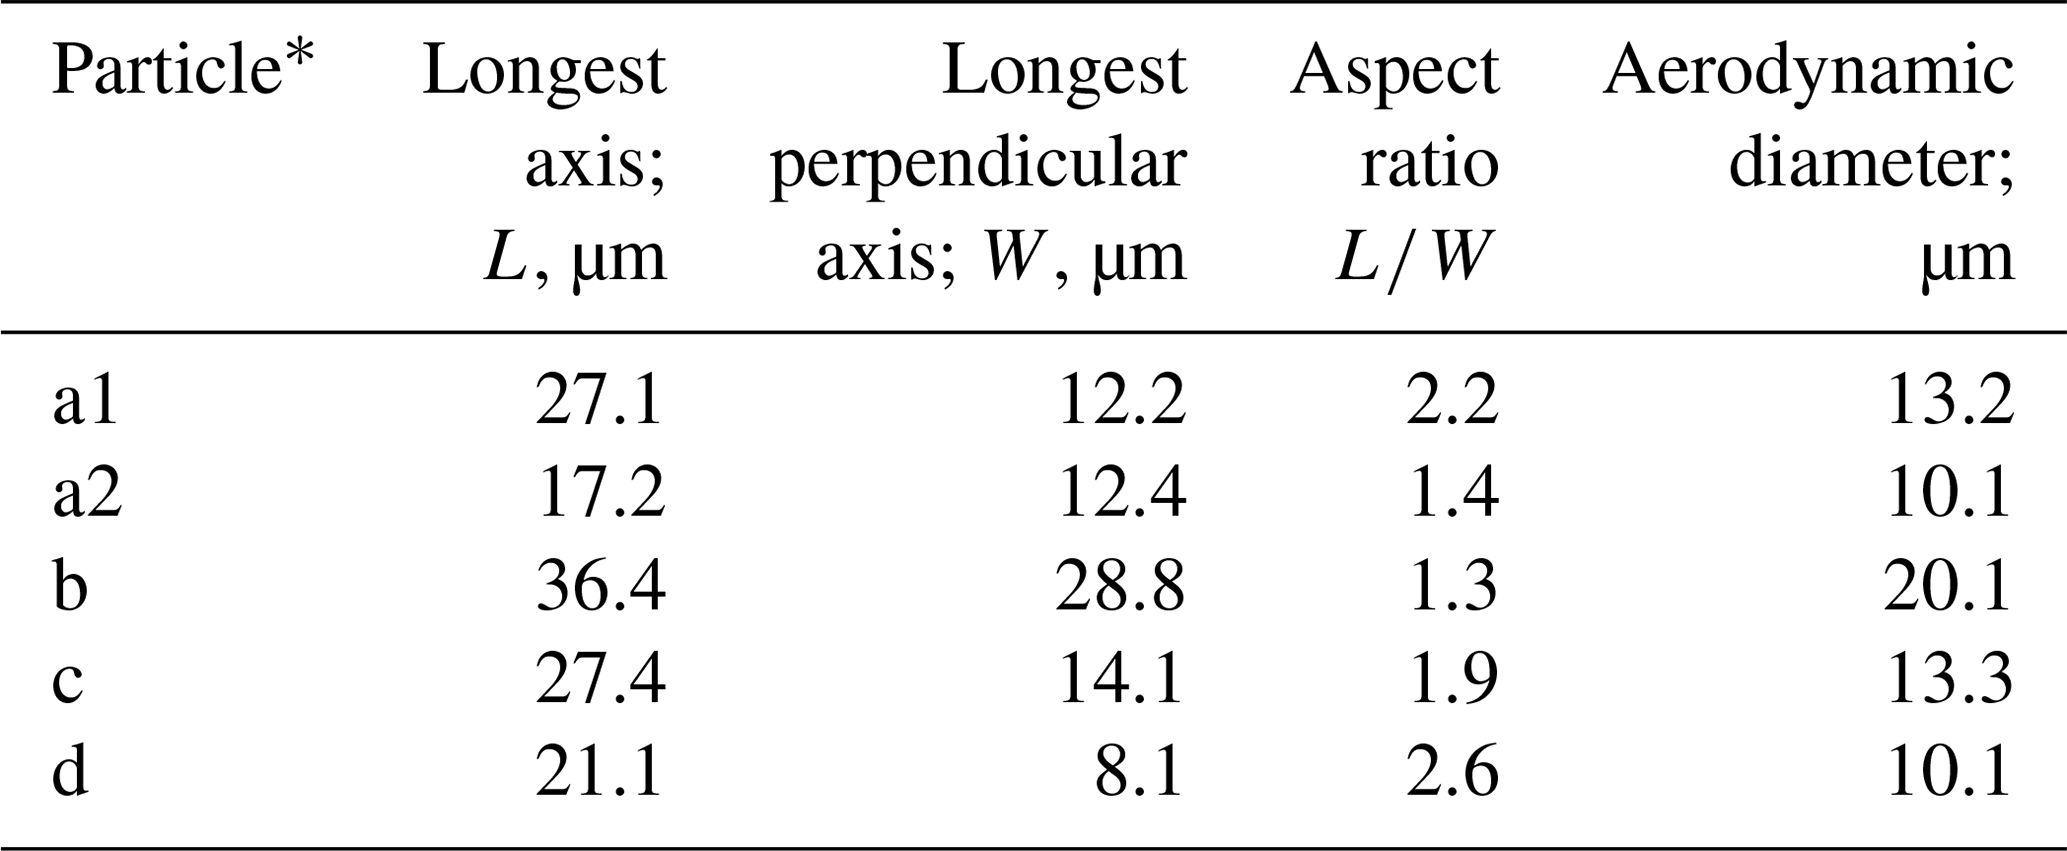
As highlighted by the inset in Fig. 9, in which the size-resolved dust mass distributions are shown on a logarithmic scale, more of the measured mass is contained in particles with diameters >6 µm than in the model (10 % versus 4 %). An underestimation of the largest dust sizes in global models and its implications has been examined in Adebiyi and Kok (2020) and references therein. Filters from 1 and 2 August indicate mass from particles with diameters >10 µm, and these were interrogated further with scanning electron microscopy to independently corroborate the particle size (Fig. 10). Four of the five examples include a dimension exceeding 20 µm (see Table 2 for dimensions of each identified particle), with the largest particle measuring 36.4 by 26.8 µm (Fig. 10b). The aerodynamic diameters (da) confirm that the appropriate impactor stage is indeed collecting particles with da>10 µm (See Table 2). The particles are highly aspherical, with aspect ratios ranging from 1.36 to 2.6. Although these are only five samples, their mean aspect ratio of 1.9 is equal to the median calculated from almost 78 000 samples gathered in Puerto Rico (E. A. Reid et al., 2003; J. S. Reid et al., 2003a; Huang et al., 2020). This asphericity will contribute to the survival of the particles, as aspherical particles fall at slower terminal speeds than spheres of equivalent mass (Yang et al., 2013; Huang et al., 2020). These observed dust particles exceed the GEOS-5 upper limit of a 20 µm diameter. However, only 0.45 µg m−3 of the total measured dust mass concentration (approximately 3 %) is contained in particles with diameters exceeding 10 µm, implying that the neglect of particles with diameters >20 µm by GEOS-5 FP only results in a small error in the total dust mass concentration after such long-range transport.

Figure 10Scanning electron microscopy images of filter samples from (a, b) 1 August 2016 and (c, d) 2 August 2016. Individual particle dimensions are shown in Table 2. The cellulose filter fibers used for collection are visible in the background behind each particle.
4.5 Dust vertical structure
The extinctions corresponding to the GEOS-5 FP dust mass mixing profiles, estimated using the mass extinction efficiencies specific to each size range (Table 1), can be assessed using extinctions retrieved from the lidar backscattered intensities (Delgadillo et al., 2018). This is similar to the strategy invoked within Liu et al. (2012) for comparison between space-based lidar extinctions and GEOS-5 dust mass loadings, using a mass extinction efficiency of 0.7 m2 g−1, and Sauter et al. (2019) (who use a smaller value of 0.4 m2 g−1, implying larger particles). Four examples, spanning the 28–30 July 2016 dust event and that of 5 August 2016, are shown in Fig. 11. The AERONET-derived τa from the early morning, overlapping with 12:00 UTC, indicates values of 0.1–0.2, with the highest aerosol loading occurring on 29 July 2016.
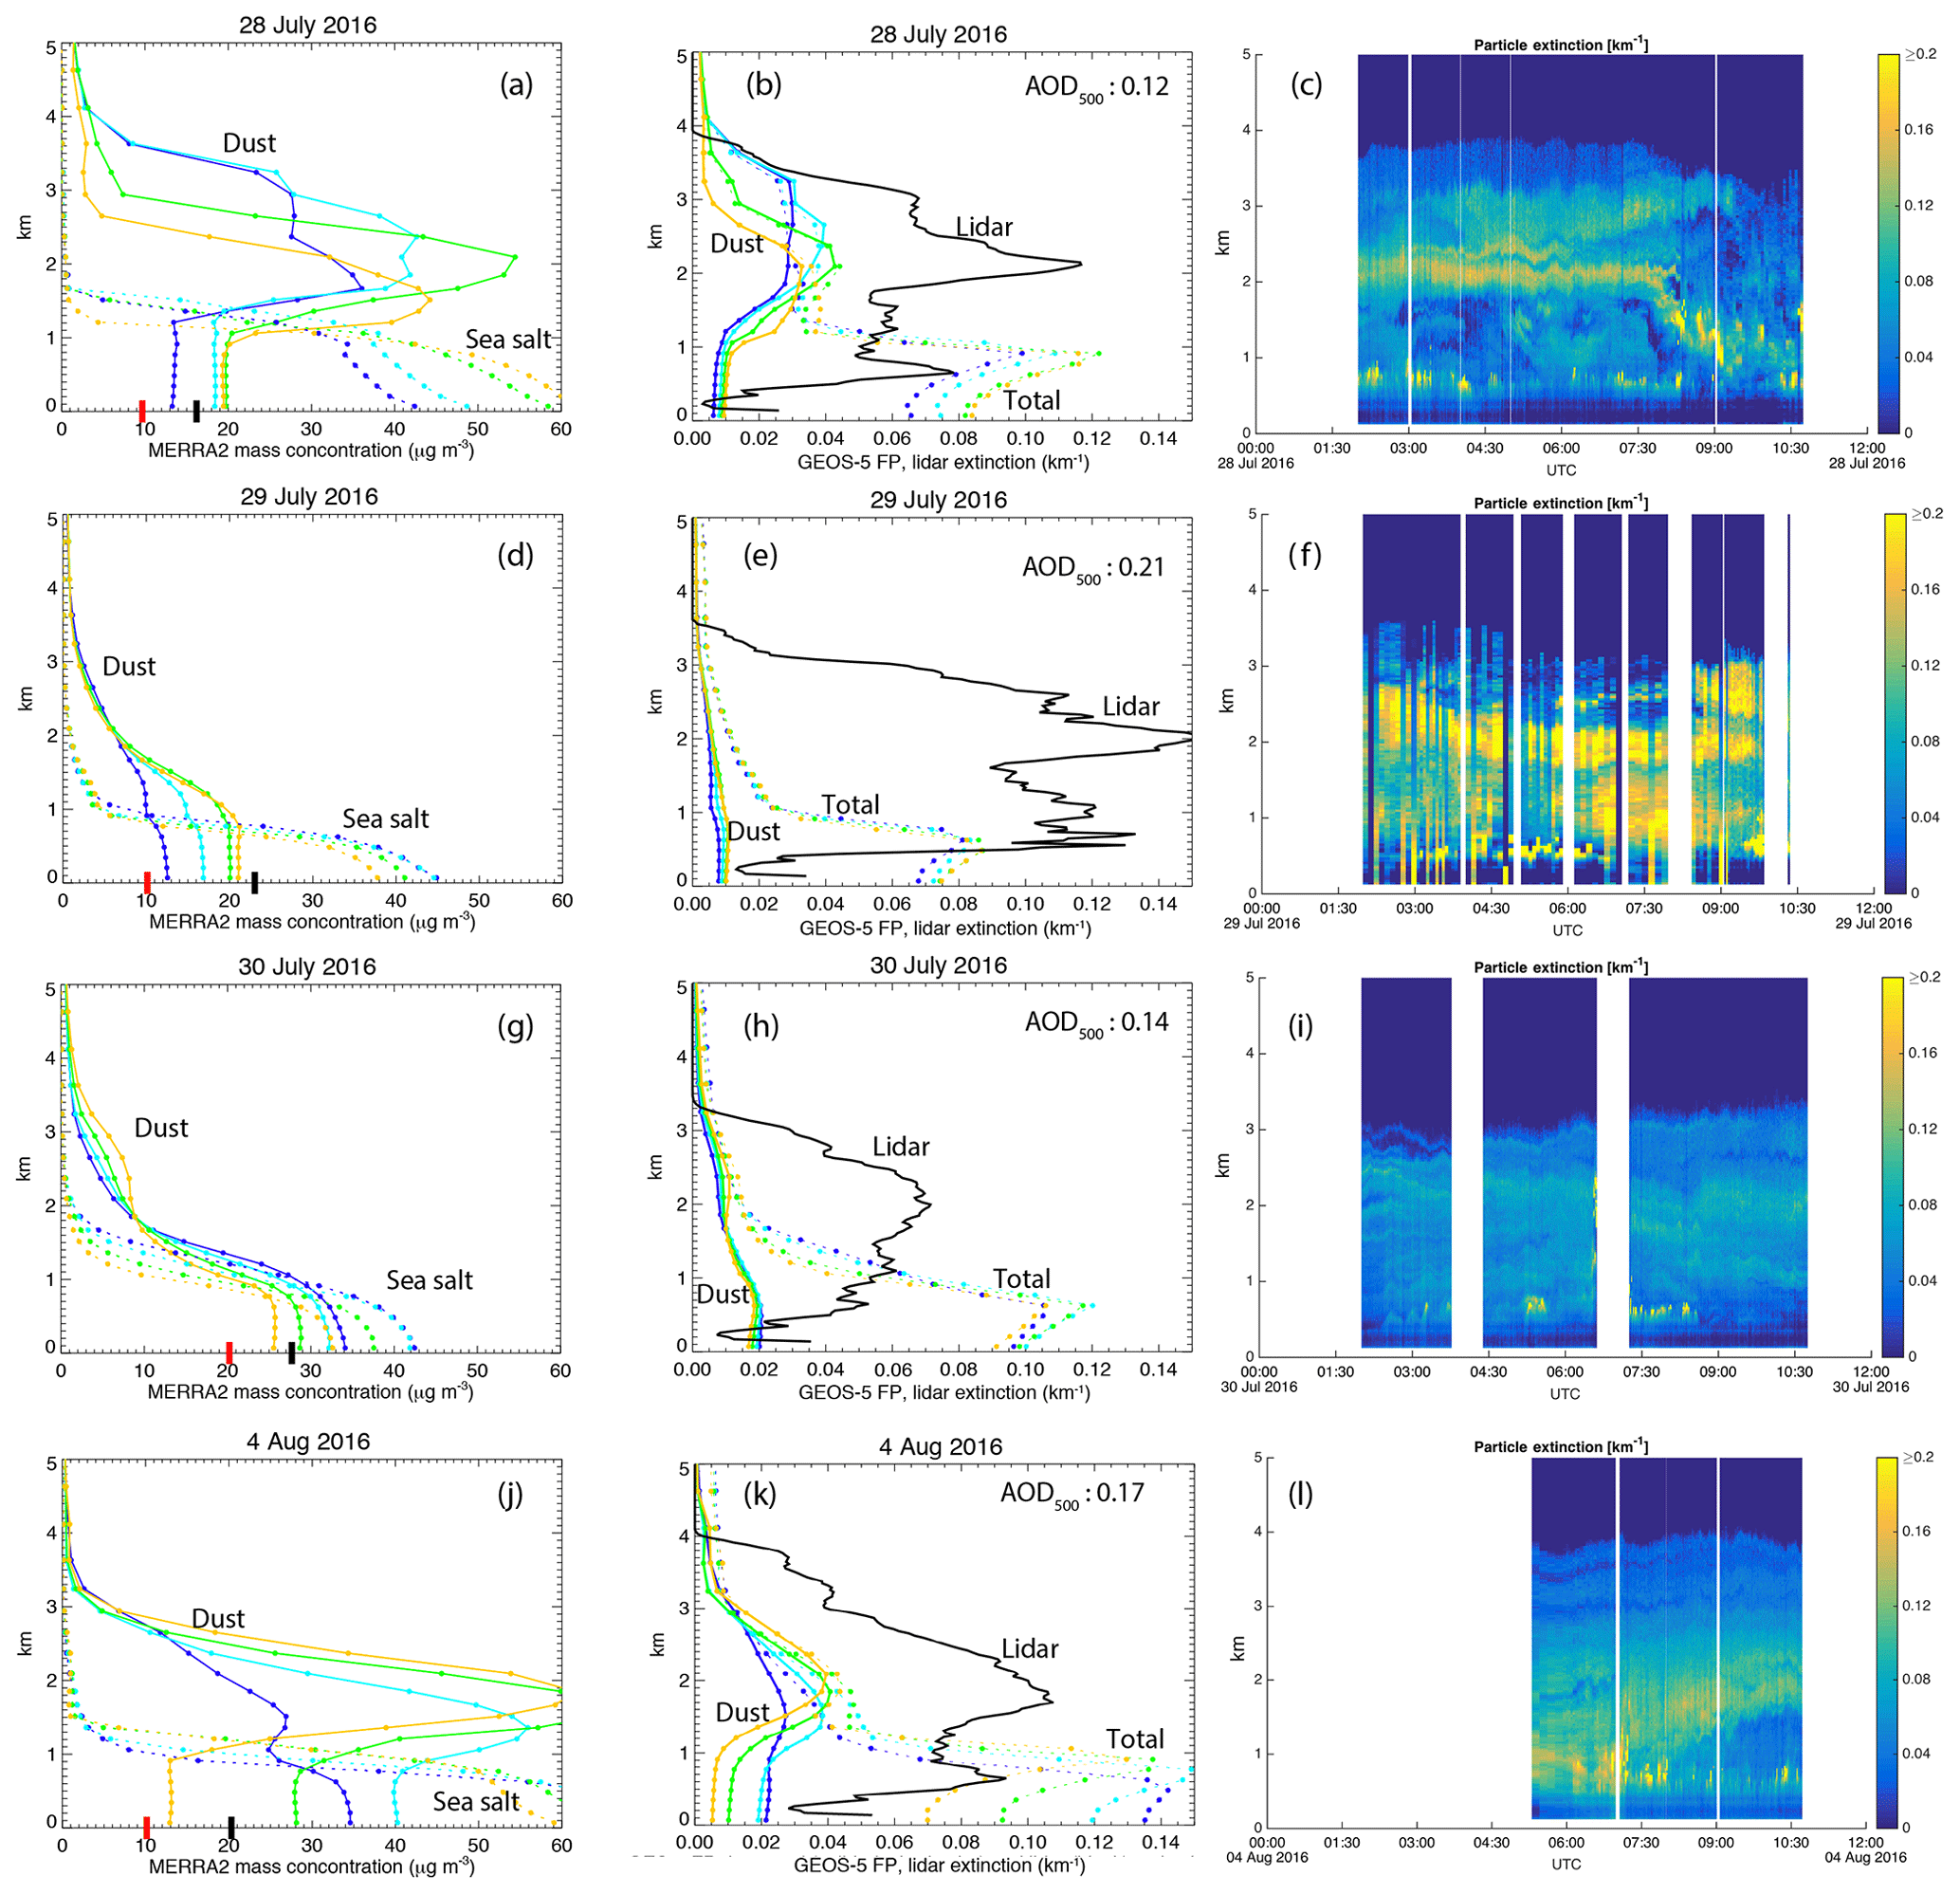
Figure 11(a) MERRA-2 dust (solid) and sea salt (dashed) mass concentrations for 28 July 2016 03:00–12:00 UTC (dark blue, light blue, green, and yellow lines indicate 03:00, 06:00, 09:00, and 12:00 UTC, respectively), with surface model (black) and impactor (red) total dust mass concentrations included as thick vertical lines. (b) GEOS-5 FP dust (solid) and total (dashed) volume extinction coefficients for 28 July 2016 03:00–12:00 UTC (same labeling scheme as in panel a) and the lidar-derived volume extinction coefficient profile averaged over cloud-free portions (determined visually from camera imagery) of 28 July 02:00–11:00 UTC (black). The average 11:00–13:00 UTC AERONET-derived aerosol optical depth at 500 nm is indicated. (c) 28 July 2011 UTC lidar-derived volume extinction coefficient time series. (d–f) Same as panels (a)–(c) but for 29 July 2016. (g–i) Same as panels (a)–(c) but for 30 July 2016. (j–l) Same as panels (a)–(c) but for 5 August 2016. 00:00–12:00 UTC corresponds to 19:00–07:00 LT.
The time series of the lidar-derived extinctions (Fig. 11c, f, i and l, all corresponding to nighttime when the lidar signal is more robust) indicate dust extending up to 4 km at times, stratified into distinct layers supporting what appear to be gravity waves (Fig. 11). A peak at 2 km is specific to the 28–30 July dust event (Fig. 3), and a secondary peak at approximately 800 m represents the boundary layer top, where the maximum in relative humidity may induce the hygroscopic swelling of sea spray aerosols or indicate undetected optically thin cloud (Delgadillo et al., 2018). The GEOS-5 FP dust mass concentrations clearly indicate the presence of dust in the free troposphere on two of the days, though, perhaps surprisingly, not on the day with the highest AERONET-derived optical depth. When dust is present, its distribution by altitude is similar to that inferred from the lidar. Within the boundary layer, the filter-based size-resolved dust mass concentrations measurements (thick red bars within Fig 11a, d, g and j) reach 10 µg m−3 or more on all 4 d. GEOS-5 FP near-surface dust mass concentration values are higher on all 4 d than those measured (compare to the thick black bars).
Corresponding model aerosol extinction profiles, resolved over the 03:00–12:00 UTC time frame encapsulated within the average of the cloud-free lidar extinction profiles, suggests that the GEOS-5 FP product does not distribute enough of the assimilated τa above 1.5 km on any of the 4 d (Fig. 11b, e, h, k). Most of the model τa is confined to the boundary layer, where the τa also contains a sea spray contribution given relative humidities capable of exceeding 80 % (not shown). The lidar extinction values within the boundary layer are much lower than those from GEOS-5 FP, despite including a sea salt contribution, and are also lower in the free troposphere compared to those derived using GEOS-5 values.
A further assessment examines whether GEOS-5 preferentially places larger particles at lower altitudes, based on larger fall speeds for larger sizes, as this may contribute to the lower model-estimated dust extinctions. Size-resolved model dust mass mixing ratios for 28 July 2016 indicate that larger particles do prefer lower altitudes (Fig. 12), and in particular much fewer particles with diameters >6 µm occur above the boundary layer. In the two size ranges with the largest discrepancy between the model and measurements (2–4 µm versus 0.2–2 µm), the altitude difference between the vertical distribution of the two size-resolved dust mass mixing ratios is only on the order of 100–300 m, however.

To summarize, this assessment indicates that GEOS-5 FP places too much dust within the boundary layer and possibly not enough in the free troposphere above the boundary layer, although mass measurements in the free troposphere are lacking with which to more definitely validate the latter claim. Where GEOS-5 FP does place dust within the free troposphere, the mass is reasonably distributed by altitude.
Dust forecasts incorporating the assimilation of satellite-derived τa can circumvent a difficulty global aerosol models encounter, in which τa is too low further away from a source region (e.g., Kim et al., 2014; Evan et al., 2014; Ansmann et al., 2017). As such, the assimilation of observed τa holds the promise of more accurate depictions of the global aerosol distribution. While the GEOS-5 FP aerosol forecasts and MERRA-2 capture independently measured τa and its spatial variability well for an aerosol environment dominated by sea spray and long-range dust, the more challenging objective of a realistic aerosol vertical distribution, in both size and mass, is less well met. A clear overestimate in the modeled sea salt loading, apparent in an in situ comparison (Fig. 6), is corroborated by the independent findings of Bian et al. (2019). This will foster an underestimate in the dust loading for the same assimilated τa.
A comparison to dust mass concentrations measured at the surface and to lidar profiles of retrieved extinction indicates that GEOS-5 FP can distribute dust too low in the atmosphere, with too much mass placed in particle sizes that are larger than observed (except at the largest sizes). An overestimate of the amount of dust in the boundary layer has implications for model-deduced ocean fertilization by the soluble iron (e.g., Colarco et al., 2003) and for cloud nucleation. Size-resolved measurements place most of the mass in diameters smaller than 2 µm, while GEOS-5 FP/MERRA-2 places most of the dust mass in diameters between 2 and 4 µm (Fig. 9). The prescribed dust mass extinction efficiency, by which the dust portion of the assimilated aerosol optical depth is cast as a dust mass mixing ratio, is more than a factor of 3 larger for the smaller size (Table 1), and small differences in the distribution of mass between 0–2 and 2–4 µm have significant ramifications for the extinction. A model dust size distribution that places more of the dust in slightly larger sizes will overestimate the dust mass even if the light extinction by dust is correctly represented.
The overestimate in the model dust size after long-range transport is opposite to that documented for most global aerosol models, in which the number of small particles can be overestimated relative to the large particles (e.g., Kok, 2011). We recognize a recent emphasis on the presence of very large dust particles within the Saharan air layer (e.g., Ryder et al., 2019), and their ability to be transported for long distances. Large aspherical dust particles are also detected in Miami after a transport of ∼6000 km, exceeding the amount modeled, but their contribution to the overall mass is negligible. Their presence is consistent with other observations that perceive little mixing of African dust with other air masses en route for select cases (Karyampudi et al., 1999), and find larger dust particles closer to the top of the Saharan air layer (Jung et al., 2013; Yang et al., 2013; Gasteiger et al., 2017), as opposed to the bottom. The existence of the large particles may be more typical of the dust events that advect more directly to Miami and undergo little precipitation. The neglect of particles exceeding the maximum GEOS-5-specified particle diameter of 20 µm introduces little error in the total GEOS-5 dust mass concentrations but may be more important for the direct aerosol radiative effect, in particular the longwave component. This is not addressed here.
A previous study focusing on dust size distributions in coastal Florida indicates relatively fewer dust particles with diameters <2 µm than are reported here (Prospero et al., 2001), and the cascade impactor may be prone to undersampling the largest sizes (Li-Jones and Prospero, 1998; J. S. Reid et al., 2003a), although the good correspondence to the bulk measurements argues against this. Cloud processing in the boundary layer will also preferentially remove the largest dust particles. A survey of other measured dust sizes reported in the literature reinforces that dust particle sizes can be difficult to compare in a consistent manner across studies. Kok et al. (2017) indicate that most of the north African dust mass at emission is contained in particle diameters reaching 10 µm. Ryder et al. (2013) report that most of their dust mass, in measurements made close to the African coast, is in diameters exceeding 5 µm, consistent with Haywood et al. (2003). Closer to coastal Florida, in situ measurements made during the Puerto Rico Dust Experiment place most of the mass in particles with diameters between 5 and 7 µm (Maring et al., 2003b; J. S. Reid et al., 2003b), with similar sizes between the boundary layer and the free troposphere (Maring et al., 2003a). The Denjean et al. (2015) study, also based on measurements taken in Puerto Rico, does not consider particle diameters <1 µm. In contrast, inferences of dust size deduced from multi-wavelength lidar measurements at Barbados (Haarig et al., 2017) estimate most dust particles are 1.6–2.0 µm in diameter, which is more broadly consistent with the Miami impactor measurements. Other recent lidar measurements also perceive larger concentrations of aerosols with diameters <2 µm (Haarig et al., 2019). This is at first glance consistent with the in situ dust mass concentrations reported in Jung et al. (2013) near Barbados, but these do not extend beyond 2.5 µm in diameter (most aircraft aerosol intake inlets cut off at 3 µm) and do not resolve the larger sizes.
Our dust size measurements are gathered at a location further away from the dust source than Puerto Rico (Reid et al., 2002; E. A. Reid et al., 2003; J. S. Reid et al., 2003b; Maring et al., 2003a, b) and Barbados (Jung et al., 2013; Weinzierl et al., 2016), although effort was made to select for those days with a more direct transport from northern Africa (as opposed to resulting from a recirculation around the Gulf of Mexico). Reasons for the size discrepancy between our measurements and those produced by GEOS-5 FP remain not entirely understood. Critiques can be made of each individual measurement presented within this study. In their totality, however, a consistent interpretation emerges based on the retrieved lidar extinctions, and near-surface dust and sea salt mass concentrations, suggesting the model mean dust sizes, by mass, are too large, leading to relatively too much dust mass placed in the boundary layer. At the same time, the total dust loading is too low within GEOS-5 FP and MERRA-2, possibly because too much of the assimilated aerosol optical depth is speciated into sea salt. We consider the current analysis a pilot study, however, and recommend a further dedicated assessment with a multi-wavelength depolarization extinction lidar as well as a more complete set of size-resolved in situ dust mass measurements, both at the ground and in the free troposphere. This will better anchor ideas for future improvements to the depiction of the full dust life cycle within the GEOS-5 model, including through wet deposition.
The datasets developed for this study (lidar extinction retrievals, size-resolved dust mass concentrations, and measured sodium mass concentrations) are available from the University of Miami Scholarly Repository at https://doi.org/10.17604/1b5v-h184 (Kramer et al., 2020b). These include the sun photometer aerosol optical depths, which are also publicly available through the AERONET website. The bulk dust mass concentration dataset is available through the University of Miami Scholarly Repository at https://doi.org/10.17604/q3vf-8m31 (Zuidema, 2019), for which Zuidema et al. (2019) is the appropriate reference. The HYSPLIT model can be accessed through https://www.ready.noaa.gov/HYSPLIT.php (last access: November 2016), a NOAA Air Resource Laboratory product.
PZ designed the study and led the writing of the manuscript. SJK carried out the data collection and initial analysis and drafted the initial manuscript. The GEOS-5 FP and MERRA-2 values were provided by RG. RD provided the lidar analysis. CA contributed to the Miami data collection, with LC providing input on the methodology and additional mentorship of SJK. AEB provided the SEM analysis. PRC provided substantial insight into the GEOS-5 and MERRA-2 methodology. All authors commented on the manuscript.
The authors declare that they have no conflict of interest.
We thank Arlindo da Silva for intellectual input on the original study. We thank Brent Holben and Tom Eck for their support of the Miami sun photometers through the AERONET project. Jasper Kok and an additional anonymous reviewer are thanked for their thoughtful comments, which helped improve the manuscript. Patricia Quinn and Tim Bates are thanked for providing their insights into the dust impactor measurements. This work would not have been possible without the history of investments by Joseph Prospero into the dust filter sampling program at the University of Miami, its analysis and intellectual interpretation.
This research has been supported by the National Science Foundation, Division of Atmospheric and Geospace Sciences Major Research Instrumentation (grant no. 0923217), a faculty program fund (grant no. NSF AGS-1233874), an NSF AGS Research Experiences for Undergraduates grant, and DOE ASR (grant no. DE-SC0013720).
This paper was edited by Andreas Petzold and reviewed by Jasper Kok and one anonymous referee.
Adebiyi, A. A., Zuidema, P., and Abel, S.: The convolution of dynamics and moisture with the presence of shortwave absorbing aerosols over the southeast Atlantic, J. Climate, 28, 1997–2024, https://doi.org/10.1175/JCLI-D-14-00352.1, 2015. a
Adebiyi, A. A. and Kok, J. F.: Climate models miss most of the coarse dust in the atmosphere, Sci. Adv., 6, eaaz9507, https://doi.org/10.1126/sciadv.aaz9507, 2020. a
Ansmann, A., Rittmeister, F., Engelmann, R., Basart, S., Jorba, O., Spyrou, C., Remy, S., Skupin, A., Baars, H., Seifert, P., Senf, F., and Kanitz, T.: Profiling of Saharan dust from the Caribbean to western Africa – Part 2: Shipborne lidar measurements versus forecasts, Atmos. Chem. Phys., 17, 14987–15006, https://doi.org/10.5194/acp-17-14987-2017, 2017. a
Bian, H., Froyd, K., Murphy, D. M., Dibb, J., Darmenov, A., Chin, M., Colarco, P. R., da Silva, A., Kucsera, T. L., Schill, G., Yu, H., Bui, P., Dollner, M., Weinzierl, B., and Smirnov, A.: Observationally constrained analysis of sea salt aerosol in the marine atmosphere, Atmos. Chem. Phys., 19, 10773–10785, https://doi.org/10.5194/acp-19-10773-2019, 2019. a, b, c, d
Buchard, V., Randles, C. A., da Silva, A. M., Darmenov, A., Colarco, P. R., Govindaraju, R., Ferrare, R., Hair, J., Beyersdorf, A. J., Ziemba, L. D., and Yu, H.: The MERRA-2 Aerosol Reanalysis, 1980 Onward. Part II: Evaluation and Case Studies, J. Climate, 30, 6851–6872, https://doi.org/10.1175/JCLI-D-16-0613.1, 2017. a, b, c, d, e, f
Burton, S. P., Ferrare, R. A., Hostetler, C. A., Hair, J. W., Rogers, R. R., Obland, M. D., Butler, C. F., Cook, A. L., Harper, D. B., and Froyd, K. D.: Aerosol classification using airborne High Spectral Resolution Lidar measurements – methodology and examples, Atmos. Meas. Tech., 5, 73–98, https://doi.org/10.5194/amt-5-73-2012, 2012. a, b
Burton, S. P., Hair, J. W., Kahnert, M., Ferrare, R. A., Hostetler, C. A., Cook, A. L., Harper, D. B., Berkoff, T. A., Seaman, S. T., Collins, J. E., Fenn, M. A., and Rogers, R. R.: Observations of the spectral dependence of linear particle depolarization ratio of aerosols using NASA Langley airborne High Spectral Resolution Lidar, Atmos. Chem. Phys., 15, 13453–13473, https://doi.org/10.5194/acp-15-13453-2015, 2015. a
Chin, M., Ginoux, P., Kinne, S., Holben, B. N., Duncan, B. N., Martin, R., , Logan, J., Higurashi, A., and Nakajima, T.: Tropospheric aerosol optical thickness from the GOCART model and comparisons with satellite and sun photometer measurements, J. Atmos. Sci., 59, 461–483, 2002. a
Colarco, P. R., da Silva, A., Chin, M., and Diehl, T.: Online simulations of global aerosol distributions in the NASA GEOS-4 model and comparisons to satellite and ground-based aerosol optical depth, J. Geophys. Res., 115, d14207, https://doi.org/10.1029/2009JD012820, 2010. a
Colarco, P. R., Toon, O. B., Reid, J. S., Livingston, J. M., Russell, P. B., Redemann, J., Schmid, B., Maring, H. B., Savoie, D., Welton, E. J., Campbell, J. R., Holben, B. N., and Levy, R.: Saharan dust transport to the Caribbean during PRIDE: 2. Transport, vertical profiles, and deposition in simulations of in situ and remote sensing observations, J. Geophys. Res., 108, 8590–8606, https://doi.org/10.1029/2002JD002659, 2003. a
Colarco, P. R., Nowottnick, E. P., Randles, C., Yi, B., Yang, P., Kim, K.-M., Smith, J. A., and Bardeen, C. G.: Impact of radiatively interactive dust aerosols in the NASA GEOS‐5 climate model: Sensitivity to dust particle shape and refractive index, J. Geophys. Res., 119, 753–786, https://doi.org/10.1002/2013JD020046, 2014. a
Delgadillo, R., Voss, K., and Zuidema, P.: Characteristics of optically-thin coastal Florida cumuli from surface-based lidar measurements, J. Geophys. Res., 123, 10591–10605, https://doi.org/10.1029/2018JD028867, 2018. a, b, c, d, e, f
Denjean, C., Caquineau, S., Desboeufs, K., Laurent, B., Maille, M., Rosado, M. Q., Vallejo, P., Mayol-Bracero, O. L., and Formenti, P.: Long-range transport across the Atlantic in summertime does not enhance the hygroscopicity of African mineral dust, Geophys. Res. Lett., 42, 7835–7843, 2015. a, b, c
Dunion, J.: Rewriting the climatology of the tropical North Atlantic and Caribbean Sea atmosphere, J. Climate, 24, 893–908, https://doi.org/10.1175/2010jcli3496.1, 2011. a
Evan, A. T., Flamant, C., Fiedler, S., and Doherty, O.: An analysis of aeolian dust in climate models, Geophys. Res. Lett., 41, 5996–6001, https://doi.org/10.1002/2014GL060545, 2014. a, b
Freudenthaler, V., Esselborn, M., Wiegner, M., Heese, B., Tesche, M., Ansmann, A., Müller, D., Althausen, D., Wirth, M., Fix, A., Ehret, G., Knippertz, P., Toledano, C., Gasteiger, J., Garhammer, M., and Seefeldner, M.: Depolarization ratio profiling at several wavelengths in pure Saharan dust during SAMUM 2006, Tellus, 61, 165–179, https://doi.org/10.1111/j.1600-0889.2008.00396.x, 2009. a
Garrison, V. H., Majewski, M., Foreman, W. T., Genualdi, S. A., Mohammed, A., and Simonich, S. L.: Persistent organic contaminants in Saharan dust air masses in West Africa, Cape Verde and the eastern Caribbean, Sci. Total Environ., 468–469, 530–543, https://doi.org/10.1016/j.scitotenv.2013.08.076, 2014. a
Gasteiger, J., Groß, S., Sauer, D., Haarig, M., Ansmann, A., and Weinzierl, B.: Particle settling and vertical mixing in the Saharan Air Layer as seen from an integrated model, lidar, and in situ perspective, Atmos. Chem. Phys., 17, 297–311, https://doi.org/10.5194/acp-17-297-2017, 2017. a
Gelaro, R., McCarty, W., Suárez, M. J., Todling, R., Molod, A., Takacs, L., Randles, C. A., Darmenov, A., Bosilovich, M. G., Reichle, R., Wargan, K., Coy, L., Cullather, R., Draper, C., Akella, S., Buchard, V., Conaty, A., da Silva, A. M., Gu, W., Kim, G.-K., Koster, R., Lucchesi, R., Merkova, D., Nielsen, J., Partyka, G., Pawson, S., Putman, W., Rienecker, M., Schubert, S. D., Sienkiewicz, M., and Zhao, B.: The Modern-Era Retrospective Analysis for Research and Applications, Version 2 (MERRA-2), J. Climate, 30, 5419–5454, https://doi.org/10.1175/JCLI-D-16-0758.1, 2017. a, b
Ginoux, P., Chin, M., Tegen, I., Prospero, J., Holben, B., Dubovik, O., and Lin, S.-J.: Sources and distributions of dust aerosols simulated with the GOCART model, J. Geophys. Res., 106, 20255–20273, https://doi.org/10.1029/2000JD000053, 2001. a, b
Gong, S.: A parameterization of sea-salt aerosol source function for sub- and super-micron particles, Global Biogeochem. Cy., 17, 1097–1106, https://doi.org/10.1029/2003GB002079, 2003. a
Haarig, M., Ansmann, A., Althausen, D., Klepel, A., Groß, S., Freudenthaler, V., Toledano, C., Mamouri, R.-E., Farrell, D. A., Prescod, D. A., Marinou, E., Burton, S. P., Gasteiger, J., Engelmann, R., and Baars, H.: Triple-wavelength depolarization-ratio profiling of Saharan dust over Barbados during SALTRACE in 2013 and 2014, Atmos. Chem. Phys., 17, 10767–10794, https://doi.org/10.5194/acp-17-10767-2017, 2017. a, b
Haarig, M., Walser, A., Ansmann, A., Dollner, M., Althausen, D., Sauer, D., Farrell, D., and Weinzierl, B.: Profiles of cloud condensation nuclei, dust mass concentration, and ice-nucleating-particle-relevant aerosol properties in the Saharan Air Layer over Barbados from polarization lidar and airborne in situ measurements, Atmos. Chem. Phys., 19, 13773–13788, https://doi.org/10.5194/acp-19-13773-2019, 2019. a
Haywood, J., Francis, P., Osborne, S., Glew, M., Loeb, N., Highwood, E., Tanré, D., Myhre, G., Formenti, P., and Hirst, E.: Radiative properties and direct radiative effect of Saharan dust measured by the C-130 aircraft during SHADE: 1. Solar spectrum, J. Geophys. Res., 108, 8577–8593, https://doi.org/10.1029/2002JD002687, 2003. a
Holben, B. N., Eck, T., Slutsker, I., Tanré, D., Buis, J. P., Setzer, A., Vermote, E., Reagan, J. A., Kaufman, Y. J., Nakajima, T., Lavenu, F., Jankowiak, I., and Smirnov, A.: AERONET – A Federated Instrument Network and Data Archive for Aerosol Characterization, Remote Sens. Environ., 66, 1–16, https://doi.org/10.1016/S0034-4257(98)00031-5, 1998. a, b
Huang, Y., Kok, J. F., Kandler, K., Lindqvist, H., Nousiainen, T., Sakai, T., Adebiyi, A., and Jokinen, O.: Climate Models and Remote Sensing Retrievals Neglect Substantial Desert Dust Asphericity, Geophys. Res. Lett., 47, e2019GL086592, https://doi.org/10.1029/2019GL086592, 2020. a, b, c, d
Huneeus, N., Schulz, M., Balkanski, Y., Griesfeller, J., Prospero, J., Kinne, S., Bauer, S., Boucher, O., Chin, M., Dentener, F., Diehl, T., Easter, R., Fillmore, D., Ghan, S., Ginoux, P., Grini, A., Horowitz, L., Koch, D., Krol, M. C., Landing, W., Liu, X., Mahowald, N., Miller, R., Morcrette, J.-J., Myhre, G., Penner, J., Perlwitz, J., Stier, P., Takemura, T., and Zender, C. S.: Global dust model intercomparison in AeroCom phase I, Atmos. Chem. Phys., 11, 7781–7816, https://doi.org/10.5194/acp-11-7781-2011, 2011. a
Jung, E., Albrecht, B., Prospero, J. M., Jonsson, H. H., and Kreidenweis, S. M.: Vertical structure of aerosols, temperature, and moisture associated with an intense African dust event observed over the eastern Caribbean, J. Geophys. Res., 118, 4623–4643, https://doi.org/10.1002/jgrd.50352, 2013. a, b, c
Kanitz, T., Engelmann, R., Heinold, B., Baars, H., Skupin, A., and Ansmann, A.: Tracking the Saharan Air Layer with shipborne lidar across the tropical Atlantic, Geophys. Res. Lett., 41, 1044–1050, https://doi.org/10.1002/2013GL058780, 2014. a
Karyampudi, V. M., Palm, S., Reagen, J., Fang, H., Grant, W., Hoff, R., Moulin, C., Pierce, H., Torres, O., Browell, E., and Melfi, S.: Validation of the Saharan Dust Plume Conceptual Model Using Lidar, Meteosat, and ECMWF Data, B. Am. Meteorol. Soc., 80, 1045–1076, https://doi.org/10.1175/1520-0477(1999)080<1045:VOTSDP>2.0.CO;2, 1999. a
Kim, D., Chin, M., Yu, H., Diehl, T., Tan, Q., A.Kahn, R., Tsigaridis, K., E.Bauer, S., Takemura, T., Pozzoli, L., Bellouin, N., Schulz, M., Peyridieu, S., Chédin, A., and Koffi, B.: Sources, sinks, and transatlantic transport of North African dust aerosol: A multimodel analysis and comparison with remote sensing data, J. Geophys. Res., 119, 6259–6277, https://doi.org/10.1002/2013JD021099, 2014. a, b
Koffi, B., Schulz, M., Bréon, F.-M., Dentener, F., Steensen, B. M., Griesfeller, J., Winker, D., Balkanski, Y., Bauer, S. E., Bellouin, N., Berntsen, T., Bian, H., Chin, M., Diehl, T., Easter, R., Ghan, S., Hauglustaine, D. A., Iversen, T., Kirkevåg, A., Liu, X., Lohmann, U., Myhre, G., Rasch, P., Øyvind Seland, Skeie, R. B., Steenrod, S. D., Stier, P., Tackett, J., Takemura, T., Tsigaridis, K., Vuolo, M. R., Yoon, J., and Zhang, K.: Evaluation of the aerosol vertical distribution in global aerosol models through comparison against CALIOP measurements: AeroCom phase II results, J. Geophys. Res., 121, 7254–7283, https://doi.org/10.1002/2015JD024639, 2016. a
Kok, J. F.: A scaling theory for the size distribution of emitted dust aerosols suggests climate models underestimate the size of the global dust cycle, P. Natl Acad. Sci. USA, 108, 1016–1021, 2011. a
Kok, J. F., Mahowald, N. M., Fratini, G., Gillies, J. A., Ishizuka, M., Leys, J. F., Mikami, M., Park, M.-S., Park, S.-U., Van Pelt, R. S., and Zobeck, T. M.: An improved dust emission model – Part 1: Model description and comparison against measurements, Atmos. Chem. Phys., 14, 13023–13041, https://doi.org/10.5194/acp-14-13023-2014, 2014. a, b
Kok, J. F., Ridley, D. A., Zhou, Q., Miller, R. L., Zhao, C., Heald, C. L., S.Ward, D., Albani, S., and Haustein, K.: Smaller desert dust cooling estimated from analysis of dust size and abundance, Nat. Geosci., 10, 274–278, https://doi.org/10.1038/NGEO2912, 2017. a
Kramer, S., Kirtman, B., Zuidema, P., and Ngan, F.: Sub Seasonal Variability of Extreme Dust Events over South Florida, J. Geophys. Res., 125, e2019JD031874, https://doi.org/10.1029/2019JD031874, 2020a. a, b, c, d, e
Kramer, S. J., Alvarez, C. A., Barkley, A., Colarco, P., Custals, L., Delgadillo, R., Gaston, C. J., Govindaraju, R., and Zuidema, P.: Datasets contributing to Kramer et al., 2020: Apparent dust size discrepancy in aerosol reanalysis in north African dust after long-range transport, University of Miami Libraries, https://doi.org/10.17604/1b5v-h184, 2020b. a
Lawson, D. R.: Impaction surface coatings intercomparison and measurements with cascade impactors, Atmos. Environ., 14, 195–199, 1980. a
Li-Jones, X. and Prospero, J. M.: Variations in the size distribution of non-sea-salt sulfate aerosol in the marine boundary layer at Barbados: Impact of African dust, J. Geophys. Res., 103, 16073–16084, 1998. a, b, c, d, e
Liu, D., Wang, Y., Wang, Z., and Zhou, J.: The three-dimensional structure of transatlantic african dust transport: A new perspective from CALIPSO LIDAR measurements, Adv. Meteorol., 2012, 850704, https://doi.org/10.1155/2012/850704, 2012. a
Maring, H., Savioe, D. L., Izaguirre, M. A., Custals, L., and Reid, J. S.: Vertical distributions of dust and sea-salt aerosols over Puerto Rico during PRIDE measured from a light aircraft, J. Geophys. Res., 108, 8587–8598, https://doi.org/10.1029/2002JD002544, 2003a. a, b, c
Maring, H., Savoie, D. L., Izaguirre, M. A., Custals, L., and Reid, J. S.: Mineral dust aerosol size distribution change during atmospheric transport, J. Geophys. Res., 108, 8592–8603, https://doi.org/10.1029/2002JD002536, 2003b. a, b
Ott, D. K., Cyrs, W., and Peters, T. M.: Passive measurement of coarse particulate matter PM10–2.5, J. Aerosol Sci., 39, 156–167, 2008. a
Perry, K. D., Cahill, T. A., Eldred, R. A., Dutcher, D. D., and Gill, T. E.: Long-range transport of North African dust to the eastern United States, J. Geophys. Res., 102, 11225–11238, 1997. a
Prospero, J. M.: Long-term measurements of the transport of African mineral dust to the eastern United States: Implications for regional air quality, J. Geophys. Res., 104, 15917–15927, 1999a. a, b, c, d, e, f
Prospero, J. M.: Assessing the Impact of Advected African Dust on Air Quality and Health in the Eastern United States, Human Ecological Risk Assess.: An Int. J., 5, 471–479, https://doi.org/10.1080/10807039.1999.10518872, 1999b. a
Prospero, J. M., Olmez, I., and Ames, M.: Al and Fe in PM2.5 and PM10 suspended articles in south-central Florida: The impact of the long range transport of African mineral dust, Water Air Soil Poll., 125, 291–317, 2001. a, b
Randles, C. A., da Silva, A. M., Buchard, V., Colarco, P. R., Darmenov, A., Govindaraju, R., Smirnov, A., Holben, B., Ferrare, R., Hair, J., Shinozuka, Y., and Flynn, C. J.: The MERRA-2 Aerosol Reanalysis, 1980 Onward. Part I: System Description and Data Assimilation Evaluation, J. Climate, 30, 6823–6850, https://doi.org/10.1175/JCLI-D-16-0609.1, 2017. a, b, c
Reid, E. A., Reid, J. S., Meier, M. M., Dunlap, M. R., Cliff, S., Broumas, A., Perry, K., and Maring, H.: Characterization of African dust transported to Puerto Rico by individual particle and size segregated bulk analysis, J. Geophys. Res., 108, 8591, https://doi.org/10.1029/2002JD002935, 2003. a, b
Reid, J. S., Westphal, D. L., Livingston, J. M., Savoie, D. L., Maring, H., Jonsson, H., Eleuterio, D., Kinney, J., and Reid, E.: Dust vertical distribution in the Caribbean during the Puerto Rico Experiment, Geophys. Res. Lett., 29, 1151–1155, https://doi.org/10.1029/2001GL014092, 2002. a, b
Reid, J. S., Jonssonn, H. J., Maring, H. B., Smirnov, A., Savoie, D. L., Cliff, S. S., Reid, E., Livingston, J., Meier, M., Dubovik, O., and Tsay, S.-C.: Comparison of size and morphological measurements of coarse mode dust particles from Africa, J. Geophys. Res., 108, 8593, https://doi.org/10.1029/2002JD002485, 2003a. a, b, c, d
Reid, J. S., Kinney, J., Westphal, D., Holben, B., Welton, E. J., Tsay, S.-C., Eleuterio, D. P., Campbell, J. R., Christopher, S. A., Colarco, P. R., Jonsson, H. H., Livingston, J. M., Maring, H. B., Meier, M. L., Pilewskie, P., Prospero, J. M., Reid, E. A., Remer, L. A., Russell, P. B., Savoie, D. L., Smirnov, A., and Tanre, D.: Analysis of measurements of Saharan dust by airborne and ground-based remote sensing methods during the Puerto Rico Dust Experiment (PRIDE), J. Geophys. Res., 108, 8586–8599, https://doi.org/10.1029/2002JD002493, 2003b. a, b
Ryder, C. L., Highwood, E. J., Lai, T., Sodemann, H., and Marsham, J. H.: Impact of atmospheric transport on the evolution of microphysical and optical properties of Saharan dust, Geophys. Res. Lett., 40, 2433–2438, https://doi.org/10.1002/grl.50482, 2013. a
Ryder, C. L., Highwood, E. J., Walser, A., Seibert, P., Philipp, A., and Weinzierl, B.: Coarse and giant particles are ubiquitous in Saharan dust export regions and are radiatively significant over the Sahara, Atmos. Chem. Phys., 19, 15353–15376, https://doi.org/10.5194/acp-19-15353-2019, 2019. a
Sauter, K., L'Ecuyer, T., van den Heever, S. C., Twohy, C., Heidinger, A., and Wood, N.: The observed influence of tropical convection on the Saharan dust layer, J. Geophys. Res., 124, 10896–10912, https://doi.org/10.1029/2019JD031365, 2019. a
Savoie, D. L. and Prospero, J.: Particle size distribution of nitrate and sulfate in the marine atmosphere, Geophys. Res. Letts., 9, 1207–1210, 1982. a
Savoie, D. L., Prosperoa, J., and Saltzman, E.: Non-sea-salt sulfate and nitrate in tradewind aerosols at Barbados: Evidence for long-range transport, J. Geophys. Res., 94, 5069–5080, 1989. a
Shi, H., Xiao, Z., Zhan, X., Ma, H., and Tian, X.: Evaluation of MODIS and two reanalysis aerosol optical depth products over AERONET sites, Atmos. Res., 220, 75–90, 2019. a
Stein, A. F., Draxler, R., Rolph, G., Stunder, M., Cohen, M., and Ngan, F.: NOAA's HYSPLIT Atmospheric Transport and Dispersion Modeling System, B. Am. Meteorol. Soc., 96, 2059–2078, 2015. a
Sugimoto, N. and Lee, C. H.: Characteristics of dust aerosols inferred from lidar depolarization measurements at two wavelengths, Appl. Optics, 45, 7468–7474, 2006. a
Tegen, I. and Lacis, A.: Modeling of particle size distribution and its influence on the radiative properties of mineral dust aerosol, J. Geophys. Res., 101, 19237–19244, https://doi.org/10.1029/95JD03610, 1996. a
van der Does, M., Brummer, G.-J., v. Crimpen, F., Korte, L., Mahowald, N., Merkel, U., Prospero, J., Yu, H., Zuidema, P., and Stuut, J.-B.: Tropical rains controlling deposition of Saharan dust across the North Atlantic Ocean, Geophys. Res. Lett., 47, e2019GL086867, https://doi.org/10.1029/2019GL086867, 2020. a, b
Wagner, J. and Leith, D.: Passive aerosol sampler. Part I: Principle of operation, Aerosol Sci. Tech., 34, 186–192, 2001. a
Wang, H.-C. and John, W.: Comparative bounce properties of particle materials, Aerosol Sci. Technol., 7, 285–299, 1987. a
Weinzierl, B., Ansmann, A., Prospero, J., Althausen, D., Benker, N., Chouza, F., Dollner, M., Farrell, D., Fomba, W., Freudenthaler, V., Gasteiger, J., Groß, S., Haarig, M., Heinold, B., Kandler, K., Kristensen, T., Mayol-Bracero, O., Müller, T., Reitebuch, O., Sauer, D., Schäfler, A., Schepanski, K., Spanu, A., Tegen, I., Toledano, C., and Walser, A.: The Saharan Aerosol Long-range Transport and Aerosol-Cloud-Interaction Experiment (SALTRACE) overview and selected highlights, B. Am. Meteorol. Soc., 98, 1427–1451, https://doi.org/10.1175/BAMS-D-15-00142.1, 2016. a
Wilson, R. and Spengler, J.: Particles in Our Air: Concentrations and Health Effects, Harvard University Press, Boston, MA, USA, 1996. a
Yang, W., Marshak, A., Kostinski, A., and Várnai, T.: Shape‐induced gravitational sorting of Saharan dust during transatlantic voyage: Evidence from CALIOP lidar depolarization measurements, Geophys. Res. Lett., 40, 3281– 3286, https://doi.org/10.1002/grl.50603, 2013. a, b
Zuidema, P.: Data contributing to Zuidema et al., 2019: “Is summer African dust arriving earlier at Barbados? The updated long-term in-situ dust mass concentration time series from Ragged Point, Barbados and Miami, Florida”, University of Miami Libraries, https://doi.org/10.17604/q3vf-8m31, 2019. a
Zuidema, P., Alvarez, C., Kramer, S. J., Custals, L., Izaguirre, M., Sealy, P., Prospero, J. M., and Blades, E.: Is summer African dust arriving earlier to Barbados? The updated long-term in-situ dust mass concentration records from Ragged Point, Barbados and Miami, Florida, B. Am. Meteorol. Soc., 100, 1981–1986, https://doi.org/10.1175/BAMS-D-18-0083.1, 2019. a, b, c
- Abstract
- Introduction
- Background and datasets
- Overview of 2014–2016 summer dust seasons
- Comparison of GEOS-5 FP/MERRA-2 aerosol distributions to the Miami observations
- Conclusions and discussion
- Data availability
- Author contributions
- Competing interests
- Acknowledgements
- Financial support
- Review statement
- References