the Creative Commons Attribution 4.0 License.
the Creative Commons Attribution 4.0 License.
 | 27 Aug 2020
A semi-empirical potential energy surface and line list for H216O extending into the near-ultraviolet
Eamon K. Conway
Iouli E. Gordon
Jonathan Tennyson
Oleg L. Polyansky
Sergei N. Yurchenko
Kelly Chance
Accurate reference spectroscopic information for the water molecule from the microwave to the near-ultraviolet is of paramount importance in atmospheric research. A semi-empirical potential energy surface for the ground electronic state of has been created by refining almost 4000 experimentally determined energy levels. These states extend into regions with large values of rotational and vibrational excitation. For all states considered in our refinement procedure, which extend to 37 000 cm−1 and J=20 (total angular momentum), the average root-mean-square deviation is approximately 0.05 cm−1. This potential energy surface offers significant improvements when compared to recent models by accurately predicting states possessing high values of J. This feature will offer significant improvements in calculated line positions for high-temperature spectra where transitions between high J states become more prominent.
Combining this potential with the latest dipole moment surface for water vapour, a line list has been calculated which extends reliably to 37 000 cm−1. Obtaining reliable results in the ultraviolet is of special importance as it is a challenging spectral region for the water molecule both experimentally and theoretically. Comparisons are made against several experimental sources of cross sections in the near-ultraviolet and discrepancies are observed. In the near-ultraviolet our calculations are in agreement with recent atmospheric retrievals and the upper limit obtained using broadband spectroscopy by Wilson et al. (2016, p. 194), but they do not support recent suggestions of very strong absorption in this region.
- Article
(3096 KB) - Full-text XML
-
Supplement
(21722 KB) - BibTeX
- EndNote


Water vapour is a major absorber of light in the terrestrial atmosphere, and it interferes with atmospheric retrievals from the microwave to the near-ultraviolet (Lampel et al., 2015). The water molecule dissociates at 41 145.92 cm−1 (Boyarkin et al., 2013), and there are almost no rovibrational transitions beyond that. Although the absorption of water vapour in the near-ultraviolet is known to be weak, particularly when compared to features in the infrared, it obscures retrievals of electronic spectra of important (from an atmospheric and pollution monitoring perspective) molecules with trace abundances in the terrestrial atmosphere (Fleischmann et al., 2004; Cantrell et al., 1990; Stutz et al., 2000). Retrievals performed in the visible and near-ultraviolet have a long record of success (Gonzalez Abad et al., 2019). Water vapour is one such molecule where accurate retrievals have already been performed in the visible spectral range using OMI (Levelt et al., 2018; Wang et al., 2014, 2019), GOME (Wagner et al., 2003) SCIAMACHY (Noël et al., 2004), GOME-2 (Wagner et al., 2013) and more recently TROPOMI (Borger et al., 2020).
Observations also indicate that water vapour overlaps with near-ultraviolet absorption features of trace molecules such as H2CO, O2−O2, BrO and HONO (Lampel et al., 2017). The marginal concentration of these molecules implies that weak water vapour absorption may in fact interfere with their observation.
Satellite missions possessing spectrometers with detection limits extending into the near-ultraviolet are becoming more popular for both Earth and planetary studies: Hubble Space Telescope (HST) (NASA), MAVEN (NASA), CUTE (Fleming et al., 2018), OMI (Levelt et al., 2018) and the recently launched GEMS (Kim et al., 2020) to name but a few. NASA's TEMPO (Tropospheric Emissions: Monitoring of Pollution) mission will monitor the air over North America and Central America from 740 to 290 nm. and it aims to accurately characterize atmospheric pollution (Zoogman et al., 2017). Without accurate reference spectra through the entire range, this will not be possible. For the principal isotopologue of water vapour, the HITRAN2016 (Gordon et al., 2017) database only extends to 400 nm, and while this limit is more than sufficient for the majority of applications, the increasing demand of remote-sensing missions operating in the ultraviolet suggests that the HITRAN spectral range needs to be extended to shorter wavelengths.
Computing an accurate line list requires three elements (Lodi and Tennyson, 2010): an accurate potential energy surface (PES), an accurate dipole moment surface (DMS) and a program capable of solving the nuclear motion problem for the Schrödinger equation with an exact kinetic energy operator. The recently calculated water line list due to Polyansky et al. (2018), named “POKAZATEL”, provided the first attempt to model the entire spectrum of water vapour up to dissociation; POKAZATEL utilized a newly developed PES, the fewer-parameter DMS by Lodi et al. (2011) (known as LTP2011S) and the DVR3D nuclear motion program (Tennyson et al., 2004). The spectrum predicted by POKAZATEL has been tested against observations in our own atmosphere and was found to under-absorb in the near-ultraviolet (Lampel et al., 2017). To address this, a recently developed dipole moment surface (DMS), CKAPTEN (Conway et al., 2018), has been created through extensive electronic structure calculations, and spectra computed with this DMS have been shown to provide improvements over the POKAZATEL line list for wavelengths down to 400 nm (Conway et al., 2020a).
Semi-empirical adjustments which start from a high-quality ab initio PES allow energy levels to be calculated to within a fraction of a wavenumber when compared to experimental measurements (Bubukina et al., 2011; Mizus et al., 2018; Partridge and Schwenke, 1997; Polyansky et al., 2018). The POKAZATEL PES (note that the POKAZATEL PES and POKAZATEL line list are distinct entities) extends to dissociation and predicts energy levels with J=0, 2 and 5 with a root-mean-square error (RMSE) of 0.118 cm−1. The uncertainty due to the potential on the calculated transition intensities in the near-ultraviolet is not documented.
The POKAZATEL line list was also designed for high-temperature applications (it is complete), yet as shown below, the POKAZATEL PES only calculates energy levels to high precision for states with low values of total angular momentum J. The PES's accuracy rapidly diminishes as J grows (Polyansky et al., 2018). This rotational effect is not uncommon in semi-empirical potentials (Bubukina et al., 2011; Mizus et al., 2018; Partridge and Schwenke, 1997). The distribution of rotational energy levels makes this potential problematic for the generation of high-temperature spectra where transitions between high J states are important. However, the POKAZATEL line list is complete and includes all transitions involving states up to Jmax=72, where all states with J≥73 lie above the dissociation threshold.
Recent near-ultraviolet broadband cavity ring-down measurements by Pei et al. (2020) suggest that water vapour may absorb strongly and should have large effects on observations in the 290–350 nm interval. Pei et al. (2020) claims that near-ultraviolet water vapour absorption spectra will “significantly affect” the retrievals of ozone and also contribute 0.26–0.76 W m−2 to the Earth's energy budget. In 2013, the same group performed a similar experiment in the same wavelength region (Du et al., 2013), which also suggested strong absorption in the near-ultraviolet, but the two data sets do not agree with each other. While the earlier data set showed peaks, albeit greatly amplified at the wavelengths predicted by theory, the second data set showed no such correlation.
In contrast, Wilson et al. (2016) investigated the absorption of water vapour between 325 and 420 nm and could not replicate the strong absorption features provided by Du et al. (2013). Wilson et al. (2016) report an upper bound on the water vapour absorption in this region of cm2 molecule−1, which is at least a factor of 10 lower than the peaks reported by the other studies. Earlier, Dupre et al. (2005) recorded a continuous wave cavity ring-down spectrum of water vapour near 400 nm and observed 62 transitions.
In this work we create a new semi-empirical potential energy surface that accurately models the rotational behaviour of those high J states while also predicting states near dissociation to a reasonable degree of accuracy. With this surface, a new line list that extends into the near-ultraviolet is calculated and used to investigate the available laboratory and atmospheric measurements of water vapour absorption in the blue and near-ultraviolet.
2.1 Fitting the ab initio surface
Approximately 16 000 electronic structure calculations were previously performed for a dipole moment surface at the MR-CI (multi-reference configuration interaction) level of theory utilizing an aug-cc-pCV6Z basis set (Dunning, 1989; Woon and Dunning Jr., 1995; Peterson and Dunning, 2002) and the Douglass–Kroll–Hess Hamiltonian of order two (DKH2) (Conway et al., 2018). These calculations span water bond lengths in the range of 1.3–4.0 a0 with angles between 30 and 178∘. Setting the energy at the equilibrium configuration (re=1.8141 a0 and θe=104.52∘) to zero, the maximum energy of these ab initio calculations that we consider is 57 423 cm−1.
These points need to be fitted to a functional form to obtain an ab initio PES; in the fit each data point was weighted as a function of their energy, with weights wi smoothly reducing towards zero as energy increases. The weighting function considered here is similar to the function used by Partridge and Schwenke (1997) for their 1997 PES. A similar version of this weighting function is also used in an ethylene PES (Delahaye et al., 2014):
While constructing the POKAZATEL (Polyansky et al., 2018) potential energy surface, Polyansky et al. found that a single surface could not accurately predict energies from the bottom of the well up to dissociation; hence, they follow the procedure by Varandas (1996) and define a piecewise potential. The same methodology was recently used to create a PES for the C3 molecule (Rocha and Varandas, 2018). We are also interested in accurately predicting energies that extend into the near-ultraviolet and so we too use a piecewise defined potential as given by
where χE is a switching function dependent upon energy (E):
and r1, r2 and θ are the corresponding values of the bond lengths and inter-bond angle. This function ensures smoothness, and the parameters ζs and β control the range of the switch. Our values are similar to those of the POKAZATEL PES, except our switching point ζs is different. By lowering our ζs from the 35 000 cm−1 value of POKAZATEL to 30 000 cm−1, we allow high-order parameters in Vlow to have a greater influence on the upper levels.
Due to the difficulty of fitting data in different energy regions, it is helpful to begin with a well-defined functional form; hence, the starting point for Vup in our new PES is the Vup function of the POKAZATEL potential. However, for Vlow, we employ a new functional form defined as
where for . r12 is the separation between the two hydrogen atoms, re=1.8141 a0 is the equilibrium bond length and is the angle at equilibrium. α was determined from a series of optimizations, and the optimal value was found to be 1.24. D1 and D2 were also floated during our initial linear least-square fits and are set to 42 778.44 and 683 479.329404 cm−1, respectively. The expansion variables ζ1, ζ2 and ζ3 are defined as
G(θ) and F(r1,r2) are dimensionless damping functions that constrain the potential in the limits of θ→0 and . These are defined as
The number of parameters, Cijk, was optimized to provide the lowest root-mean-square (rms) deviation from the underlying ab initio data such that there are also no holes created from overfitting. A hole is an unphysical feature of a PES that often appears as a continuous (although not always) drop or dip in the surface where it should instead be smooth. We found that using 250 parameters provided the lowest rms deviation of 35 cm−1 from the electronic structure calculations. This value is large due to the large discrepancy between our ab initio data points and Vup from POKAZATEL rather than from our fitting of Vlow. The 250 parameters used here are close to the 241 parameters taken by Bubukina et al. (2011) and Mizus et al. (2018), as well as the 245 parameters by Partridge and Schwenke (1997). The maximum values of i, j and k that we consider are 10, 8 and 15, respectively. In addition to the fitted ab initio surface, we also include a QED (quantum electrodynamics) correction to our ab initio PES via the one-electron Lamb shift (Pyykkö et al., 2001) and a second-order relativistic energy correction (Quiney et al., 2001).
For quanta in ν1 and ν3, i.e. the stretching modes, Schwenke (2001) discovered that his Born–Oppenheimer diagonal corrections (BODC), also known as the adiabatic correction, did not agree with those calculated by Zobov et al. (1996). The two calculations did, however, exhibit better agreement for the different quanta of bending in ν2. The adiabatic correction is known to be large for high stretch modes (Polyansky et al., 2013), particularly for those in the visible and near-ultraviolet which we are interested in. However, neither source is well tested nor suited for such energetic states; hence, we chose to omit this correction to our surface and rely on fitting to experiment to incorporate this effect.
The non-adiabatic correction is an important contribution to any high-accuracy potential (Partridge and Schwenke, 1997; Schwenke, 2001; Bubukina et al., 2011; Mizus et al., 2018; Polyansky et al., 2013). For high-temperature spectra, transitions involving high values of the total angular momentum, J, become significantly more prominent and, as the non-adiabatic correction grows approximately as J2 (Bunker and Moss, 1980), non-adiabatic effects are more important. For this reason, we follow Bubukina et al. (2011) and embed these corrections within our Hamiltonian as new kinetic energy operators which are functions of operators , and . The coefficients before these operators are the values determined from Schwenke (2001) multiplied by a factor of 1.1, which he suggests, times optimized values from Bubukina et al. (2011) In total, this gives (in a.u):
2.2 Nuclear motion calculations
We use the DVR3D (Tennyson et al., 2004) suite of programs for solving the nuclear motion problem. For these calculations, we take Radau coordinates with a bisector embedding and use a 55 by 40 discrete variable representation (DVR) grid with Morse oscillator like functions in r and associated Legendre polynomials in θ, respectively. The DVR for these basis sets is constructed using Gaussian quadrature schemes in associated-Laguerre and associated-Legendre polynomials, respectively, in r and θ. For the Morse oscillator-like functions, we take rE=3.0, ω=0.007 and β=0.25 (all in a.u.), which are the values used to compute the POKAZATEL line list. For the vibrational problem, matrices of dimension 3500 are diagonalized and used as a basis for the full rovibrational problem. For this, matrices of dimension are diagonalized, where J is the total angular momentum and p is the parity (p=0 or 1). Nuclear masses have been used throughout.
These parameters have been optimized for the initial J=0 problem such that vibration energies below 27 000 cm−1 are well converged to better than 0.01 cm−1, while for energies at 37 000 cm−1 the convergence error is less than 0.03 cm−1.
2.3 Creating a semi-empirical PES
PES refinement is a technique where one adjusts the underlying ab initio surface to reproduce measured data to a high degree of accuracy, often to within a fraction of a wavenumber (Huang et al., 2012; Polyansky et al., 2018; Mizus et al., 2018; Bubukina et al., 2011). The method by Yurchenko et al. (2003) has been successfully applied to numerous H2O potentials (Polyansky et al., 2018; Mizus et al., 2018; Bubukina et al., 2011), as well as to TiO (McKemmish et al., 2019), AsH3 (Coles et al., 2019), NH3 (Coles et al., 2018), CH3Cl (Owens et al., 2018) and C2H4 (Mant et al., 2018). In this procedure, one maintains the overall structure of the underlying ab initio surface while simultaneously optimizing the parameters of the fit. This prevents the development of unwanted holes while refining.
Overall, we are trying to minimize
where is the typical observed minus calculated DVR3D rovibrational energy and similarly is the difference between ab initio and calculated potential energies. The factor f is the “weight” of our semi-empirical PES to our initial ab initio surface. Setting f too large can result in overfitting if the sum over j and/or i is too small.
The Hellman–Feynmann theorem allows us to efficiently calculate the derivative of an energy level with respect to a particular parameter in our potential, required for the least-squares fit. With this, we can iterate and optimize the parameters of the PES to reduce the deviation of our semi-empirical energies from the observed levels. The MARVEL (measured active rotational–vibrational energy levels) procedure (Furtenbacher et al., 2007; Császár et al., 2007; Furtenbacher and Császár, 2012) was originally constructed for a IUPAC study of water spectra (Tennyson et al., 2014). The resulting empirical energy levels for (Tennyson et al., 2013) have been subsequently updated in response to both improvements to the MARVEL algorithm (Tóbiás et al., 2019) and to the availability of new data (Furtenbacher et al., 2020). We refine our potential to updated MARVEL energy levels with J=0, 2, 5, 10, 15 and 20, representing approximately 4000 states. The more recent potentials for water vapour (Shirin et al., 2003; Polyansky et al., 2018; Mizus et al., 2018; Bubukina et al., 2011) have been limited to refinement of states with J=0, 2 and 5, which is not sufficient to accurately predict high J levels.
The only near-ultraviolet energy levels available for come from the multiphoton experiments by Grechko et al. (2010, 2009) and span states below J ≊ 7. The reduced number of measurements in the blue–violet and near-ultraviolet makes the Vup particularly difficult to refine accurately. More high-resolution experimental work in these regions would be welcome.
3.1 PES refinement
For our initial unrefined ab initio PES, the average deviation from the MARVEL J=0 ab initio vibration band origins (VBOs) below 37 000 cm−1 is approximately 2 cm−1, a figure dominated by overtones in ν2. Refining to the VBOs alone is known to not produce accurate results (Schryber et al., 1997). However, fits to J=0 levels are significantly faster and provide a good starting point for refining using non-zero J states.
For the first refinement of J=0 VBOs, we set the weight of all levels with energies greater than 26 000 cm−1 to 0.1, while those less than this carry a weight of 1. This ratio of 10 : 1 was chosen such that we can include all states in the refinement without deteriorating the residuals of the lower states. The weight of our semi-empirical PES to the underlying ab initio surface was fixed at 1000, which is large enough to provide accurate results while also small enough to prevent the formation of undesirable holes. For this process, Vup was held constant. Doing this allowed us to reduce our average RMSE from the MARVEL VBOs to only 0.08 cm−1.
For the second step, the ratio of weights for those states below 26 000 cm−1 to those above this limit is now switched compared to the previous refinement of Vlow. Then, 61 of the lowest-order parameters in Vup are optimized to improve the agreement between both our ab initio data points and the MARVEL levels, while Vlow was held fixed. For this refinement of Vup, f carries the same value as the previous step and is 1000.
For the third stage, we return to Vlow and focus on the refinement of energies in higher J states, notably J=2, 5, 10, 15 and 20. The weighting criteria remains the same as in step one, and Vup was not optimized here. The rigorous quantum numbers alone are not enough to uniquely match our calculated states to the correct corresponding states from MARVEL. We therefore need to supplement the rigorous quantum labels with energy differences, which is where it becomes difficult to match and is very often non-trivial, particularly in the near-ultraviolet with the high density of states. To identify the correct match, we add new J states only after the potential was optimized to the previous J states. By doing so, the accuracy of the calculated states in the next J states are always low enough to make a reliable match. For example, we take our previous J=0 optimized surface and calculate all J=2 states using the result of the J=0 optimization and then proceed to match the J=2 states. Next, we refine Vlow to J=0 and 2 energies (as done in step one) and calculate J=5 states using the results of this optimization; we then match these J=5 states to those in MARVEL. The optimization of J=0, 2 and 5 would follow next. This was continued through to J=20. This procedure allowed us to ensure that we optimize the calculated states to the correct empirical values in MARVEL. Outliers were removed from the refinement on a continuous basis and were chosen when their residuals were larger than the band average.
Next, for step four, we apply the weighting criteria of step two; refine Vup to states in J=0, 2, 5, 10, 15 and 20; and hold Vlow fixed. The procedure for adding more J levels to the optimization of Vup was the same as done above in step three. Although there are no known near-ultraviolet states with J=10, 15 or 20, the low-order parameters in Vup potentially interact very weakly with the lower states, and it is important to include these in the optimization such that we do not lose the rotational dependence of these levels. This step is repeated several more times and each time gradually increasing f towards 105. Increasing f above this provided no improvement in the RMSE, and this concluded the refinement of Vup.
For the final optimization of our potential, we refine Vlow to states in J=0, 2, 5, 10, 15 and 20 using the 10 : 1 ratios of step one while also gradually increasing f to 1010. Going beyond this offered no improvement in the final RMSE and only increases the risk of over-refining. This f value is significantly larger than that used in the final refinement of Vup, which is entirely justified by there being significantly fewer states in the near-ultraviolet.
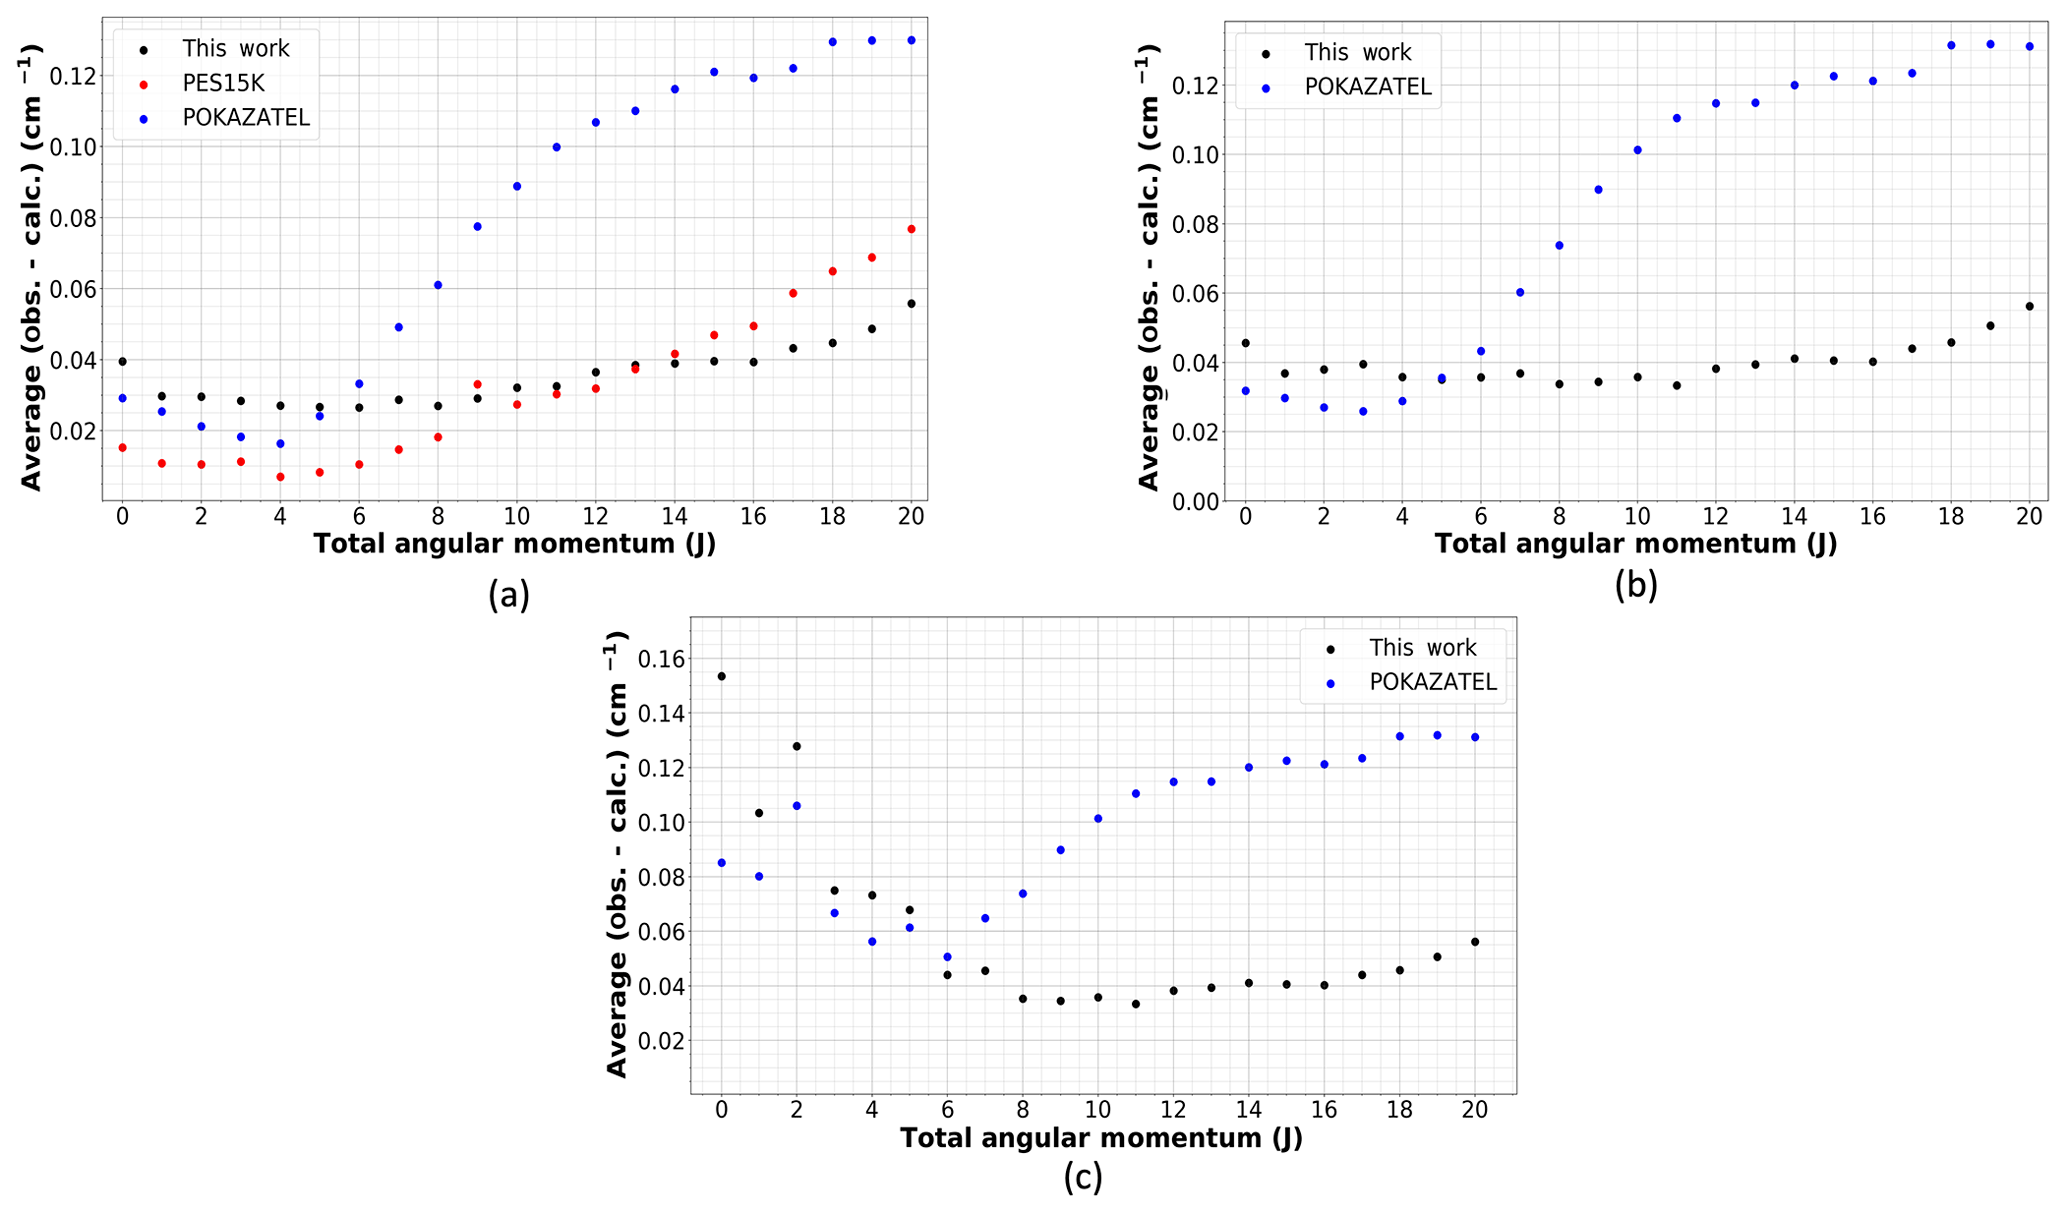
Figure 1The average deviation of calculated levels from those in MARVEL (Furtenbacher et al., 2020) using several potential energy surfaces: this work, POKAZATEL (Polyansky et al., 2018) and PES15K (Mizus et al., 2018). (a) Energies below 15 000 cm−1, (b) energies below 26 000 cm−1 and (c) energies below 37 000 cm−1.
It is common to provide a breakdown of residuals for the VBOs in a large table; however, as already described, these states alone cannot be used to measure how well a potential can calculate energy levels. Hence, we calculate the average deviation of the calculated energy levels using our new potential, the POKAZATEL potential and the PES15K potential to those MARVEL states with J≤20. The calculated states from each potential were matched to the empirical MARVEL values using the same algorithm to facilitate an equal comparison. For states with energies below 26 000 cm−1, a 0.5 cm−1 threshold was used, while for those above 26 000 cm−1, a 1.0 cm−1 limit was used. In Fig. 1, the average residuals per J are plotted in three sections: (panel a) E≤ 15 000 cm−1, (panel b) E≤26 000 cm−1 and (panel c) E≤ 37 000 cm−1. These comparisons include states in MARVEL both refined and not refined. Comparing to the unrefined states is a method of assessing the smoothness of the surface. Firstly, we must acknowledge that PES15K is excellent at reproducing those energy levels below 15 000 cm−1 with J≤9, but above this J threshold, the residuals begin to increase and eventually surpass ours. There is an outlying point at J=9 in Fig. 1a for PES15K, likely due to the matching algorithm; although, this does not occur for the other data sets. For POKAZATEL, the RMSE increases rapidly with J. This is most likely due to these potentials only being refined to states in J=0, 2 and 5. Our new potential offers lower residuals for those high J states while also providing relatively accurate energies into the near-ultraviolet. However, in Fig. 1c we see that there is a large amount of noise in both our new surface and POKAZATEL. This is due to an insufficient number of experimental data points to refine. For high values of J, it is also worth noting that, of the three potential surfaces, there are significantly fewer calculated levels from the POKAZATEL PES matched with those in MARVEL despite the same matching criteria being used for all. For the purpose of reproducibility, we provide a VBO comparison in the Supplement as well as a table containing the data used to create Fig. 1.
Figure 2 plots the same residuals seen in Fig. 1 but now as a function of energy. The rotational dependence of the POKAZATEL PES is again clear. The Fortran F90 subroutine for our new semi-empirical PES, which we call “HOT_WAT”, is provided in the Supplement.

Figure 2Calculated energy levels obtained from the POKAZATEL (Polyansky et al., 2018) surface, PES15K (Mizus et al., 2018) surface and this work compared to those in the MARVEL database (Furtenbacher et al., 2020).
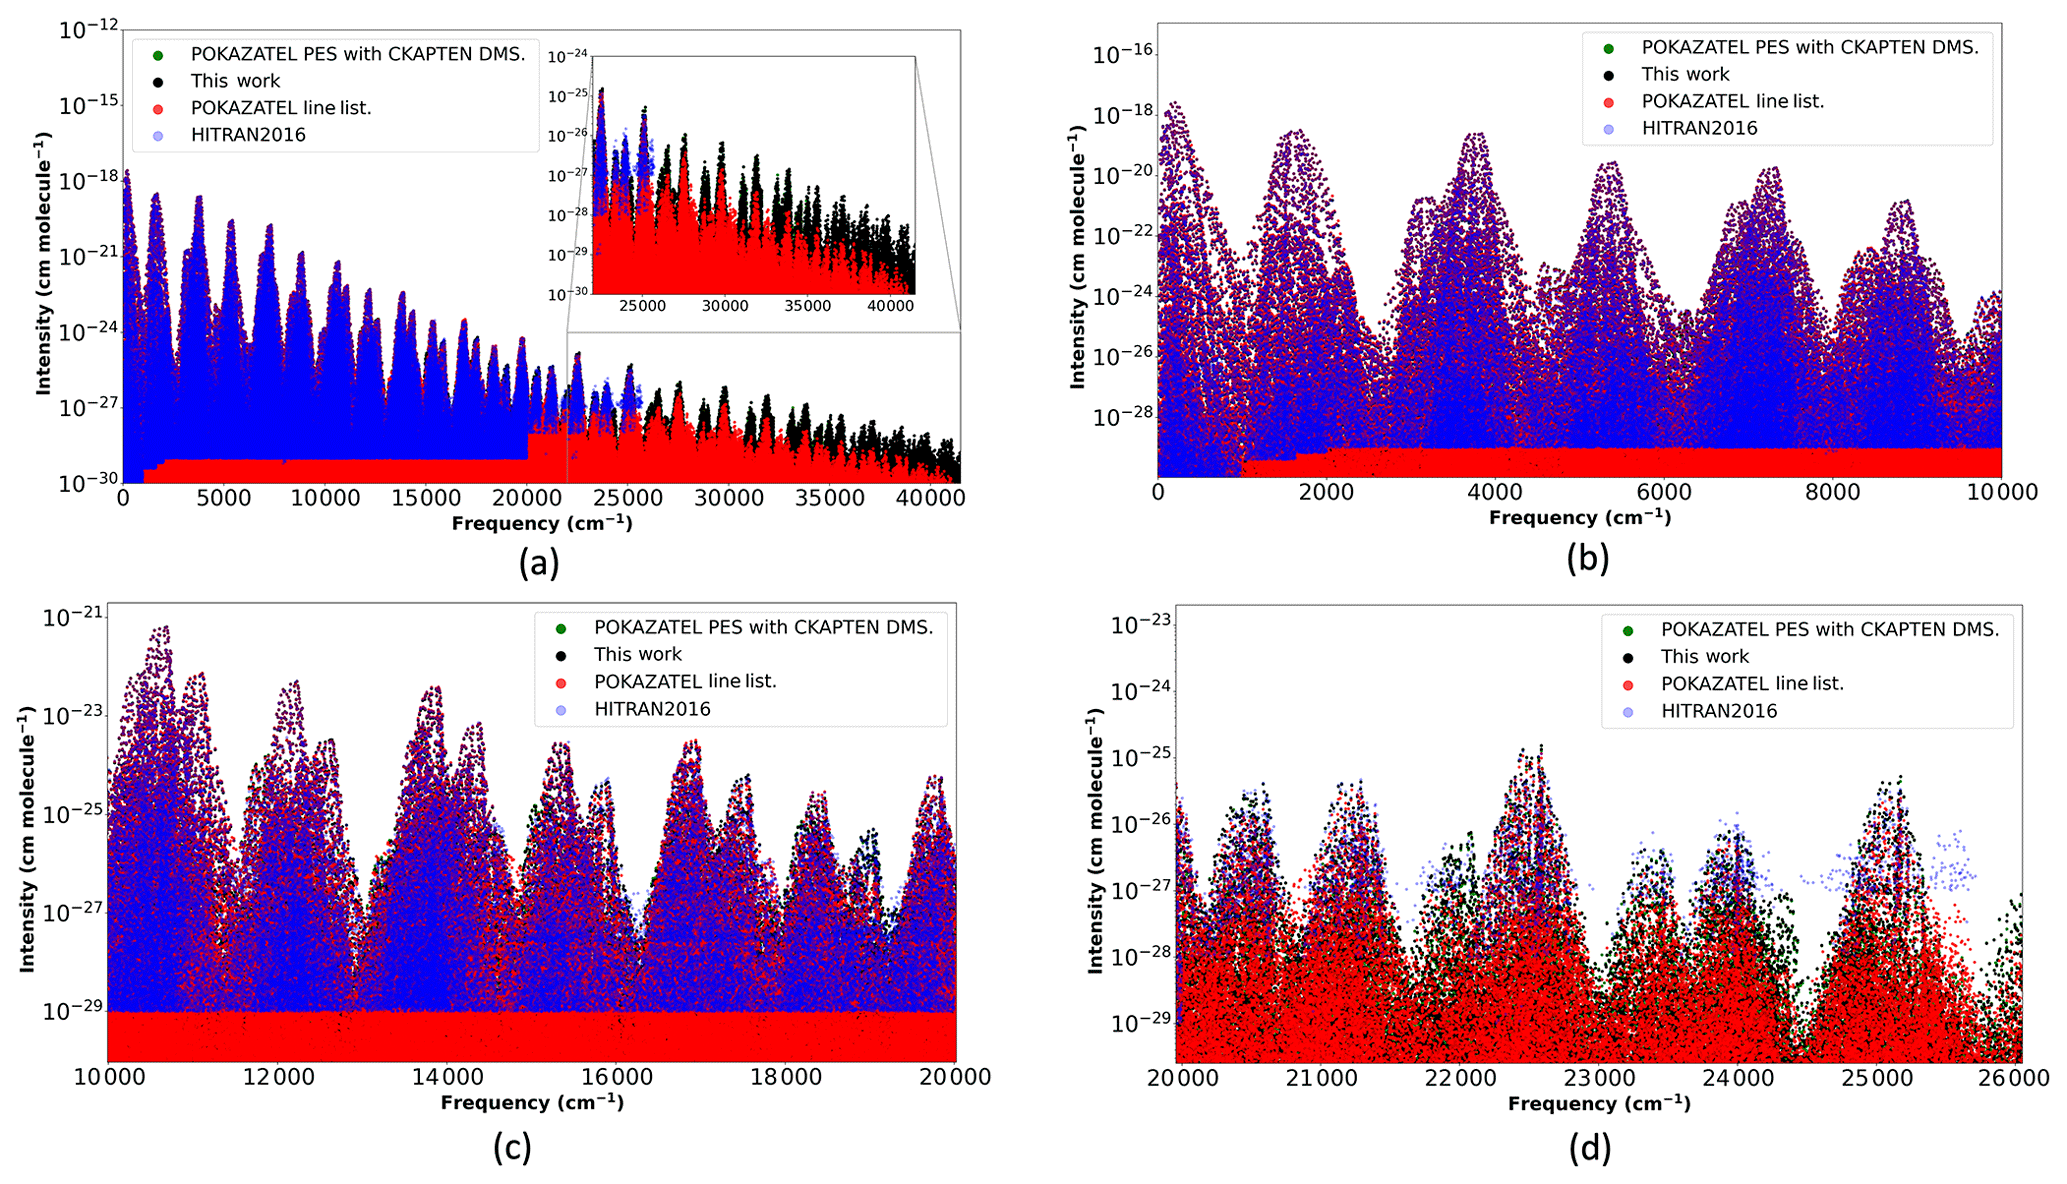
Figure 3Transition intensities from the POKAZATEL line list (Polyansky et al., 2018), this work representing our new PES with the CKAPTEN DMS (Conway et al., 2018), the POKAZATEL PES combined with the CKAPTEN DMS and HITRAN2016 (Gordon et al., 2017).
3.2 Calculation of an ultraviolet line list
To generate transition intensities, we require an accurate dipole moment surface. The CKAPTEN (Conway et al., 2018) surface has previously been shown to provide reliable dipole values (Conway et al., 2020a); hence, we will use this DMS to calculate our spectra. We compute a line list for that extends to 41 200 cm−1, i.e. beyond the shortest wavelength that will be accessible by the NASA TEMPO mission, which is 290 nm (Zoogman et al., 2017). The accuracy of this line list is not verified for transitions with frequencies beyond 37 000 cm−1, and this region may be susceptible to basis set convergence issues. In HITRAN (Gordon et al., 2017) units, the minimum intensity considered here is 10−32 cm molecule−1 and Jmax=20, all assuming 296 K. There are no transitions in the near-ultraviolet that include J=20 which have intensities surpassing our 10−32 cm molecule−1 threshold. We then proceed to “MARVELize” this line list, meaning we replace, where possible, our calculated energy levels with empirical ones from MARVEL, which also allows us to add extra quantum labels (Ka, Kc, ν1, ν2, ν3) on top of the rigorous labels J, parity and symmetry. This process is described in more detail in Conway et al. (2020a).
In an earlier study (Conway et al., 2018), we generated near-ultraviolet spectra with the POKAZATEL potential and CKAPTEN DMS; although, the thresholds used were different to those used here. The maximum transition frequency considered in the previous study was 35 000 cm−1 with Jmax=14, and the minimum intensity considered was 10−30 cm molecule−1. But these criteria should be sufficient for comparison studies in the near-ultraviolet. Comparing these calculations to our new ones will allow us to ascertain how different potential surfaces influence intensities.
In Fig. 3, we plot transition intensities from our new calculations, the POKAZATEL line list, HITRAN2016 and our old calculations previously described. For transitions in the infrared, shown in Fig. 3b, the line lists show little deviation from each other; however, as transitions extend further into the blue, differences become significantly more pronounced and, in general, the POKAZATEL intensities appear too weak. At 19 000 cm−1, the first absorption feature not well represented by the POKAZATEL line list appears; see Fig. 3c. For wavelengths extending from 500 to 400 nm, transition intensities in the HITRAN2016 line list are of comparable magnitude to ours and are, in general, made up from previously published theoretical models, notably BT2 (Barber et al., 2006) and Lodi et al. (2011) data. Atmospheric observations by Lampel et al. (2017) suggest HITEMP2010 (Rothman et al., 2010) (mostly BT2 data) predicts absorption features of water vapour in the visible more accurately than the POKAZATEL line list; hence, it is reasonable to assume POKAZATEL also under-absorbs at 19 000 cm−1. However, at the 400 nm limit of HITRAN2016, we begin to notice larger differences in the intensities; although, our new data agrees much better with POKAZATEL; see Fig. 3d.
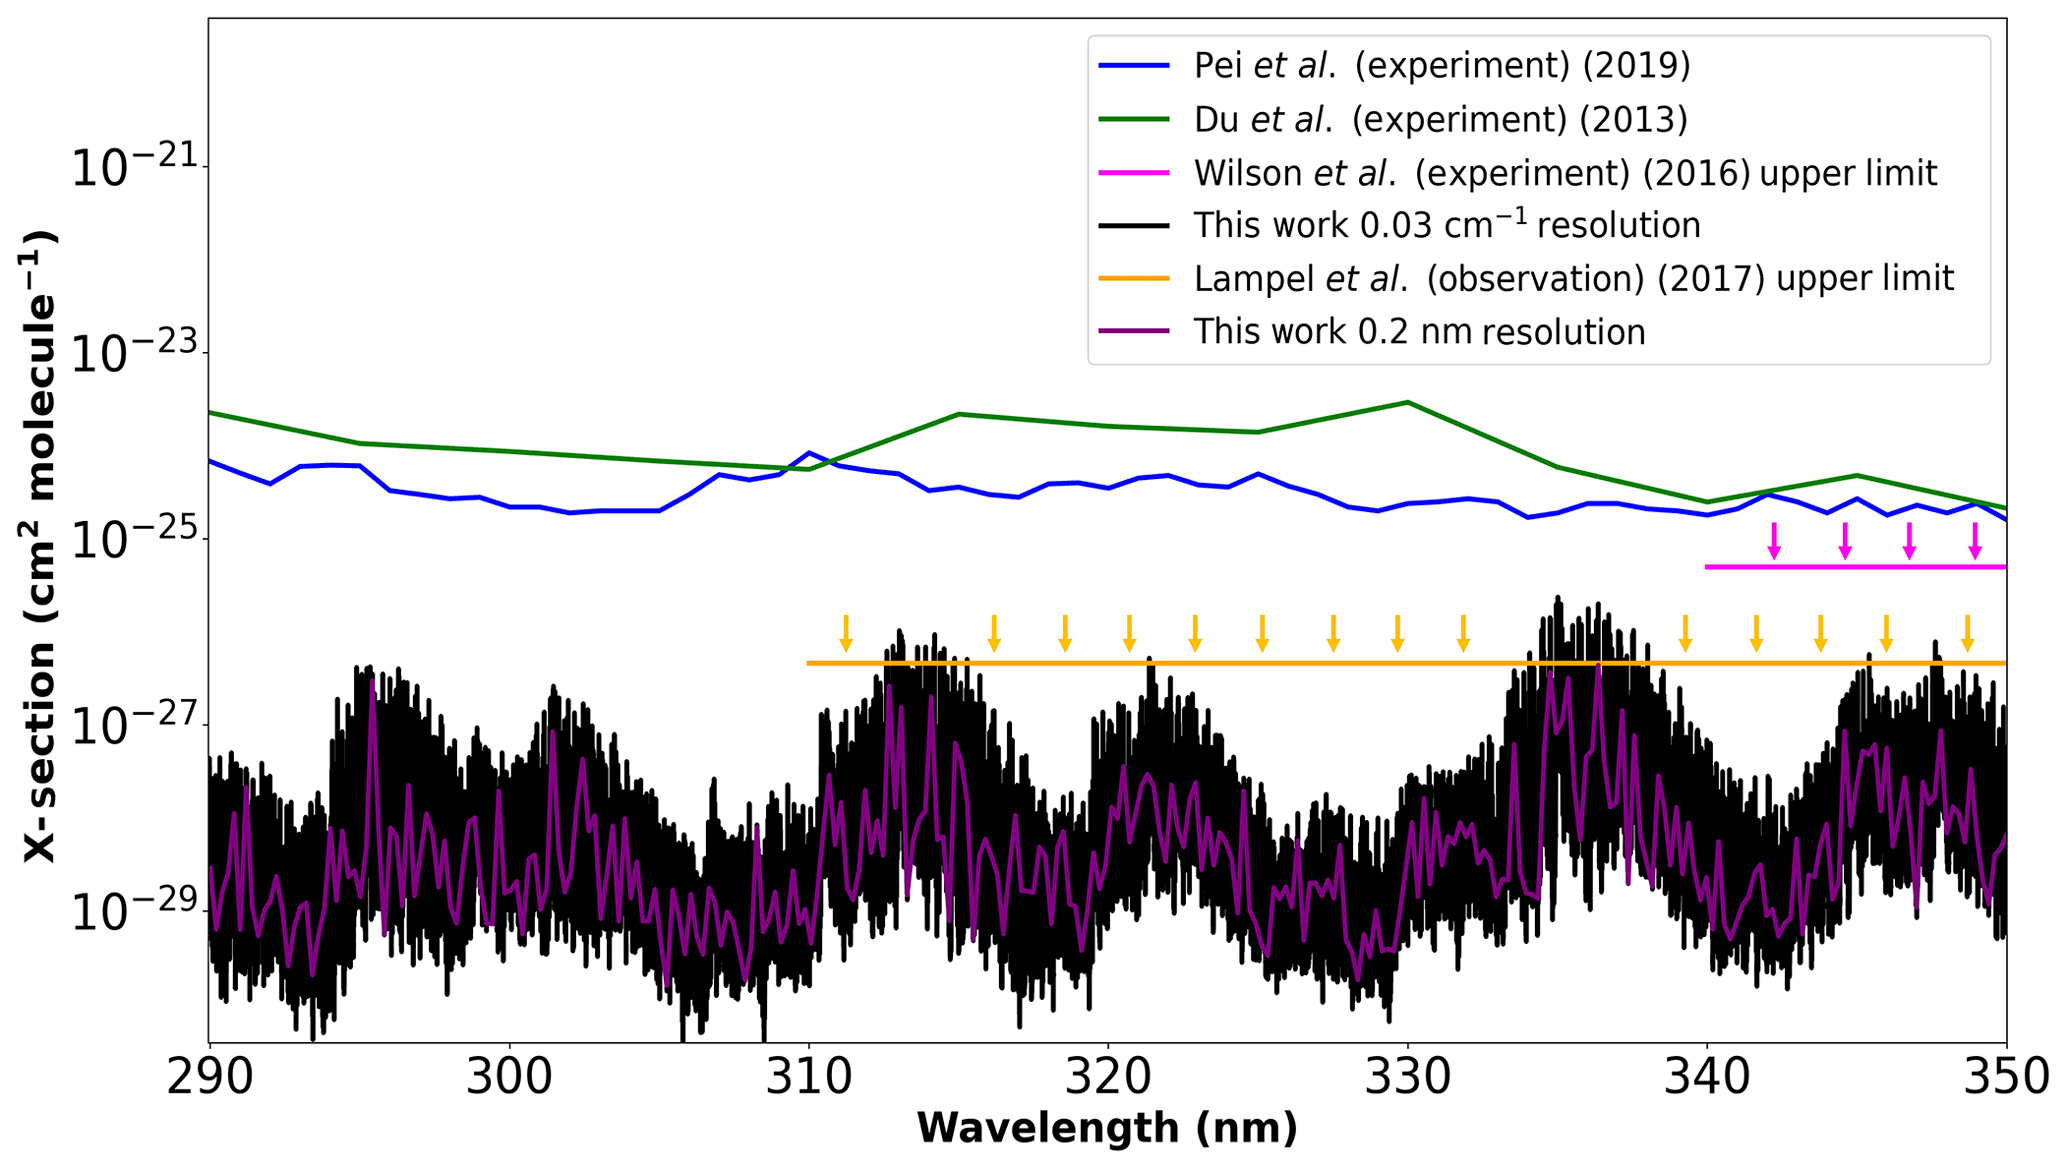
Figure 4Cross sections calculated using our new PES with the CKAPTEN DMS (Conway et al., 2018) at two different resolutions, compared to the measurements by Du et al. (2013), Pei et al. (2020), and the upper limits by Wilson et al. (2016) and Lampel et al. (2017).
Comparing our new line list to the old calculations indicates that the new potential does not greatly alter the intensities, which was expected as, for stable transitions, the DMS controls the magnitude of the absorption (Lodi and Tennyson, 2012). Hence, the differences which are observed in the near-ultraviolet are due to differences in the underlying dipole surfaces. The POKAZATEL line list was computed with the LTP2011S surface by Lodi et al. (2011), where “S” signifies that this surface is a fewer-parameter fit to their ab initio dipoles and is therefore more stable in energetic regions.
Lampel et al. (2017) evaluated this POKAZATEL line list in the near-ultraviolet and comments that the feature at approximately 363 nm is underestimated by a factor of 2.4±0.7, where the largest contribution to this uncertainty is from the observation. In Fig. 3a, there is a visible drop in the calculated POKAZATEL cross sections that begin just beyond 25 000 cm−1. To verify that our new line list correctly models this feature, we sum transition intensities in both line lists that are within 27 000–27 800 cm−1. The ratio of our summed intensities to POKAZATEL is 3.08, which is within the uncertainty by Lampel et al. (2017). Despite this improvement, further validation is required to verify the entire line list. Future work is planned for this.
In 2013, Du et al. (2013) report measurements of a strong, broadband near-ultraviolet absorption spectrum of water in the 350–290 nm region; these absorptions could not be detected by Wilson et al. (2016). The instrumental setup used by Wilson et al. (2016) enabled them to place an upper limit of absorption in this region of cm2 molecule−1. Lampel et al. (2017) also placed several upper limits on the absorption of water vapour in the region of 350–310 nm with different uncertainties. Of these, we consider the weakest upper limit to compare with as it has the lowest uncertainty. This limit is cm2 molecule−1 at a 0.7 nm resolution. More recently, Pei et al. (2020) made new measurements in the same region. In order to generate cross sections, we apply approximate air-broadening coefficients (γair) which are computed as functions of J′ and J′′ (Rothman et al., 2010) to our new line list, and we calculate cross sections using the HITRAN API (HAPI) code (Kochanov et al., 2016) at resolutions of 0.03 cm−1 and 0.2 nm with the Voigt profile. It is important to note that the cross sections reported by Pei et al. (2020) are in 1 nm step sizes and those from Du et al. (2013) are given in 5 nm intervals. Figure 4 compares our calculations to each of these data sets. The new measurements by Pei et al. (2020) give cross sections of comparable magnitude to those by Du et al. (2013) but do not resemble any feature in our line list. The data sets from Du et al. (2013) and Pei et al. (2020) are taken directly from their publications and have not been altered by us in any way. Importantly our calculated cross sections do not exceed the upper limit of Wilson et al. (2016) at any resolution considered, while our 0.2 nm resolution cross sections do not exceed the proposed 0.7 nm resolution upper limit by Lampel et al. (2017).
Both Pei et al. (2020) and Du et al. (2013) suggest that water vapour absorption in the 290–350 nm window should be on the order of 10−24 cm molecule−1, which is of comparable magnitude to features observed at 20 000–22 750 cm−1 (see Fig. 3a) (500–450 nm). Pei et al. (2020) suggest that this increased water vapour absorption is due to an absorption band between different electronic states; however, the nearest electronic state is an unbound 1B1 state which corresponds to the spectral feature at approximately 170 nm as confirmed by numerous experiments (Chung et al., 2001; Mota et al., 2005; Cantrell et al., 1997b, a; Ranjan et al., 2020). These experiments show that absorption decreases exponentially with increasing wavelength (i.e. decrease of the wavenumber), as expected considering that the upper state is unbound. In order for these electronic transitions to absorb more in the red, one needs to populate high vibrational levels of the ground state, which is not possible at atmospheric temperatures. At room temperature, this band is unlikely to affect absorption in this 290–350 nm interval to the degree quoted by Pei et al. (2020) Conversely, our line list, which predicts greatly reduced cross sections in this region, appears to be in line with atmospheric observations. We are currently collaborating with atmospheric scientists at the Center for Astrophysics | Harvard & Smithsonian (Wang et al., 2014, 2019; Gonzalez Abad et al., 2019) to further investigate this near-ultraviolet absorption by water vapour, but this effort would greatly benefit from further experimental research. Initial tests will focus on data obtained from the Ozone Monitoring Instrument (OMI) (Levelt et al., 2018).
Our calculated line list is available in the Supplement and assumes 100 % isotopic abundance.
A new semi-empirical potential energy surface for the main water vapour isotopologue is created by refining (Yurchenko et al., 2003) the ab initio model to approximately 4000 MARVEL (Furtenbacher et al., 2020) energy levels. These states extend to 37 000 cm−1 and possess total angular momenta values of J=0, 2, 5, 10, 15 and 20. By considering such a large range of total angular momenta, we manage to accurately recover the rotational behaviour of the energy levels. Comparisons made against the most recent semi-empirical potential energy surfaces (PESs) for water vapour (Mizus et al., 2018; Polyansky et al., 2018) show our new surface provides lower residuals. For energy levels in J=20, our new surface predicts MARVEL states with an RMSE of 0.056 cm−1, which is a significant improvement to the 0.13 cm−1 RMSE obtained with the POKAZATEL PES. At high temperatures, transitions between such high J states become significantly more prominent when compared to room temperature; hence, this potential will offer improvements in calculated line positions.
Combining our new surface with the CKAPTEN (Conway et al., 2018) dipole moment surface (DMS), we calculate a line list which extends to 41 200 cm−1, slightly beyond dissociation, and includes transitions with Jmax=20, possessing a minimum intensity threshold of 10−32 cm molecule−1. This line list is, however, not verified for transitions between 37 000 and 41 200 cm−1, and basis set convergence issues may arise and influence line position accuracy.
This DMS has previously been verified through a significant number of comparisons against experimental and theoretical sources (Conway et al., 2020a, b); although, not much is known in the near-ultraviolet. Comparisons of our new line list against the POKAZATEL list indicate that there are relatively large differences in the visible and near-ultraviolet regions and POKAZATEL underestimates the absorption. We show that the change in potential is not the underlying cause of the discrepancies but rather the change in the DMS.
For wavelengths below 400 nm, the POKAZATEL absorption features drop almost systematically, which explains the under-absorption observed at 363 nm (Lampel et al., 2017). The absorption calculated in our new list does not have this systematic drop. Several experimental measurements in the 350–290 nm region have previously been performed (Du et al., 2013; Pei et al., 2020; Wilson et al., 2016); although, none agree with each other. Our calculations suggest the upper limits of absorption of Wilson et al. (2016) and Lampel et al. (2017) are correct, while the other sources (Du et al., 2013; Pei et al., 2020) appear to overestimate cross sections by at least an order of magnitude. In the recent study by Medvedev et al. (2020), it is shown that calculated intensities using the CKAPTEN DMS follow a normal intensity distribution (NID) where it is appropriate and therefore are not expected to be in error that could explain the differences in absorption observed in the experiments by Du et al. (2013) and Pei et al. (2020) In particular, the absorption predicted by Du et al. (2013) or Pei et al. (2020) in the near-ultraviolet would interfere with atmospheric retrievals in a manner which is simply not observed (Lampel et al., 2017). Further experimental work on the near-ultraviolet absorption by water vapour is therefore required to resolve these issues.
Considering the improvements this new potential surface has to offer for high-temperature spectra, future work is planned for this. The potential energy surface is available in the Supplement as a FORTRAN F90 file along with the calculated line list assuming 100 % abundance. This line list will be proposed for the HITRAN2020 water line list in the visible and ultraviolet where it will be supplied with best available experimental data, including that by Dupre et al. (2005). In addition particular attention will be given to improve broadening parameters. The calculated line list will also be added to the ExoMol (Tennyson et al., 2016) website in the ExoMol format.
The Fortran code for the potential energy surface is provided in the Supplement. The data for this article is also provided in the Supplement.
The supplement related to this article is available online at: https://doi.org/10.5194/acp-20-10015-2020-supplement.
EKC performed the theoretical calculations and created all figures and tables under the supervision and guidance of IEG, JT, OLP, SNY and KC. SNY contributed to the refinement procedure of the potential energy surface. EKC wrote the initial article, and all authors contributed to the final article.
The authors declare that they have no conflict of interest.
The authors would like to thank Tibor Furtenbacher and Attila G. Császár for providing energy levels originating from a provisional update to the MARVEL database. The computations performed for this paper were conducted on the Smithsonian High Performance Cluster (SI/HPC), Smithsonian Institution. https://doi.org/10.25572/SIHPC.
This research has been supported by the UK Natural Environment Research Council (grant no. NE/T000767/1), NASA Aura (grant no. NNX17AI78G), NASA PDART (grant no. NNX16AG51G), and the STFC (Science and Technology Facilities Council) (grant no. ST/R000476/1).
This paper was edited by Sergey A. Nizkorodov and reviewed by Alain Campargue and two anonymous referees.
Barber, R. J., Tennyson, J., Harris, G. J., and Tolchenov, R. N.: A high accuracy computed water line list, Mon. Not. R. Astron. Soc., 368, 1087–1094, https://doi.org/10.1111/j.1365-2966.2006.10184.x, 2006. a
Borger, C., Beirle, S., Dörner, S., Sihler, H., and Wagner, T.: Total column water vapour retrieval from S-5P/TROPOMI in the visible blue spectral range, Atmos. Meas. Tech., 13, 2751–2783, https://doi.org/10.5194/amt-13-2751-2020, 2020. a
Boyarkin, O. V., Koshelev, M. A., Aseev, O., Maksyutenko, P., Rizzo, T. R., Zobov, N. F., Lodi, L., Tennyson, J., and Polyansky, O. L.: Accurate bond dissociation energy of water determined by triple-resonance vibrational spectroscopy and ab initio calculations, Chem. Phys. Lett., 568-569, 14–20, https://doi.org/10.1016/j.cplett.2013.03.007, 2013. a
Bubukina, I. I., Polyansky, O. L., Zobov, N. F., and Yurchenko, S. N.: Optimized semiempirical potential energy surface for HO up to 26000 cm−1, Optics Spectrosc., 110, 160–166, https://doi.org/10.1134/S0030400X11020032, 2011. a, b, c, d, e, f, g, h, i
Bunker, P. R. and Moss, R. E.: Effect of the Breakdown of the Born-Oppenheimer Approximation on the Rotation-Vibration Hamiltonian of a Triatomic Molecule, J. Mol. Spectrosc., 80, 217–228, 1980. a
Cantrell, C. A., Davidson, J. A., McDaniel, A. H., Shetter, R. E., and Calvert, J. G.: Temperature-dependent formaldehyde cross sections in the near-ultraviolet spectral region, J. Phys. Chem., 94, 3902–3908, https://doi.org/10.1021/j100373a008, 1990. a
Cantrell, C. A., Zimmer, A., and Tyndall, G. S.: Correction to “Absorption cross sections for water vapor from 183 to 193 nm”, Geophys. Res. Lett., 24, 2687–2687, https://doi.org/10.1029/97GL02803, 1997a. a
Cantrell, C. A., Zimmer, A., and Tyndall, G. S.: Absorption cross sections for water vapor from 183 to 193 nm, Geophys. Res. Lett., 24, 2195–2198, https://doi.org/10.1029/97GL02100, 1997b. a
Chung, C.-Y., Chew, E. P., Bing-Ming Cheng, M. B., and Lee, Y.-P.: Temperature dependence of absorption cross-section of H2O, HOD, and D2O in the spectral region 140–193 nm, Nucl. Instrum. Meth. A, 467-468, 1572–1576, https://doi.org/10.1016/S0168-9002(01)00762-8, 2001. a
Coles, P. A., Ovsyannikov, R. I., Polyansky, O. L., Yurchenko, S. N., and Tennyson, J.: Improved potential energy surface and spectral assignments for ammonia in the near-infrared region, J. Quant. Spectrosc. Ra., 219, 199–212, https://doi.org/10.1016/j.jqsrt.2018.07.022, 2018. a
Coles, P. A., Yurchenko, S. N., Kovacich, R. P., Hobby, J., and Tennyson, J.: A variationally computed room temperature line list for AsH3, Phys. Chem. Chem. Phys., 21, 3264–3277, https://doi.org/10.1039/C8CP07110A, 2019. a
Conway, E. K., Kyuberis, A. A., Polyansky, O. L., Tennyson, J., and Zobov, N.: A highly accurate ab initio dipole moment surface for the ground electronic state of water vapour for spectra extending into the ultraviolet, J. Chem. Phys., 149, 084307, https://doi.org/10.1063/1.5043545, 2018. a, b, c, d, e, f, g
Conway, E. K., Gordon, I. E., Kyuberis, A. A., Polyansky, O. L., Tennyson, J., and Zobov, N. F.: Accurate line lists for HO, HO and H217O with extensive comparisons to theoretical and experimental sources including the HITRAN2016 database, J. Quant. Spectrosc. Ra., 241, 106711, https://doi.org/10.1016/j.jqsrt.2019.106711, 2020a. a, b, c, d
Conway, E. K., Gordon, I. E., Polyansky, O. L., and Tennyson, J.: Use of the complete basis set limit for computing highly accurate ab initio dipole moments, J. Chem. Phys., 152, 024105, https://doi.org/10.1063/1.5135931, 2020b. a
Császár, A. G., Czakó, G., Furtenbacher, T., and Mátyus, E.: An active database approach to complete rotational–vibrational spectra of small molecules, Annu. Rep. Comput. Chem., 3, 155–176, https://doi.org/10.1016/S1574-1400(07)03009-5, 2007. a
Delahaye, T., Nikitin, A., Rey, M., Szalay, P. G., and Tyuterev, V. G.: A new accurate ground-state potential energy surface of ethylene and predictions for rotational and vibrational energy levels, J. Chem. Phys., 141, 104301, https://doi.org/10.1063/1.4894419, 2014. a
Du, J., Huang, L., Min, Q., and Zhu, L.: The influence of water vapor absorption in the 290–350 nm region on solar radiance: Laboratory studies and model simulation, Geophys. Res. Lett., 40, 4788–4792, https://doi.org/10.1002/grl.50935, 2013. a, b, c, d, e, f, g, h, i, j, k, l
Dunning, T. H.: Gaussian basis sets for use in correlated molecular calculations. I. The atoms boron through neon and hydrogen , J. Chem. Phys., 90, 1007–1023, https://doi.org/10.1063/1.456153, 1989. a
Dupre, P., Germain, T., Zobov, N. F., Tolchenov, R. N., and Tennyson, J.: Continuous Wave – Cavity ring down near ultraviolet rotation-vibration spectrum of water, J. Chem. Phys., 123, 154307, https://doi.org/10.1063/1.2055247, 2005. a, b
Fleischmann, O. C., Hartmann, M., Burrows, J. P., and Orphal, J.: New ultraviolet absorption cross-sections of BrO at atmospheric temperatures measured by time-windowing Fourier transform spectroscopy, J. Photoch. Photobio. A, 168, 117–132, https://doi.org/10.1016/j.jphotochem.2004.03.026, 2004. a
Fleming, B. T., France, K. C., Nell, N., Kohnert, R. A., Pool, K., Egan, A., Fossati, L., Koskinen, T. T., Vidotto, A. A., Hoadley, K., Desert, J.-M., Beasley, M., and Petit, P. M.: Colorado Ultraviolet Transit Experiment: a dedicated CubeSat mission to study exoplanetary mass loss and magnetic fields, Journal of Astronomical Telescopes, Instruments, and Systems, 4, 1–10, https://doi.org/10.1117/1.JATIS.4.1.014004, 2018. a
Furtenbacher, T. and Császár, A. G.: MARVEL: measured active rotational-vibrational energy levels. II. Algorithmic improvements, J. Quant. Spectrosc. Ra., 113, 929–935, https://doi.org/10.1016/j.jqsrt.2012.01.005, 2012. a
Furtenbacher, T., Császár, A. G., and Tennyson, J.: MARVEL: measured active rotational-vibrational energy levels, J. Mol. Spectrosc., 245, 115–125, https://doi.org/10.1016/j.jms.2007.07.005, 2007. a
Furtenbacher, T., Tóbiás, R., Tennyson, J., Polyansky, O. L., and Császár, A. G.: W2020: A Database of Validated Rovibrational Experimental Transitions and Empirical Energy Levels of H216O, J. Phys. Chem. Ref. Data, 49, 033101, https://doi.org/10.1063/5.0008253, 2020. a, b, c, d
Gonzalez Abad, G., Hossein Souri, A., Bak, J., Chance, K., Flynn, L. E., Krotkov, N. A., Lamsal, L., Li, C., Liu, X., Chan Miller, C., Nowlan, C. R., Suleiman, R., and Wang, H.: Five decades observing Earth's atmospheric trace gases using ultraviolet and visible backscatter solar radiation from space, J. Quant. Spectrosc. Ra., 238, 106478, https://doi.org/10.1016/j.jqsrt.2019.04.030, 2019. a, b
Gordon, I. E., Rothman, L. S., Hill, C., Kochanov, R. V., Tan, Y., Bernath, P. F., Birk, M., Boudon, V., Campargue, A., Chance, K. V., Drouin, B. J., Flaud, J.-M., Gamache, R. R., Hodges, J. T., Jacquemart, D., Perevalov, V. I., Perrin, A., Shine, K. P., Smith, M.-A. H., Tennyson, J., Toon, G. C., Tran, H., Tyuterev, V. G., Barbe, A., Császár, A. G., Devi, V. M., Furtenbacher, T., Harrison, J. J., Hartmann, J.-M., Jolly, A., Johnson, T. J., Karman, T., Kleiner, I., Kyuberis, A. A., Loos, J., Lyulin, O. M., Massie, S. T., Mikhailenko, S. N., Moazzen-Ahmadi, N., Müller, H. S. P., Naumenko, O. V., Nikitin, A. V., Polyansky, O. L., Rey, M., Rotger, M., Sharpe, S. W., Sung, K., Starikova, E., Tashkun, S. A., Vander Auwera, J., Wagner, G., Wilzewski, J., Wcisło, P., Yu, S., and Zak, E. J.: The HITRAN 2016 molecular spectroscopic database, J. Quant. Spectrosc. Ra., 203, 3–69, https://doi.org/10.1016/j.jqsrt.2017.06.038, 2017. a, b, c
Grechko, M., Boyarkin, O. V., Rizzo, T. R., Maksyutenko, P., Zobov, N. F., Shirin, S., Lodi, L., Tennyson, J., Császár, A. G., and Polyansky, O. L.: State-selective spectroscopy of water up to its first dissociation limit, J. Chem. Phys., 131, 221105, https://doi.org/10.1063/1.3273207, 2009. a
Grechko, M., Maksyutenko, P., Rizzo, T. R., and Boyarkin, O. V.: Communication: Feshbach resonances in the water molecule revealed by state-selective spectroscopy, J. Chem. Phys., 133, 081103, https://doi.org/10.1063/1.3472312, 2010. a
Huang, X., Schwenke, D. W., Tashkun, S. A., and Lee, T. J.: An isotopic-independent highly accurate potential energy surface for CO2 isotopologues and an initial 12C16O2 infrared line list, J. Chem. Phys., 136, 124311, https://doi.org/10.1063/1.3697540, 2012. a
Kim, J., Jeong, U., Ahn, M.-H., Kim, J. H., Park, R. J., Lee, H., Song, C. H., Choi, Y.-S., Lee, K.-H., Yoo, J.-M., Jeong, M.-J., Park, S. K., Lee, K.-M., Song, C.-K., Kim, S.-W., Kim, Y., Kim, S.-W., Kim, M., Go, S., Liu, X., Chance, K., Chan Miller, C., Al-Saadi, J., Veihelmann, B., Bhartia, P. K., Torres, O., Abad, G. G., Haffner, D. P., Ko, D. H., Lee, S. H., Woo, J.-H., Chong, H., Park, S. S., Nicks, D., Choi, W. J., Moon, K.-J., Cho, A., Yoon, J., Kim, S.-k., Hong, H., Lee, K., Lee, H., Lee, S., Choi, M., Veefkind, P., Levelt, P., Edwards, D. P., Kang, M., Eo, M., Bak, J., Baek, K., Kwon, H.-A., Yang, J., Park, J., Han, K. M., Kim, B.-R., Shin, H.-W., Choi, H., Lee, E., Chong, J., Cha, Y., Koo, J.-H., Irie, H., Hayashida, S., Kasai, Y., Kanaya, Y., Liu, C., Lin, J., Crawford, J. H., Carmichael, G. R., Newchurch, M. J., Lefer, B. L., Herman, J. R., Swap, R. J., Lau, A. K. H., Kurosu, T. P., Jaross, G., Ahlers, B., Dobber, M., McElroy, C., and Choi, Y.: New Era of Air Quality Monitoring from Space: Geostationary Environment Monitoring Spectrometer (GEMS), B. Am. Meteorol. Soc., 101, E1–E22, https://doi.org/10.1175/bams-d-18-0013.1, 2020. a
Kochanov, R. V., Gordon, I. E., Rothman, L. S., Wcisło, P., Hill, C., and Wilzewski, J. S.: HITRAN Application Programming Interface (HAPI): A comprehensive approach to working with spectroscopic data, J. Quant. Spectrosc. Ra., 177, 15–30, https://doi.org/10.1016/j.jqsrt.2016.03.005, 2016. a
Lampel, J., Pöhler, D., Tschritter, J., Frieß, U., and Platt, U.: On the relative absorption strengths of water vapour in the blue wavelength range, Atmos. Meas. Tech., 8, 4329–4346, https://doi.org/10.5194/amt-8-4329-2015, 2015. a
Lampel, J., Pöhler, D., Polyansky, O. L., Kyuberis, A. A., Zobov, N. F., Tennyson, J., Lodi, L., Frieß, U., Wang, Y., Beirle, S., Platt, U., and Wagner, T.: Detection of water vapour absorption around 363 nm in measured atmospheric absorption spectra and its effect on DOAS evaluations, Atmos. Chem. Phys., 17, 1271–1295, https://doi.org/10.5194/acp-17-1271-2017, 2017. a, b, c, d, e, f, g, h, i, j, k
Levelt, P. F., Joiner, J., Tamminen, J., Veefkind, J. P., Bhartia, P. K., Stein Zweers, D. C., Duncan, B. N., Streets, D. G., Eskes, H., van der A, R., McLinden, C., Fioletov, V., Carn, S., de Laat, J., DeLand, M., Marchenko, S., McPeters, R., Ziemke, J., Fu, D., Liu, X., Pickering, K., Apituley, A., González Abad, G., Arola, A., Boersma, F., Chan Miller, C., Chance, K., de Graaf, M., Hakkarainen, J., Hassinen, S., Ialongo, I., Kleipool, Q., Krotkov, N., Li, C., Lamsal, L., Newman, P., Nowlan, C., Suleiman, R., Tilstra, L. G., Torres, O., Wang, H., and Wargan, K.: The Ozone Monitoring Instrument: overview of 14 years in space, Atmos. Chem. Phys., 18, 5699–5745, https://doi.org/10.5194/acp-18-5699-2018, 2018. a, b, c
Lodi, L. and Tennyson, J.: Theoretical methods for small-molecule ro-vibrational spectroscopy, J. Phys. B, 43, 133001, https://doi.org/10.1088/0953-4075/43/13/133001, 2010. a
Lodi, L. and Tennyson, J.: Line lists for H218O and H217O based on empirically-adjusted line positions and ab initio intensities, J. Quant. Spectrosc. Ra., 113, 850–858, https://doi.org/10.1016/j.jqsrt.2012.02.023, 2012. a
Lodi, L., Tennyson, J., and Polyansky, O. L.: A global, high accuracy ab initio dipole moment surface for the electronic ground state of the water molecule, J. Chem. Phys., 135, 034113, https://doi.org/10.1063/1.3604934, 2011. a, b, c
Mant, B. P., Yachmenev, A., Tennyson, J., and Yurchenko, S. N.: ExoMol molecular line lists – XXVII: spectra of C2H4, Mon. Not. R. Astron. Soc., 478, 3220–3232, https://doi.org/10.1093/mnras/sty1239, 2018. a
McKemmish, L. K., Masseron, T., Hoeijmakers, J., Pérez-Mesa, V. V., Grimm, S. L., Yurchenko, S. N., and Tennyson, J.: ExoMol Molecular line lists – XXXIII. The spectrum of Titanium Oxide, Mon. Not. R. Astron. Soc., 488, 2836–2854, https://doi.org/10.1093/mnras/stz1818, 2019. a
Medvedev, E. S., Ushakov, V. G., Conway, E. K., Upadhyay, A., Gordon, I. E., and Tennyson, J.: Empirical normal intensity distribution for overtone vibrational spectra of triatomic molecules, J. Quant. Spectrosc. Ra., 252, 107084, https://doi.org/10.1016/j.jqsrt.2020.107084, 2020. a
Mizus, I. I., Kyuberis, A. A., Zobov, N. F., Makhnev, V. Y., Polyansky, O. L., and Tennyson, J.: High accuracy water potential energy surface for the calculation of infrared spectra, Philos. Tr. R. Soc. S.-A, 376, 20170149, https://doi.org/10.1098/rsta.2017.0149, 2018. a, b, c, d, e, f, g, h, i, j
Mota, R., Parafita, R., Giuliani, A., Hubin-Franskin, M.-J., Lourenço, J. M. C., Garcia, G., Hoffmann, S. V., Mason, N. J., Ribeiro, P. A., Raposo, M., and ao Vieira, P. L.: Water VUV electronic state spectroscopy by synchrotron radiation, Chem. Phys. Lett., 416, 152–159, https://doi.org/10.1016/j.cplett.2005.09.073, 2005. a
Noël, S., Buchwitz, M., and Burrows, J. P.: First retrieval of global water vapour column amounts from SCIAMACHY measurements, Atmos. Chem. Phys., 4, 111–125, https://doi.org/10.5194/acp-4-111-2004, 2004. a
Owens, A., Yachmenev, A., Tennyson, J., Thiel, W., and Yurchenko, S. N.: ExoMol Molecular line lists XXIX: The rotation-vibration spectrum of methyl chloride up to 1200 K, Mon. Not. R. Astron. Soc., 479, 3002–3010, https://doi.org/10.1093/mnras/sty1542, 2018. a
Partridge, H. and Schwenke, D. W.: The determination of an accurate isotope dependent potential energy surface for water from extensive ab initio calculations and experimental data, J. Chem. Phys., 106, 4618–4639, https://doi.org/10.1063/1.473987, 1997. a, b, c, d, e
Pei, L., Min, Q., Du, Y., Wang, Z., Yin, B., Yang, K., Disterhoft, P., Pongetti, T., and Zhu, L.: Water Vapor Near-UV Absorption: Laboratory Spectrum, Field Evidence, and Atmospheric Impacts, J. Geophys. Res.-Atmos., 124, 14310–14324, https://doi.org/10.1029/2019JD030724, 2020. a, b, c, d, e, f, g, h, i, j, k, l, m, n
Peterson, K. A. and Dunning, T. H.: Accurate correlation consistent basis sets for molecular core–valence correlation effects: The second row atoms Al–Ar, and the first row atoms B–Ne revisited, J. Chem. Phys., 117, 10548, https://doi.org/10.1063/1.1520138, 2002. a
Polyansky, O. L., Ovsyannikov, R. I., Kyuberis, A. A., Lodi, L., Tennyson, J., and Zobov, N. F.: Calculation of rotation-vibration energy levels of the water molecule with near-experimental accuracy based on an ab initio potential energy surface, J. Phys. Chem. A, 117, 9633–9643, https://doi.org/10.1021/jp312343z, 2013. a, b
Polyansky, O. L., Kyuberis, A. A., Zobov, N. F., Tennyson, J., Yurchenko, S. N., and Lodi, L.: ExoMol molecular line lists XXX: a complete high-accuracy line list for water, Mon. Not. R. Astron. Soc., 480, 2597–2608, https://doi.org/10.1093/mnras/sty1877, 2018. a, b, c, d, e, f, g, h, i, j, k
Pyykkö, P., Dyall, K. G., Császár, A. G., Tarczay, G., Polyansky, O. L., and Tennyson, J.: Lamb shift effects in rotation-vibration spectra of water, Phys. Rev. A, 63, 024502, https://doi.org/10.1103/PhysRevA.63.024502, 2001. a
Quiney, H. M., Barletta, P., Tarczay, G., Császár, A. G., Polyansky, O. L., and Tennyson, J.: Two-electron relativistic corrections to the potential energy surface and vibration-rotation levels of water, Chem. Phys. Lett., 344, 413–420, https://doi.org/10.1016/S0009-2614(01)00784-9, 2001. a
Ranjan, S., Schwieterman, E. W., Harman, C., Fateev, A., Sousa-Silva, C., Seager, S., and Hu, R.: Photochemistry of Anoxic Abiotic Habitable Planet Atmospheres: Impact of New H2O Cross Sections, Astrophys. J., 896, 148, https://doi.org/10.3847/1538-4357/ab9363, 2020. a
Rocha, C. and Varandas, A.: Energy-switching potential energy surface for ground-state C3, Chem. Phys. Lett., 700, 36–43, https://doi.org/10.1016/j.cplett.2018.04.005, 2018. a
Rothman, L., Gordon, I., Barber, R., Dothe, H., Gamache, R., Goldman, A., Perevalov, V., Tashkun, S., and Tennyson, J.: HITEMP, the high-temperature molecular spectroscopic database, J. Quant. Spectrosc. Ra., 111, 2139–2150, https://doi.org/10.1016/j.jqsrt.2010.05.001, 2010. a, b
Schryber, J. H., Polyansky, O. L., Jensen, P., and Tennyson, J.: On the spectroscopically determined the potential energy surfaces for the electronic ground states of NO2 and H2O, J. Mol. Spectrosc., 185, 234–243, https://doi.org/10.1006/jmsp.1997.7407, 1997. a
Schwenke, D. W.: Beyond the Potential Energy Surface: Ab initio Corrections to the Born-Oppenheimer Approximation for H2O, J. Phys. Chem. A, 105, 2352–2360, https://doi.org/10.1021/jp0032513, 2001. a, b, c
Shirin, S. V., Polyansky, O. L., Zobov, N. F., Barletta, P., and Tennyson, J.:Spectroscopically determined potential energy surface of H216O up to 25 000 cm−1, J. Chem. Phys., 118, 2124–2129, https://doi.org/10.1063/1.1532001, 2003. a
Stutz, J., Kim, E. S., Platt, U., Bruno, P., Perrino, C., and Febo, A.: UV-visible absorption cross sections of nitrous acid, J. Geophys. Res., 105, 14585–14592, https://doi.org/10.1029/2000JD900003, 2000. a
Tennyson, J., Kostin, M. A., Barletta, P., Harris, G. J., Polyansky, O. L., Ramanlal, J., and Zobov, N. F.: DVR3D: a program suite for the calculation of rotation-vibration spectra of triatomic molecules, Comput. Phys. Commun., 163, 85–116, https://doi.org/10.1016/j.cpc.2003.10.003, 2004. a, b
Tennyson, J., Bernath, P. F., Brown, L. R., Campargue, A., Carleer, M. R., Császár, A. G., Daumont, L., Gamache, R. R., Hodges, J. T., Naumenko, O. V., Polyansky, O. L., Rothmam, L. S., Vandaele, A. C., Zobov, N. F., Al Derzi, A. R., Fábri, C., Fazliev, A. Z., Furtenbacher, T., Gordon, I. E., Lodi, L., and Mizus, I. I.: IUPAC critical evaluation of the rotational-vibrational spectra of water vapor. Part III. Energy levels and transition wavenumbers for H216O, J. Quant. Spectrosc. Ra., 117, 29–80, https://doi.org/10.1016/j.jqsrt.2012.10.002, 2013. a
Tennyson, J., Bernath, P. F., Brown, L. R., Campargue, A., Császár, A. G., Daumont, L., Gamache, R. R., Hodges, J. T., Naumenko, O. V., Polyansky, O. L., Rothman, L. S., Vandaele, A. C., and Zobov, N. F.: A Database of Water Transitions from Experiment and Theory (IUPAC Technical Report), Pure Appl. Chem., 86, 71–83, https://doi.org/10.1515/pac-2014-5012, 2014. a
Tennyson, J., Yurchenko, S. N., Al-Refaie, A. F., Barton, E. J., Chubb, K. L., Coles, P. A., Diamantopoulou, S., Gorman, M. N., Hill, C., Lam, A. Z., Lodi, L., McKemmish, L. K., Na, Y., Owens, A., Polyansky, O. L., Rivlin, T., Sousa-Silva, C., Underwood, D. S., Yachmenev, A., and Zak, E.: The ExoMol database: molecular line lists for exoplanet and other hot atmospheres, J. Mol. Spectrosc., 327, 73–94, https://doi.org/10.1016/j.jms.2016.05.002, 2016. a
Tóbiás, R., Furtenbacher, T., Tennyson, J., and Császár, A. G.: Accurate empirical rovibrational energies and transitions of H216O, Phys. Chem. Chem. Phys., 21, 3473–3495, https://doi.org/10.1039/c8cp05169k, 2019. a
Varandas, A. J. C.: Energy switching approach to potential surfaces: An accurate single-valued function for the water molecule, J. Chem. Phys., 105, 3524–3531, https://doi.org/10.1063/1.473005, 1996. a
Wagner, T., Heland, J., Zöger, M., and Platt, U.: A fast H2O total column density product from GOME – Validation with in-situ aircraft measurements, Atmos. Chem. Phys., 3, 651–663, https://doi.org/10.5194/acp-3-651-2003, 2003. a
Wagner, T., Beirle, S., Sihler, H., and Mies, K.: A feasibility study for the retrieval of the total column precipitable water vapour from satellite observations in the blue spectral range, Atmos. Meas. Tech., 6, 2593–2605, https://doi.org/10.5194/amt-6-2593-2013, 2013. a
Wang, H., Liu, X., Chance, K., González Abad, G., and Chan Miller, C.: Water vapor retrieval from OMI visible spectra, Atmos. Meas. Tech., 7, 1901–1913, https://doi.org/10.5194/amt-7-1901-2014, 2014. a, b
Wang, H., Souri, A. H., González Abad, G., Liu, X., and Chance, K.: Ozone Monitoring Instrument (OMI) Total Column Water Vapor version 4 validation and applications, Atmos. Meas. Tech., 12, 5183–5199, https://doi.org/10.5194/amt-12-5183-2019, 2019. a, b
Wilson, E. M., Wenger, J. C., and Venables, D. S.: Upper limits for absorption by water vapor in the near-UV, J. Quant. Spectrosc. Ra., 170, 194–199, https://doi.org/10.1016/j.jqsrt.2015.11.015, 2016. a, b, c, d, e, f, g, h, i
Woon, D. E. and Dunning Jr., T. H.: Gaussian basis sets for use in correlated molecular calculations. V. Core‐valence basis sets for boron through neon, J. Chem. Phys., 103, 4572–4585, https://doi.org/10.1063/1.470645, 1995. a
Yurchenko, S. N., Carvajal, M., Jensen, P., Herregodts, F., and Huet, T. R.: Potential parameters of PH3 obtained by simultaneous fitting of ab initio data and experimental vibrational band origins, Chem. Phys., 290, 59–67, https://doi.org/10.1016/S0301-0104(03)00098-3, 2003. a, b
Zobov, N. F., Polyansky, O. L., Le Sueur, C. R., and Tennyson, J.: Vibration-rotation levels of water beyond the Born-Oppenheimer approximation, Chem. Phys. Lett., 260, 381–387, https://doi.org/10.1016/0009-2614(96)00872-X, 1996. a
Zoogman, P., Liu, X., Suleiman, R. M., Pennington, W. F., Flittner, D. E., Al-Saadi, J. A., Hilton, B. B., Nicks, D. K., Newchurch, M. J., Carr, J. L., Janz, S. J., Andraschko, M. R., Arola, A., Baker, B. D., Canova, B. P., Miller, C. C., Cohen, R. C., Davis, J. E., Dussault, M. E., Edwards, D. P., Fishman, J., Ghulam, A., Abad, G. G., Grutter, M., Herman, J. R., Houck, J., Jacob, D. J., Joiner, J., Kerridge, B. J., Kim, J., Krotkov, N. A., Lamsal, L., Li, C., Lindfors, A., Martin, R. V., McElroy, C. T., McLinden, C., Natraj, V., Neil, D. O., Nowlan, C. R., O'Sullivan, E. J., Palmer, P. I., Pierce, R. B., Pippin, M. R., Saiz-Lopez, A., Spurr, R. J. D., Szykman, J. J., Torres, O., Veefkind, J. P., Veihelmann, B., Wang, H., Wang, J., and Chance, K.: Tropospheric emissions: Monitoring of pollution (TEMPO), J. Quant. Spectrosc. Ra., 186, 17–39, https://doi.org/10.1016/j.jqsrt.2016.05.008, 2017. a, b