the Creative Commons Attribution 4.0 License.
the Creative Commons Attribution 4.0 License.
 | 02 Jan 2020
Traffic-originated nanocluster emission exceeds H2SO4-driven photochemical new particle formation in an urban area
Heino Kuuluvainen
Minna Aurela
Joni Kalliokoski
Niina Kuittinen
Mia Isotalo
Hilkka J. Timonen
Jarkko V. Niemi
Topi Rönkkö
Miikka Dal Maso
Elevated ambient concentrations of sub-3 nm particles (nanocluster aerosol, NCA) are generally related to atmospheric new particle formation events, usually linked with gaseous sulfuric acid (H2SO4) produced via photochemical oxidation of sulfur dioxide. According to our measurement results of H2SO4 and NCA concentrations, traffic density, and solar irradiance at an urban traffic site in Helsinki, Finland, the view of aerosol formation in traffic-influenced environments is updated by presenting two separate and independent pathways of traffic affecting the atmospheric NCA concentrations: by acting as a direct nanocluster source and by influencing the production of H2SO4. As traffic density in many areas is generally correlated with solar radiation, it is likely that the influence of traffic-related nanoclusters has been hidden in the diurnal variation and is thus underestimated because new particle formation events also follow the diurnal cycle of sunlight. Urban aerosol formation studies should, therefore, be updated to include the proposed formation mechanisms. The formation of H2SO4 in urban environments is here separated into two routes: primary H2SO4 is formed in hot vehicle exhaust and is converted rapidly to the particle phase; secondary H2SO4 results from the combined effect of emitted gaseous precursors and available solar radiation. A rough estimation demonstrates that ∼85 % of the total NCA and ∼68 % of the total H2SO4 in urban air at noontime at the measurement site are contributed by traffic, indicating the importance of traffic emissions.
- Article
(10778 KB) - Full-text XML
-
Supplement
(1155 KB) - BibTeX
- EndNote


Urban environments exhibit some of the highest aerosol particle concentrations encountered in the Earth's atmosphere. Elevated particle concentrations are related to adverse health effects (Dockery et al., 1993; Pope et al., 2002; Beelen et al., 2014) and various effects on climate (Arneth et al., 2009). Recent studies on urban aerosol particles have focused attention on the formation process of sub-3 nm particles (Zhao et al., 2011; Kulmala et al., 2013; Kontkanen et al., 2017) also called nanocluster aerosol (NCA) (Rönkkö et al., 2017). The importance of photochemical formation mechanisms, involving, e.g., sulfuric acid (H2SO4) and ammonia (Yao et al., 2018) or other photochemically produced vapors (Lehtipalo et al., 2018), has been highlighted. However, these studies omit the important role of direct emission of NCA-sized particles in their analysis, despite recent findings that traffic is a major source of such particles (Rönkkö et al., 2017). The proposed mechanisms also assume that key precursor vapors are formed via photochemical oxidation (Paasonen et al., 2010; Lehtipalo et al., 2018).
The most important gaseous species forming new particles in the atmosphere is H2SO4, the main source of which is usually considered to be sulfur dioxide (SO2). SO2 is photochemically oxidized in the atmosphere by an oxidizing agent produced by solar radiation, such as the hydroxyl radical (OH) (Kulmala et al., 2014). H2SO4 produced via this route is here termed secondary H2SO4. Sources of regional SO2 include shipping, power generation, atmospheric oxidation of dimethyl sulfide, and volcanic activity. Additionally, motor vehicles emit SO2 due to sulfur-containing fuels and lubricant oils; hence, traffic can also contribute to the secondary H2SO4 levels. A part of SO2 formed during combustion is oxidized to H2SO4 already in vehicles' oxidative exhaust after-treatment systems (Arnold et al., 2012), which makes vehicles direct H2SO4 emitters. In contrast to the secondary H2SO4 formed via photochemistry, H2SO4 formed in hot exhaust without the need of solar radiation is here termed primary H2SO4. In principle, primary H2SO4 can also contribute to the atmospheric H2SO4 concentrations, at least in the vicinity of traffic.
Ambient aerosol particles are either emitted directly into the atmosphere as primary particles or new particles are formed from atmospheric precursor gases in a new particle formation (NPF) process. NPF processes have been shown to occur in a variety of environments, and their occurrence is believed to be controlled, on the one hand, by the availability of particle-forming vapors and, on the other hand, by the reduction of the vapors and fresh cluster-sized nuclei due to preexisting aerosol surface area acting as a condensation sink (CS) (McMurry and Friedlander, 1979; Kerminen et al., 2018). The observations that many urban areas display high numbers of NCA particles have been puzzling because aerosol in this size range has generally been associated with NPF processes, which are unexpected due to high CS in urban areas.
Simultaneously, evidence has been mounting that the exhaust of road vehicles often contains high numbers of particles in the nucleation mode size range (5–50 nm) (Kittelson, 1998) and, recently, that traffic is a direct source of NCA-sized particles (Rönkkö et al., 2017). A recent study by Yao et al. (2018) presented data of high NCA concentrations in a highly polluted urban area, with an interpretation that they are formed in a regional NPF process. Here, this view is contrasted and complemented by presenting data from a 1-month measurement campaign performed in May 2017 at the curbside of a densely trafficked street in an urban area of Helsinki, Finland. NCA concentration data from this curbside measurement have already been analyzed by Hietikko et al. (2018) with the conclusion that traffic induces a dominant signal on NCA concentrations, according to diurnal variation and wind direction. Here, we extend the analysis with the data of H2SO4 concentrations and solar irradiances (SIs) to distinguish interfering processes of traffic and regional NPF on NCA concentrations. The H2SO4 measurement at the curbside connects urban H2SO4 concentrations to traffic sources quantitatively, for the first time. The data provide reference data for primary H2SO4 emission data and the ability to determine emission factors of vehicles in a real-world driving situation.
Prescribed primary emissions in current regional and global aerosol models do not include particles in the smallest size range (Paasonen et al., 2016). The NCA-sized particle concentrations in models are therefore mainly driven by photochemical NPF processes, omitting the directly emitted NCA-sized particles. Due to the unknown chemical composition of the traffic-originated NCA-sized particles, significant NCA-related health risks cannot be excluded. Especially for solid NCA, their behavior inside the body, such as penetrating directly into brains through the olfactory nerve (Maher et al., 2016), may have hitherto unknown adverse effects. Measuring the composition of NCA particles directly is very challenging with current technologies due to very small particle size and thus very low mass of NCA particles. An alternative way to study particle composition is to study the formation mechanism of the particles, which is one objective of this study.
2.1 Measurement site
The measurement site was located at a street canyon at Mäkelänkatu about 3 km north of the city center of Helsinki, Finland (Fig. 1). The devices for gas and aerosol measurements were installed in two containers next to each other (Fig. 2) located at the curbside of the street canyon.
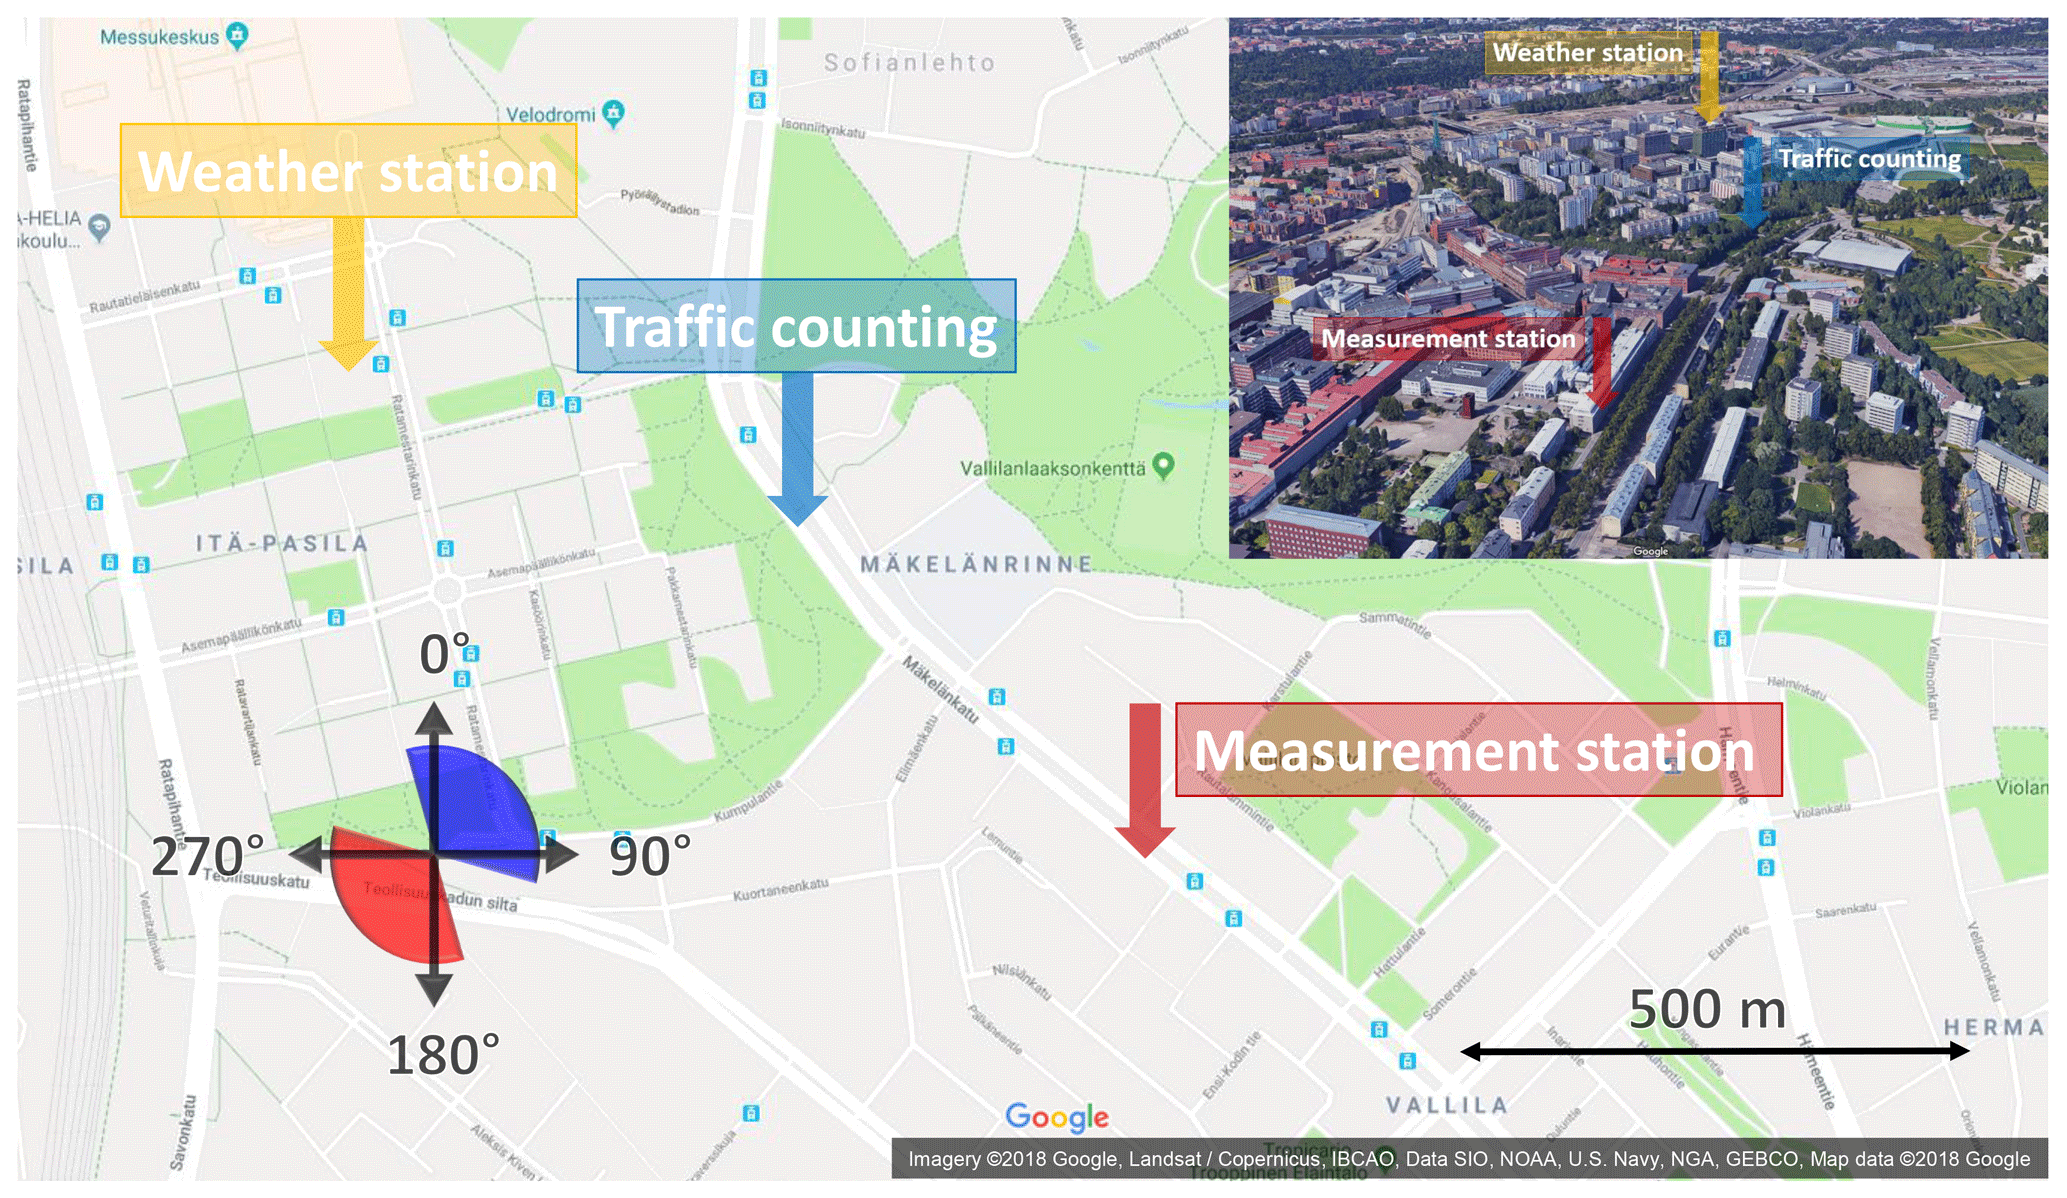
Figure 1The map of the measurement site. Red and blue sectors denote the wind directions which result in the flow field coming from the street direction and from the background direction, respectively, towards the measurement container.
Traffic count was measured in 15 min time resolution by the City of Helsinki at the same street but 600 m north of the measurement containers. Environmental parameters, such as wind velocity, wind direction, SI, air temperature, pressure, relative humidity, and precipitation, were measured at a weather station on the rooftop of a 53 m high building 900 m northwest of the measurement containers. The location of the weather station provided measurement data which are undisturbed by other buildings but the location was still sufficiently near to the measurement containers to provide representative values.
The street canyon consists of three lanes for cars in both directions, two rows of trees, two tramlines, and two pavements, resulting in a total width of 42 m and height of 17 m (Kuuluvainen et al., 2018). Due to the vortex affecting the flow field in a street canyon, the wind direction at the measurement containers was considered opposite to the direction above the roofs (Ahmad et al., 2005). Therefore, the wind direction diagram in Fig. 1 is mirrored by the street canyon axis. However, the street canyon in this case is not a regular street canyon but a wide avenue canyon and it has a displaced building near the measurement location. This can cause some errors to the actual flow field interpreted using the mirrored wind direction, and the effect of wind direction on the measured emissions is not seen as clearly as in an open environment or in a regular street canyon.
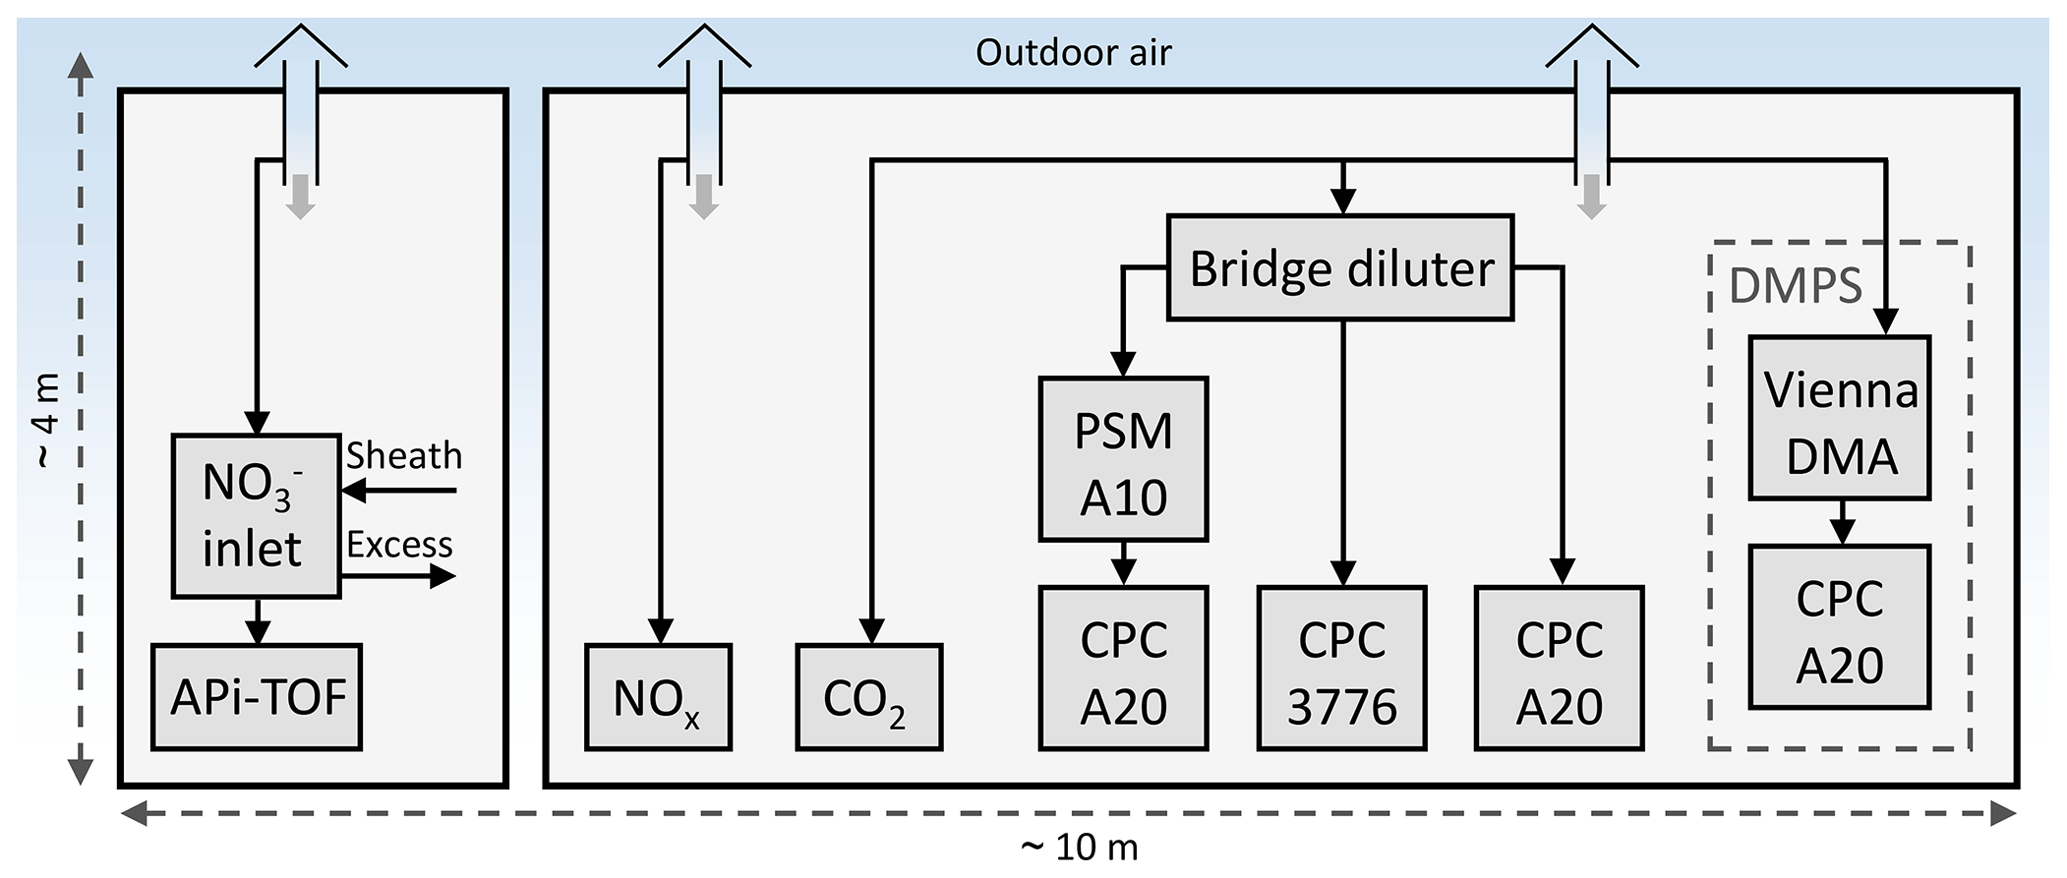
The measurement setup inside the containers is shown in Fig. 2. Outdoor air samples to the measurement devices were drawn through the roof of the containers 4 m above the ground, using vertical probes having diameters of 50 mm and flow rates higher than 200 L min−1 to minimize losses onto the walls of the sampling lines.
2.2 Sulfuric acid measurements
H2SO4 was measured in the gas phase using a nitrate-ion-based (-based) chemical-ionization atmospheric-pressure-interface time-of-flight mass spectrometer (CI-APi-TOF-MS; Aerodyne Research Inc.; USA and Tofwerk AG, Switzerland; Jokinen et al., 2012). It consists of a chemical ionization (CI) inlet (Eisele and Tanner, 1993) and an APi-TOF-MS (Junninen et al., 2010).
The CI inlet was operated by ionizing a small concentration of nitric acid (HNO3) vapor in the sheath air using an X-ray to produce ions. The sheath air flow rate to the CI inlet was 20 L min−1 and it was generated in two ways: during the first 2 weeks, a small pump followed by an HEPA filter was used, and during the last 2 weeks, an oil-lubricated compressor followed by coarse particle, oil, water droplet, HEPA, and activated carbon filters was used. The excess flow from the CI inlet using a vacuum pump had a flow rate of 30 L min−1, resulting in the sample flow rate of 10 L min−1 to the inlet.
H2SO4 is detected in the CI-APi-TOF-MS as bisulfate ions () and as ions clustered with HNO3 through the following reactions:
where n = 0, 1, … The H2SO4 concentrations are calculated with the equation
where C is the calibration coefficient for H2SO4, P is the penetration efficiency of H2SO4 in the sampling lines, and the curly brackets denote the areas of the peaks at corresponding mass-to-charge ratios in the high-resolution spectra measured by the TOF mass spectrometer. The calibration coefficient was determined by generating known concentrations of H2SO4 using the oxidation of SO2 by OH radical (Kürten et al., 2012). The calibration coefficient was determined for the both sheath air generations: the values are cm−3 for the pump-based sheath air and cm−3 for the compressor-based sheath air. The values differ due to different purities of the sheath air.
The diffusional losses (Brockmann, 2005) of H2SO4 in the sampling lines were calculated with the diffusion coefficient of 0.071 cm2 s−1 representing the diffusion coefficient of a hydrated H2SO4 molecule in relative humidity of 60 % and temperature of 283 K (Chapman and Cowling, 1954; Hanson and Eisele, 2000). The calculated penetrations are P=0.30 when pump-based sheath air was used and P=0.22 when compressor-based sheath air was used. These values differ because minor changes to the sampling lines were also made when the compressor was installed.
The H2SO4 concentrations from zero measurements are subtracted from the measured H2SO4 concentrations. The zero measurements were done by using the sheath air as a sample to obtain the H2SO4 concentration originating from the sheath air generation. The H2SO4 concentrations during the zero measurements were 3.7×105 cm−3 with the pump-based sheath air and 1.8×106 cm−3 with the compressor-based sheath air. Due to the limitations of space inside the containers, a higher level of purification for the sheath air was not available.
The data from the CI-APi-TOF-MS were recorded with the time resolution of 2 s, but at least 1 min of the raw data are required for averaging to obtain feasible high-resolution spectra.
2.3 Gas measurements
Nitric oxide (NO) and nitrogen dioxide (NO2) concentrations were measured using a Horiba APNA-370 and the data were recorded with a time resolution of 1 min. In this study, only the sum of NO and NO2 concentrations, denoted as NOx concentration, is used in the analysis. Carbon dioxide (CO2) concentration was measured using a LI-COR LI-7000 analyzer with a time resolution of 1 s.
Because traffic density and the concentrations of emissions at the curbside are not directly correlated due to turbulent flow field and variable wind directions causing the emissions to be diluted in a different extent at the measurement location, a traffic-originated tracer is needed to connect the observed concentrations quantitatively to traffic emissions. An ideal tracer is one that is universally emitted by all vehicles and is not altered in the atmosphere during the timescale of the exhaust plume dilution process. CO2 is emitted by all combustion engines, with the emission rate proportional to the fuel consumption; thus, it is used as a tracer in determining emission factors of traffic. The drawback of CO2 as a traffic tracer is its varying background concentration due to regional-level phenomena. The background concentration is also higher than the concentration increase in traffic. As the main source of NOx in urban areas is traffic (Clapp and Jenkin, 2001), the background concentration is low and thus causes no significant uncertainty to the traffic contribution. However, the drawback of NOx is its varying emission rates across the whole vehicle fleet (Yli-Tuomi et al., 2005). Concluding, we decided to use NOx as the traffic tracer, except in the emission factor analysis where CO2 is used due to its direct connection to the fuel consumption.
The NOx concentration ([NOx]) correlates well with the traffic density on weekdays (Fig. 3). However, on weekends, much stronger dilution conditions during daytime compared to nighttime are seen. During nighttime, there is a peak in the NOx concentration though it is nonexistent in traffic density, which suggests stagnant weather conditions coincided at nighttime on weekends for the considered time range. The NOx concentrations were higher during the morning rush hours than during the afternoon rush hours on weekdays although the traffic density behaved oppositely, which occurs because, during the morning rush hours, traffic was concentrated on the same side of the street as the measurement containers, providing a shorter distance, and thus less dilution, for the emissions to travel to the measurement devices.
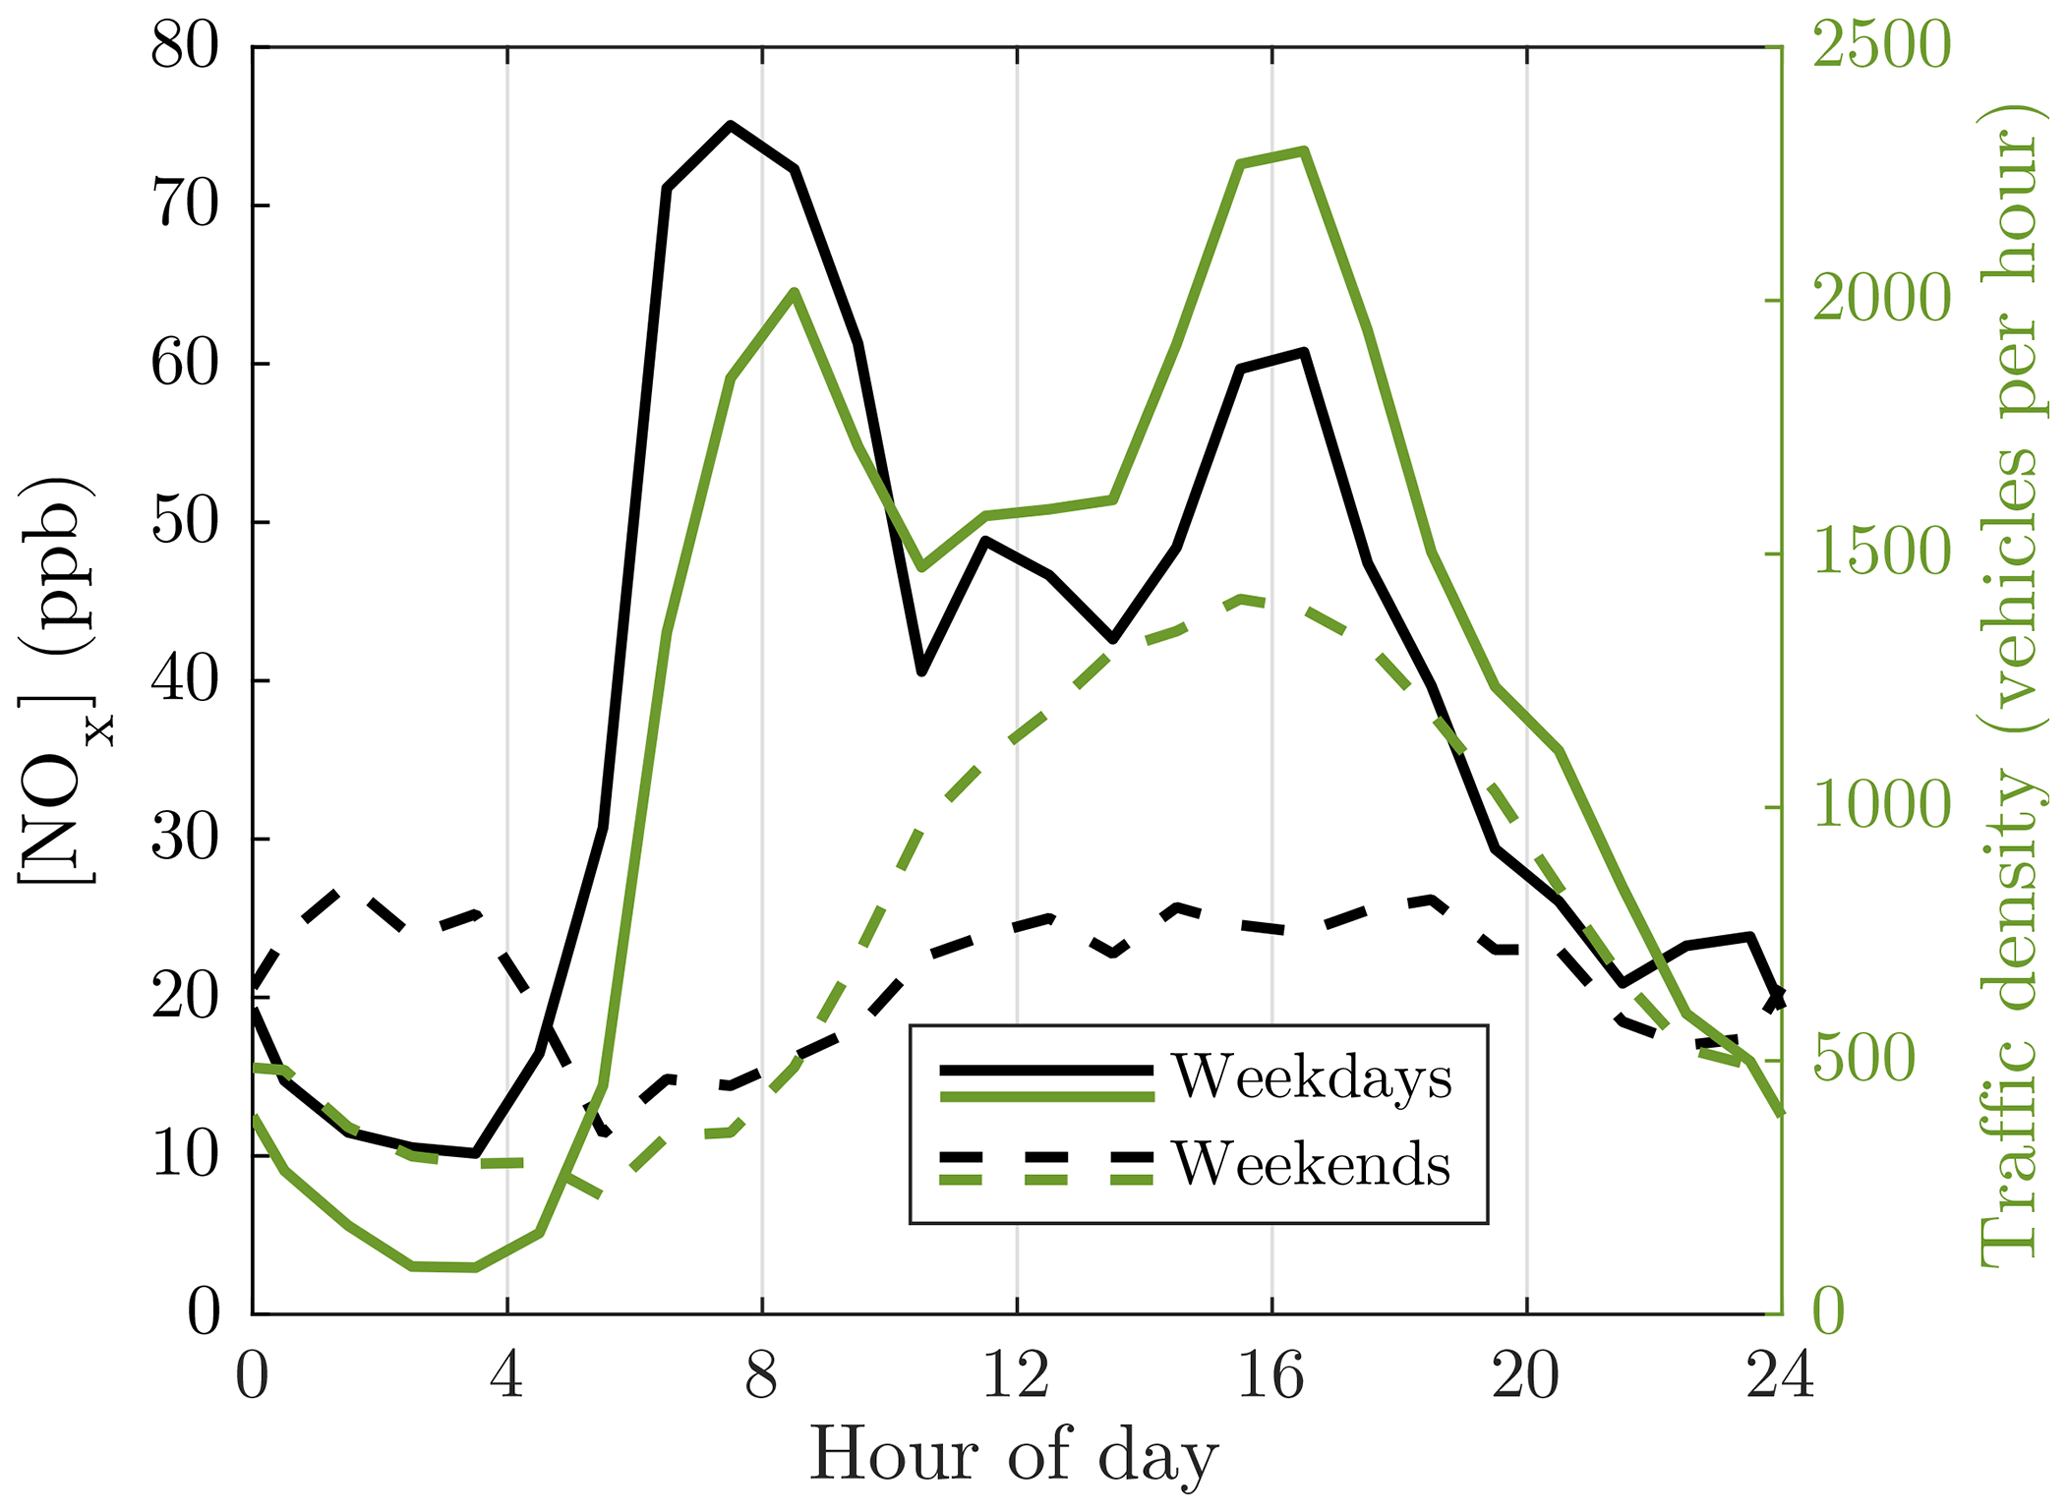
Figure 3Average diurnal variations in nitrogen oxide (NOx) concentration, representing the concentration of the traffic-originated emissions overall and traffic density. The NOx concentration data measured with 1 min time resolution are firstly averaged to 1 h resolution; secondly, the averaged data from different days are averaged geometrically for the specific hours. Geometric averages are used for emissions, instead of arithmetic averages, because the logarithmic nature of the concentrations would cause skewed frequency distributions; thus, the highest concentrations would be weighted more than the lower ones. Arithmetic averaging is used for the traffic density.
2.4 Particle measurements
The number concentration of particles with the diameters larger than approximately 1.2 nm were measured using an Airmodus A10 particle size magnifier (PSM A10) (Vanhanen et al., 2011) with a diethylene glycol saturator flow rate of 1.3 L min−1 followed by an Airmodus A20 condensation particle counter (CPC A20). Particles larger than 3 and 7 nm were measured using a TSI 3776 condensation particle counter (CPC 3776) and another Airmodus CPC A20, respectively. The particle size distribution between 6 and 800 nm was measured using a differential mobility particle sizer (DMPS) consisting of a Vienna-type differential mobility analyzer (DMA) followed by a CPC A20. Due to high particle concentrations at the street canyon, the sample for CPCs was diluted using a bridge diluter having a dilution ratio of 8.2. The dilution ratio for the specific diluter is, however, measured for larger particle sizes only, and because the diluter is based on diffusional losses of the particles, the dilution ratio for NCA-sized particles is higher. Therefore, the NCA concentrations reported here represent the lower limits of the actual concentrations.
The number concentration of nanocluster aerosol, particles within the diameter range between 1.2 and 3 nm, can be calculated by subtracting the concentration measured by the CPC 3776 from the concentration measured by the PSM. The particle size distribution between 1.2 and 800 nm can be calculated with the data from all these aerosol measurement devices by taking the cut diameters of the CPCs and the dilution ratio of the bridge diluter into account. The NCA concentration was measured with a time resolution of 1 s and the size distribution with a time resolution of 9 min.
The data from the off-site measurements of traffic count and environmental parameters are available for the whole 4-week measurement campaign starting on 4 May and ending on 31 May 2017 (see the Supplement for the time series). This time range provided adequate data for examining NCA and H2SO4 formation with respect to solar irradiance because there were sufficient amounts of days both with clear sky and with cloud cover, yet without too many rainy days. There are some gaps in the NCA and H2SO4 data during the 4 weeks due to unavailability of the measurement devices. The data analysis considers only the time ranges for which all the measurement data are available, resulting in 3 weeks of data.
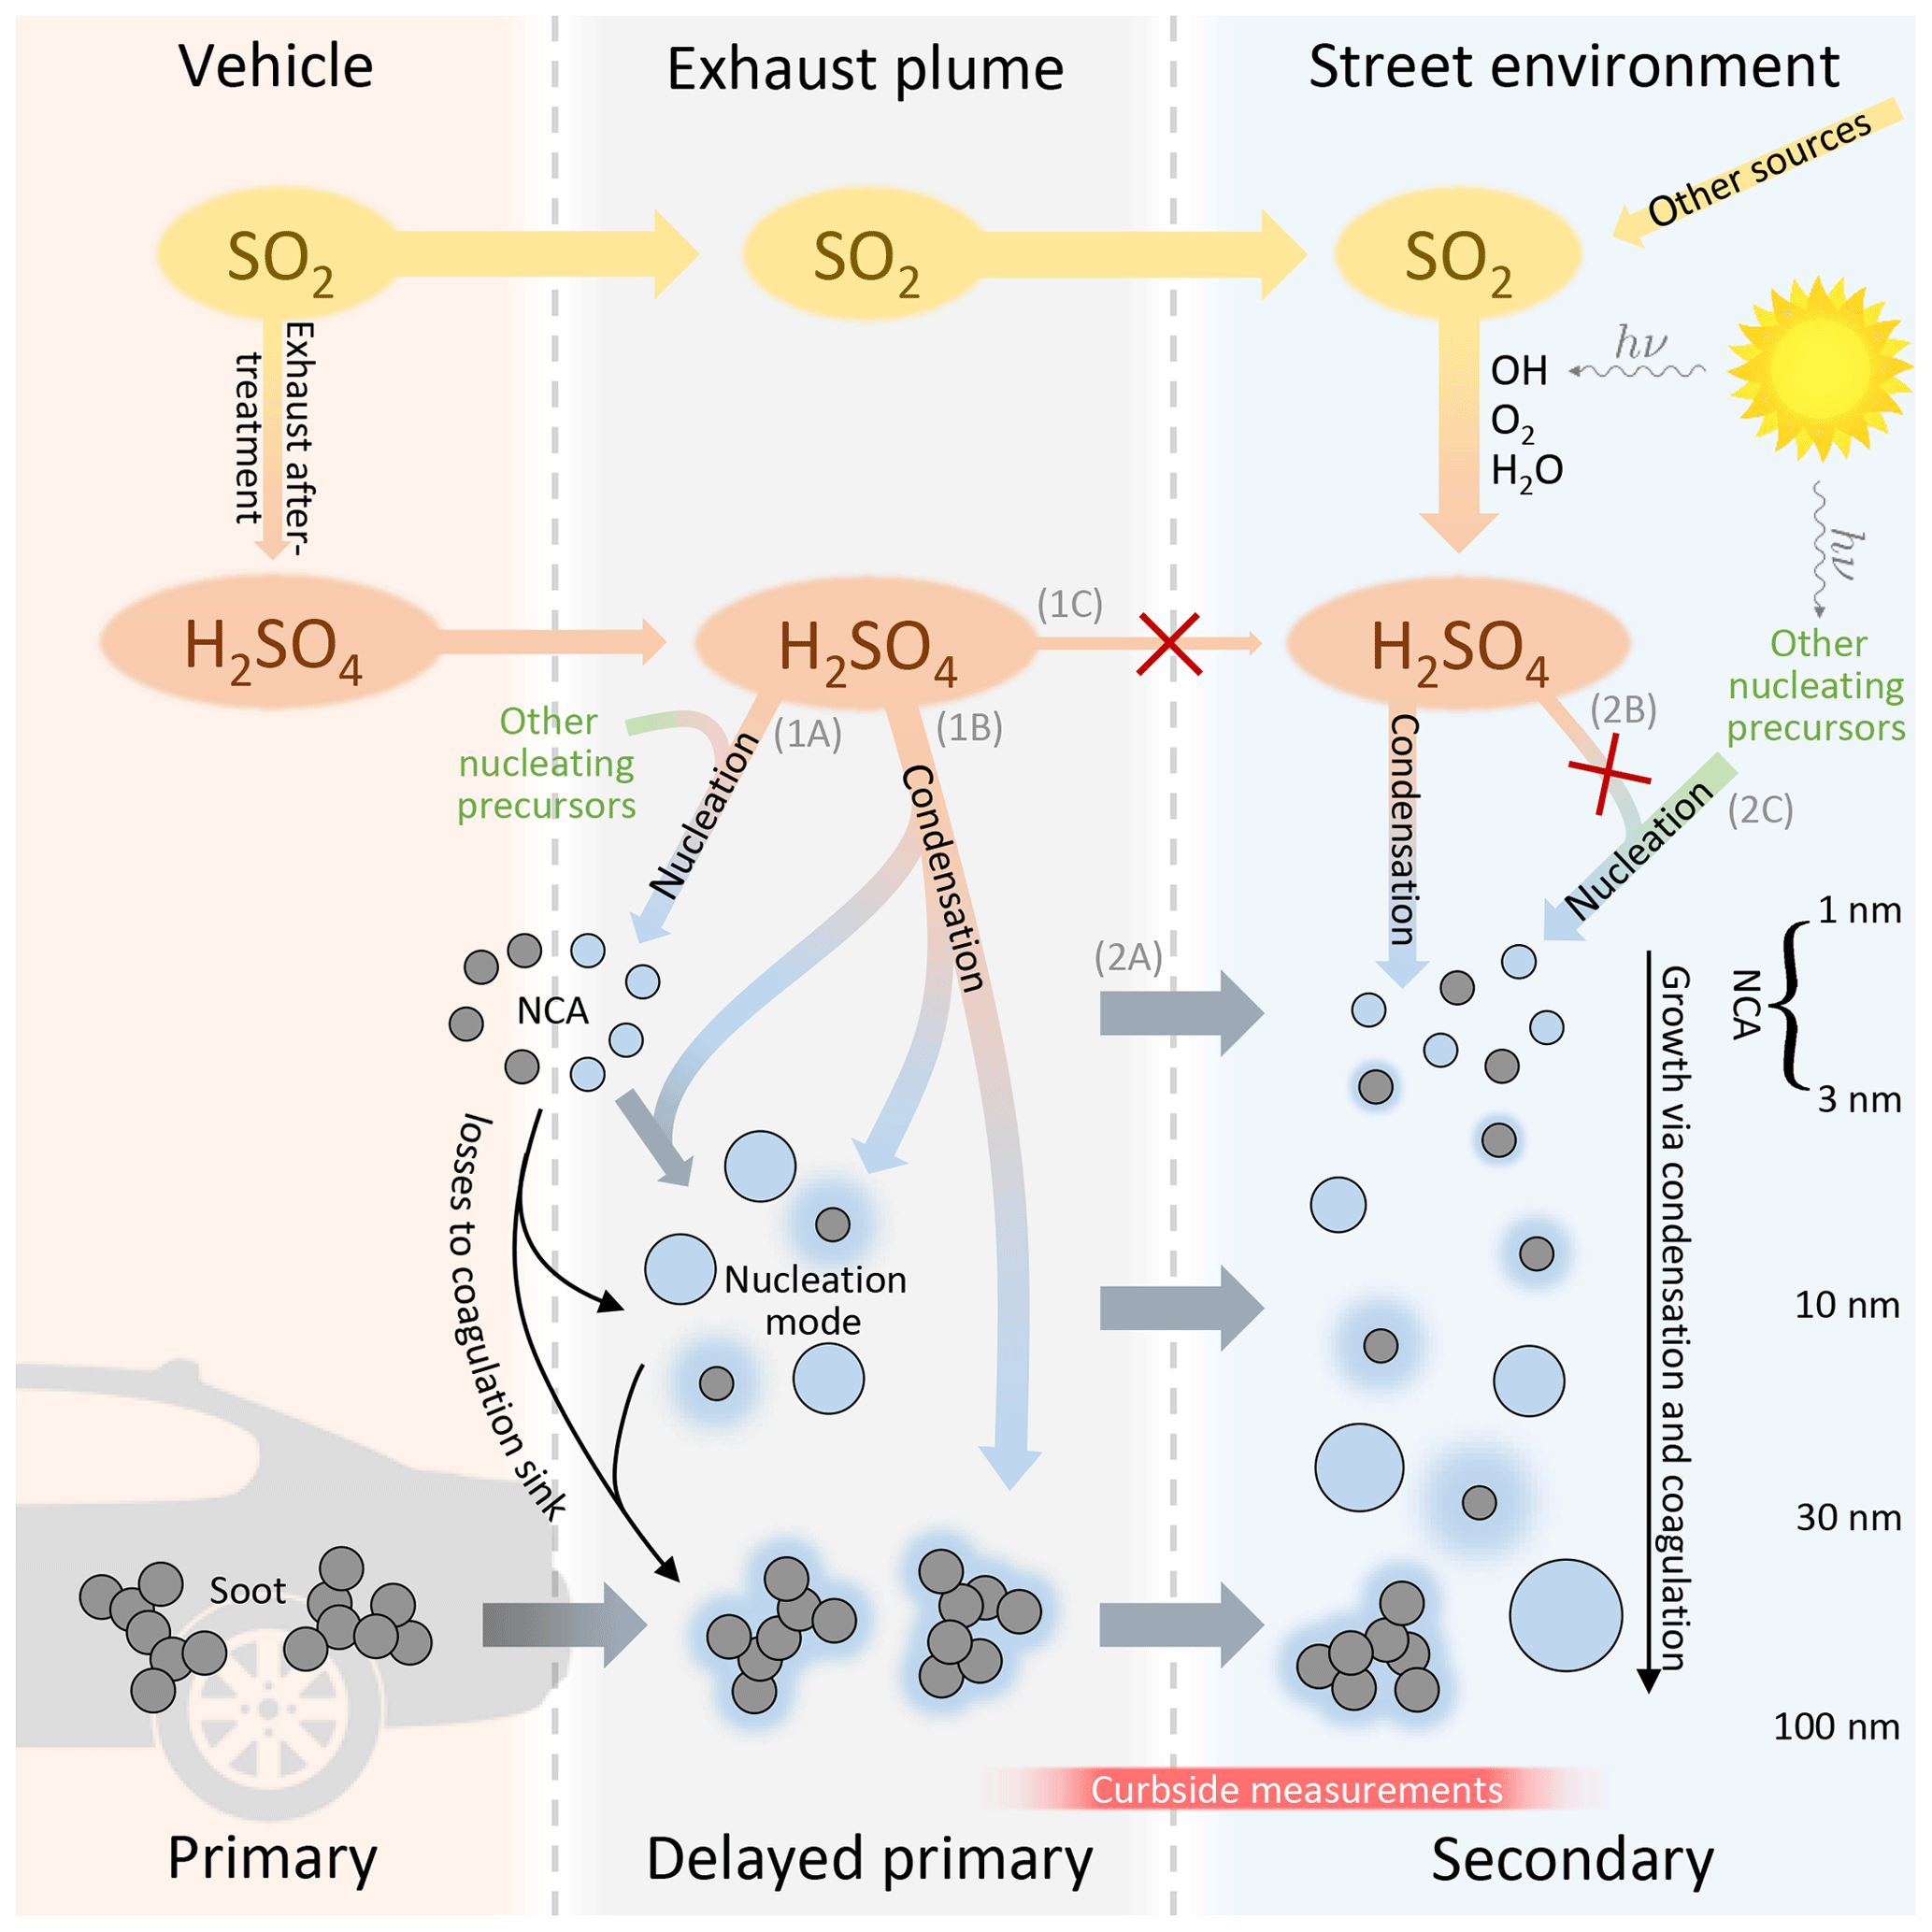
Figure 4Proposed mechanism of sulfuric acid and particle formation in traffic-influenced areas. The route of primary H2SO4 to the urban atmosphere (route 1C) is largely terminated to the particle phase rapidly after the emission (routes 1A and 1B). Conversely, secondary H2SO4 remains in the urban atmosphere because it does not experience such a rapid gas-to-particle conversion. NCA presence in the urban atmosphere is majorly controlled by traffic emissions (route 2A) and only marginally by nucleation from secondary precursors (routes 2B and 2C); in particular the contribution of nucleation from secondary H2SO4 (route 2B) is noticeably overridden by traffic emissions (route 2A).
Figure 4 presents our proposal for the updated mechanism of H2SO4 and particle formation in traffic-influenced areas, based on our measurement results. The most noteworthy details are illustrated with red crosses indicating H2SO4 routes which were observed to occur barely only, or not at all. As shown later in this section, our measurement at the curbside displays no clear increase in gaseous H2SO4 concentrations with increasing traffic volumes. With the fact that vehicles do emit primary H2SO4 (Arnold et al., 2012; Rönkkö et al., 2013), it is evident that the majority of primary H2SO4 must be converted to the particle phase via nucleation (route 1A) and condensation (1B) rapidly after emission. Conversely, secondary H2SO4 potentially remains longer in the urban atmosphere because it does not experience conditions favoring such a rapid gas-to-particle conversion, i.e., rapid temperature decrease, high precursor concentrations, and high preexisting CS. Therefore, the signal of H2SO4 measured from the curbside of the street is mainly due to secondary H2SO4 only.
Our results show that both traffic and regional NPF influence NCA concentrations at the urban traffic site, with direct NCA emission from traffic dominating. Comparison of the NCA and H2SO4 concentrations with SI and traffic density suggests that while solar radiation favors higher NCA concentrations, the photochemically produced H2SO4 may not be the key compound in the presence of NCA in urban areas. Traffic-originated NCA particles may be formed via a delayed primary emission route by rapid nucleation of low-volatility gaseous compounds emitted by vehicles during exhaust cooling after release from the tailpipe (1A). On the other hand, they may be solid particles emitted directly by engines, via a primary emission route (Sgro et al., 2012; Alanen et al., 2015). Although it is likely that both nucleation (1A) and condensation (1B) routes from primary H2SO4 exist because nucleation mode particle number concentrations and particle sizes are correlated with the H2SO4 concentration in exhaust (Arnold et al., 2012; Rönkkö et al., 2013), the ratio of the routes at our measurement site is not determined. Neither is the ratio of NCA particles emitted primarily and through the nucleation route (1A) determined. Therefore, the relative proportion of H2SO4 in traffic-originated NCA particles remains unknown, leading to the possibility of solid NCA emissions.
The first evidence for traffic-contributed concentrations of NCA (NNCA) and H2SO4 was found in the diurnal variations in the NCA, H2SO4, and NOx concentrations and SI (Fig. 5). The diurnal variations on weekdays (Fig. 5a) differ from the diurnal variations on weekends (Fig. 5b). The main difference between weekdays and weekends is traffic volumes; therefore, such a difference in the concentrations of NCA and H2SO4 should only be expected if their formation is in some manner connected to traffic. The connection of NCA to traffic is further strengthened by comparing it to the NOx concentrations, which are directly linked to traffic densities and traffic-related emissions (Fig. 3). On weekdays, the NCA concentration increased in tandem with the NOx concentration during the morning rush hours. On weekends, the NCA concentration increased at noontime much more clearly than the NOx concentration. This can be interpreted as a sign of an ongoing regional NPF process producing NCA particles with high SI. On weekdays, the regional NPF process should only produce higher NCA concentration during afternoon rush hours having higher SI compared to morning. The increased NCA concentrations during the morning rush hours suggest that the traffic-originated NCA does not require solar radiation to form.
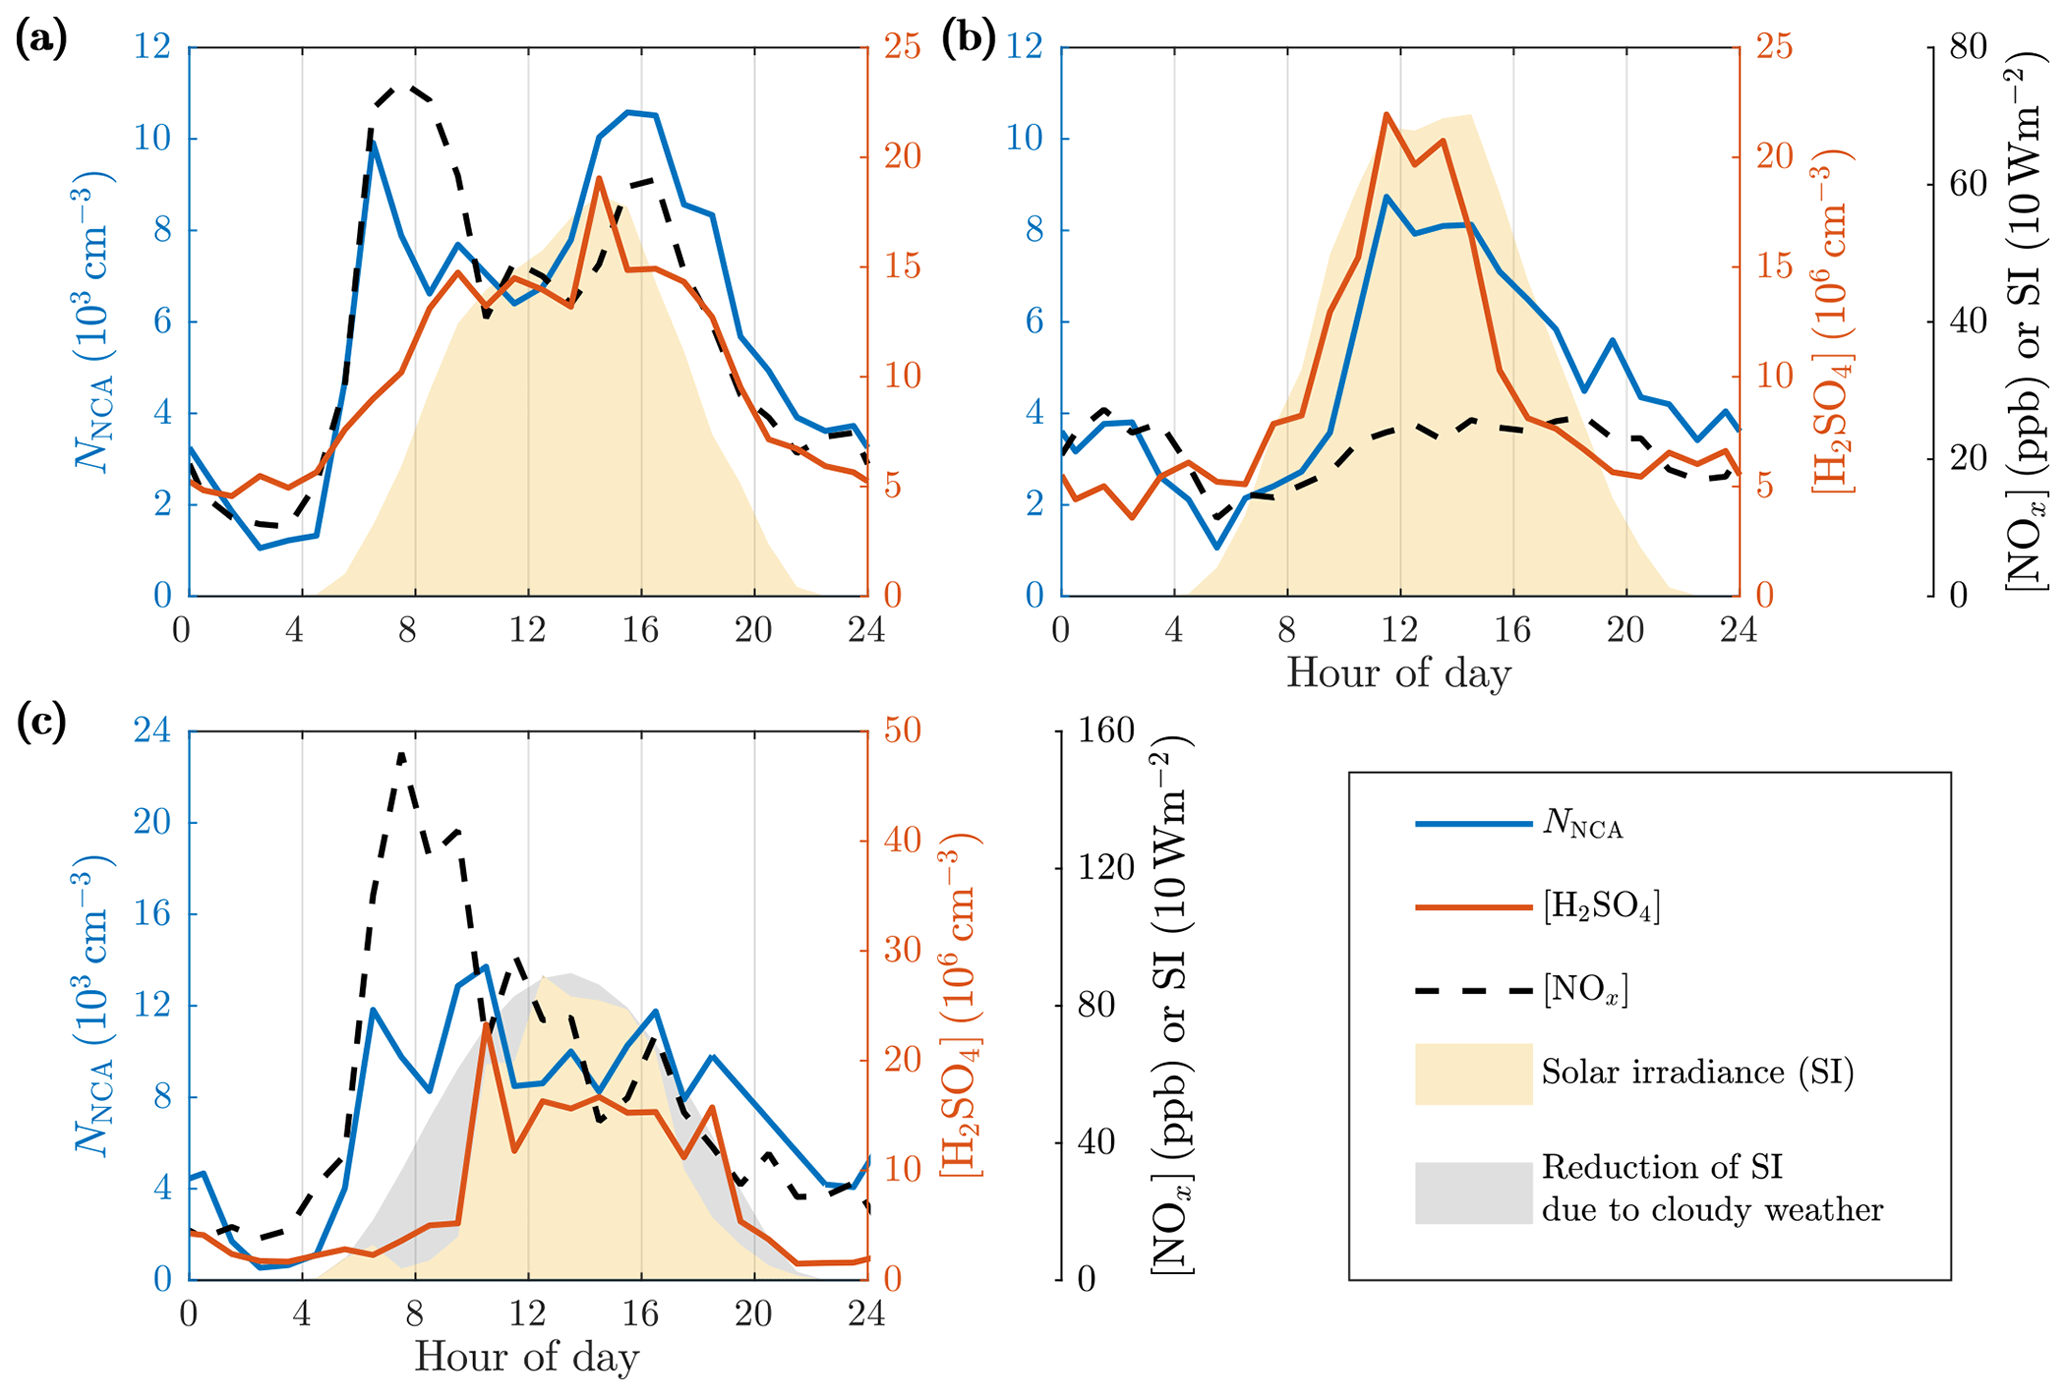
Figure 5Average diurnal variations in the NCA, H2SO4, and NOx concentrations and solar irradiance (SI) on (a) weekdays, (b) weekends, and (c) example day 22 May 2017 with a cloudy morning and evening. The concentration data first averaged to 1 h time resolution are averaged geometrically as described in Fig. 3.
We observed that traffic levels influence the H2SO4 concentrations, but they are still mainly controlled by solar radiation. In contrast to the NCA concentration, the H2SO4 concentration traced SI much more closely, with a maximum at noontime and minimum at night. On weekdays, a peak in the H2SO4 concentration during afternoon rush hours suggests that traffic might also influence the formation of H2SO4. Further evidence for this is found by comparing the diurnal variation in H2SO4 between weekdays and weekends. On weekends, the H2SO4 concentration increased not until the traffic density and the NOx concentration were also increased, whereas on weekdays the traffic density was already high when SI and the H2SO4 concentration began to increase. Furthermore, higher irradiances were required on weekends before the rise in the H2SO4 concentration, and, additionally, the order of the increase in the NCA and H2SO4 concentrations was switched.
The time series show that NCA is not similarly controlled by solar radiation but rather by traffic. This is clearly showcased in Fig. 5c, which presents data from a day with cloudy weather reducing SI in the morning and in the evening but still with a constant wind direction. The NCA concentration closely traced traffic levels in the morning, whereas the H2SO4 concentration only increased when SI increased hours later. This clearly shows that the formation of NCA, in this case, is independent of SI and the H2SO4 concentration. It is also noteworthy that no increase in the NCA concentration is observed when SI increased, suggesting that traffic dominated in the NCA formation. There were also other days with cloudiness decreasing SI with similar observations; however, the example day in Fig. 5c was the day with the most clear effect of cloudiness on SI and the reduction of SI coincides with morning rush hours, displaying high NCA concentrations.
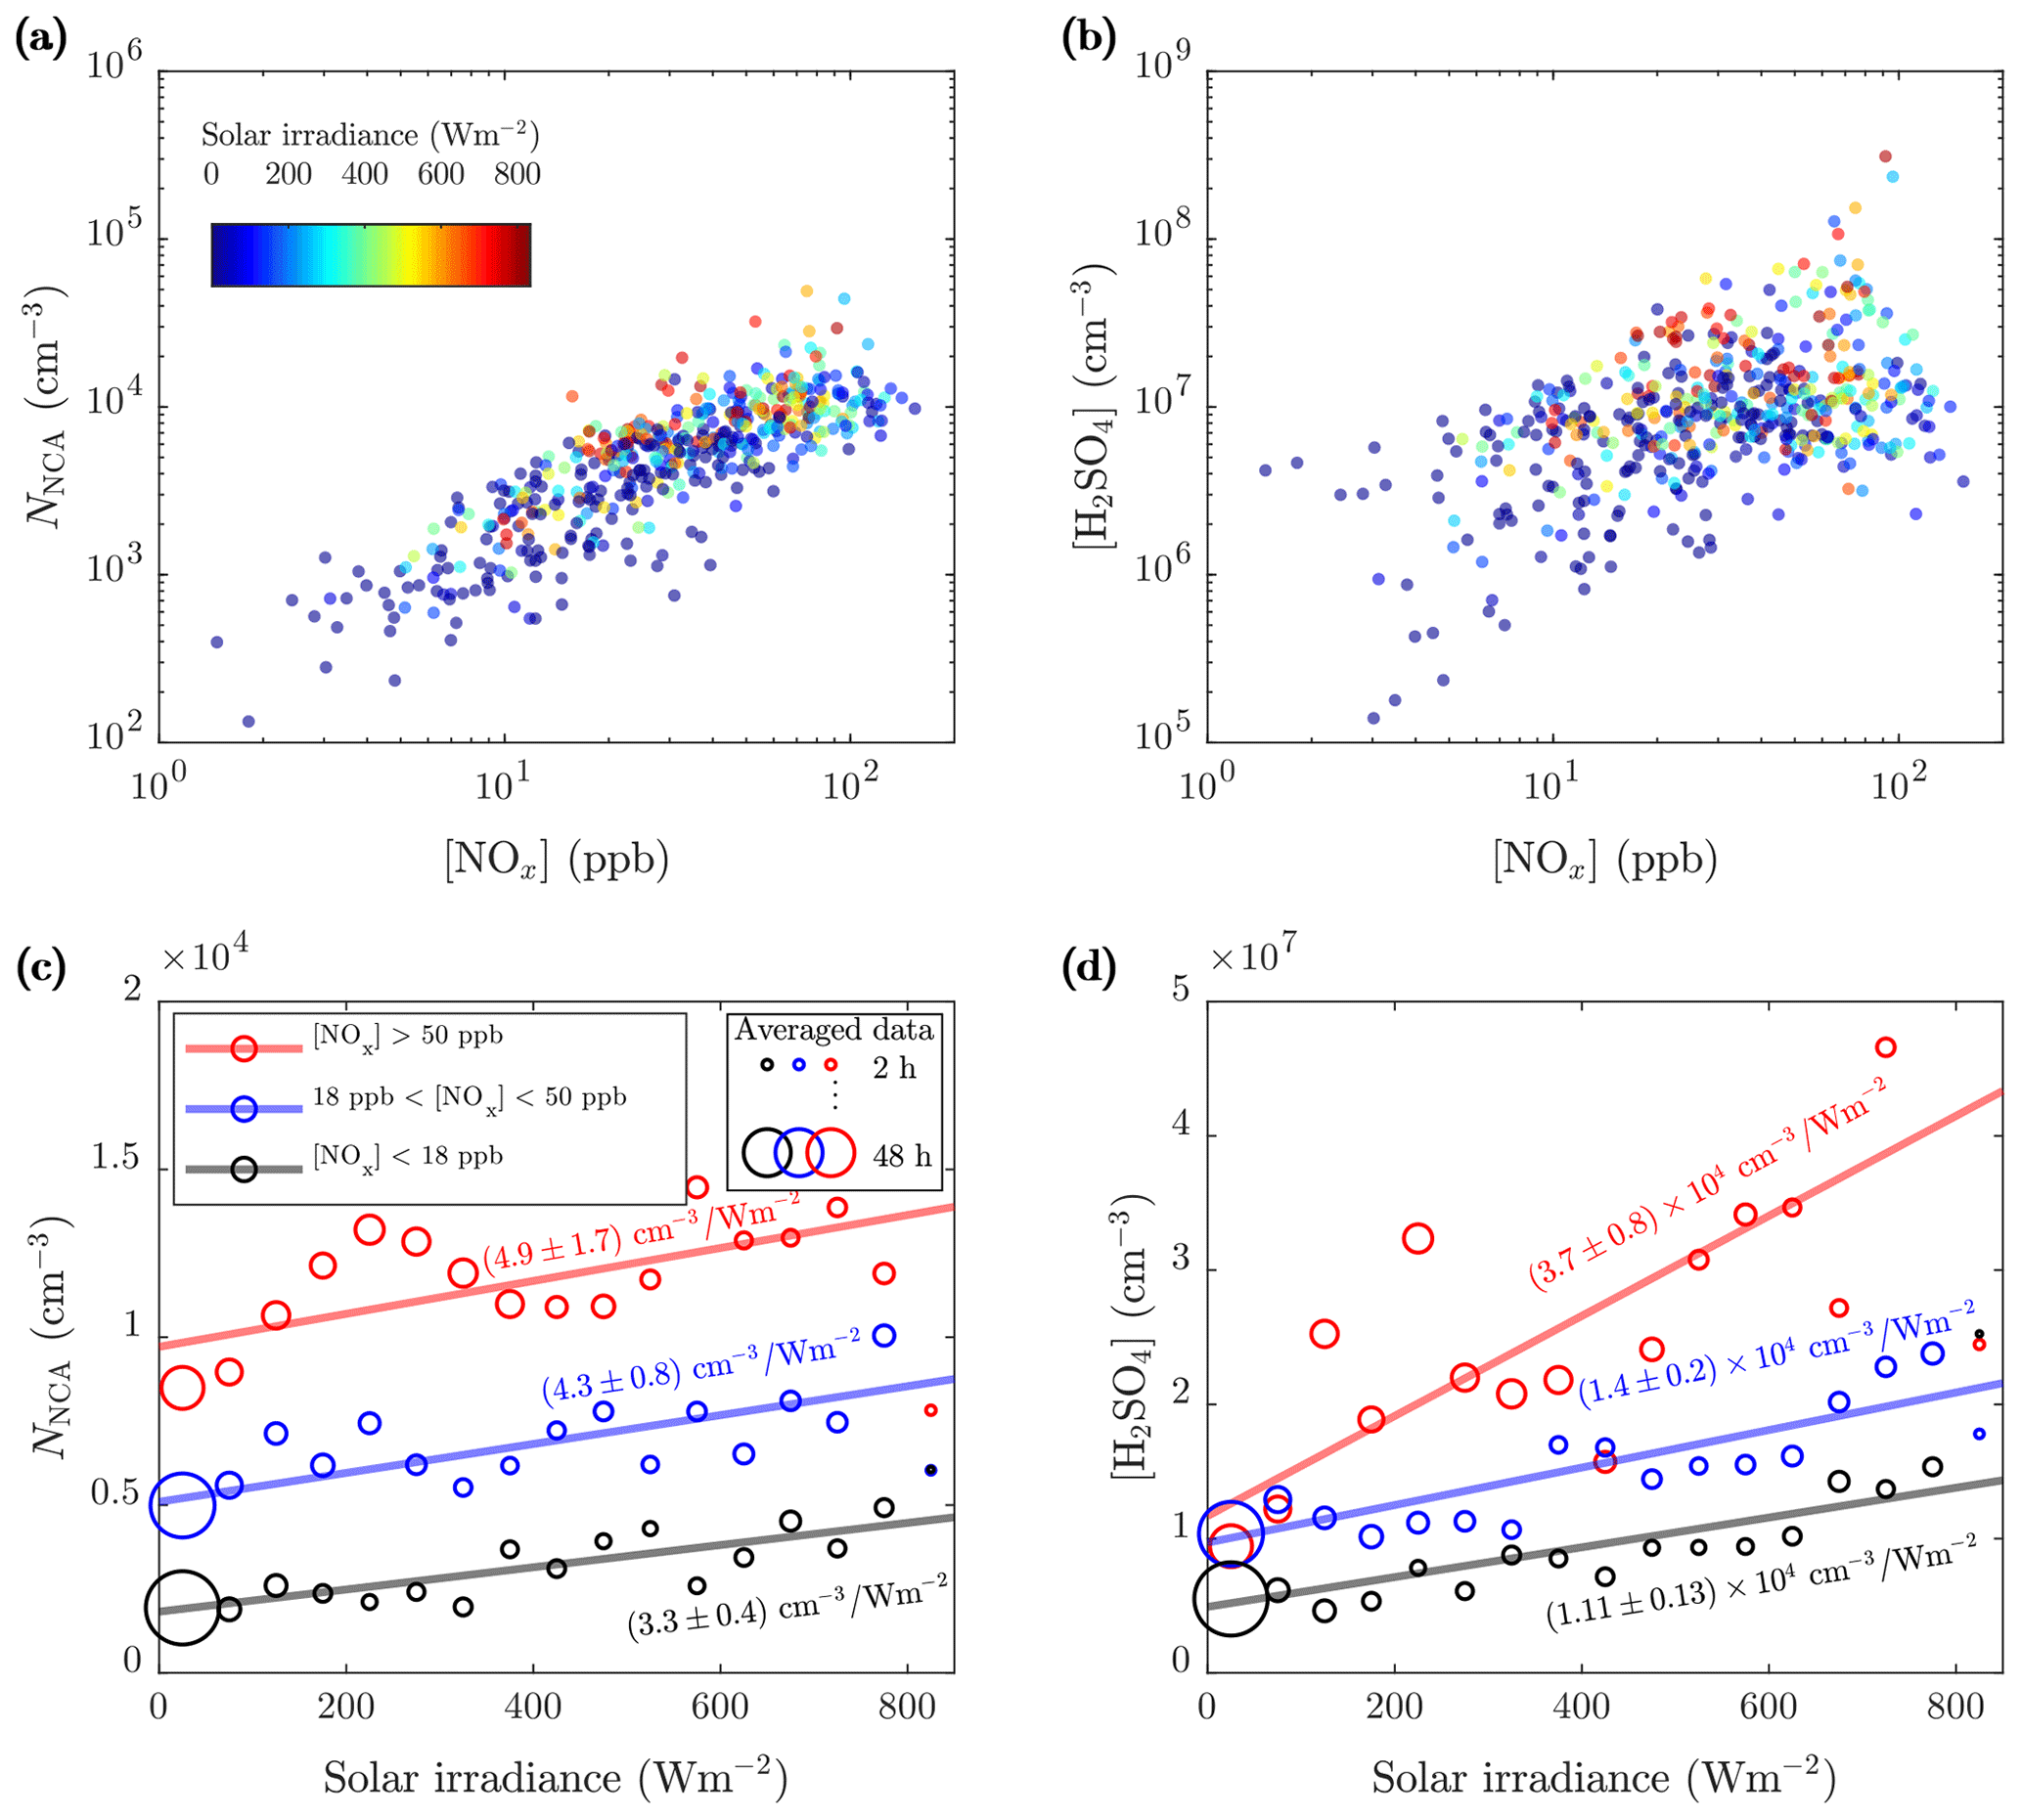
Figure 6The 1 h averages of the (a) NCA and (b) H2SO4 concentrations as a function of the NOx concentration colored by the solar irradiance (SI) and 10 min averages of the (c) NCA and (d) H2SO4 concentrations further averaged to 17 different SI bins (bin width is chosen to provide clear graphical representation) for three NOx concentration ranges. Weighted least-squares fitting, with data point count in bin averaging (shown with the circle diameters) as weights, for the bin-averaged values was performed to output linear fits. The slopes are marked in the figure and are not largely affected by the chosen bin width. The intercepts are (c) , , and cm−3 and (d) , , and cm−3 for the lowest, the middle, and the highest NOx concentration ranges, respectively.
The data suggest that the formation of atmospheric H2SO4 is strongly enhanced in the presence of both traffic and sunlight. While a strong correlation between the NCA and NOx concentrations (Fig. 6a, b: Pearson's R=0.84) confirms the connection between NCA and traffic, a remarkably weaker, but also positive, correlation between the H2SO4 and NOx concentrations (R=0.50) was observed, revealing the connection between H2SO4 and traffic. The effect of SI at different traffic densities shows differing patterns for NCA (Fig. 6c) and H2SO4 (Fig. 6d). While high SI is associated with higher NCA and H2SO4 levels, traffic density determines the base level for both (the concentrations at zero SI). For H2SO4, the influence of traffic causes a marked increase in the slope of the H2SO4 concentration–SI line. The slope can be interpreted as the production efficiency of H2SO4 via photochemistry. It is evident that for NCA, the influence of traffic dominates in comparison to SI, as the traffic-influenced NCA concentration (red data) exceeds the non-traffic concentrations (black data) even during dark times. For H2SO4, the situation is different, as all dark-period H2SO4 concentrations are close to equal levels. These differing patterns suggest that the majority of NCA in traffic-influenced areas is formed independently of secondary H2SO4, in contrast to the findings of Yao et al. (2018).
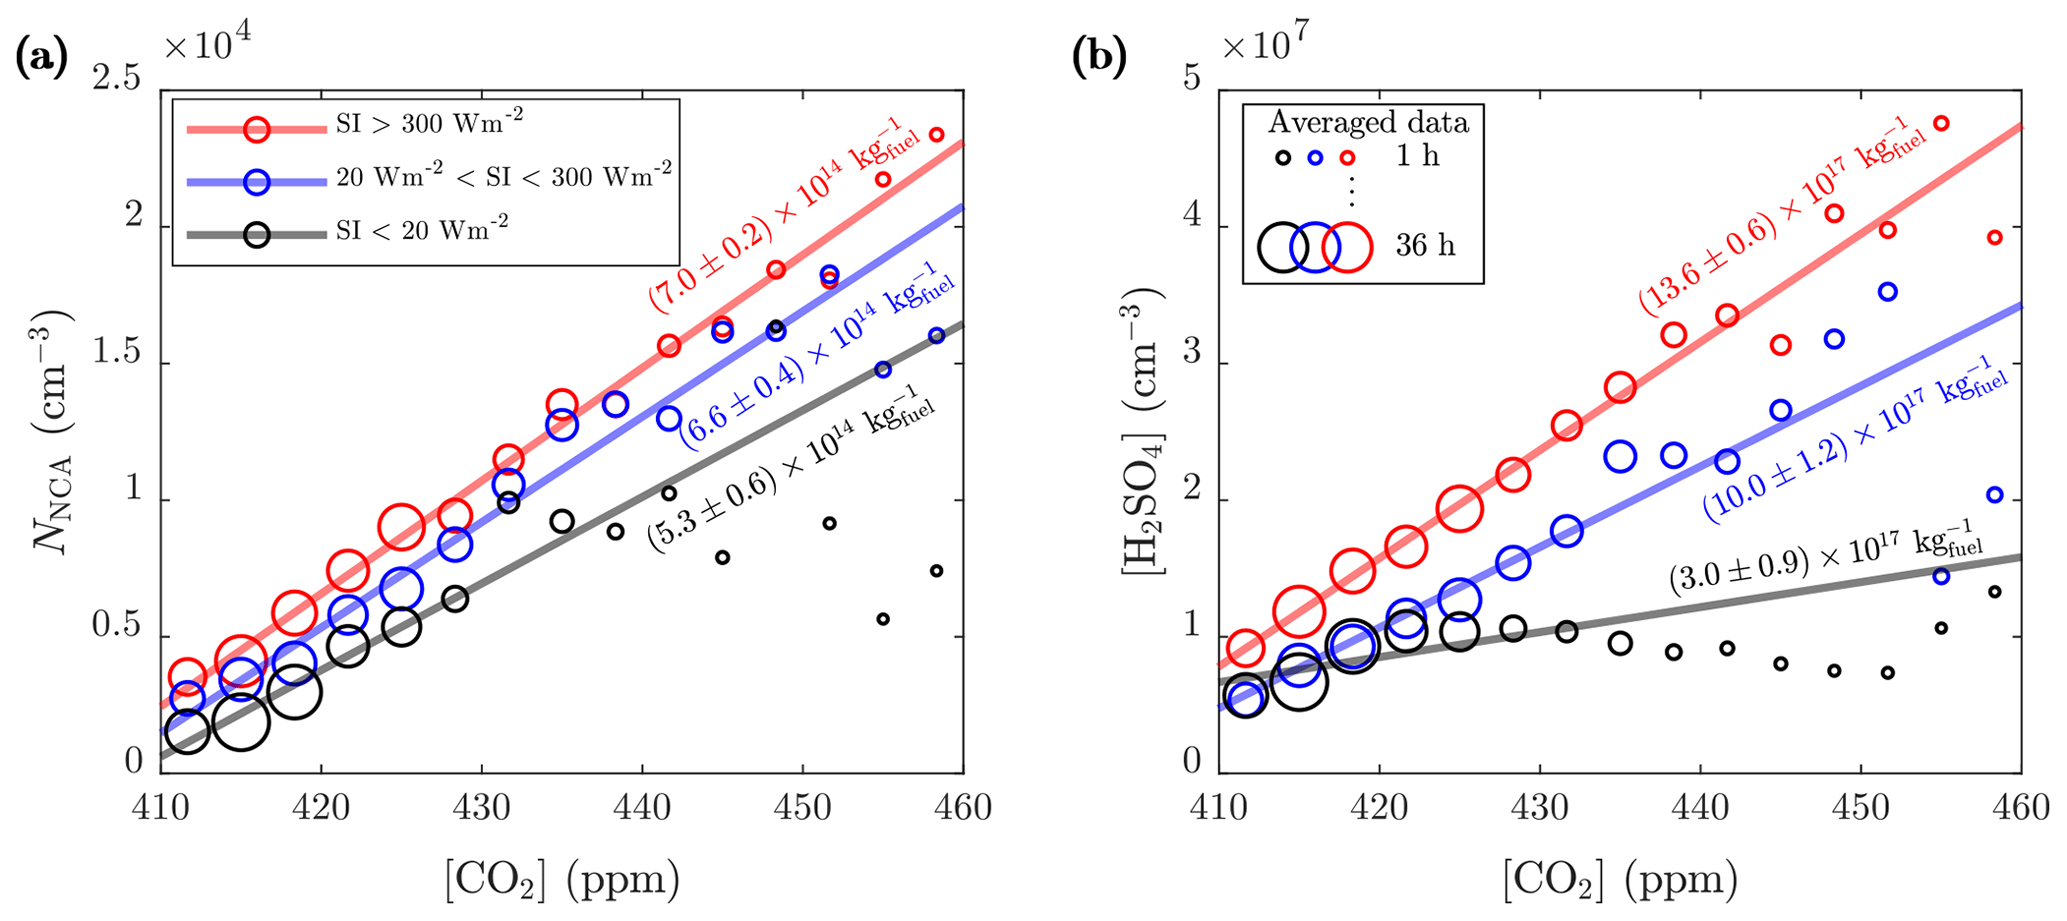
Figure 7The 1 min averages of the (a) NCA and (b) H2SO4 concentrations further averaged to CO2 concentration bins for three SI ranges (see Fig. 6 for the details on averaging and linear regression). The slopes of the linear fits converted to kilograms of fuel combusted (using the emission factor of CO2, 3.14 kg per 1 kg of fuel combusted; Yli-Tuomi et al., 2005) are marked in the figure. The intercepts of the fits at 410 ppm are (a) , , and cm−3 and (b) , , and cm−3 for the lowest, the middle, and the highest SI ranges, respectively.
Even more compelling evidence for traffic-originated NCA and H2SO4 can be found by comparing the observed concentrations to CO2 concentrations ([CO2]). In Fig. 7, no apparent difference in the emission factors of NCA for different SIs are seen; however, in the case of H2SO4, higher SI lead to noticeably higher emission factors of H2SO4. We tested for potential co-correlations between SI and traffic density to examine potential traffic level increase with simultaneous SI increase due to their almost similar diurnal cycles. We found no clear correlation between CO2 concentration and SI (Fig. S5). In a case of a found correlation, the slopes in Fig. 7 could not have been interpreted as emission factors but as photochemical production due to accelerated photochemistry with higher SI values. Although the varying background concentration of CO2 causes uncertainty in analyzing the contribution of traffic to emissions, linear dependencies are still observed in Fig. 7. These results again support the finding that solar radiation is required for the formation of H2SO4 from traffic emissions and demonstrates clearly that both NCA and H2SO4 originate from traffic. This is further supported by examining the concentrations in different wind directions (Figs. 8 and 9), which shows that the highest concentrations were measured when the wind blew from the street.
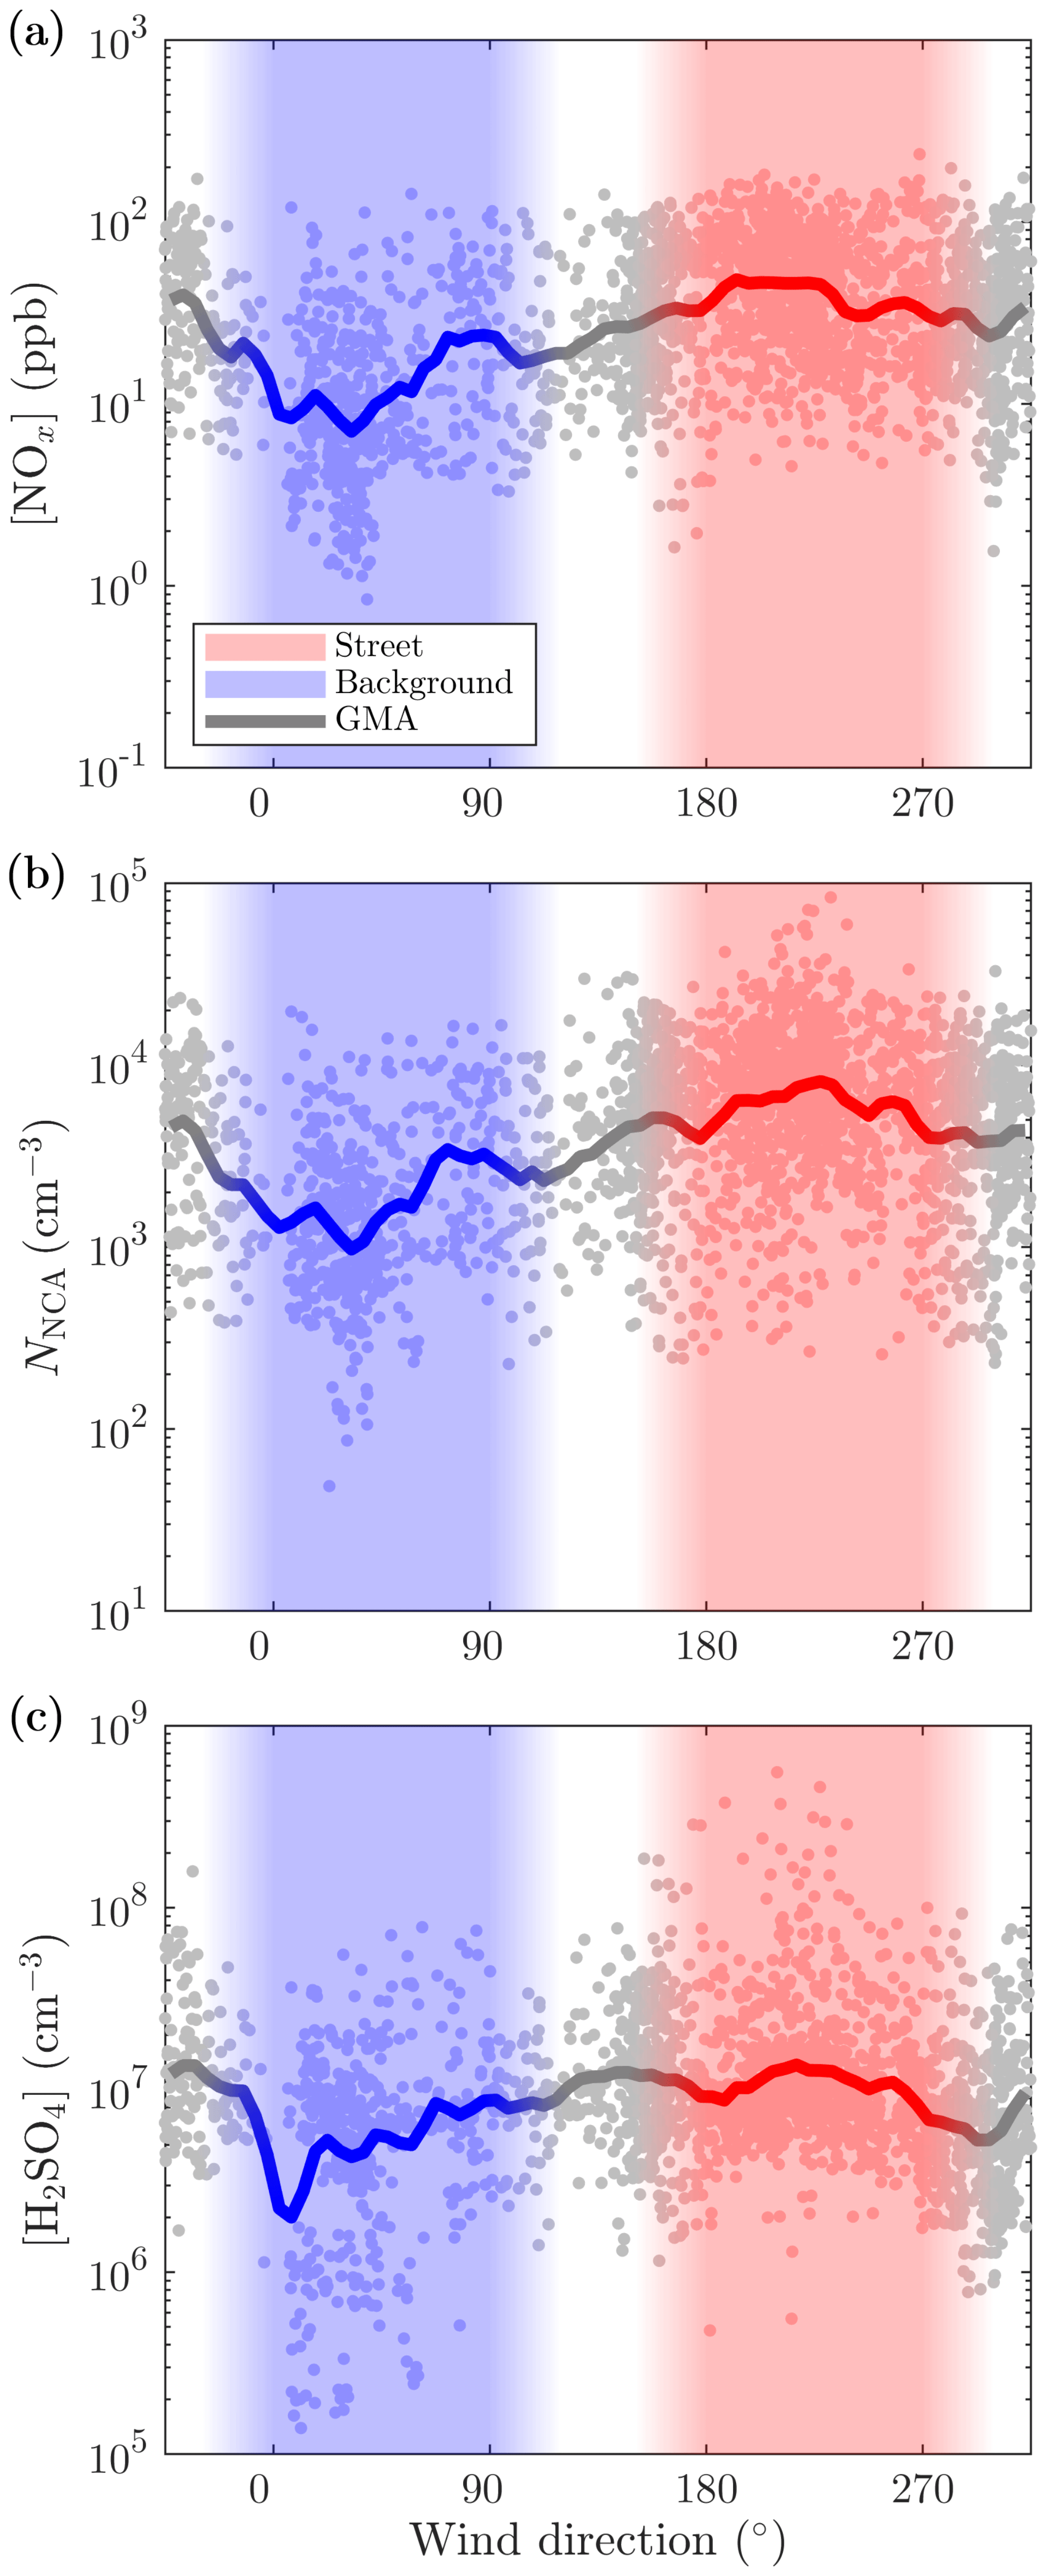
Figure 8The 10 min averages of the (a) NOx, (b) NCA, and (c) H2SO4 concentrations measured with different wind directions. Wind velocities smaller than 0.5 m s−1 are excluded. GMA denotes geometric moving average.
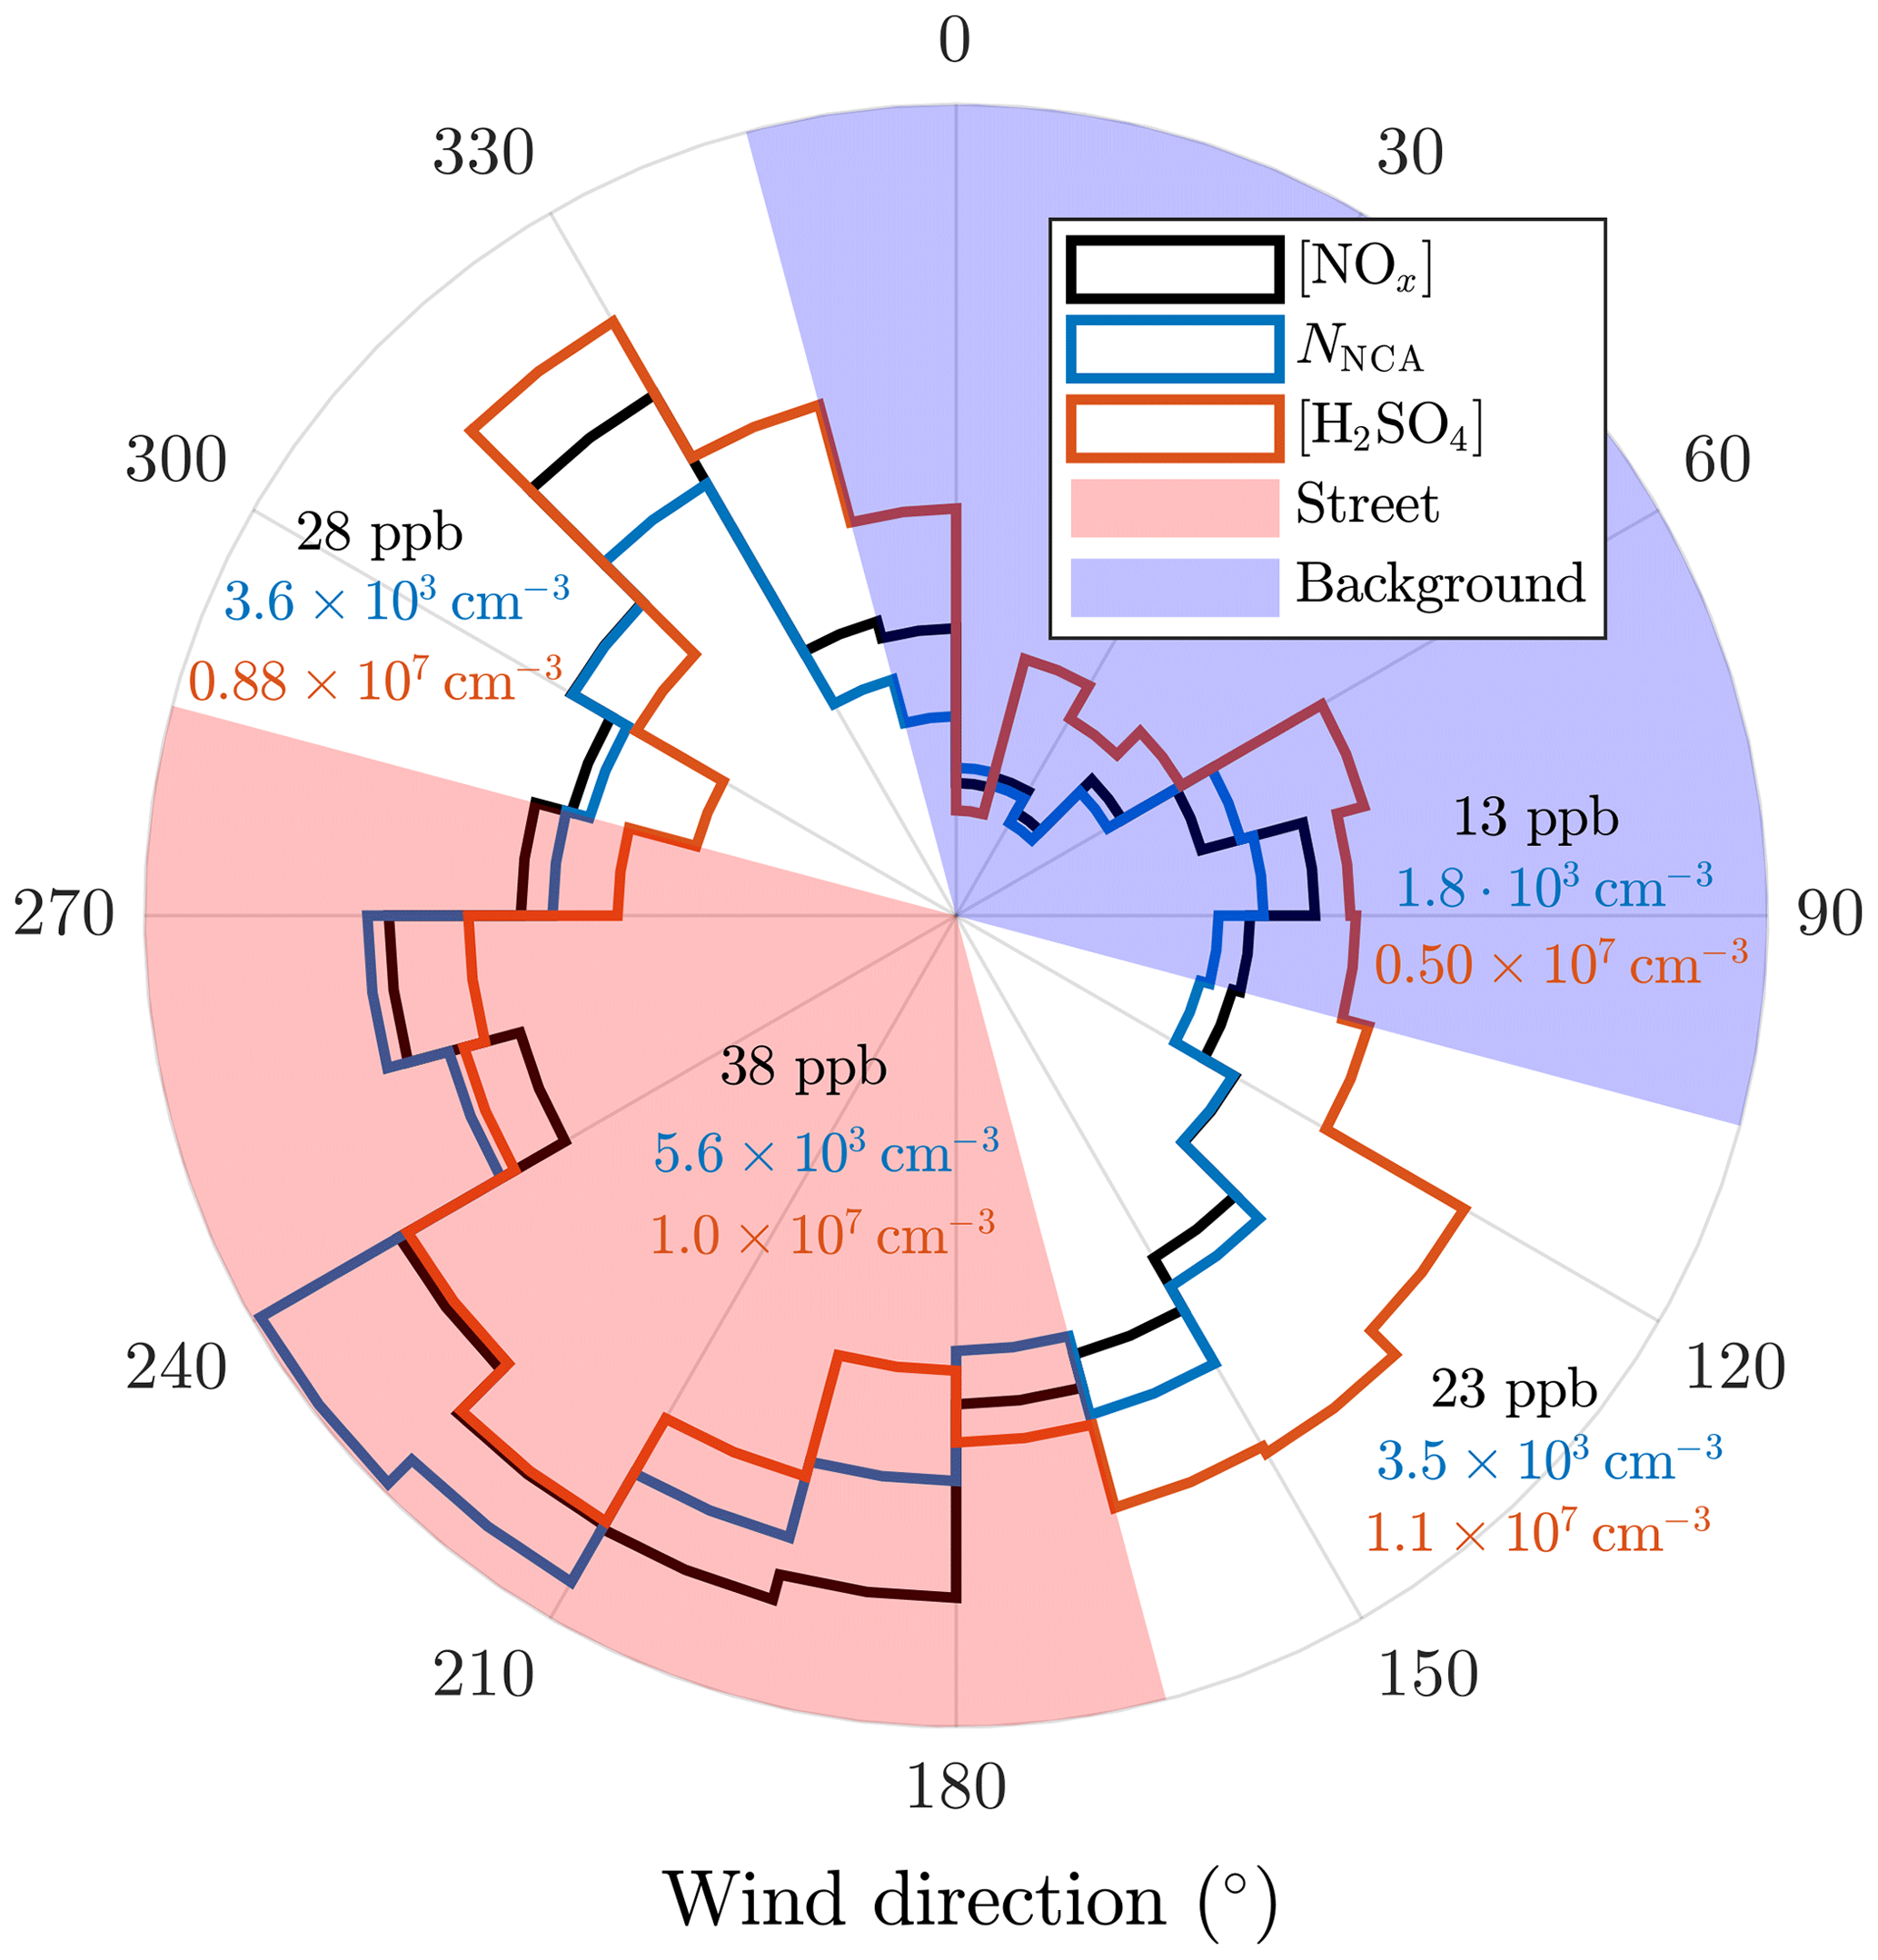
Figure 9The 10 min averages of the NOx, NCA, and H2SO4 concentrations further averaged to different wind direction sectors. Wind velocities smaller than 0.5 m s−1 are excluded. The geometric averages of the concentrations across the sectors are shown in the figure.
While the emission factors can depend markedly on vehicle, engine, fuel, and after-treatment system types, the emission factors obtained here represent the average fleet-level values and can thus be moderately applicable in regional and global aerosol models at least for areas with the same average fleet composition as at our measurement site in Helsinki. However, more research is needed to obtain emission factors separated into the different types.
The annual CO2 emission rate from traffic in Helsinki in 2017 was 5.38×10⁸ kg CO2 a−1 (VTT Technical Research Centre of Finland Ltd, 2017). Using the average NCA emission factor versus CO2 emission, 2.21×10¹⁴ kg CO2−1, a rough estimation on the annual NCA emission from traffic in Helsinki becomes . The annual NCA formation rate via photochemical NPF in Helsinki can be approximated using estimates of nucleation rate, from 1 to 10 ; NPF event day count per year, from 30 to 120 a−1; NPF duration, from 2 to 4 h, measured in a rural area in Hyytiälä, Finland (Dal Maso et al., 2005; Kulmala and Kerminen, 2008) and in an urban area in Helsinki (Hussein et al., 2008); the total area of Helsinki, 214 km2; and a rough estimate for the boundary layer height, 500 m. Multiplying these gives the estimation of the annual NCA formation rate from 0.23×10²³ to 18.5×10²³ a−1. Comparison of these annual rates suggests that a minimum of 6 % but even up to 84 % of NCA particles are estimated to originate from traffic in Helsinki on an annual basis. Although this range is wide, the contribution of traffic-originated NCA is significant.
Another estimation for the traffic contribution to NCA (and also to H2SO4) in urban air can be performed using the linear fits from Fig. 6. Considering typical weekday noontime at our measurement location and assuming the annual mean of the daytime maximum SI in Helsinki, 500 W m−2, the NCA concentration due to traffic is (the value of the high NOx line at zero irradiance) and the increase in the NCA concentration due to photochemistry is cm−3 (calculated with the slope of the low NOx line). These concentrations indicate that approximately 85 % of the total NCA concentration at the street canyon originates from traffic at noontime. Considering midsummer and midwinter, the daytime maximum SIs are 850 and 100 W m−2, giving the contributions of ∼ 78 % and ∼ 97 %, respectively. Therefore, it is evident that the major fraction of NCA originated from traffic at our measurement location, even with the highest available SI values in midsummer.
For H2SO4, the concentration due to traffic at our measurement location at typical weekday noontime is , and the increase in the concentration due to photochemistry is , indicating approximately 68 % of the total H2SO4 concentration at the street canyon originates from local traffic at noontime. For midsummer and midwinter, the contributions become ∼ 56 % and ∼ 92 %, respectively. These values signify that the major fraction of H2SO4 also originated from traffic even though it cannot be seen as clearly from the diurnal variation as is seen in the case of NCA.
Because regional NPF events are frequently suppressed by high CSs (Kerminen et al., 2018), decreasing CS can lead to a NPF event, resulting in particle number concentration increase. However, our data display no clear anticorrelations of this kind (see Fig. S6). This again implies that regional NPF events cannot clearly be distinguished from the data measured in the vicinity of dense traffic.
Traffic-emitted NCA poses a potential health risk because the observed NCA concentrations are valid at the curbside of the street, which is the location where pedestrians spend time in traffic. Spreading of the NCA particles emitted on the streets can be approximated with particle lifetimes. The lifetimes can be estimated using coagulation sinks (CoagS) and the time constants of coagulation scavenging (τCoagS), which is the inverse of CoagS, calculated as in Kulmala et al. (2001). Assuming no other losses of the particles, such as self-coagulation and condensational growth out from the NCA size range, and no mixing of the emitted aerosol with the background aerosol, τCoagS represents the lifetime of the particles. The estimated lifetimes were on the scale of several minutes, resulting in a spreading possibility of the NCA particles around urban areas. The diurnal variations in CoagS and τCoagS are presented in Fig. S2.
Our data clearly demonstrate that NCA-sized particle concentrations in a traffic-influenced environment are controlled by NCA directly emitted by traffic. The data also demonstrate that while generally NCA and photochemically produced nucleating vapor concentrations correlate, this correlation is likely, firstly, due to increased traffic volumes at daytime and, secondly, due to traffic-originated H2SO4 and other nucleating vapors. We also showed that H2SO4 formation is driven by both solar radiation and a traffic-related source.
Our results have several implications on our understanding of aerosol particle formation in traffic-influenced areas. Firstly, because current regional and global air quality models do not include particles in the sub-3 nm size range as primary emissions (Paasonen et al., 2016), the modeled NCA-sized particle concentrations are mainly driven by photochemical NPF processes, neglecting their origin from traffic as primary sources. Thus, our results show an urgent need to update these emissions. In light of our results, it seems evident that there will be areas in which direct emissions dominate the formation of new aerosol. A rough calculation gives that, on an annual basis, up to 84 % of NCA can originate from traffic in Helsinki, and, according to the measured NCA concentrations, at typical weekday noontime, ∼ 85 % of the total NCA concentration was contributed by traffic at our studied site. In wintertime, this contribution may reach ∼ 97 % due to lower SIs, which highlights the need for updating the annual particle formation cycles in the models. Secondly, our results also show that both traffic emission and regional NCA formation signals can be distinguished for most of the times and that traffic also influences the formation of H2SO4. Together with the findings of Yao et al. (2018), this presents a significant update on the particle formation mechanisms in urban areas. As illustrated in Fig. 4, the particle concentration is controlled by the interplay of the two processes, with varying importance depending on the proximity of the emission source. Our results call for reconsideration and reanalysis of observations of NPF events observed in traffic-influenced areas. In many cases, there is covariance between traffic volumes and SI, and care should be taken to separate these two variables in the analysis, e.g., by considering CO2 or NOx as tracers for traffic volumes. Finally, potential health effects of traffic emissions in urban areas should also be considered more carefully because the composition of the emitted NCA particles is still unknown, especially as some clues for their non-volatility exist.
The time series data are freely available at https://doi.org/10.5281/zenodo.3558852 (Olin, 2019).
The supplement related to this article is available online at: https://doi.org/10.5194/acp-20-1-2020-supplement.
MD, TR, JVN, and HJT designed the research. MO, HK, MA, JK, NK, and MI performed the measurements. MO, HK, NK, and MI analyzed the data. MO prepared the paper with contributions from all co-authors.
The authors declare that they have no conflict of interest.
We thank the tofTools team for providing tools for mass spectrometry analysis and Mikko Sipilä from the University of Helsinki for lending the chemical ionization inlet for the atmospheric-pressure-interface time-of-flight mass spectrometer. Harri Portin and Anu Kousa from the Helsinki Region Environmental Services Authority (HSY) as well as the HSY's AQ measurement team are acknowledged for their valuable work related to the data quality control and measurements at the Mäkelänkatu supersite. Petri Blomqvist from the City of Helsinki is acknowledged for the traffic count data.
This research has been supported by Tekes – the Finnish Funding Agency for Innovation (grant no. 2883/31/2015), HSY, and Pegasor Oy, who funded the research through the Cityzer project, the graduate school of Tampere University of Technology, and the Academy of Finland through the Profi 4 (grant no. 318940), infrastructure funding (grant no. 273010), and the Condenz project (grant no. 326437).
This paper was edited by Markus Petters and reviewed by three anonymous referees.
Ahmad, K., Khare, M., and Chaudhry, K.: Wind tunnel simulation studies on dispersion at urban street canyons and intersections—a review, J. Wind Eng. Ind. Aerod., 93, 697–717, https://doi.org/10.1016/j.jweia.2005.04.002, 2005. a
Alanen, J., Saukko, E., Lehtoranta, K., Murtonen, T., Timonen, H., Hillamo, R., Karjalainen, P., Kuuluvainen, H., Harra, J., Keskinen, J., and Rönkkö, T.: The formation and physical properties of the particle emissions from a natural gas engine, Fuel, 162, 155–161, https://doi.org/10.1016/j.fuel.2015.09.003, 2015. a
Arneth, A., Unger, N., Kulmala, M., and Andreae, M.: Clean the air, heat the planet?, Science, 326, 672–673, https://doi.org/10.1126/science.1181568, 2009. a
Arnold, F., Pirjola, L., Rönkkö, T., Reichl, U., Schlager, H., Lähde, T., Heikkilä, J., and Keskinen, J.: First online measurements of sulfuric acid gas in modern heavy-duty diesel engine exhaust: Implications for nanoparticle formation, Environ. Sci. Technol., 46, 11227–11234, https://doi.org/10.1021/es302432s, 2012. a, b, c
Beelen, R., Raaschou-Nielsen, O., Stafoggia, M., Andersen, Z., Weinmayr, G., Hoffmann, B., Wolf, K., Samoli, E., Fischer, P., Nieuwenhuijsen, M., Vineis, P., Xun, W., Katsouyanni, K., Dimakopoulou, K., Oudin, A., Forsberg, B., Modig, L., Havulinna, A., Lanki, T., Turunen, A., Oftedal, B., Nystad, W., Nafstad, P., De Faire, U., Pedersen, N., Östenson, C.-G., Fratiglioni, L., Penell, J., Korek, M., Pershagen, G., Eriksen, K., Overvad, K., Ellermann, T., Eeftens, M., Peeters, P., Meliefste, K., Wang, M., Bueno-De-Mesquita, B., Sugiri, D., Krämer, U., Heinrich, J., De Hoogh, K., Key, T., Peters, A., Hampel, R., Concin, H., Nagel, G., Ineichen, A., Schaffner, E., Probst-Hensch, N., Künzli, N., Schindler, C., Schikowski, T., Adam, M., Phuleria, H., Vilier, A., Clavel-Chapelon, F., Declercq, C., Grioni, S., Krogh, V., Tsai, M.-Y., Ricceri, F., Sacerdote, C., Galassi, C., Migliore, E., Ranzi, A., Cesaroni, G., Badaloni, C., Forastiere, F., Tamayo, I., Amiano, P., Dorronsoro, M., Katsoulis, M., Trichopoulou, A., Brunekreef, B., and Hoek, G.: Effects of long-term exposure to air pollution on natural-cause mortality: An analysis of 22 European cohorts within the multicentre ESCAPE project, Lancet, 383, 785–795, https://doi.org/10.1016/S0140-6736(13)62158-3, 2014. a
Brockmann, J. E.: Sampling and Transport of Aerosols, in: Aerosol Measurement: Principles, Techniques, and Applications, 2nd edn., edited by: Baron, P. A. and Willeke, K., John Wiley & Sons, Hoboken, USA, 143–195, 2005. a
Chapman, S. and Cowling, T.: The Mathematical Theory of Non-uniform Gases. An account of the kinetic theory of viscosity, thermal conduction, and diffusion in gases, 2nd edn., Cambridge University Press, Cambridge, UK, 1954. a
Clapp, L. J. and Jenkin, M. E.: Analysis of the relationship between ambient levels of O3, NO2 and NO as a function of NOx in the UK, Atmos. Environ., 35, 6391–6405, https://doi.org/10.1016/S1352-2310(01)00378-8, 2001. a
Dal Maso, M., Kulmala, M., Riipinen, I., Wagner, R., Hussein, T., Aalto, P., and Lehtinen, K.: Formation and growth of fresh atmospheric aerosols: eight years of aerosol size distribution data from SMEAR II, Hyytiälä, Finland, Bor. Env. Res., 10, 323–336, 2005. a
Dockery, D., Pope III, C., Xu, X., Spengler, J., Ware, J., Fay, M., Ferris Jr., B., and Speizer, F.: An association between air pollution and mortality in six U.S. cities, New Engl. J. Med., 329, 1753–1759, https://doi.org/10.1056/NEJM199312093292401, 1993. a
Eisele, F. L. and Tanner, D. J.: Measurement of the gas phase concentration of H2SO4 and methane sulfonic acid and estimates of H2SO4 production and loss in the atmosphere, J. Geophys. Res.-Atmos., 98, 9001–9010, https://doi.org/10.1029/93JD00031, 1993. a
Hanson, D. R. and Eisele, F.: Diffusion of H2SO4 in Humidified Nitrogen: Hydrated H2SO4, J. Phys. Chem. A, 104, 1715–1719, https://doi.org/10.1021/jp993622j, 2000. a
Hietikko, R., Kuuluvainen, H., Harrison, R. M., Portin, H., Timonen, H., Niemi, J. V., and Rönkkö, T.: Diurnal variation of nanocluster aerosol concentrations and emission factors in a street canyon, Atmos. Environ., 189, 98–106, https://doi.org/10.1016/j.atmosenv.2018.06.031, 2018. a
Hussein, T., Martikainen, J., Junninen, H., Sogacheva, L., Wagner, R., Dal Maso, M., Riipinen, I., Aalto, P., and Kulmala, M.: Observation of regional new particle formation in the urban atmosphere, Tellus, 60, 509–521, https://doi.org/10.1111/j.1600-0889.2008.00365.x, 2008. a
Jokinen, T., Sipilä, M., Junninen, H., Ehn, M., Lönn, G., Hakala, J., Petäjä, T., Mauldin III, R. L., Kulmala, M., and Worsnop, D. R.: Atmospheric sulphuric acid and neutral cluster measurements using CI-APi-TOF, Atmos. Chem. Phys., 12, 4117–4125, https://doi.org/10.5194/acp-12-4117-2012, 2012. a
Junninen, H., Ehn, M., Petäjä, T., Luosujärvi, L., Kotiaho, T., Kostiainen, R., Rohner, U., Gonin, M., Fuhrer, K., Kulmala, M., and Worsnop, D. R.: A high-resolution mass spectrometer to measure atmospheric ion composition, Atmos. Meas. Tech., 3, 1039–1053, https://doi.org/10.5194/amt-3-1039-2010, 2010. a
Kerminen, V.-M., Chen, X., Vakkari, V., Petäjä, T., Kulmala, M., and Bianchi, F.: Atmospheric new particle formation and growth: review of field observations, Environ. Res. Lett., 13, 103003, https://doi.org/10.1088/1748-9326/aadf3c, 2018. a, b
Kittelson, D.: Engines and nanoparticles: A review, J. Aerosol Sci., 29, 575–588, https://doi.org/10.1016/S0021-8502(97)10037-4, 1998. a
Kontkanen, J., Lehtipalo, K., Ahonen, L., Kangasluoma, J., Manninen, H. E., Hakala, J., Rose, C., Sellegri, K., Xiao, S., Wang, L., Qi, X., Nie, W., Ding, A., Yu, H., Lee, S., Kerminen, V.-M., Petäjä, T., and Kulmala, M.: Measurements of sub-3 nm particles using a particle size magnifier in different environments: from clean mountain top to polluted megacities, Atmos. Chem. Phys., 17, 2163–2187, https://doi.org/10.5194/acp-17-2163-2017, 2017. a
Kulmala, M. and Kerminen, V.-M.: On the formation and growth of atmospheric nanoparticles, Atmos. Res., 90, 132–150, https://doi.org/10.1016/j.atmosres.2008.01.005, 2008. a
Kulmala, M., Dal Maso, M., Mäkelä, J. M., Pirjola, L., Väkevä, M., Aalto, P., Miikkulainen, P., Hämeri, K., and O'Dowd, C. D.: On the formation, growth and composition of nucleation mode particles, Tellus B, 53, 479–490, https://doi.org/10.1034/j.1600-0889.2001.530411.x, 2001. a
Kulmala, M., Kontkanen, J., Junninen, H., Lehtipalo, K., Manninen, H., Nieminen, T., Petäjä, T., Sipilä, M., Schobesberger, S., Rantala, P., Franchin, A., Jokinen, T., Järvinen, E., Äijälä, M., Kangasluoma, J., Hakala, J., Aalto, P., Paasonen, P., Mikkilä, J., Vanhanen, J., Aalto, J., Hakola, H., Makkonen, U., Ruuskanen, T., Mauldin III, R., Duplissy, J., Vehkamäki, H., Bäck, J., Kortelainen, A., Riipinen, I., Kurtén, T., Johnston, M., Smith, J., Ehn, M., Mentel, T., Lehtinen, K., Laaksonen, A., Kerminen, V.-M., and Worsnop, D.: Direct observations of atmospheric aerosol nucleation, Science, 339, 943–946, https://doi.org/10.1126/science.1227385, 2013. a
Kulmala, M., Petäjä, T., Ehn, M., Thornton, J., Sipilä, M., Worsnop, D., and Kerminen, V.-M.: Chemistry of Atmospheric Nucleation: On the Recent Advances on Precursor Characterization and Atmospheric Cluster Composition in Connection with Atmospheric New Particle Formation, Annu. Rev. Phys. Chem., 65, 21–37, https://doi.org/10.1146/annurev-physchem-040412-110014, 2014. a
Kürten, A., Rondo, L., Ehrhart, S., and Curtius, J.: Calibration of a Chemical Ionization Mass Spectrometer for the Measurement of Gaseous Sulfuric Acid, J. Phys. Chem. A, 116, 6375–6386, https://doi.org/10.1021/jp212123n, 2012. a
Kuuluvainen, H., Poikkimäki, M., Järvinen, A., Kuula, J., Irjala, M., Maso, M. D., Keskinen, J., Timonen, H., Niemi, J. V., and Rönkkö, T.: Vertical profiles of lung deposited surface area concentration of particulate matter measured with a drone in a street canyon, Environ. Pollut., 241, 96–105, https://doi.org/10.1016/j.envpol.2018.04.100, 2018. a
Lehtipalo, K., Yan, C., Dada, L., Bianchi, F., Xiao, M., Wagner, R., Stolzenburg, D., Ahonen, L. R., Amorim, A., Baccarini, A., Bauer, P. S., Baumgartner, B., Bergen, A., Bernhammer, A.-K., Breitenlechner, M., Brilke, S., Buchholz, A., Mazon, S. B., Chen, D., Chen, X., Dias, A., Dommen, J., Draper, D. C., Duplissy, J., Ehn, M., Finkenzeller, H., Fischer, L., Frege, C., Fuchs, C., Garmash, O., Gordon, H., Hakala, J., He, X., Heikkinen, L., Heinritzi, M., Helm, J. C., Hofbauer, V., Hoyle, C. R., Jokinen, T., Kangasluoma, J., Kerminen, V.-M., Kim, C., Kirkby, J., Kontkanen, J., Kürten, A., Lawler, M. J., Mai, H., Mathot, S., Mauldin, R. L., Molteni, U., Nichman, L., Nie, W., Nieminen, T., Ojdanic, A., Onnela, A., Passananti, M., Petäjä, T., Piel, F., Pospisilova, V., Quéléver, L. L. J., Rissanen, M. P., Rose, C., Sarnela, N., Schallhart, S., Schuchmann, S., Sengupta, K., Simon, M., Sipilä, M., Tauber, C., Tomé, A., Tröstl, J., Väisänen, O., Vogel, A. L., Volkamer, R., Wagner, A. C., Wang, M., Weitz, L., Wimmer, D., Ye, P., Ylisirniö, A., Zha, Q., Carslaw, K. S., Curtius, J., Donahue, N. M., Flagan, R. C., Hansel, A., Riipinen, I., Virtanen, A., Winkler, P. M., Baltensperger, U., Kulmala, M., and Worsnop, D. R.: Multicomponent new particle formation from sulfuric acid, ammonia, and biogenic vapors, Sci. Adv., 4, eaau5363, https://doi.org/10.1126/sciadv.aau5363, 2018. a, b
Maher, B. A., Ahmed, I. A. M., Karloukovski, V., MacLaren, D. A., Foulds, P. G., Allsop, D., Mann, D. M. A., Torres-Jardón, R., and Calderon-Garciduenas, L.: Magnetite pollution nanoparticles in the human brain, P. Natl. Acad. Sci. USA, 113, 10797–10801, https://doi.org/10.1073/pnas.1605941113, 2016. a
McMurry, P. and Friedlander, S.: New particle formation in the presence of an aerosol, Atmos. Environ., 13, 1635–1651, https://doi.org/10.1016/0004-6981(79)90322-6, 1979. a
Olin, M.: Data for Olin et al.: “Traffic-originated nanocluster emission exceeds H2SO4-driven photochemical new particle formation in an urban area” Zenodo, https://doi.org/10.5281/zenodo.3558852, 2019. a
Paasonen, P., Nieminen, T., Asmi, E., Manninen, H. E., Petäjä, T., Plass-Dülmer, C., Flentje, H., Birmili, W., Wiedensohler, A., Hõrrak, U., Metzger, A., Hamed, A., Laaksonen, A., Facchini, M. C., Kerminen, V.-M., and Kulmala, M.: On the roles of sulphuric acid and low-volatility organic vapours in the initial steps of atmospheric new particle formation, Atmos. Chem. Phys., 10, 11223–11242, https://doi.org/10.5194/acp-10-11223-2010, 2010. a
Paasonen, P., Kupiainen, K., Klimont, Z., Visschedijk, A., Denier van der Gon, H. A. C., and Amann, M.: Continental anthropogenic primary particle number emissions, Atmos. Chem. Phys., 16, 6823–6840, https://doi.org/10.5194/acp-16-6823-2016, 2016. a, b
Pope, C., Burnett, R., Thun, M., Calle, E., Krewski, D., Ito, K., and Thurston, G.: Lung cancer, cardiopulmonary mortality, and long-term exposure to fine particulate air pollution, J. Amer. Med. Assoc., 287, 1132–1141, https://doi.org/10.1001/jama.287.9.1132, 2002. a
Rönkkö, T., Lähde, T., Heikkilä, J., Pirjola, L., Bauschke, U., Arnold, F., Schlager, H., Rothe, D., Yli-Ojanperä, J., and Keskinen, J.: Effects of gaseous sulphuric acid on diesel exhaust nanoparticle formation and characteristics, Environ. Sci. Technol., 47, 11882–11889, https://doi.org/10.1021/es402354y, 2013. a, b
Rönkkö, T., Kuuluvainen, H., Karjalainen, P., Keskinen, J., Hillamo, R., Niemi, J. V., Pirjola, L., Timonen, H. J., Saarikoski, S., Saukko, E., Järvinen, A., Silvennoinen, H., Rostedt, A., Olin, M., Yli-Ojanperä, J., Nousiainen, P., Kousa, A., and Dal Maso, M.: Traffic is a major source of atmospheric nanocluster aerosol, P. Natl. Acad. Sci. USA, 114, 7549–7554, https://doi.org/10.1073/pnas.1700830114, 2017. a, b, c
Sgro, L. A., Sementa, P., Vaglieco, B. M., Rusciano, G., D’Anna, A., and Minutolo, P.: Investigating the origin of nuclei particles in GDI engine exhausts, Combust. Flame, 159, 1687–1692, https://doi.org/10.1016/j.combustflame.2011.12.013, 2012. a
Vanhanen, J., Mikkilä, J., Lehtipalo, K., Sipilä, M., Manninen, H. E., Siivola, E., Petäjä, T., and Kulmala, M.: Particle size magnifier for nano-CN detection, Aerosol Sci. Tech., 45, 533–542, https://doi.org/10.1080/02786826.2010.547889, 2011. a
VTT Technical Research Centre of Finland Ltd: LIPASTO unit emissions, database, available at: http://lipasto.vtt.fi/yksikkopaastot/ (last access: 15 January 2019), 2017. a
Yao, L., Garmash, O., Bianchi, F., Zheng, J., Yan, C., Kontkanen, J., Junninen, H., Mazon, S. B., Ehn, M., Paasonen, P., Sipilä, M., Wang, M., Wang, X., Xiao, S., Chen, H., Lu, Y., Zhang, B., Wang, D., Fu, Q., Geng, F., Li, L., Wang, H., Qiao, L., Yang, X., Chen, J., Kerminen, V.-M., Petäjä, T., Worsnop, D. R., Kulmala, M., and Wang, L.: Atmospheric new particle formation from sulfuric acid and amines in a Chinese megacity, Science, 361, 278–281, https://doi.org/10.1126/science.aao4839, 2018. a, b, c, d
Yli-Tuomi, T., Aarnio, P., Pirjola, L., Mäkelä, T., Hillamo, R., and Jantunen, M.: Emissions of fine particles, NOx, and CO from on-road vehicles in Finland, Atmos. Environ., 39, 6696–6706, https://doi.org/10.1016/j.atmosenv.2005.07.049, 2005. a, b
Zhao, J., Smith, J. N., Eisele, F. L., Chen, M., Kuang, C., and McMurry, P. H.: Observation of neutral sulfuric acid-amine containing clusters in laboratory and ambient measurements, Atmos. Chem. Phys., 11, 10823–10836, https://doi.org/10.5194/acp-11-10823-2011, 2011. a