the Creative Commons Attribution 4.0 License.
the Creative Commons Attribution 4.0 License.
 | 17 Jul 2019
Evaluation of the effect of regional joint-control measures on changing photochemical transformation: a comprehensive study of the optimization scenario analysis
Shuhui Zhu
Jingyu An
Min Zhou
Hongli Wang
Rusha Yan
Liping Qiao
Xudong Tian
Lijuan Shen
Ling Huang
Yangjun Wang
Jeremy C. Avise
Joshua S. Fu
Heavy haze usually occurs in winter in eastern China. To control the severe air pollution during the season, comprehensive regional joint-control strategies were implemented throughout a campaign. To evaluate the effectiveness of these strategies and to provide some insights into strengthening the regional joint-control mechanism, the influence of control measures on levels of air pollution was estimated with an integrated measurement-emission-modeling method. To determine the influence of meteorological conditions, and the control measures on the air quality, in a comprehensive study, the 2nd World Internet Conference was held during 16–18 December 2015 in Jiaxing City, Zhejiang province, in the Yangtze River Delta (YRD) region. We first analyzed the air quality changes during four meteorological regimes and then compared the air pollutant concentrations before, during, and after the regulation under static meteorological conditions. Next, we conducted modeling scenarios to quantify the effects caused due to the air pollution control measures. We found that total emissions of SO2, NOx, PM2.5, and volatile organic compounds (VOCs) in Jiaxing were reduced by 56 %, 58 %, 64 %, and 80 %, respectively, while total emission reductions of SO2, NOx, PM2.5, and VOCs over the YRD region are estimated to be 10 %, 9 %, 10 %, and 11 %, respectively. Modeling results suggest that during the campaign from 8 to 18 December, PM2.5 daily average concentrations decreased by 10 µg m−3 with an average decrease of 14.6 %. Our implemented optimization analysis compared with previous studies also reveals that local emission reductions play a key role in air quality improvement, although it shall be supplemented by regional linkage. In terms of regional joint control, implementing pollution channel control 48 h before the event is of most benefit in getting similar results. Therefore, it is recommended that a synergistic emission reduction plan between adjacent areas with local pollution emission reductions as the core part should be established and strengthened, and emission reduction plans for different types of pollution through a stronger regional linkage should be reserved.
- Article
(23899 KB) - Full-text XML
- BibTeX
- EndNote


High concentrations of PM2.5 have attracted much attention due to its impact on visibility (Pui et al., 2014), human health (West et al., 2016), and global environment. To control the air pollution situation in China, the Ministry of Ecology and Environment of the People's Republic of China released a lot of policies which can generally be divided into long-term action plans (such as the Clean Air Action Plan, 2013–2017, and the Five-year Action Plan) and short-term control measures (such as Clean Air Protection during Mega Events and Air Pollution Warning and Protection Measures). China has successfully implemented some mega-event air-pollution-control plans and ensured good air quality, including the 2008 Beijing Olympics (Kelly and Zhu, 2016); the 2010 World Expo in Shanghai (CAI-Asia, 2010); the 2010 Guangzhou Asian Games (Liu et al., 2013); the 2014 Asia-Pacific Economic Cooperation forum (APEC; Liang et al., 2017); 2014 Summer Youth Olympics in Nanjing (CAI-Asia, 2014); and the 2015 China Victory Day Parade (Victory Parade 2015; Liang et al., 2017). After implementation of these control measures, it is important to understand how effective these strategies are.
The 2nd World Internet Conference was held in Tongxiang, Jiaxing, and Zhejiang during 16–18 December 2015. To reduce air pollution during the conference, Zhejiang province and the Regional Air-pollution Joint Control Office of the Yangtze River Delta (YRD) region developed an Action Plan for Air Pollution Control during the conference (henceforth referred to as the Action Plan) which clarified target goals, time periods for implementing controls, regions in which the controls would be applied, and the control measures to be implemented, as described below. Targets are to achieve an air quality index (AQI) below 100 in “key areas”, an AQI below 150 in “control areas”, and to achieve significant improvement of the air quality in the surrounding (or buffer) regions outside the control areas. The time periods of interest for implementing various controls include the early stage (3 months before the conference), the advanced stage (2 weeks to 4 d before the conference) and the central stage (3 d before and 2 d after the conference). Regions are areas within a 50 km radius, within a 100 km radius, and outside of a 100 km radius from the center of Tongxiang were classified as key areas, control areas, and buffer areas, respectively. These areas cover nine cities including Jiaxing, Huzhou, Hangzhou, Ningbo, and Shaoxing in Zhejiang province; Suzhou and Wuxi in Jiangsu province; and Xuancheng in Anhui province, as shown in Fig. 1.
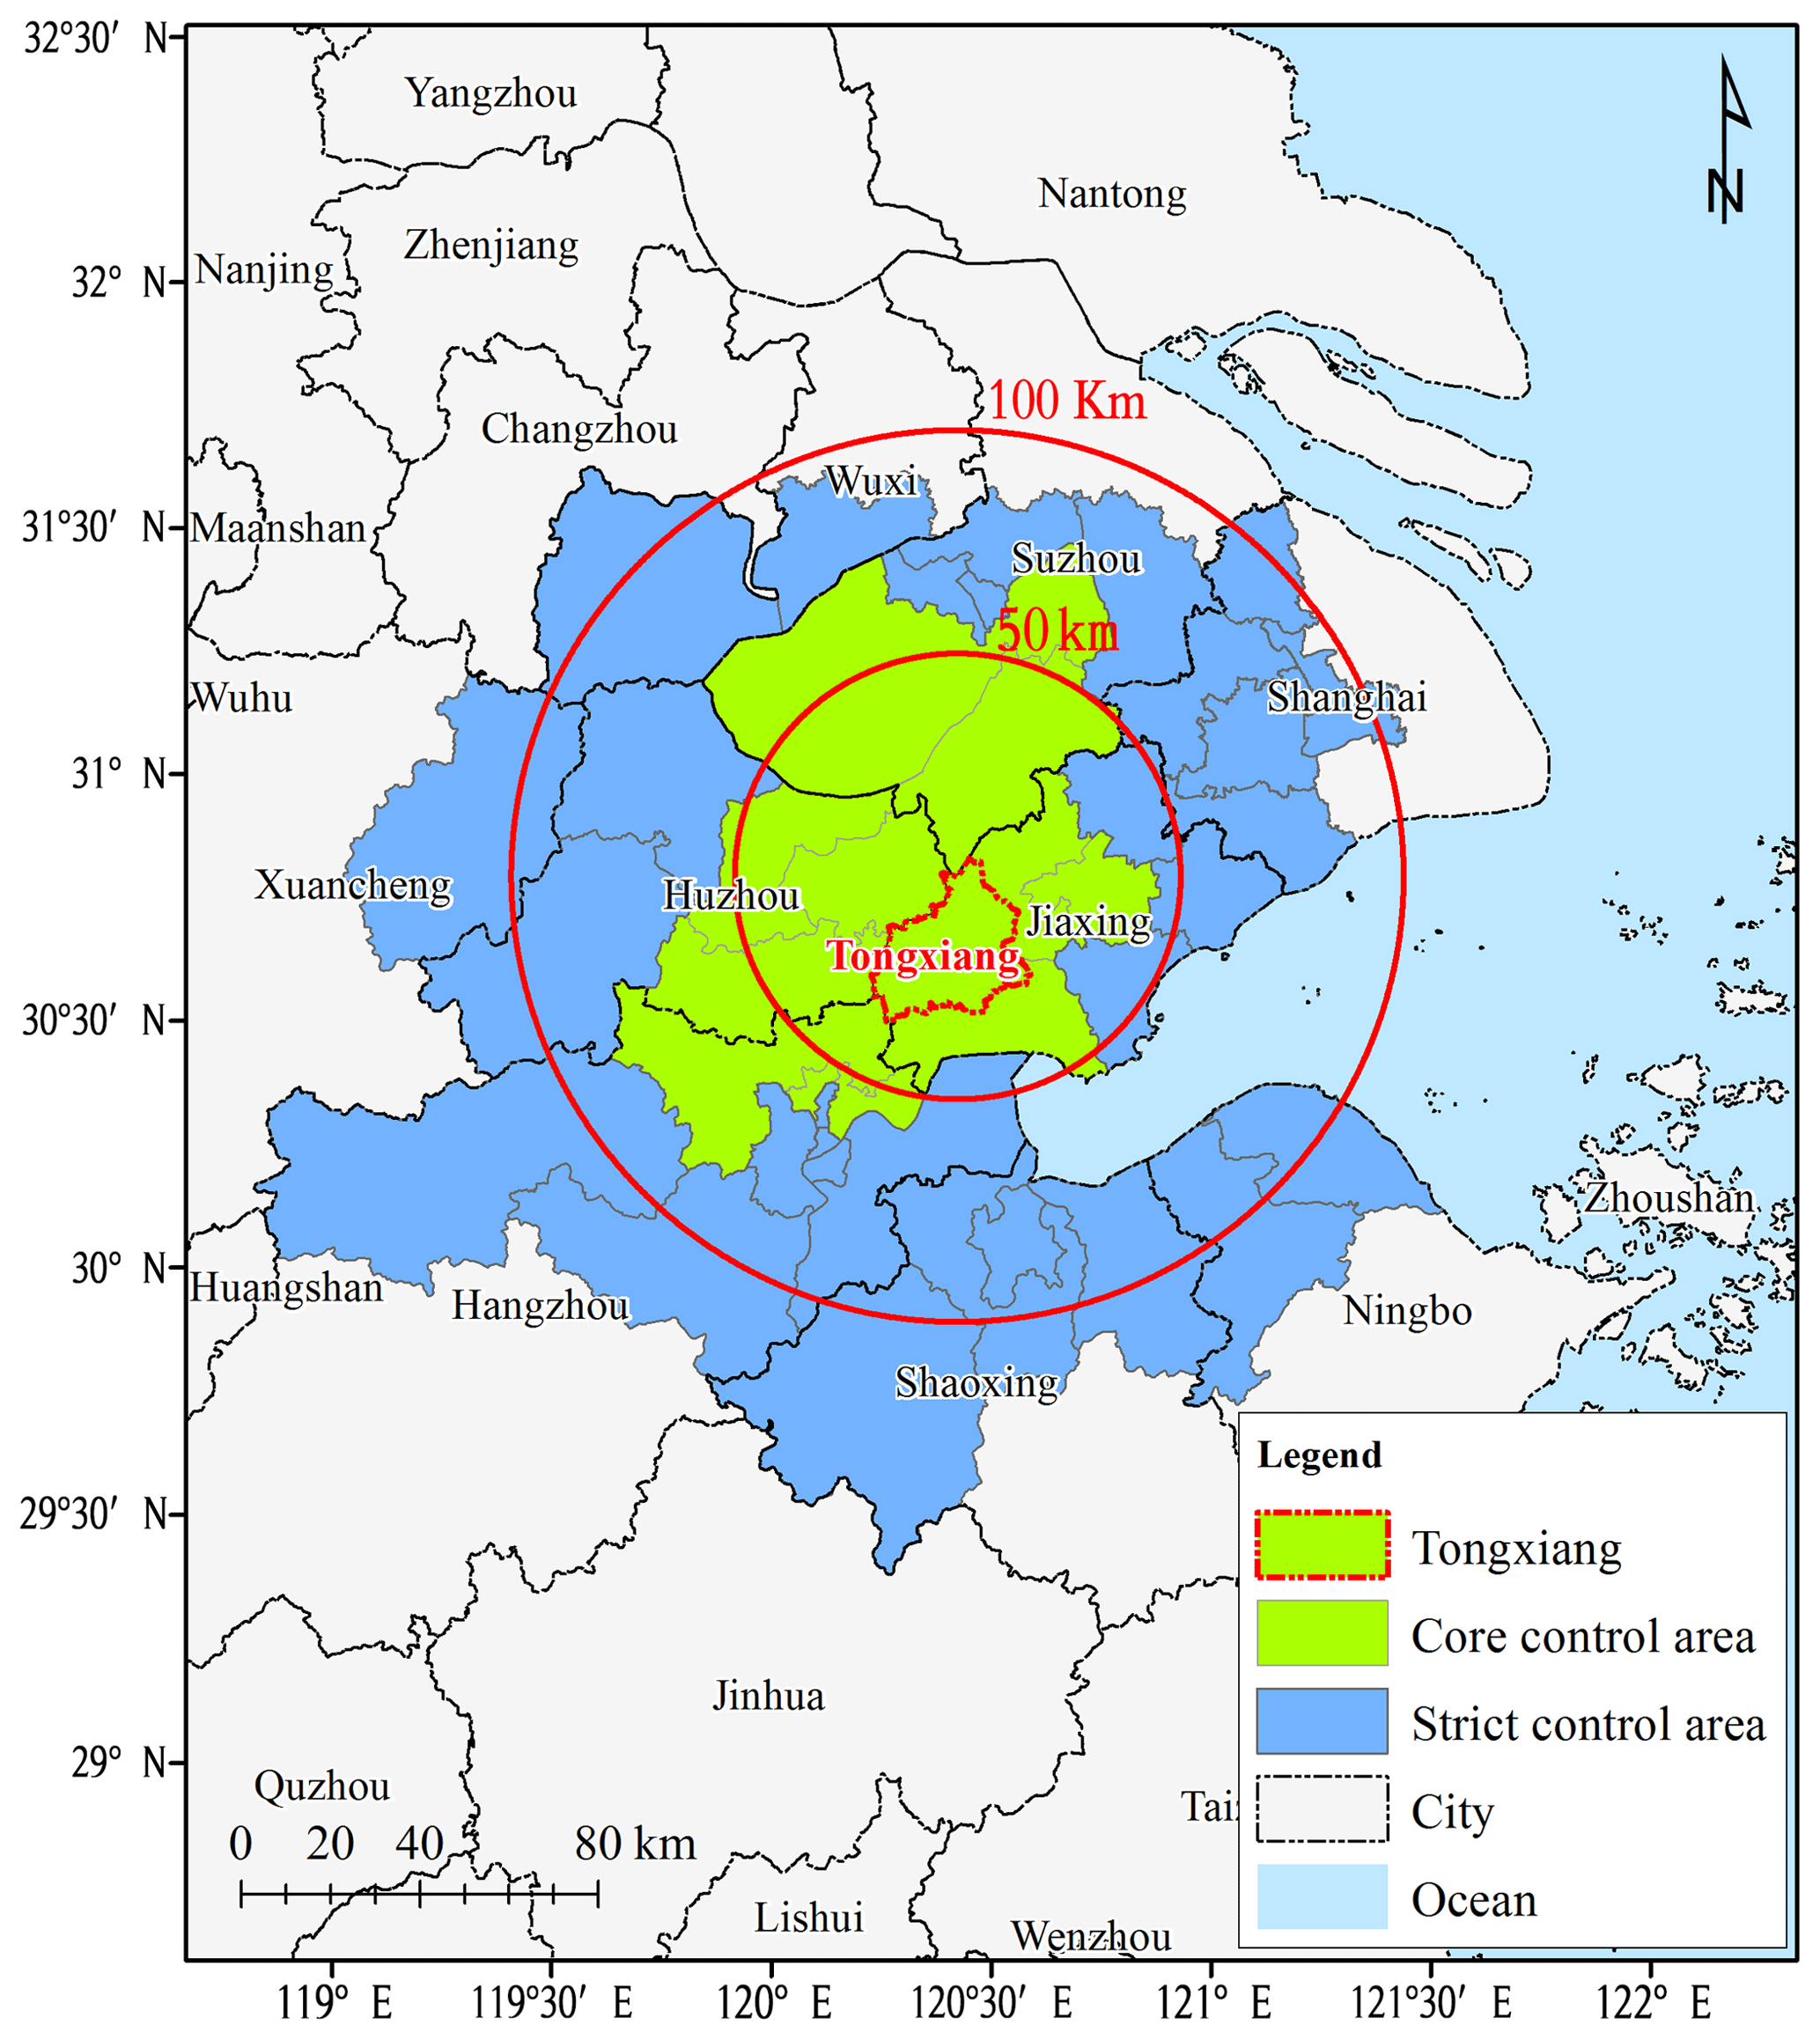
Figure 1Controlled regions in the Action Plan for Air Quality Control during the World Internet Conference.
Many studies have provided descriptive analysis of changing concentrations of air pollutants during mega events; some have reported the emission reductions and related air quality changes (Y. Wang et al., 2009, 2010, 2016, 2015; Liu et al., 2013; Tang et al., 2015; Li et al., 2016; Sun et al., 2016; P. L. Chen et al., 2017; Han et al., 2016; Xu et al., 2017). However, different air pollution control targets, different control measures, and different locations may cause significantly different effects among those strategies. In this paper, the reduction in PM2.5 achieved through the Action Plan is investigated further to help quantify the level of PM2.5 reduction that can be attributed to different aspects of the Action Plan. An integrated emission-measurement-modeling method described in the next section including analysis of multi-pollutant observations, backward trajectory and potential source contribution analyses, estimates of pollutant emission reductions, and photochemical model simulations is adopted to conduct a comprehensive assessment of the impact of control measures on air quality improvement based on three aspects: meteorological conditions, pollutant emission reductions of local sources, and regional contributions.
In order to strengthen the regional air pollution joint-control mechanism in the YRD region, various measures and their implementation were systematically reviewed, and the qualitative and quantitative relationships among the implementation of measures, changes in emissions of air pollution sources, and air quality improvement were studied. Specifically, the impact of measures – such as management and control of coal-burning power plants, production restriction and suspension of industrial enterprises, motor vehicle limitation and work site suspension, and dust control – was investigated. In addition, the role of meteorology (in particular transport) was assessed in terms of its influence on the relevance and effectiveness of various measures, and ways to optimize air quality control measures and emergency emission reductions under heavy pollution during major events were evaluated.
To assess the effectiveness of the various controls outlined in the Action Plan, emission reductions associated with those controls were calculated, and photochemical modeling was conducted to determine the change in PM2.5 attributed to specific controls. On this basis, an assessment of how to optimize control measures was carried out with respect to both the area in which the emission reduction took place and the start time for implementing the controls (i.e., how far in advance do the controls need to be implemented). Analysis of the numerical modeling results is focused on the effectiveness of the control measures with respect to regional transport of pollutants in the YRD region.
2.1 Measurements
An online observational station was set up at the Shanxi supersite of Zhejiang province (30.82∘ N, 120.87∘ E), which is located at the core area for pollution-control measures. Online hourly PM2.5 mass concentration, carbonaceous aerosols, elements, and ionic species were measured by the Synchronized Hybrid Ambient Real-time Particulate monitor (SHARP, model 5030, Thermo Fisher Scientific Corporation, USA), the OC∕EC carbon aerosol analyzer (model-4, Sunset Laboratory Corporation, USA), the Xact multi-metal monitor (XactTM 625, PALL Corporation, USA), and the ambient ion monitor ion chromatograph (AIM IC, model URG 9000, URG Corporation, USA), respectively. Meteorological parameters, including wind speed, wind direction, temperature, pressure, and relative humidity, were measured as well.
PM2.5 concentration data quality conform to the standards of data quality control published by the Ministry of Ecology and Environment of the People's Republic of China.
A semicontinuous Sunset OC/EC analyzer was used to measure organic carbon (OC) and elemental carbon (EC) mass loadings at the observation site by adopting the NIOSH-5040 protocol based on thermal–optical transmittance (TOT). The ambient air was first sampled into a PM2.5 cyclone inlet with a flow rate of 8 L min−1. The OC and EC were collected on a quartz fiber filter with an effective collection area of 1.13 cm2. The analyzer was programmed to collect aerosol for 45 min at the start of each hour, followed by the analysis of carbonaceous species during the remainder of the hour. The analysis procedure is described in detail by Huang et al. (2018).
The ionic concentrations of nitrate, sulfate, chloride, sodium, ammonium, potassium, calcium, and magnesium (Na+, K+, Ca2+, , Mg2+, , , Cl−) in the fine fraction (PM2.5) were measured with a 1 h time resolution using the AIM IC. The sample analysis unit is composed by anion and a cation ion chromatographs (Dionex ICS-1100), which were using guard columns with potassium hydroxide eluent (KOH) for the anion system and methane sulfonic acid (MSA) eluent for the cation system. The limit of detection reported by the manufacturer is 0.1 µg m−3 for all species. The operation principle of AIM IC is described in detail by Markovic et al. (2012).
Hourly ambient mass concentrations of 16 elements (K, Ca, V, Mn, Fe, As, Se, Cd, Au, Pb, Cr, Ni, Cu, Zn, Ag, Ba) in PM2.5 were determined by the Xact multi-metals monitor. In brief, the Xact instrument samples the air through a section of filter tape at a flow rate of 16.7 L min−1 using a PM2.5 sharp cut cyclone. The exposed filter tape spot then advances into an analysis area where the collected PM2.5 is analyzed by energy-dispersive X-ray fluorescence (EDXRF) to determine metal mass concentrations. The sequence of sampling and analysis were performed continuously and simultaneously on an hourly basis.
2.2 Potential source contribution analysis
TrajStat is a HYSPLIT (Hybrid Single Particle Lagrangian Integrated Trajectory) model developed by the Chinese Academy of Meteorological Sciences and NOAA Air Resources Laboratory based on a geographic information system (GIS). It uses statistical methods to analyze air mass back trajectories to cluster trajectories and compute the potential source contribution function (PSCF) with observation data and meteorological data included (Wang et al., 2009).
PSCF analysis is a conditional probability function using air mass trajectories to locate pollution sources. It can be calculated for each 1∘ longitude by 1∘ latitude cell by dividing the number of trajectory endpoints that correspond to samples with factor scores or pollutant concentrations greater than specified values by the number of total endpoints in the cell (Zeng et al., 1989). Therefore, pollution source areas are indicated by high PSCF values. Since the deviation of PSCF results could increase with the increases in distance between cell and receptor, a weight factor (Wij) was adopted in this study to lower the uncertainty in PSCF results. PSCF and Wij calculations are described in Eqs. (1) and (2), where mij is the number of trajectory endpoints greater than specified values in cell (i,j), and nij is the number of total endpoints in this cell (Zeng et al., 1989; Polissar et al., 1999).
In this study, the TrajStat modeling system was used to analyze potential source contribution areas of PM2.5 in Jiaxing during different pollution episodes with the combination of Global Data Assimilation System (GDAS) meteorological data provided by the NCEP (National Centers for Environmental Prediction). Polluted air mass trajectories corresponded to those trajectories with PM2.5 hourly concentration higher than 75 µg m−3.
2.3 Model setup
2.3.1 Model selection and parameter settings
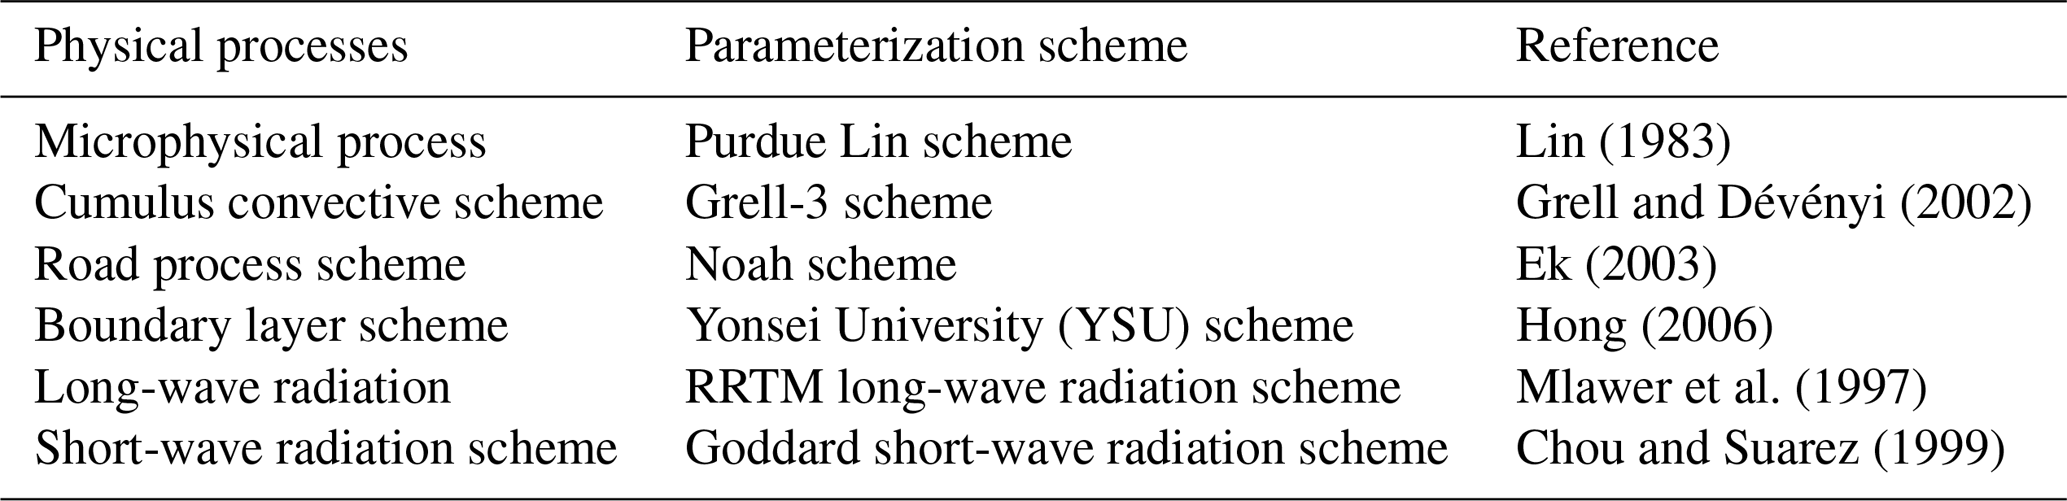
In this study, the WRF-CMAQ/CAMx air quality numerical modeling system was used to evaluate the improvement in air quality resulting from the control measures outlined in the Action Plan. It takes into account modeling variations from different air quality models. For the mesoscale meteorological field, we adopted the WRF model version 3.4 (https://www.mmm.ucar.edu/wrf-model-general, last access: 4 July 2019), the CAMx model version 6.1 (http://www.camx.com/, last access: 4 July 2019), and the CMAQ model version 5.0 (Nolte et al., 2015; http://www.cmascenter.org/cmaq/, last access: 4 July 2019). The chemical mechanisms utilized in CMAQ were the CB05 gas-phase chemical mechanism (Yarwood et al., 2005) and AERO5 aerosol mechanism, which includes the inorganic aerosol thermodynamic model ISORROPIA (Nenes et al., 1998) and updated secondary organic aerosol (SOA) yield parameterizations. The gaseous and aerosol modules used in CAMx are the CB05 chemical mechanism and a static two-mode coarse/fine (CF) scheme, respectively. The aqueous-phase chemistry for both models is based on the updated mechanism of the Regional Acid Deposition Model (RADM; Chang et al., 1987). Particulate source apportionment technology (PSAT) coupled in the CAMx is applied to quantify the regional contributions to PM2.5 as well. The WRF meteorological modeling domain consists of three nested Lambert projection grids of 36 km, 12 km, and 4 km, with three grids larger than the CMAQ/CAMx modeling domain at each boundary. WRF was run simultaneously for the three nested domains with two-way feedback between the parent and the nested grids. All the three domains utilized 27 vertical sigma layers with the top layer at 100 hPa and the major physics options for each domain listed in Table 1. For the CMAQ/CAMx modeling domain shown in Fig. 2, we adopted a 36 km, 12 km, and 4 km nested domain structure with 14 vertical layers, which were derived from the WRF 27 layers. The two outer domains cover much of eastern Asia and eastern China, while the innermost domain covers the YRD region. The simulation period was from 1 to 18 December 2015, during which 1–7 December was utilized for model spin-up and 8–18 December was the key period for analysis of the modeling results with control measures.
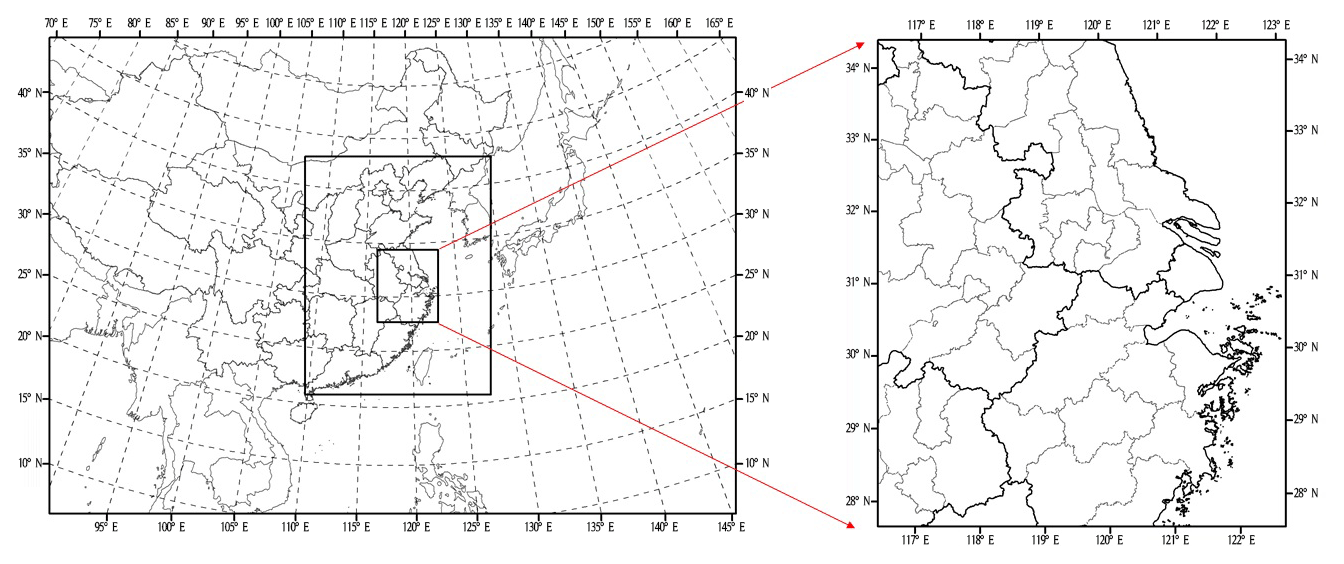
Figure 2Modeling domain. RRTM is a rapid and accurate radiative transfer model.
Table 1Parameterization scheme of the physical processes in the WRF model.
Initial and boundary conditions (ICs/BCs) for the WRF modeling were based on 1∘ by 1∘ grids FNL (Final) Operational Global Analysis data that are archived at the Global Data Assimilation System (GDAS). Boundary conditions to WRF were updated at 6 h intervals for D01.
Anthropogenic source emission inventory in YRD is based on the most recent inventory developed by our group (Huang et al., 2011; Li et al., 2011; Liu et al., 2018). The emission inventory for areas outside of the YRD in China is derived from the MEIC model (Multi-resolution Emission Inventory of China, latest data for 2012; http://www.meicmodel.org, last access: 4 July 2019) and anthropogenic emissions over other Asian regions are from the MIX emission inventory for 2010 (Li et al., 2017). Biogenic emissions are calculated by the MEGAN v2.1 (Guenther et al., 2012). We further developed a controlled emission inventory to account for the control measures based on the emission reduction requirements described in the control measures plan and the control measures for the emergency air pollution warning. These estimates are basically according to the control measures and reduction requirements for specific source sectors and cities described in the control plan. The Sparse Matrix Operator Kernel Emissions (SMOKE, https://www.cmascenter.org/smoke, last access: 4 July 2019) model is applied to process these emissions for modeling inputs that are more detailed emission processes and not usually used in China.
2.3.2 Model performance
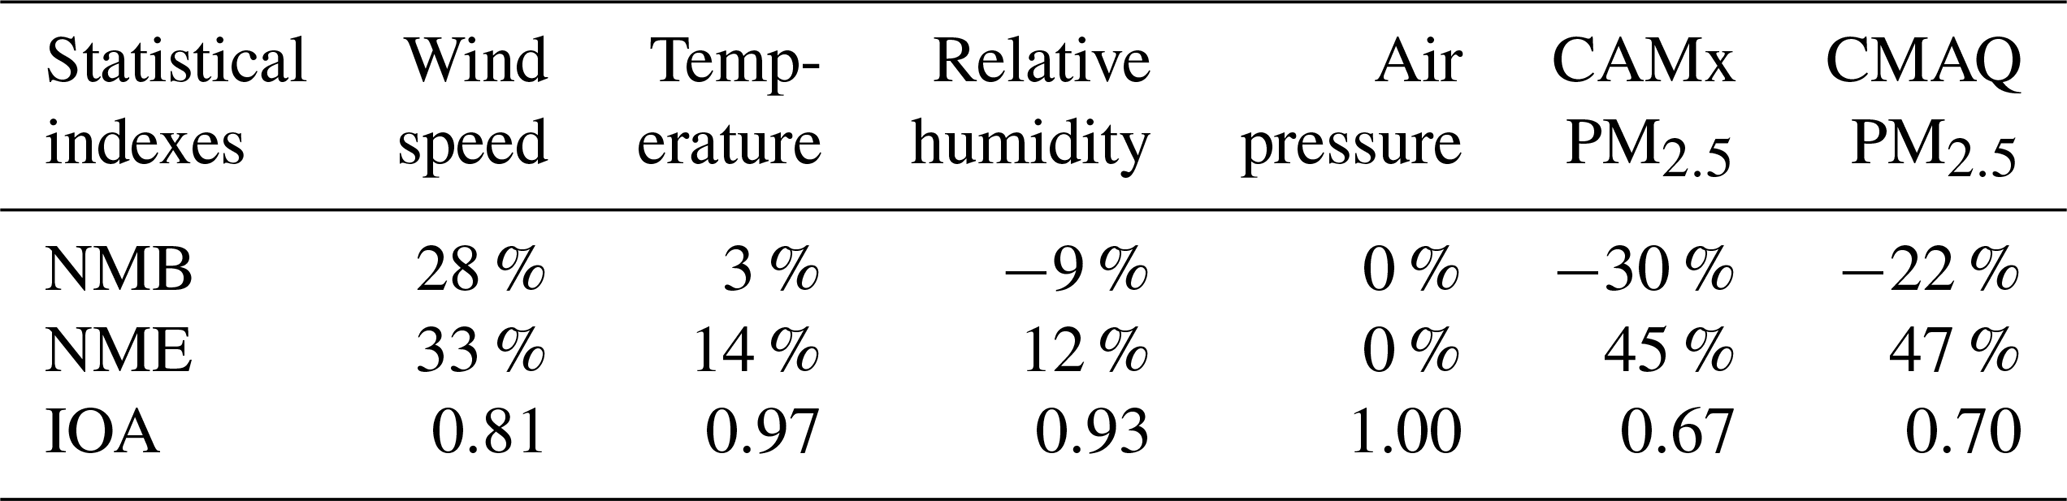
Prior to evaluating the effectiveness of the control measures and reactions, the performance of the modeling system was evaluated to ensure it was able to reasonably reproduce the observed meteorological conditions and PM2.5 levels. Statistical indexes used for model evaluation include normalized mean bias (NMB), normalized mean error (NME), and index of agreement (IOA). The equations to calculate these statistical indexes are as follows:
where Pj and Oj are predicted and observed hourly concentrations, respectively. is the average value of observations. IOA ranges from 0 to 1, with 1 indicating perfect agreement between model and observation.
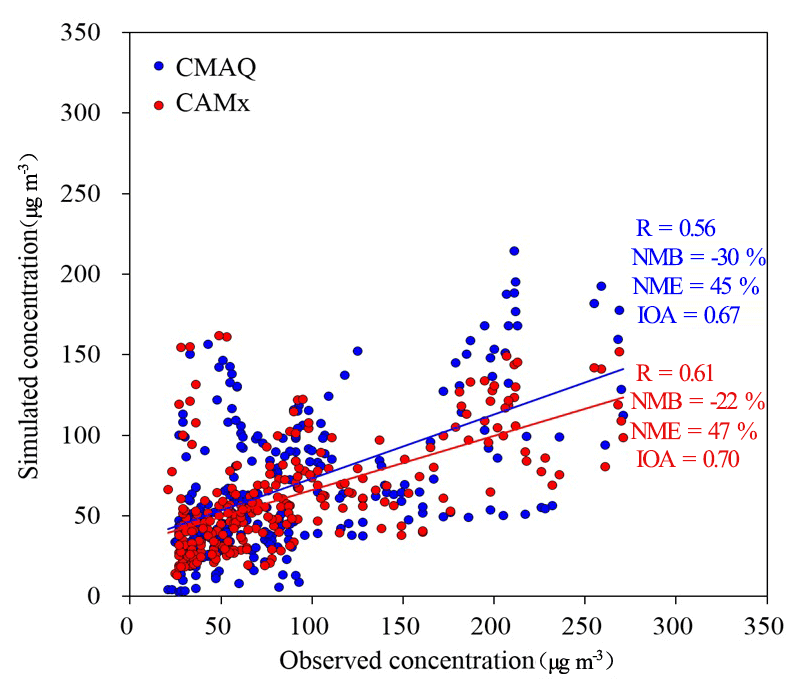
Observational data from the Shanxi supersite in Jiaxing City were compared with model results for model evaluation verification. Table 2 shows the summary statistics for the main meteorological parameters simulated with the WRF model and hourly PM2.5 concentrations simulated by CMAQ. Among the meteorological parameters, wind speed is slightly over predicted with an NMB value of 28 %, while temperature, relative humidity, and pressure all have IOA values greater than 0.9. Figure 3 compares the simulated and observed PM2.5 concentrations at the Shanxi supersite. In general, model-predicted data are lower than the observed data with NMB values of −22 % to −30 %, NME values of 45 % to 47 %, and IOA values of 0.67 to 0.70 (Table 2). These underestimations may be due to three reasons. Firstly, winter underestimation of PM2.5 (especially SOA) is a common issue with CMAQ or CAMx simulations over China (Hu et al., 2017; Li et al., 2016), which can be explained by a lack of model-calculated oxidants or missing reactions (Kasibhatla et al., 1997) of SOA formation pathways (Appel et al., 2008; Foley et al., 2010). Secondly, uncertainty still exists in the regional emission inventory, including the basic emissions inventory and the control scenarios. Thirdly, the wind speed is slightly overestimated over the region, with NMB and NME values of 28 % and 33 %, respectively, causing fast dispersion of air pollutants. Overall, these statistics for both the meteorological parameters and simulated PM2.5 are generally consistent with the results in other published modeling studies (Zheng et al., 2015; Wang et al., 2014; Zhang et al., 2011; Fu et al., 2016; Li et al., 2015a, b), which suggests that the simulation performance is acceptable.
Table 2Statistics of simulation verification for meteorological parameters and hourly PM2.5 concentration.
2.3.3 Method for quantifying the effectiveness of a control
Quantifying the PM2.5 reduction in response to emission reductions was done using the so-called brute force method (BFM; Burr and Zhang, 2011), where a baseline scenario was simulated using unadjusted emissions (i.e., those emissions that would have occurred in the absence of the Action Plan) and a campaign scenario was modeled based on the emission controls outlined in the Action Plan. In both cases, the same meteorology and chemical boundary conditions were utilized to drive the photochemical model simulations. Through a comparative analysis of the scenarios, a relative improvement factor (RF) for a given atmospheric pollutant, resulting from emission controls, can be calculated and combined with ground-based observations to assess the improvement in air quality associated with those emission controls.
where Cb is the simulated pollutant concentration in the baseline scenario (µg m−3), Cs is the pollutant concentration in the campaign scenario (µg m−3), Co denotes the actual observed concentration at the site (µg m−3), and Cd is the concentration improvement caused by the control measures (µg m−3). Utilizing models in a relative sense to assess the efficiency of emission controls on air quality is common practice in regulatory modeling, with the assumption that there may be biases in the absolute concentrations simulated by a modeling system but that the relative response of that system will reflect the response observed in the atmosphere (US EPA, 2014).
3.1 Photochemical transformation changes in air pollutants during the campaign
Ground-based observational data show that from 1 to 23 December, Jiaxing City experienced four distinct physical and chemical processes that contributed to the observed pollution levels at different periods. For each of these processes, this study utilized the integrated emission-measurement-modeling method to analyze the evolution of air quality from several aspects, including the backward air flow trajectory, potential contribution source areas, meteorological conditions, and the variation in PM2.5 concentration.
3.1.1 Pollution process before the campaign with local emission accumulation as the main contributor
The first time period of interest was from 6 to 8 December. Analysis of the potential source contribution areas resulting from PSCF modeling suggests that the polluted air mass primarily originated from the northwest and northerly airstreams, passing Shandong, the eastern coastal areas of Jiangsu and Shanghai, and into northern Zhejiang, as is shown in Fig. 4. Analysis of the large-scale weather patterns showed that the polluted air mass occurred in Beijing, Tianjin, Shandong peninsula, and northern Jiangsu as a result of cold air with polluted air mass transported into the region on the morning of 5 December. In the southern part of Shandong province, the PM2.5 concentration peak appeared on the morning of 6 December, while the PM2.5 concentration peak appeared around midnight on 7 December at the coastal area of Jiangsu. On 6 December, the development of warm and humid air flow resulted in increasing ground humidity, which contributed to the growth of secondary fine particles and the gradual accumulation of polluted air mass in northern Zhejiang and the surrounding areas of Shanghai. On 7 December, affected by the surface high-pressure system, the spread of the plume was slow, and the spatial extent of the plumes in northern Zhejiang expanded. Therefore, during this time period, the pollution was primarily affected by regional transport and worsened by stagnant local conditions in Jiaxing.
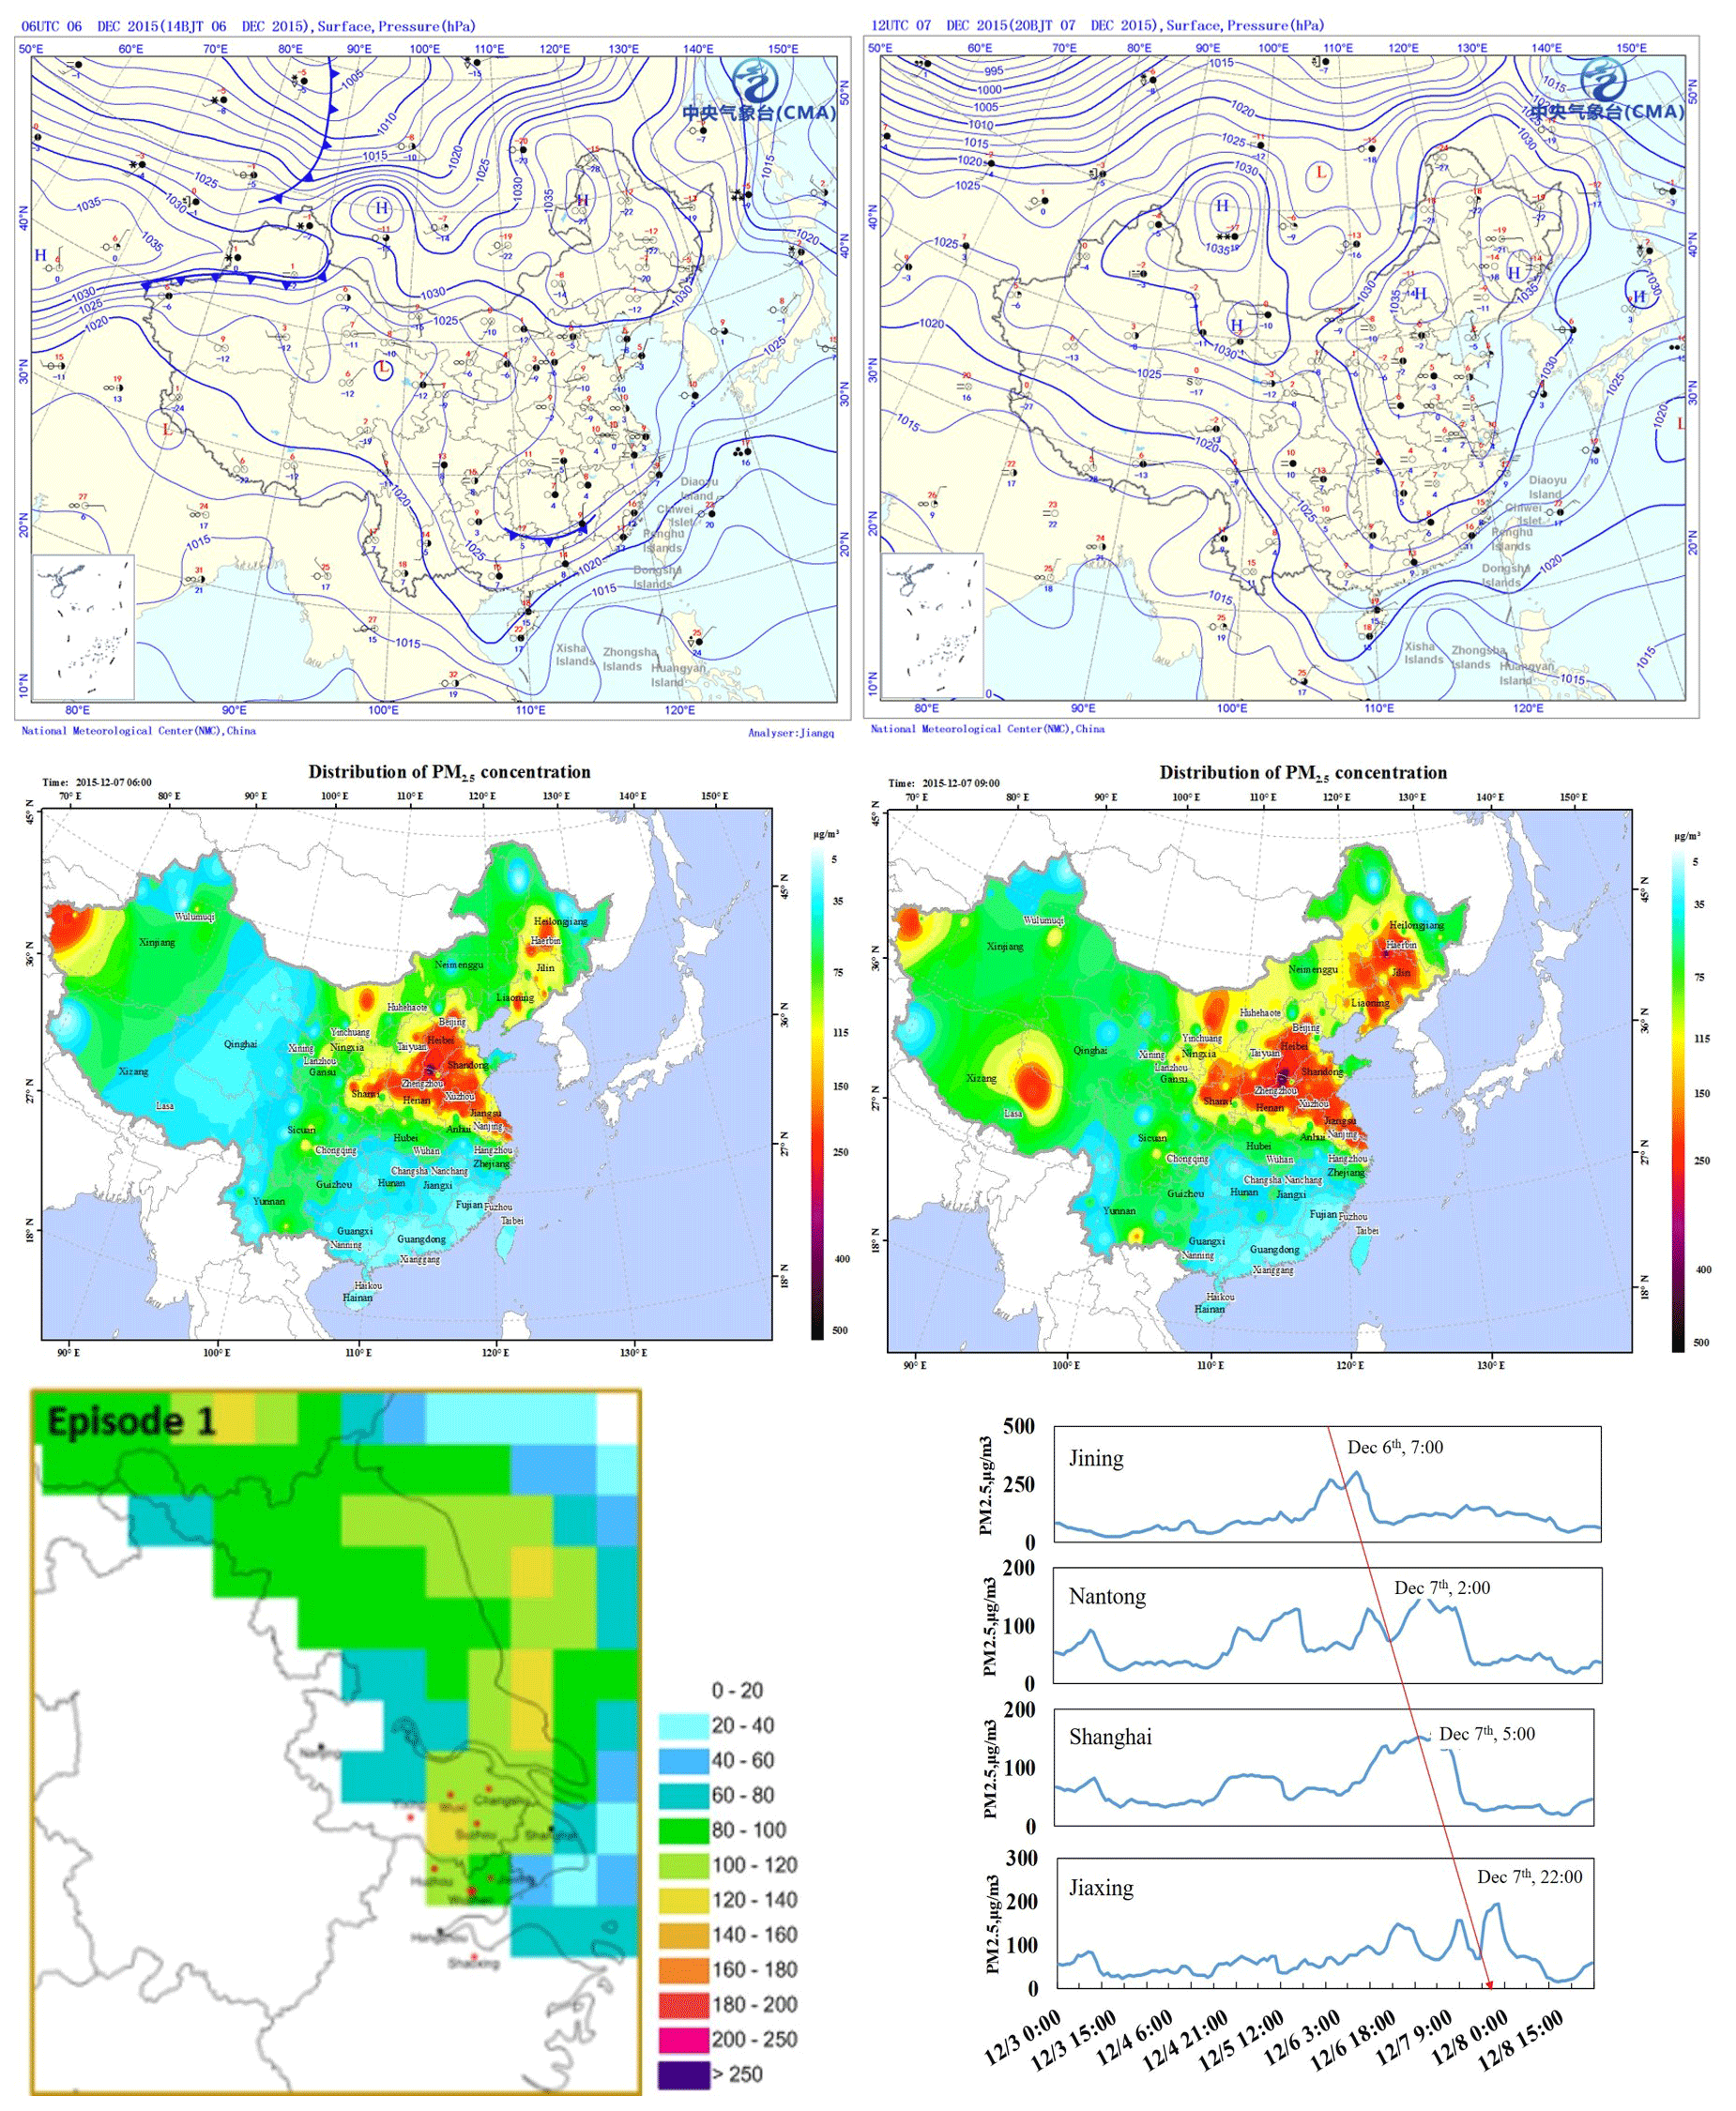
Figure 4Analysis of (a) the large-scale weather patterns, (b) distribution of PM2.5 concentrations, (c) potential source regions, and (d) observed PM2.5 time series for selected sites during 6 to 8 December 2015.
3.1.2 Pollution process during the campaign with the southward motion of the weak cold air
The second time period of interest was from 10 to 11 December. Analysis of potential source contribution areas suggests that the polluted air mass mainly came from northern regions, passing from southeastern Shandong peninsula and central-eastern Jiangsu to northern Zhejiang. From the large-scale weather pattern, the diffusion of weak cold air on 10 December gradually transported the polluted air mass in the upper reaches of the region to the YRD region. The pollution peaked in areas such as Lianyungang in northern Jiangsu on the evening of 10 December. On 11 December, the PM2.5 concentration peak appeared in central and southern Jiangsu as a result of northern weak air flow. The plume was further transported into Zhejiang province with the expansion influencing areas as is shown in Fig. 5. Therefore, the pollution process was mainly affected by the transport of polluted air mass caused by the southward motion of cold air.

Figure 5Analysis of (a) the large-scale weather patterns, (b) distribution of PM2.5 concentrations, (c) potential regional sources, and (d) observed PM2.5 time series for select sites during 10 to 11 December 2015.
3.1.3 Heavy pollution process during the campaign with the transit and transport of strong cold air
The third period of interest was from 13 December to the early hours of 16 December. Analysis of the potential source contribution areas suggests that the polluted air mass mainly came from the northwest direction, passing through southeastern Shanxi, western Shandong, eastern Anhui, and western Jiangsu to Zhejiang province. On 14 December, affected by the cold air transport in the north, northern plumes hit Hebei, Henan, and Anhui provinces, with the highest degree of pollution on the 14 December. On 15 December, the further spread of cold air caused the transport of plumes into Jiangsu and Zhejiang. The northern part of Zhejiang province was in the center of pollution on the 15 December, which worsened the pollution and expanded the scope of pollution, as is shown in Fig. 6. On 16 December, under the control of the high-pressure system in northern Zhejiang, the air mass gradually moved eastward and the air quality improved in the morning. Therefore, for this time period, large-scale transport was the main factor leading to the increase in pollutant levels.
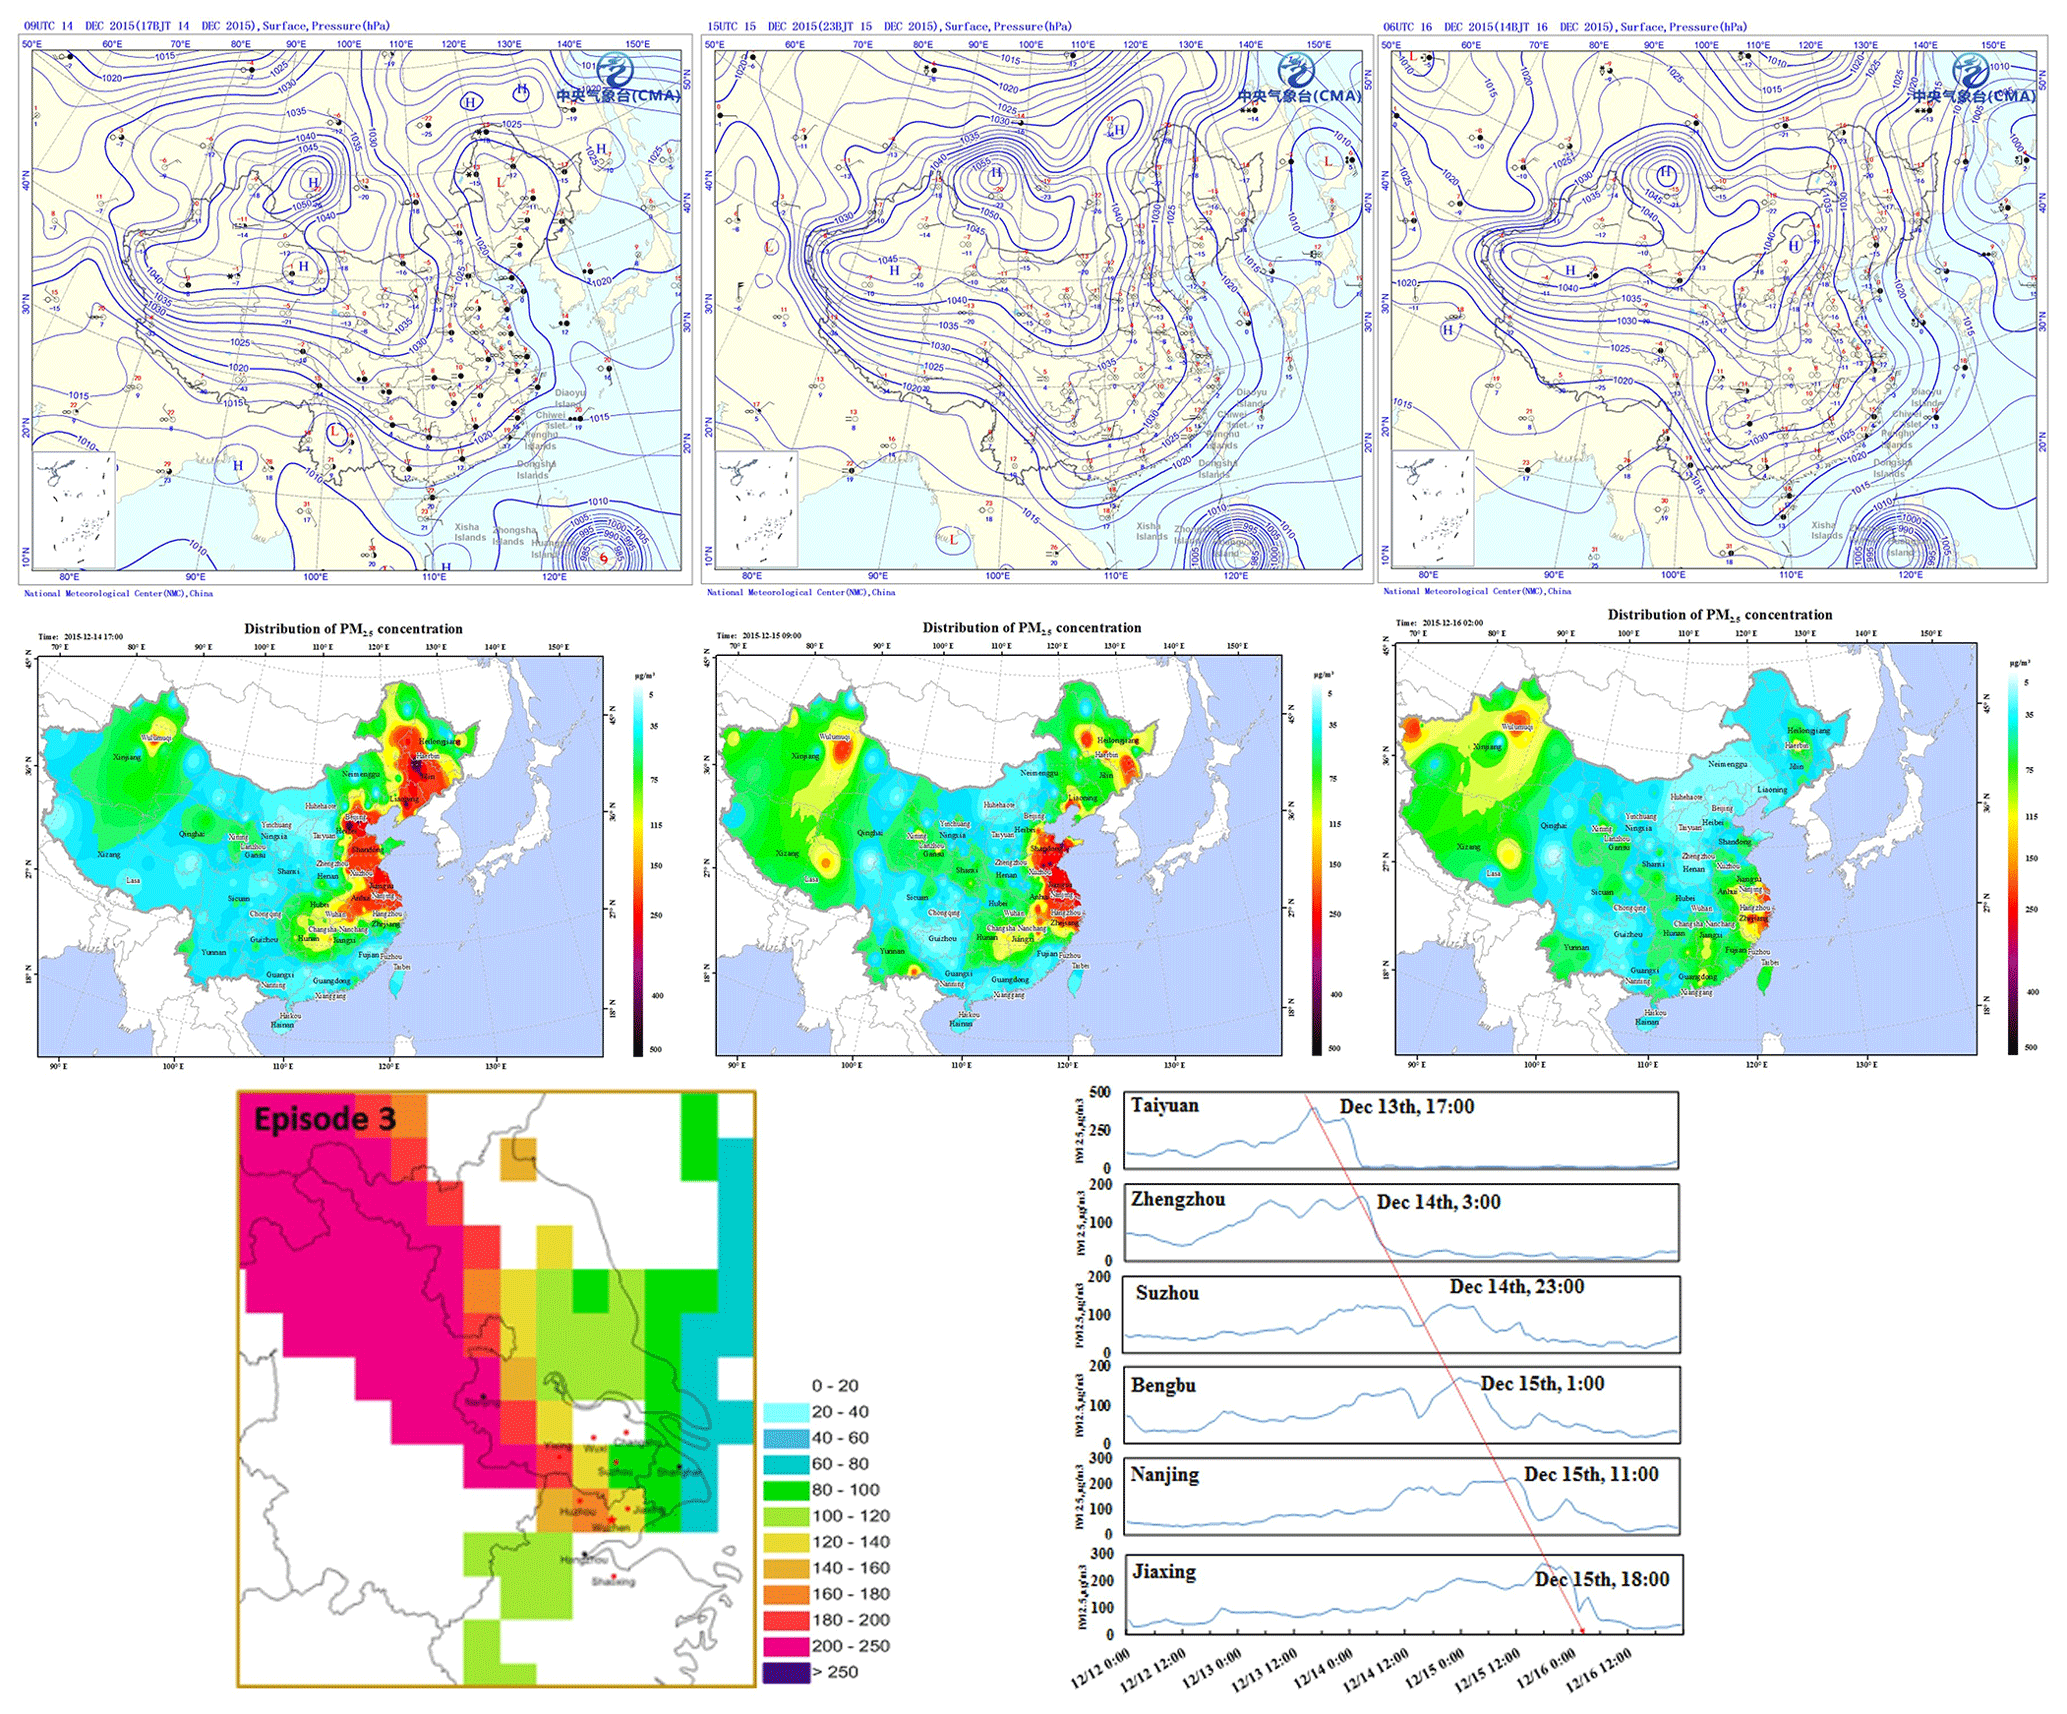
Figure 6Analysis of (a) the large-scale weather patterns, (b) distribution of PM2.5 concentrations, (c) potential regional sources, and (d) observed PM2.5 time series for select sites during 14 to 16 December 2015.
3.1.4 Pollution removal process caused by clean cold air during the conference
During the conference from 16 to 18 December, weather was affected by the large-scale southward transport of cold dry air in northern Zhejiang, resulting in lower temperature and relative humidity, as well as a significant improvement in the air quality. On the 17 December and the 18 December, under the control of a high-pressure system in northern Zhejiang, the sea level pressure increased, the humidity was lower, and the wind speed was reduced. Because of the emission reduction effect of the control measures, the pollutant accumulation rate was likely slowed down and the air quality in northern Zhejiang was good overall. From the analysis of potential sources, PM2.5 concentrations in Shandong, Jiangsu, and Shanghai were significantly reduced. The PM2.5 concentration during the conference was mainly controlled by local emissions, as is shown in Fig. 7.
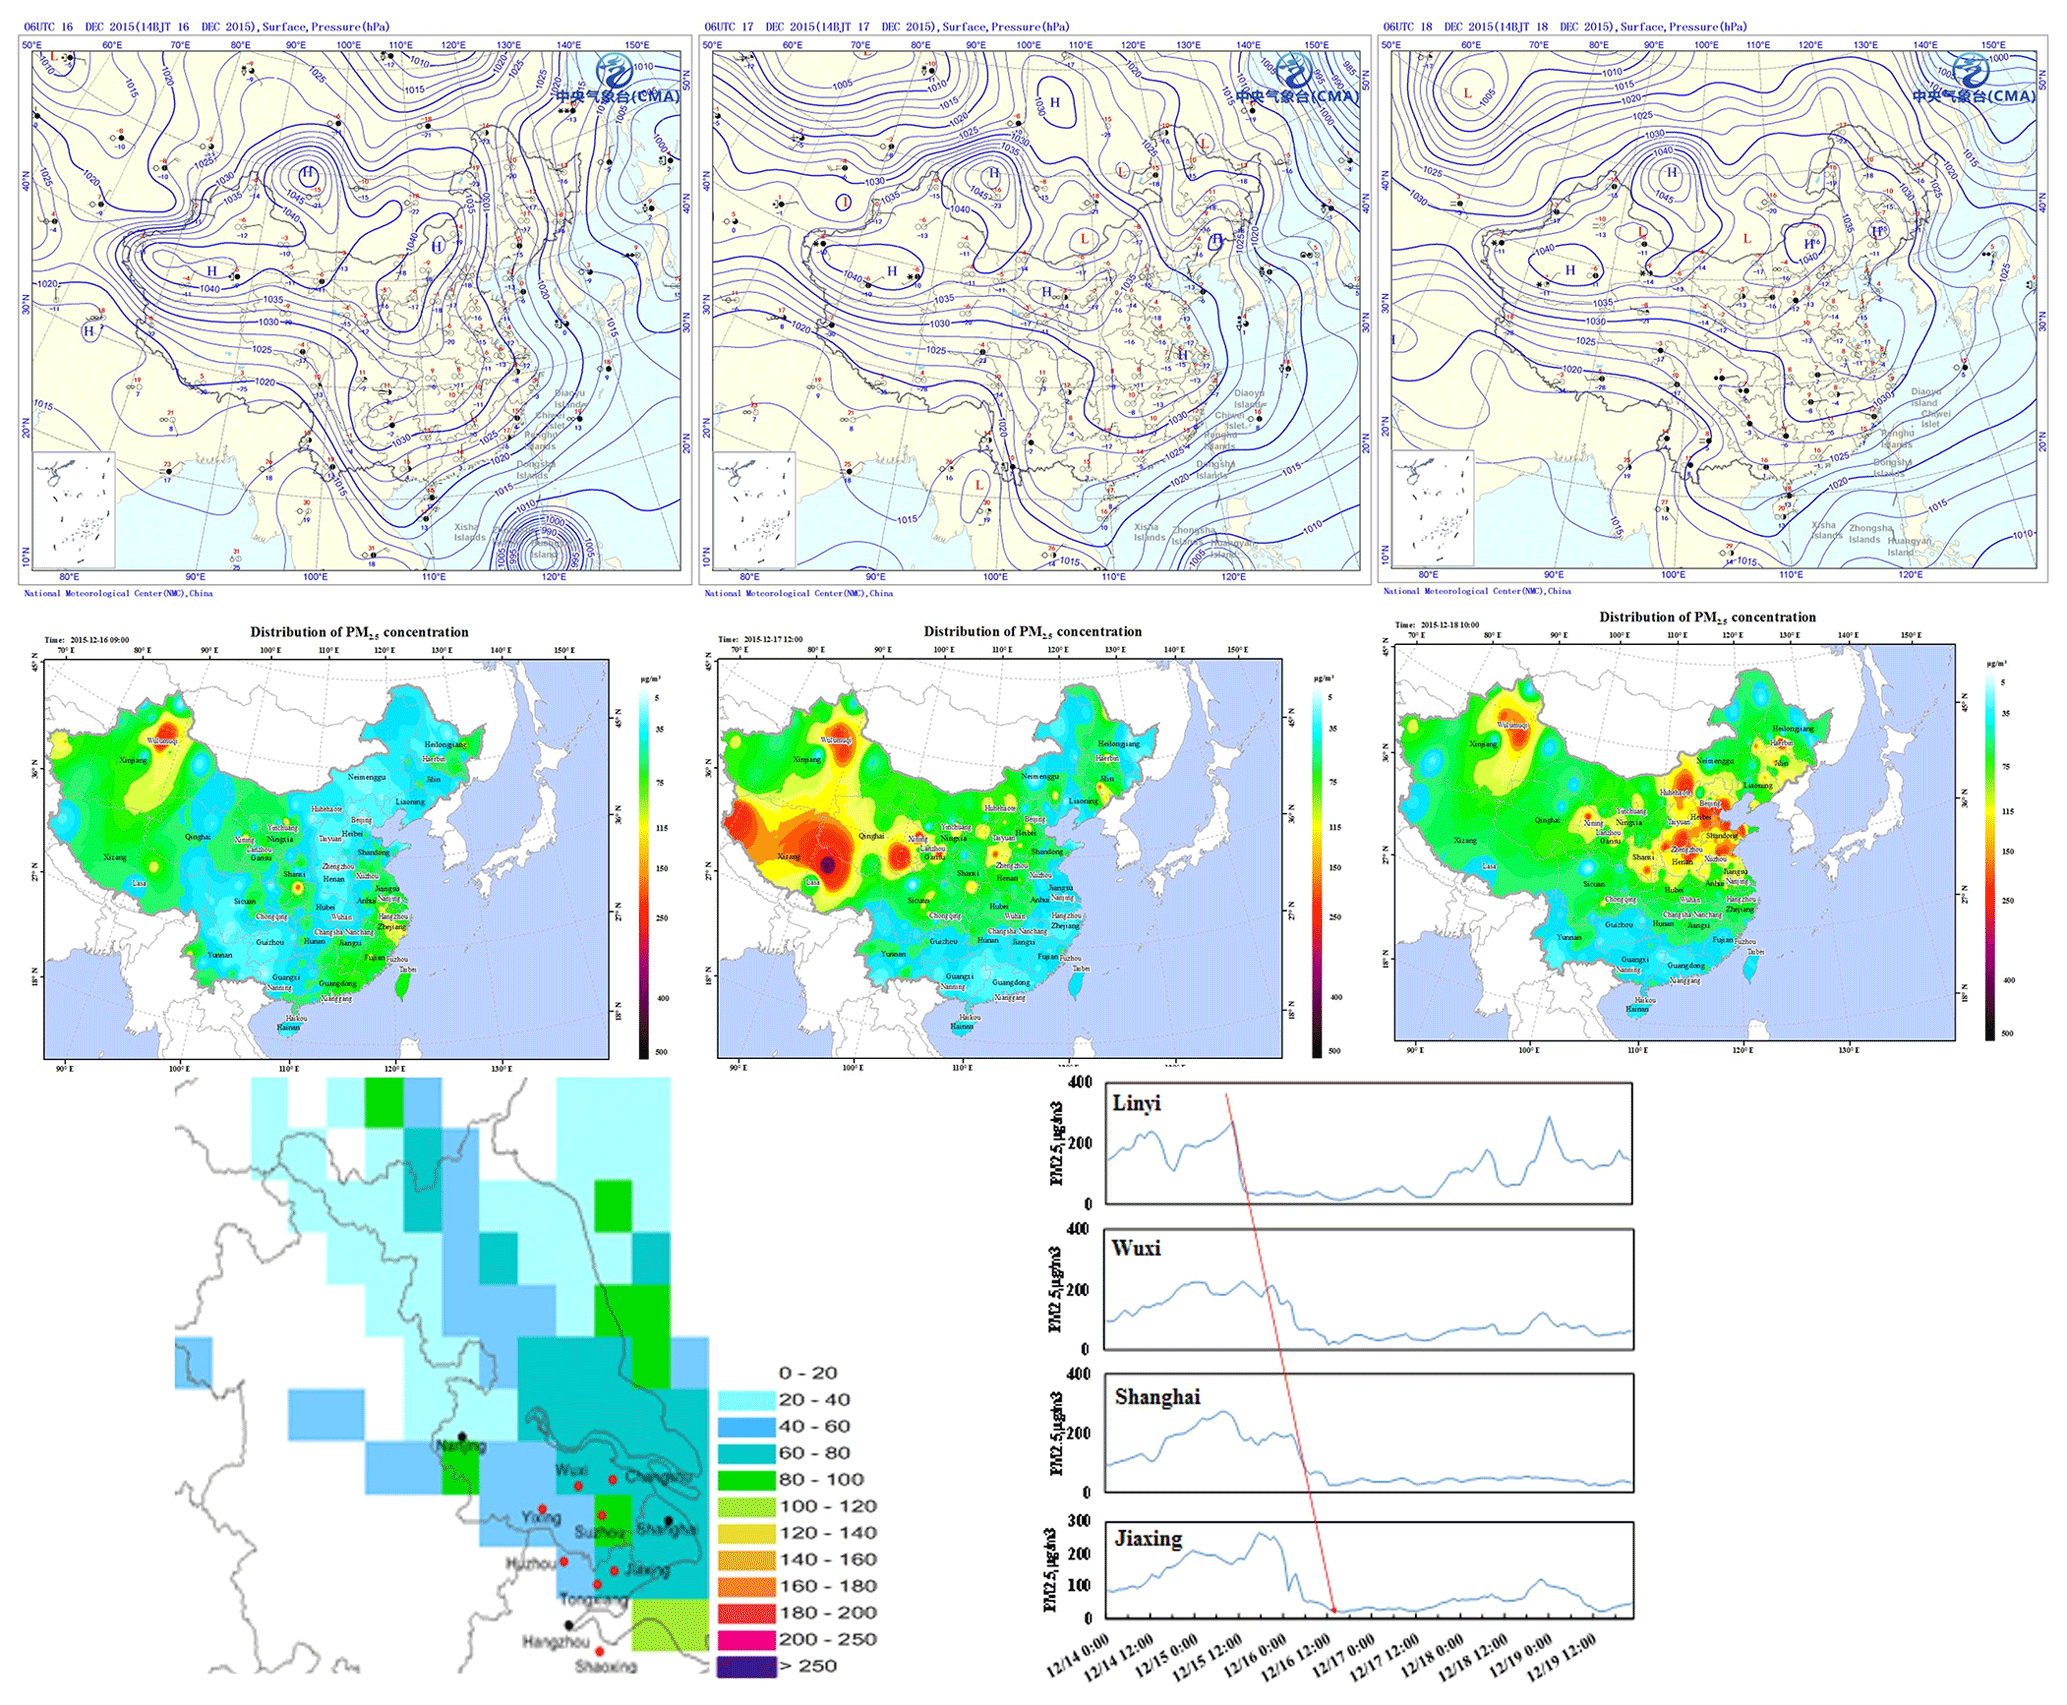
Figure 7Analysis of (a) the large-scale weather patterns, (b) distribution of PM2.5 concentrations, (c) potential regional sources, and (d) observed PM2.5 time series for select sites during 16 to 18 December 2015.
3.1.5 Pollution process after the campaign with local emission accumulation as the main contributor
The fourth period of interest was from 20 to 23 December. Analysis of the potential source contribution areas suggests that the polluted air mass mainly came from the southwest direction, passing through southern Hubei, southern Anhui, and southwestern Jiangsu to northern Zhejiang. On 20 December, controlled by a stagnant air mass, Zhejiang province had a relatively low near-surface wind speed and little dispersion, resulting in the accumulation of local pollutants. On 21 December, northern Zhejiang was located in the center of a high-pressure system with conditions conducive to little mixing, and therefore polluted air mass occurred in some areas in northern Zhejiang. On 22 December, affected by the warm and humid southwestern air flow, Zhejiang experienced some precipitation but the pollution in northern Zhejiang was not improved due to deep polluted air masses. In Hubei and Anhui, located to the southwest of Jiaxing City, high pollution levels appeared from the evening of 22 December to the early hours of 23 December, as is shown in Fig. 8. On 23 December, the further expansion of polluted air masses resulted in serious pollution in Jiangsu and northern Zhejiang. In general, under these heavily polluted conditions, the local accumulation of pollutants was mainly caused by stagnant conditions with little dispersion and transport within the southwestern air stream.
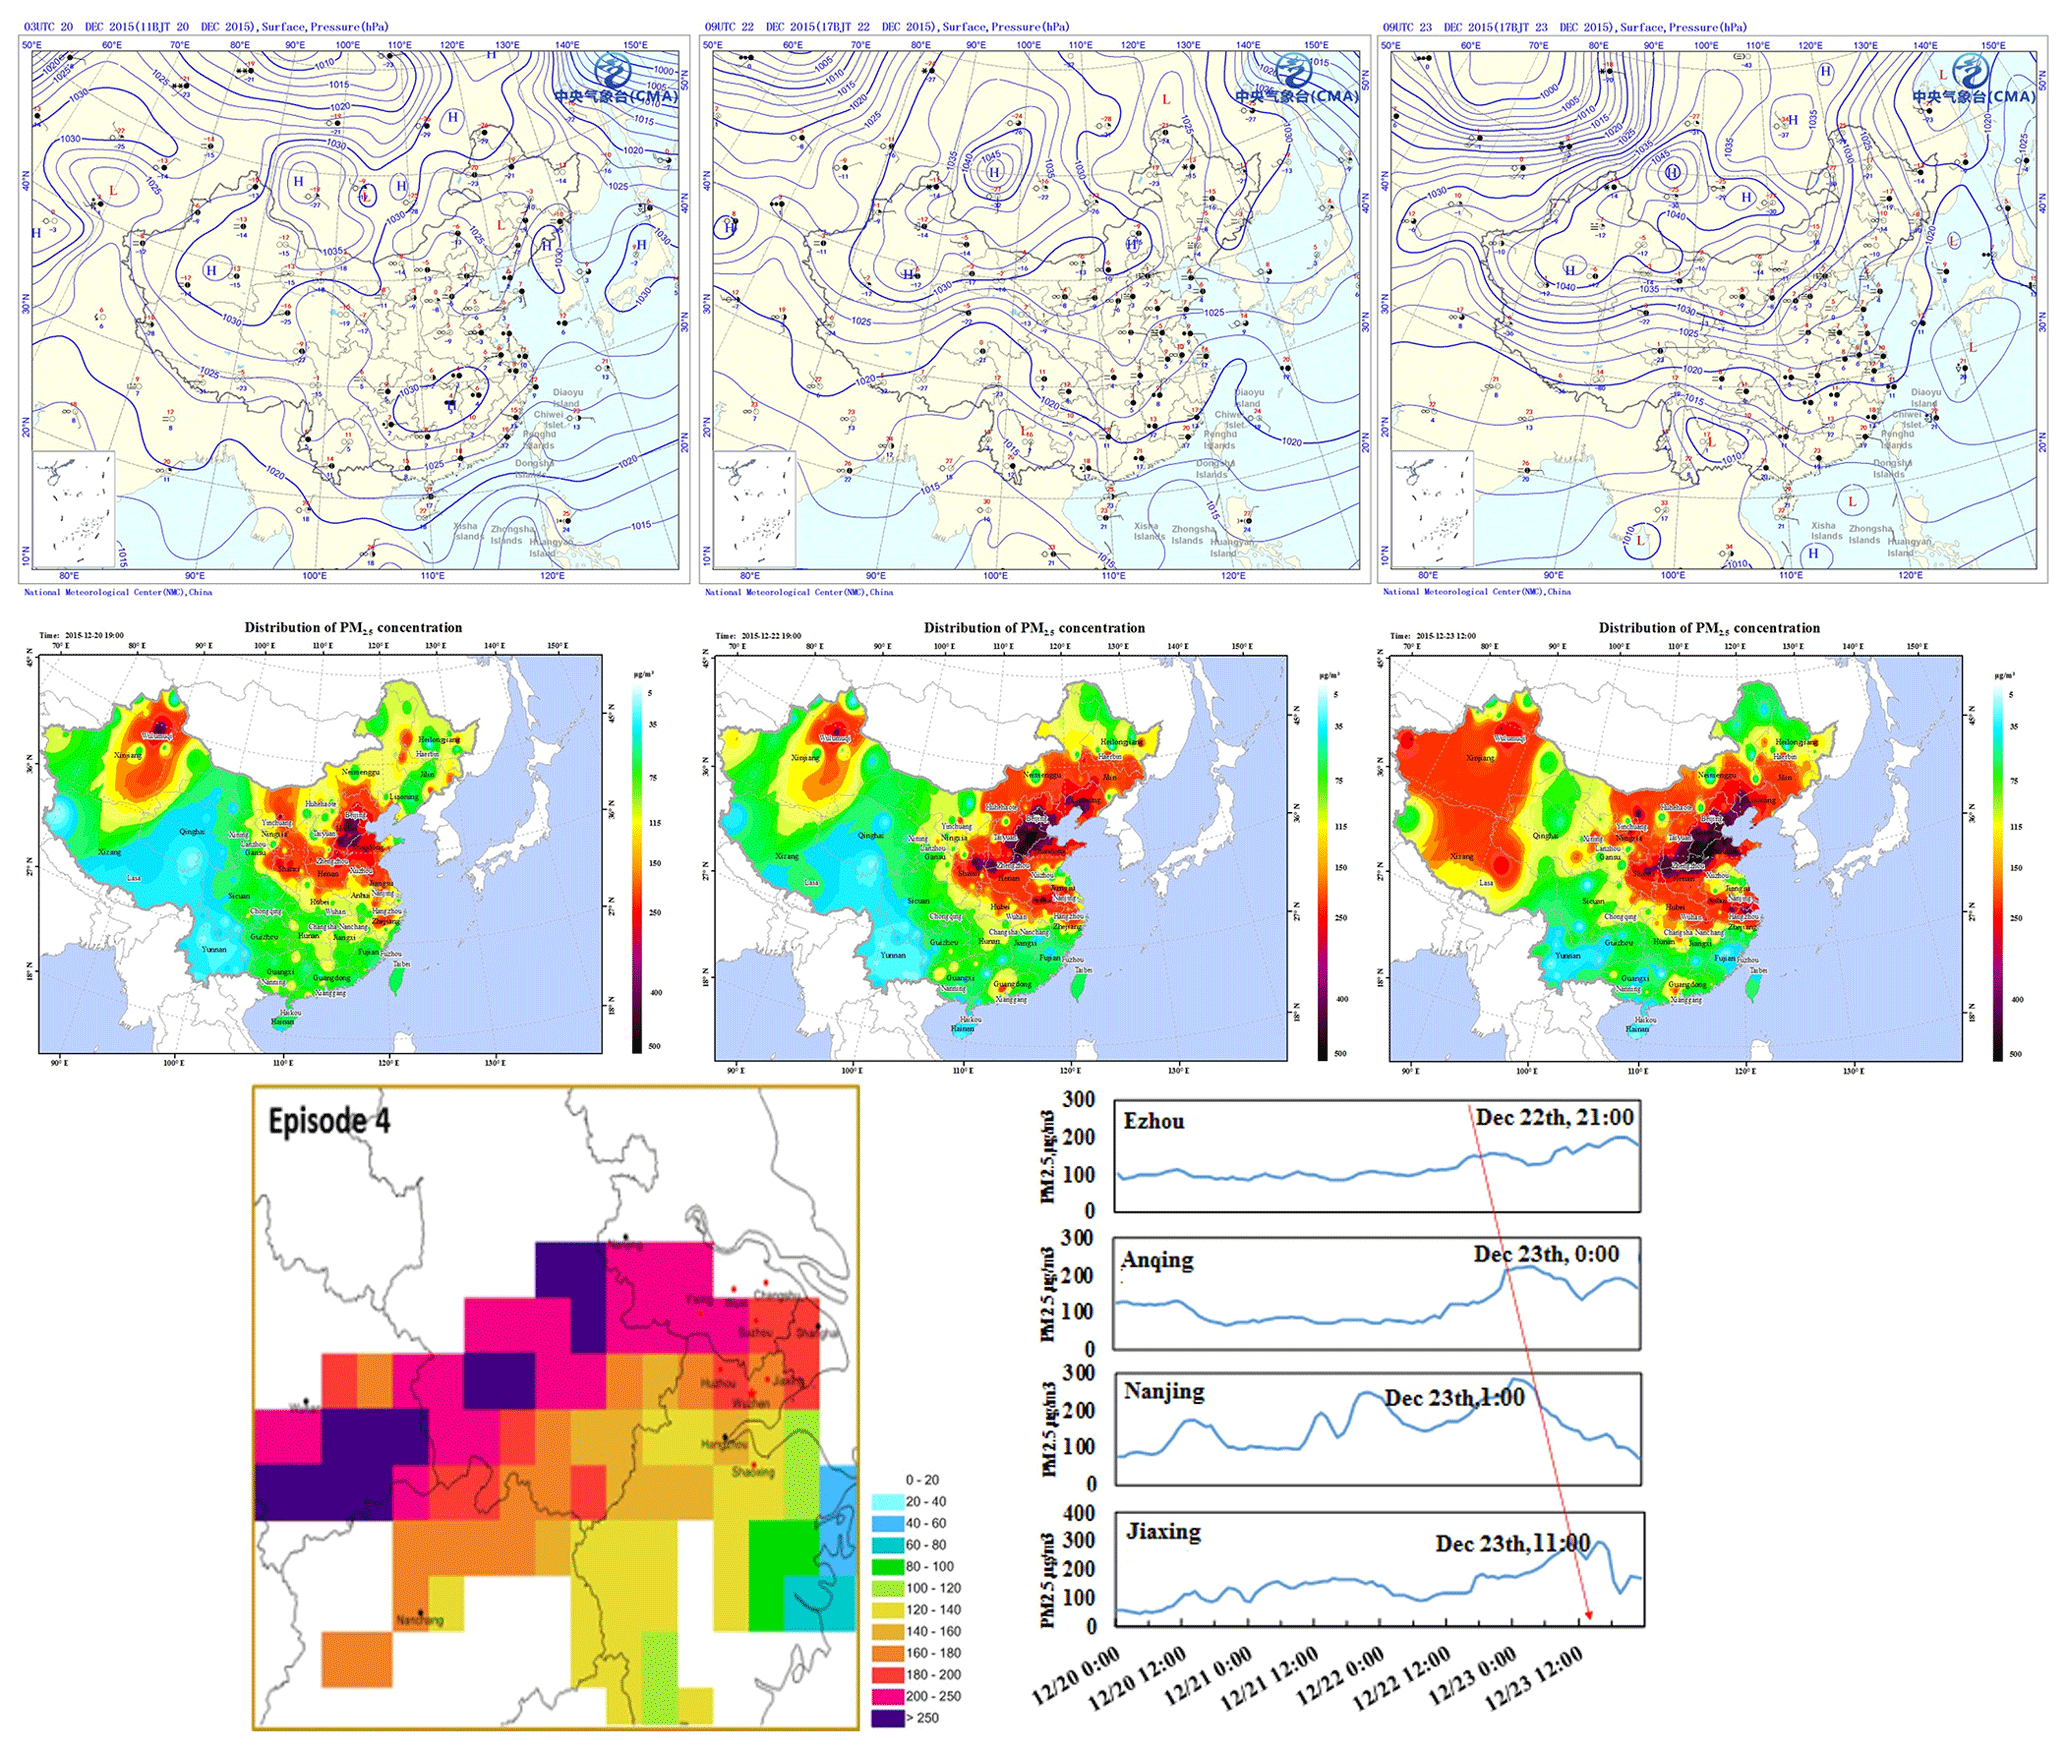
Figure 8Analysis of (a) the large-scale weather patterns, (b) distribution of PM2.5 concentrations, (c) potential regional sources, and (d) observed PM2.5 time series for select sites during 20 to 23 December.
3.2 Air quality changes under the same meteorological conditions before and after the campaign
3.2.1 Air quality changes under static meteorological conditions before and during the campaign
During the air pollution control campaign for the conference, air quality in Jiaxing City fluctuated greatly due to the frequent southward motion of cold air from the north. Under static weather conditions, sources of atmospheric pollution mainly came from the accumulation of polluted air masses from local sources and sources in neighboring areas. Therefore, in order to eliminate the influence of the transport process of the air mass, this study compared the air quality status before, during, and after the campaign in Jiaxing City under stagnant weather conditions (wind speed less than 1 m s−1) and assessed the impact of control measures on ambient air quality in Jiaxing based on air quality observation data.
Figure 9 shows the concentration levels of certain pollutants including SO2, NO, CO, NO2, and PM2.5 in Jiaxing City before (1–7 December), during (8–19 December), and after the regulation (19–31 December) under stagnant weather conditions. It can be seen that pollutant concentrations during the campaign were less than those before the campaign in which SO2 had the most significant decline of 40.1 % and NOx, CO, PM2.5, and PM10 declined by 8.0 %, 2.6 %, 12.5 %, and 16.3 %, respectively, indicating that control measures significantly improved the air quality in Jiaxing City, especially with respect to SO2 and PM10.
After the campaign, all the pollutant concentrations rebounded sharply. SO2, NO, NO2, CO, PM2.5, and PM10 increased 8.3 %, 15.4 %, 10.3 %, 31.8 %, 32.2 %, and 28.6 %, respectively. Concentrations of some pollutants were even higher than those before the campaign, which suggests that the emission intensity of the sources had significantly increased after the campaign.

Figure 9Comparison between air pollutant concentrations at Shanxi station before, during, and after the campaign under stagnant meteorological conditions.
There are also some differences in concentrations of major chemical components of PM2.5 in Jiaxing City before (1–7 December), during (8–19 December), and after the campaign (19–31 December) under static weather conditions, as shown in Fig. 9. The concentrations of major chemical components of PM2.5 during the campaign were less than those before the campaign, which is consistent with the conclusion that changes in certain pollutant concentrations. On average, , , , OC, mineral soluble irons (Ca2+ and Mg2+), and K+ declined by 11.8 %, 5.1 %, 32.1 %, 9.8 %, 56.8 %, and 5.1 %, respectively. Comparisons between the distribution of PM2.5 chemical components before and during the campaign under static conditions suggest that Ca2+ and Mg2+ decreased most significantly during the control period, which indicates that the suspension of construction operations – which results in dust emissions and the rising frequency of rinsing and cleaning paved roads – significantly reduced dust emissions. During the campaign, significantly decreased, indicating that vehicle control measures successfully reduced NOx emissions and subsequently the formation of inorganic aerosols. The significant decrease in also shows that restricting or suspending the operation of coal-burning power plants and industries in local and neighboring cities played a very positive role.
Both the chemical compositions of PM2.5 and chemical processes associated with PM2.5 production change if we compare observed data during and after the regulation. As is shown in Fig. 10, the SO2 concentrations after control are a little bit higher than during control (+5.9 %). However, the after control is much higher than during control (25.8 %). This is probably due to two reasons: firstly, SO2 emissions and primary sulfate emissions increased after the control measures were terminated; secondly, previous studies have reported that increased NOx emissions could accelerate the formation of secondary sulfate (Cheng et al., 2016). This can be clearly seen from the sulfate oxidizing rate (SOR). A different trend is observed for NO2 and , with the NO2 concentrations after control being much higher than during control (+9.4 %), while the increase in (+9.45 %) is about the same. Sulfate originates from both primary emissions and secondary formation, but nitrate is mostly secondary. The nitrate oxidizing rate (NOR) during and after regulation is about the same and most of the nitrate is in the gas phase as indicated by the ratio (0.87). Therefore, the increase in is smaller than . The PM2.5 concentration after control sharply rebounded by 31.8 %, indicating that both primary emissions and secondary formation are activated.
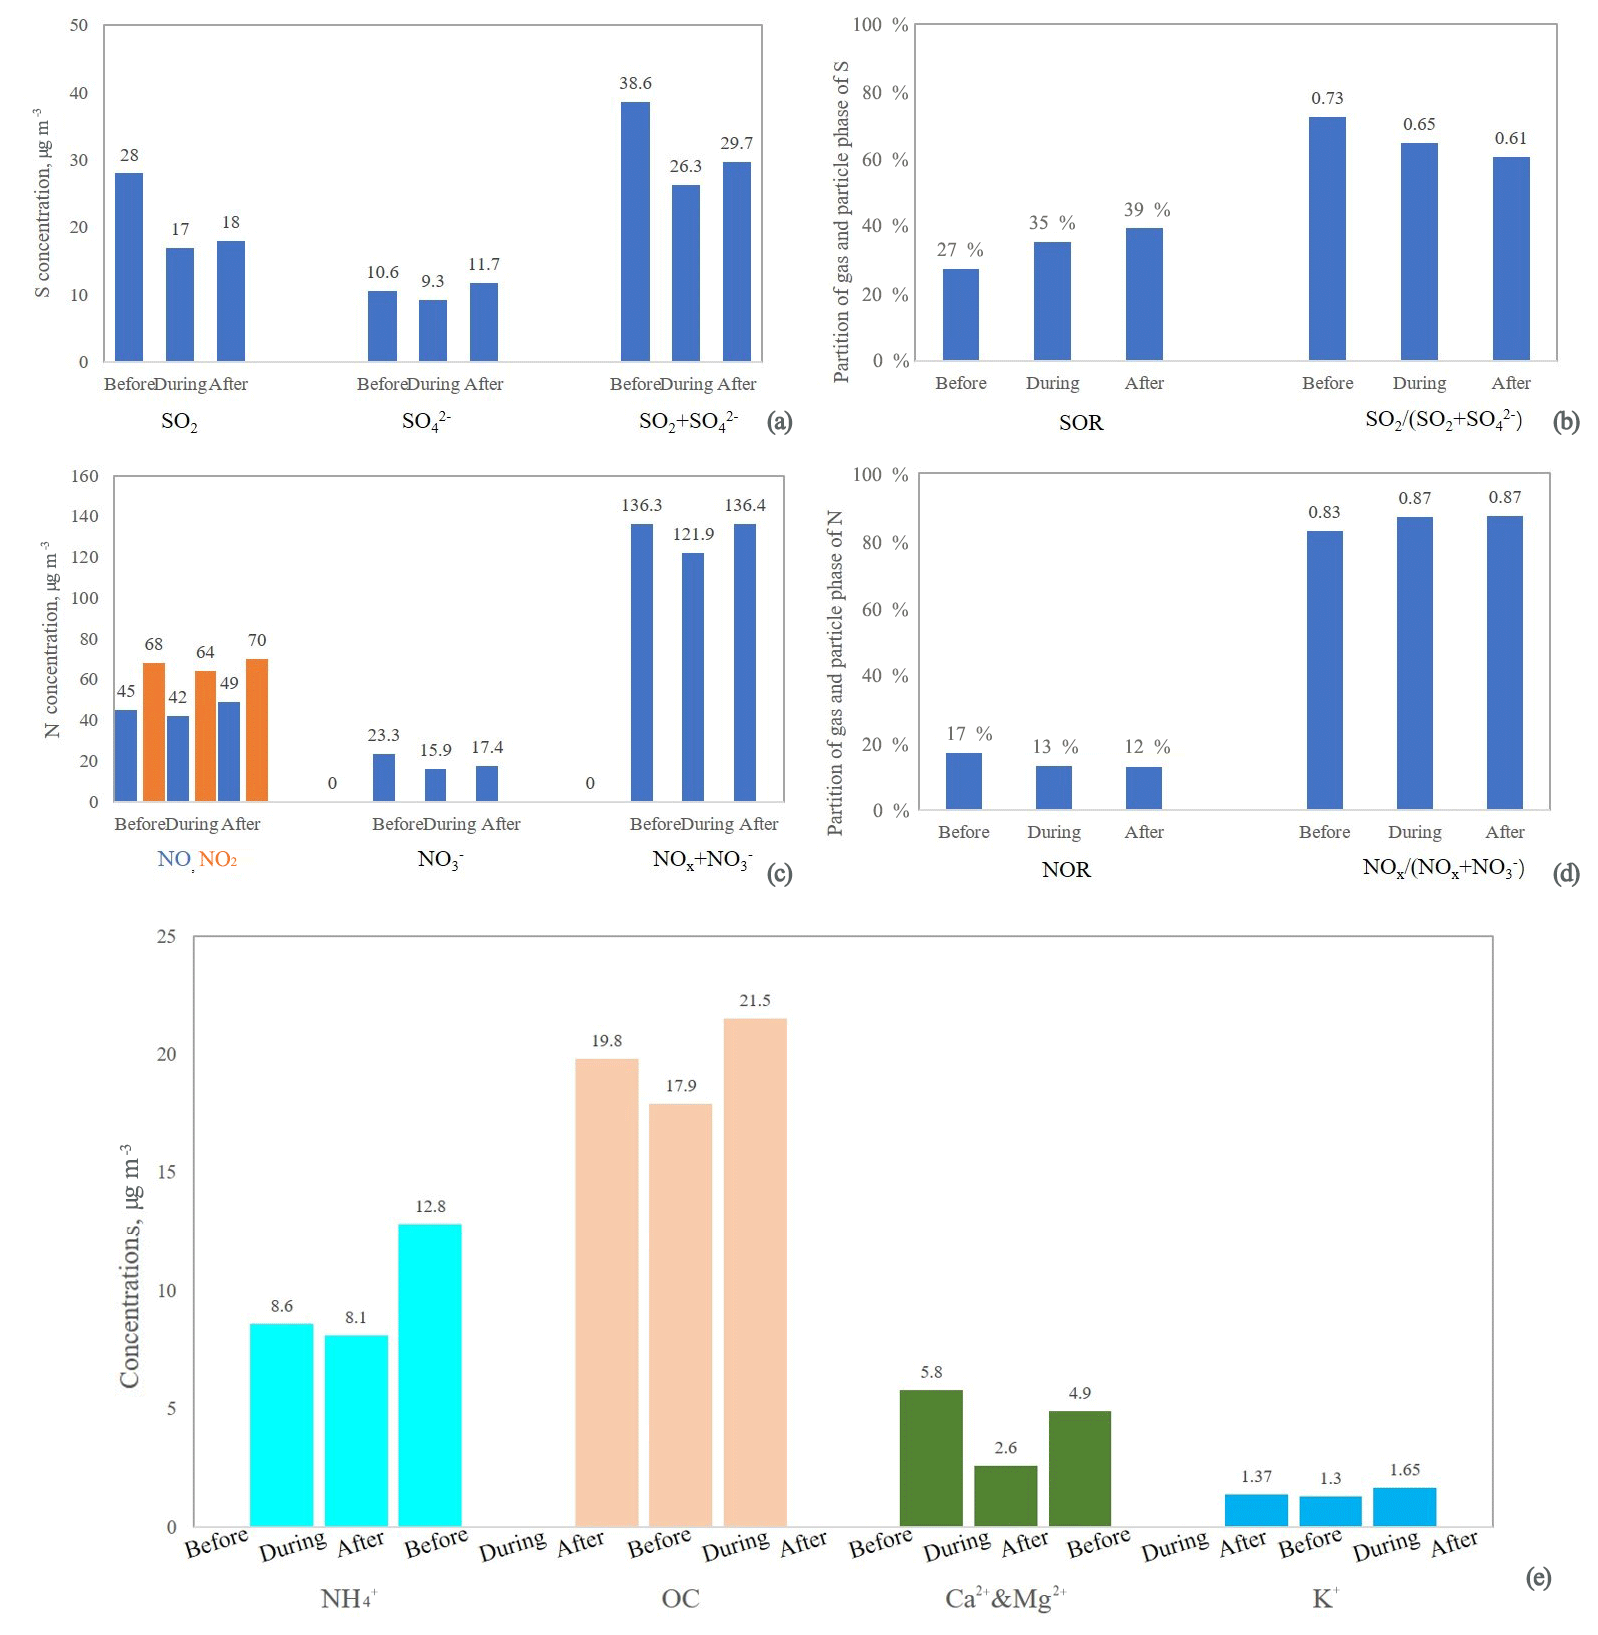
Figure 10Comparison between PM2.5 chemical components at Shanxi station before and after the campaign under static meteorological conditions.
3.2.2 Air quality changes under the same air mass trajectory before and during the campaign
In order to distinguish the impact of meteorological conditions on air quality in Jiaxing City and better analyze the effects of control measures on air quality during the conference, this study has combined meteorological conditions with backward air flow trajectory analysis and carried out a comparative study by selecting a relatively similar pollution period before and during the campaign. The first period occurred before the campaign from 2 December 12:00 UTC+8 to 4 December 20:00 UTC+8 (all times in this paper are in UTC+8), while the second period occurred during the campaign from 16 December 09:00 to 18 December 05:00. Both of these periods were relatively unaffected by long-range transport of plumes into the study area and have similar backward airflow trajectories and meteorological conditions. Table 3 and Fig. 11 compare average mass concentrations of pollutants (SO2, NOx, PM2.5, and PM10) during these two periods. As can be seen from the figure, SO2, PM2.5, and PM10 decreased during the campaign by roughly 46 %, 13 %, and 27 %, respectively, while NOx exhibited only a small decrease. This shows that without the impact of long-range transport, emission reduction measures carried out by local and surrounding cities play a significant role in defining the air quality in Jiaxing.
Table 3Concentrations of major pollutants under similar meteorological conditions before and during the campaign.
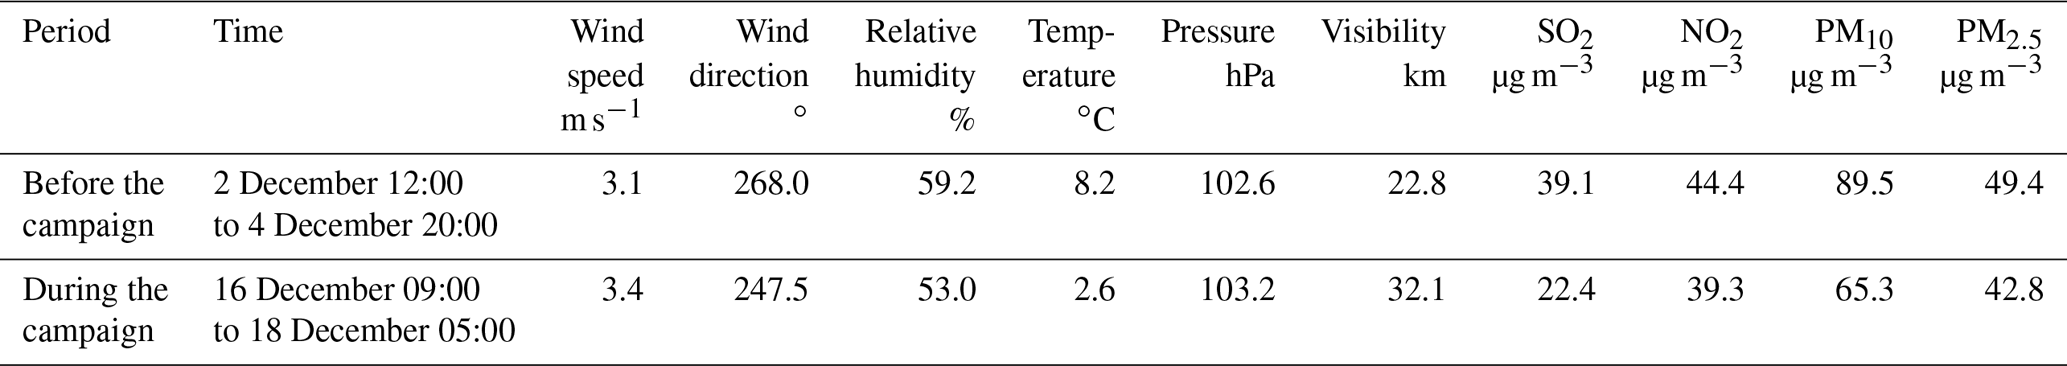
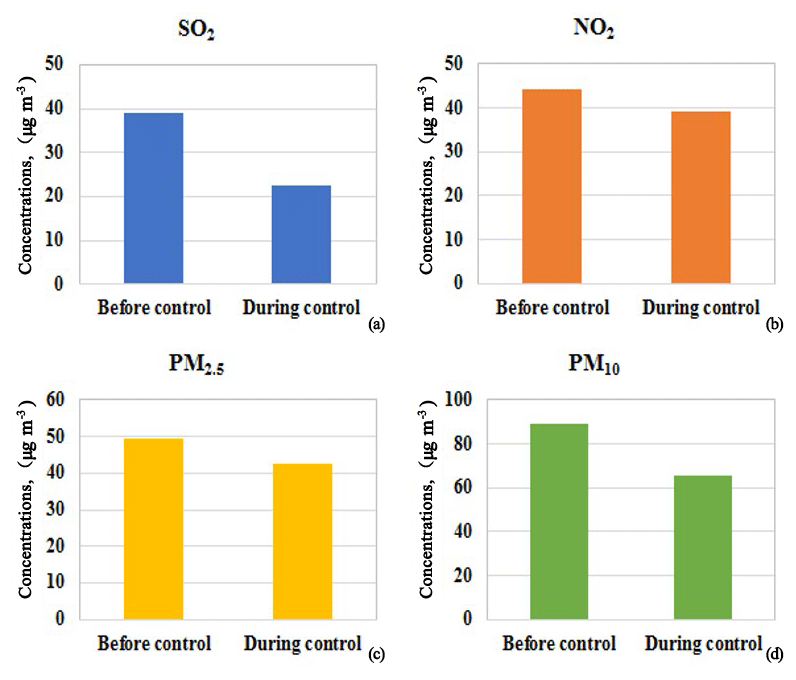
Figure 11Comparison between concentrations of major air pollutants in Jiaxing before and after the campaign under same meteorological conditions.
There were two regional pollution episodes that occurred during the campaign. The first was during 10–12 December caused by the southward motion of northern weak cold air. Polluted air masses from southeastern Shandong peninsula passed through central eastern Jiangsu and into northern Zhejiang, affecting the air quality in Jiaxing. During this period, the average daily PM2.5 concentration in Jiaxing was 145.7 µg m−3, higher than the regional average, and its major chemical components were nitrate (31 %), sulfate (18 %), ammonium (13 %), and organic carbon (13 %), with obvious regional secondary pollution characteristics.
The second episode occurred from 14 to 15 December and was caused by the transit of northwesterly strong cold air. Polluted air masses came from the northwest direction; moved rapidly to the southeast; passed through Shanxi, Hebei, western Shandong, eastern Anhui, and western Jiangsu; and ultimately moved into Zhejiang province. The air masses left China through southeastern Zhejiang on the early morning of the 16 December. The YRD region was strongly affected by the transport of the polluted air mass, with heavy polluted air masses appearing and lasting for about 1 d over the YRD region from north to south. PM2.5 peaked in Jiaxing on the 15 December with a daily average of 201.6 µg m−3. The main chemical components of PM2.5 during the episode were nitrate (25 %), sulfate (14 %), ammonium (12 %), and organic carbon (13 %), which is consistent with an aged air mass as well as regional secondary pollution characteristics.
The regional linkage was initiated from 16 to 18 December, combined with favorable mixing conditions brought by the cold front. The overall air quality in the YRD region during this time period was good, with an average daily PM2.5 concentration in Jiaxing of 45 µg m−3. The major chemical components during this cleaner period were organic carbon (26 %), nitrate (16 %), ammonium (12 %), sulfate (9 %), and other components (37 %), with some newly formed particles and no obvious regional transport, suggesting that air pollutants were mainly derived from local emissions.
3.3 Emission reduction estimation during the campaign
The air quality assurance campaign for the 2nd World Internet Conference was from 8 to 18 December. In order to ensure the air quality during the conference, three provinces and Shanghai municipality in the YRD region carried out joint-control measures. Based on the implementation of control measures in all areas during the conference and whether each area had effectively implemented control measures during 8–18 December, regional emission reductions have been assessed. It is estimated that emission reductions of SO2, NOx, PM2.5, and volatile organic compounds (VOCs) caused by production restriction in regional industrial enterprises are 2867.8, 3064.7, 2165.5, and 5055.4 t, respectively. Emission reductions of various pollutants caused by the restrictions on motor vehicle traffic are estimated to be 4.7 t of SO2, 326.9 t of NOx, 36.1 t of PM2.5, and 452.5 t of VOCs. Emission reduction of PM2.5 caused by dust control was estimated to be 266.0 t. Therefore, it can be seen that emission reductions mainly come from industrial sources, while motor vehicle restrictions contributed greatly to emission reductions of NOx and VOCs, and dust control contributed 10 % to emission reductions of PM2.5.
When looking at specific industries, the power plants contributed most to the emission reductions of SO2 and NOx at 49.7 % and 46.9 %, respectively, followed by the chemical industry, building materials industry, steel industry, and petrochemical industry with a total contribution from all four sectors to emission reductions of SO2 and NOx of 42.0 % and 47.2 %, respectively. For PM2.5, the building materials industry contributed the most at 62.0 %, followed by steel and processing industry, power industry, and nonferrous smelting and process industry with contributions of 14.3 %, 13.1 %, and 8.1 %, respectively. For VOCs, the emission reduction sectors are mainly chemical, petrochemical, and machinery manufacturing sectors with a total contribution of 65.7 % and individual contributions of 25.1 %, 23.2 %, and 17.4 %, respectively. In addition, metal products processing, building materials, and steel and processing sectors also contributed significantly to emission reductions of 13.4 %, 8.0 %, and 6.5 %, respectively.
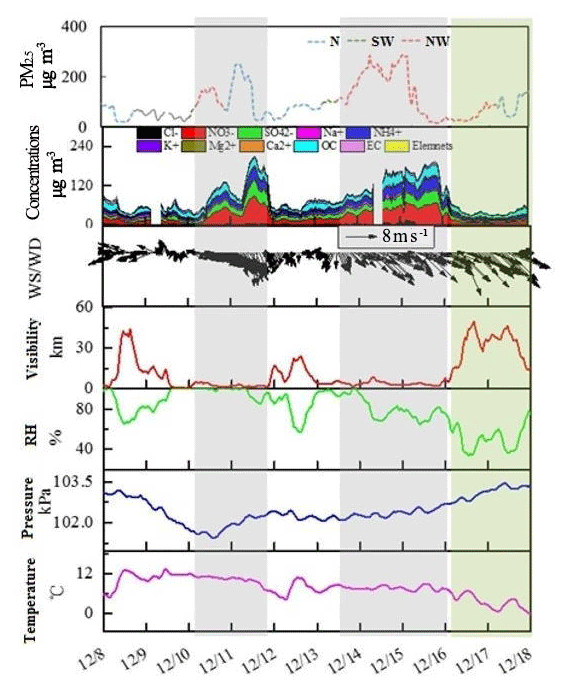
Figure 12Changes in air quality and meteorological parameters in Jiaxing City during the campaign.
In terms of the regional distribution of emission reductions, Jiaxing, Hangzhou, Suzhou, and Shaoxing have the largest contribution of around 80 %. These four cities contribute 87 % to the total emission reduction of PM2.5.
Combing all control measures, total emission reductions of SO2, NOx, PM2.5, and VOCs are estimated to be 2872.5, 3391.6, 2467.6, and 5507.9 t, respectively, which accounts for 10 %, 9 %, 10 %, and 11 %, respectively, of the total urban emissions. It is worth mentioning that if we consider the emergency emission reduction measures for heavy pollution during the campaign, the amount of emission reduction for all pollutants and the proportion of their emission reductions would be even larger. Table 4 shows the percentage and the amount of emission reductions for pollutants under various control measures.
Table 4Emission reduction estimations for various control measures.
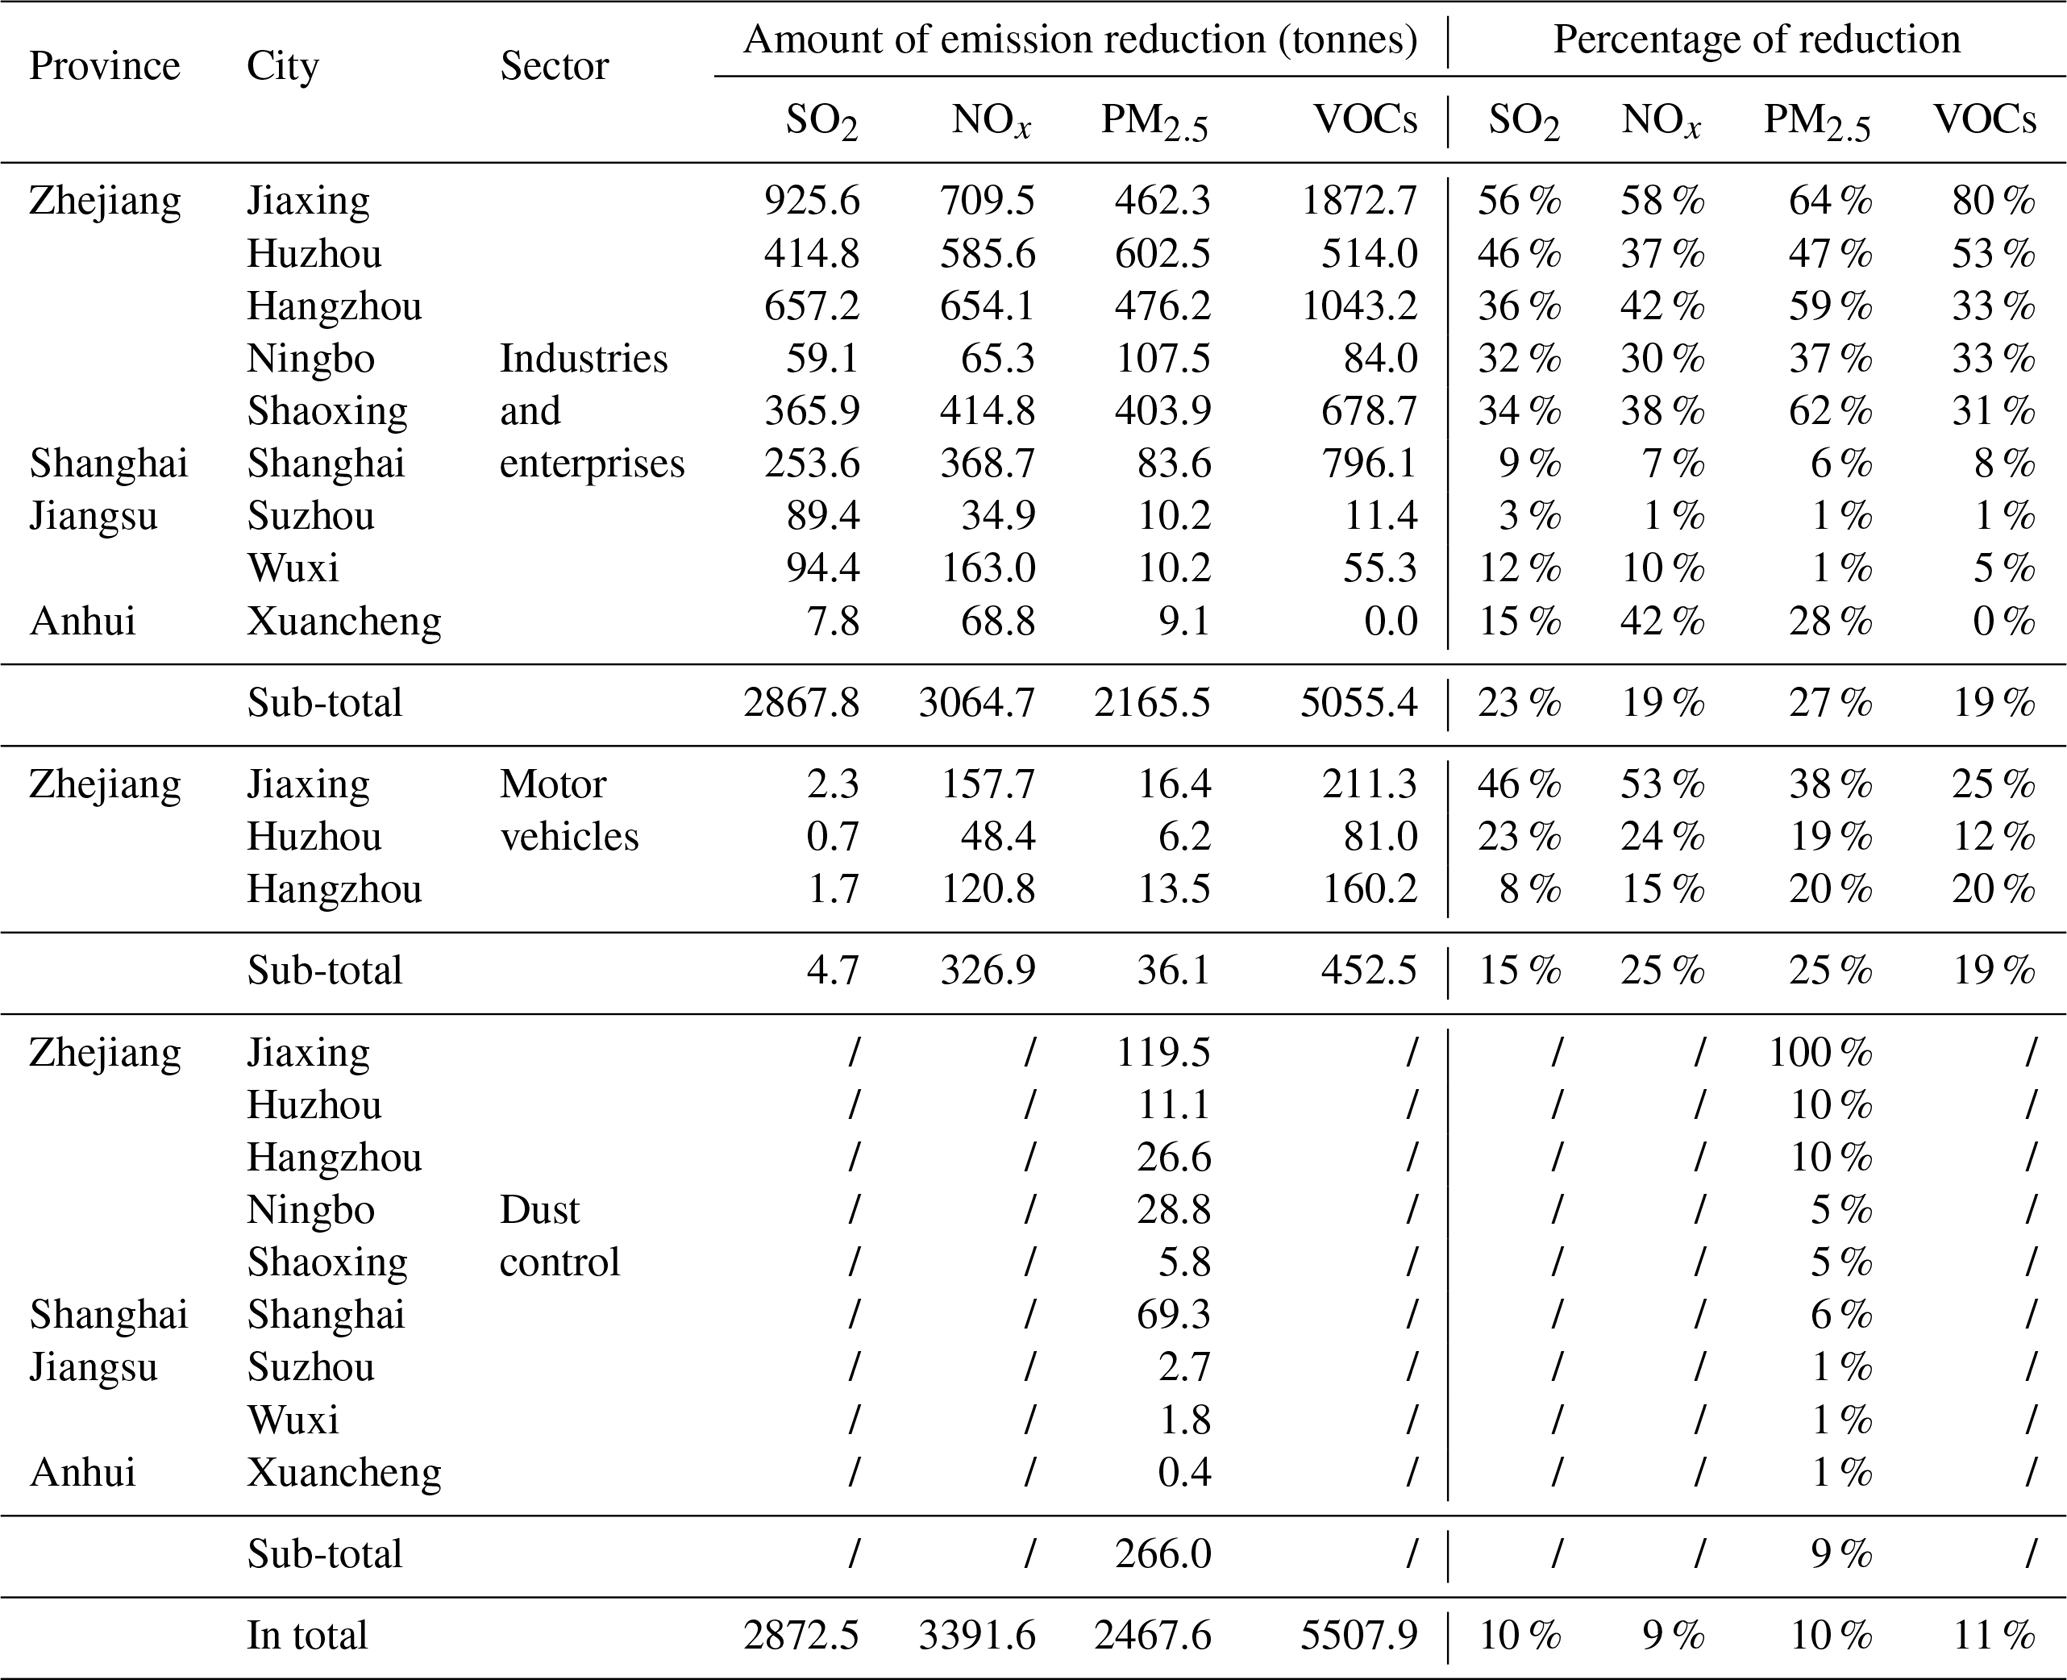
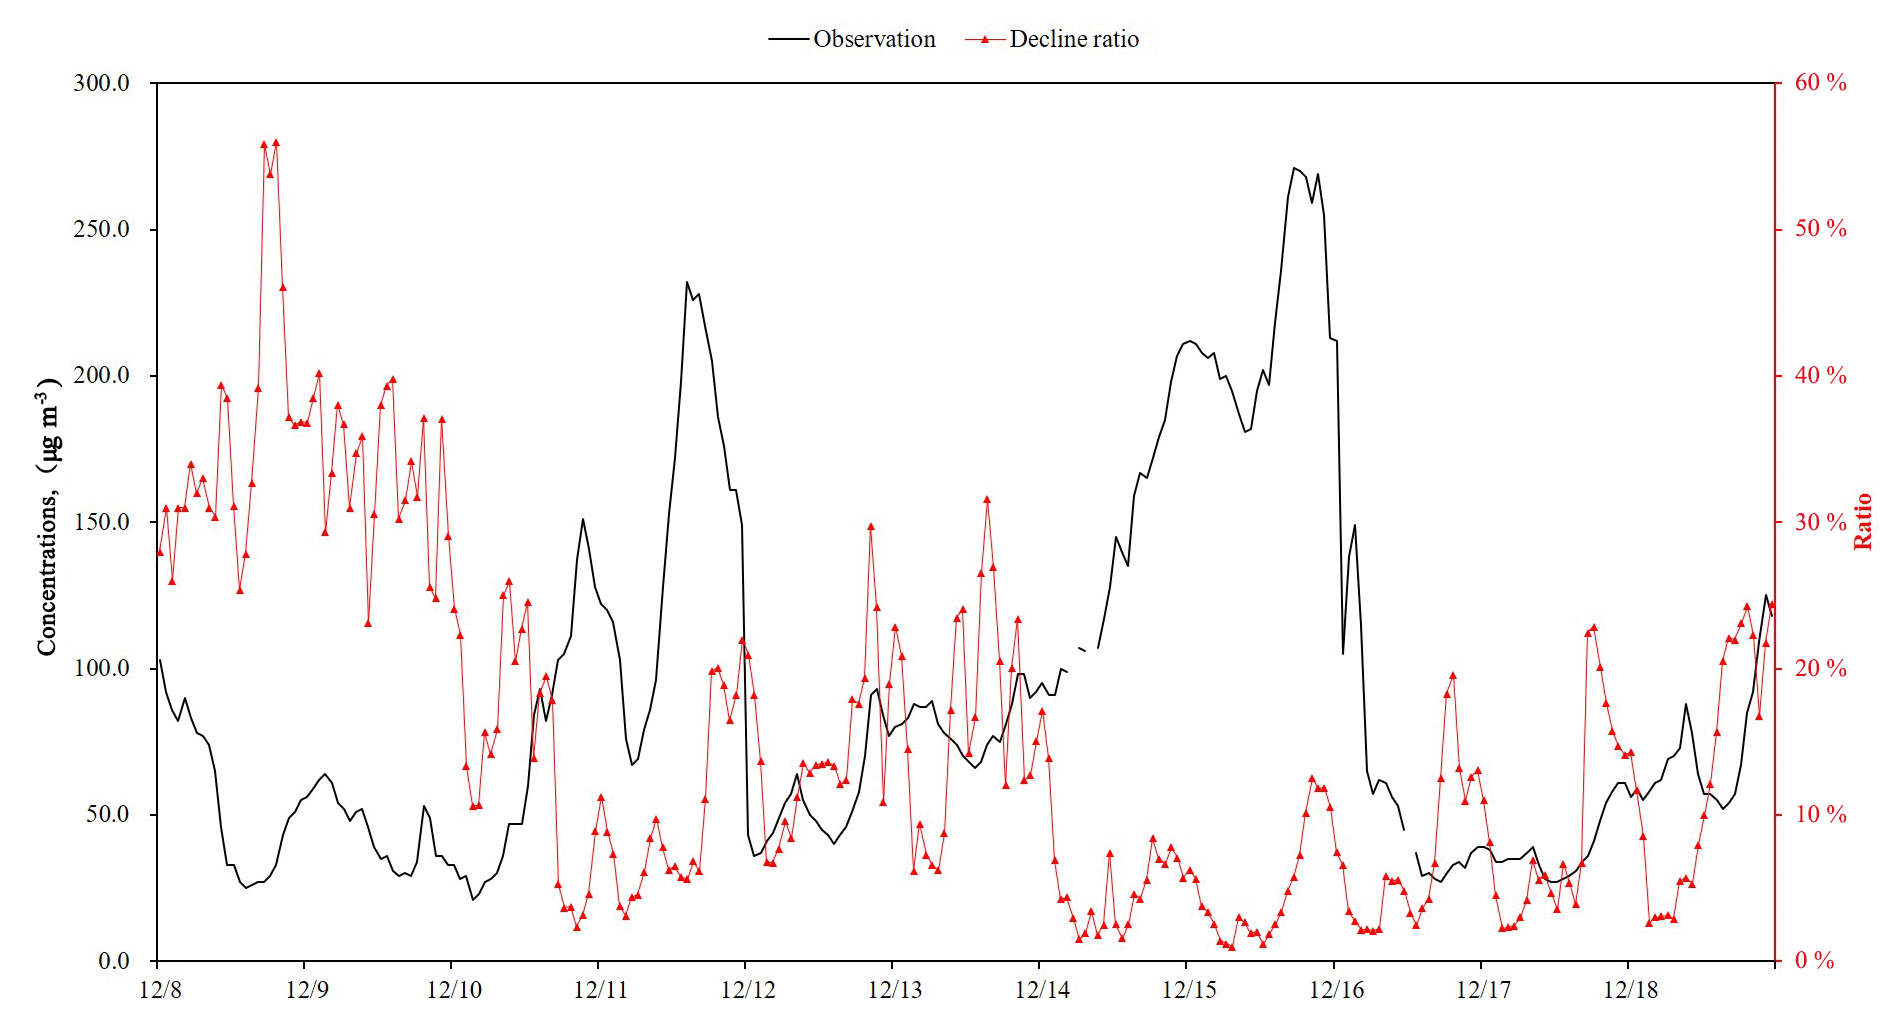
Figure 13Time series of observed PM2.5 and the percentage reduction resulting from the implementation of air quality control measures.
3.4 Quantitative estimates of the contribution of control measures to air quality improvement
3.4.1 PM2.5 concentration improvement in Jiaxing
The WRF-CMAQ air quality model, combined with observations, was used to evaluate the improvement of PM2.5 in Jiaxing due to the emission reductions achieved through the campaign. This analysis utilized two model simulations to assess the impact of the emission reductions: (1) a baseline scenario, which utilized an uncontrolled emission inventory (i.e., the emissions that would have occurred without the campaign), and (2) an emission inventory, which reflects the emission reductions achieved by the campaign. Figure 13 shows the time series of PM2.5 observed concentrations and the percent change in PM2.5 after the air quality control measures were implemented. It can be seen that the PM2.5 decline ratio in Jiaxing varies with time. The PM2.5 decline ratio was most significant during 8–9 December with a maximum reduction of 56 %. During the campaign from 8 to 18 December, average PM2.5 concentrations decreased by 10.5 µg m−3 with an average decrease of 14.4 %. However, although there are many control strategies implemented, the effects during 14–16 December are low. As described in Sect. 3.1.2, the prevailing wind direction during this period is NW and Jiaxing experienced a heavy pollution process with the transit and transport of strong cold air. Therefore, we can not see an obvious effect without strong upwind precursor emission reductions.
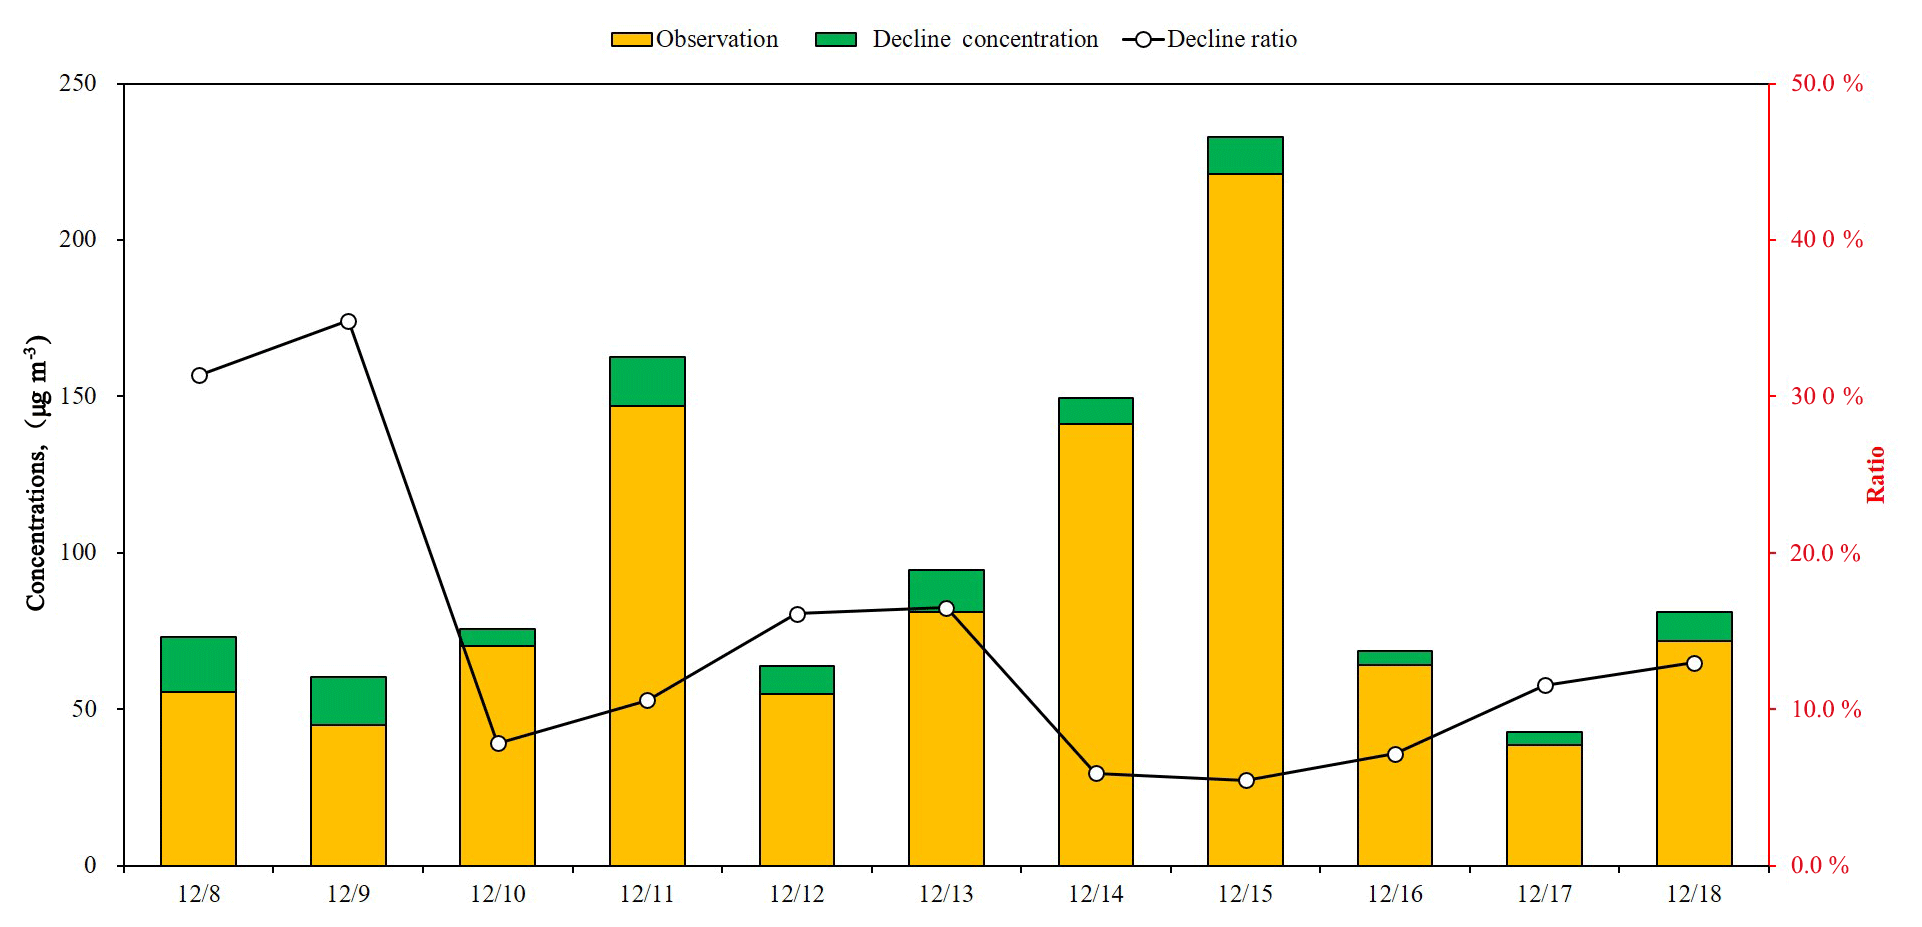
Figure 14 shows the reduction in daily average PM2.5 concentrations in Jiaxing resulting from the emission reductions associated with the Action Plan for Air Quality Control during the World Internet Conference. As can be seen from the figure, the improvement in PM2.5 before the conference (8 and 9 December) was relatively significant, with daily average declines of roughly 31 % and 35 %, respectively, which corresponds to a decrease of around 17 µg m−3. The reduction in PM2.5 during 14–15 December, two of the days with some of the highest observed PM2.5, was relatively low at around 6 %, while daily average PM2.5 concentrations on those days decreased by around 10.0 µg m−3. The magnitude of emission reductions during those two time periods was basically the same so it is likely that the observed difference in PM2.5 levels was the result of meteorological differences, and in particular enhanced transport of polluted air into Jiaxing from 14 to 15 December. Overall, under the influence of regional control measures for emission reductions from 8 to 18 December, PM2.5 daily average concentration decreased by 5.5 %–34.8 % with an average of 14.6 % or 10 µg m−3.
The decline ratio changes with meteorological conditions even under the same emission reduction situation because meteorological conditions influence dispersion from primary emissions, regional transport, and secondary formation. The magnitude of emission reductions during those two time periods was basically the same, so it is possible that the observed difference in PM2.5 levels was the result of meteorological differences. Overall, the residual PM2.5 may come from three aspects: (1) although stringent control measures have been implemented, there are still some precursor emissions in the city, which accumulated and formed secondary particles under favorable meteorological conditions; (2) enhanced transport under specific meteorological conditions, especially upwind emissions; (3) in view of the uncertainties in model performance (underestimation of PM2.5, especially underestimation of SOA) described in previous sections, it should be noted that the secondary formation may probably be underestimated, causing a modeled decline ratio lower than observed.
3.4.2 PM2.5 concentration improvement across regions
Figure 15 shows the spatial distribution of PM2.5 concentrations in the Yangtze River Delta region from 8 to 18 December in the baseline scenario and the campaign scenario. As can be seen from the figure, southern Jiangsu, Shanghai, and northern Zhejiang in the central YRD region had relatively high PM2.5 concentrations, which is consistent with the typically more serious pollution levels in autumn and winter in the YRD region. Under the influence of regional control measures, PM2.5 average concentrations declined significantly in Jiaxing, Hangzhou, and Huzhou, especially at the junction of these three cities, with a slight improvement in central southern Zhejiang as well. The average percentage PM2.5 decline ratio in Jiaxing, Hangzhou, and Huzhou was about 6 %–20 %. Meanwhile, given that the prevailing winds are northwesterly in winter, there was also some improvement in central and southern Zhejiang.
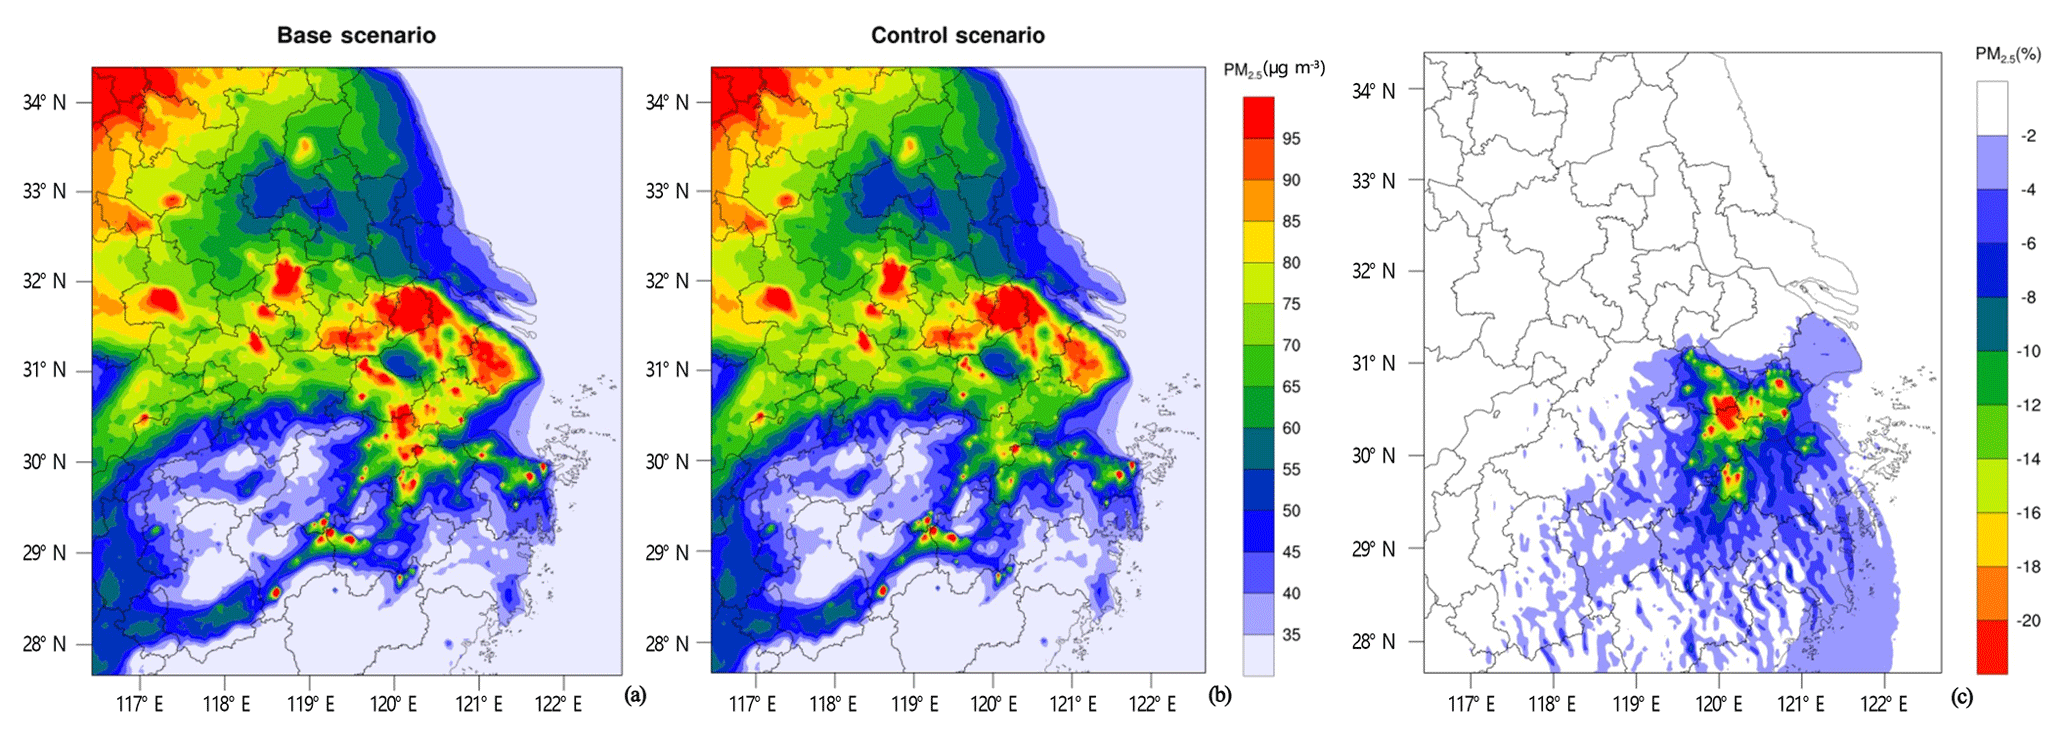
Figure 15Spatial distribution of PM2.5 concentrations in the Yangtze River Delta region under the baseline scenario (a) and the campaign scenario (b), and the percentage reduction in PM2.5 throughout the YRD region (c).
3.4.3 Regional contributions of PM2.5 concentration improvement in Jiaxing
Figure 16a shows the percentage reduction in PM2.5 daily average concentrations from 13 to 18 December after control measures were implemented in Jiaxing and regionally. The reduction in PM2.5 was the result of both local controls and regional controls, which reduced pollution in the air masses transported into Jiaxing. Overall, modeling suggests that the regional controls reduced PM2.5 levels in Jiaxing between 5.5 % and 16.5 % (9.9 % average), while local control measures contributed 4.5 %–14.4 %, with an average of 8.8 %.
Figure 16b shows the average contribution of local emission reductions in Jiaxing and in the YRD region over the entire campaign (13–18 December), as well as the corresponding improvement in PM2.5 levels in Jiaxing. During this period, PM2.5 daily average concentration declined by 4–13 µg m−3, while there were differences in the contribution of regional emission reductions and local emission reductions in Jiaxing during different periods. Overall, local control measure in Jiaxing had the largest impact on PM2.5 levels and accounted for 89 % of the decline in PM2.5, while regional control measures contributed the remaining 11 %.
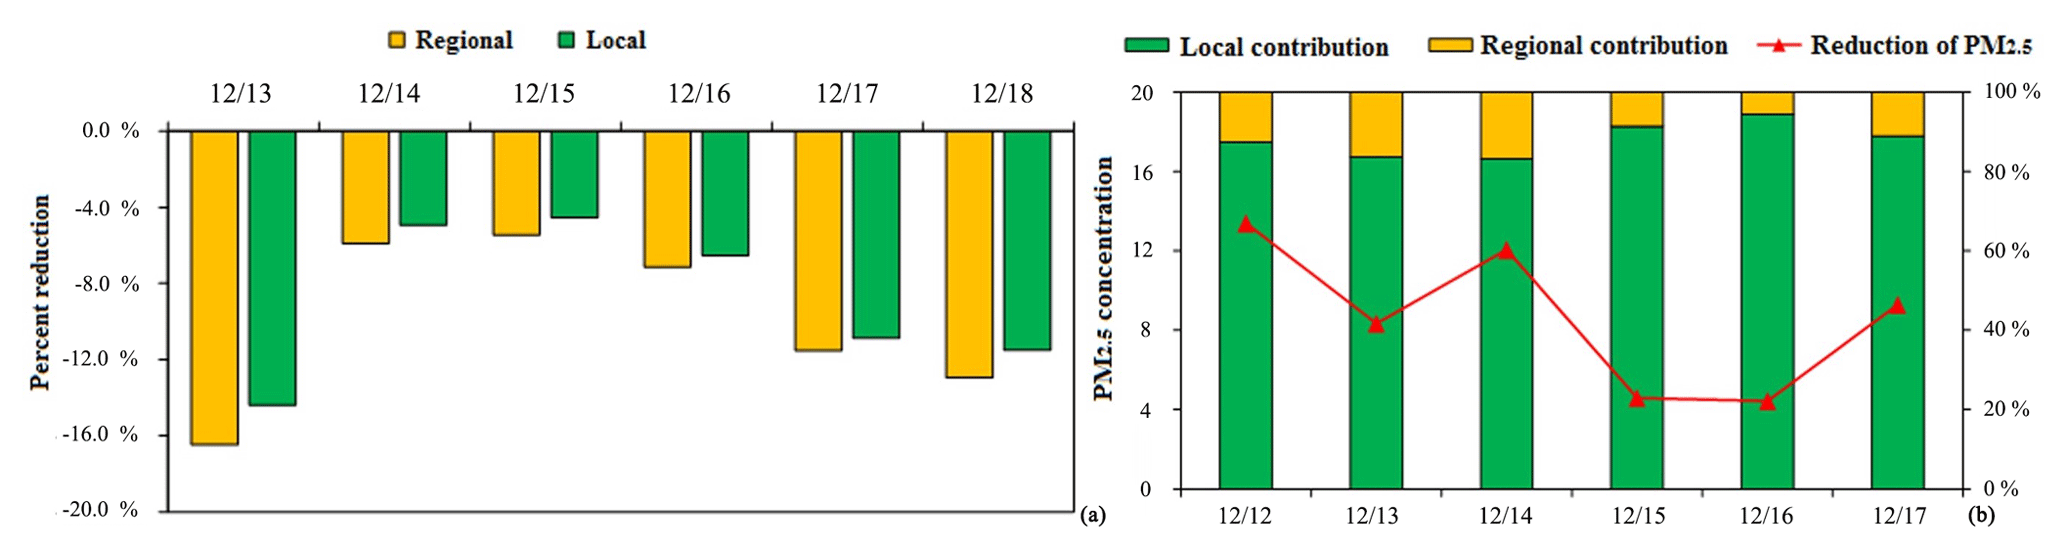
Figure 16Percentage reduction in daily average PM2.5 concentrations from 13 to 18 December after implementation of the control measures across the region and in Jiaxing (a) and contribution of local and regional emission reductions in Jiaxing, and the resulting improvement of daily average PM2.5 concentrations in Jiaxing (b).
3.5 Optimization scenario analysis of regional linkage control measures
3.5.1 Optimization scenario settings
In order to further analyze the optimization potential of air quality control measures for major events and enhance the effectiveness of the control measure scheme design, three control measure optimization scenarios have been set on the basis of the evaluation scenario (Base) after the implementation of air quality control measures during the conference. These scenarios include local emission reductions in Jiaxing under stagnant meteorological conditions, where local emission accumulation is the main contributor to the pollution process (Sce. 1), and the emission reduction scenario where transport of polluted air masses into Jiaxing is a major contributor to the PM2.5 levels in Jiaxing. In order to investigate the transport processes further, the latter scenario was further divided into a scenario 24 h in advance (Sce. 2) and a scenario 48 h in advance (Sce. 3). Table 5 describes the details of each scenario.
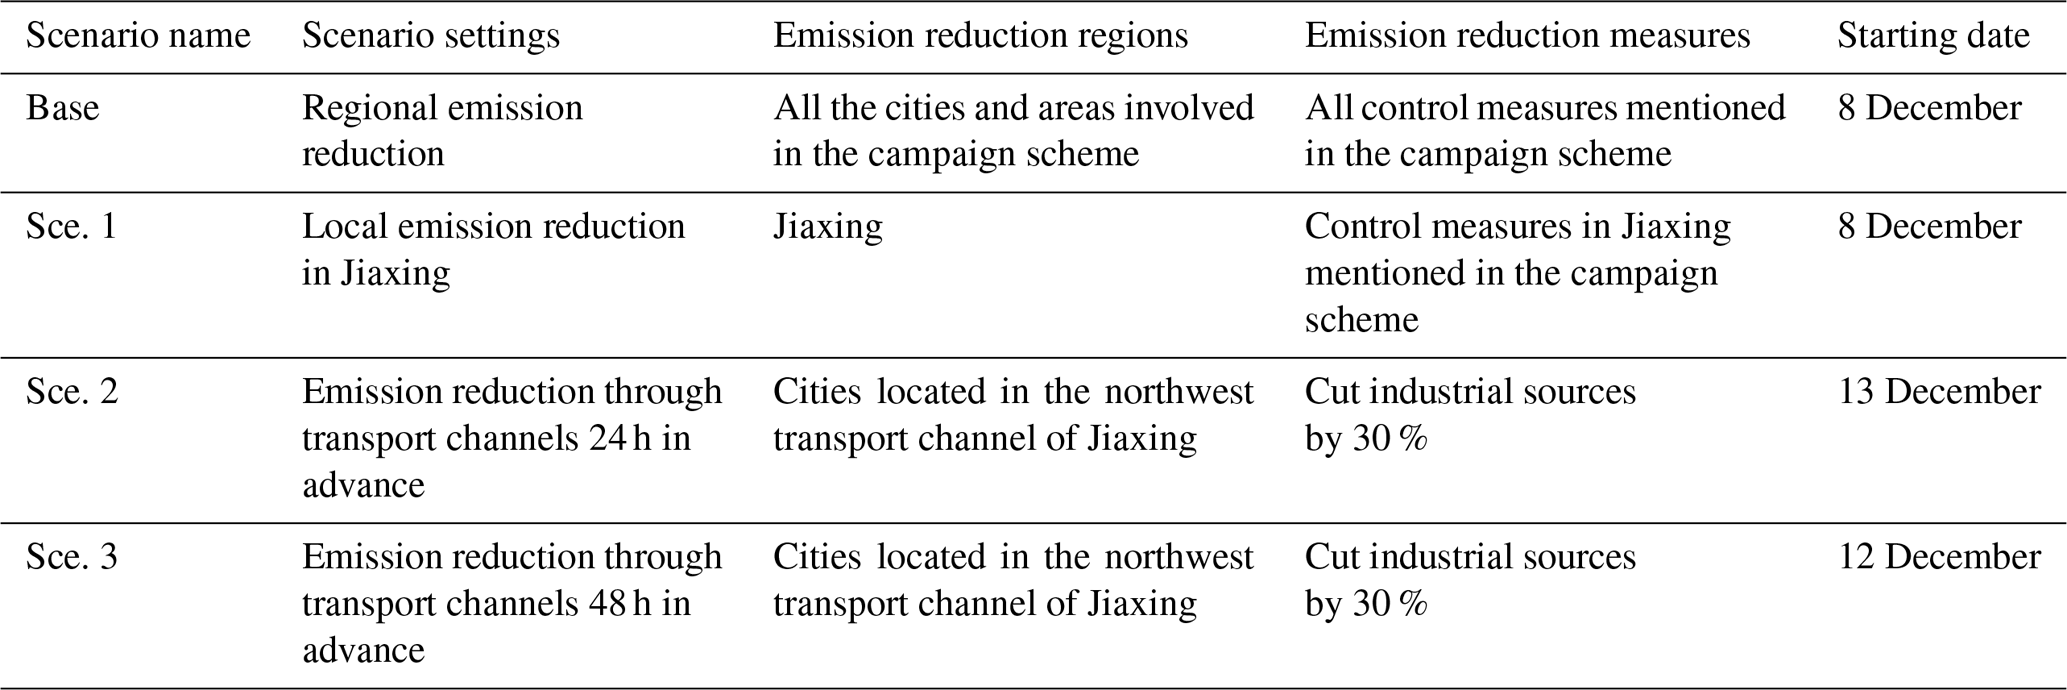
Figure 17 shows the cities that primarily influence the polluted air masses transported into Jiaxing, where the transport channels were determined through backward trajectory analysis. These cities include Huzhou in Zhejiang province; Suzhou, Wuxi, Changzhou, Nanjing, Zhenjiang, Huai'an, Suqian, and Suzhou in Jiangsu province; and Suzhou, Huaibei, Bozhou, Bengbu, Chuzhou, and Ma'anshan in Anhui province. Each of these cities took measures to reduce emissions by limiting production from industries by 30 %.

Figure 17Cities involved in the transport channel and the emission reduction channel.
The WRF-CMAQ modeling system was used to analyze and compare the air quality improvement effect under different pollution processes in four scenarios.
3.5.2 Analysis of optimization scenario effects
In order to evaluate the effect of the different starting time for the same control measures, and the same starting time for local and regional control measures, we investigated four scenarios. Figure 18 shows the percentage reduction in daily average PM2.5 concentrations in Jiaxing City from 13 to 18 December under the regional emission reduction scenario, the Jiaxing local emission reduction scenario, and the transport channel emission reduction scenario. Overall, there are differences in the distribution of PM2.5 under the different scenarios. The air quality improvement due to the regional emission reductions was higher than that of local emission reductions in Jiaxing, and lower than that of channel emission reductions.
Effect of local emission reductions in Jiaxing. By comparing the effect of local emission reductions in Jiaxing (Sce. 1) and the effect of regional emission reductions (Base), we can see that PM2.5 daily average concentrations in Jiaxing declined by around 5.5 %–16.5 % under the regional emission reduction plan (regional emission plan including the local emissions control) from 13 to 18 December and by around 4.5 %–14.4 % under the local emission reduction plan. Local emission reductions in Jiaxing contributed 83 %–94 % to the emission reduction effect. Therefore, local emission reduction in Jiaxing is the key factor in improving the local air quality.
Compared with the channel emission reduction scenario 24 h in advance (11.6 %–18.2 %), local emission reductions also contributed more than 50 % to the improvement effect on 13, 17, and 18 December. Therefore, local emission reductions contributed most to the air quality improvement effect in Jiaxing, indicating that local areas are still the most important control areas during the campaign.
Effect of emission reductions through transport channels. As mentioned above, during the large-scale transport of heavily polluted air masses into the Yangtze River Delta region from 14 to 15 December, the PM2.5 pollution in Jiaxing was significantly affected. Under the local emission reduction scenario (Sce. 1) and the regional linkage emission reduction scenario (Base), PM2.5 daily average concentrations in Jiaxing decline by only 4.5 %–5.9 %. If a 30 % reduction in emissions from industrial sources in the upwind transport channel is implemented, PM2.5 daily average concentrations in Jiaxing declined by 11.6 %–13.6 %, while local emission reductions contributed less than 40 % to the improvement of PM2.5. Therefore, to reduce PM2.5 under these large-scale transport conditions, in addition to intensifying local emission reduction efforts, it is more effective to prevent and control such pollution by adopting emission reductions of industrial sources over key transport channels, especially for elevated sources.

Figure 18Decline rates of PM2.5 daily average concentrations in Jiaxing under different scenarios.
In this study, the main transport channel involved is the northwest transport channel in control areas, which basically represents the typical winter transport channel in the region. Air quality improvement due to regional emission reductions was slightly larger than that of local emission reductions in Jiaxing, and smaller than that of channel emission reductions. This suggests that emission reduction in the downwind cities does not have much effect on Jiaxing's air quality. In contrast, emission reduction based on predicted transport pathway in advance are much more effective than local emission reduction and regional emission reductions. Therefore, a well-designed management plan for the main transport channel is necessary to ensure optimized air quality improvement in autumn and winter, in addition to reducing local emissions.
Effect of the starting time for channel emission reductions. According to the comparisons between the emission reduction scenario 24 h in advance (Sce. 2) and the emission reduction scenario 48 h in advance (Sce. 3) during the large-scale PM2.5 transport, we can see that if we take 13 December as the target and adopt channel emission reductions 48 h in advance, PM2.5 daily average concentrations will decline by 23.1 % when compared to the baseline scenario, which is significantly better than the improvement achieved by the emission reduction scenario 24 h in advance (18.2 %). Therefore, early measures to reduce emissions will lead to improvement of air quality.
If we focus on the conference period (16–18 December), PM2.5 daily average concentrations will decline by 15.3 %–19.7 % under the two channel emission reduction scenarios, indicating a close improvement effect. Therefore, during the pollution process when local emissions are the main contributor, local emission reductions should be the top priority with no difference between channel reductions 24 h in advance and 48 h in advance. If transport is the main contributor to the pollution, adopting channel reductions 48 h in advance can bring about more of an improvement effect than 24 h in advance.
The effect of restricting production in industrial enterprises is remarkable. The power industry and related industrial enterprises in Jiaxing cut SO2 and NOx emissions by over 50 %, while the building materials industry, smelting industry, and other industrial enterprises cut PM2.5 emissions by 63 %, contributing greatly to the reduction of primary PM2.5 concentrations. The petrochemical industry, chemical industry, and other related industrial enterprises cut VOC emissions by 66 % in total, contributing greatly to the reduction of PM2.5 formed through the conversion of precursor species. The observation data of PM2.5 components suggest that the relative contribution of secondary components dropped significantly during the conference. Production restriction or suspension for industrial enterprises is the main contributor to emission reductions for various pollutants during the campaign, which resulted in the largest improvement in air quality.
Motor vehicle pollutant emissions declined significantly. In Jiaxing, motor vehicle restrictions were fully implemented during heavy pollution days, temporary traffic control was implemented during certain periods, and enterprises and institutions had a 3-day vacation during the conference. Emission reduction rates for various pollutants from motor vehicle emissions were around 40 %–50 %. Motor vehicle emission reduction measures contributed to the total emission reductions of nitrogen oxides by 18.2 %, fine particles by 3.4 %, and volatile organic compounds by 10.1 %.
The effect of dust control measures is remarkable. During the conference, most of the construction sites in Jiaxing were suspended from operation. Increased frequency for road cleaning activities greatly lowered the dust emissions. Speciation of the measured PM2.5 suggests that the mass concentration of crust material decreased by 14 % compared to measurements after the conference. Especially under static conditions, mineral soluble ions (Ca2+ and Mg2+) declined 56.8 % before and during the campaign. This suggests that the suspension of construction operations and increased frequency of rinsing and cleaning of paved roads significantly reduced dust emissions.
Regional linkage between surrounding areas played an important role. PM2.5 is a typical regional air pollutant, with obvious regional transport characteristics. In accordance with the requirements of the campaign scheme, eight cities around Jiaxing have actively implemented emission reduction measures. During the campaign, PM2.5 concentrations in eight surrounding cities and southeastern Zhejiang also declined with obvious regional synergies.
It is worth noting that the implementation of control measures has also had a negative impact on the economy and the society in the short term while improving the air quality. For example, production restriction or suspension on a large number of industrial enterprises were taken at great economic costs and motor vehicle restriction had a large impact on the society.
Suggestions on emission reduction plans are as follows. Local emission reductions shall be supplemented by regional linkage. Assessment results show that local emission reductions play a key role in ensuring air quality. Therefore, it is recommended that a synergistic emission reduction plan between adjacent areas with local pollution emission reductions as the core part should be established and strengthened, and emission reduction plans for different types of pollution through a stronger regional linkage should be reserved. Strengthen the pollution reduction in the upper reaches along the transport channel. It is especially crucial to enhance pollution emission reductions in the upper reaches of the channel since long-distance transport of plumes is a problem. This is especially true for key industrial sources and elevated sources. Considering that polluted air mass transport is more frequent in winter, it is necessary to develop emission reduction plans for different plume transport channels, combined with forecasting and warning mechanisms which could be initiated on time.
Datasets associated with this work will be available upon request to the corresponding author.
LL designed this study and wrote the paper. HLW co-designed the study and provided valuable advice on the data analysis. CH developed the regional emissions inventory. SHZ performed observational data analysis and JYA carried out the CMAQ and CAMx modeling work. RSY performed the WRF modeling. MZ and LPQ helped with observation and data quality control. XDT and LJS carried out the measurements and provided the observed data. LH and YJW helped to revise the paper. JCA and JSF helped revise and polish the article and gave advice on paper writing.
The authors declare that they have no conflict of interest.
This article is part of the special issue “Regional transport and transformation of air pollution in eastern China”. It is not associated with a conference.
This study was financially supported by the “Chinese National Key Technology R&D Program” via grant no. 2014BAC22B03 and the National Natural Science Foundation of China (no. 41875161). We also thank the Joint Prevention and Control of Regional Air Pollution office of the Yangtze River Delta region for coordinating the data share. We would like to thank the anonymous referees for those suggestions raised which have helped greatly to improve this paper.
This research has been supported by the Chinese National Key Technology R&D Program (grant no. 2014BAC22B03) and the National Natural Science Foundation of China (grant no. 41875161).
This paper was edited by Renyi Zhang and reviewed by three anonymous referees.
Appel, K. W., Bhave, P. V., Gilliland, A. B., Sarwar, G., and Roselle, S. J.: Evaluation of the community multiscale air quality (CMAQ) model version 4.5: sensitivities impacting model performance, Part II particulate matter, Atmos. Environ. 42, 6057–6066, 2008.
Burr, M. J. and Zhang, Y.: Source apportionment of fine particulate matter over the Eastern U.S., Part I: source sensitivity simulations using CMAQ with the Brute Force method, Atmos. Pollut. Res., 2, 300–317, 2011.
CAI-Asia: “Blue Skies at Shanghai EXPO 2010 and Beyond: Analysis of Air Quality Management in Cities with Past and Planned Mega-Events: A Survey Report” Pasig City, Philippines, 20 pp., 2010.
CAI-Asia: “Nanjing YOG 2014 Home” Pasig City, Philippines, 142 pp., 2014.
Chang, J. S., Brost, R. A., Isaksen, I. S. A., Madronich, S., Middleton, P., Stockwell, W. R., and Walcek, C. J.: A 3-Dimensional eulerian acid deposition model – physical concepts and formulation, J. Geophys. Res., 92, 14681–14700, 1987.
Chen, P. L., Wang, T. J., Lu, X.B. ,Yu, Y., Kasoar, M., Xie, M., and Zhuang, B.: Source apportionment of size-fractionated particles during the 2013 Asian Youth Games and the 2014 Youth Olympic Games in Nanjing, China, Sci. Total Environ., 579, 860–870, 2017.
Chen, Q., Fu, T. M., Hu, J., Ying, Q., and Zhang, L.: Modelling secondary organic aerosols in China, Nat. Sci. Rev., 4, 806–809, 2017.
Cheng, Y., Zheng, G., Wei, C., Mu, Q., Zheng, B., Wang, Z., Gao, M., Zhang, Q., He, K., Carmichael, G., Pöschl1, U., and Su, H.: Reactive nitrogen chemistry in aerosol water as a source of sulfate during haze events in China, Science Advances, 2, 1601530–1601530, doi:10.1126/sciadv.1601530, 2016.
Chou, M. D. and Suarez, M. J.: A solar radiation parameterization (CLIR-AD-SW) for atmospheric studies, 42 pp., 1999.
Ek, M. B.: Implementation of Noah land surface model advances in the National Centers for Environmental Prediction operational mesoscale Eta model, J. Geophys. Res., 108, https://doi.org/10.1029/2002jd003296, 2003.
Foley, K. M., Roselle, S. J., Appel, K. W., Bhave, P. V., Pleim, J. E., Otte, T. L., Mathur, R., Sarwar, G., Young, J. O., Gilliam, R. C., Nolte, C. G., Kelly, J. T., Gilliland, A. B., and Bash, J. O.: Incremental testing of the Community Multiscale Air Quality (CMAQ) modeling system version 4.7, Geosci. Model Dev., 3, 205–226, https://doi.org/10.5194/gmd-3-205-2010, 2010.
Fu, X., Cheng, Z., Wang, S., Hua, Y., Xing, J., and Hao, J.: Local and Regional Contributions to Fine Particle Pollution in Winter of the Yangtze River Delta, China, Aerosol Air. Qual. Res., 16, 1067–1080, 2016.
Guenther, A. B., Jiang, X., Heald, C. L., Sakulyanontvittaya, T., Duhl, T., Emmons, L. K., and Wang, X.: The Model of Emissions of Gases and Aerosols from Nature version 2.1 (MEGAN2.1): an extended and updated framework for modeling biogenic emissions, Geosci. Model Dev., 5, 1471–1492, https://doi.org/10.5194/gmd-5-1471-2012, 2012.
Han, X. K., Guo, Q. J., Liu, C. Q., Strauss, H., Yang, J., Hu, J., Wei, R., Tian, L., Kong, J., and Peters, M.: Effect of the pollution control measures on PM2.5 during the 2015 China Victory Day Parade: Implication from water-soluble ions and sulfur isotope, Environ. Pollut., 218, 230–241, 2016.
Hong, S. Y.: A new vertical diffusion package with an explicit treatment of entrainment processes, Mon. Weather Rev., 134, 2318–2341, https://doi.org/10.1175/MWR3199.1, 2006.
Hu, J. L., Wang, Y., Ying, Q., and Zhang, H.: Spatial and temporal variability of PM2.5 and PM10 over the North China Plain and the Yangtze River Delta, China, Atmos. Environ., 95, 598–609, 2014.
Hu, J. L., Wu, L., Zheng, B. , Zhang, Q., He, K., Chang, Q., Li, X., Yang, F., Ying, Q., and Zhang, H.: Source contributions and regional transport of primary particulate matter in China, Environ. Pollut., 207, 31–42, 2015.
Hu, J. L., Wang, P., Ying, Q., Zhang, H., Chen, J., Ge, X., Li, X., Jiang, J., Wang, S., Zhang, J., Zhao, Y., and Zhang, Y.: Modeling biogenic and anthropogenic secondary organic aerosol in China, Atmos. Chem. Phys., 17, 77–92, https://doi.org/10.5194/acp-17-77-2017, 2017.
Huang, C., Chen, C. H., Li, L., Cheng, Z., Wang, H. L., Huang, H. Y., Streets, D. G., Wang, Y. J., Zhang, G. F., and Chen, Y. R.: Emission inventory of anthropogenic air pollutants and VOC species in the Yangtze River Delta region, China, Atmos. Chem. Phys., 11, 4105–4120, https://doi.org/10.5194/acp-11-4105-2011, 2011.
Huang, Y. M., Liu, Y., Zhang, L. , Peng, C., and Yang, F.: Characteristics of Carbonaceous Aerosol in PM2.5 at Wanzhou in the Southwest of China, Atmosphere, 9, https://doi.org/10.3390/atmos9020037, 2018.
Jiang, C., Wang, H., Zhao, T., Li, T., and Che, H.: Modeling study of PM2.5 pollutant transport across cities in China's Jing-Jin- Ji region during a severe haze episode in December 2013, Atmos. Chem. Phys., 15, 5803–5814, https://doi.org/10.5194/acp-15-5803-2015, 2015.
Kasibhatla, P., Chameides, W. L., and Jonn, J. S.: A three dimensional global model investigation of seasonal variations in the atmospheric burden of anthropogenic sulphate aerosols. J. Geophys. Res. 102, 3737–3759, 1997.
Kelly, F. J. and Zhu, T.: Transport solutions for cleaner air, Science, 352, 934–936, 2016.
Li, J. L., Zhang, M. G., Gao, Y., and Chen, L.: Model analysis of secondary organic aerosol over China with a regional air quality modeling system (RAMS-CMAQ), Atmos. Ocean. Sci. Lett., 9, 443–450, 2016.
Li, L., Chen, C. H., Fu, J. S., Huang, C., Streets, D. G., Huang, H. Y., Zhang, G. F., Wang, Y. J., Jang, C. J., Wang, H. L., Chen, Y. R., and Fu, J. M.: Air quality and emissions in the Yangtze River Delta, China, Atmos. Chem. Phys., 11, 1621–1639, https://doi.org/10.5194/acp-11-1621-2011, 2011.
Li, L., An, J. Y., Zhou, M., Yan, R. S., Huang, C., Lu, Q., Lin, L., Wang, Y. J., Tao, S. K., Qiao, L. P., Zhu, S. H., and Chen, C. H.: Source apportionment of fine particles and its chemical components over the Yangtze River Delta, China during a heavy haze pollution episode, Atmos. Environ., 123, 415–429, 2015.
Li, M., Zhang, Q., Kurokawa, J.-I., Woo, J.-H., He, K., Lu, Z., Ohara, T., Song, Y., Streets, D. G., Carmichael, G. R., Cheng, Y., Hong, C., Huo, H., Jiang, X., Kang, S., Liu, F., Su, H., and Zheng, B.: MIX: a mosaic Asian anthropogenic emission inventory under the international collaboration framework of the MICS-Asia and HTAP, Atmos. Chem. Phys., 17, 935–963, https://doi.org/10.5194/acp-17-935-2017, 2017.
Li, R. P., Mao, H. J., Wu, L., He, J., Ren, P., and Li, X.: The evaluation of emission control to PM concentration during Beijing APEC in 2014, Atmos. Pollut. Res., 7, 363–369, 2016.
Li, X., Zhang, Q., Zhang, Y., Zheng, B., Wang, K., Chen, Y., Wallington, T. J., Han, W., Shen, W., Zhang, X., and He, K.: Source contributions of urban PM2.5 in the Beijing–Tianjin–Hebei region: Changes between 2006 and 2013 and relative impacts of emissions and meteorology, Atmos. Environ., 123, 229–239, 2015.
Liang, P., Zhu, T., Fang, Y., Li, Y., Han, Y., Wu, Y., Hu, M., and Wang, J.: The role of meteorological conditions and pollution control strategies in reducing air pollution in Beijing during APEC 2014 and Victory Parade 2015, Atmos. Chem. Phys., 17, 13921–13940, https://doi.org/10.5194/acp-17-13921-2017, 2017.
Lin, Y. L.: Bulk parameterization of the snow field in a cloud model, J. Appl. Meteorol., 22, 1065–1092, 1983.
Liu, H., Wang, X. M., Zhang, J. , He, K., Wu, Y., and Xu, J.: Emission controls and changes in air quality in Guangzhou during the Asian Games, Atmos. Environ., 76, 81–93, 2013.
Liu, J. and Zhu, T.: NOx in Chinese Megacities, Nat. Sci. Peace. Sec., 120, 249–263, 2013.
Liu, Y., Li, L., An, J. Y., Zhang, W., Yan, R. S., Huang, L., Huang, C., Wang, H. L., Wang, Q., and Wang, M.: Emissions, chemical composition, and spatial and temporal allocation of the BVOCs in the Yangtze River Delta Region in 2014, Environ. Sci., 39, 608–617, 2018.
Lu, Q., Zhang, Y. F., Ma, Y. , Chen, M., Ge, X., Ma, Y., Zheng, J., Wang, Z., and Li, S: Source identification of trace elements in the atmosphere during the second Asian Youth Games in Nanjing, China: Influence of control measures on air quality, Atmos. Pollut. Res., 7, 547–556, 2016.
Lv, B. L., Liu, Y., Yu, P., Zhang,B., Bai, Y. Q.: Characterizations of PM2.5 Pollution Pathways and Sources Analysis in Four Large Cities in China, Aerosol Air Qual. Res., 15, 1836–1843, 2015.
Markovic, M. Z., VandenBoer, T. C., and Murphy, J. G.: Characterization and Optimization of an Online System for the Simultaneous Measurement of Atmospheric Water-soluble Constituents in the Gas and Particle Phases, J. Environ. Monit., 14, 1872–1874, 2012.
Mlawer, E. J., Taubman, S. J., Brown, P. D., Iacono, M. J., and Clough, S. A.: Radiative transfer for inhomogeneous atmospheres: RRTM, a validated correlated-k model for the longwave, J. Geophys. Res., 102, 16663–16682, 1997.
Nenes, A., Pilinis, C., and Pandis, S. N.: ISORROPIA: A New Thermodynamic Model for Multiphase Multicomponent Inorganic Aerosols, Aquat. Geochem., 4, 123–152, 1998.
Nolte, C. G., Appel, K. W., Kelly, J. T., Bhave, P. V., Fahey, K. M., Collett Jr., J. L., Zhang, L., and Young, J. O.: Evaluation of the Community Multiscale Air Quality (CMAQ) model v5.0 against size-resolved measurements of inorganic particle composition across sites in North America, Geosci. Model Dev., 8, 2877–2892, https://doi.org/10.5194/gmd-8-2877-2015, 2015.
Polissar, A. V., Hopke, P. K., Kaufmann, P. P., Kaufmann, Y., Hall, D., Bodhaine, B., Dutton, E., and Harris J.: The aerosol at Barrow, Alaska: long-term trends and source location, Atmos. Environ., 33, 2441–2458, 1999.
Pui, D. Y. H., Chen, S. C., and Zuo, Z. L.: PM2.5 in China: Measurements, sources, visibility and health effects, and mitigation, Particuology, 13, 1–26, 2014.
Sun, Y. L., Wang, Z. F., Wild, O. , Xu, W., Chen, C., Fu, P., Du, W., Zhou, L., Zhang, Q., Han, T., Wang, Q., Pan, X., Zheng, H., Li, J., Guo, X., Liu, J., and Worsnop, D. R.: “APEC Blue”: Secondary Aerosol Reductions from Emission Controls in Beijing, Sci. Rep-UK., 6, 20668, https://doi.org/10.1038/srep20668, 2016.
Swagata, P., Pramod, K., Sunita, V. , Prakash, D., and Soni, M.: Potential source identification for aerosol concentrations over a site in Northwestern India, Atmos. Res., 169, 65–72, 2016.
Tang, G., Zhu, X., Hu, B., Xin, J., Wang, L., Münkel, C., Mao, G., and Wang, Y.: Impact of emission controls on air quality in Beijing during APEC 2014: lidar ceilometer observations, Atmos. Chem. Phys., 15, 12667–12680, https://doi.org/10.5194/acp-15-12667-2015, 2015.
Tang, L., Haeger-Eugensson, M., Sjoberg, K. , Wichmann, J., Molnar, P., and Sallsten, G.: Estimation of the long-range transport contribution from secondary inorganic components tos urban background PM10 concentrations in south-western Sweden during 1986–2010, Atmos. Environ., 89, 93–101, 2014.
Tian, M., Wang, H., Chen, Y., Yang, F., Zhang, X., Zou, Q., Zhang, R., Ma, Y., and He, K.: Characteristics of aerosol pollution during heavy haze events in Suzhou, China, Atmos. Chem. Phys., 16, 7357–7371, https://doi.org/10.5194/acp-16-7357-2016, 2016.
US EPA.: Draft Modeling Guidance for Demonstrating Attainment of Air Quality Goals for Ozone, PM2.5, and Regional Haze, 2014.
Wang, L. T., Wei, Z., Yang, J., Zhang, Y., Zhang, F. F., Su, J., Meng, C. C., and Zhang, Q.: The 2013 severe haze over southern Hebei, China: model evaluation, source apportionment, and policy implications, Atmos. Chem. Phys., 14, 3151–3173, https://doi.org/10.5194/acp-14-3151-2014, 2014.
Wang, T., Nie, W., Gao, J., Xue, L. K., Gao, X. M., Wang, X. F., Qiu, J., Poon, C. N., Meinardi, S., Blake, D., Wang, S. L., Ding, A. J., Chai, F. H., Zhang, Q. Z., and Wang, W. X.: Air quality during the 2008 Beijing Olympics: secondary pollutants and regional impact, Atmos. Chem. Phys., 10, 7603–7615, https://doi.org/10.5194/acp-10-7603-2010, 2010.
Wang, Y., Hao, J., McElroy, M. B., Munger, J. W., Ma, H., Chen, D., and Nielsen, C. P.: Ozone air quality during the 2008 Beijing Olympics: effectiveness of emission restrictions, Atmos. Chem. Phys., 9, 5237–5251, https://doi.org/10.5194/acp-9-5237-2009, 2009.
Wang, Y. Q., Zhang, X. Y., and Draxler, R. R.: TrajStat: GIS-based software that uses various trajectory statistical analysis methods to identify potential sources from long-term air pollution measurement data, Environ. Modell. Softw., 24, 938–939, 2009.
Wang, Q. Z., Zhuang, G. S., Huang, K., Liu, T., Deng, C., Xu, J., Lin, Y., Guo, Z., Chen, Y., Fu, Q., Fu, J. S., and Chen, J.: Probing the severe haze pollution in three typical regions of China: Characteristics, sources and regional impacts, Atmos. Environ., 120, 76–88, 2015.
Wang, Y. Q., Zhang, Y., Schauer, J. J., de Foy, B., Guo, B., and Zhang, Y.: Relative impact of emissions controls and meteorology on air pollution mitigation associated with the Asia-Pacific Economic Cooperation (APEC) conference in Beijing, China, Sci. Total Environ., 571, 1467–1476, 2016.
Wang, Z. S., Li, Y. T., Chen, T. , Li, L., Liu, B., Zhang, D., Sun, F., Wei, Q., Jiang, L., and Pan, L.: Changes in atmospheric composition during the 2014 APEC conference in Beijing, J. Geophys. Res., 120, 12695–12707, https://doi.org/10.1002/2015jd023652, 2015.
West, J. J., Cohen, A., Dentener, F., Brunekreef, B., Zhu, T., Armstrong, B., Bell, M. L., Brauer, M., Carmichael, G., Costa, D. L., Dockery, D. W., Kleeman, M., Krzyzanowski, M., Künzli, N., Liousse, C., Lung, S. C., Martin, R. V., Pöschl, U., Pope, C. A., Roberts, J. M., Russell, A. G., and Wiedinmyer, C.: What We Breathe Impacts Our Health: Improving Understanding of the Link between Air Pollution and Health, Environ. Sci. Technol., 50, 4895–4904, 2016.
Xiao, Z. M., Zhang, Y. F., Hong, S. , Bi, X.-H., Jiao, L., Feng, Y.-C., and Wang, Y.-Q.: Estimation of the Main Factors Influencing Haze, Based on a Long-term Monitoring Campaign in Hangzhou, China, Aerosol Air Qual. Res., 11, 873–882, 2011.
Xu, W., Song, W., Zhang, Y., Liu, X., Zhang, L., Zhao, Y., Liu, D., Tang, A., Yang, D., Wang, D., Wen, Z., Pan, Y., Fowler, D., Collett Jr., J. L., Erisman, J. W., Goulding, K., Li, Y., and Zhang, F.: Air quality improvement in a megacity: implications from 2015 Beijing Parade Blue pollution control actions, Atmos. Chem. Phys., 17, 31–46, https://doi.org/10.5194/acp-17-31-2017, 2017.
Yarwood, G., Rao, S., Yocke, M., and Whitten, G. Z.: Updates to the Carbon Bond chemical mechanism: CB05, Final Report prepared for US EPA, 161 pp., 2005.
Zeng, Y. and Hopke, P. K.: A study of the sources of acid precipitation in Ontario, Canada, Atmos. Environ., 23, 1499–1509, 1989.
Zhang, Y., Cheng, S. H., Chen, Y. S., and Wang, W. X.: Application of MM5 in China: Model evaluation, seasonal variations, and sensitivity to horizontal grid resolutions, Atmos. Environ., 45, 3454–3465, 2011.
Zheng, B., Zhang, Q., Zhang, Y., He, K. B., Wang, K., Zheng, G. J., Duan, F. K., Ma, Y. L., and Kimoto, T.: Heterogeneous chemistry: a mechanism missing in current models to explain secondary inorganic aerosol formation during the January 2013 haze episode in North China, Atmos. Chem. Phys., 15, 2031–2049, https://doi.org/10.5194/acp-15-2031-2015, 2015.