the Creative Commons Attribution 4.0 License.
the Creative Commons Attribution 4.0 License.
 | 17 Jul 2019
H2SO4 and particle production in a photolytic flow reactor: chemical modeling, cluster thermodynamics and contamination issues
David R. Hanson
Hussein Abdullahi
Seakh Menheer
Joaquin Vences
Michael R. Alves
Joan Kunz
Size distributions of particles formed from sulfuric acid (H2SO4) and water vapor in a photolytic flow reactor (PhoFR) were measured with a nanoparticle mobility sizing system. Experiments with added ammonia and dimethylamine were also performed. H2SO4(g) was synthesized from HONO, sulfur dioxide and water vapor, initiating OH oxidation by HONO photolysis. Experiments were performed at 296 K over a range of sulfuric acid production levels and for 16 % to 82 % relative humidity. Measured distributions generally had a large-particle mode that was roughly lognormal; mean diameters ranged from 3 to 12 nm and widths (lnσ) were ∼0.3. Particle formation conditions were stable over many months. Addition of single-digit pmol mol−1 mixing ratios of dimethylamine led to very large increases in particle number density. Particles produced with ammonia, even at 2000 pmol mol−1, showed that NH3 is a much less effective nucleator than dimethylamine. A two-dimensional simulation of particle formation in PhoFR is also presented that starts with gas-phase photolytic production of H2SO4, followed by kinetic formation of molecular clusters and their decomposition, which is determined by their thermodynamics. Comparisons with model predictions of the experimental result's dependency on HONO and water vapor concentrations yield phenomenological cluster thermodynamics and help delineate the effects of potential contaminants. The added-base simulations and experimental results provide support for previously published dimethylamine–H2SO4 cluster thermodynamics and provide a phenomenological set of ammonia–sulfuric acid thermodynamics.
- Article
(2993 KB) - Full-text XML
-
Supplement
(6065 KB) - BibTeX
- EndNote


Particle formation in the atmosphere has long been studied (McMurry et al., 2005; Kulmala et al., 2004) to ascertain potential impacts on health (Nel, 2005) and on climate processes (IPCC, 2013). For example, nanoparticles (characterized as < 10 nm in diameter) can have special health effects, as their small size allows for efficient transport into lung tissue (Kreyling et al., 2006). They also influence climate by growing to sizes large enough to affect radiative forcing and the properties of clouds. Despite numerous and wide-ranging studies devoted to understanding new particle formation, mechanisms and nucleation rates applicable to many regions of the atmosphere remain uncertain.
Sulfuric-acid-driven nucleation is a prime source of nanoparticles in the atmosphere (Kuang et al., 2012; Sipilä et al., 2010); thus, it is the starting point for many laboratory studies. Previous work on particle nucleation in the binary (water–sulfuric acid) system (Kirkby et al., 2011; Ball et al., 1999; Zollner et al., 2012; Ehrhart et al., 2016; Yu et al., 2017) has concluded that binary nucleation can be significant at low temperatures, such as at high latitudes and in the upper troposphere. The sulfuric acid–water binary system also serves as an important baseline diagnostic for comparing experimental results. Finally, nanoparticle growth by sulfuric acid and water vapor, as well as the uptake of oxidized organic compounds by acidic nanoparticles, is of interest. Good knowledge of the formation and stability of binary nanoparticles is needed to understand their subsequent growth via other compounds.
Previous laboratory studies of nucleation in the binary system diverge widely, especially for results taken at or near room temperature, suggesting experimental details may significantly affect results. For example, does it matter if H2SO4 is provided by a bulk or a photolytic source? Does the type of photolytic precursor (O3, H2O2, H2O, etc.) matter (Sipilä et al., 2010; Berndt et al., 2008; Laaksonen et al., 2008)? The CLOUD experimental results at 278 K and below (Kürten et al., 2016; Ehrhart et al., 2015) have alleviated some of these concerns, yet room-temperature results can provide more stringent tests due to a greater sensitivity to thermodynamics. Other issues include (i) limitations imposed by particle detector characteristics, as well as cluster and particle wall losses (McMurry, 1983; Kürten et al., 2015, 2018), and (ii) determining the concentration of H2SO4 (Sipilä et al., 2010; Kürten et al., 2012; Young et al., 2008), which is typically uncertain to a factor of 2 (Eisele and Tanner, 1993), although higher accuracies (±33 %, Kürten et al., 2012) can be achieved. These experimental challenges can significantly influence results and their interpretation, yet these largely known issues can be addressed to some degree.
Contaminants are the biggest unknown factor in these types of experiments, and it is important to ascertain whether they are present at levels that can influence particle formation rates. If the contaminant is an amine, even a very low abundance can be a point of concern. For example, Zollner et al. (2012) argued that a 10−14 mixing ratio of methylamine could have affected their binary system measurements. Glasoe et al. (2015) presented data from the same apparatus as Zollner et al. (2012), and they carried this argument further and estimated that contaminant dimethylamine mixing ratios during their binary system measurements were less than or equal to 10−15. If the contaminant is NH3, however, it likely needs to reach the single-digit pmol mol−1 (pptv) level or higher to significantly interfere with measurements in the binary system at room temperature. Kirkby et al. (2011) and, more recently, Kürten et al. (2016) estimate ammonia contaminant levels of 4–10 pptv NH3 for their experiments performed at 292–298 K; it is not clear if this level of ammonia had a significant effect on their results. Recently, Yu et al. (2017) reported upper limits for NH3 and dimethylamine of 23 and 0.5 pptv, respectively, for their putative base-free nucleation experiments. Yet their nucleation rates are not extreme outliers, suggesting that their dimethylamine level was probably much lower than 0.5 pptv. Nonetheless, uncertainty introduced by undetectable (using state-of-the-art instruments) levels of contaminants underscores the need for multiple approaches for studying sulfuric acid nucleation.
Here we describe an apparatus and results from experiments regarding the formation of sulfuric acid nanoparticles from photolytically generated sulfuric acid vapor via OH+SO2 photochemistry initiated with HONO photolysis at ∼350–370 nm. Although nitrous acid is considered an important contributor to OH radical formation in many situations (Sörgel et al., 2011), little has been done to understand its photolysis, which leads to sulfuric acid formation and new particle formation. We also studied the effects of adding ammonia or dimethylamine; both are known to greatly enhance particle production rates (Almeida et al., 2013; Glasoe et al., 2015; Yu et al., 2012; Ortega et al., 2012; Nadykto and Yu, 2011). We present experimental results where temporary contamination of the apparatus was evident, yet long-term results indicate a relatively constant level of cleanliness in the experiment. The experimental results are compared to simulations of the flow reactor that couple the flow with photochemical kinetics and an acid–base particle formation scheme. In addition to providing H2SO4 concentrations, the model results and their comparison to experimental particle characteristics have led to phenomenological cluster-free energies for the ammonia–sulfuric acid system at 52 % relative humidity. Finally, we present a compendium of results from photolytic particle formation experiments near room temperature.
The photolytic flow reactor (PhoFR) is a vertically aligned cylindrical glass tube with an inner diameter of 5.0 cm, a length of ∼130 cm, a volume of approximately 2.5 L and topped with a 23 cm long conical glass piece with several flow inlets (Fig. 1a). In the course of this work, a Teflon screen was positioned between the cone and the flow reactor to calm the jetting from the inlets. A ∼105 cm length of PhoFR is jacketed and kept at a constant temperature, typically 296 K, by circulation of thermostated water. The main flow of gas was nitrogen from a liquid nitrogen gas pack, and the total flow rate was 2.9 sLpm (standard L min−1, 273 K and 1 atm). The flow contained small amounts of SO2 and HONO, typically 16 and 0.02 µmol mol−1 (ppmv), respectively, and up to several percent water vapor. Relative humidity was set by sending a portion of the flow over a heated water reservoir and then through a thermostated, vertically aligned tube that removed excess water vapor. Total pressure was slightly above ambient (∼0.98 atm). Gauge pressure was monitored continuously and it was typically 0.001 atm. The oxygen level from the liquid nitrogen, stated to be 10 ppmv or less, was apparently sufficient for the subsequent oxidation chemistry – noting few differences in particle size distributions upon adding several percent O2 to the flow. For all liquid nitrogen cylinder changeovers, the high-pressure side of the regulator is flushed several times before exposing the lines to the new supply of gas – a standard procedure used by Ball et al. (1999), Zollner et al. (2012) and Glasoe et al. (2015) Also keeping in line with that past work, filters have not been used on any gas supply lines.
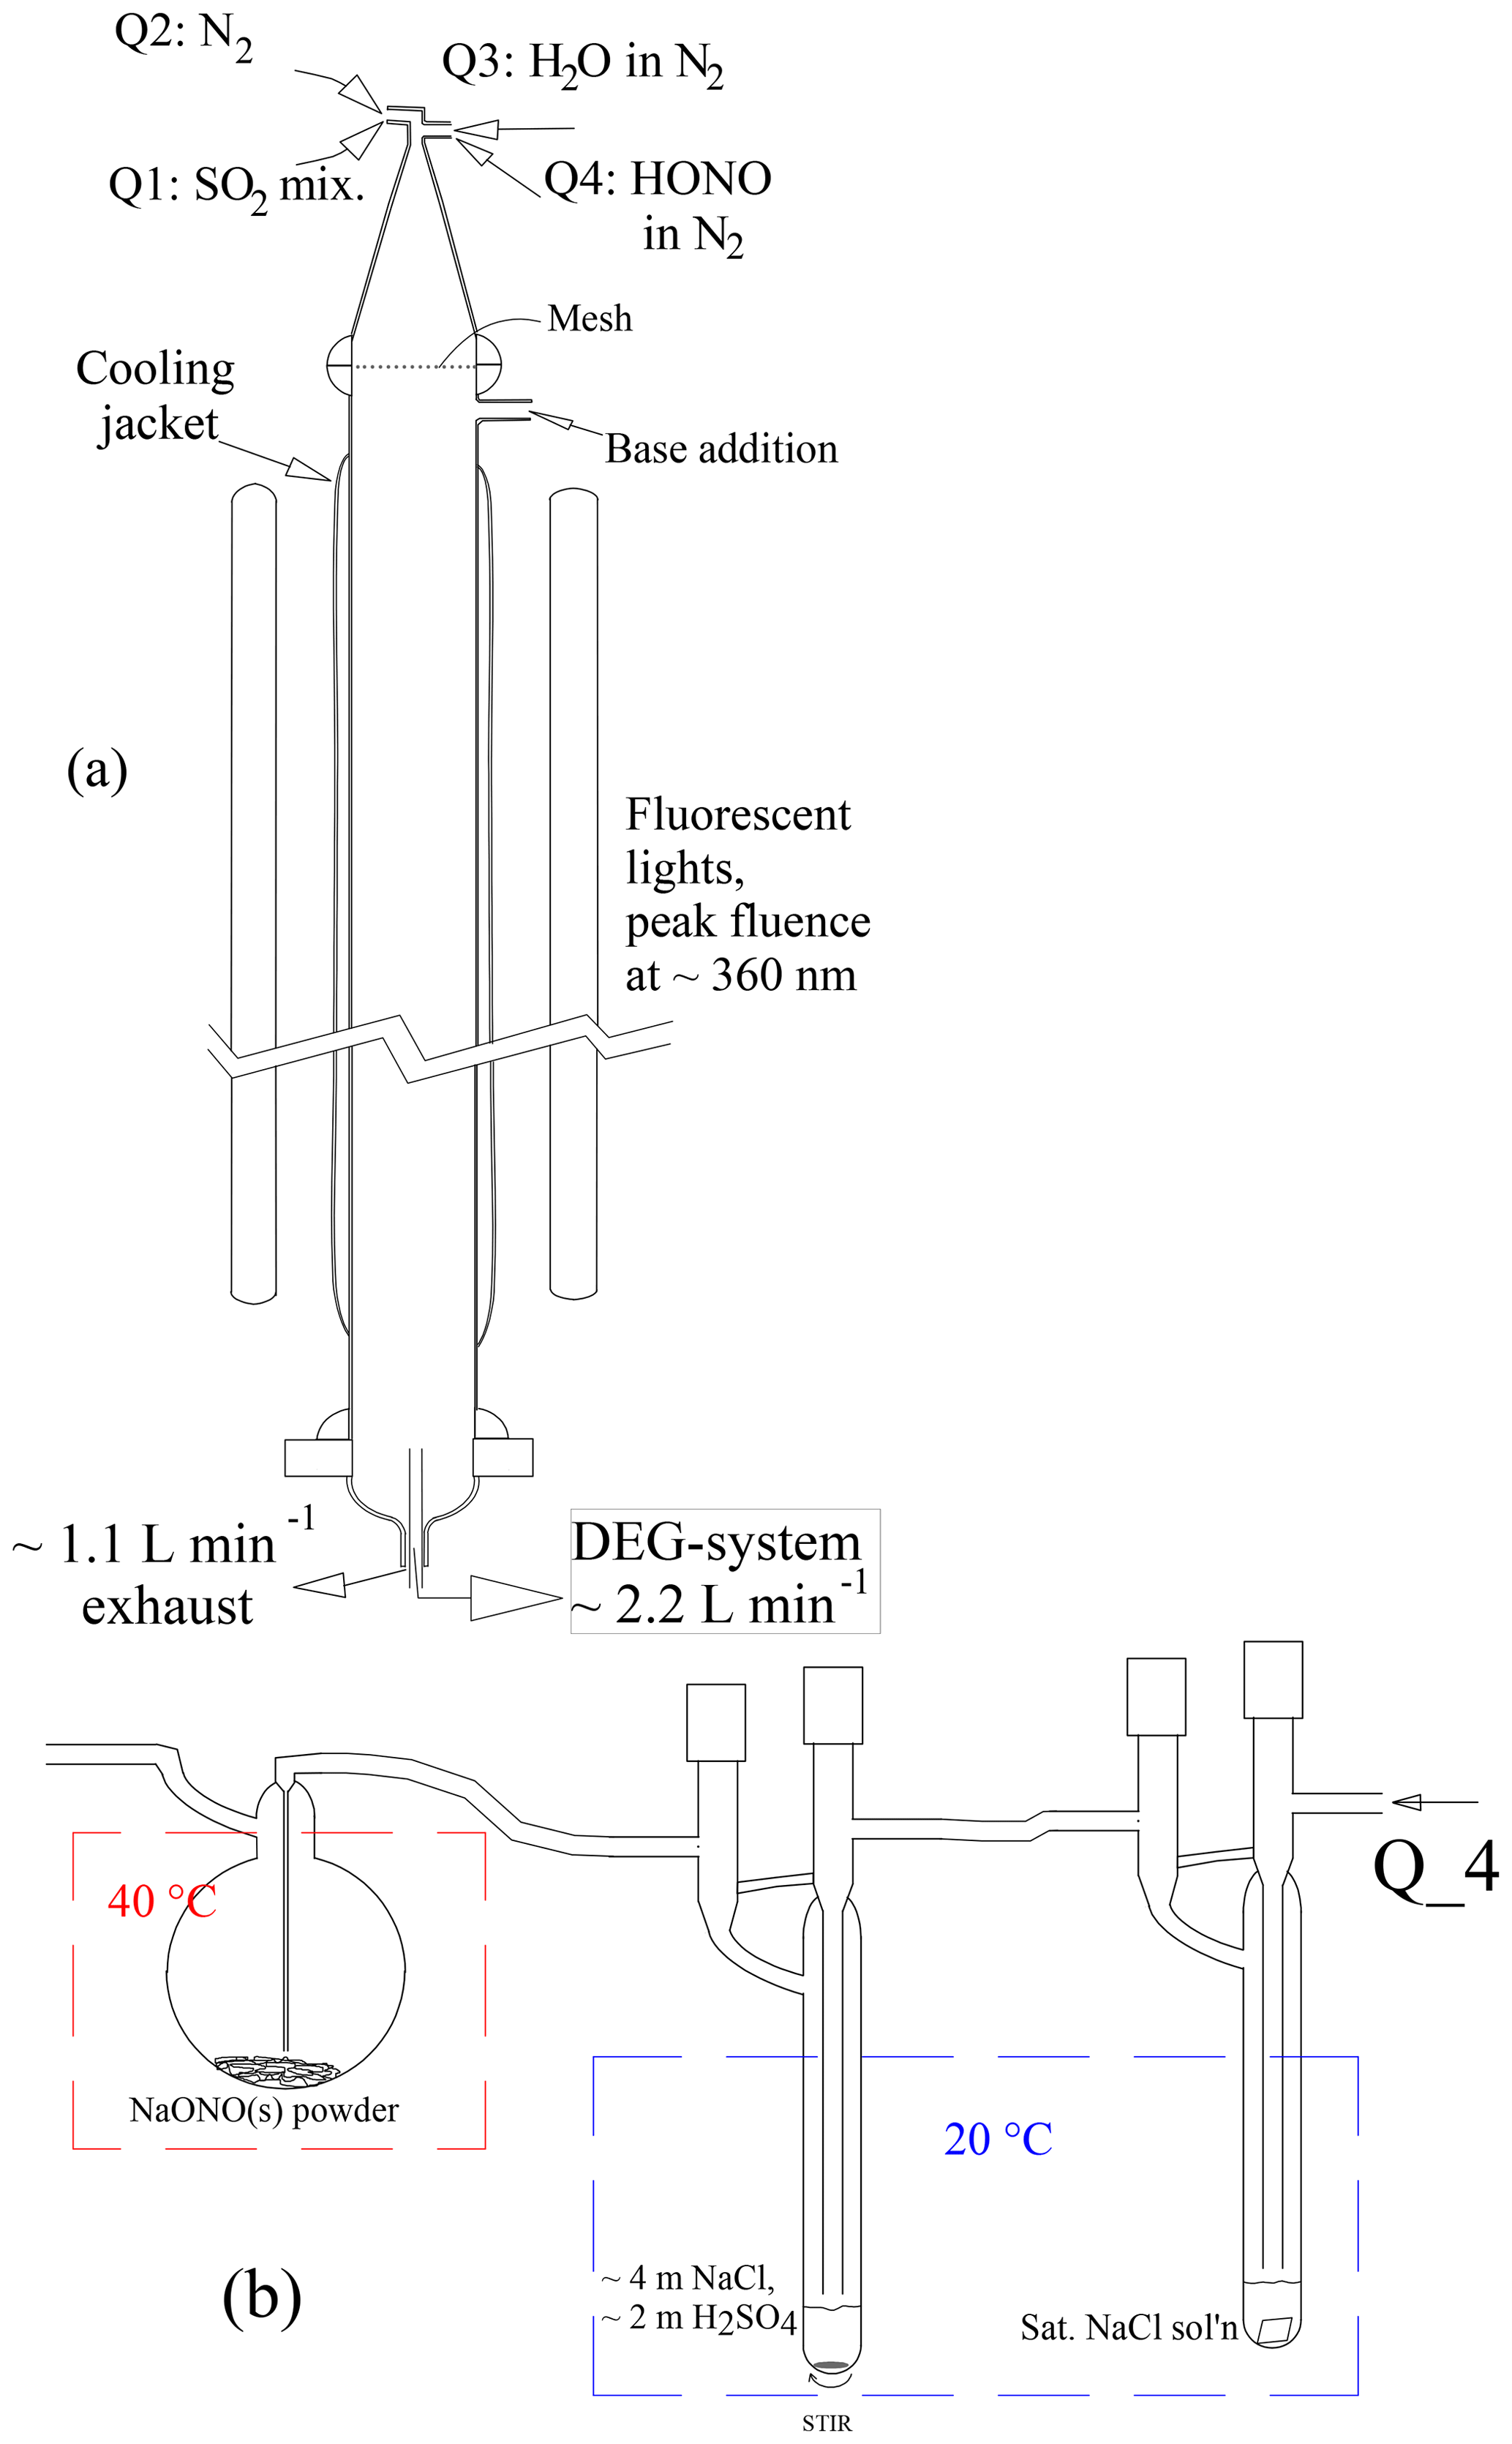
Figure 1(a) PhoFR schematic and (b) HONO source. The average flow velocity of 2.8 cm s−1 yields an average residence time in PhoFR of approximately 45 s. The concentrations listed in (b) are in molal (mol per kg H2O)
Entering gas flows were monitored and set by mass flow meters under computer control. Typical flows for baseline conditions in sLpm or sccm (standard cm3 min−1, 273 K, 1 atm) were dry gas at 1.4 sLpm, fully humidified air at 1.5 sLpm, HONO-laden (∼15 ppmv) N2 flow at 4.2 sccm and SO2-laden flow at 32 sccm (1500 ppmv SO2 in N2). These baseline conditions help diagnose the long-term stability of the system. The baseline number densities of SO2 and HONO in the flow reactor (accounting for dynamic dilution) are 4×10¹⁴ and 5.2×1011 cm−3, respectively. Three sections were not insulated or thermoregulated: (i) the conical top section, (ii) the top 10 cm of the flow reactor where the base-addition port resides and (iii) the bottom 20 cm where aerosol was sampled. The fully humidified line and the port where it enters the cone were gently heated (298–300 K) to eliminate condensation when room temperature was less than 296 K.
The SO2-in-N2 mixture (Minneapolis Oxygen) was reported (Liquid Technologies Corporation, EPA Protocol) to contain 1500 ppmv SO2 ±10 %. Water vapor was taken from a gently heated ∼500 mL volume of deionized water (Millipore) that also contained a few grams of concentrated sulfuric acid to suppress potential base contamination from the bulk water. This humidified flow then passed through 80 cm of vertically aligned Teflon tubing (∼6.2 mm ID) held at the temperature of the flow reactor.
Photolyte HONO was continuously produced (Febo et al., 1995) by flowing nitrogen laden with ∼15 ppmv HCl vapor into a small (25 mL) round-bottomed flask containing 1–2 g of powdered NaONO held at 40–50 ∘C (Fig. 1b). HONO vapor and coproduct NaCl are produced in a classic double-displacement reaction. The powder could be very slowly mixed with a small (1 cm long) stir bar, and results generally did not depend on whether the powder was stirred. Periodic gentle shaking of the flask usually led to only temporary changes in particle number densities.
The HONO level exiting the generator is likely to be equal to the HCl level entering it. The HCl generator and a water vapor pre-saturator were typically temperature-controlled at 20 ∘C. A saturated (∼6 m, molal) NaCl aqueous solution in the pre-saturator yields a relative humidity of 76 % in the flow: a stable amount of water vapor stabilizes the solution in the HCl generator, which contains a solution with a 2-to-1 mole ratio for NaCl to H2SO4. The HCl generator solution was prepared initially with concentrations of 3.5 m NaCl and 1.75 m H2SO4, and calculations (Wexler and Clegg, 2002; Friese and Ebel, 2010) result in an HCl vapor pressure of atm. UV absorption measurements to determine the HONO level in this flow are described in the Supplement (S5.1), and the results indicate that the source has a HONO level of about atm. This suggests that the HCl generator's HCl vapor pressure is slightly larger than the calculated value. While the water vapor pre-saturator minimized loss of water from the HCl generator, small temperature differences between these two vessels can introduce variability and possibly a bias.
Four black lights that have a UVA spectral irradiance centered at 360 nm illuminated about a 115 cm length of the jacketed flow reactor from a distance of about 15 cm from the reactor center. An estimate of the fluence (5×10¹⁵ photon cm−2 s−1) indicates a photolysis rate coefficient of approximately 10−3 s−1 for HONO. Experiments are described in the Supplement (S5.2) where production of methyl vinyl ketone and methacrolein from the oxidation of isoprene were monitored, yielding (together with the 15 ppmv HONO level in the source flow) a HONO photolysis rate coefficient of s−1.
H2SO4 is formed via (i) OH produced via HONO photolysis, (ii) OH addition to SO2, (iii) H-atom abstraction by O2 and (iv) reaction of SO3 with H2O molecules (Lovejoy et al., 1996). The HO2 and NO radicals generated in this process can react together and generate an additional OH radical. When SO2 is present at a few parts-per-million by volume, the dominant loss for OH is OH+SO2 and a pseudo-first-order loss rate coefficient is given by [SO2] × cm cm3 s s−1. With this SO2 baseline level, OH reacts with HONO for typical conditions only about 1 % of the time. The OH first-order loss rate coefficient is ∼3 s−1 from [HONO] × cm cm3 s−1. Yet at low SO2 levels, loss of OH due to reaction with HONO can be significant.
H2SO4 levels build as the flow moves down the reactor, forming H2SO4 molecular clusters, and these clusters grow into stable particles. These particles accumulate enough material, primarily H2SO4 and H2O, to grow to several nanometers in diameter. Growth due to OH or HO2 uptake, followed by reaction with absorbed SO2, may also contribute to growth.
Particles were sampled on-axis at the exit of the flow reactor, about 120 cm from the conical inlet, with a custom-built mobility-sizing and counter system designed for nanometer-sized particles. Briefly, size-classified particles (Am241 charger and a TSI 3085 Nano DMA) were detected with a diethylene glycol (DEG)-sheathed condensation particle counter (CPC) in tandem with a butanol-based CPC (Jiang et al., 2011). This system is denoted “DEG system” in this study. The DEG CPC was operated with a saturator temperature of 57 ∘C, a condenser temperature of 20 ∘C, 0.36 L min−1 condenser flow and 0.07 L min−1 capillary flow. The Nano DMA was operated with 2 L min−1 aerosol-in and monodispersed-out flows and a 13 L min−1 sheath flow, as in Glasoe et al. (2015).
For a few experiments, ammonia or dimethylamine was added through a port at the top of the flow reactor as trace gases. A discussion of their mixing into the main flow is presented in the Supplement (S7.1). Their sources were permeation tubes, and 100 hundreds or single-digit parts-per-trillion by volume levels could be set by either a single- or a double-stage dynamic dilution system, respectively (Freshour et al., 2014; Glasoe et al., 2015). Ammonia was used in the single-dilution system and dimethylamine was dedicated for use in the double-dilution system. Permeation rates were determined periodically by redirecting the base-laden flow through an acidic solution and monitoring the change in pH over time (Freshour et al., 2014).
Model
The two-dimensional model of the flow reactor incorporating the photochemical kinetics of H2SO4 formation was built on a previous model of acid–base molecular cluster formation, which was fully corroborated against a commercial computational fluid dynamics simulation (Hanson et al., 2017). The flow profile can be set to either plug or fully developed laminar, the formation of clusters with up to 10 H2SO4 and 10 base molecules can be simulated. If so desired, clusters larger than 10 H2SO4 molecules can be simulated using a growth-only mechanism. Note that clusters without a base molecule represent a weighted average of the binary H2SO4–H2O thermodynamics for a given relative humidity. The detailed photochemistry in our experiment includes the production of OH and its reactions with SO2, as well as with HO2, NO, NO2, HONO, HNO3, H2O2, etc. The rate coefficients and mechanisms are presented in the Supplement (S7, Table S1). The acid and base species and all molecular clusters, as well as OH, are lost to the walls limited only by diffusion.
The model reacts, convects, and diffuses all reactants and products and yields the abundance of H2SO4 and its molecular clusters; the largest clusters are then correlated to the abundance of experimentally determined particles (Panta et al., 2012; Hanson et al., 2017). Coagulation was not implemented because cluster–cluster interactions are not significant for most of the conditions of the present work. Water molecules are not explicitly tracked, but hydration is taken into account when calculating the collisional rate coefficient and the size of the clusters, assuming bulk properties. Increases in computational times can be significant when large clusters are simulated using the growth-only mode, e.g., a factor of 8 for adding clusters up to 250 H2SO4 molecules, compared to stopping growth at the 10 acid and 3 base cluster. Yet it is desirable to simulate very large clusters via uptake of H2SO4, assuming no loss, to compare results to measured size distributions. Further analysis of cluster growth and loss processes, including growth only for clusters larger than 10 H2SO4 molecules, is presented in the Supplement (S1.3).
Ammonia or dimethylamine could be included at a trace level with the flow entering the simulated reactor, whereupon acid–base clustering and particle formation commence (note that base is lost to the wall, limited by diffusion). The model assumes rapid mixing of base into the main flow. Justification for this is presented in the Supplement (S7.1). The photochemistry is described in detail in the Supplement (S7), and the acid–base clustering reactions are described in detail in Hanson et al. (2017) along with thermodynamic schemes for clusters of the bases with sulfuric acid. Scheme DMA_I from that work was used here, while a new cluster thermodynamics scheme for the ammonia-added experiments was developed for NH3–H2SO4 clusters at 52 % relative humidity (see Supplement S8).
3.1 Particle formation evaluation
The stability of particle formation conditions over several months is demonstrated by presenting the number and the average size of particles for baseline conditions. In the next section, the modeled photochemistry for baseline conditions is presented to provide baseline sulfuric acid concentrations within PhoFR and we discuss how the size distributions were analyzed. In subsequent sections, these analytical devices will be applied to the results of experiments where reactant levels were varied. In the Supplement (S1.0) there is a typical time series of the raw data (the count rates for each channel) and a table with the overall correction factors.
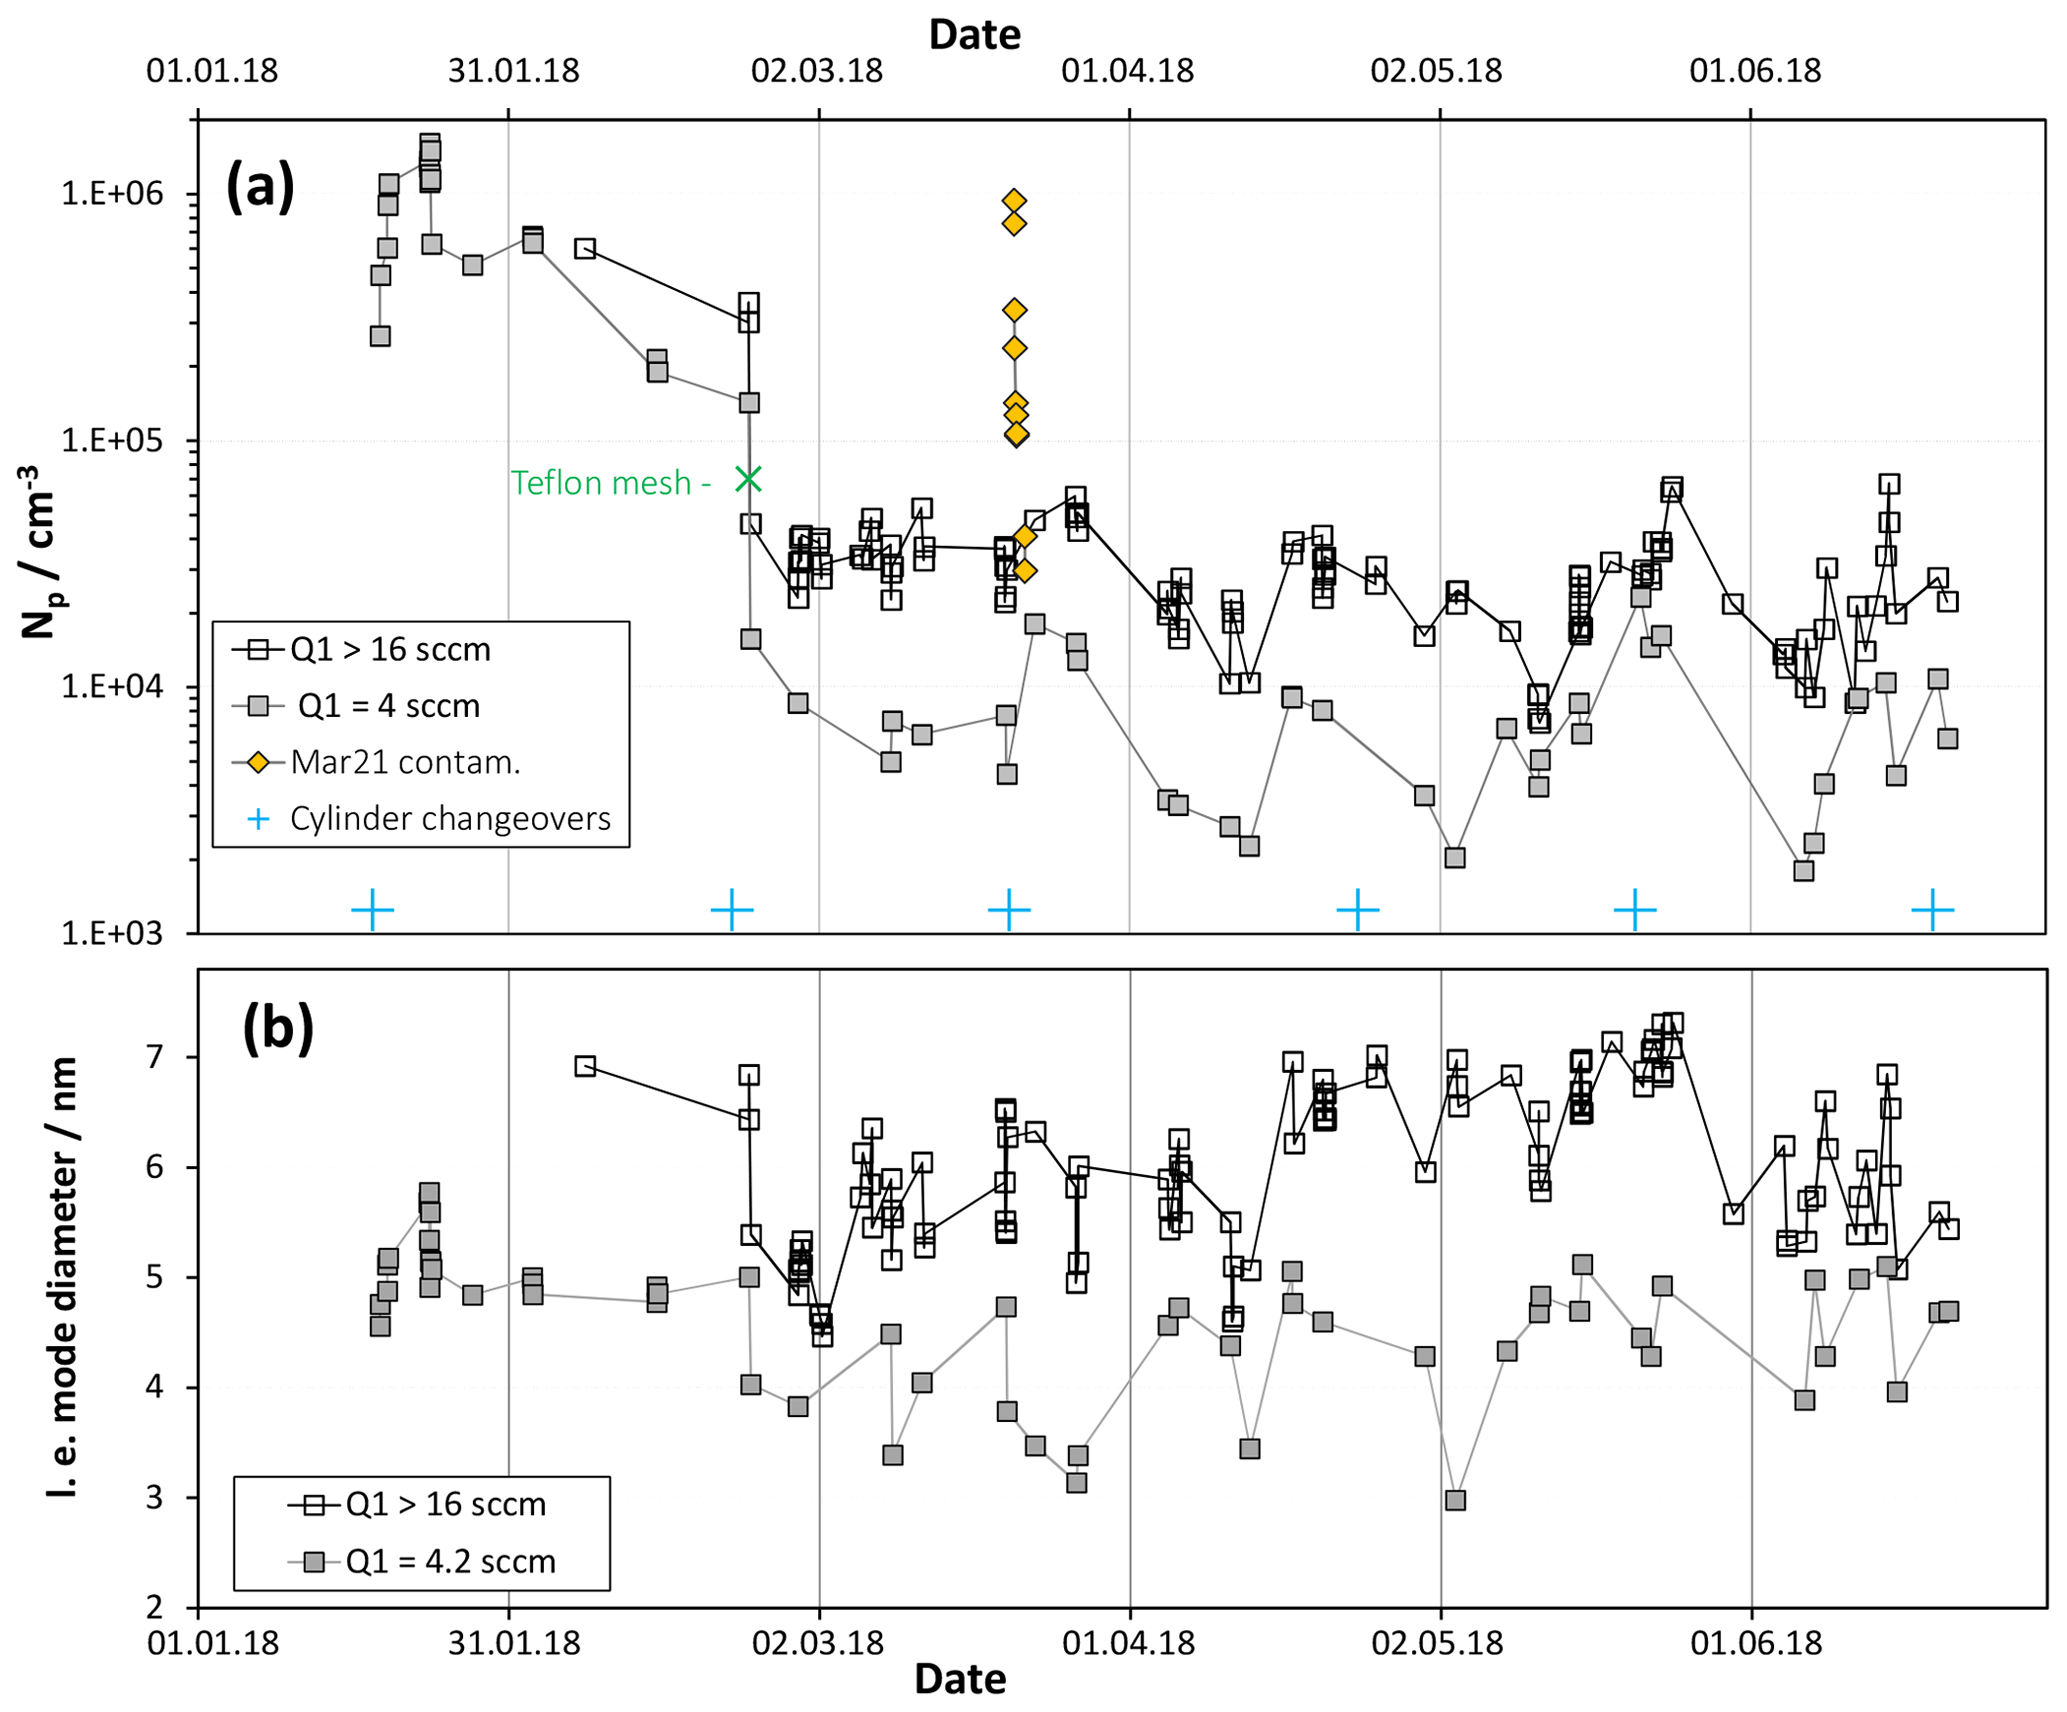
Figure 2(a) Number of large particles for baseline HONO (Q4=4.2 sccm: [HONO] = 5×1011 cm−3) plotted vs. time for two different SO2 levels, equivalent to 2 and > 8 ppmv. Data on 21 and 22 March are shown as the yellow diamonds and are for low SO2 conditions. Np is severely elevated due to a suspected dust contaminant. (b) Leading-edge (l.e.) mode diameters plotted vs. time also binned by SO2 level.
Shown in Fig. 2 are (a) the total particle number density, Np and (b) so-called “leading-edge” (see S1.1 in the Supplement) mode diameters over a 6-month period for baseline conditions: 52 % relative humidity (RH), 296 K, a total flow of 2.9 sLpm and a flow of N2 through the HONO source, Q4, of 4.2 sccm. The data were binned according to the flow of the SO2 mixture, Q1, either 4 sccm or > 16 sccm. The abundance of HONO is 20 ppbv and SO2 is either 2 ppmv or > 8 ppmv. Shown in the Supplement (S1.2) are representative particle size distributions, corrected for size-dependent diffusion losses in CPC transport and inlet lines. Np was determined by summing the particle concentrations with Dp of ∼2.4 nm and larger because the two smallest diameter concentrations are the local minimum for most of the size distributions. Furthermore, these small diameter data can have large random uncertainties due to large corrections applied to low count rates. Discussed in the Supplement (S4) are possible sources of the scatter in the data.
Note the data presented as gold diamonds: these are Np (low SO2) on the day of and the day after a gas supply cylinder changeover. This event could be due to entrainment of dust particles into the supply lines. Nothing like this happened on the five other cylinder changeovers that occurred during this time interval. What is different about this cylinder exchange is not known. The effects are temporary as a 90 % decrease in Np occurred in a few hours, an additional 70 % drop occurred overnight and a day later Np is within the upper range of the scatter for baseline conditions.
The measured size distributions are governed by the interplay between the spatial distributions of [H2SO4] and the added-base or potential contaminant species. For example, small-sized and midsized particles probably form somewhat downstream of the top of the reactor whereas the largest particles at the leading edge of the distributions are formed near the top of the reactor. The largest particles must originate at the top of the reactor, having the highest overall exposure to H2SO4. These so-called leading-edge particles are the focus of our analysis.
The leading-edge particles are greatly enhanced when base was added, regardless of whether this was ammonia or dimethylamine. In these cases, the leading-edge particles are prominent in the distributions and are described by lognormals (see the distributions presented below). The leading-edge volume–mean diameters for the added-base experiments are similar to those of the no-added-base distributions. So we propose that the leading-edge particles are indicative of the nucleation conditions at the top of PhoFR. In the Supplement (S1.1) there is more discussion of the leading-edge mode of the particle size distributions and supporting results from the simulation (Supplement S1.2: plots of modeled distributions with and without added NH3).
The high SO2 data (Fig. 2a) exhibit an Np that averaged about 2×104 cm−3 since late February; also, the leading edge of the size distributions (Fig. 2b), fit to lognormal functions, indicates mode diameters of about 6 nm with lnσ values of ∼0.35. The large drop in Np on 23 February is due to a Teflon mesh (ultrasonically cleaned and soaked overnight in a dilute sulfuric acid solution) placed between the cone and the flow reactor. The edges of the Teflon mesh fit in the gap of the glass joint without disturbing the Teflon-encapsulated O-ring. The mesh was installed because flow visualization experiments, similar to those described in Ball et al. (1999), revealed extensive back-streaming into the cone. Back-streaming can carry H2SO4 from the illuminated section into the cone to initiate nucleation there. With the Teflon mesh in place, a trend in Np with time cannot be discerned in Fig. 2a. Similarly, leading-edge mode diameters indicate that Dle is roughly constant over the time period 24 February to 20 June (Fig. 2b).
While the effects on Np (Fig. 2a) due to the addition of the mesh are large, the effects on mode diameter are less pronounced. On the other hand, there is a 5-week period beginning in the middle of April 2018 that has mode diameters about 1 nm larger than those during the preceding and following time periods. What was different about this time period is not known; however, potential changes in flow patterns and variations in room temperature are potential explanations.
Since changes in Dle are small or negligible, the growth conditions in PhoFR must be stable during this 5-month time period. The cumulative exposure of particles to H2SO4 as they travel down PhoFR is constant, indicating that the UV flux and reactant concentrations are as well. The overall stability in Np during this time also indicates that the purity of the system is stable. Variations in Np might have been influenced by changes in potential contaminants, yet the HCl source for the HONO generator is temperature-sensitive and flow patterns can be influenced by temperature variations in the non-thermoregulated sections of the flow reactor. An expected increase in cleanliness over time, due to acid building up on surfaces and binding potential base-emitting contaminants, is not exhibited in the data.

Figure 3Model simulation for [HONO] = 5.2×1011 cm−3, [SO2] = 4×1014 cm−3 and no base. Concentrations of NO through H2SO4 are plotted on the left axis. Concentrations of OH and the (H2SO4)2 and (H2SO4)10 clusters are plotted on the right axis. These simulations are equivalent to experimental conditions of Q4=4.2 sccm and Q1=32 sccm. The illuminated section is from 0 to 110 cm. At 110 cm HONO photolysis ceases and [OH] (right axis) drops to a level supplied primarily by HO2+ NO (a reaction between HO2 and SO2 was included; see Sect. 3.2.4).
Simulated reactant distributions
Shown in Fig. 3 are simulated centerline concentrations of the gas-phase species and two molecular clusters in order of abundance at the end of the reactor on the left axis (H2SO4, NO2, NO, HO2, H2O2, HO2NO2 and NH3) and on the right axis (OH, (H2SO4)2 and 103 times the (H2SO4)10 cluster abundance). This simulation was performed with [HONO] = 5.2×1011 cm−3, simulating an experiment with Q4=4.2 sccm. These conditions are close to those for the data depicted in Fig. 2 with the simulation being strictly binary nucleation.
Sulfuric acid rises steadily and reaches 1.2×1010 cm−3 by the end of the illuminated section that extends from 0 to 110 cm. The downstream section of the reactor with the highest sulfuric acid level is where particles achieve most of their growth: over the bottom two-thirds of PhoFR, an axial distance of 40 to 125 cm, [H2SO4] averages about 8×109 cm−3. We partition the reactor into the top third and the bottom two-thirds. Although somewhat arbitrary, it provides a point of view for discussing the experimental results. Furthermore, this point of view is congruent with the experimental finding that a large-particle mode at the leading edge of the size distributions is discernible, especially when base was added. So although clusters are formed and particles are nucleated along the length of the reactor, we seek to explain only the largest of them.
With this perspective, we can calculate bulk properties from the growth of the leading-edge particles due to their accumulating H2SO4 and H2O (assuming no evaporation) as they traverse the bottom two-thirds of the flow reactor. Using centerline values, an increase in particle diameter of 4.8 nm is estimated as they travel from 40 to 125 cm, using the bulk approximation to calculate the increase in diameter (Verheggen and Mozurkewich, 2002; Wexler and Clegg, 2002). This is in accord with the leading-edge mode diameters in Fig. 2b of about 6 nm, considering that nascent particles are roughly 1.3 nm in diameter, using bulk properties for the four-acid cluster, assuming it is large enough for evaporation to be negligible. There is also a 0.3 nm difference between mobility and volume–mass diameters (Larriba et al., 2010). Thus, modeled H2SO4 on-axis concentrations and residence time, along with the assumption of bulk properties for the small particles, are an adequate starting point for discussing growth in this experiment.
Growth was also explored with the model, and simulated particle size distributions (Supplement S1.3, Fig. S7.1) are consistent with the growth calculation in the preceding paragraph. The simulated clusters were grown to hundreds of H2SO4 molecules using growth only for clusters larger than 10 H2SO4 molecules. The added-ammonia simulations show a Dle of about 4 nm (Fig. S1.3.1b) and 6 nm (Fig. S7.1) for Q4=2.1 and 4.2 sccm, respectively. These mode diameters are consistent with the bulk-property growth analysis.
The added-base simulations also provide information on nucleation near the top of the reactor. The axial distribution of critical clusters, assumed to contain 4 H2SO4 molecules, and those that are just larger reach a steady state by about 40 cm (Fig. S1.3.2), while very few of the 20 and larger H2SO4 clusters have formed at this point. Nucleation in the top third of the flow reactor is important and heavily influences the large-particle mode when base is present. Downstream regions contribute midsized particles that influence the shape of the simulated particle size distributions; this can be seen in binary, added-dimethylamine and added-ammonia simulations that are compared in Fig. S1.3.1c. Nonetheless, these simulations support a partitioning of the reactor as a rhetorical tool for discussing the results and for drawing broad conclusions about the presence of contaminants in this region.
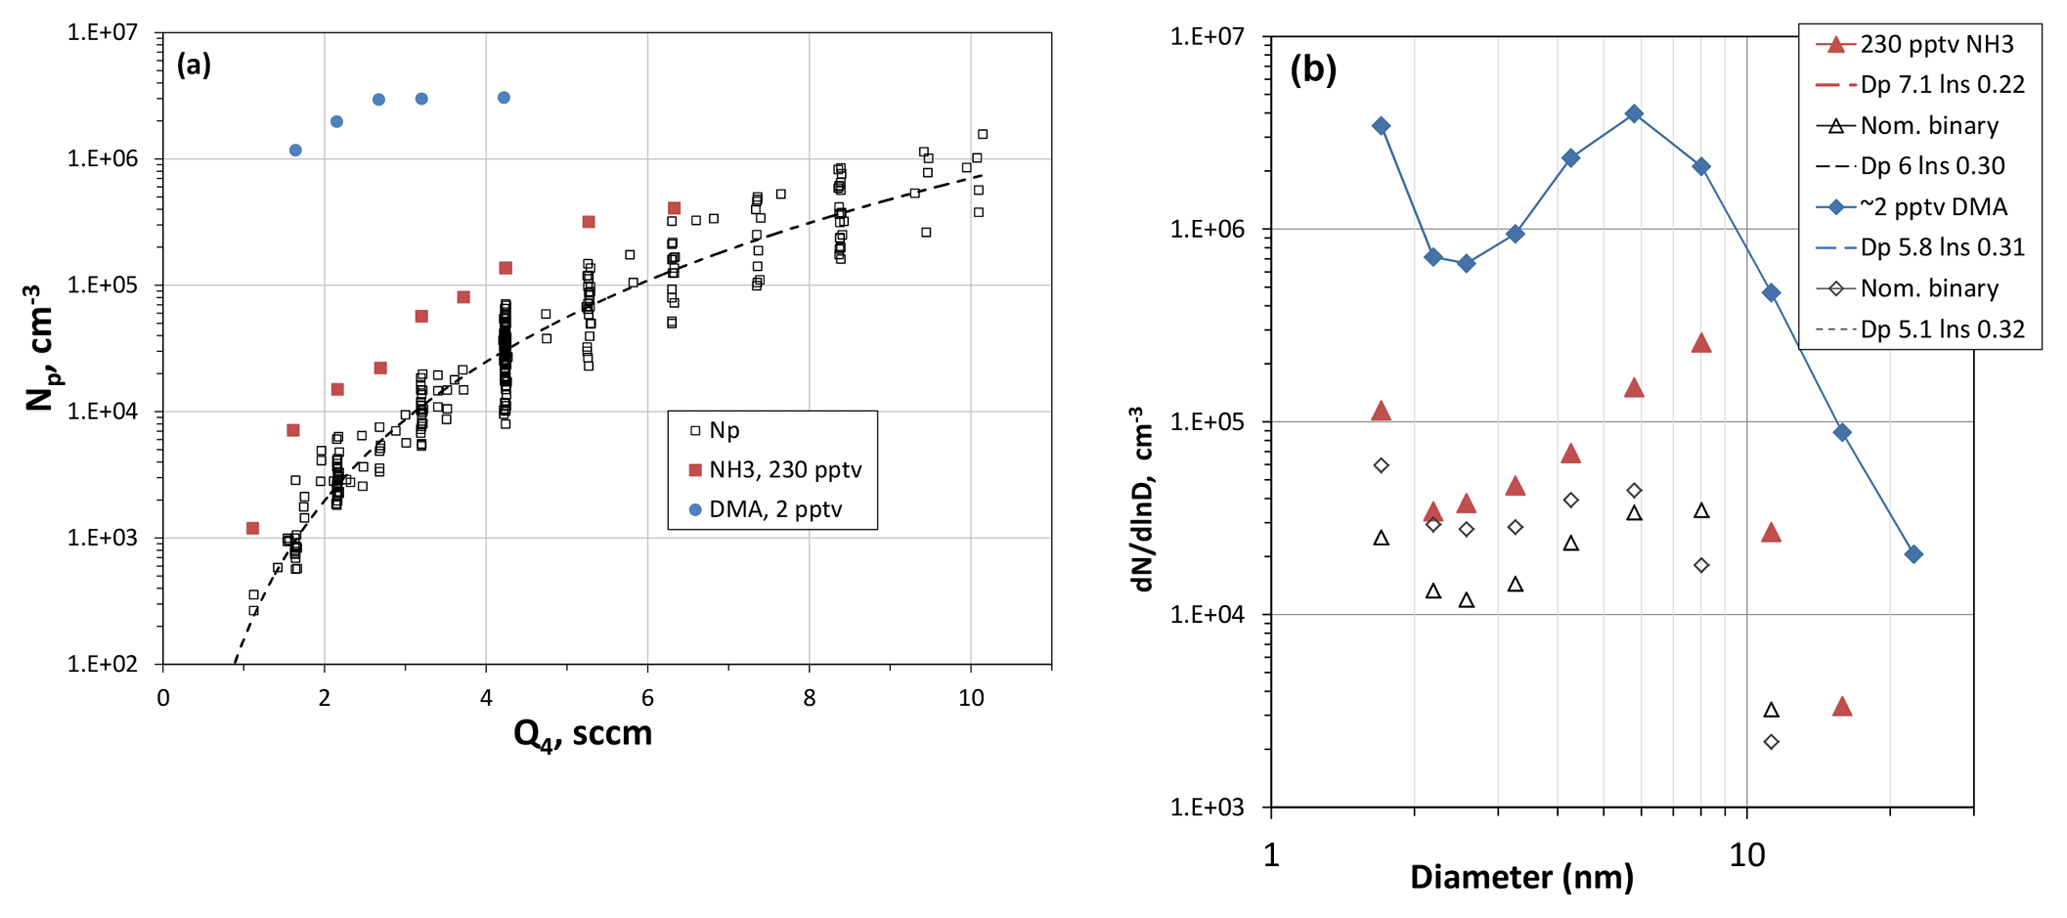
Figure 4(a) Number of large particles as a function of Q4, the HONO-laden flow rate. RH was 52 %, T=296 K and [SO2] > 2.5×1014 cm−3 (10 ppmv). For reference, Q4=4.2 sccm results in a modeled value of cm−3 for H2SO4 at Z=35 cm and R=0. Added-base experimental results are shown as the blue circles (dimethylamine) and red squares (ammonia). (b) Size distributions showing the effect of added NH3 (red triangles) and added dimethylamine (blue diamonds). Nominal binary distributions for those runs are also shown. The lognormal distributions are also shown (dashed lines) and the legend indicates the mode diameter and lnσ in that order.
3.2 Variation in Np with reactant
3.2.1 Dependence on HONO
Shown in Fig. 4a are Np vs. Q4, i.e., the flow through the HONO source, while the other reactants were held constant: 296 K, 52 % RH and SO2 at 8 ppmv or higher. The data are primarily measurements without added base (black squares), but the results from two runs where base was added are also shown. Figure 4b shows typical size distributions for measurements at Q4=4.2 sccm for experiments with and without added base. Several more representative size distributions as a function of Q4 are shown in the Supplement (S1.2).
The N2 flow through the HONO source, Q4, is a proxy for HONO abundance and thus sulfuric acid. The variation in the volume–mean diameter of the leading-edge mode with Q4 is presented in the Supplement (Fig. S1.2.2), and particle size scales approximately linearly with Q4. This suggests that particles are exposed to linearly increasing amounts of H2SO4 over this range of Q4. These data support the Q4-as-proxy notion that H2SO4 levels are proportional to the HONO concentration in PhoFR, which is set by the nitrogen flow (Q4) through the HONO source.
The nominally binary Np has a power dependence on Q4 of about 4 (dashed line), which is also the case for the NH3-added (230 pptv) data. For ammonia added at this level there is only a modest effect on Np, a qualitative finding that is not congruent with recent experimental work (Kürten et al., 2016; Glasoe et al., 2015). For added dimethylamine at ∼2 pptv, however, there is a large effect on Np and on its dependence on Q4, consistent with other experimental work (e.g., Glasoe et al., 2015; Almeida et al., 2013). More results and discussion of the added-base experiments are presented below.
A power dependence of 5 for Np on H2SO4 was exhibited for the H2SO4–H2O binary system (Zollner et al., 2012) which is somewhat larger than that exhibited in Fig. 4b; other bulk experiments have power dependencies on H2SO4 that range up to ∼20 (Wyslouzil et al., 1991; Viisanen et al., 1997). Yet the CLOUD experiment (Kürten et al., 2016), also with photolytic generation of H2SO4, shows a power dependency of 3.7 at 292 K for [H2SO4] concentrations from 3×10⁸ to 1.5×109 cm−3. An ammonia-contaminant abundance of 4 pptv was stated to apply to those results. Experimental results (Glasoe et al., 2015; Almeida et al., 2013) indicate power dependencies on H2SO4 are significantly affected when a base is present, corroborating the assertion that our nominally pure results were affected by the presence of an impurity base compound.
3.2.2 Effects of added ammonia and dimethylamine
When base was added to PhoFR, its mixing ratio was calculated assuming it has fully mixed and there is no loss to the wall. There is wall loss in the experiment and mixing of the base into the main flow takes an amount of time. Nonetheless, these mixing ratios are convenient for discussion and they are directly linked to the flow of added base. Care needs to be taken using these mixing ratios when comparing the results with simulations and other experiments. See the Supplement (S3.1 and S7.1) for more on base mixing into the flow.
With data for nominally clean conditions for comparison, the effect of 230 pptv NH3 on the large particle abundance is significant in Fig. 4a by about a factor of 5, a factor that does not significantly depend on the level of HONO and thus H2SO4 present in the flow reactor. The experimental size distributions (e.g., red triangles in Fig. 4b) reveal a more distinct and larger leading-edge mode than the nominally pure data. Plots of Dle as HONO were varied and are presented in the Supplement (S3.1), and the effect of added NH3 is a ∼20 % increase in Dle. The shift in the distributions to slightly larger sizes is due to enhanced particle formation in the top third of the flow reactor, shifting the peak nucleation rates upstream compared to those in the absence of added NH3. This is supported by the simulated size distributions shown in the Supplement (S1.3), where the leading edge of the size distributions becomes more distinct when ammonia is added to the simulations (Fig. S1.3.1).
Previous work has shown large increases in Np when ammonia was added to a (nominally clean) binary sulfuric acid–water nucleating system. At H2SO4 concentrations of a few times 109 cm−3, Ball et al. (1999), Zollner et al. (2012), and Glasoe et al. (2015) observed factors of 10-to-1000, ∼1000, and 106 for ammonia levels of a few parts-per-trillion by volume, 25, and 55 pptv, respectively. Also, Kürten et al. (2016) showed that particle production in the CLOUD experiment increased by about a factor of 100 upon addition of several hundred parts-per-trillion by volume NH3 at 292 K and [H2SO4] of 1.5–2.2×108 cm−3; this factor may have been even larger if the nominally binary system was not affected by a purported 4 pptv ammonia contaminant. We think that the presence of a contaminant in our nominally pure measurements is responsible for the low enhancement factors in particle numbers when hundreds of parts-per-trillion by volume of NH3 are added. There will be more discussion on this below.
Dimethylamine addition at 2 pptv ( %) had a large effect on the number of particles (blue circles, Fig. 4a) and even the smallest particles (mobility diameter of 1.7 nm) increased by about 2 orders of magnitude (Fig. 4b). Nonetheless, the leading edge of the distributions is clearly the dominant mode for these conditions. It is interesting that the shape of the distributions is similar to the nominally binary cases (unfilled diamonds, Fig. 4b). The Supplement (S3.2) presents additional measured size distributions for the dimethylamine-added experiments.
It is notable that Np is not particularly sensitive to H2SO4 above Q4=2.7 sccm. Model results also indicate a leveling off in the calculated Np as Q4 increases (see Sect. 3.3 below), which appears to be due to scavenging of the amine by particles. Nonetheless, it appears that the potential contaminant for the nominally binary experiments is a much less effective nucleator than dimethylamine is at a level of 2 pptv.
Since effects due to adding dimethylamine at the single-digit parts-per-trillion by volume level are large, it would be desirable to experimentally investigate amine additions at lower levels. With the current dynamic dilution system, base addition at levels lower than a few parts-per-trillion by volume are swamped by the precision uncertainty in the flow meter readings. More results from these types of experiments await further improvement in the dimethylamine delivery system. Another alternative is exploring conditions where nucleation is expected to slow, such as at low Q4 and/or at temperatures warmer than 296 K.
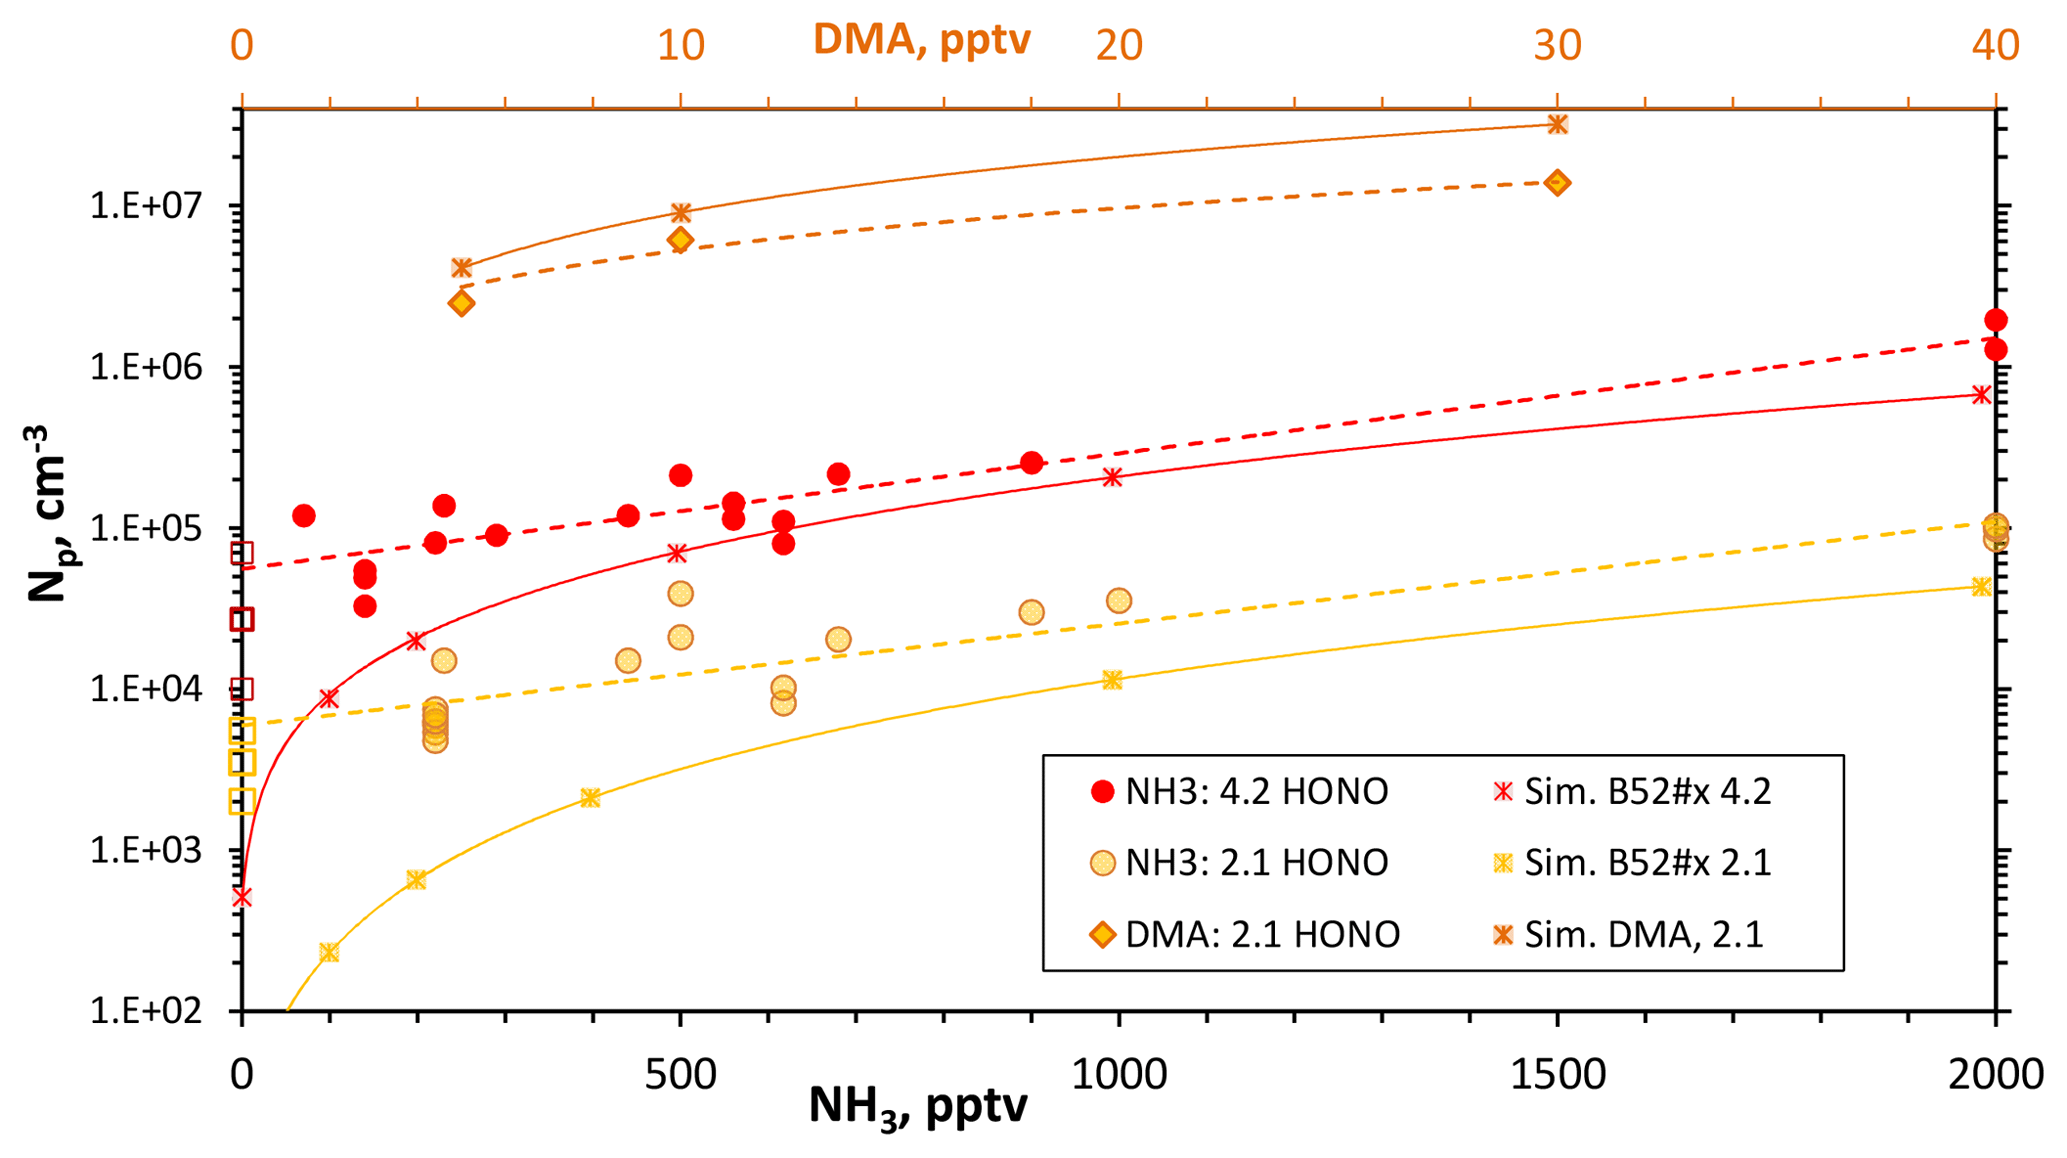
Figure 5Variation in measured Np with added NH3 for Q4 of 4.2 and 2.1 sccm and for added dimethylamine at Q4=2.1 sccm (top axis for dimethylamine level). Simulated Np is shown for NH3_52 (ammonia) and DMA_I (dimethylamine) thermodynamics. The average and the range of measured Np without added base are shown as the squares for the two Q4 levels. Lines connect data taken from the simulations (solid) and empirical fits for experimental data (dashed). SO2 level was > 12 ppmv.
Variation in Np with added base
Shown in Fig. 5 are the total number of particles plotted as a function of added ammonia level for a fixed amount of HONO: either Q4=2.1 (yellow) or 4.2 (red) sccm. The open squares represent the range of data obtained for nominally binary conditions (without added base). There are significant effects on Np due to the addition of NH3 at the top of the reactor, over a factor of 10 for both sets of data.
At large NH3 exposures (high levels and/or prolonged addition), particle counts increased dramatically with exposure time, indicating a conditioning of the flow reactor wall. This is demonstrated in the Supplement (S6), which presents measurements on days when 2000 pptv NH3 was added. The 2000 pptv NH3 data in Fig. 5 were taken soon after ammonia introduction, minimizing the effects of high ammonia exposure.
The large variability of the NH3 data in Fig. 5 mirrors the underlying variability in Np without added NH3 (Fig. 4a). Yet, within the scatter of the measurements, the dependence of Np upon NH3 is smaller than the 1.6 power dependence found in the bulk-source experiments of Glasoe et al. (2015). A close to linear dependence on ammonia can be ascertained from the results of other photolytic H2SO4 production experiments: the flow reactor experiments of Benson et al. (2009, 2011) and Berndt et al. (2010) and the 292 K CLOUD chamber experimental results (Kürten et al., 2016; Kirkby et al., 2011). On the other hand, the 292 K AC/DC theoretical ammonia–sulfuric acid nucleation rates predict a power dependence on ammonia of between 2 and 3, depending on conditions (Kürten et al., 2016).
Simulated Np as a function of added ammonia is shown in Fig. 5 and they are roughly in accord with the experimental data. The major discrepancy is at low added NH3, where simulated Np is significantly lower than experimental Np. The presence of a contaminant that influences the experimental Np, particularly at low ammonia levels, can contribute to this discrepancy. At high NH3 levels, the effect of the contaminant was assumed to be diminished and the cluster thermodynamics were adjusted so that simulations matched the experiment. Thus, the experimental data at Q4=4.2 sccm with ammonia ≥500 pptv guided the development of the H2SO4-NH3 cluster thermodynamics used in these simulations (see the Supplement S8). We do not seek to establish the accuracy of the cluster thermodynamics but instead a phenomenological description of the results: the NH3–H2SO4 thermodynamics developed and used here are phenomenological.
Incomplete agreement across the full range of the present experimental results can also be due in part to an inadequate representation of the actual flow and the mixing of base into the flow in the simulations; however, this would not be expected to depend on the amount of added ammonia or on Q4 (see Supplement S7.1 for more on base mixing into the flow). Small changes to a few cluster-free energies, 1 or 2 kcal mol−1, can significantly alter predicted Np.
For ammonia levels greater than a few hundred parts-per-trillion by volume, this set of thermodynamics (labeled NH3_52) yields simulated Np that varies with NH3 to the 1.6 power for Q4=4.2 sccm conditions and NH3 to the 1.9 power for the Q4=2.1 sccm conditions. Since the dependencies on NH3 for these simulations and those of the theoretical ACDC rates (Kürten et al., 2016) are greater than is exhibited in the present and previous work (Benson et al., 2011; Berndt et al., 2010; Kürten et al., 2016; Kirkby et al., 2011), there may be a commonality across this set of experimental work: that contaminants affected the nominally binary measurements. The low dependence of particle formation rate on ammonia (or low “enhancement factors”, e.g., Benson et al., 2011) exhibited in previous work (Benson et al., 2011; Berndt et al., 2010; Kirkby et al., 2011; Kürten et al., 2016) may have been due in part to the influence of contaminants. A “saturation effect” at high ammonia levels may also act to limit (Kirkby et al., 2011) the ammonia dependence of the nucleation rate. Yet there is congruence of results from a few of the experiments at high ammonia conditions (see Sect. 3.4.1 below).
The added-dimethylamine data in Fig. 5 show that dimethylamine has a very large effect on Np of 2 to 3 orders of magnitude (Q4=2.1 sccm for this data). There is a low dependency on dimethylamine abundance where Np scales approximately linearly with amine mixing ratio. Simulations using DMA_I thermodynamics (Hanson et al., 2017) are also shown in Fig. 5 and simulated Np mimics the experimental Np and its variation with dimethylamine fairly well, except perhaps at 30 pptv dimethylamine where simulated Np is 3×107 cm−3. Coagulation would reduce simulated Np considerably: with a coagulation rate coefficient of cm3 s−1, an Np of 3×107 cm−3 results in a coagulation rate of ( 2×106 cm−3 s−1. In just 5 s, a third of the simulated particles can coagulate. This rough estimate suggests coagulation is important for those conditions and the effect should be properly evaluated in the simulations.
The dimethylamine results presented in Figs. 4 and 5 are small sets of data, and for Fig. 4 dimethylamine was added at a level that challenges the lower range of the dynamic dilution system. Nonetheless, the thermodynamic scheme DMA_I yields cluster concentrations that are consistent with the measured Np and its trends with dimethylamine level. Since the thermodynamics scheme DMA_I (Hanson et al., 2017) was developed by comparing to the dimethylamine–H2SO4 data of Glasoe et al. (2015), the present data and the Glasoe et al. (2015) dimethylamine results are tied together in a semiquantitative sense.
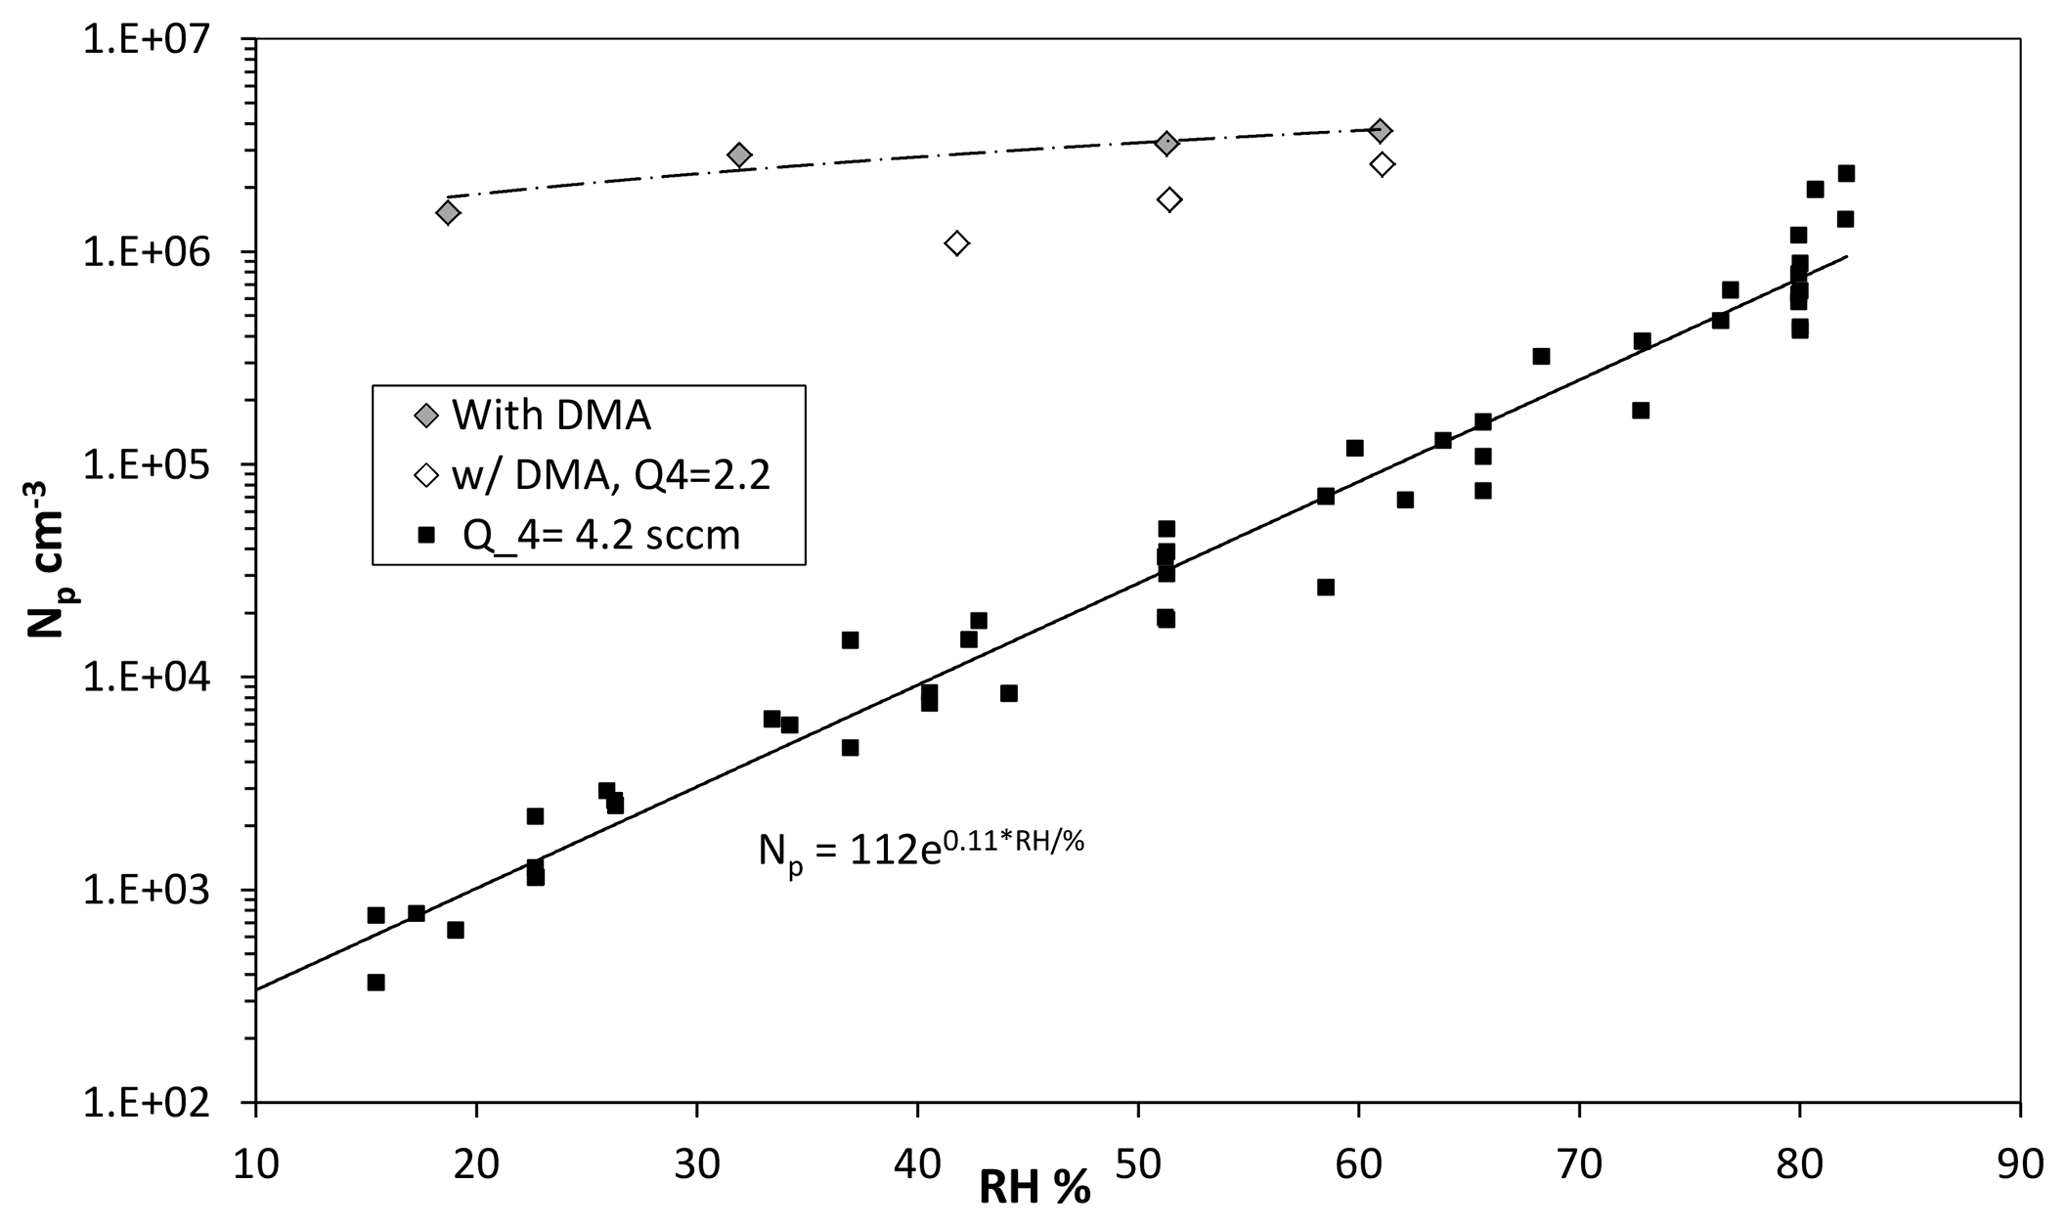
Figure 6Variation in Npwith RH in percent (RH determined by the fraction of flow through the water saturator, Q3). Q4 was 4.2 sccm and Q1 > 20 sccm ([SO2] > 10 ppmv). Also shown are data with dimethylamine added at 2 pptv (filled diamonds) and data at a lower Q4=2.1 sccm with dimethylamine at 5 pptv.
3.2.3 Water variation and addition of dimethylamine
Shown in Fig. 6 is measured Np vs. humidity (as filled squares), calculated from the flow rate of the humidified nitrogen. Total flow rate, HONO and SO2 levels were kept constant; the humidified flow rate was varied from 0.5 to 2.4 sLpm. Although the overall data are phenomenologically exponential (the solid line in the figure), over limited ranges the data exhibit power dependencies on RH of between 4 and 6. A strong dependence of the number of particles on RH is expected for the binary sulfuric acid–water nucleating system, and the power dependence here lies at the low end of range (5–9) reported by Zollner et al. (2012). A plot of the size of the leading-edge mode vs. humidity is presented in the Supplement (Fig. S1.2.2b).
A set of data with 2–5 pptv dimethylamine added is shown as diamonds (filled and open are Q4=4.2 and 2.1 sccm, respectively). There is much less water dependence (approximately linear) when dimethylamine is present, which is consistent with theoretical notions (Almeida et al., 2013; Henschel et al., 2016) that dimethylamine–H2SO4 clusters are not particularly sensitive to H2O. This postulate has also been elucidated in several other publications (e.g., Kurtén et al., 2008; Coffman and Hegg, 1995). The data indicate there may be a slightly higher sensitivity to water vapor at the low Q4 conditions. A complicating factor in fully interpreting this data is that the steady-state H2SO4 abundance (the monomer and all its hydrates) changes with RH because its overall diffusivity changes by about 10 % as RH varies from 15 % to 80 % (Hanson and Eisele, 2000). More experimental work is needed in this interesting system.
Supposing there are dimethylamine-type base contaminants in the putatively base-free experiments (solid squares), it clearly does not reach the single-digit parts-per-trillion by volume level for baseline 52 % RH conditions. Indeed, simulated particle number densities with a level of 0.005 pptv dimethylamine entering the flow reactor were consistent with the 52 % RH and Q4=4.2 sccm results (see Sect. 3.3 below). A set of simulations were run from 0.005 up to 2 pptv dimethylamine and predicted Np scaled linearly with base level. At the 2 pptv level, an Np of about 107 cm−3 was predicted, while experimental Np is 3×106 cm−3. Note that an Np at the 107 cm−3 level will be significantly affected by coagulation, which is not captured in the simulations.
3.2.4 SO2
Particle size and number density were found to depend on SO2 abundance. Shown in Fig. 7 is Np vs. the flow rate of the SO2 mixture, Q1. HONO source flow rate Q4 was 4.2 sccm for this data. Despite its scatter, the data show the SO2 level affects both the number of large particles and their size, DV,le (shown in Fig. S1.2.2c): both increase with [SO2] and begin to level off at high [SO2]. This qualitative behavior is expected, as at low SO2 abundance not all of the OH will react with SO2 and above a certain level there should not be much more of an effect with increases in SO2. Young et al. (2008) also report a stronger-than-expected dependence of their results on SO2 abundance.
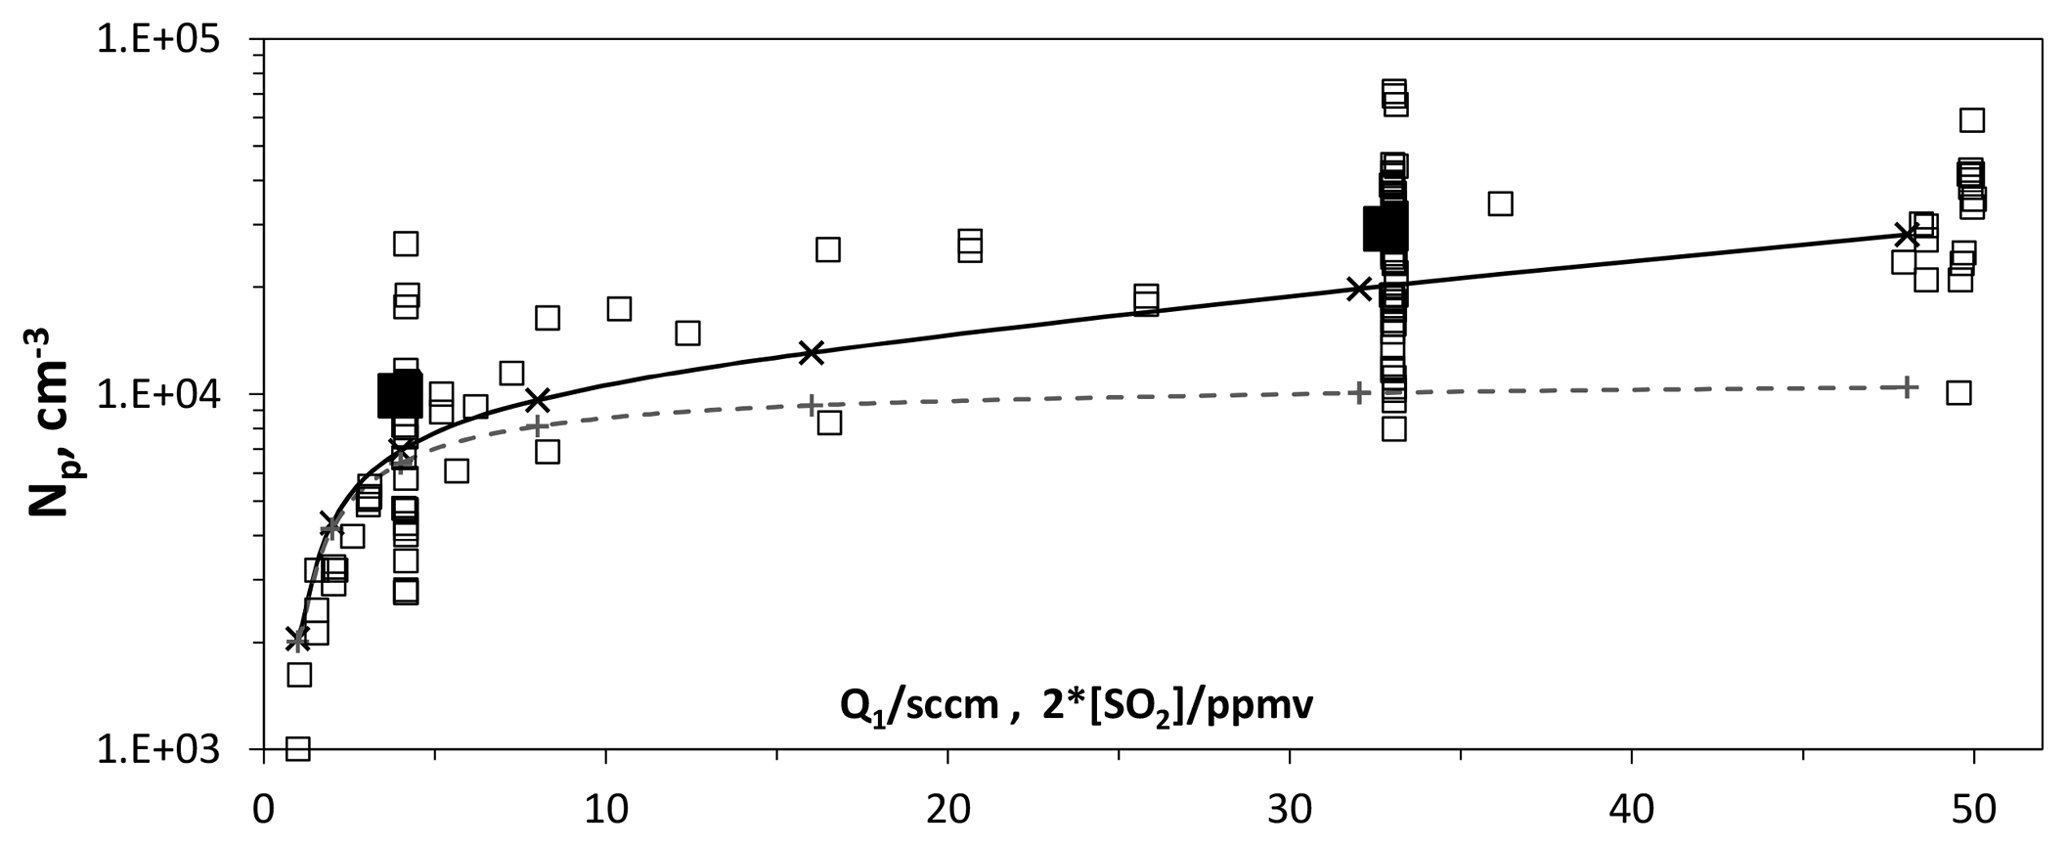
Figure 7Number of large particles vs. flow rate of SO2 mixture. The HONO source flow rate, Q4, was 4.2 sccm, which results in roughly 5×1011 cm−3 [HONO] in PhoFR. For reference, an SO2 mixture flow rate of 32 sccm results in an [SO2] of 4×1014 cm−3 in PhoFR (about 16 pptv). The solid and dashed lines are model values for Np and size, with 200 pptv NH3 entering the flow reactor and a HO2+SO2 rate coefficient of cm3 s−1 (crosses and solid lines) and in the absence of this reaction (plus signs and dashed lines). The solid squares indicate the average at Q1=4 and 32 sccm.
A set of simulations that includes a reaction between HO2 and SO2 is shown as the solid line in Fig. 7. Note that a level of 200 pptv of NH3 entering the flow reactor was included. The experimental results show increases with SO2 that are roughly in line with the model simulations. Without this reaction the model shows (the dashed line) much smaller increases in Np (40 % vs. 250 % with the reaction) and in size (Fig. S1.2.2c, 10% vs. 20% with the reaction) as SO2 increases from 2 to 16 ppmv.
The simulation assumed a value of cm3 s−1 for . There is disagreement whether HO2 reacts with SO2 as well as potential end products (Chen et al., 2014; Kurten et al., 2011). We assumed that the products are H2SO4 and OH. Experimental values for this rate coefficient range from upper limits of cm3 s−1 (Graham et al., 1979) and cm3 s−1 (Burrows et al., 1979), to a value of cm3 s−1 (Payne et al., 1973). A heterogeneous reaction occurring in the particles involving SO2 would help explain the dependence of DV,le on SO2 abundance (Fig. S1.2.2c), while leaving Np undisturbed.
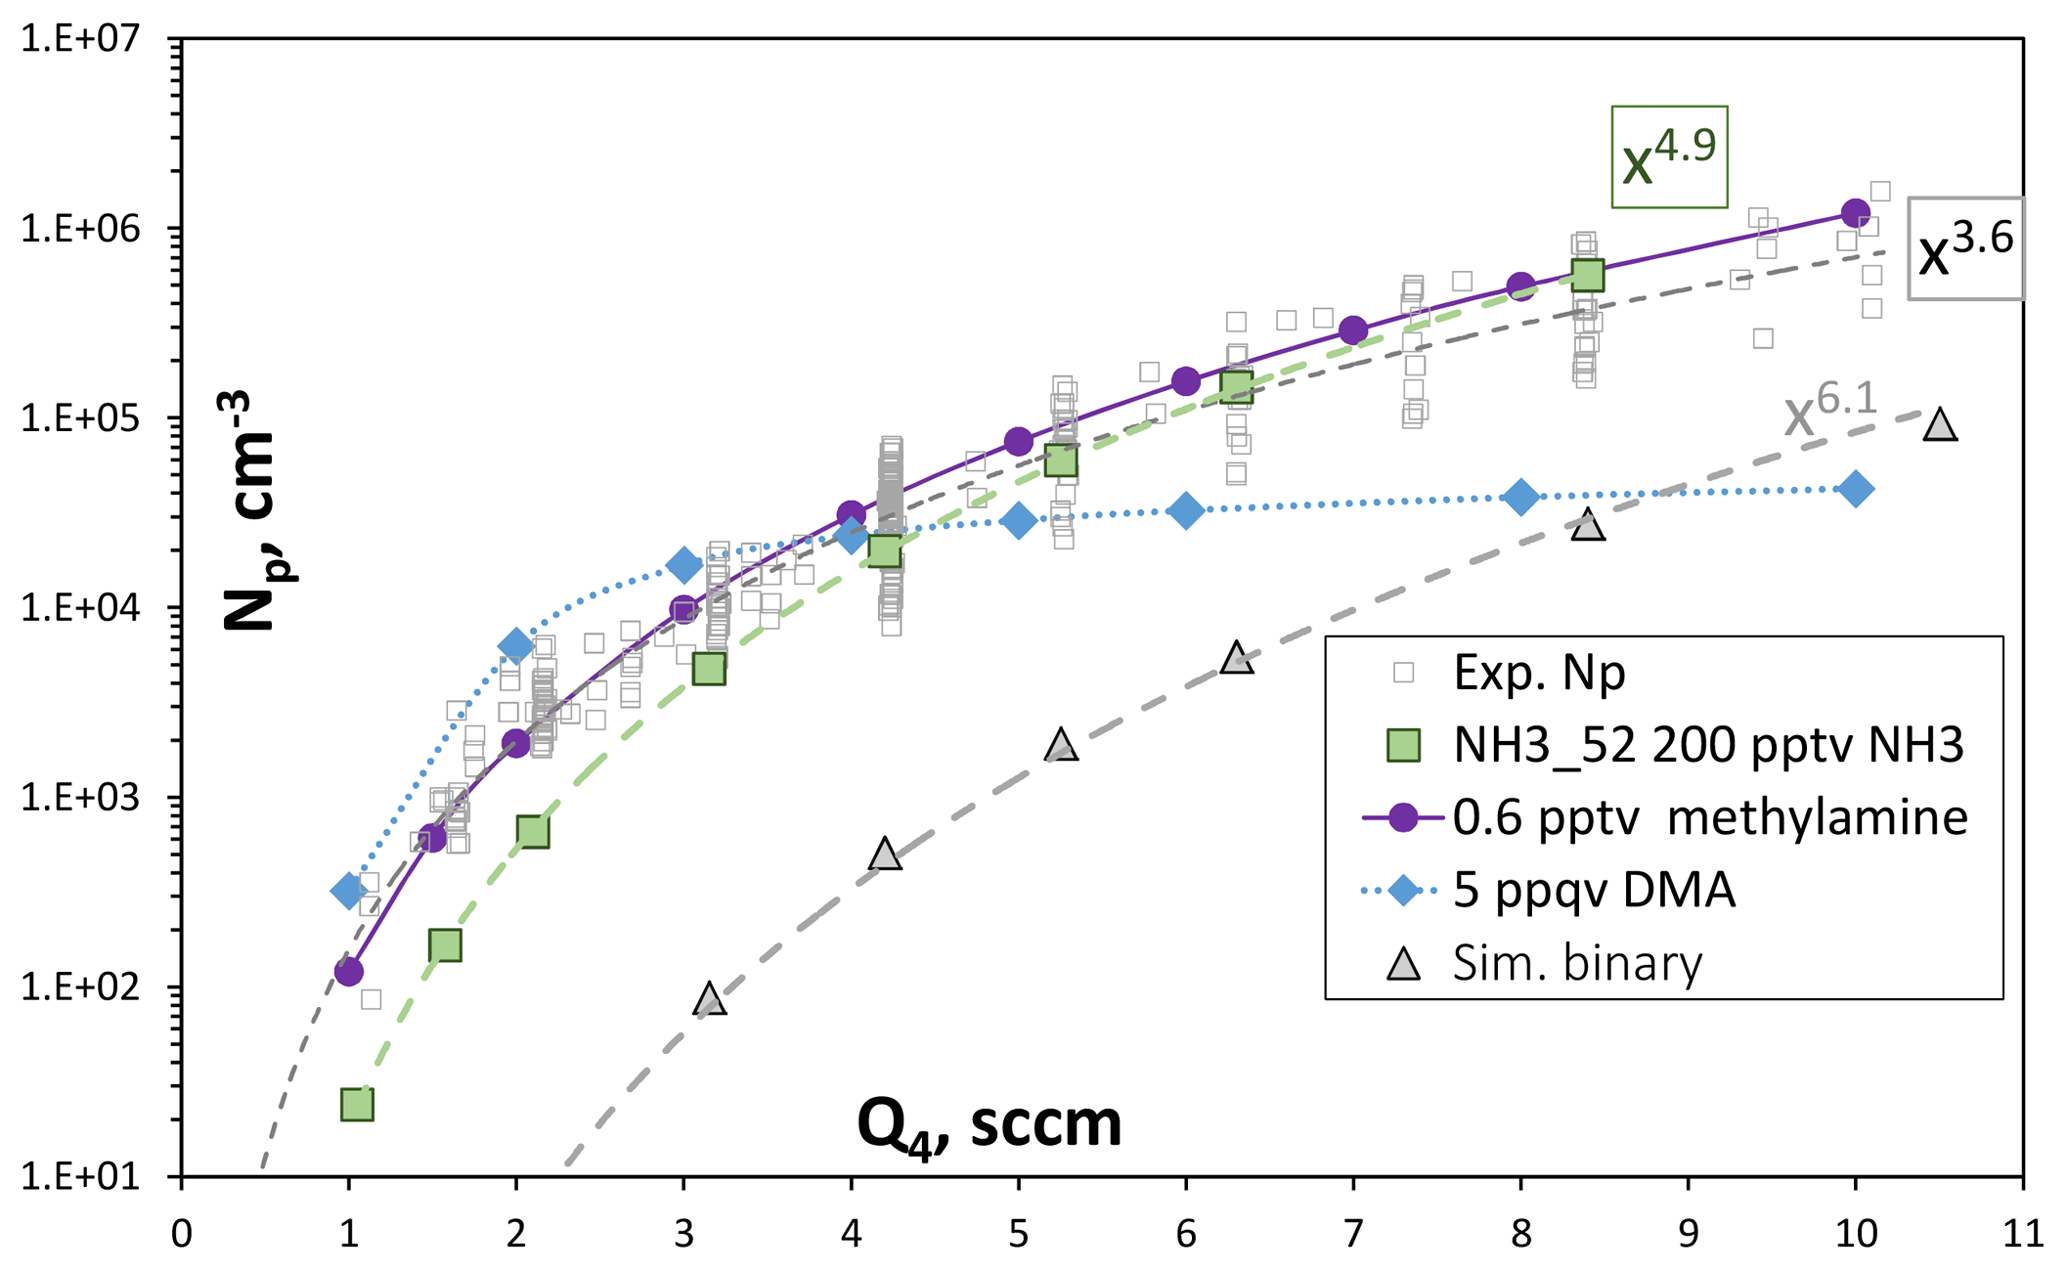
Figure 8Np vs. Q4, the HONO-containing flow. Experimental data are from Fig. 4, simulated data is on-axis Np at axial position = 120 cm into PhoFR. Green symbols are ammonia at 200 pptv and the gray triangles are the binary, simulated with scheme NH3_52 thermodynamics. The blue diamonds are simulations with 0.005 pptv dimethylamine added using DMA_I thermodynamics. The purple circles are 0.6 pptv methylamine from Glasoe et al. (2015). Power dependencies are indicated in the plot.
3.3 Characteristics of a potential contaminant
The experimental Np as a function of HONO from Fig. 4a, along with model-simulated Np, is shown in Fig. 8. The simulations were run for NH3 at 0 and 200 pptv using NH3_52 thermodynamics and for dimethylamine at 0.005 pptv using DMA_I thermodynamics (Hanson et al., 2017); SO2 was set to 16 ppmv and was cm3 s−1. The experimental data are for nominally clean conditions.
The simulations with NH3 at 200 pptv yield Np similar to the experimental results and, furthermore, dependencies upon HONO align with experimental dependencies. The powerful nucleator dimethylamine entering the flow reactor at 5 ppqv (1.2×105 cm−3) also yields a simulated Np at Q4=4.2 sccm close to the experimental Np of about 2.5×104 cm−3. The variation in predicted Np with HONO, however, is disparate from the experimental variation, where the simulated Np levels off at high values of Q4. This leveling off is due, at least in part, to a simple number limitation: the largest simulated Np is 4×104 cm−3, which is about one-third of the number density of dimethylamine molecules introduced. A strict limit would be reached depending on how many dimethylamine molecules are in each particle. Nonetheless, the simulations suggest the contaminant acts more like ammonia than dimethylamine.
While the presence of 200 pptv ammonia is consistent with the experimental Np, methylamine has comparable power dependencies on acid. These are plotted as the purple circles in Fig. 8, where the methylamine nucleation rates were taken from the expression in Table S2 of Glasoe et al. (2015) and a 4 s nucleation time was applied. Since it is significantly less powerful than dimethylamine, a larger abundance of 0.5 pptv is needed to give Np comparable to the experiment and the full range of Q4 is covered, assuming scavenging of methylamine by clusters would be minimal. An impurity with an abundance of a fraction of a part-per-trillion by volume may last a long time due to a low evaporation rate. These considerations would make methylamine (or perhaps another primary amine) a suitable candidate for a potential gas-phase base contaminant in PhoFR. Of course, whether the contaminant is ammonia or methylamine (or perhaps a combination) cannot be determined at this time. However, it appears that studying the primary amines would be interesting in this context, as well as for understanding their effects on sulfuric acid nucleation rates. The Supplement (S9) presents some more discussion on the effects of SO2.
3.4 Comparison to previous results
A number of previous results are compiled along with the present measurements in Fig. 9 for nominally base-free conditions. The present results are assigned the simulated H2SO4 value in the center of the reactor and at 30 cm into the illuminated region. The nucleation rate J was taken to be Np divided by the time the center of the flow travels from 20 to 40 cm, 4 s. This time is presumed to apply to the nominally clean conditions here. On the other hand, with base added intentionally, significant nucleation may also occur in the 0 to 20 cm region where base abundance is high. Uncertainties in J are probably on the order of a factor of 2. Uncertainty in H2SO4 is about a factor of 2, based on the calculated values at 15 and 60 cm, which are −49 % and +106 %, respectively, from the 30 cm value. The radial profile of H2SO4 at 30 cm axial distance is flat from the center out to a radius of 1.7 cm. See the Supplement for radial profiles of H2SO4 (Fig. S1.3.3).
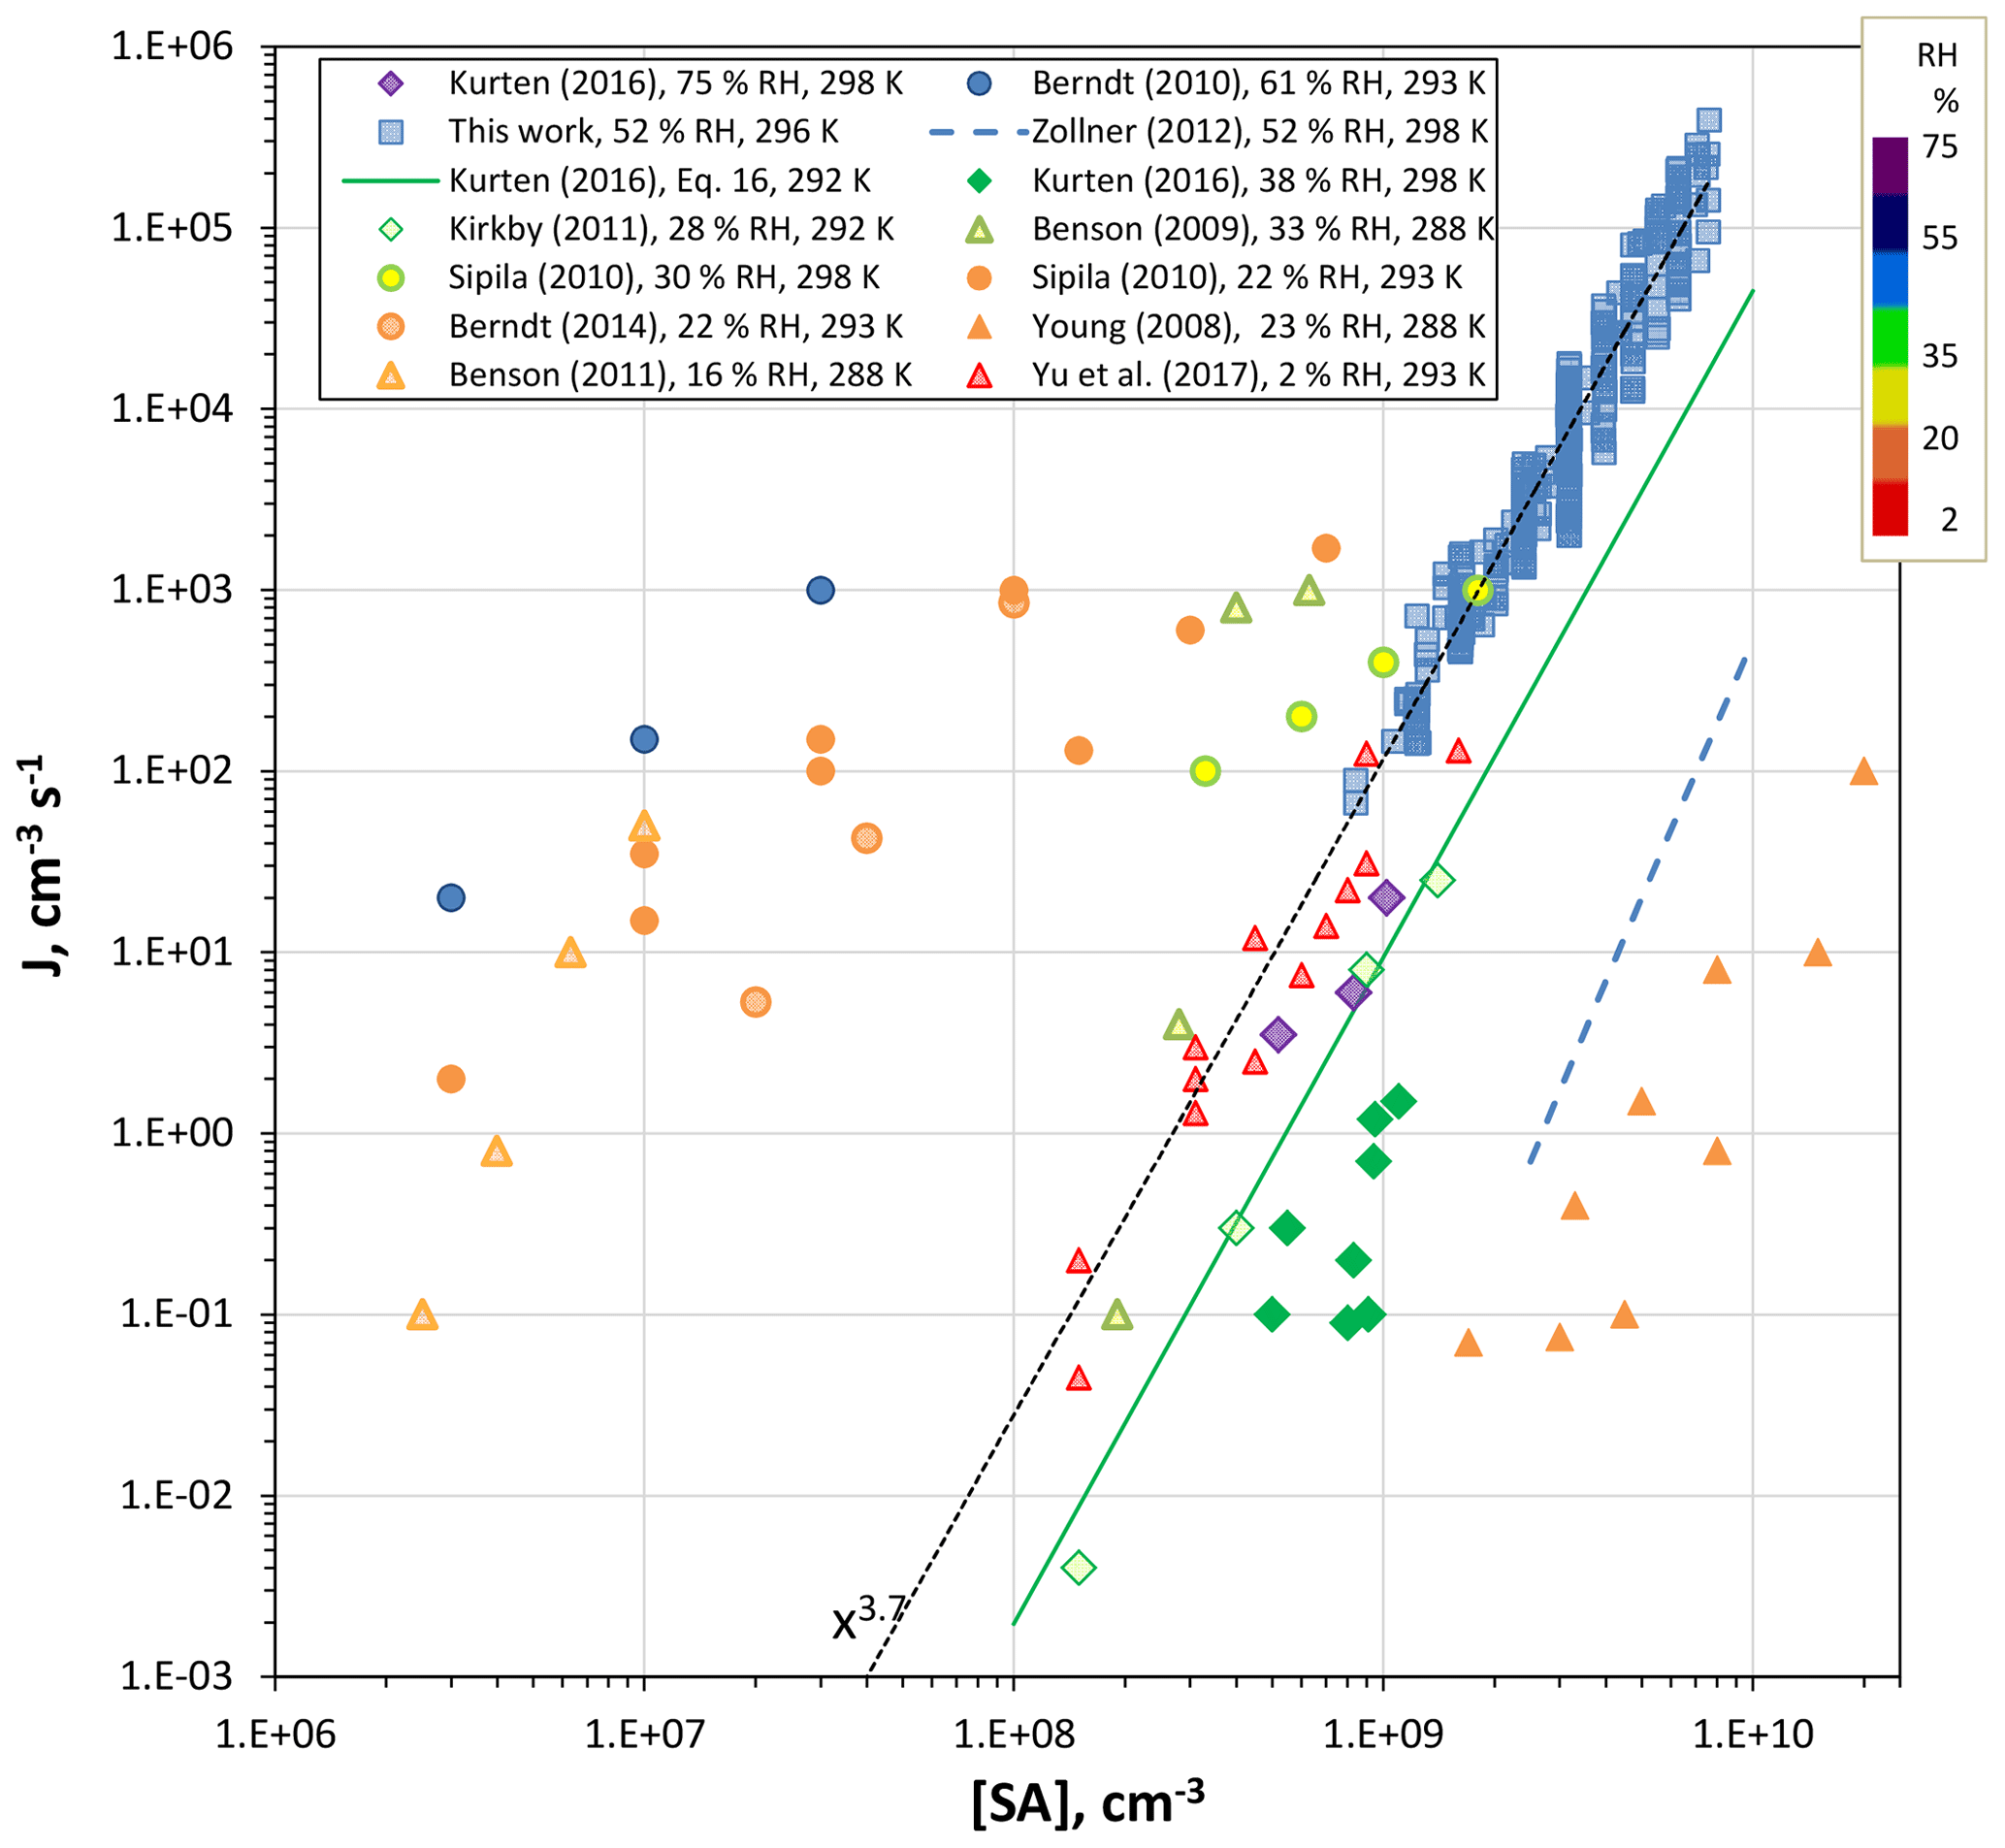
Figure 9Comparison of results from previous work (all photolytic H2SO4 production except Zollner et al., 2012) for nominally clean conditions. RH color-coding was applied to the points and temperatures are indicated in the legend.
The experimental data in Fig. 9 were taken over a range of temperatures, 288 to 300 K, and relative humidities, 2.3 % to 75 % RH (conditions indicated in the legend). The present results extrapolate to rates that are in fair agreement with Benson et al. (2009) and much of the CLOUD data set (Kirkby et al., 2011; Kürten et al., 2016) except for the 40 % RH at 298 K data. The bulk-source H2SO4 data reported by Zollner et al. (2012) is included for reference; it was corrected from 38 % RH to 52 % RH, increasing by about a factor of 5 using a RH5 dependency. The difference between the bulk-source and present photolytic H2SO4 is about 4 orders of magnitude; the Kürten et al. (2016) 40 % RH data is closest to this set of bulk data, within about 2 orders of magnitude.
There is apparent agreement between several data sets for H2SO4 concentrations of 108 to 109 cm−3: our lowest J (and the extrapolation of our data, dotted line) and those of Yu et al. (2017), Benson et al. (2009), Kürten et al. (2016) and Kirkby et al. (2012), but this agreement is complicated by the wide range of relative humidities (from 2.3 % RH up to 75 % RH). The data of Young et al. (2008) suggests a very low contamination level; however, there are unresolved issues in measured [H2SO4] (see the factor of 10 disparity in their Fig. 5). Lack of experimental water dependencies and assessment of base levels makes drawing conclusions from these comparisons fraught with difficulty. Nonetheless, it is interesting that the dependencies of J on sulfuric acid level are similar in many of these studies. This suggests there is an underlying similarity in particle formation conditions, such as contaminant identity and level (which seems unlikely), or the critical cluster's H2SO4 content is not particularly sensitive to the type or abundance of the contaminant.
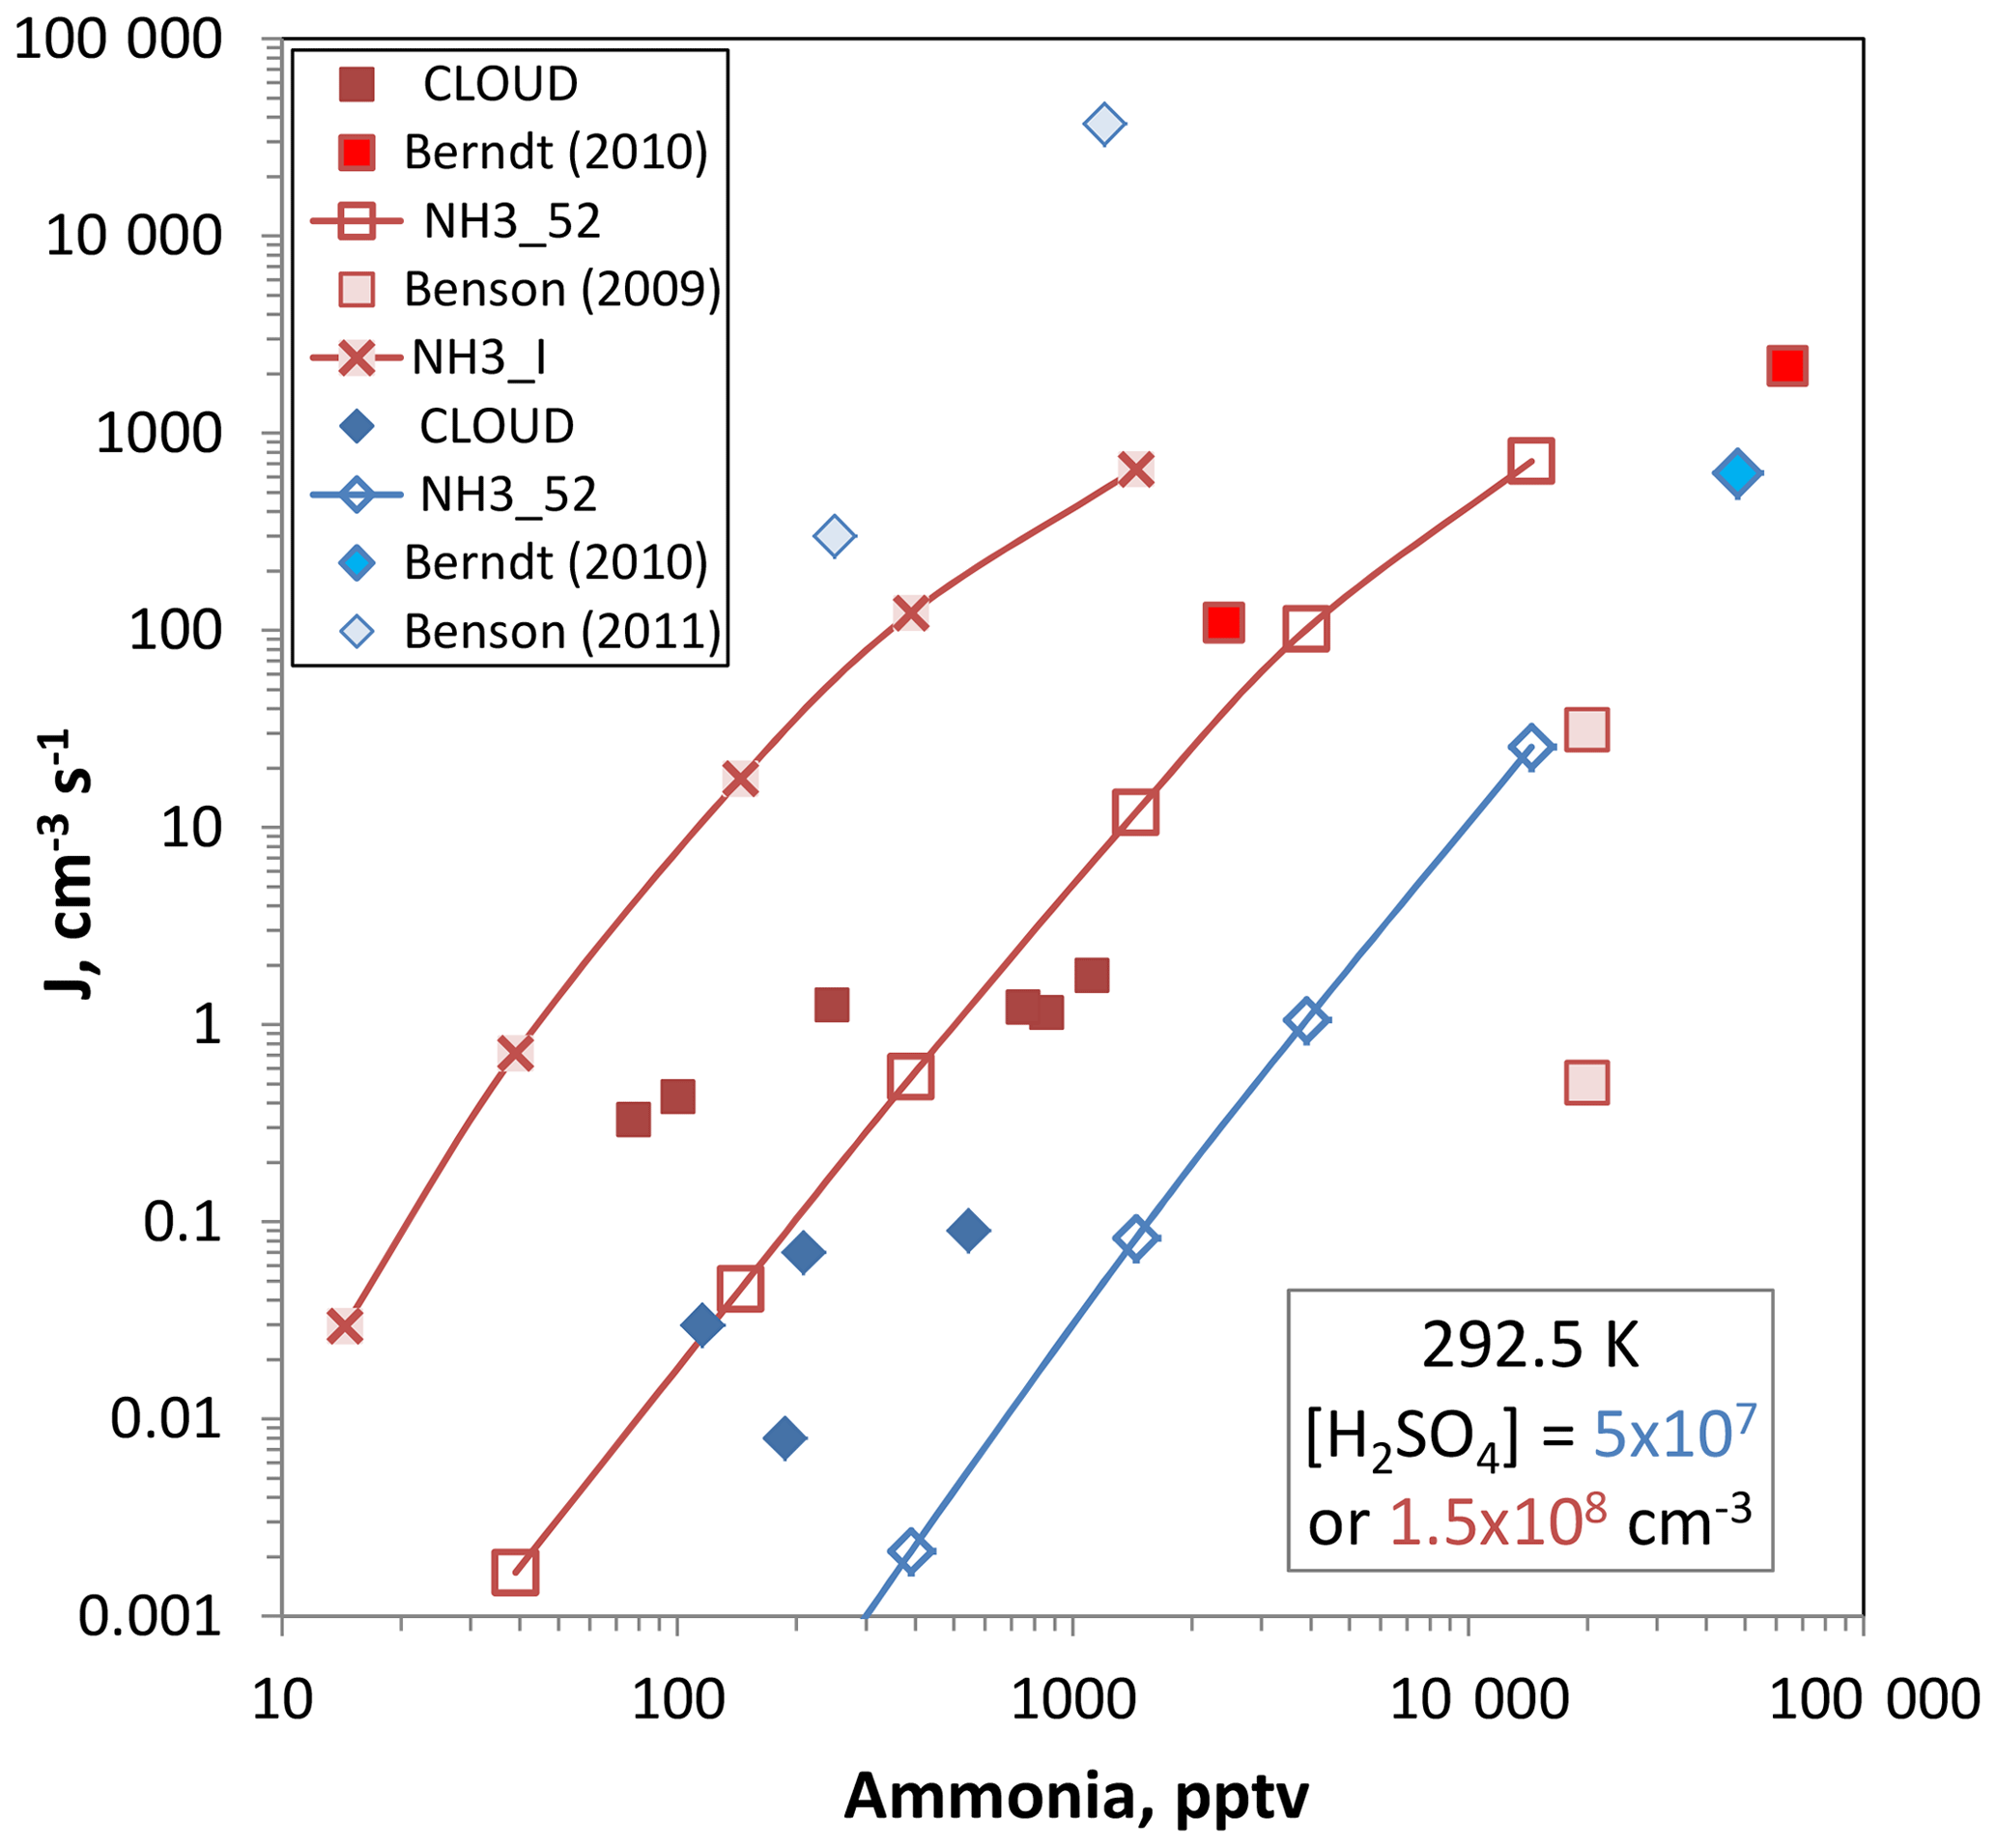
Figure 10Ammonia–sulfuric acid nucleation rate vs. ammonia abundance. Sulfuric acid level is 5×107 cm−3 for the blue diamonds and 1.5×108 cm−3 for the red squares. CLOUD data is from Dunne et al., 292.5 K in neutral conditions. Berndt et al. (2010), 293 K, have their squared dependence on [H2SO4] applied, which results in a division by ∼30 to extrapolate to the 1.5×108 cm−3 conditions. No corrections are needed for the 5×107 cm−3 data point. Benson et al. (2009) report a 4 power dependence on sulfuric acid and correction factors are 5 and divide by 16. Benson et al. (2011) requires multiplicative factors of ∼40 to extrapolate to 5×107 cm−3 [H2SO4]. Box model nucleation rates for the two different [H2SO4] are shown for the NH3_52 thermodynamics and J for the 1.5×108 cm−3 conditions was also predicted using NH3_I from Hanson et al. (2017).
3.4.1 Comparison of nucleation rates for added ammonia
Plotted in Fig. 10 are nucleation rates vs. ammonia abundance for measurements at low [H2SO4], 5×10⁷ and 1.5×108 cm−3, and temperatures between 288 and 293 K. Also plotted are predictions according to the present data using the box model and methodology presented in Hanson et al. (2017). The experimental data from the CLOUD project for 292.5 K were taken from Dunne et al. (2017) and were also presented by Kürten et al. (2016). The Benson et al. (2009, 2011) work was performed at 288 K and significant extrapolation of nucleation rates was applied to get comparable sulfuric acid concentrations (see the caption). The Berndt et al. (2010) work was performed at 293 K and extrapolation was needed to get comparison rates for the 1.5×108 cm−3 [H2SO4] conditions.
The model predictions using the NH3_52 thermodynamics developed here gives rates that are congruent with the CLOUD data and with Berndt et al. (2011) while NH3_I thermodynamics (calculated only for [H2SO4] = 1.5×108 cm−3) gives rates that are high by 2–3 orders of magnitude. NH3_I is a set of ammonia–sulfuric acid thermodynamics derived in Hanson et al. (2017) that skirted the lower limit of the Glasoe et al. (2015) ammonia data set. Benson et al. (2009, 2011) is quite disparate and a temperate correction would lessen the discrepancy for the set of data at the low H2SO4 but it would worsen it at the higher H2SO4.
With the box model predictions using NH3_52 thermodynamics serving as a bridge, the present added-ammonia data agree with both the CLOUD data (Kürten et al., 2016; Dunne et al., 2017) and the Berndt et al. (2011) data. Since the box model rates using NH3_I thermodynamics (Hanson et al., 2017) are much too high, we can conclude that the Glasoe et al. (2015) ammonia data set it was based on does not agree with the present measurements. Recently, Kürten (2019) concluded that the NH3_II (stronger binding than NH3_I) thermodynamics of Hanson et al. (2017) yields nucleation rates much higher than the CLOUD measurements.
We presented a new experimental apparatus for studying particle formation involving photolytically formed H2SO4 vapor, and the results show that the system is reproducible and responds to changes in water, HONO and SO2 concentrations largely as expected. Modeled particle formation rates could be made congruous with experimental observations by including either dimethylamine at a level of mole fraction or NH3 at a level of mole fraction. Also, the dependence of Np on SO2 level was best explained by a reaction between HO2 and SO2 that yields (ultimately) H2SO4 and OH with a rate coefficient of cm3 s−1.
Comparison of the present results to other photolytic H2SO4 experiments yields several suppositions. Their divergence from the bulk-source data of Zollner et al. (2012) suggests these experiments are not clean enough and/or they are subject to an unknown reaction or photochemistry. The similarity of the present results to those of Benson et al. (2009), Kirkby et al. (2011), Kürten et al. (2016) and Yu et al. (2017) suggests a common element that affects nucleation beyond what bulk-source H2SO4 experiments reveal. The outlier results of Berndt et al. (2010, 2014) and Benson et al. (2011) may suffer from relatively high level of contaminants: Berndt et al. (2014) suggested that a part-per-trillion by volume of amine could have been present in their experiment. As can be seen in Fig. 9, there is a remarkable agreement of the H2SO4 power dependencies for Kirkby et al. (2011), Yu et al. (2017) and the present results. This may be due to a similarly sized critical cluster across these studies.
Side products from photolytic generation of H2SO4 that enhance nucleation were suggested by Berndt et al. (2008); however, Sipilä et al. (2010) found no difference between nucleation rates whether H2SO4 was produced photolytically or taken from a bulk source. Yet, much of the Sipilä et al. (2010) photolytic nucleation rates are many orders of magnitude too high for the putative binary system; see Fig. 9, comparing the present results, the Zollner et al. (2012) bulk-liquid data, Yu et al. (2017), and the results from the CLOUD experiment from Kirkby et al. (2011) and Kürten et al. (2016). With the exception of their bulk 298 K 30 % RH results, the Sipilä et al. (2010) data largely overlap the Benson et al. (2011) and Berndt et al. (2014) data and probably also suffer from amine contaminants at the parts-per-trillion by volume level.
The total particle number strongly depended on relative humidity with RH4 and RH6 power relationships over RH ranges of 15 % to 35 % and 40 % to 77%, respectively. The CLOUD 298 K results (Kürten et al., 2016) show a power dependency of 4 on RH from 40 % to 75 % at 298 K that is in rough agreement with the present results. Yu et al. (2017) reported a nucleation rate that depended linearly on RH that seems to be out of line with these other data sets.
The weak dependence of Np on added NH3 near room temperature, also reflected in a few other studies (Kirkby et al., 2011; Kürten et al., 2016; Benson et al., 2011), is probably due to a contaminant that overwhelms ammonia-induced nucleation, especially at low levels of added ammonia. We surmised that a contaminant in our system is not consistent with dimethylamine but is consistent with a few hundred parts-per-trillion by volume of ammonia; alternatively, we postulated that 0.5 pptv of methylamine could also be responsible.
The model simulations with NH3–H2SO4 thermodynamic schemes NH3_I and, because it is stronger, NH3_II (Hanson et al., 2017), result in Np that greatly exceed the present experimental results. With the simulations serving as a bridge between these two experiments, we conclude that the present experimental data and the Glasoe et al. (2015) NH3–H2SO4 results do not agree. Glasoe et al. (2015) noted that their NH3–H2SO4 nucleation rates were much higher than those of Ball et al. (1999) and Zollner et al. (2012), but with the present results as a backdrop, the Glasoe et al. (2015) criticisms of those two studies are blunted. In hindsight we postulate an avenue for an amine contamination in the Glasoe et al. (2015) ammonia experiments: several amino-compounds were studied in succession using the same dynamic dilution system. Since ammonia was used between amines, holdover of the amine is possible and even small levels would significantly boost particle numbers, compromising the ammonia–sulfuric acid system measurements. Note that in the present experimental setup, there were two dynamic dilution systems, one dedicated for ammonia and one for dimethylamine.
Additions of dimethylamine resulted in large abundances of particles, which limited the range of conditions we were able to study. The number densities are such that a model with proper treatments of coagulation and cluster–cluster collisions is needed to fully interpret the results. Nonetheless, the experimental results are in decent agreement with model simulations using the thermodynamic scheme (DMA_I, Hanson et al., 2017) that best captured the Glasoe et al. (2015) dimethylamine–H2SO4 experimental results. We found low RH dependencies when dimethylamine was added, in line with expectations. Note the details of this preliminary finding need further work: (i) RH affects the steady-state sulfuric acid and (ii) coagulation effects need to be properly evaluated.
Atmospheric implications of the present work are of a qualitative nature. The current work suggests that nucleation rates in the NH3–H2SO4 system for a few studies can be seen to converge but more measurements near room temperature are needed to aid the development of ammonia–sulfuric acid thermodynamics (e.g., this work; Hanson et al., 2017; Kürten, 2019). We concluded that the experimental nucleation rates in this system from Glasoe et al. (2015) are discordant. On the other hand, as alluded to in the previous paragraph, the current work is consistent with the Glasoe et al. (2015) dimethylamine–H2SO4 results. Also, the much-predicted low RH dependency for dimethylamine–H2SO4 nucleation finds experimental corroboration here. Finally, even if the reaction of HO2 with SO2 occurs with a rate coefficient of cm3 s−1, it is probably an insignificant source of atmospheric hydroxyl radicals and oxidized sulfur compounds.
In the future, a series of measurements in the dimethylamine–H2SO4 system with added dimethylamine at fractional parts-per-trillion by volume levels and low relative humidities are planned. We also plan to study the relative humidity dependence of ammonia-induced H2SO4 nucleation, as well as variations in temperature on both amine- and ammonia-addition nucleation. In the long term, the system developed here will be used in particle growth studies where nanometer-diameter particles prepared in the Glasoe et al. (2015) apparatus are directed through PhoFR along with target organic compounds.
All data presented in this paper are available by contacting the corresponding author.
The supplement related to this article is available online at: https://doi.org/10.5194/acp-19-8999-2019-supplement.
HA and JV built the particle detector and performed preliminary experiments, MA helped design and carry out experiments, SM carried out added-NH3 experiments and helped with the manuscript, JK helped develop the photochemical module, and DH developed and ran the simulations, developed and carried out experiments, and prepared the manuscript with contributions from all co-authors. The authors declare that they have no conflict of interest.
The authors declare that they have no conflict of interest.
Thanks to Chase Grieves, Charles Ward, Nathaniel Hoffmann and Siew Thao for performing verification experiments that led to improvements in the deployment of the DEG system and T. Otsego for data analysis. Thanks to T. Kukowski for their programming help on the numerical model. Thanks to Y. Melka and N. Clark for their work on the Python program that accumulates and displays particle counter data. We are grateful to M. Stolzenburg and P. McMurry for their comments on the manuscript and for lending their expertise and guidance during the course of this work.
This research has been supported by the National Science Foundation, Directorate for Geosciences (grant nos. AGS-1338706, AGS-1761638).
This paper was edited by Joachim Curtius and reviewed by two anonymous referees.
Almeida, J., Schobesberger, S., Kürten, A., Ortega, I. K., Kupiainen-Määttä, O., Praplan, A. P., Adamov, A., Amorim, A., Bianchi, F., Breitenlechner, M., David, A., Dommen, J., Donahue, N. M., Downard, A., Dunne, E. M., Duplissy, J., Ehrhart, S., Flagan, R. C., Franchin, A., Guida, R., Hakala, J., Hansel, A., Heinritzi, M., Henschel, H., Jokinen, T., Junninen, H., Kajos, M., Kangasluoma, J., Keskinen, H., Kupc, A., Kurtén, T., Kvashin, A. N., Laaksonen, A., Lehtipalo, K., Leiminger, M., Leppä, J., Loukonen, V., Makhmutov, V., Mathot, S., McGrath, M. J., Nieminen, T., Olenius, T., Onnela, A., Petäjä, T., Riccobono, F., Riipinen, I., Rissanen, M., Rondo, L., Ruuskanen, T., Santos, F. D., Sarnela, N., Schallhart, S., Schnitzhofer, R., Seinfeld, J. H., Simon, M., Sipilä, M., Stozhkov, Y., Stratmann, F., Tomé, A., Tröstl, J., Tsagkogeorgas, G., Vaattovaara, P., Viisanen, Y., Virtanen, A., Vrtala, A., Wagner, P. E., Weingartner, E., Wex, H., Williamson, C., Wimmer, D., Ye, P., Yli-Juuti, T., Carslaw, K. S., Kulmala, M., Curtius, J., Baltensperger, U., Worsnop, D. R., Vehkamäki, H., and Kirkby, J.: Molecular understanding of sulphuric acid-amine particle nucleation in the atmosphere, Nature, 502, 359–363, https://doi.org/10.1038/nature12663, 2013.
Ball, S. M., Hanson, D. R., Eisele, F. L., and McMurry, P. H.: Laboratory Studies of Particle Nucleation – Initial Results for H2SO4, H2O, and NH3 Vapors, J. Geophys. Res., 104, 718–723, 1999.
Benson, D. R., Erupe, M. E., and Lee, S.-H.: Laboratory-measured H2SO4, NH3, H2O ternary homogeneous nucleation rates: Initial observations, Geophys. Res. Lett. 36, L15818, https://doi.org/10.1029/2009GL038728, 2009.
Benson, D. R., Yu, J. H., Markovich, A., and Lee, S.-H.: Ternary homogeneous nucleation of H2SO4, NH3, and H2O under conditions relevant to the lower troposphere, Atmos. Chem. Phys., 11, 4755–4766, https://doi.org/10.5194/acp-11-4755-2011, 2011.
Berndt, T., Stratmann, F., Bräsel, S., Heintzenberg, J., Laaksonen, A., and Kulmala, M.: SO2 oxidation products other than H2SO4 as a trigger of new particle formation. Part 1: Laboratory investigations, Atmos. Chem. Phys., 8, 6365–6374, https://doi.org/10.5194/acp-8-6365-2008, 2008.
Berndt, T., Stratmann, F., Sipilä, M., Vanhanen, J., Petäjä, T., Mikkilä, J., Grüner, A., Spindler, G., Lee Mauldin III, R., Curtius, J., Kulmala, M., and Heintzenberg, J.: Laboratory study on new particle formation from the reaction OH+SO2: influence of experimental conditions, H2O vapour, NH3 and the amine tert-butylamine on the overall process, Atmos. Chem. Phys., 10, 7101–7116, https://doi.org/10.5194/acp-10-7101-2010, 2010.
Berndt, T., Sipilä, M., Stratmann, F., Petäjä, T., Vanhanen, J., Mikkilä, J., Patokoski, J., Taipale, R., Mauldin III, R. L., and Kulmala, M.: Enhancement of atmospheric H2SO4∕H2O nucleation: organic oxidation products versus amines, Atmos. Chem. Phys., 14, 751–764, https://doi.org/10.5194/acp-14-751-2014, 2014.
Burrows, J. P., Cliff, D. I., Harris, G. W., Thrush, B. A., and Wilkinson, J. P. T.: Atmospheric Reactions of the HO2 Radical Studied By Laser MRS, P. Roy. Soc. Lond. Ser. A, 368, 463–481, 1979.
Chen, X., Tao, C., Zhong, L., Gao, Y., Yao, W., and Li, S.: Theoretical study on the atmospheric reaction of SO2 with the HO2 and HO2⋅H2O complex formation HSO4 and H2SO3, Chem. Phys. Lett., 608, 272–0276, 2014.
Coffman, D. J. and Hegg, D. A.: A Preliminary Study of the Effect of Ammonia on Particle Nucleation in the Marine Boundary Layer, J. Geophys. Res.-Atmos., 100, 7147–7160. https://doi.org/10.1029/94JD03253, 1995.
Dunne, E. M., Gordon, H., Kürten, A., Almeida, J., Duplissy, J., Williamson, C., Ortega, I. K., Pringle, K. J., Adamov, A., Baltensperger, U., Barmet, P., Benduhn, F., Bianchi, F., Breitenlechner, M., Clarke, A., Curtius, J., Dommen, J., Donahue, N. M., Ehrhart, S., Flagan, R. C., Franchin, A., Guida, R., Hakala, J., Hansel, A., Heinritzi, M., Jokinen, T., Kangasluoma, J., Kirkby, J., Kulmala, M., Kupc, A., Lawler, M. J., Lehtipalo, K., Makhmutov, V., Mann, G., Mathot, S., Merikanto, J., Miettinen, P., Nenes, A., Onnela, A., Rap, A., Reddington, C. L. S., Riccobono, F., Richards, N. A. D., Rissanen, M. P., Rondo, L., Sarnela, N., Schobesberger, S., Sengupta, K., Simon, M., Sipilä, M., Smith, J. N., Stozkhov, Y., Tomé, A., Tröstl, J., Wagner, P. E., Wimmer, D., Winkler, P. M., Worsnop, D. R., and Carslaw, K. S.: Global atmospheric particle formation from CERN CLOUD measurements, Science, 354, 1119–1123, 2016.
Ehrhart, S., Ickes, L., Almeida, J., Amorim, A., Barmet, P., Bianchi, F., Dommen, J., Dunne, E. M., Duplissy, J., Franchin, A., Kangasluoma, J., Kirkby, J., Kürten, A., Kupc, A., Lehtipalo, K., Nieminen, T., Riccobono, F., Rondo, L., Schobesberger, S., Steiner, G., Tomé, A., Wimmer, D., Baltensperger, U., Wagner, P. E., and Curtius, J.: Comparison of the SAWNUC model with CLOUD measurements of sulphuric acid water nucleation, J. Geophys. Res.-Atmos., 121, 12401–12414, https://doi.org/10.1002/2015JD023723, 2016.
Eisele, F. L. and Tanner, D. J.: Measurement of the Gas Phase Concentration of H2SO4 and Methane Sulfonic Acid and estimates of H2SO4 Production and Loss in the Atmosphere, J. Geophys. Res. D, 98, 9001–9010, 1993.
Febo, A., Perrino, C., Sparapani, R., and Gherardi, M.: Evaluation of a – Continuous Generation System for Nitrous Acid, Environ. Sci. Tech., 29, 2390-2395, 1995.
Freshour, N. A., Carlson, K. K., Melka, Y. A., Hinz, S., Panta, B., and Hanson, D. R.: Amine permeation sources characterized with acid neutralization and sensitivities of an amine mass spectrometer, Atmos. Meas. Tech., 7, 3611–3621, https://doi.org/10.5194/amt-7-3611-2014, 2014.
Friese, E. and Ebel, A.: Temperature Dependent Thermodynamic Model of the System HNHNaSONOClH2O, J. Phys. Chem. A, 114, 11595–11631, https://doi.org/10.1021/jp101041j, 2010.
Glasoe, W. A., Volz, K., Panta, B., Freshour, N., Bachman, R., Hanson, D. R., McMurry, P. H., and Jen, C. N.: Sulfuric Acid Nucleation: An Experimental Study of the Effect of Seven Bases, J. Geophys. Res. D, 120, 1933–1950, 2015.
Graham, R. A., Winer, A. M., Atkinson, R., and Pitts Jr., J.: Rate Constants for the Reaction of HO2 with HO2, SO2, CO, N20, Trans-2-Butene, and 2,3-Dimethyl-2-Butene at 300 K, J. Phys. Chem., 83, 215–220, 1979.
Hanson, D. R., Bier, I., Panta, B., Jen, C. N., and McMurry, P. H.: Computational Fluid Dynamics Studies of a Flow Reactor: Free Energies of Clusters of Sulfuric Acid with NH3 and Dimethylamine, J. Phys. Chem. A, 121, 3976, https://doi.org/10.1021/acs.jpca.7b00252, 2017.
Henschel, H., Kurten, T., and Vehkamaki, H.: Computational Study on the Effect of Hydration on New Particle Formation in the Sulfuric Acid/Ammonia and Sulfuric Acid/Dimethylamine Systems, J. Phys. Chem. A, 120, 1886–1896, https://doi.org/10.1021/acs.jpca.5b11366, 2016.
IPCC: Climate Change 2013: The Physical Science Basis, Contribution of Working Group I to the Fifth Assessment Report of the Intergovernmental Panel on Climate Change, edited by: Stocker, T. F., Qin, D., Plattner, G.-K., Tignor, M., Allen, S. K., Boschung, J., Nauels, A., Xia, Y., Bex, V., and Midgley, P. M., Cambridge University Press, Cambridge, United Kingdom and New York, NY, USA, 1535 pp., 2013.
Jiang, J., Chen, M., Kuang, C., Attoui, M., and McMurry, P. H.: Electrical Mobility Spectrometer using a Diethylene Glycol Condensation Particle Counter for Measurement of Aerosol Size Distributions Down to 1 Nm, Aerosol Sci. Tech., 45, 510–521, https://doi.org/10.1080/02786826.2010.547538, 2011.
Kirkby, J., Curtius, J., Almeida, J., Dunne, E., Duplissy, J., Ehrhart, S., Franchin, A., Gagné, S., Ickes, L., Kürten, A., Kupc, A., Metzger, A., Riccobono, F., Rondo, L., Schobesberger, S., Tsagkogeorgas, G., Wimmer, D., Amorim, A., Bianchi, F., Breitenlechner, M., David, A., Dommen, J., Downard, A., Ehn, M., Flagan, R.C., Haider, S., Hansel, A., Hauser, D., Jud, W., Junninen, H., Kreissl, F., Kvashin, A., Laaksonen, A., Lehtipalo, K., Lima, J., Lovejoy, E. R., Makhmutov, V., Mathot, S., Mikkilä, J., Minginette, P., Mogo, S., Nieminen, T., Onnela, A., Pereira, P., Petäjä, T., Schnitzhofer, R., Seinfeld, J. H., Sipilä, M., Stozhkov, Y., Stratmann, F., Tomé, A., Vanhanen, J., Viisanen, Y., Vrtala, A., Wagner, P. E., Walther, H., Weingartner, E., Wex, H., Winkler, P. M., Carslaw, K. S., Worsnop, D. R., Baltensperger, U., and Kulmala, M.: Role of sulphuric acid, ammonia and galactic cosmic rays in atmospheric aerosol nucleation, Nature, 476, 429–435, https://doi.org/10.1038/nature10343, 2011.
Kreyling, W. G., Semmler-Behnke, M., and Moller, W.: Ultrafine Particle-Lung Interactions: Does Size Matter?, J. Aerosol Med., 19, 74–83, https://doi.org/10.1089/jam.2006.19.74, 2006.
Kuang, C., Chen, M., Zhao, J., Smith, J., McMurry, P. H., and Wang, J.: Size and time-resolved growth rate measurements of 1 to 5 nm freshly formed atmospheric nuclei, Atmos. Chem. Phys., 12, 3573–3589, https://doi.org/10.5194/acp-12-3573-2012, 2012.
Kulmala, M., Vehkamaki, H., Petaja, T., Dal Maso, M., Lauri, A., Kerminen, V.-M., Birmili, W., and McMurry, P. H.: Formation and Growth Rates of Ultrafine Atmospheric Particles: A Review of Observations, J. Aerosol Sci., 35, 143–176, https://doi.org/10.1016/j.jaerosci.2003.10.003, 2004.
Kürten, A.: New particle formation from sulfuric acid and ammonia: nucleation and growth model based on thermodynamics derived from CLOUD measurements for a wide range of conditions, Atmos. Chem. Phys., 19, 5033–5050, https://doi.org/10.5194/acp-19-5033-2019, 2019.
Kürten, A., Rondo, L., Ehrhart, S., and Curtius, J.: Calibration of a Chemical Ionization Mass Spectrometer for the Measurement of Gaseous Sulfuric Acid, J. Phys. Chem. A, 116, 6375–6386, https://doi.org/10.1021/jp212123n, 2012.
Kürten, A., Williamson, C., Almeida, J., Kirkby, J., and Curtius, J.: On the derivation of particle nucleation rates from experimental formation rates, Atmos. Chem. Phys., 15, 4063–4075, https://doi.org/10.5194/acp-15-4063-2015, 2015.
Kürten, A., Bianchi, F., Almeida, J., Kupiainen-Määttä, O., Dunne, E. M., Duplissy, J., Williamson, C., Barmet, P., Breitenlechner, M., Dommen, J., Donahue, N. M., Flagan, R. C., Franchin, A., Gordon, H., Hakala, J., Hansel, A., Heinritzi, M., Ickes, L., Jokinen, T., Kangasluoma, J., Kim, J., Kirkby, J., Kupc, A., Lehtipalo, K., Leiminger, M., Makhmutov, V., Onnela, A., Ortega, I. K., Petäjä, T., Praplan, A. P., Riccobono, F., Rissanen, M. P., Rondo, L., Schnitzhofer, R., Schobesberger, S., Smith, J. N., Steiner, G., Stozhkov, Y., Tomé, A., Tröstl, J., Tsagkogeorgas, G., Wagner, P. E., Wimmer, D., Ye, P., Baltensperger, U., Carslaw, K., Kulmala, M., and Curtius, J.: Experimental particle formation rates spanning tropospheric sulfuric acid and ammonia abundances, ion production rates and temperatures, J. Geophys. Res.-Atmos., 121, 12377–12400, https://doi.org/10.1002/2015JD023908, 2016.
Kürten, A., Li, C., Bianchi, F., Curtius, J., Dias, A., Donahue, N. M., Duplissy, J., Flagan, R. C., Hakala, J., Jokinen, T., Kirkby, J., Kulmala, M., Laaksonen, A., Lehtipalo, K., Makhmutov, V., Onnela, A., Rissanen, M. P., Simon, M., Sipilä, M., Stozhkov, Y., Tröstl, J., Ye, P., and McMurry, P. H.: New particle formation in the sulfuric acid-dimethylamine-water system: reevaluation of CLOUD chamber measurements and comparison to an aerosol nucleation and growth model, Atmos. Chem. Phys., 18, 845–863, https://doi.org/10.5194/acp-18-845-2018, 2018.
Kurtén, T., Loukonen, V., Vehkamäki, H., and Kulmala, M.: Amines are likely to enhance neutral and ion-induced sulfuric acid-water nucleation in the atmosphere more effectively than ammonia, Atmos. Chem. Phys., 8, 4095–4103, https://doi.org/10.5194/acp-8-4095-2008, 2008.
Kurten, T., Lane, J. R., Jørgensen, S., and Kjaergaard, H. G.: A Computational Study of the Oxidation of SO2 to SO3 by Gas-Phase Organic Oxidants, J. Phys. Chem. A, 115, 8669–8681, 2011.
Larriba, A., Hogan, C., and de Lamora, J.: The Mobility–Volume Relationship below 3.0 nm Examined by Tandem Mobility–Mass Measurement, Aerosol Sci. Tech., 45, 453–467, 2010.
Lovejoy, E. R., Hanson, D. R., and Huey, L. G.: Kinetics and Products of the Gas-Phase Reaction of SO3 with Water, J. Phys. Chem., 100, 19911–19916, 1996.
McMurry, P. H.: New Particle Formation in the Presence of an Aerosol: Rates, Time Scales, and Sub-0.01 Um Size Distributions, J. Colloid Interf. Sci., 95, 72–80, https://doi.org/10.1016/0021-9797(83)90073-5, 1983.
McMurry, P. H., Fink, M., Sakurai, H., Stolzenburg, M. R., Mauldin III, R. L., Smith, J., Eisele, F., Moore, K., Sjostedt, S., Tanner, D., Huey, L. G., Nowak, J. B., Edgerton, E., and Voisin, D.: A Criterion for New Particle Formation in the Sulfur-Rich Atlanta Atmosphere, J. Geophys. Res., 110, D22S02, https://doi.org/10.1029/2005JD005901, 2005.
Nadykto, A. and Yu, F.: Amine's in the Earth's Atmosphere: A Density Functional Theory Study of the Thermochemistry of Pre-Nucleation Clusters, Entropy, 13, 554–569, 2011.
Nel, A.: Air Pollution-Related Illness: Effects of Particles, Science, 308, 804–806, https://doi.org/10.1126/science.1108752, 2005.
Ortega, I. K., Kupiainen, O., Kurtén, T., Olenius, T., Wilkman, O., McGrath, M. J., Loukonen, V., and Vehkamäki, H.: From quantum chemical formation free energies to evaporation rates, Atmos. Chem. Phys., 12, 225–235, https://doi.org/10.5194/acp-12-225-2012, 2012
Panta, B., Glasoe, W. A., Zollner, J. H., Carlson, K. K., and Hanson, D. R.: Computational Fluid Dynamics of a Cylindrical Nucleation Flow Reactor with Detailed Cluster Thermodynamics, J. Phys. Chem. A, 116, 10122–10134, https://doi.org/10.1021/jp302444y, 2012.
Payne, W. A., Stief, L. J., and Davis, D. D.: A Kinetics Study of the Reaction of HO2 with SO2 and NO, J. Am. Chem. Soc., 95, 7614–7619, 1973.
Sipilä, M., Berndt, T., Petaejae, T., Brus, D., Vanhanen, J. Stratmann, F., Patokoski, J., Mauldin, L., Hyvärinen, A.-P., Lihavainen, H., and Kulmala, M.: The Role of Sulfuric Acid in Atmospheric Nucleation, Science, 327, 1243–1246, https://doi.org/10.1126/science.1180315, 2010.
Sörgel, M., Regelin, E., Bozem, H., Diesch, J.-M., Drewnick, F., Fischer, H., Harder, H., Held, A., Hosaynali-Beygi, Z., Martinez, M., and Zetzsch, C.: Quantification of the unknown HONO daytime source and its relation to NO2, Atmos. Chem. Phys., 11, 10433–10447, https://doi.org/10.5194/acp-11-10433-2011, 2011.
Viisanen, Y., Kulmala, M., and Laaksonen, A.: Experiments on Gas-Liquid Nucleation of Sulfuric Acid and Water, J. Chem. Phys., 107, 920–926, https://doi.org/10.1063/1.474445, 1997.
Verheggen, B. and Mozurkewich, M.: Determination of Nucleation and Growth Rates from Observation of a SO2 Induced Atmospheric Nucleation Event, J. Geophys. Res. 107, 4123, https://doi.org/10.1029/2001JD000683, 2002.
Wexler, A. S. and Clegg, S. L.: Atmospheric Aerosol Models for Systems Including the Ions H+, NH4+, Na+, SO, NO, Cl−, Br−, and H2O, J. Geophys. Res., 107, 4207, https://doi.org/10.1029/2001JD000451, 2002.
Wyslouzil, B. E., Seinfeld, J. H., Flagan, R. C., and Okuyama, K.: Binary Nucleation in Acid-Water Systems. II. Sulfuric Acid-Water and a Comparison with Methanesulfonic Acid-Water, J. Chem. Phys., 94, 6842–6850, https://doi.org/10.1063/1.460262, 1991.
Young, L. H., Benson, D. R., Kameel, F. R., Pierce, J. R., Junninen, H., Kulmala, M., and Lee, S.-H.: Laboratory studies of H2SO4∕H2O binary homogeneous nucleation from the SO2+OH reaction: evaluation of the experimental setup and preliminary results, Atmos. Chem. Phys., 8, 4997–5016, https://doi.org/10.5194/acp-8-4997-2008, 2008.
Yu, H., McGraw, R., and Lee, S.-H.: Effects of Amines on Formation of Sub-3 Nm Particles and their Subsequent Growth, Geophys. Res. Lett., 39, L02807, https://doi.org/10.1029/2011GL050099, 2012.
Yu, H., Dai, L., Zhao, Y., Kanawade, V. P., Tripathi, S. N., Ge, X., Chen, M., and Lee, S.-H.: Laboratory Observations of Temperature and Humidity Dependencies of Nucleation and Growth Rates of Sub-3 nm Particles, J. Geophys. Res.-Atmos., 122, 1919–1929, https://doi.org/10.1002/2016JD025619, 2017.
Zollner, J. H., Glasoe, W. A., Panta, B., Carlson, K. K., McMurry, P. H., and Hanson, D. R.: Sulfuric acid nucleation: power dependencies, variation with relative humidity, and effect of bases, Atmos. Chem. Phys., 12, 4399–4411, https://doi.org/10.5194/acp-12-4399-2012, 2012.