the Creative Commons Attribution 4.0 License.
the Creative Commons Attribution 4.0 License.
 | 12 Jul 2019
Persistent growth of anthropogenic non-methane volatile organic compound (NMVOC) emissions in China during 1990–2017: drivers, speciation and ozone formation potential
Qiang Zhang
Dan Tong
Yu Lei
Chaopeng Hong
Sicong Kang
Liu Yan
Yuxuan Zhang
Yu Bo
Yafang Cheng
Kebin He
Non-methane volatile organic compounds (NMVOCs) are important ozone and secondary organic aerosol precursors and play important roles in tropospheric chemistry. In this work, we estimated the total and speciated NMVOC emissions from China's anthropogenic sources during 1990–2017 by using a bottom-up emission inventory framework and investigated the main drivers behind the trends. We found that anthropogenic NMVOC emissions in China have been increasing continuously since 1990 due to the dramatic growth in activity rates and absence of effective control measures. We estimated that anthropogenic NMVOC emissions in China increased from 9.76 Tg in 1990 to 28.5 Tg in 2017, mainly driven by the persistent growth from the industry sector and solvent use. Meanwhile, emissions from the residential and transportation sectors declined after 2005, partly offsetting the total emission increase. During 1990–2017, mass-based emissions of alkanes, alkenes, alkynes, aromatics, oxygenated volatile organic compounds (OVOCs) and other species increased by 274 %, 88 %, 4 %, 387 %, 91 % and 231 %, respectively. Following the growth in total NMVOC emissions, the corresponding ozone formation potential (OFP) increased from 38.2 Tg of O3 in 1990 to 99.7 Tg of O3 in 2017. We estimated that aromatics accounted for the largest share (43 %) of the total OFP, followed by alkenes (37 %) and OVOCs (10 %). Growth in China's NMVOC emissions was mainly driven by the transportation sector before 2000, while industry and solvent use dominated the emission growth during 2000–2010. Since 2010, although emissions from the industry sector and solvent use kept growing, strict control measures on transportation and fuel transition in residential stoves have successfully slowed down the increasing trend, especially after the implementation of China's clean air action since 2013. However, compared to large emission decreases in other major air pollutants in China (e.g., SO2, NOx and primary PM) during 2013–2017, the relatively flat trend in NMVOC emissions and OFP revealed the absence of effective control measures, which might have contributed to the increase in ozone during the same period. Given their high contributions to emissions and OFP, tailored control measures for solvent use and industrial sources should be developed, and multi-pollutant control strategies should be designed to mitigate both PM2.5 and ozone pollution simultaneously.
- Article
(7152 KB) - Full-text XML
-
Supplement
(308 KB) - BibTeX
- EndNote


With rapid economic growth and urbanization, high concentrations of ground ozone and aerosols have caused severe adverse effects on air quality, ecosystems and human health (Monks et al., 2015; Lu et al., 2018). Non-methane volatile organic compounds (NMVOCs) play key roles in producing ozone and secondary organic aerosols (SOAs), and some NMVOCs are toxic. NMVOCs can be emitted from a variety of sources, including anthropogenic, biogenic and open biomass burning (van der Werf et al., 2010; Guenther et al., 2012; Li et al., 2017). Previous studies revealed that reducing NMVOC emissions from anthropogenic sources is crucial for controlling ozone and fine particulate matter (PM2.5; with aerodynamic diameters less than or equal to 2.5 µm) pollution in Chinese cities (Shao et al., 2009; Yuan et al., 2013; Jin et al., 2015).
Anthropogenic NMVOC emissions over China have been estimated in various global and regional emission inventories (e.g., Klimont et al., 2002; Bo et al., 2008; Zhang et al., 2009; Li et al., 2014; Wei et al., 2014; Wu et al., 2016). Despite considering local statistics and measurements, uncertainties in NMVOC emissions are still high, i.e., ±68 %–±78 %, due to a lack of accurate information for a variety of sources such as solvent use, residential fuel combustion, etc. (Zhang et al., 2009; Kurokawa et al., 2013). In recent decades, dramatic changes in NMVOC emissions have taken place in China that are driven by economic development as well as implementation of control measures for the major sectors of industry, residential use and transportation (Wu et al., 2016; Li et al., 2017; Zheng et al., 2018). Energy-efficient and environmentally friendly technologies have been gradually introduced into the market. In addition, China has implemented stringent clean air policies to mitigate emissions in recent years, driving the significant reductions in emissions of air pollutants during 2013–2017 (Zheng et al., 2018).
Considering the large variances in chemical reactivity for different species, long-term chemically resolved emissions are urgently needed for tailored air pollution control measures in China. Previous efforts have been made to estimate speciated NMVOC emissions for China (e.g., Zhang et al., 2009; Li et al., 2014; Wu and Xie, 2017), but a long-term speciated NMVOC emission inventory over China is still missing. Chemical profiles are recognized as the major uncertainty sources for a speciated NMVOC emission inventory. For instance, oxygenated volatile organic compounds (OVOCs) were always missing in early measured source profiles (Liu et al., 2008). To reduce the uncertainties introduced by profiles, Li et al. (2014) developed a speciated NMVOC emission inventory over China for the year 2006 based on a composite source profile database with correction for OVOC fractions. Recent work has compiled an updated source profile database covering most species with inclusion of local measurements in China (Mo et al., 2016). However, these updates have rarely been used in developing long-term speciated NMVOC emissions for China. Here, we developed a long-term anthropogenic NMVOC emission inventory for China for the period of 1990–2017 by using updated activity data from the Multi-resolution Emission Inventory for China (MEIC) model framework (Liu et al., 2015; Li et al. 2017; Zheng et al., 2018) and a collection of state-of-the-art emission factors and source profiles.
The increasingly severe ozone pollution in China has been observed by the national monitoring network since 2013 (K. Li et al., 2018; Lu et al., 2018). Identifying the drivers of surface ozone rise is crucial for designing ozone control policy and protecting human health and ecosystems (K. Li et al., 2018). In the context of significant reductions for criteria pollutants such as NOx, SO2, CO and PM2.5 attributed to the implementation of control measures (Zheng et al., 2018), trends in NMVOC emissions and their potential effects on ozone production are critical for understanding the observed ozone trend and designing mitigation measures in the near future. Based on speciated NMVOC emissions developed in this work, we also estimate ozone formation potential (OFP) from different species and emitting sectors for the same period to inform targeted emission-control policies.
2.1 NMVOC emissions
We estimated the emissions of NMVOCs from 1990 to 2017 following the bottom-up framework of the MEIC model (available at http://www.meicmodel.org/, last access: 9 January 2019). The emissions were calculated based on a technology-based methodology, as described in detail by earlier papers (Zhang et al., 2009; Zheng et al., 2014, 2018; Liu et al., 2015; Li et al., 2017). Briefly, emissions for stationary sources were estimated based on the “emission factor” method following Eq. (1) (Zhang et al., 2009):
where i denotes the administrative unit of China, j is the source category in the classification system, k represents the fuel type for combustion-related sources or products for industrial processes, and m is the technology of fuel combustion or industrial production. E represents the estimated emissions, which are integrated by A (activity rate), X (technology distribution ratio) and the EF (emission factor) for each emitting source. The EF is determined based on the raw unabated emission factor (EFraw), the penetration ratio (Cn) and the removal efficiency of the control technology ηn as follows:
For power plants, NMVOC emissions were derived from the China coal-fired Power plant Emissions Database (CPED; Liu et al., 2015), which is developed based on detailed information on fuel type, fuel quality, combustion technology and pollutant abatement facilities for > 7600 power generation units nationwide in China. The improved emissions for the on-road transportation sector developed by Zheng et al. (2014) were integrated into the framework of MEIC, which estimated the vehicle population and emission factors at a county level.
A detailed four-level source classification system, representing sector, fuel and/or product, technology and/or solvent type, and end-of-pipe pollutant abatement facilities, was established by including over 700 emitting sources in the MEIC model. Only anthropogenic sources, excluding open biomass burning, aviation and international shipping, were considered. Emissions of biofuel burning in households were estimated in this inventory. We present a total of five sectors (power, industry, residential, solvent use and transportation) and 15 subsectors by combining 109 NMVOC emitting sources by fuel type, industrial product, solvent use, vehicle type and diesel engine in Table 1. The detailed source categories, activity rates, emission factors and references are given in Table S1. Both combustion processes using fossil fuel and biofuel were considered for boilers and stoves. The subsector of “oil production, distribution and refinery” includes the evaporative emissions during oil production, transfer, refining and refueling in oil stations.

Paint use was further divided from the solvent use sector and includes the paint use applied to architecture, vehicles, wood and other industrial purposes. The inter-annual market shares of waterborne and solvent-based paint were further taken into account for each source category. Printing ink, pharmaceutical production, pesticide use, glue use and domestic solvent use were separately calculated and grouped into the subsector of “solvent use other than paint”.
For on-road transportation, we set up a process-based calculation framework for gasoline and diesel vehicles classified into eight types covering both trucks and passenger cars and four performance categories (high-duty, medium-duty, light-duty and mini). Each emitting process, including pollutant exhaust in the running mode and NMVOC evaporation, was considered. China's emission standards matching pre-Euro I and Euro I to Euro V emissions standards during 1990–2017 were applied for each vehicle type, as listed in Zheng et al. (2018).
2.1.1 Activity rates
Activity rates during 1990–2017 were mainly gathered and assigned from various official statistics released by the National Bureau of Statistics (NBS). The inter-annual coal consumption rates for each power plant unit were obtained from the CPED (Liu et al., 2015). For combustion-related sources in the industrial and residential sectors, the consumption rates of fossil fuel and biofuel were obtained from the provincial energy balance spreadsheets of the “China Energy Statistical Yearbook” (NBS, 1992–2017). The yields of industrial products were collected from various officially released statistics for the specific economic sector, such as the “China Statistical Yearbook”, ”China Rubber Industry Yearbook”, “China Chemical Industry Yearbook”, “China Light Industry Yearbook”, “China Paint and Coatings Industry Yearbook”, “China National Petroleum Corporation Yearbook”, “China Trade and External Economic Statistical Yearbook”, “China Plastics Industry Yearbook”, “China Industry Economy Statistical Yearbook”, “China Sugar and Liquor Yearbook”, and “China Food Industry Yearbook” (for references, see Table S1).
The amounts of solvent use were gathered or estimated from a wide range of available statistics and peer-reviewed literature published by Chinese researchers (“China Paint and Coatings Industry Yearbook”, “China Chemical Industry Yearbook”, “China Industry Economy Statistical Yearbook”, “China Forestry Statistical Yearbook”, and “China Statistical Yearbook for Regional Economy”; Wei et al., 2009). Paint use was further divided into seven subcategories (as listed in Table S1) by assigning a splitting ratio based on local studies (Wei et al., 2009). For solvent use other than paint, the solvent consumption amounts were obtained from statistics or reports (for printing, vehicle treatment, wood production, pharmaceutical production, pesticide use, dry clean and glue use) or estimated using proxies (for domestic solvent). Limited information by province is available for the solvent use sector; we allocated the national activity rates derived from yearbooks into provinces based on the construction area, vehicle production, vehicle ownership, cultivation area, etc., according to the solvent application type.
The activity rates of on-road vehicles were assigned following the approach of Zheng et al. (2014), which modeled the vehicle ownership and fuel consumption by counties for each vehicle type, with provincial statistics as inputs (NBS, 2000–2015; NBS, 1990–2017). The diesel amounts consumed in off-road engines for each province were obtained from the sector-specific statistical data (“China Transportation and Communications Yearbook”, “China Automotive Industry Yearbook”, “China Agriculture Statistical Report”, and “China Statistical Yearbook on Construction”).
2.1.2 Emission factors
Emission factors were determined based on first-hand measurements or local surveys, including the European Environment Agency (EEA) guidebook (EEA, 2016), the AP-42 database (EPA, 1995) and peer-reviewed literature (Tsai et al., 2003; He, 2006; Wei et al., 2009; Zheng et al., 2014). The unabated emission factors used in our calculation and their references are listed in Table S1. Previous studies have conducted a comprehensive overview of available emission factors from measurements in China and databases from other countries that complied with China's inventory compiling system (Klimont et al., 2002; Bo et al., 2008; Wu et al., 2016). We firstly evaluated the emission factors based on local measurements or that were determined by taking China's regulations into account, e.g., the values of Wei et al. (2009) for solvent use, values of Tsai et al. (2003) for residential coal combustion and the technology-based emission factors derived from Zheng et al. (2014) for on-road vehicles. For most industrial processes and solvent use sources, local measurements of emission factors are still limited in China, and more investigations need to be conducted in the future. Regarding these sources, we mainly refer to European studies (EEA, 2016) or AP-42 (EPA, 1995) combined with source information from local investigations where available (Zhang et al., 2000; Tsai et al., 2003; He, 2006; Li et al., 2011; Wang et al., 2013).
Control strategies for NMVOCs have been applied to solvent use, industry, residential and transportation sources in recent years. The underlying technology penetration rates were derived from reports and surveys and supplemented with unpublished data from the Ministry of Ecology and Environment of the People's Republic of China (Zheng et al., 2018; Peng et al., 2019). As of 2017, a series of regulations on paint use, covering wood, architecture, industrial and vehicle applications, have been established nationwide (as presented in Table S1), leading to the decline of corresponding emission factors. To comply with the emission standard in GB 18582-2008, waterborne paint containing low levels of organic chemicals has dominated the architectural interior wall coating since 2008 (Wei et al., 2009). Proportions of waterborne paints applied in architectural outdoor and automobile production lines have increased gradually, changing from 15 % to 84 % and 5 % to 37 % during 2005–2017, respectively, according to local surveys (Wang and Li, 2012). Notably, in Guangdong province, the waterborne solvent products have dominated the local market, covering a wide range of industries (with shares ≥ 70 %) by 2017 and benefiting from the pioneering implementation of environmental legislation. Replacing coal with natural gas and electricity in both industrial and residential boilers and fuel transitions from biofuel to commercial energy driven by an increase in per capita income have decreased the average emission strength (Peng et al., 2019). The stage-by-stage stringent emission standards implemented for on-road vehicles have had substantial effects on NMVOC emission reduction (Zheng et al., 2018). Newly registered vehicles must comply with the latest emission standards. Following the timeline of standards release, gasoline-light duty vehicles meeting Euro IV and Euro V standards represented > 55 % and > 8 %, respectively, of nationwide vehicles by 2017. In the meanwhile, the proportions of Euro V have increased up to > 60 % in Beijing and Shanghai. For diesel vehicles, the shares of Euro IV were estimated to be in the range of 29 %–63 % nationwide in 2017, varying by vehicle duties. In Beijing and Shanghai, diesel vehicles meeting Euro V were estimated to account for 29 %–74 % of the fleet. In addition, by 2017, all “yellow label” vehicles were eliminated for both gasoline and diesel vehicles, further eliminating NMVOC emissions from super emitters (Zheng et al., 2018).
Regarding OVOCs, we corrected the emission factors for on-road vehicles. Because current emission factors are only for non-methane hydrocarbons (NMHC), we applied correction ratios of 1.32, 1.08, 1.10 and 1.06 for heavy-duty and light-duty diesel vehicles and heavy-duty and light-duty gasoline vehicles to the original values to comply with the follow-up speciation for the total NMVOCs, assuming OVOC fractions of 32 %, 8 %, 10 % and 6 %, respectively, following the method of Li et al. (2014) and source profiles listed in Table S1.
2.2 Speciation of NMVOCs
Following Li et al. (2014), we developed emissions by individual chemical species based on the profile-assignment approach. First, we established a “composite” profile database for China by integrating the local profiles and supplementing them with the SPECIATE v4.5 database for absent sources (Simon et al., 2010; available at https://www.epa.gov/air-emissions-modeling/speciate-version-45-through-40, last access: 21 April 2018). Then, regarding OVOCs, we reviewed the profiles for all combustion-related sources, including the combustion of coal, fuel oil, gasoline and diesel in the power, industry, residential and transportation sectors, and corrected the incomplete profiles that were absent from the OVOC fractions. Especially, OVOCs account for more than 30 % for the residential coal (31 %), biofuel use (23 %–33 %) and exhaust from heavy-duty diesel vehicles (32 %). Finally, we assigned the composite profile to each source by setting up the source linkage between the profiles and the inventory. The selected source profiles used in this work are presented in Table S1.
The detailed procedure for developing the composite profile database is illustrated in Li et al. (2014). Briefly, for sources for which local profiles are available and for which there are significant differences in technology or legislation between China and western countries, only local profiles are used; otherwise, all corresponding profiles are listed as “candidate” ones and included for further compilation of the composite profile database. The gathered local profiles cover the following major contributing sources: biofuel combustion (Tsai et al., 2003; Liu et al., 2008; Wang et al., 2009; Mo et al., 2016); coal combustion (Liu et al., 2008; Shi et al., 2015); asphalt production (Liu et al., 2008); oil production, handling and refinery (Liu et al., 2008); vehicle varnish paint (Yuan et al., 2010); printing ink (Yuan et al., 2010; Zheng et al., 2013; H. Wang et al., 2014); gasoline evaporation (Liu et al., 2008; Zhang et al., 2013; Wu et al., 2015); polypropylene production (Mo et al., 2015); gasoline vehicles (Duffy et al., 1999; Schauer et al., 2002; Liu et al., 2008); and diesel vehicles (Schauer et al., 1999; Liu et al., 2008; Yao et al., 2015; Mo et al., 2016). In addition to the source profiles used for speciation in Li et al. (2014), we updated profiles that were newly added in SPECIATE v4.5 and local profiles measured in recent years (Zhang et al., 2013; H. Wang et al., 2014; Shi et al., 2015; Wu et al., 2015; Yao et al., 2015; Mo et al., 2015, 2016). Profiles for approximately 60 sources were updated, including power plants, paint production, industrial coal use, gasoline evaporation, coke production, biofuel combustion in residential stoves, glue use, paint use, vehicles and off-road diesel engines. Compared to Li et al. (2014), the update in source profiles results in higher mass fractions for alkenes, alkynes and OVOCs and lower contributions for aromatics.
Due to the improper sampling and analysis method used in profile measurements, several local profiles lack significant OVOC fractions (Li et al., 2014). We extended the revision to all combustion processes and corrected their profiles by appending the component of OVOCs with fractions derived from the “complete” profiles for the same source. After OVOC correction, all candidate profiles were averaged by species to establish the composite profile database. The equation of the OVOC revision is as follows:
where Xrevised is the mass fraction of species j in the revised profile for source i and Xori is the original mass fraction; represents the calculated mean of the OVOC proportion for all candidate profiles that have measured OVOCs.
2.3 Calculation of OFP
OFP is a widely used scale to investigate the potential ozone production due to emissions of NMVOCs and has been applied to guide the establishment of most cost-effective ozone mitigation measures (e.g., Song et al., 2007; Zheng et al., 2009). OFP for individual chemical species is calculated based on the mass and maximum incremental reactivity (MIR), which scales the ozone production potential for corresponding species:
where i, j and k represent the source, chemical species and province, respectively. OFP is the ozone formation potential, EVOC is the total NMVOC emission estimate, X represents the mass fraction for species j emitted from source i, derived from the composite profiles in this study, and MIR is the maximum incremental reactivity scale for species j (Carter, 1994, 2010).
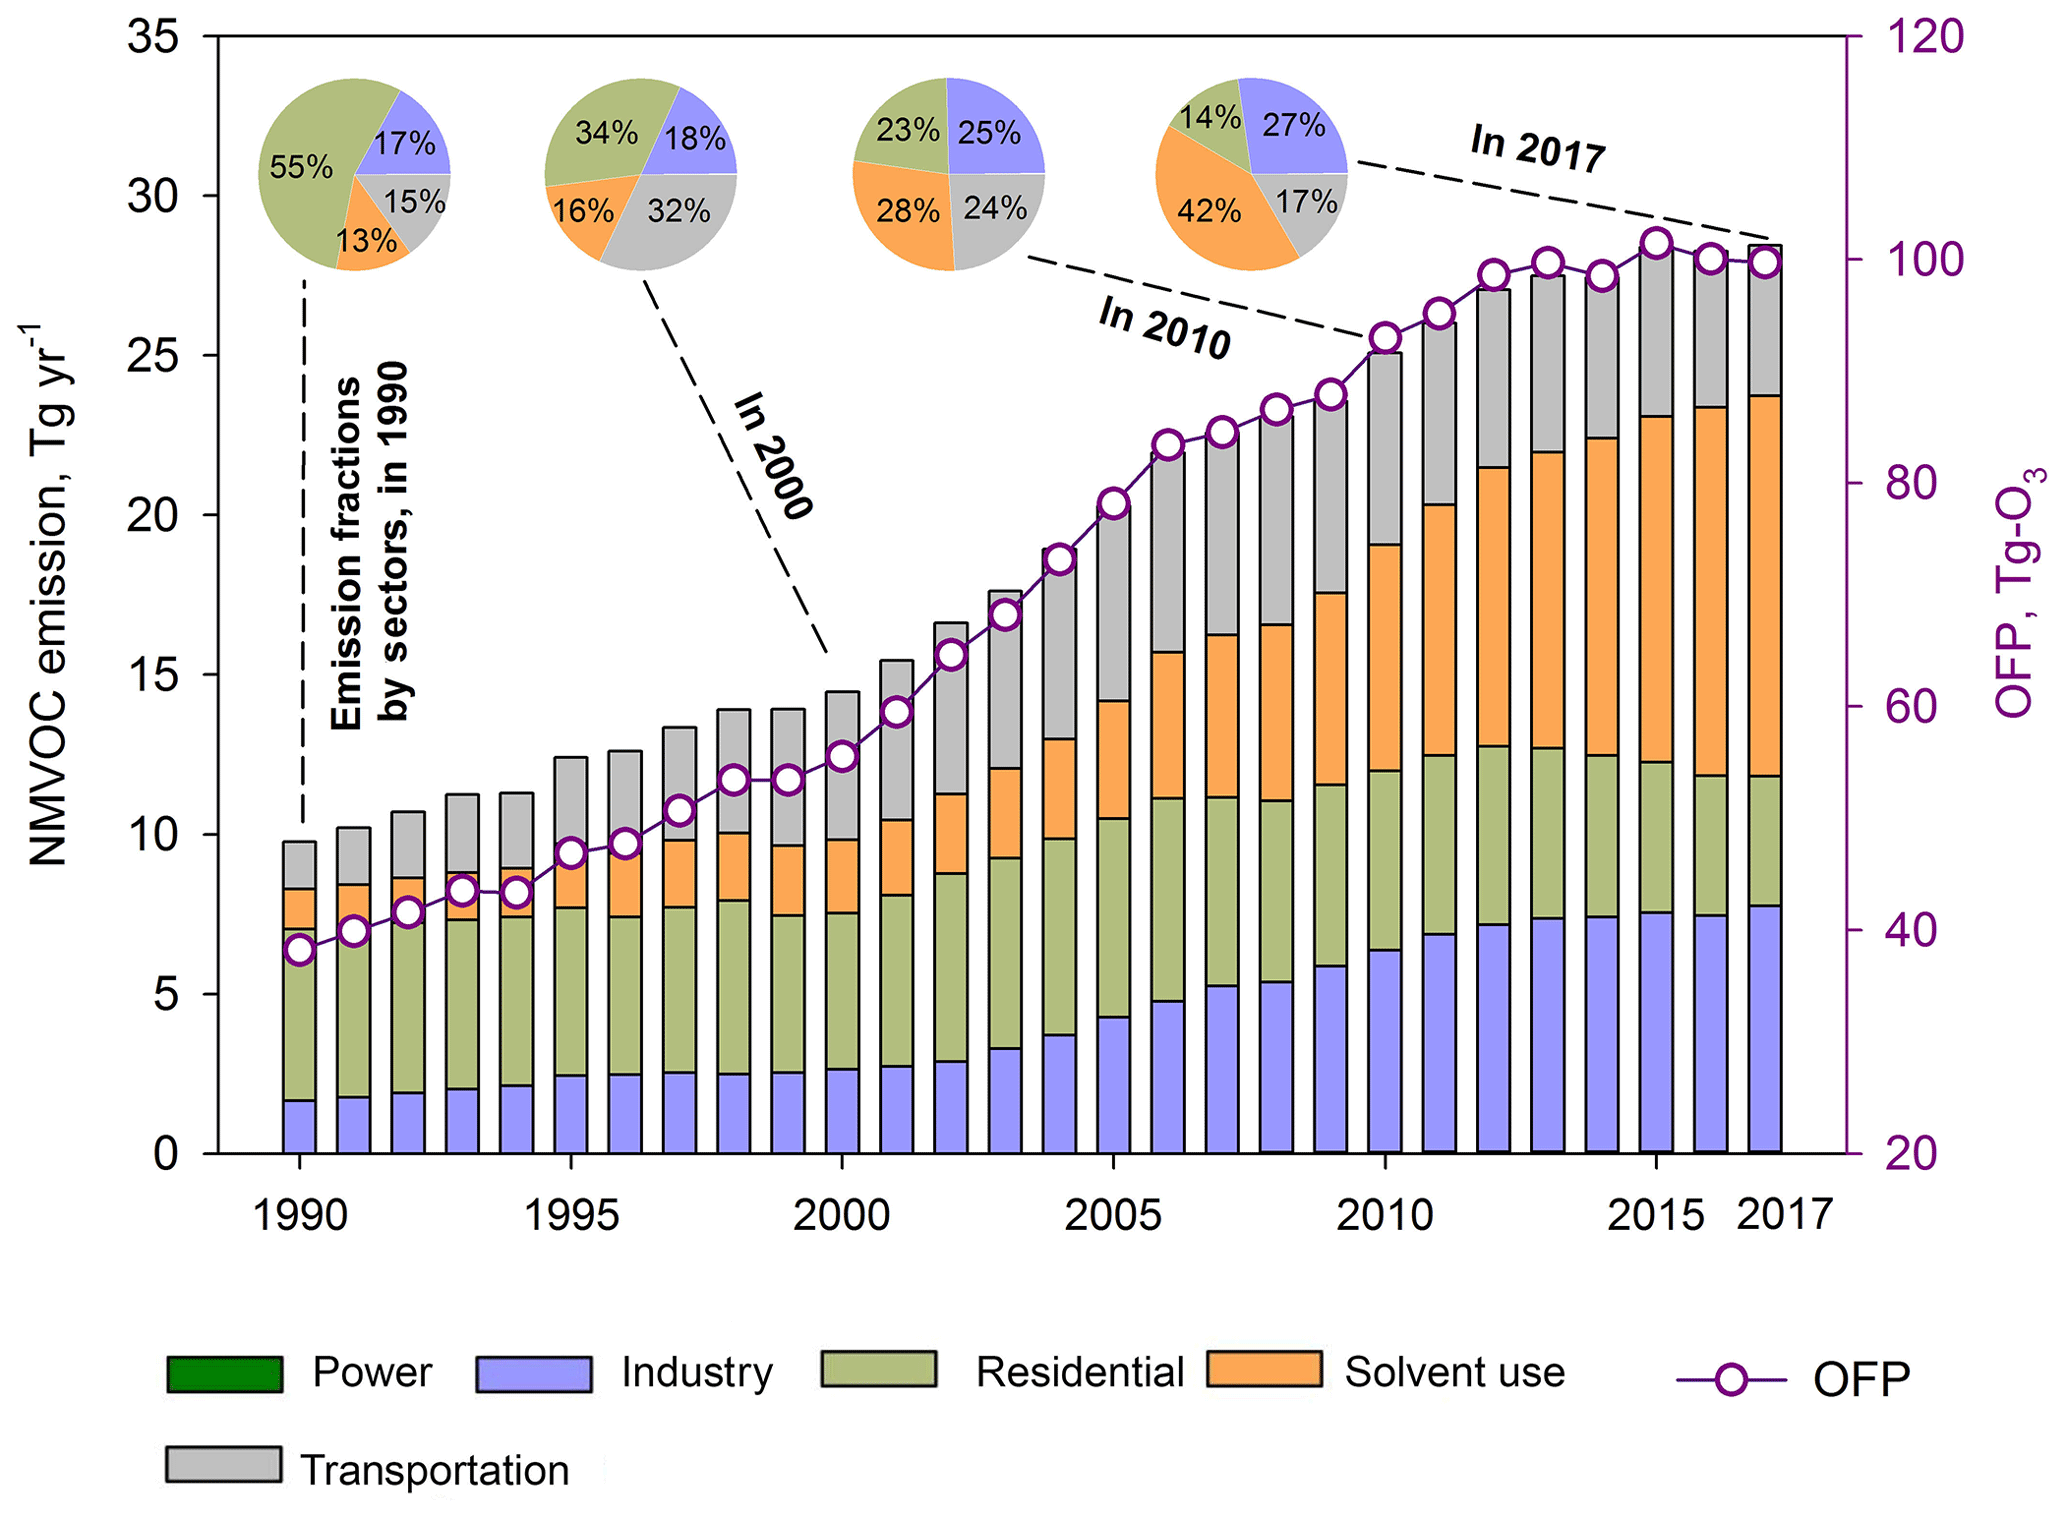
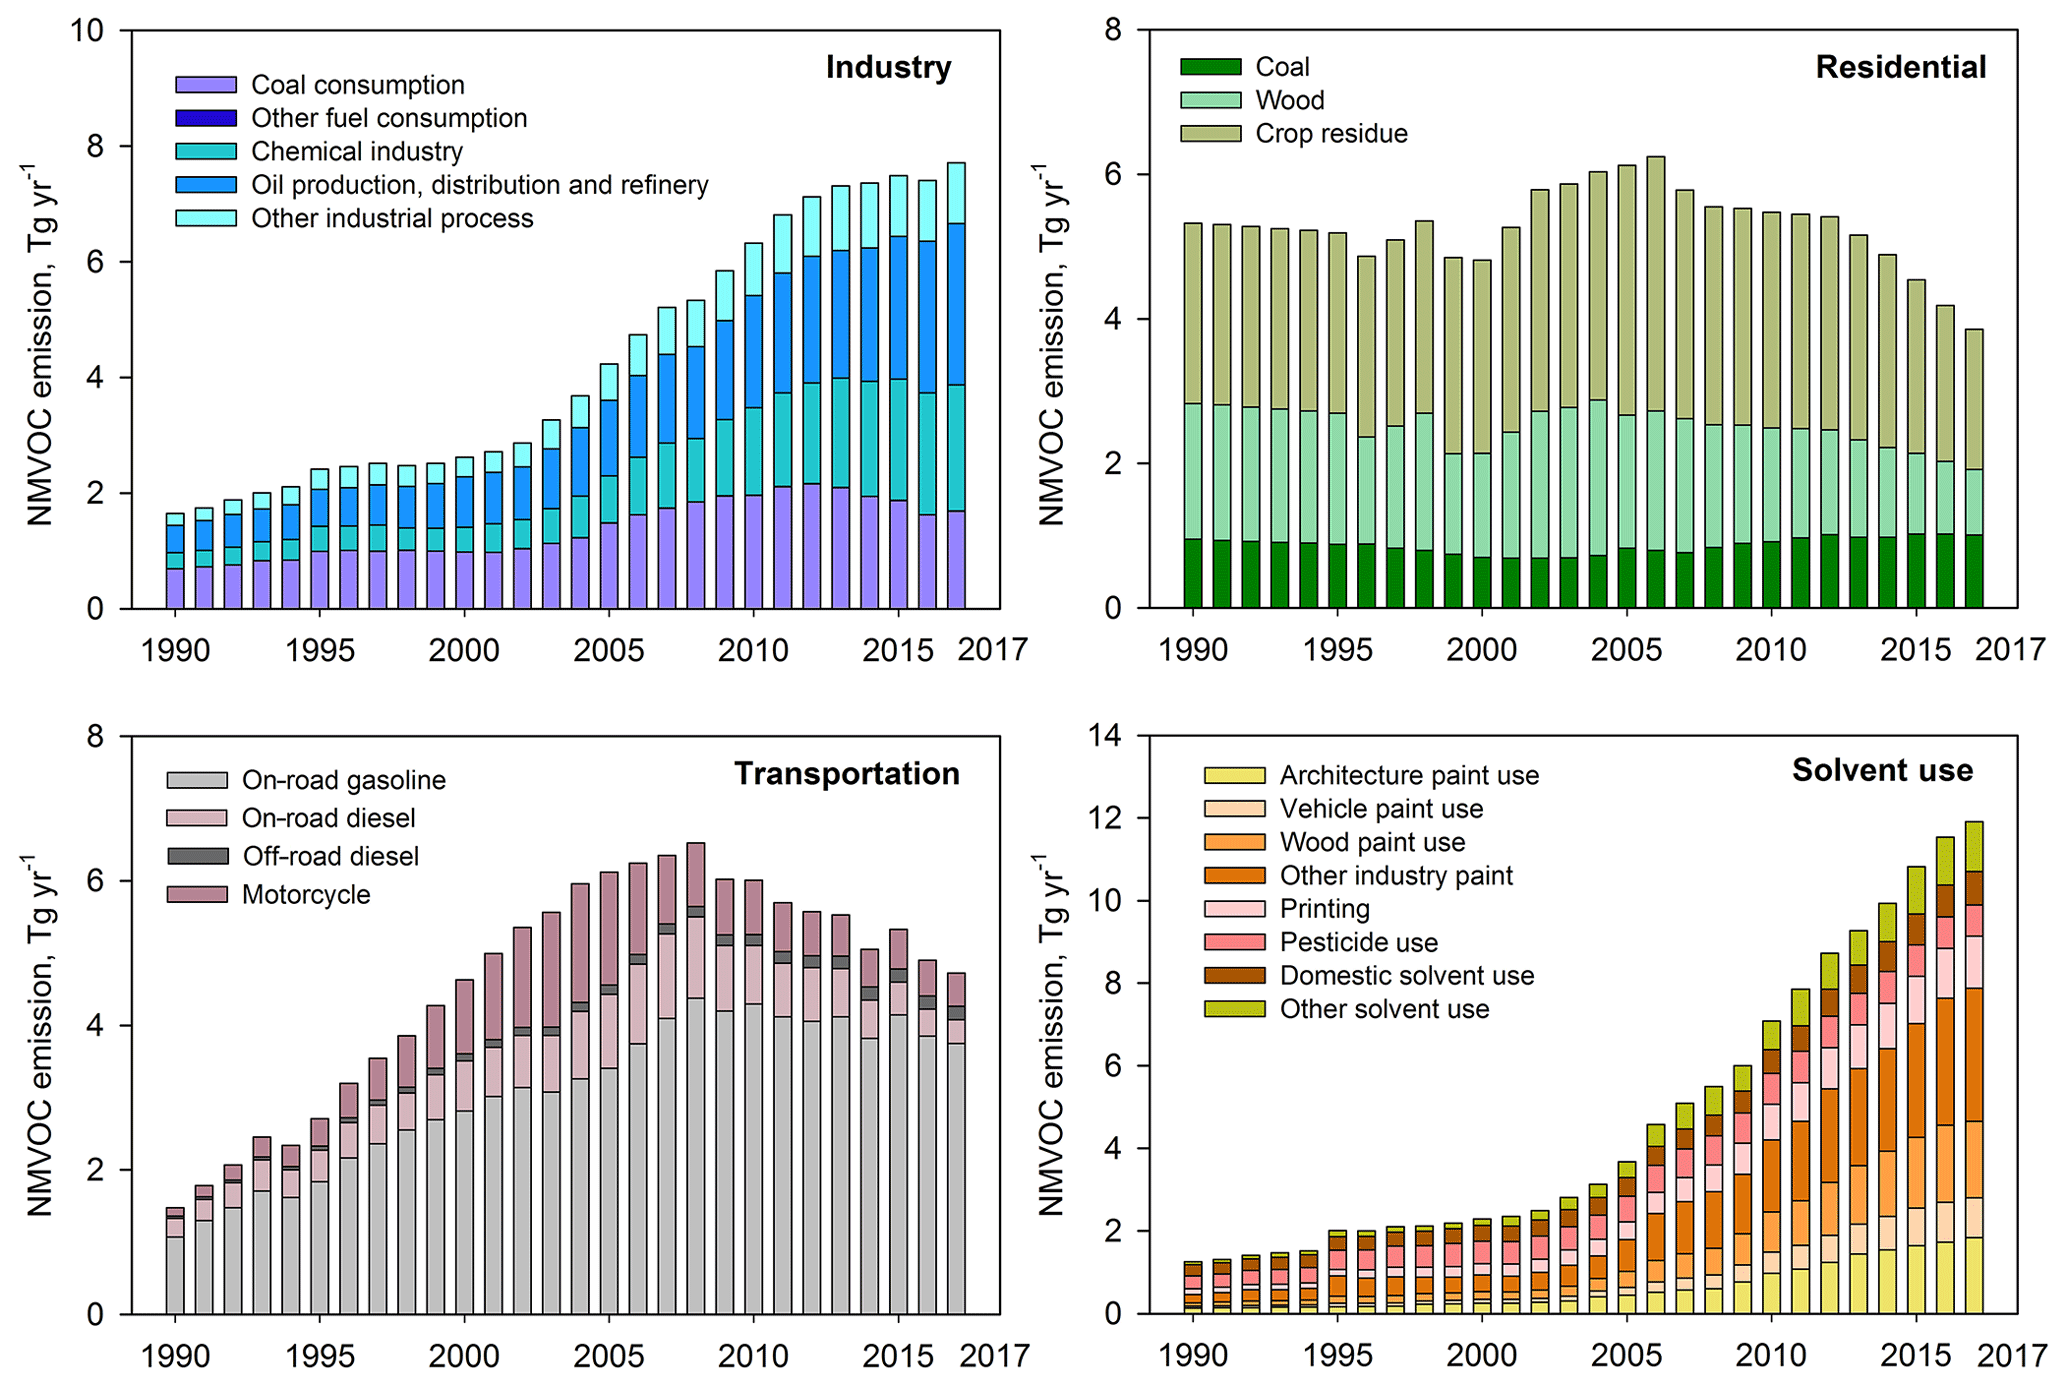
Figure 2NMVOC emissions by subcategories of industry, residential, transportation and solvent use sector in China from 1990 to 2017.
3.1 Emission trends and driving forces
China's NMVOC emissions have shown a continuously increasing trend. NMVOC emissions were estimated to be 9.8 Tg in 1990; then they increased to 14.5 Tg in 2000, 20.3 Tg in 2005, 25.1 Tg in 2010 and 28.5 Tg in 2017, with annual growth rates of 4.0 % (1990–2000), 7.0 % (2000–2005), 4.3 % (2005–2010) and 1.8 % (2010–2017). Emissions by sectors and subcategories for each sector during 1990–2017 are shown in Figs. 1 and 2, respectively (details in Table 1). Industry (+6.0 Tg, +368 %) and solvent use (+10.7 Tg, +850 %) are the main sectors driving the total emission increase during 1990–2017. The transportation emissions first increased rapidly and then decreased, peaking at 6.5 Tg in 2008. Residential emissions gradually decreased during the last decade, dominated by biofuel combustion, leading to a 24 % emission decline in 2017 compared to 1990. As a result, the proportions by sector for national emissions have changed, with growing contributions from industry (17 %–27 % for 1990–2017) and solvent use (13 %–42 %), shrinking contributions from residential use (55 %–14 %), and stable contributions from the transportation sector (15 %–17 %).
The emission trends by subcategory for each major sector (industry, residential, solvent use and transportation) are further illustrated in Fig. 2. Coal combustion, the chemical industry and oil-related processes are the main contributors to the industrial emission changes. Despite the gradual decline in industrial coal use since 2012, industrial processes still show a continuously increasing trend, driven by the chemical industry. The rapid emission growth of solvent use can be attributed to several sources, including paint use and other various solvent applications. Both the residential and transportation sectors have started to decrease in recent years. The significant reductions in crop residue use in residential stoves are consistent with the socioeconomic development in rural areas of China. Vehicular emissions show a sharp increase from 1990 to 2008, driven by the increase in vehicle ownership, then decrease gradually because of the stage-by-stage implementation of volatile organic compound (VOC) abatement measures, especially for gasoline-fueled passenger cars.
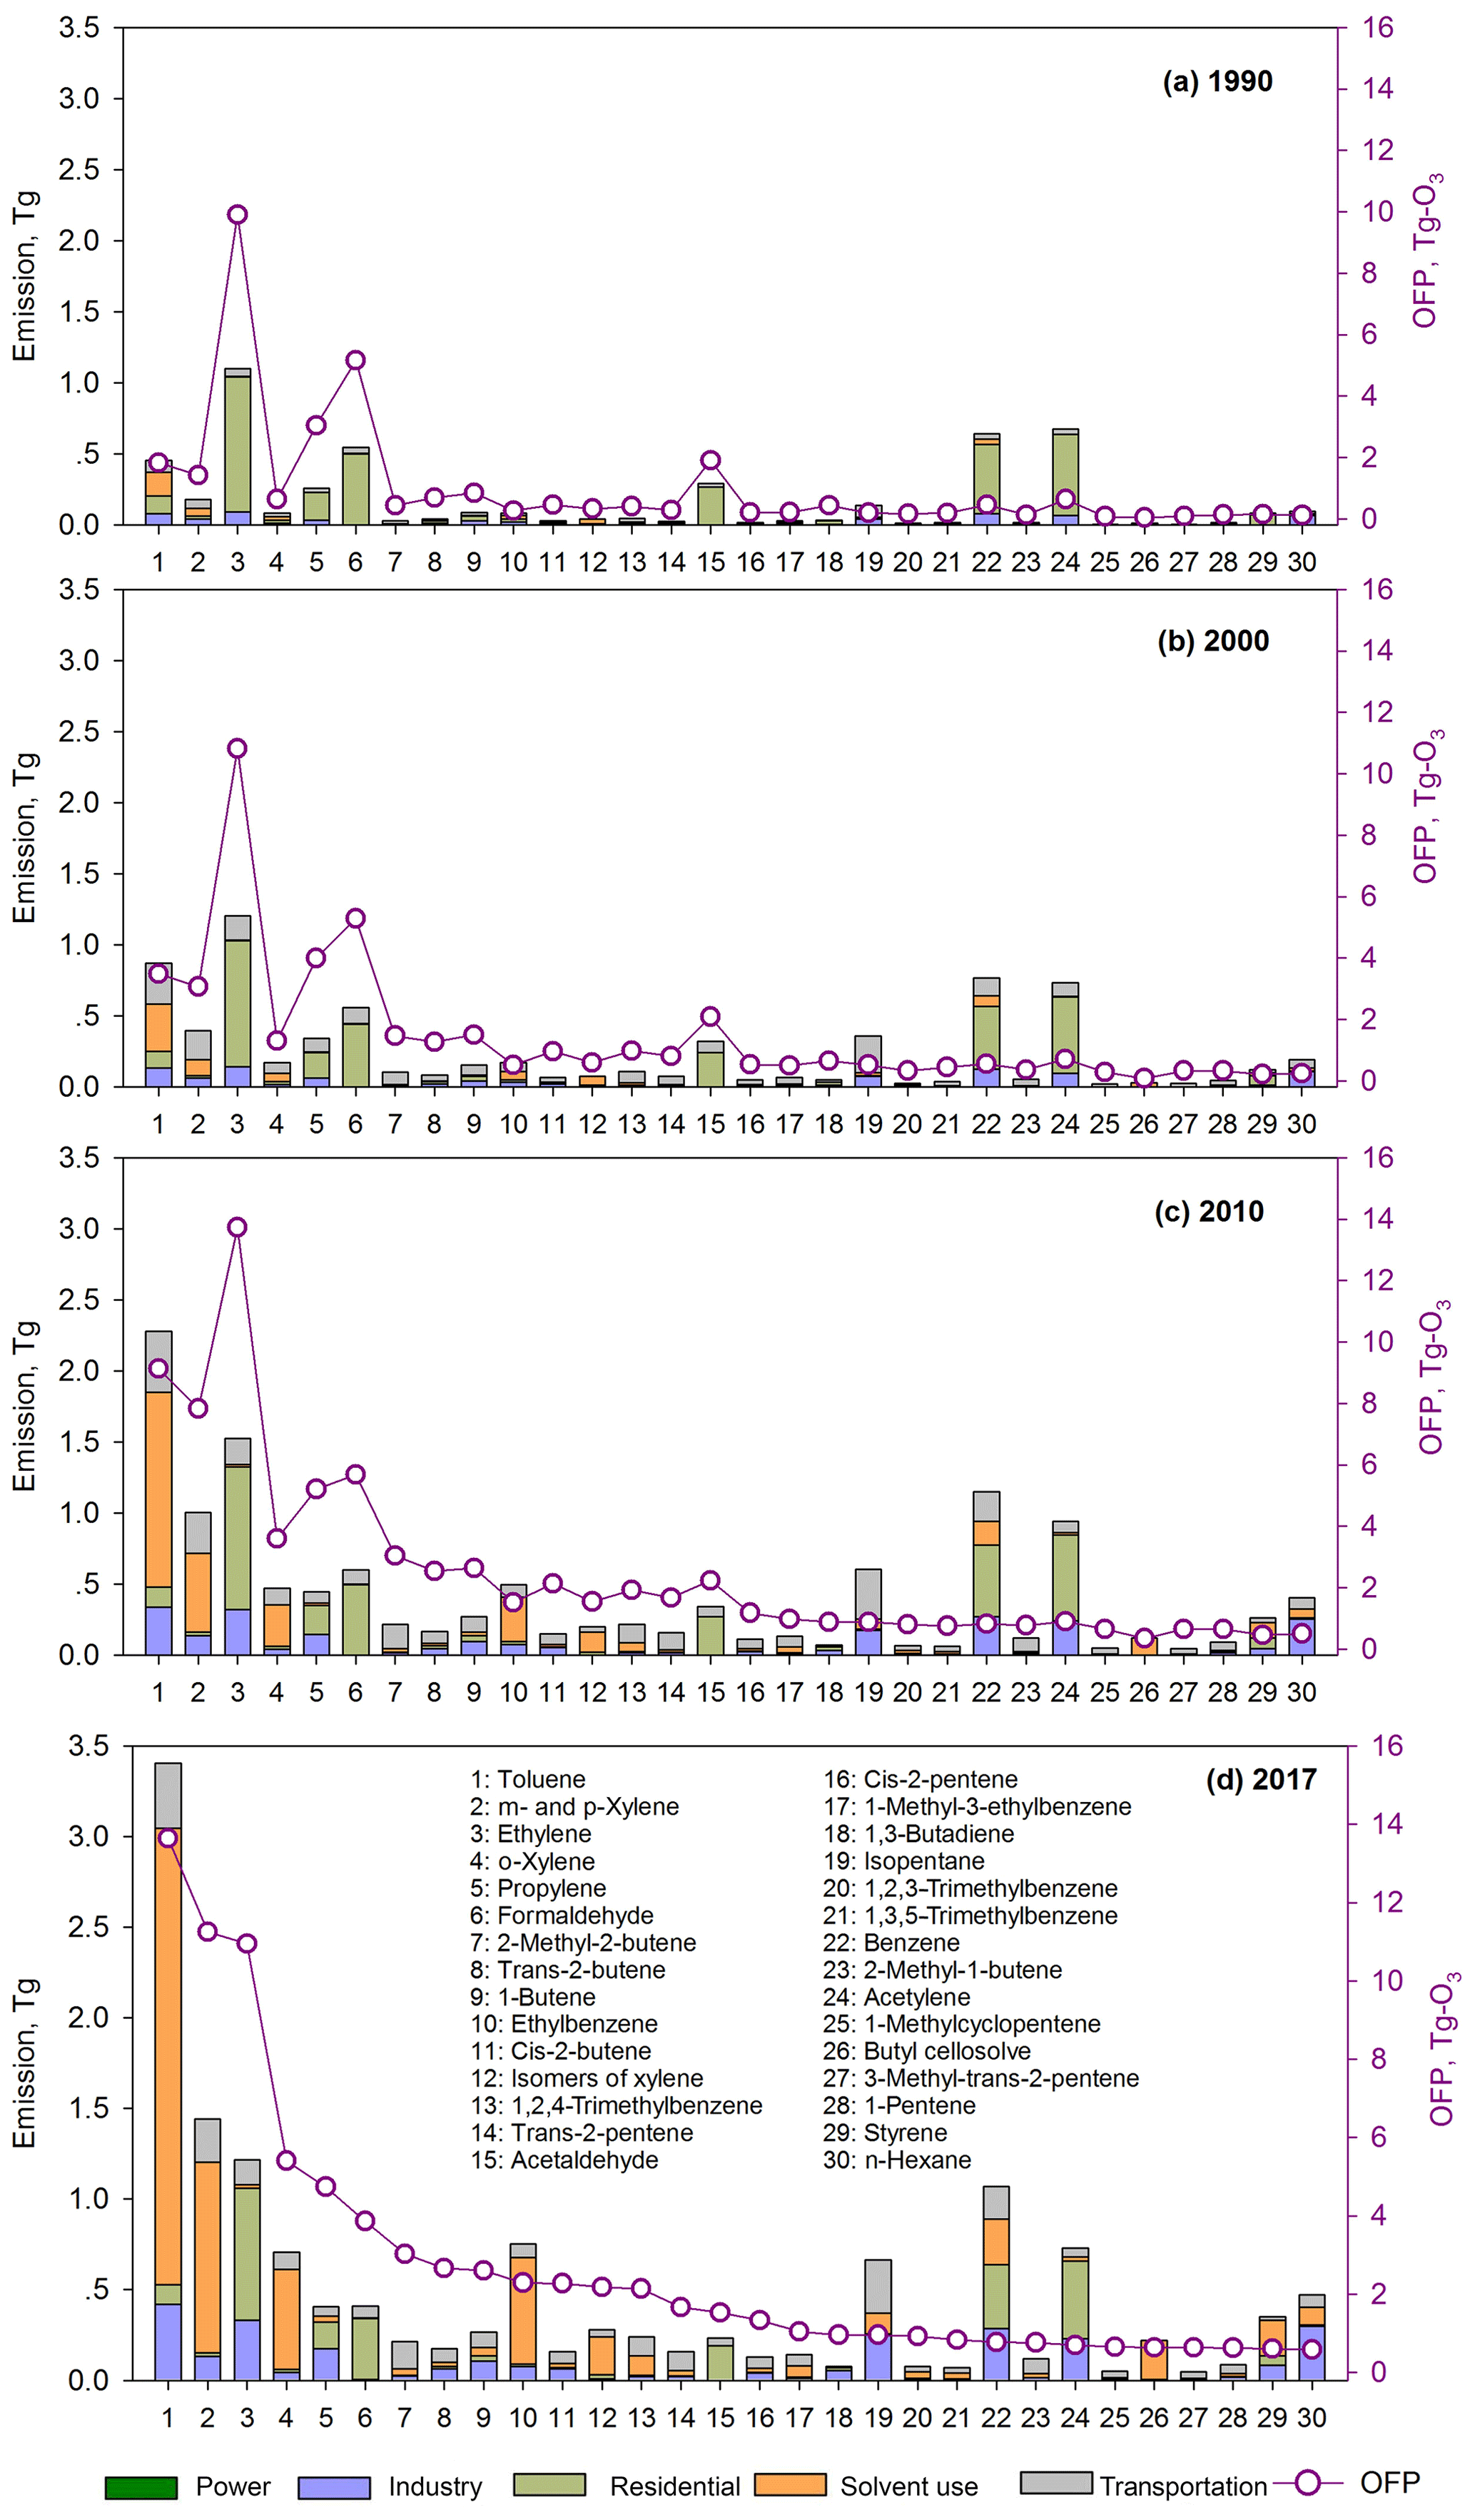
Figure 3Emissions of the top 30 species contributing to OFP in 2017 in an OFP-descending order by sector in 1990 (a), 2000 (b), 2010 (c) and 2017 (d).
3.2 Speciated NMVOC emissions
Emissions by individual chemical species were developed based on the total NMVOC emissions (as illustrated above) and the mass fractions derived from source profiles. Figure 3d presents the sectorial emissions of the top 30 species in OFP-descending order in 2017, which together account for > 80 % of the total OFP. Toluene is the largest contributor to OFP, with emissions estimated to be 3.4 Tg (12.0 % of the total), followed by m- and p-xylene (1.4 Tg, 5.1 %), ethylene (1.2 Tg, 4.3 %), o-xylene (0.71 Tg, 2.5 %), propylene (0.41 Tg, 1.4 %) and formaldehyde (0.41 Tg, 1.4 %; in OFP-descending order). The different distribution patterns between mass and OFP are attributed to the variations among chemical species in the reactivity scales of MIR. In 2017, toluene, xylene (including all isomers of xylene, i.e., m- and p-xylene and o-xylene), and ethylbenzene were dominated by solvent use, while ethylene, propylene and formaldehyde were mainly contributed by industrial and residential sources.
We present the emissions by sector for these 30 species in 1990, 2000 and 2010 with the calculated OFP as references in Fig. 3a–c. Notably, aromatics, including toluene and xylene, showed dramatic emission increases, whereas alkenes (ethylene and propylene) and OVOCs (formaldehyde and acetaldehyde) showed moderate changes. For the first 10-year period (1990–2000), ethylene contributed approximately 10 % by mass and 20 %–25 % by OFP, ranking first among all identified species. Transportation drove up emissions of all chemical species during 1990–2000. In the second 10-year stage (2000–2010), toluene surpassed ethylene, becoming the largest contributor to the total emissions, with an increase in proportion from 6 % to 9 %. Similar increasing trends were estimated for other aromatic species linked to the solvent use and industry sectors. Solvent use has continuously driven up related species such as toluene and xylene since 2010 due to the increasing demand and relatively limited penetration of control measures. Meanwhile, ethylene, acetylene and formaldehyde started to decrease as a result of reductions in residential biofuel use and vehicle exhaust.
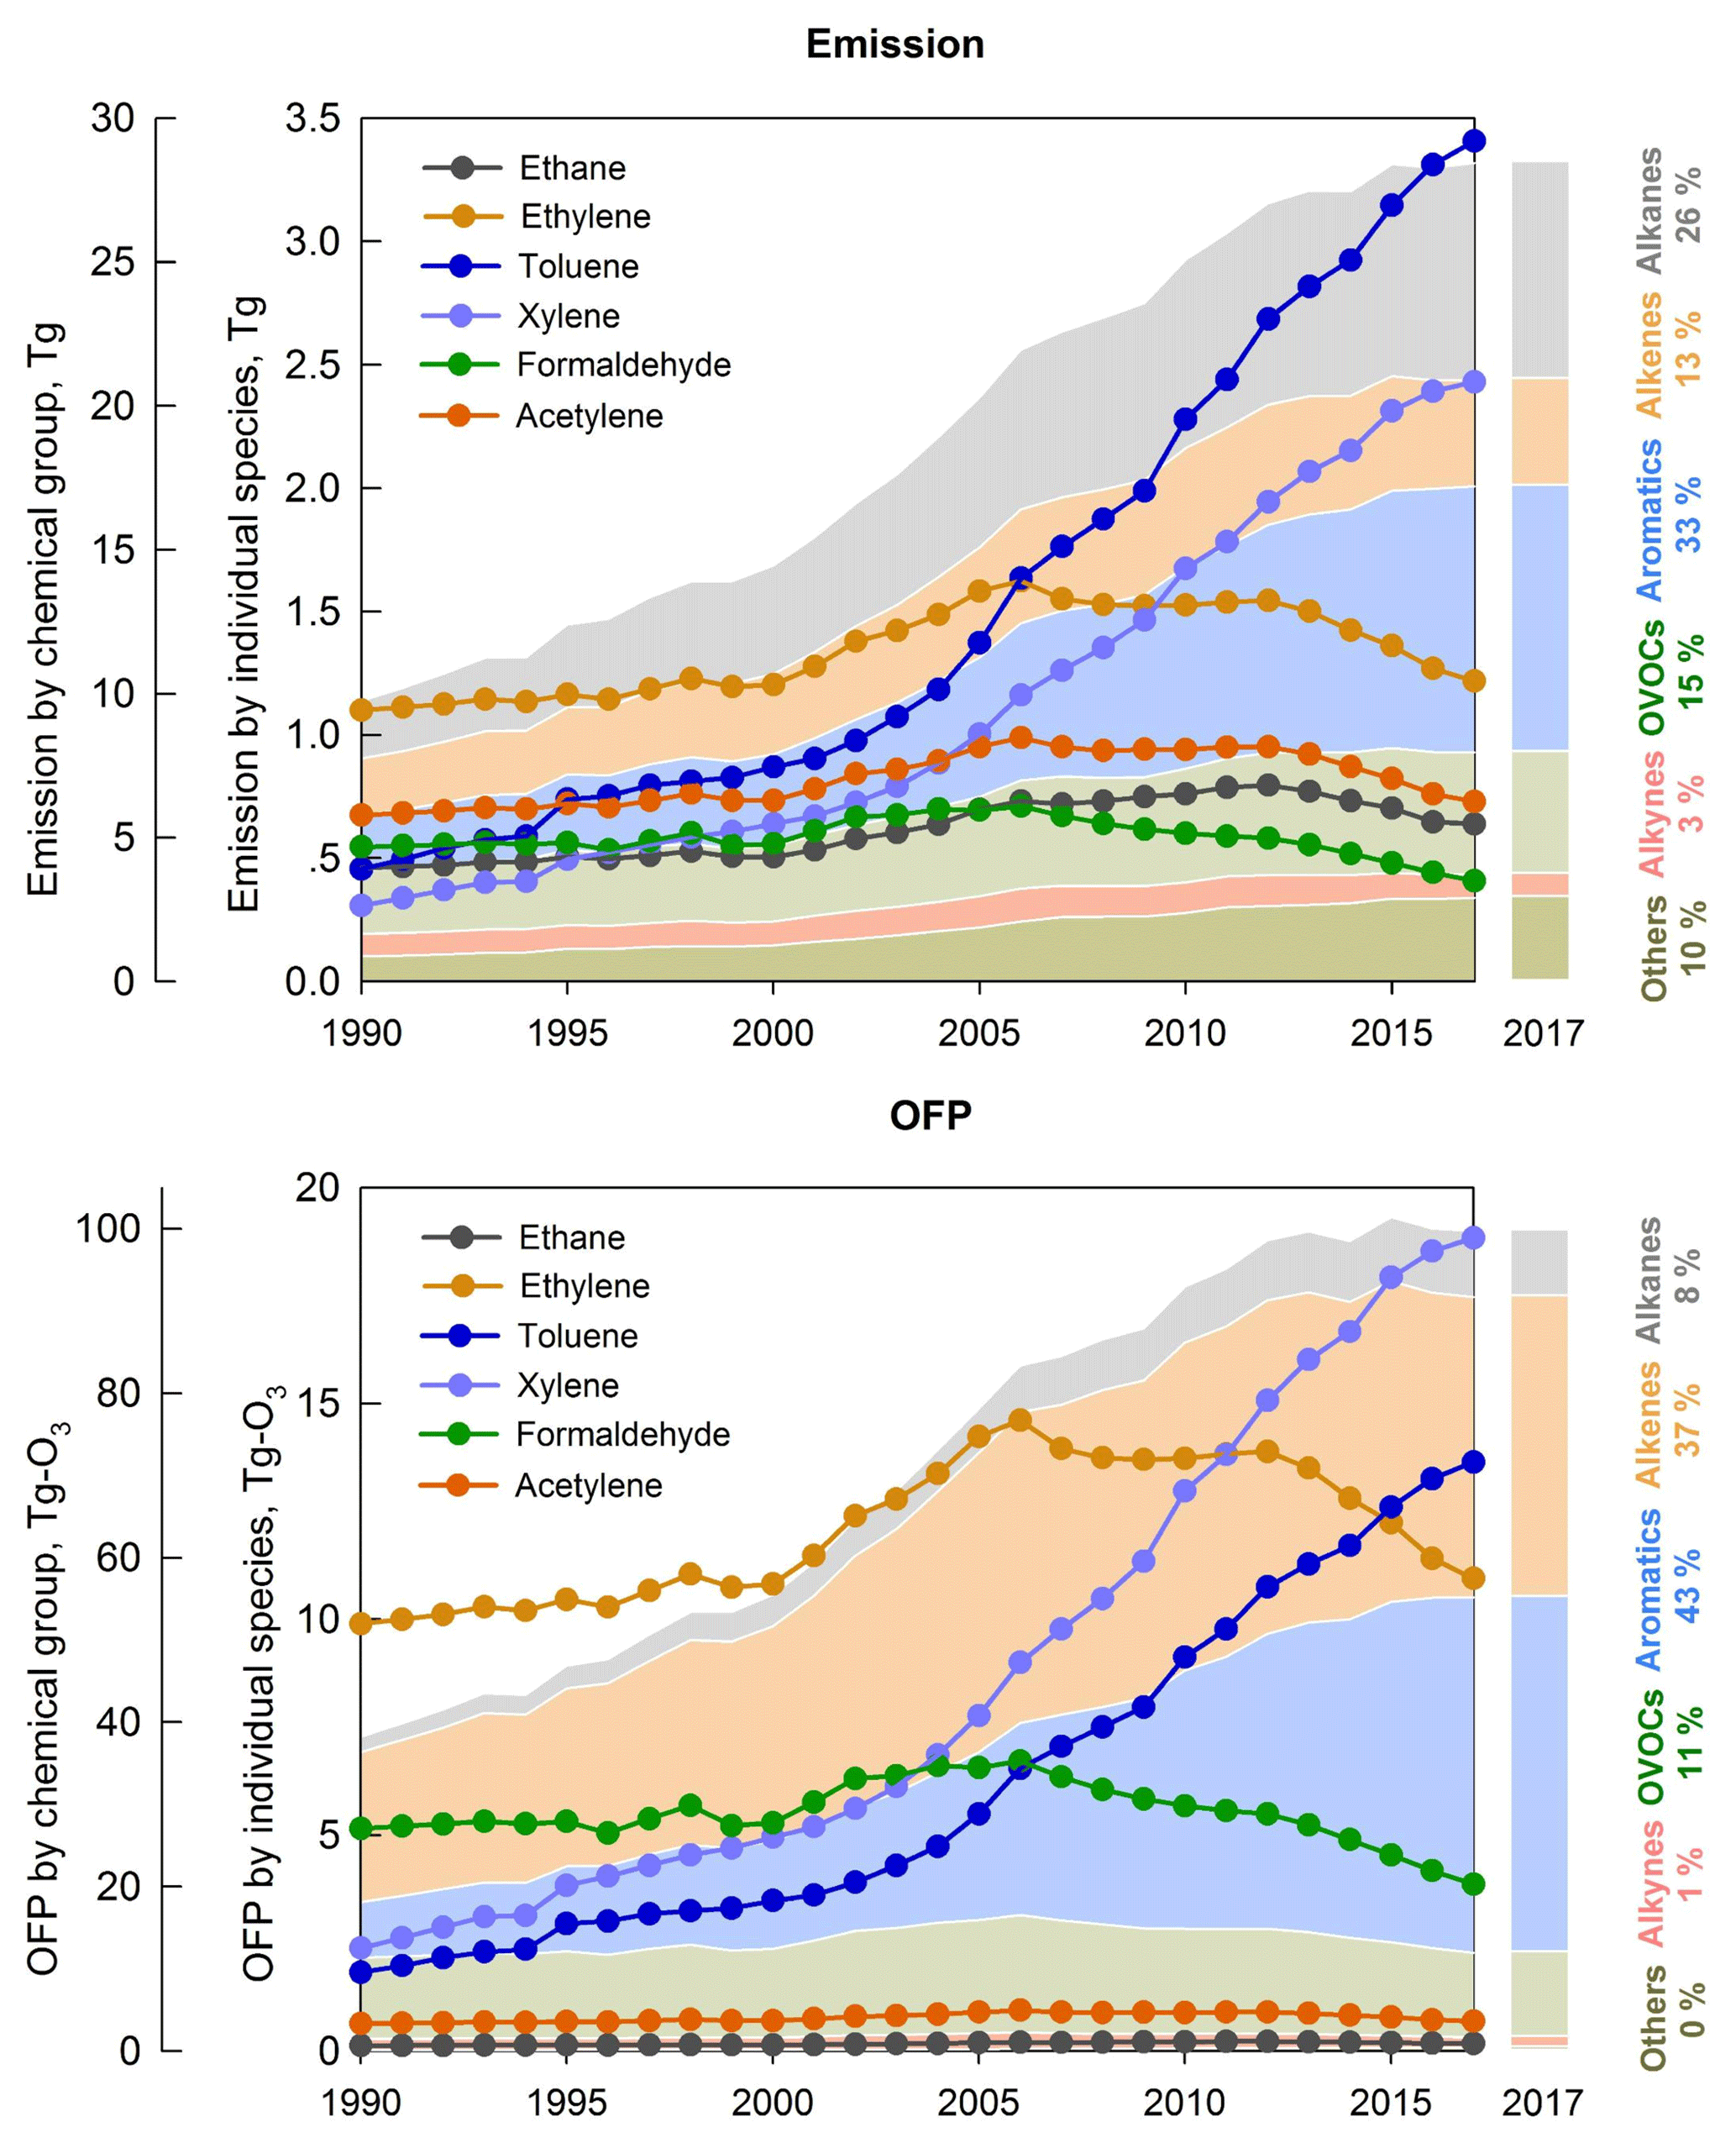
Figure 4Emission and OFP trends for key chemical species (ethane, ethylene, toluene, xylene, formaldehyde and acetylene) during 1990–2017. “Xylene” includes all isomers of xylene (m- and p-xylene and o-xylene).
Figure 4 further illustrates the emission and OFP trends for six representative species (ethane, ethylene, toluene, xylene, formaldehyde and acetylene) of chemical groups (alkanes, alkenes, aromatics, OVOCs and alkynes). Apart from ethane and acetylene, all species are identified with high contributions to ozone formation during 1990–2017 (see Fig. 4b). Sharp growth was estimated for toluene and xylene, with 6-fold (> 2 Tg) higher emissions in 2017 than in 1990, mainly driven by solvent use as illustrated above. The emissions of ethane first increased then showed slight decrease and experienced a 39 % (+178 Gg) increase in 2017 compared to 1990. Ethylene emissions rose rapidly in the first 16 years and then declined, increasing by 11 % (+117 Gg) from 1990 to 2017. The declining trend of ethylene in recent years can be attributed to the residential combustion activities. In contrast to the overall growing trend, formaldehyde decreased by 25 % (−137 Gg), leading to even lower emissions in 2017 than in 1990 because of the reduced use of biofuel in residential stoves.
As shown in Fig. 4, emission fractions by chemical group changed significantly, with reduced proportions of alkenes and OVOCs and increased shares of aromatics and alkanes. In 2017, aromatics were the largest contributing chemical group to emissions, accounting for 33 % of the total. The mass fractions for alkenes and OVOCs gradually decreased from 20 % and 23 % in 1990 to 13 % and 15 % in 2017, respectively. Figure 5 decomposes the driving forces of emission changes by chemical group and sector from 1990 to 2017. During 1990–2000, the 48 % (+4.6 Tg) emission increase was mainly attributed to alkanes (+1.8 Tg), aromatics (+1.3 Tg) and alkenes (+0.91 Tg) contributed by the transportation sector. Since 2000, activity rates from solvent use and industry have grown rapidly along with the economic development, leading to large emission increases in alkanes and aromatics. For the period of 2000–2010, aromatics and alkanes accounted for 36 % and 26 % of the total emission growth, respectively, dominated by solvent use and industrial sources. Solvent use and industrial processes continuously promoted the emissions of aromatics (+2.8 Tg) and alkanes (+1.5 Tg) in recent years (2010–2017), but the increasing trend was lowered by the declined emissions of transportation and residential sectors (−2.9 Tg) that benefited from the penetration of control measures and transition of fuel types. As a result, a much lower emission growth ratio of 13 % was estimated for 2010–2017, compared to a > 40 % increase for previous decades (see Fig. 5).
3.3 OFP
The national OFP shows a persistent increasing trend from 38 Tg of O3 to 100 Tg of O3, at a growth factor of 2.6, during 1990–2017 (Fig. 1). Due to their large emission amounts and high ozone-producing chemical reactivity (scaled by MIR), ethylene, toluene, xylene and propylene are estimated to be the key NMVOC precursors in ozone formation during the last decades (see Fig. 3). The rankings of OFP contribution by individual species have changed over time, with increasingly important roles played by reactive aromatic species (toluene, xylene and ethylbenzene) and decreasing contributions from alkenes (ethylene, propylene and butenes) and OVOCs (formaldehyde and acetaldehyde). Specifically, during 1990–2017, toluene, xylene, 2-methyl-2-butene, ethylbenzene, 2-butene, 1,2,4-trimethylbenzene, propylene, 2-pentene and formaldehyde contributed most to the OFP trend. Transportation, solvent use and industry sectors were the main contributors to the OFP increase and partly suppressed by the decline in biofuel use.
As presented in Fig. 4, xylene (sum of m-xylene, p-xylene and o-xylene) and toluene surpassed ethylene to become the two largest OFP contributors at present. In 2000, alkenes contributed 47 % to the total OFP, while aromatics accounted for 24 %. Driven by the increasing emissions of aromatics since 2000, the OFP contributions of aromatics (43 %) are now even higher than those of alkenes (37 %). Alkenes and aromatics together represented 80 % of the total OFP in 2017. Among the top 30 species contributors, the OFP proportions of aromatics are even higher, increasing from 20 % in 1990 to 50 % in 2017. The significant role of aromatics highlights the importance of setting up corresponding measures to suppress ozone formation.
We present the components driving the OFP growth by chemical group and sector from 1990 to 2017 in Fig. 5. As illustrated above, during 1990–2000, the rapidly increasing number of vehicles along with economic development introduced large quantities of reactive alkenes and aromatics as well as OFP (+45 %). From 2000 to 2010, solvent use became the largest contributor to the OFP change, accompanied by the boom in aromatic emissions. During this period, on-road gasoline vehicles and industry also played important roles in the OFP increase caused by alkenes. The OFP contribution of alkanes was small even though the emission increase was significant; this is due to the low chemical reactivity of alkanes. Notably, during the most recent years (2010–2017), emissions of several key source categories have started to stabilize or even decrease, significantly mitigating the increased OFP caused by solvent use and industrial processes. OFP reductions are mainly attributed to alkenes (−3.3 Tg of O3) and OVOCs (−2.5 Tg of O3) associated with the sectors of residential biofuel combustion and transportation.
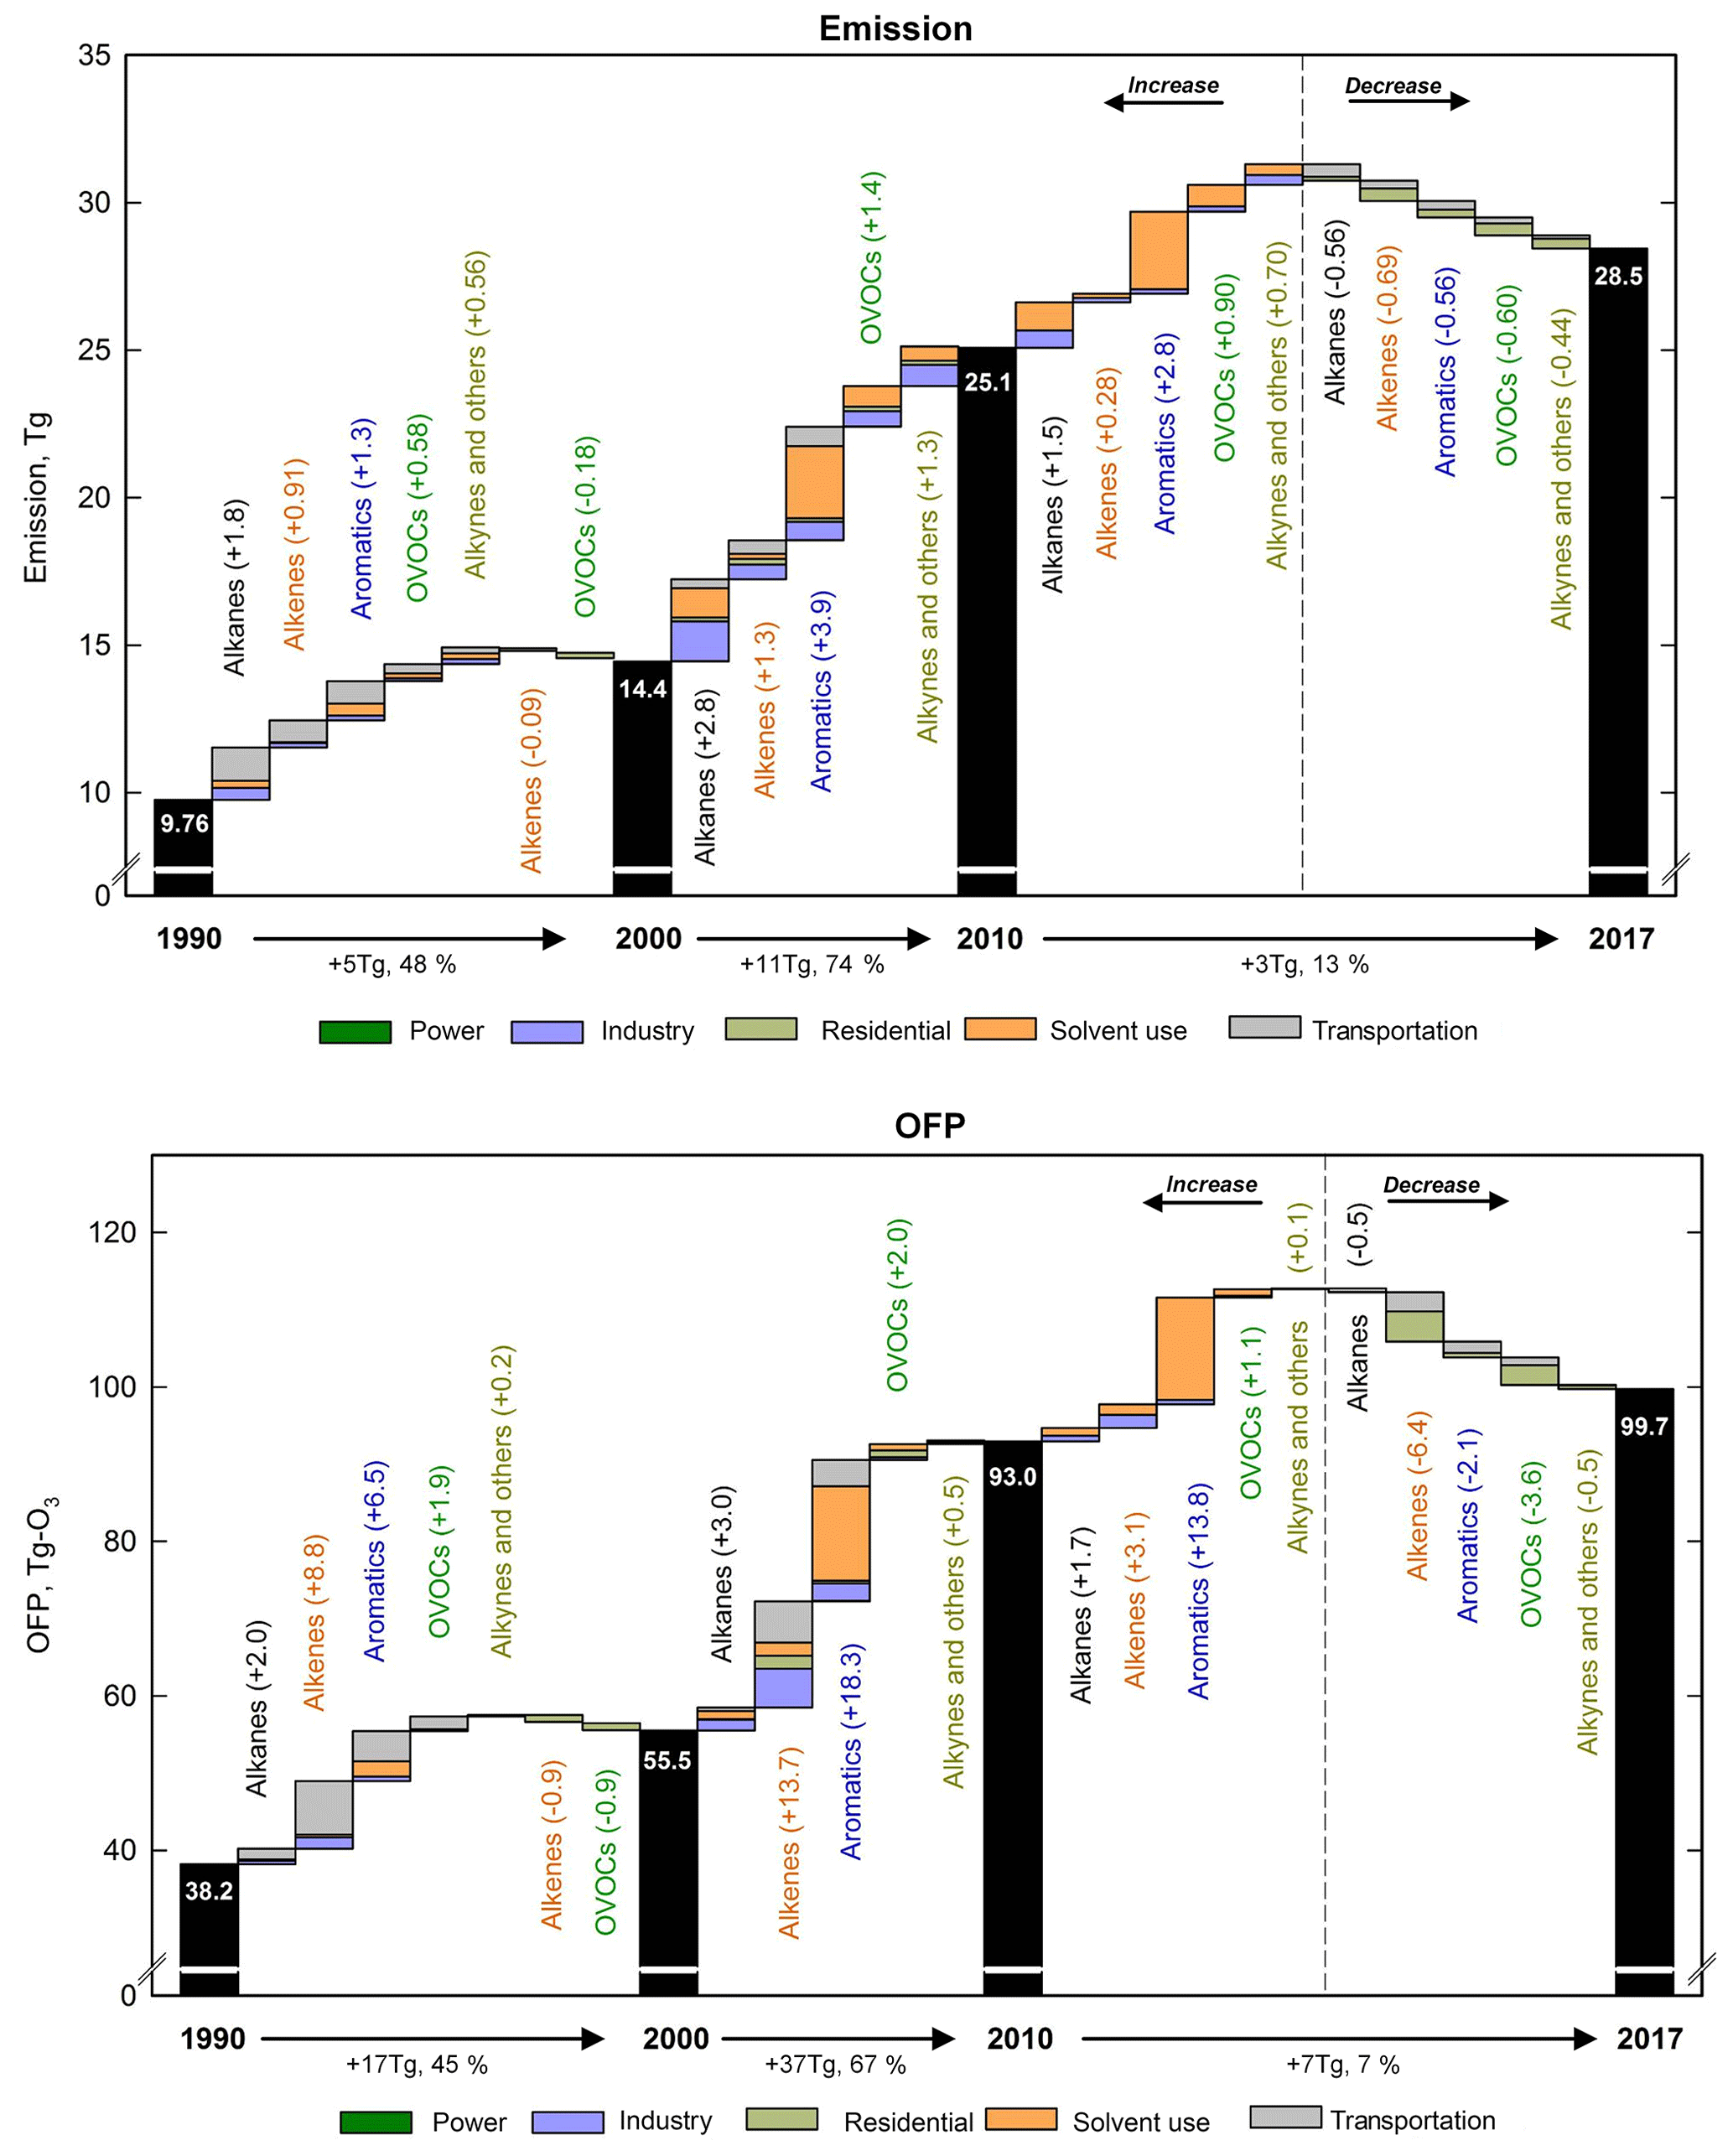
Figure 5Decomposed changes by chemical group and sector for emission and OFP from 1990 to 2017. Each bar represents the contribution by chemical group to the total emission or OFP changes for the specific time period.
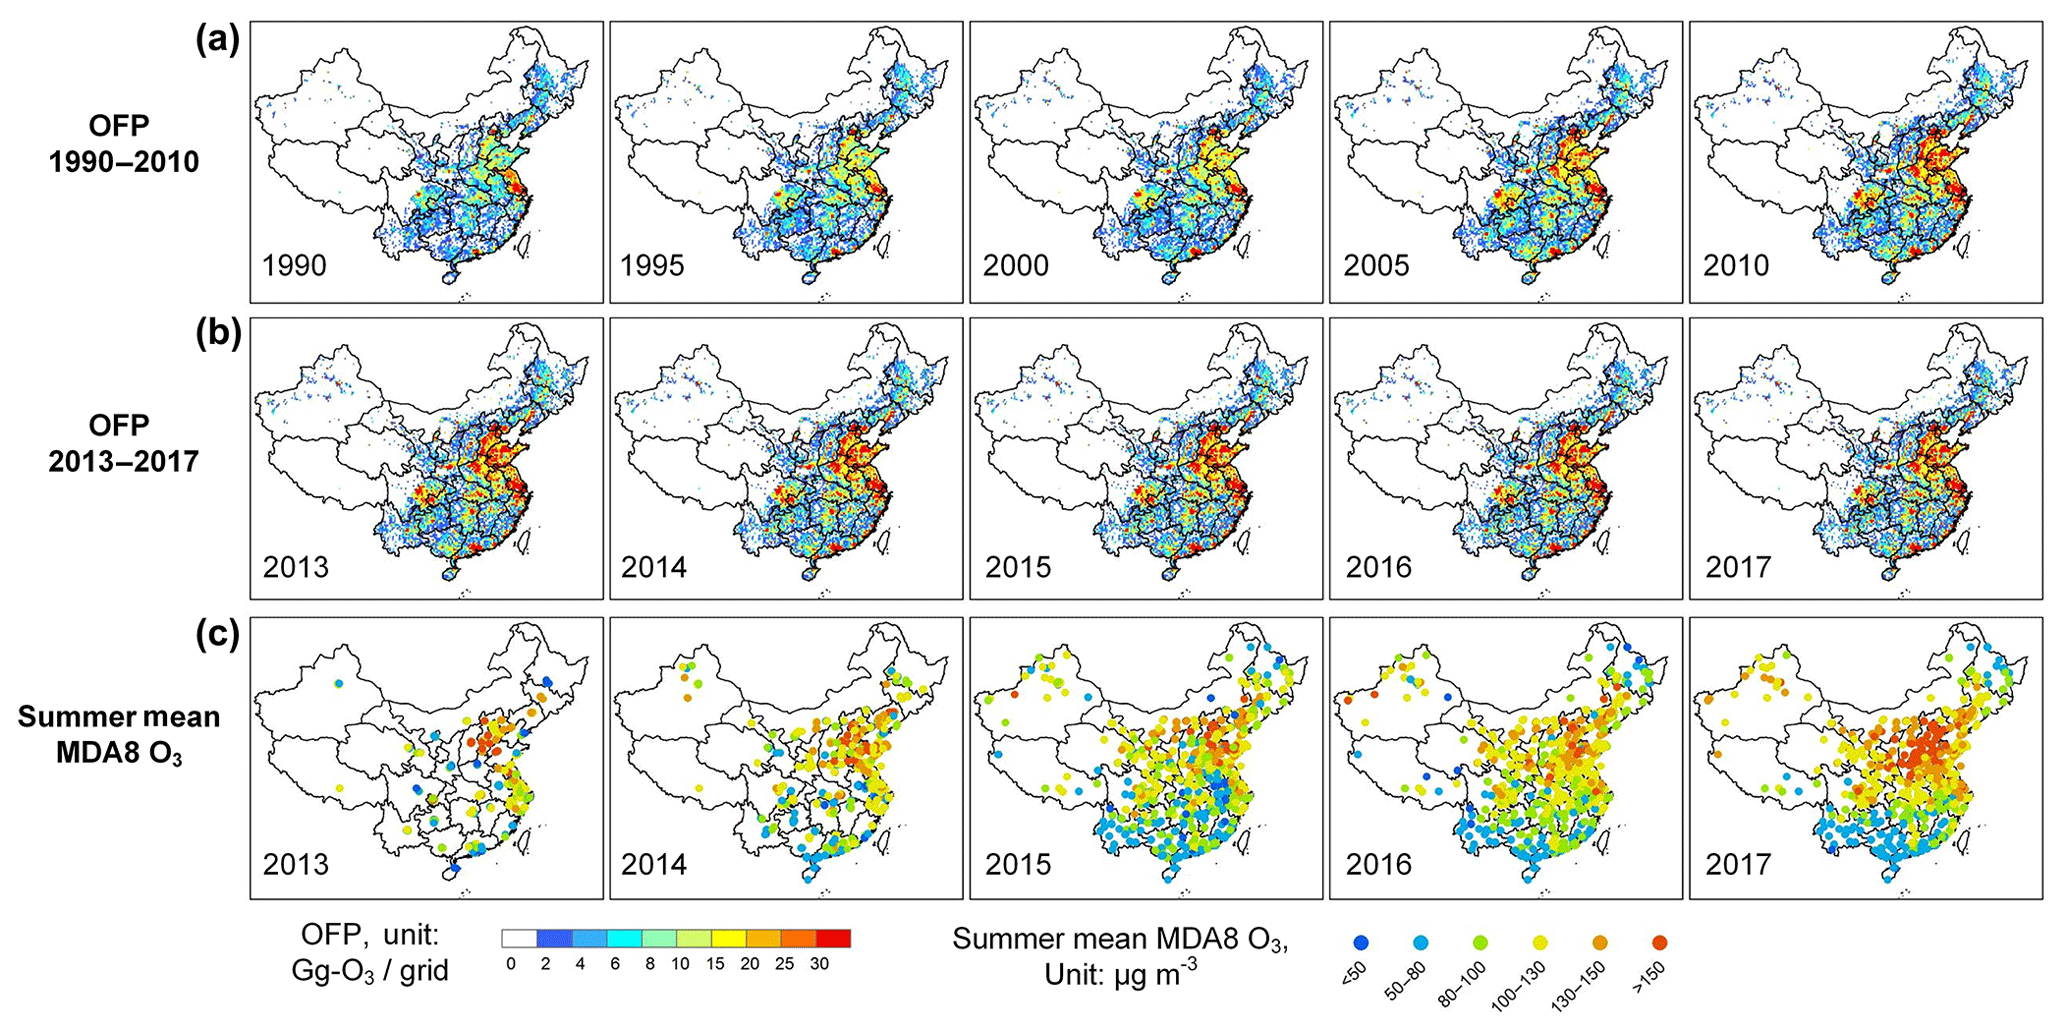
Figure 6OFP spatial distributions during 1990–2017 (a, b), and the observed summer mean (June–July–August) maximum daily 8 h average (MDA8) surface ozone concentrations in 2013–2017 (c).
By allocating the emissions into grids based on spatial surrogates, we depicted the spatial distributions of OFP at a spatial resolution of in Fig. 6. Power plant locations derived from the CPED and verified using Google Earth were used to distribute the corresponding emissions; rural population density and road maps were used as proxies for residential biofuel combustion and on-road vehicles, respectively; urban and total population datasets were used to allocate the emissions of other sources. The spatial patterns of OFP are in general consistent with the observed ozone maps (see Fig. 6). Significant signals of urbanization are especially prevalent over China, demonstrating the potential severe ozone pollution in densely populated regions such as eastern China and the Sichuan basin. We further analyzed the OFP trends for four key regions with severe ozone pollution in China, i.e., Beijing–Tianjin–Hebei (BTH), the Yangtze River Delta (YRD), the Pearl River Delta (PRD) and the Sichuan Basin (SCB) for 2013–2017. Compared to the values of 2013, OFP for BTH, YRD, PRD and SCB showed minor growth ratios of 2 %, 8 %, 9 % and 2 % in 2017, respectively. Especially, the mitigation measures covering various sources implemented in PRD achieved a 7 % decrease in OFP in 2014–2017. This suggests that due to the absence of effective mitigation measures regarding NMVOCs, the potential ozone production for megacity clusters has been stable in recent years in contrast to the dramatic reductions of NOx and primary PM2.5.
We depicted the trend of summer mean (June–July–August) maximum daily 8 h average (MDA8) ozone concentrations observed by the ground monitoring network over China since 2013 in Fig. 6. In contrast to the flat trend of OFP during the same period, significant increases in ozone were observed in northern, central and southwestern China. Previous studies indicated that VOC-limited conditions prevail in megacities of China, where more ozone can be produced as a result of dramatic NOx emission decline (Gao et al., 2017; K. Li et al., 2018). The effective reduction of PM2.5 in recent years favoring the penetration of ultraviolet light to the surface may also lead to greater ozone production. Based on model simulation, K. Li et al. (2018) demonstrates that the sharp decrease in NOx emissions (∼ 21 %) in VOC-limited regions, and the ∼ 40 % reduction of PM2.5 concentrations slowing down the aerosol sink of hydroperoxy radicals, drove the rise of surface ozone in China during 2013–2017. As indicated by above analyses, the lagging mitigation measures of NMVOCs compared to other criteria for pollutants in most of urban China have advanced ozone production through nonlinear chemistry in the gas phase and/or multiphase chemistry between gases and aerosols. Designing cost-effective mitigation measures for NMVOCs accompanying NOx, CO and PM2.5 is quite urgent and crucial for ozone control in the near future.
4.1 Comparison with previous studies
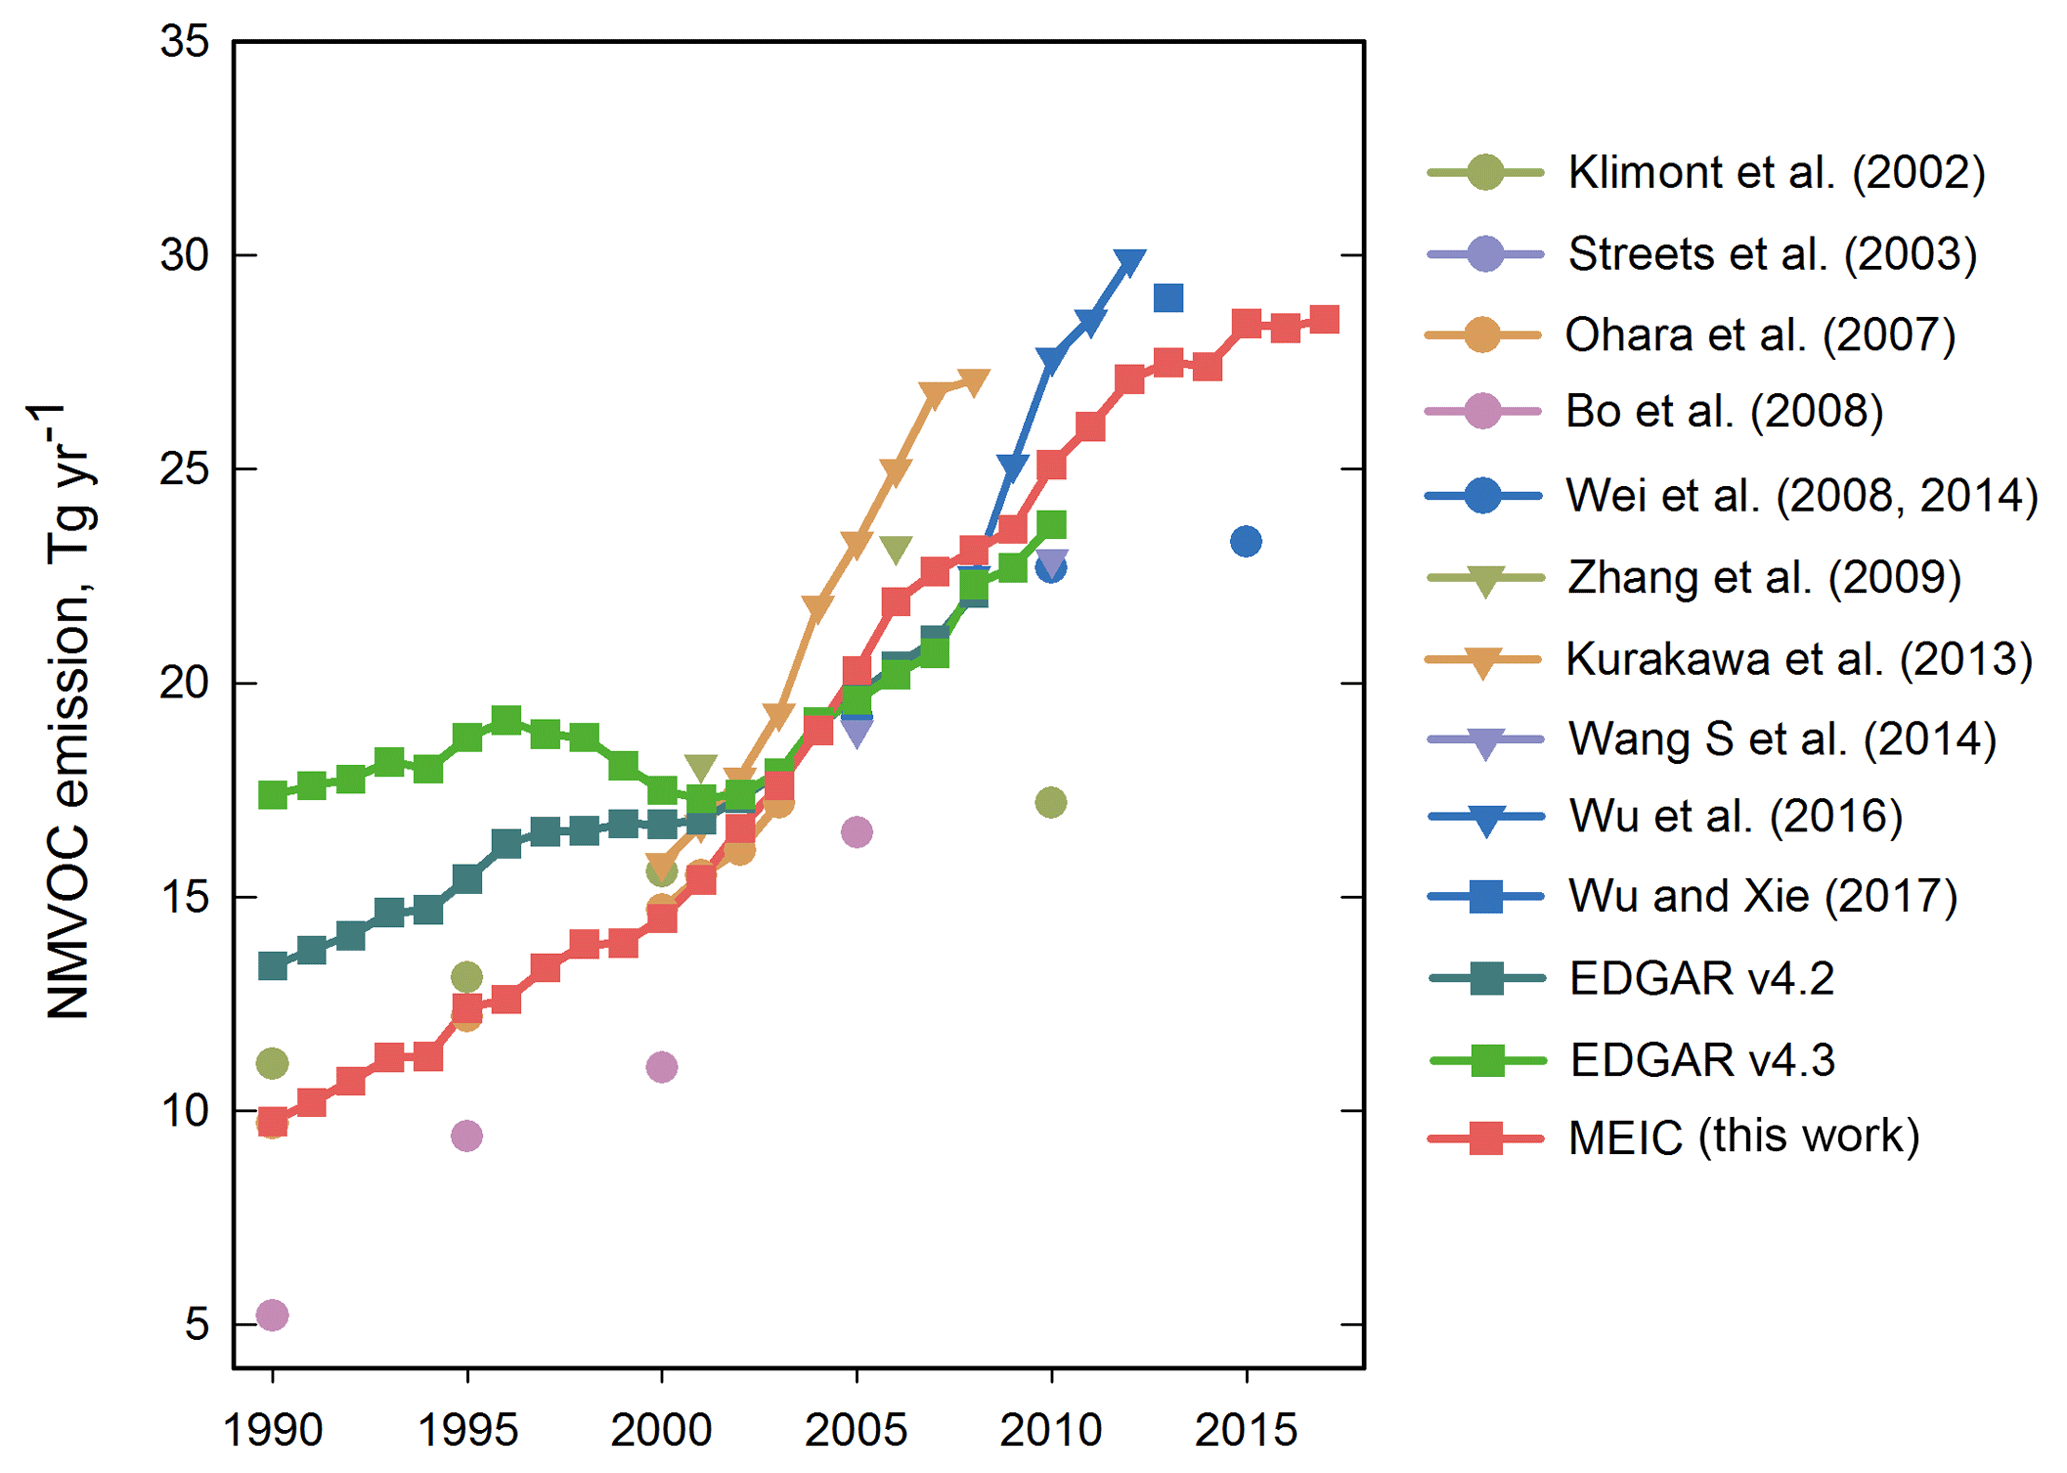
The NMVOC emissions in China estimated in our work are compared with previous estimates in Fig. 7. The increasing pattern since 2000 is generally consistent among different long-term emission inventories (Kurokawa et al., 2013; Wu et al., 2016). Our estimates are slightly lower than the values of Wu et al. (2016), Wu and Xie (2017), and the Regional Emission inventory in ASia version 2.1 (REAS v2.1; Kurokawa et al., 2013) but are higher than those of Wei et al. (2014) and Bo et al. (2008). The emissions estimated by the various inventories for the most recent years, i.e., since 2010, agree relatively well, with variations of 10 %–22 %. For regional emission inventories, as the data sources of activity rates are generally consistently obtained from official statistics, we can attribute the emission differences to the distinct source classification system and assignment of emission factors. For the emission inventory at a global scale, the calculated growth rate of NMVOC emissions in the Emissions Database for Global Atmospheric Research (EDGAR; EC-JRC/PBL, 2011; Crippa et al., 2018) is much slower than our estimates. EDGAR emissions are slightly lower than our estimates after 2000 but much higher in the 1990s. The reasons for these differences are complicated and should include inconsistency in source categories, data sources of activity rates and emission factors (M. Li et al., 2018).
4.2 Uncertainty and limitations
The uncertainties in the total NMVOC emissions in China were estimated to be at a moderate level of ±68 %–±78 % (Zhang et al., 2009; Kurokawa et al., 2013), mainly arising from the lack of reliable data for scattered areal sources. Solvent use and industrial processes are sectors with high uncertainty according to Wu et al. (2016). On the other hand, selection and application of source profiles can lead to differences of over a magnitude of 3 in quantifying individual species, representing the largest uncertainty sources during speciation (Li et al., 2014).
Uncertainties in the composite profile are related to the accuracy of individual profiles applied for speciation. We calculated the uncertainties in the composite ones via the propagation of errors approach. For each species included in sources, the standard error (SE) for all profiles that had measurements was calculated to represent the “true” mass fraction error based on limited samples. If only one profile is used, expert judgment was used to estimate the profile error. We assumed the coefficients of variation (CVs; i.e., standard deviation divided by the mean) of the SPECIATE v4.5 profiles with overall qualities of A–E to be ±5 %–500 % and assigned local source profiles at CVs of ±5 %–±15 % according to the measurement year based on expert judgment. Errors were added linearly for sources that shared profiles and then combined in quadrature into subsectors. Then the profile uncertainties were calculated to be 1.96 times the CV at the 95 % confidence interval.
Source profiles contribute large uncertainties in determining emissions of individual chemical species and further species-specific OFP (see Fig. S1). Despite using similar sampling and analytical methods, the measured profiles show significant diversity among different studies, varying with fuel type, combustion technology, end-of-pipe control facilities, solvent components, etc. For abundant components of toluene, ethylene, m- and p-xylene, and propylene, the uncertainties in the mass fractions are in the range of 7 %–453 %, with averages of 74 %–101 %, showing comparable accuracy to the emission estimates. Profiles of vehicular sources and paint use show low uncertainties for all chemical species, including on-road gasoline, on-road diesel, off-road diesel and industrial paint use, because of the inclusion of reliable local source profiles. The uncertainty matrix shown in Fig. S1 highlights the need for more measurements and further analyses for important sources (species), especially chemical industry (o-xylene and benzene), other industrial processes (toluene, xylene, formaldehyde and 2-methyl-2-butene), residential biofuel combustion (toluene, xylene, ethylbenzene, cis-2-butene and butyl cellosolve) and waste treatment (xylene, ethylene and formaldehyde). Yet, it is difficult to quantify the uncertainties for trace gases such as polycyclic aromatic hydrocarbons (PAHs) and halohydrocarbons that have high molar mass but have not been included in standard sampling and analytical protocols in current measurements.
The inter-annual variations in profiles are yet to be investigated, and more local source profiles with complete information of chemical species are still in need. An improved linkage between the source profile matrix and the source, province and temporal information will be important in improving the accuracy of emission estimates.
It should be addressed that our inventory only includes anthropogenic sources (including biofuel) and excludes open biomass burning, which may introduce bias for analyses covering all source types. Based on the most recent work (Yin et al., 2019), emissions of open biomass burning in China are 1.12–2.16 Tg of NMHC, corresponding to 2.90–5.60 Tg of NMVOCs by applying an averaged OVOC fraction of 61.4 % (8753 in SPECIATE 4.5; Andreae and Merlet, 2001) during 2003–2017. Compared to 17.6–28.5 Tg of NMVOCs from anthropogenic sources during the same period, we captured > 83 % of the total emissions, and the total NMVOC emissions would be 32.8 Tg in 2017, with large emission decreases (−7 %) for 2015–2016.
4.3 Policy implications
Ozone pollution has become increasingly severe in China, especially in megacities (Gao et al., 2017; Lu et al., 2018). Both ground measurements and satellites have detected an increasing trend of tropospheric ozone concentrations over recent decades due to emissions of precursors, tropospheric chemistry, penetration from the stratosphere and meteorological changes (Verstraeten et al., 2015; Wang et al., 2016; K. Li et al., 2018).
Our estimates of the speciated NMVOC emissions and underlying indications will be important for establishing the most cost-effective mitigation measures for ozone. The effective actions to control fine PM in China have gained significant achievements since 2013, while the ozone problem has not been fully addressed by the Chinese government. Based on our estimates, the implementation of control measures for vehicles, industrial and residential sources has led to emission reductions of alkenes, alkanes and aldehydes. However, due to the absence of effective control for evaporative sources, large amounts of aromatics have been emitted from the condensed phase into the atmosphere since 2000. Paint use, the chemical industry, petroleum production and distribution, and other solvent use sources are the main contributors to the changes since 2010 and remain inefficiently controlled nationwide. These sources should be addressed and controlled more stringently in the next step. As urban China mainly has VOC-limited conditions, mitigation of NMVOC emissions will suppress ozone formation effectively. China urgently needs to set up goals and enact more stringent legislation to control NMVOC emissions and NOx, CO and PM2.5 emissions to prevent further potential ozone pollution and adverse effects on human health.
Long-term speciated NMVOC emissions over China were estimated based on the MEIC framework and an updated local source profile database for the period from 1990 to 2017. Our results showed that China's emission of NMVOCs increased by 192 % from 9.76 Tg in 1990 to 28.5 Tg in 2017 due to the economic development and relatively late implementation of the emission-control strategy. From 1990 to 2017, industrial sources and solvent use were the main driving forces for the emission increment, while the reduction of residential biofuel use and on-road vehicle exhaust in recent years lowered the rapid growth rates. Consequently, toluene and xylene emissions increased by more than a factor of 6 and surpassed those of ethylene. The proportion of aromatic emissions increased monotonically from 20 % in 1990 to 33 % in 2017, becoming the largest contributor in China at present. Meanwhile, the emissions of alkanes (e.g., ethane), alkenes (e.g., ethylene, propylene) and OVOCs (e.g., formaldehyde) showed decreasing trends during 2010–2017.
The persistent growth of NMVOC emissions has led to increasingly enhanced ozone production over the last 2 decades but has tended to stabilize in recent years. The total OFP in China was estimated to have dramatically increased from 38.2 Tg of O3 in 1990 to 99.7 Tg of O3 in 2017, with distinct driving sources in different economic development periods. On-road gasoline vehicles, paint use and industrial sources were the major contributors to the dramatic increases in emission and OFP from 1990 to 2010. Large amounts of OFP produced by reactive aromatics and alkenes were estimated during this period. For 2010–2017, OFP increased by only 7 %, attributed to the implementation of successful clean air policies covering the transportation and industry sectors as well as the reduced biofuel use in residential stoves. In 2017, the national OFP value was dominated by aromatics (43 %) and alkenes (37 %). Controlling the emissions of aromatics and alkenes from solvent use and industrial processes is crucial in addressing the ozone problem.
Ozone pollution has become a severe problem over megacity clusters in China. Due to the absence of effective control measures regarding NMVOCs, OFP has shown a stable trend in China since 2013, in contrast to the dramatic emission reductions for NOx, CO and primary PM2.5. Discrepancies between the increase in observed surface O3 and the flat OFP trends might be the result of nonlinear chemistry and multiphase chemistry caused by this imbalance. Controlling NMVOC emissions is anticipated to be efficient in suppressing ozone formation because VOC-limited conditions prevail in most urban areas in China. Considering the potential adverse effects on human health and complicated production mechanisms for ozone in the troposphere, China urgently needs to formulate ozone control policies based on the updated source information for precursors, including NOx, CO and NMVOCs, and set up cost-effective measures to mitigate both PM2.5 and ozone.
The detailed emissions data developed in this work and all underlying data presented in figures are available at https://doi.org/10.6084/m9.figshare.c.4544963.v1 (Li et al., 2019).
The supplement related to this article is available online at: https://doi.org/10.5194/acp-19-8897-2019-supplement.
QZ designed the research. ML, QZ, BZ, DT, YL, FL, CH, SK, LY and YZ calculated the total NMVOC emissions. ML developed speciated VOC emissions and estimated OFP. ML, QZ, YZ, HS, YC, YB and KH interpreted the data. ML and QZ wrote the paper, with input from all co-authors.
The authors declare that they have no conflict of interest.
Meng Li acknowledges Xiaodong Liu for the technical support.
This research has been supported by the National Key R&D Program (grant no. 2016YFC0201506) and the National Natural Science Foundation of China (grant nos. 91744310, 41625020, 41571130035 and 41571130032).
This paper was edited by Aijun Ding and reviewed by two anonymous referees.
Andreae, M. O. and Merlet, P.: Emission of trace gases and aerosols from biomass burning, Global Biogeochem. Cy., 15, 955–966, https://doi.org/10.1029/2000GB001382, 2001.
Bo, Y., Cai, H., and Xie, S. D.: Spatial and temporal variation of historical anthropogenic NMVOCs emission inventories in China, Atmos. Chem. Phys., 8, 7297–7316, https://doi.org/10.5194/acp-8-7297-2008, 2008.
Carter, W. P. L.: Development of ozone reactivity scales for volatile organic compounds, J. Air Waste Manage., 44, 881–899, 1994.
Carter, W. P. L.: Updated maximum incremental reactivity scale and hydrocarbon bin reactivities for regulatory applications, prepared for California Air Resources board Contract 07-339, available at: http://cmscert.engr.ucr.edu/~carter/SAPRC/MIR10.pdf (last access: July 2018), 2000.
Crippa, M., Guizzardi, D., Muntean, M., Schaaf, E., Dentener, F., van Aardenne, J. A., Monni, S., Doering, U., Olivier, J. G. J., Pagliari, V., and Janssens-Maenhout, G.: Gridded emissions of air pollutants for the period 1970–2012 within EDGAR v4.3.2, Earth Syst. Sci. Data, 10, 1987–2013, https://doi.org/10.5194/essd-10-1987-2018, 2018.
Duffy, B. L., Nelson, P. F., Ye, Y., and Weeks, I. A.: Speciated hydrocarbon profiles and calculated reactivities of exhaust and evaporative emissions from 82 in-use light-duty Australian vehicles, Atmos. Environ., 33, 291–307, https://doi.org/10.1016/S1352-2310(98)00163-0, 1999.
EC-JRC/PBL (European Commission, Joint Research Center/Netherlands Environmental Assessment Agency), Emission Database for Global Atmospheric Research version 4.2, available at: http://edgar.jrc.ec.europa.eu (last access: June 2015), 2011.
European Environment Agency (EEA): EMEP/CORINAIR Emission Inventory Guidebook – 2016, available at: https://www.eea.europa.eu/publications/emep-eea-guidebook-2016 (lass access: December 2018), 2016.
Environmental Protection Agency (EPA): Compilation of air pollu- tant emission factors (AP42), Fifth Edition, chap. 1–13, available at: https://www.epa.gov/air-emissions-factors-and-quantification/ap-42-compilation-air-emissions-factors, (lass access: December 2018), 1995.
Gao, W., Tie, X., Xu, J., Huang, R., Mao, X., Zhou, G., and Chang, L.: Long-term trend of O3 in a mega City (Shanghai), China: Characteristics, causes, and interactions with precursors, Sci. Total Environ., 603–604, 425–433, https://doi.org/10.1016/j.scitotenv.2017.06.099, 2017.
Guenther, A. B., Jiang, X., Heald, C. L., Sakulyanontvittaya, T., Duhl, T., Emmons, L. K., and Wang, X.: The Model of Emissions of Gases and Aerosols from Nature version 2.1 (MEGAN2.1): an extended and updated framework for modeling biogenic emissions, Geosci. Model Dev., 5, 1471–1492, https://doi.org/10.5194/gmd-5-1471-2012, 2012.
He, Q.: Characteristics, emission factors and emission estimation for particulate matters and volatile organic compounds emitted from coke production in China (in Chinese), PhD thesis, Guangzhou Institute of Geochemistry, Chinese Academy of Sciences, Guangzhou, 2006.
Jin, X. and Holloway, T.: Spatial and temporal variability of ozone sensitivity over China observed from the Ozone Monitoring Instrument, J. Geophys. Res., 120, 7229–7246, https://doi.org/10.1002/2015JD023250, 2015.
Karl, T., Striednig, M., Graus, M., Hammerle, A., and Wohlfahrt, G.: Urban flux measurements reveal a large pool of oxygenated volatile organic compound emissions, P. Natl. Acad. Sci. USA, 115, 1186–1191, 2018.
Klimont, Z., Streets, D. G., Gupta, S., Cofala, J., Lixin, F., and Ichikawa, Y.: Anthropogenic emissions of non-methane volatile organic compounds in China, Atmos. Environ., 36, 1309–1322, https://doi.org/10.1016/S1352-2310(01)00529-5, 2002.
Kurokawa, J., Ohara, T., Morikawa, T., Hanayama, S., Janssens-Maenhout, G., Fukui, T., Kawashima, K., and Akimoto, H.: Emissions of air pollutants and greenhouse gases over Asian regions during 2000–2008: Regional Emission inventory in ASia (REAS) version 2, Atmos. Chem. Phys., 13, 11019–11058, https://doi.org/10.5194/acp-13-11019-2013, 2013.
Li, K., Jacob, D. J., Liao, H., Shen, L., Zhang, Q., and Bates, K. H.: Anthropogenic drivers of 2013–2017 trends in summer surface ozone in China, P. Natl. Acad. Sci. USA, 116, 422–427, https://doi.org/10.1073/pnas.1812168116, 2018.
Li, M., Zhang, Q., Streets, D. G., He, K. B., Cheng, Y. F., Emmons, L. K., Huo, H., Kang, S. C., Lu, Z., Shao, M., Su, H., Yu, X., and Zhang, Y.: Mapping Asian anthropogenic emissions of non-methane volatile organic compounds to multiple chemical mechanisms, Atmos. Chem. Phys., 14, 5617–5638, https://doi.org/10.5194/acp-14-5617-2014, 2014.
Li, M., Liu, H., Geng, G., Hong, C., Liu, F., Song, Y., Tong, D., Zheng, B., Cui, H., Man, H., Zhang, Q., and He, K.: Anthropogenic emission inventories in China: a review, Natl. Sci. Rev., 4, 834–866, https://doi.org/10.1093/nsr/nwx150, 2017.
Li, M., Klimont, Z., Zhang, Q., Martin, R. V., Zheng, B., Heyes, C., Cofala, J., Zhang, Y., and He, K.: Comparison and evaluation of anthropogenic emissions of SO2 and NOx over China, Atmos. Chem. Phys., 18, 3433–3456, https://doi.org/10.5194/acp-18-3433-2018, 2018.
Li, M., Zhang, Q., Zheng, B., Tong, D., Lei, Y., Liu, F., Hong, C., Kang, S., Yan, L., Zhang, Y., Bo, Y., Su, H., Cheng, Y. and He, K.: Persistent growth of anthropogenic NMVOC emissions in China during 1990–2017: drivers, speciation, and ozone formation potential, https://doi.org/10.6084/m9.figshare.c.4544963.v1, 2019.
Liu, F., Zhang, Q., Tong, D., Zheng, B., Li, M., Huo, H., and He, K. B.: High-resolution inventory of technologies, activities, and emissions of coal-fired power plants in China from 1990 to 2010, Atmos. Chem. Phys., 15, 13299–13317, https://doi.org/10.5194/acp-15-13299-2015, 2015.
Liu, Y., Shao, M., Fu, L., Lu, S., Zeng, L., and Tang, D.: Source profiles of volatile organic compounds (VOCs) measured in China: Part I, Atmos. Environ., 42, 6247–6260, https://doi.org/10.1016/j.atmosenv.2008.01.070, 2008.
Lu, X., Hong, J., Zhang, L., Cooper, O. R., Schultz, M. G., Xu, X., Wang, T., Gao, M., Zhao, Y., and Zhang, Y.: Severe Surface Ozone Pollution in China: A Global Perspective, Environ. Sci. Technol., 5, 487–494, https://doi.org/10.1021/acs.estlett.8b00366, 2018.
Mo, Z., Shao, M., and Lu, S.: Compilation of a source profile database for hydrocarbon and OVOC emissions in China, Atmos. Environ., 143, 209–217, https://doi.org/10.1016/j.atmosenv.2016.08.025, 2016.
Mo, Z., Shao, M., Lu, S., Qu, H., Zhou, M., Sun, J., and Gou, B.: Process-specific emission characteristics of volatile organic compounds (VOCs) from petrochemical facilities in the Yangtze River Delta, China, Sci. Total Environ., 533, 422–431, https://doi.org/10.1016/j.scitotenv.2015.06.089, 2015.
Monks, P. S., Archibald, A. T., Colette, A., Cooper, O., Coyle, M., Derwent, R., Fowler, D., Granier, C., Law, K. S., Mills, G. E., Stevenson, D. S., Tarasova, O., Thouret, V., von Schneidemesser, E., Sommariva, R., Wild, O., and Williams, M. L.: Tropospheric ozone and its precursors from the urban to the global scale from air quality to short-lived climate forcer, Atmos. Chem. Phys., 15, 8889–8973, https://doi.org/10.5194/acp-15-8889-2015, 2015.
National Bureau of Statistics (NBS): China Statistical Yearbook (1990, 1991, 1992, 1993, 1994, 1995, 1996, 1997, 1998, 1999, 2000, 2001, 2002, 2003, 2004, 2005, 2006, 2007, 2008, 2009, 2010, 2011, 2012, 2013, 2014, 2015, 2016, 2017 edition), China Statistics Press, Beijing, China, 1990–2017.
National Bureau of Statistics (NBS): China Energy Statistical Yearbook (1991, 1991–1996, 1997–1999, 2000–2002, 2004, 2005, 2006, 2007, 2008, 2009, 2010, 2011, 2012, 2013, 2014, 2015, 2016, 2017 editions), China Statistics Press, Beijing, China, 1992–2017.
National Bureau of Statistics (NBS): China Statistical Yearbook for Regional Economy (2000, 2001, 2002, 2003, 2004, 2005, 2006, 2008, 2009, 2010, 2011, 2012, 2013, 2014 edition), China Statistics Press, Beijing, China, 2000–2015.
Ohara, T., Akimoto, H., Kurokawa, J., Horii, N., Yamaji, K., Yan, X., and Hayasaka, T.: An Asian emission inventory of anthropogenic emission sources for the period 1980–2020, Atmos. Chem. Phys., 7, 4419–4444, https://doi.org/10.5194/acp-7-4419-2007, 2007.
Peng, L., Zhang, Q., Yao, Z., Mauzerall, D. L., Kang, S., Du, Z., Zheng, Y., Xue, T., and He, K.: Underreported coal in statistics: A survey-based solid fuel consumption and emission inventory for the rural residential sector in China, Appl. Energ., 235, 1169–1182, https://doi.org/10.1016/j.apenergy.2018.11.043, 2019.
Schauer, J. J., Kleeman, M. J., Cass, G. R., and Simoneit, B. R. T.: Measurement of Emissions from Air Pollution Sources. 2. C1 through C30 Organic Compounds from Medium Duty Diesel Trucks, Environ. Sci. Technol., 33, 1578–1587, https://doi.org/10.1021/es980081n, 1999.
Schauer, J. J., Kleeman, M. J., Cass, G. R., and Simoneit, B. R. T.: Measurement of Emissions from Air Pollution Sources. 5, C1–C32 Organic Compounds from Gasoline-Powered Motor Vehicles, Environ. Sci. Technol., 36, 1169–1180, https://doi.org/10.1021/es0108077, 2002.
Shao, M., Zhang, Y., Zeng, L., Tang, X., Zhang, J., Zhong, L., and Wang, B.: Ground-level ozone in the Pearl River Delta and the roles of VOC and NOx in its production, J. Environ. Manage., 90, 512–518, https://doi.org/10.1016/j.jenvman.2007.12.008, 2009.
Shi, J., Deng, H., Bai, Z., Kong, S., Wang, X., Hao, J., Han, X., and Ning, P.: Emission and profile characteristic of volatile organic compounds emitted from coke production, iron smelt, heating station and power plant in Liaoning Province, China, Sci. Total Environ., 515–516, 101–108, https://doi.org/10.1016/j.scitotenv.2015.02.034, 2015.
Simon, H., Beck, L., Bhave, P. V., Divita, F., Hsu, Y., Luecken, D., Mobley, J. D., Pouliot, G. A., Reff, A., Sarwar, G., and Strum, M.: The development and uses of EPA's SPECIATE database, Atmos. Pollut. Res., 1, 196–206, https://doi.org/10.5094/APR.2010.026, 2010.
Song, Y., Shao, M., Liu, Y., Lu, S., Kuster, W., Goldan, P., and Xie, S.: Source Apportionment of Ambient Volatile Organic Compounds in Beijing, Environ. Sci. Technol., 41, 4348–4353, https://doi.org/10.1021/es0625982, 2007.
Streets, D. G., Bond, T. C., Carmichael, G. R., Fernandes, S. D., Fu, Q., He, D., Klimont, Z., Nelson, S. M., Tsai, N. Y., Wang, M. Q., Woo, J. H., and Yarber, K. F.: An inventory of gaseous and primary aerosol emissions in Asia in the year 2000, J. Geophys. Res.-Atmos., 108, 8809, https://doi.org/10.1029/2002JD003093, 2003.
Tsai, S. M., Zhang, J., Smith, K. R., Ma, Y., Rasmussen, R. A., and Khalil, M. A. K.: Characterization of Non-methane Hydrocarbons Emitted from Various Cookstoves Used in China, Environ. Sci. Technol., 37, 2869–2877, https://doi.org/10.1021/es026232a, 2003.
van der Werf, G. R., Randerson, J. T., Giglio, L., Collatz, G. J., Mu, M., Kasibhatla, P. S., Morton, D. C., DeFries, R. S., Jin, Y., and van Leeuwen, T. T.: Global fire emissions and the contribution of deforestation, savanna, forest, agricultural, and peat fires (1997–2009), Atmos. Chem. Phys., 10, 11707–11735, https://doi.org/10.5194/acp-10-11707-2010, 2010.
Verstraeten, W. W., Neu, J. L., Williams, J. E., Bowman, K. W., Worden, J. R., and Boersma, K. F.: Rapid increases in tropospheric ozone production and export from China, Nature Geosci., 8, 690–695, https://doi.org/10.1038/ngeo2493, 2015.
Wang, H., Qiao, Y., Chen, C., Lu, J., Dai, H., Qiao, L., Lou, S., Huang, C., Li, L., Jing, S., and Wu, J.: Source Profiles and Chemical Reactivity of Volatile Organic Compounds from Solvent Use in Shanghai, China, Aerosol Air Qual. Res., 14, 301–310, https://doi.org/10.4209/aaqr.2013.03.0064, 2014.
Wang, Q., Geng, C., Lu, S., Chen, W., and Shao, M.: Emission factors of gaseous carbonaceous species from residential combustion of coal and crop residue briquettes, Front. Environ. Sci. Eng., 7, 66–76, https://doi.org/10.1007/s11783-012-0428-5, 2013.
Wang, S., Wei, W., Du, L., Li, G., and Hao, J.: Characteristics of gaseous pollutants from biofuel-stoves in rural China, Atmos. Environ., 43, 4148–4154, https://doi.org/10.1016/j.atmosenv.2009.05.040, 2009.
Wang, S. X., Zhao, B., Cai, S. Y., Klimont, Z., Nielsen, C. P., Morikawa, T., Woo, J. H., Kim, Y., Fu, X., Xu, J. Y., Hao, J. M., and He, K. B.: Emission trends and mitigation options for air pollutants in East Asia, Atmos. Chem. Phys., 14, 6571–6603, https://doi.org/10.5194/acp-14-6571-2014, 2014.
Wang, W.-N., Cheng, T.-H., Gu, X.-F., Chen, H., Guo, H., Wang, Y., Bao, F.-W., Shi, S.-Y., Xu, B.-R., Zuo, X., Meng, C., and Zhang, X.-C.: Assessing Spatial and Temporal Patterns of Observed Ground-level Ozone in China, Sci. Rep., 7, 3651, https://doi.org/10.1038/s41598-017-03929-w, 2017.
Wang, X. and Li, W.: Characteristics and coating technology of waterborne coatings for automobile, Shanghai Coating, 50, 2012 (in Chinese).
Wei, W., Wang, S., Chatani, S., Klimont, Z., Cofala, J., and Hao, J.: Emission and speciation of non-methane volatile organic compounds from anthropogenic sources in China, Atmos. Environ., 42, 4976–4988, https://doi.org/10.1016/j.atmosenv.2008.02.044, 2008.
Wei, W., Wang, S., and Hao, J.: Estimation and forcast of volatile organic compounds emitted from paint uses in China, Environ. Sci., 30, 2809–2815, 2009 (in Chinese).
Wei, W., Wang, S., Hao, J., and Cheng, S.: Trends of chemical speciation profiles of anthropogenic volatile organic compounds emissions in China, 2005–2020, Front. Environ. Sci. Eng., 8, 27–41, https://doi.org/10.1007/s11783-012-0461-4, 2014.
Wu, R., Bo, Y., Li, J., Li, L., Li, Y., and Xie, S.: Method to establish the emission inventory of anthropogenic volatile organic compounds in China and its application in the period 2008–2012, Atmos. Environ., 127, 244–254, https://doi.org/10.1016/j.atmosenv.2015.12.015, 2016.
Wu, Y., Yang, Y.-D., Shao, M., and Lu, S.-H.: Missing in total OH reactivity of VOCs from gasoline evaporation, Chinese Chem. Lett., 26, 1246–1248, https://doi.org/10.1016/j.cclet.2015.05.047, 2015.
Wu, R. and Xie, S.: Spatial Distribution of Ozone Formation in China Derived from Emissions of Speciated Volatile Organic Compounds, Environ. Sci. Technol., 51, 2574–2583, https://doi.org/10.1021/acs.est.6b03634, 2017.
Yao, Z., Wu, B., Shen, X., Cao, X., Jiang, X., Ye, Y., and He, K.: On-road emission characteristics of VOCs from rural vehicles and their ozone formation potential in Beijing, China, Atmos. Environ., 105, 91–96, https://doi.org/10.1016/j.atmosenv.2015.01.054, 2015.
Yin, L., Du, P., Zhang, M., Liu, M., Xu, T., and Song, Y.: Estimation of emissions from biomass burning in China (2003–2017) based on MODIS fire radiative energy data, Biogeosciences, 16, 1629–1640, https://doi.org/10.5194/bg-16-1629-2019, 2019.
Yuan, B., Hu, W. W., Shao, M., Wang, M., Chen, W. T., Lu, S. H., Zeng, L. M., and Hu, M.: VOC emissions, evolutions and contributions to SOA formation at a receptor site in eastern China, Atmos. Chem. Phys., 13, 8815–8832, https://doi.org/10.5194/acp-13-8815-2013, 2013.
Yuan, B., Shao, M., Lu, S., and Wang, B.: Source profiles of volatile organic compounds associated with solvent use in Beijing, China, Atmos. Environ., 44, 1919–1926, https://doi.org/10.1016/j.atmosenv.2010.02.014, 2010.
Zhang, J., Smith, K. R., Ma, Y., Ye, S., Jiang, F., Qi, W., Liu, P., Khalil, M. A. K., Rasmussen, R. A., and Thorneloe, S. A.: Greenhouse gases and other airborne pollutants from household stoves in China: a database for emission factors, Atmos. Environ., 34, 4537–4549, https://doi.org/10.1016/S1352-2310(99)00450-1, 2000.
Zhang, Q., Streets, D. G., Carmichael, G. R., He, K. B., Huo, H., Kannari, A., Klimont, Z., Park, I. S., Reddy, S., Fu, J. S., Chen, D., Duan, L., Lei, Y., Wang, L. T., and Yao, Z. L.: Asian emissions in 2006 for the NASA INTEX-B mission, Atmos. Chem. Phys., 9, 5131–5153, https://doi.org/10.5194/acp-9-5131-2009, 2009.
Zhao, Y., Hennigan, C. J., May, A. A., Tkacik, D. S., de Gouw, J. A., Gilman, J. B., Kuster, W. C., Borbon, A., and Robinson, A. L.: Intermediate-Volatility Organic Compounds: A Large Source of Secondary Organic Aerosol, Environ. Sci. Technol., 48, 13743–13750, https://doi.org/10.1021/es5035188, 2014.
Zheng, B., Huo, H., Zhang, Q., Yao, Z. L., Wang, X. T., Yang, X. F., Liu, H., and He, K. B.: High-resolution mapping of vehicle emissions in China in 2008, Atmos. Chem. Phys., 14, 9787–9805, https://doi.org/10.5194/acp-14-9787-2014, 2014.
Zheng, B., Tong, D., Li, M., Liu, F., Hong, C., Geng, G., Li, H., Li, X., Peng, L., Qi, J., Yan, L., Zhang, Y., Zhao, H., Zheng, Y., He, K., and Zhang, Q.: Trends in China's anthropogenic emissions since 2010 as the consequence of clean air actions, Atmos. Chem. Phys., 18, 14095–14111, https://doi.org/10.5194/acp-18-14095-2018, 2018.
Zheng, J., Shao, M., Che, W., Zhang, L., Zhong, L., Zhang, Y., and Streets, D.: Speciated VOC Emission Inventory and Spatial Patterns of Ozone Formation Potential in the Pearl River Delta, China, Environ. Sci. Technol., 43, 8580–8586, https://doi.org/10.1021/es901688e, 2009.
Zheng, J., Yu, Y., Mo, Z., Zhang, Z., Wang, X., Yin, S., Peng, K., Yang, Y., Feng, X., and Cai, H.: Industrial sector-based volatile organic compound (VOC) source profiles measured in manufacturing facilities in the Pearl River Delta, China, Sci. Total Environ., 456–457, 127–136, https://doi.org/10.1016/j.scitotenv.2013.03.055, 2013.