the Creative Commons Attribution 4.0 License.
the Creative Commons Attribution 4.0 License.
Arctic cloud annual cycle biases in climate models
Patrick C. Taylor
Robyn C. Boeke
Ying Li
David W. J. Thompson
Arctic clouds exhibit a robust annual cycle with maximum cloudiness in fall and minimum cloudiness in winter. These variations affect energy flows in the Arctic with a large influence on the surface radiative fluxes. Contemporary climate models struggle to reproduce the observed Arctic cloud amount annual cycle and significantly disagree with each other. The goal of this analysis is to quantify the cloud-influencing factors that contribute to winter–summer cloud amount differences, as these seasons are primarily responsible for the model discrepancies with observations. We find that differences in the total cloud amount annual cycle are primarily caused by differences in low, rather than high, clouds; the largest differences occur between the surface and 950 hPa. Grouping models based on their seasonal cycles of cloud amount and stratifying cloud amount by cloud-influencing factors, we find that model groups disagree most under strong lower tropospheric stability, weak to moderate mid-tropospheric subsidence, and cold lower tropospheric air temperatures. Intergroup differences in low cloud amount are found to be a function of lower tropospheric thermodynamic characteristics. Further, we find that models with a larger low cloud amount in winter have a larger ice condensate fraction, whereas models with a larger low cloud amount in summer have a smaller ice condensate fraction. Stratifying model output by the specifics of the cloud microphysical scheme reveals that models treating cloud ice and liquid condensate as separate prognostic variables simulate a larger ice condensate fraction than those that treat total cloud condensate as a prognostic variable and use a temperature-dependent phase partitioning. Thus, the cloud microphysical parameterization is the primary cause of inter-model differences in the Arctic cloud annual cycle, providing further evidence of the important role that cloud ice microphysical processes play in the evolution and modeling of the Arctic climate system.
- Article
(32083 KB) - Full-text XML
-
Supplement
(13071 KB) - BibTeX
- EndNote
Arctic clouds, arguably one of the most poorly understood aspects of the Arctic climate system, strongly modulate radiative energy fluxes at the surface, through the atmosphere, and to the top of the atmosphere (Cesana et al., 2012; Curry et al., 1996; Kay et al., 2008; Kay and L'Ecuyer, 2013; Shupe and Intrieri, 2004). As such, Arctic clouds have the potential to influence climate variability and change in the Arctic and globally. For instance, the presence of clouds in winter over sea ice can be the difference between a −40 W m−2 surface radiative energy imbalance and a balanced surface radiation budget, influencing surface temperature and sea ice growth (Morrison et al., 2012; Persson et al., 2002, 2017). Accurately representing clouds in climate models is therefore necessary to realistically simulate the evolution of the Arctic surface energy budget.
Contemporary climate models, however, strongly disagree with observations of the seasonality of Arctic cloud radiative effects. Observations indicate that Arctic clouds cool the surface through the reflection of solar radiation for a few months during summer and warm the surface through enhanced downwelling longwave radiation over the rest of the year (Kay and L'Ecuyer, 2013; Shupe and Intrieri, 2004). Climate models possess significant biases in the seasonality of the surface cloud radiative effect (Boeke and Taylor, 2016; Karlsson and Svensson, 2013, 2011). Climate models participating in the Coupled Model Intercomparison Project 5 (CMIP5) (Taylor et al., 2011) simulate Arctic clouds that are too reflective in summer and not insulating enough in winter. These cloud radiative effect biases trace to a number of errors in cloud properties: namely, insufficient Arctic cloud amount (English et al., 2015); inaccurate partitioning of cloud water between the liquid and ice phase, leading to excessive ice clouds (Cesana et al., 2012; Kay et al., 2016); and insufficient supercooled liquid clouds (Komurcu et al., 2014). This study focuses on errors in model-simulated Arctic cloud amount and annual cycle.
Arctic cloud amount exhibits a robust annual cycle that has been known for some time (Hahn et al., 1995; Huschke, 1969). However, important revisions to our understanding of the cloud amount annual cycle have occurred since the launch of the CloudSat Cloud Profiling Radar (Stephens et al., 2008) and the Cloud-Aerosol Lidar with Orthogonal Polarization (CALIOP) (Winker et al., 2010). As illustrated in Liu et al. (2012), both ground observer and satellite passive radiometer retrieval data sets indicate a broad summer maximum in cloud amount extending into September, declining through fall, and reaching an annual cycle minimum in winter. Both data sets suffer from the lack of sunlight in fall and winter. Passive cloud retrieval algorithms also change with surface type, posing additional challenges (Minnis et al., 2011). CALIOP and CloudSAT active remote-sensing instruments provide cloud amount data independent of surface type with high accuracy in the absence of sunlight. Active remote-sensing observations indicate that average Arctic cloud amount exceeds 65 % for each month, reaching 90 % in fall (Boeke and Taylor, 2016; Liu et al., 2012), and that previous data sets missed ∼10 %–15 % of fall cloud cover. Space-based active retrievals are not without limitations, most important of which is a 25 %–40 % under-detection of clouds below 500 m relative to surface-based remote-sensing observations (Liu et al., 2017). However, CALIOP and CloudSAT cloud amount data still provide the most complete characterization of vertically resolved Arctic-wide cloud amount.
Despite the refined observational knowledge of the Arctic cloud annual cycle, the mechanisms that control it remain an open question. Beesley and Moritz (1999) outline several physical controls on Arctic clouds including surface–atmosphere coupling, large-scale meteorology, and cloud microphysics. First, the surface–atmospheric coupling mechanism implies less sea ice, more surface evaporation, and that Arctic cloud amount should follow the annual cycle of sea ice. Observationally, this mechanism has been shown to operate under specific conditions in fall, where reduced sea ice cover corresponds to increased cloud amount, but not in summer (Kay and Gettelman, 2009; Morrison et al., 2018; Taylor et al., 2015). Second, seasonal changes in large-scale meteorology, atmospheric advection, and humidity influence the cloud amount annual cycle. Previous work demonstrates a significant dependence of cloud properties on local atmospheric conditions (Barton et al., 2012; Kay and Gettelman, 2009; Li et al., 2014; Liu and Schweiger, 2017). Lower tropospheric stability has a profound influence on Arctic low cloud amount, where increased stability corresponds to reduced cloud amount (Taylor et al., 2015). Third, cloud microphysical processes affect cloud amount and exhibit a seasonality tied to temperature, where colder temperatures support ice crystal formation and growth (e.g., via heterogeneous freezing and the Wegener–Bergeron–Findeisen process) (Beesley and Moritz, 1999). The growth of ice crystals consumes available liquid, leading to precipitation. Once all of the ice has fallen out, the atmosphere often transitions from a cloudy to clear state (Pithan et al., 2014). In addition, the seasonality of aerosol amount and composition can influence cloud amount and properties by altering microphysics (Coopman et al., 2018; Jackson et al., 2012).
Given the lack of mechanistic understanding of the drivers of the Arctic cloud annual cycle, it comes as no surprise that climate models struggle to simulate the Arctic cloud amount annual cycle. Comparison of the CALIOP-CloudSAT total column cloud amount with CMIP5 models indicates that individual models differ from observations by more than 15 % in summer and 40 % in winter (Boeke and Taylor, 2016). Further, Boeke and Taylor (2016) show that several models produce peak cloud cover in winter, whereas others produce peak cloud cover in summer; few models capture the observed fall cloud cover peak. Thus, the majority of models misrepresent the annual cycle of Arctic cloud cover. Meteorological reanalysis data products are not immune and also exhibit similar errors in the Arctic cloud amount annual cycle timing (Liu and Key, 2016).
The combination of poor model simulation and the lack of mechanistic understanding of the drivers of the Arctic cloud annual cycle signals a critical gap in our understanding with significant consequences for our ability to attribute, simulate, and predict Arctic climate variability and change. We address this gap by investigating the drivers of the inter-model differences in the Arctic cloud annual cycle in CMIP5 climate models. As indicated by previous studies, Arctic cloud amount is influenced by its environment, a fact that guides this study. We adopt a methodology that stratifies climate-model-simulated vertically resolved cloud amount by several key cloud-influencing factors, which are described in Sect. 2. The stratification methodology, discussed in Sect. 3, enables us to explore the dependence of simulated cloud amount on individual and groups of cloud-influencing factors and how they differ across the CMIP5 models. In Sect. 4, our key results are compared with previous work (Li et al., 2014a) and our understanding of the mechanisms driving the Arctic cloud annual cycle is discussed. Lastly, Sect. 5 highlights the insights gained into how the Arctic cloud annual cycle influences Arctic climate variability and change and our ability to simulate it.
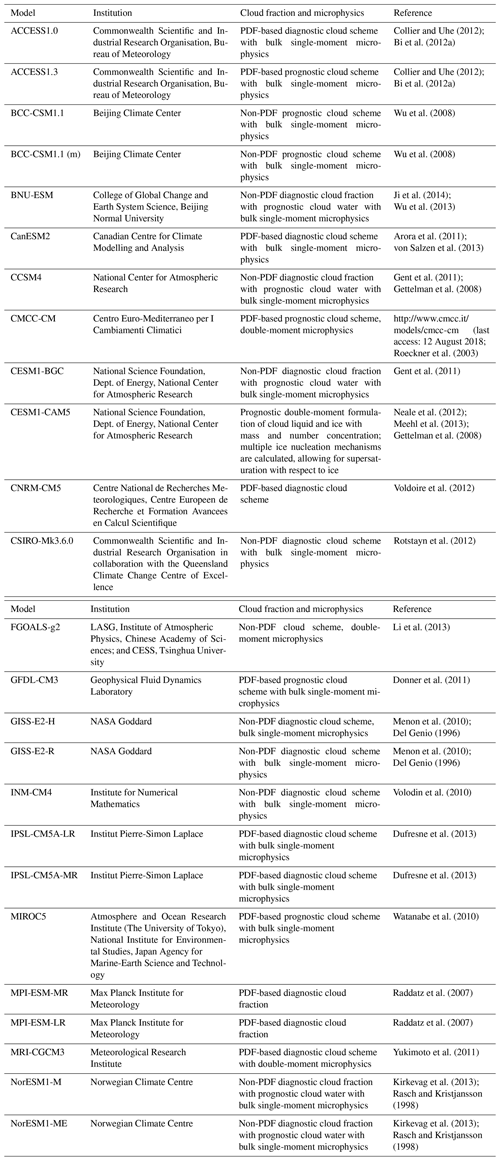
The goal of this analysis is to explain the divergent representations of the Arctic cloud amount annual cycle found in contemporary climate models. We use the historical forcing simulations (prescribed greenhouse gases and land use changes consistent with observations from 1979 to 2005) from 24 CMIP5 climate models (Taylor et al., 2011; see Table 1 for a detailed description of each model and the corresponding model cloud and microphysics scheme). The model outputs are available in the CMIP5 archive (https://esgf-node.llnl.gov/projects/cmip5/, last access: 12 August 2018).
Several observed and reanalysis variables are included as a reference to gauge the fidelity of the model results. The Modern-Era Retrospective Analysis for Research and Applications-2 (MERRA-2) provides information about the Arctic atmospheric conditions. MERRA-2 has a horizontal resolution of 0.5∘ latitude × 0.625∘ longitude and vertical resolution of 72 hybrid-eta levels fully described in Molod et al. (2015). The observed vertically resolved Arctic cloud amounts are derived from CALIPSO-CloudSAT-CERES-MODIS (C3M) data (Kato et al., 2010). Vertical profiles of cloud fraction are also included from ERA-Interim reanalysis (Dee et al. 2011).
The primary methodology composites cloud amount into bins of individual cloud-influencing factors, adapted from Li et al. (2014). The cloud-influencing factors considered include vertically resolved cloud amount, air temperature (TA), relative humidity (RH), 500 hPa vertical velocity (ω500), sensible heat flux (SHF), latent heat flux (LHF), liquid and ice water mixing ratios (CLW and CLI, respectively), sea ice concentration (SIC), and lower tropospheric stability (LTS). Lower tropospheric stability is defined as the potential temperature difference between the surface and 700 hPa, computed from the monthly averaged temperature profile. We also extend our composite analysis beyond single variables and construct joint distributions.
The primary difference between the present analysis and Li et al. (2014) is the use of monthly averaged model output instead of instantaneous satellite data. To understand the potential shortcomings of using monthly averaged output instead of daily output, calculations were investigated by carrying out the analysis using daily data based on one available model (IPSL-CM5A-LR). The results (not shown) indicated that the largest difference between using daily and monthly mean model output was due to the lesser dynamic range on monthly timescales. Overall, the daily and monthly mean results agree in the most frequently occurring meteorological conditions. The largest differences between the daily and monthly results occur in winter for high-stability regimes (LTS > 34) in which daily data show about 10 % larger CA than monthly; however, these regimes occur with a frequency less than 0.1 %. We also note that the covariances between clouds and cloud-influencing factors evaluated at daily and monthly timescales represent different manifestations of processes; thus, different processes may be important for explaining cloud behavior and model differences at daily and monthly timescales. As such, care must be taken in the interpretation of the results at monthly timescales. We do not expect the use of monthly averaged data to affect the main conclusions; however, an analysis performed at the daily timescale provides more detailed information due to the larger dynamic range with the potential to identify additional processes that cause model differences under a wider range of atmospheric conditions.
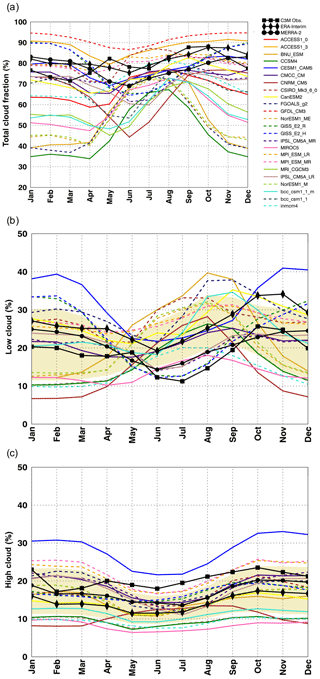
Figure 1Annual cycle of (a) total cloud amount, (b) low cloud amount (defined as cloud between 1000 and 850 hPa), and (c) high cloud amount (cloud between 500 and 300 hPa). Color lines represent individual CMIP5 models, black lines with symbols represent C3M observations and reanalysis. The yellow shading in (b) and (c) represents the ensemble mean ± one standard deviation.
Lastly, the results are composited and analyzed within two groups based upon key features of the simulated Arctic total cloud amount annual cycle. Figure 1a shows that the cloud amount annual cycles from individual models tend to follow one of two patterns: (1) the largest cloud amount in winter with small seasonal variations and (2) the minimum cloud amount in winter and maximum cloud amount in summertime and early autumn, with large seasonal amplitude. Figure 2 further summarizes these two patterns by showing a scatterplot of the average winter (DJF) and summer (JJA) cloud amounts for individual models. This result motivates the separation of the 24 models into two groups: models that simulate a larger total cloud amount in winter are referred to as Group 1 (10 models), whereas models that simulate a larger total cloud amount in summer are referred to as Group 2 (14 models).
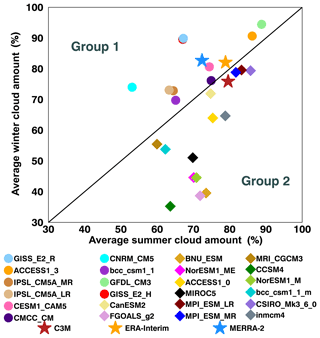
Figure 2Average total cloud amount in winter (DJF) vs. average in summer (JJA). Models above the 1:1 line (maximum cloud amount in winter; circle symbols) are defined as Group 1 and those below the 1:1 line (maximum cloud amount in summer; square symbols) are Group 2. The star symbols represent C3M observations (red), ERA-Interim (orange), and MERRA-2 (blue).
While the models can be grouped in several different ways, the choice to delineate model groups above and below the diagonal 1:1 line in Fig. 2 clearly places models with similar cloud amount annual cycle shapes together, while also grouping them based on how they differ from C3M observations and two reanalyses (see stars in Fig. 2). Group 1 models show maximum cloud amount in winter, which closely resemble MERRA-2 but differ from C3M observations. Group 2 models correctly simulate the winter-season minimum cloud amount, consistent with C3M, but possess (1) a much larger-amplitude of annual cycle than that in either C3M or reanalysis and (2) a summer peak in cloud amount as opposed to fall, as seen in both C3M and ERA-Interim. This separation is also motivated by the need to understand the factors (e.g., microphysics, surface turbulent fluxes, dynamics, and thermodynamics) responsible for producing clouds in these individual seasons and to provide insight as to the cause(s) of the differences in Arctic cloud amount annual cycle between models. The application of this grouping allows us to consolidate the analysis and take a deeper look at the influencing factors.
As a test of the robustness of the grouping strategy, we created a third group containing the five models closest to the C3M observations (hereafter Group 3: bcc-csm1-1, CMCC-CM, CanESM2, MPI-ESM-MR, and MPI-ESM-LR). Composites of CA for from Group 3 show features present in both Group 1 and Group 2, as expected since Group 3 contains models from each (not shown). This indicates that even the models closest to observations display features from their respective group. If the 1:1 line was a poor metric to use for group selection, we would expect Group 3 to resemble one of the groups or neither of the groups. Thus, the results are robust to a small change in the grouping strategy.
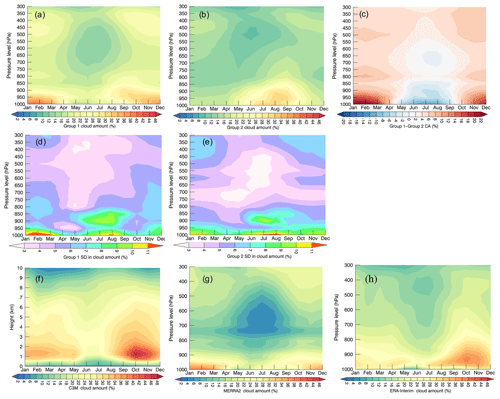
Figure 3Vertically resolved mean cloud amount annual cycle for (a) Group 1, (b) Group 2, and (c) Group 1 minus Group 2 as well as the vertically resolved standard deviation across (d) Group 1 and (e) Group 2 members are shown. Observational and reanalysis profiles of cloud amount are shown for (f) C3M, (g) MERRA-2, and (h) ERA-Interim.
3.1 Vertical variations in the cloud amount annual cycle
Figure 3 illustrates the vertically resolved average cloud amount annual cycle for each model group observation (Fig. 3f–h). Observations and two reanalyses (Fig. 3g–h) all agree on the timing of minimum low cloud amount during summer. The peak season of the low cloud amount is slightly different. For example, both C3M and ERA-Interim (Fig. 3g, h) show the peak in low cloud amount and vertical extent in late autumn around October, whereas the MERRA-2 reanalysis (Fig. 3f) shows the low cloud amount peak in winter around January and February.
Group 1 (Fig. 3a) exhibits a minimum in low cloud amount (>850 hPa) in May through July with a maximum low cloud amount in January and February. Group 1 high cloud amount follows a similar seasonal pattern as low clouds with a minimum in summer and maximum in the fall and winter at reduced amplitude. Group 2 (Fig. 3b) exhibits a similar high cloud amount annual cycle as Group 1 with smaller cloud amounts and a weaker amplitude. However, the annual cycle of low cloud in Group 2 indicates that cloud amount slowly increases in amount and extends in height through summer, then sharply decreases after September, in sharp contrast with C3M observations, MERRA-2 reanalysis Group 1 (Fig. 3f, g), and Group 1 (Fig. 3a).
The standard deviation in cloud amount across each group (Fig. 3d, e) indicates that the intragroup differences are greatest in the lowest levels of the atmosphere during all months for both groups. Specifically, the standard deviation in cloud amount is greatest at vertical levels and times of year with the largest cloud amount, below 800 hPa and above 500 hPa in winter for both groups and below 800 hPa in summer. The only exception is in Group 1, where larger standard deviations occur in summer below 800 hPa, when Group 1 models show minimum cloud amount.
The seasonal cycle of the vertically resolved cloud amount (Fig. 3) are consistent with the results in Fig. 1b, c, which illustrate the simulated and observed seasonal cycles of Arctic cloud amount for low clouds (1000–850 hPa) and high clouds (500–300 hPa), respectively. The results in Fig. 1a, c demonstrate that low clouds predominantly contribute to the winter vs. summer peaks in the simulated seasonal cycle of the total cloud amount. The rest of this paper analyzes how the dependence of cloud amount on the cloud-influencing factors contributes to these differences in Arctic low cloud amount in winter vs. summer. The goal of this paper is to understand how, why, and to what extent do the cloud-influencing factors contribute to the differences in the Arctic low cloud amount, with winter peaks in Group 1 and late summer peaks in Group 2.
3.2 Horizontal variation in the cloud amount annual cycle
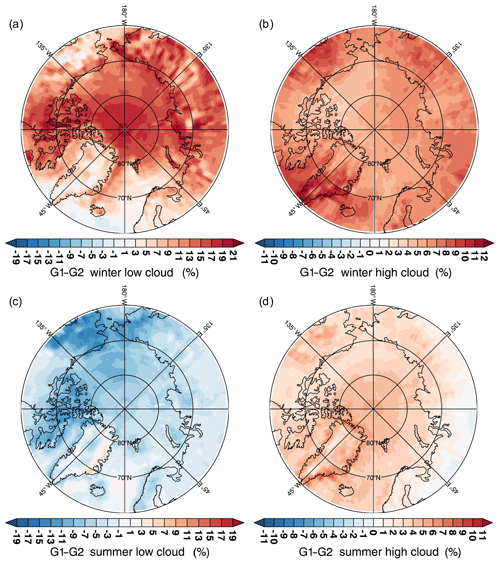
The above differences in the annual cycle of the Arctic clouds between Groups 1 and 2 are based on the averages over the entire Arctic region, in this subsection we further confirm that such differences in sign are spatially uniform across the Arctic. Figure 4 illustrates the spatial variations in the low and high cloud amount differences for Group 1 minus Group 2. In winter, Group 1 produces an average of 12.4 % more low clouds than Group 2 (Fig. 4a) and 7.3 % fewer low clouds in summer (Fig. 4c). These differences are generally spatially uniform. Differences in high cloud amount show similar spatial uniformity but with Group 1 producing more high clouds than Group 2 in both winter (+6.4 %) and summer (+3.7 %) (Fig. 4b, c). Overall, the spatial variability of the difference is very weak (i.e., the differences in the average high and low cloud amount between land, ocean, and all surface types are generally less than 1 %); thus, regional differences do not significantly contribute to the annual cycle differences in low or high cloud amount.
Since atmospheric and surface properties vary across the Arctic and can influence the simulated cloud amount, we also analyze the spatial variations in cloud-influencing factors for the model groups (not shown) and find that the differences between Group 1 and Group 2 exhibit a general spatial uniformity with only minor deviations. As such, the following stratification analysis is performed over the entire Arctic region.
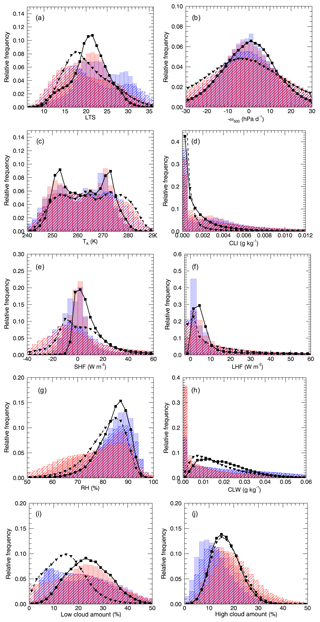
Figure 5Probability distributions of (a) LTS, (b) −ω500, (c) low-level TA, (d) CLI, (e) SHF, (f) LHF, (g) RH, (h) CLW, (i) low cloud amount, and (j) high cloud amount. Red shading denotes Group 1, blue denotes Group 2, solid fill represents ocean grid boxes, and cross-hatching represents land grid boxes. The solid black line shows MERRA-2 reanalysis values for ocean (square symbol) and land (triangle symbol). Distributions include all months of the year.
3.3 Intergroup differences in mean and distribution of atmospheric conditions
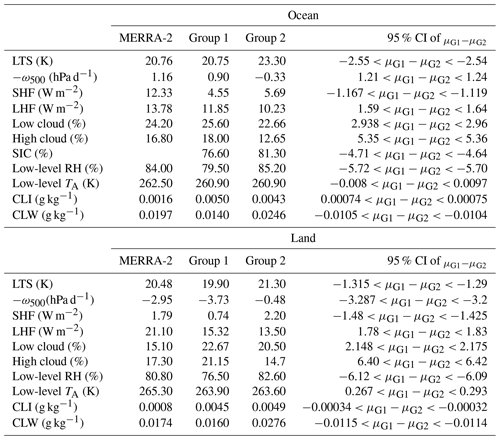
Arctic cloud formation is influenced by a number of atmospheric characteristics including surface and boundary layer thermodynamic properties and large-scale dynamics (Kay and Gettelman, 2009; Liu and Schweiger, 2017; Taylor et al., 2015). Table 2 and Fig. 5 provide the annual mean ensemble averages of cloud-influencing factors for each group and their probability density functions (PDFs) over the ocean and land surfaces. Although the average properties for all cloud-influencing factors between the two groups are significantly different at 95 % confidence (fourth column in Table 2), the differences are generally very small, suggesting that differences in the average atmospheric conditions do not drive intergroup differences in the cloud amount annual cycle. Notable differences found for LTS, RH and CLW over both surface types, with the values in Group 2 higher than those in Group 1. Overall, the spread in the average cloud-influencing factors is larger within each group than between Group 1 and 2.
The variability of individual cloud-influencing factors is consistent between the groups, with some small differences. The PDFs in Fig. 5 summarize the frequency of the cloud-influencing factors for Group 1 (red) and Group 2 (blue) separated into land (cross-hatching) and ocean (solid). Figure 5 includes PDFs of each variable derived from MERRA-2 reanalysis with solid black lines for ocean (square symbols) and land (triangle symbols). In most cases, the distribution of cloud-influencing factors is similar between the two groups for each surface type. Consistent with Table 2, the most notable differences between the groups are that (1) Group 2 models exhibit a higher frequency of stronger LTS values for both land and ocean (Fig. 5a) and (2) Group 2 −ω500 exhibits a higher frequency of values near 0 hPa d−1 over both land and ocean (Fig. 5b). In these cases, Group 1 −ω500 and LTS is more consistent with MERRA-2. Additional group differences are seen in RH (Fig. 5g), CLI (Fig. 5d) and CLW (Fig. 5h), where Group 2 favors higher RH, larger CLW, and a higher frequency of CLI values near 0 g kg−1 while Group 1 shows a higher frequency of CLW values near 0 g kg−1.
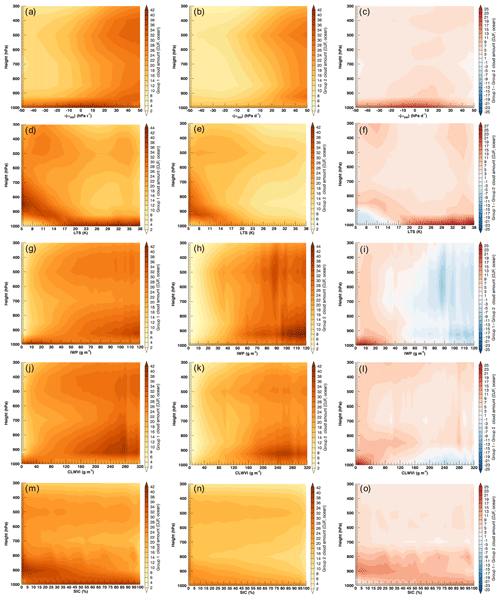
Figure 6Vertically resolved DJF average cloud amount stratified by −ω500 for (a) Group 1, (b) Group 2, and (c) Group 1 minus Group 2; LTS for (d) Group 1, (e) Group 2, and (f) Group 1 minus Group 2; IWP for (g) Group 1, (h) Group 2, and (i) Group 1 minus Group 2; CLWVI for (j) Group 1, (k) Group 2, and (l) Group 1 minus Group 2; and SIC for (m) Group 1, (n) Group 2, and (o) Group 1 minus Group 2. All panels are for ocean.
3.4 Dependence of vertically resolved cloud amount on cloud-influencing factors
We investigate the extent to which intergroup differences in cloud amount are explained by differences in the relationship between cloud amount and cloud-influencing factors. Figure 6 shows the vertically resolved average cloud amount in DJF binned by five different cloud-influencing factors: −ω500, LTS, ice water path (IWP), total condensed water path (CLWVI; ice plus liquid), and SIC, all of which show relatively large intergroup differences as compared to other variables (see Table 2 and Fig. 5). Since Group 1 models show a winter cloud amount peak in the annual cycle, it is expected that Group 1 produces larger cloud amounts than Group 2 throughout the troposphere and especially below 850 hPa for most cloud-influencing factors (Fig. 6, right column).
Figure 6a, b illustrate the cloud vertical structure in DJF as a function of −ω500 and reveals a general increase in cloud amount as the strength of rising motion increases at most levels for both groups over ocean (from left to right in Fig. 6a, b) and land (Fig. S1 in the Supplement). Note that for levels >950 hPa, cloud amount in Group 1 exhibits larger cloud amounts under both sinking and rising motion, and also contributes to large intergroup differences at pressures >950 hPa (Fig. 6c).
Figure 6d, e illustrate the dependence of the vertically resolved cloud amount in DJF stratified by LTS. Both groups exhibit a general decrease in cloud amount and vertical extent with stronger LTS at all levels and over both ocean and land (Fig. S1); in other words, as conditions become more stable, clouds tend to occur less frequently and are constrained to a shallower layer closer to the surface, also found in observations (Taylor et al., 2015). Much like −ω500, Group 1 produces equal or larger cloud amounts at pressures >950 hPa as LTS increases, signaling a potentially important −ω500–LTS covariance (discussed below). Specifically, the average cloud amount is >20 % larger in Group 1 than in Group 2 when LTS >20 K at pressures >950 hPa. The larger cloud amounts at pressures >950 hPa in Group 1 can be viewed as either a difference in a dissipative mechanism (e.g., turbulent mixing, cloud microphysics, or precipitation) between the groups or a difference in cloud production (e.g., ice formation or surface buoyancy).
Figure 6g, h, j, k illustrate the dependence of cloud amount in DJF on IWP and CLWVI. Models in both groups favor more cloud amount with higher cloud bases for increasing IWP and CLWVI; both surface types exhibit similar behavior. Group 1 diverges from Group 2 at lower values of IWP and CLWVI ( g m−2) by producing maximum cloud amount in the thin cloud regime at pressures >950 hPa (Fig. 6g, j), while Group 2 shows minimum cloud amount. For the average wintertime values of IWP (∼32 g m−2) and CLWVI (∼52 g m−2), Group 1 has larger cloud amount than Group 2 at all levels over ocean and land.
The influence of surface conditions on cloud amount over the Arctic Ocean is assessed using SIC (Fig. 6m–o). Representing an integral measure of the surface influence on cloud amount, increased SIC generally corresponds to decreases in surface turbulent fluxes and stronger LTS (Pavelsky et al., 2011; Taylor et al., 2018). Figures 6m, n illustrate that both groups produce a decrease in cloud amount and lower cloud bases with increased SIC although the cloud amount is higher in Group 1 than in Group 2. As for other variables, this relationship is weakened in Group 1 at pressures >950 hPa.
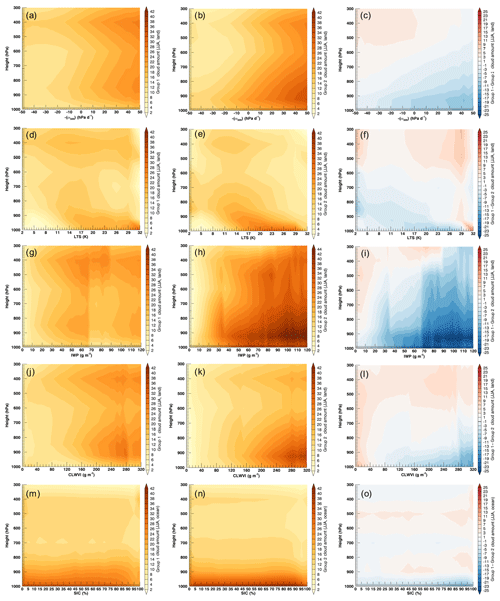
Figure 7Vertically resolved JJA cloud amount stratified by −ω500 for (a) Group 1, (b) Group 2, and (c) Group 1 minus Group 2; LTS for (d) Group 1, (e) Group 2, and (f) Group 1 minus Group 2; IWP for (g) Group 1, (h) Group 2, and (i) Group 1 minus Group 2; CLWVI for (j) Group 1, (k) Group 2, and (l) Group 1 minus Group 2; and SIC for (m) Group 1, (n) Group 2, and (o) Group 1 minus Group 2. All panels are over land except for SIC.
Figure 7 shows the vertically resolved average cloud amount dependence on four different cloud-influencing factors (−ω500, LTS, IWP, and CLWVI) over land and one (SIC) over ocean for summer (JJA). We show results over land in summer because differences exceed 20 % over land and are 5 %–10 % over ocean. Since Group 2 includes models with a summer cloud amount peak in the seasonal cycle (especially for low clouds), it is expected that Group 2 models generally produce larger cloud amount than Group 1 throughout the troposphere for almost all cloud-influencing factors (right column). The largest intergroup differences are again at pressures >950 hPa.
Important findings from Fig. 7 include (1) the intergroup differences in cloud amount are ∼5 %–10 % smaller during summer, (2) Group 2 tends to produce more clouds at pressures >950 hPa for all cloud-influencing factors, (3) all dependencies of cloud amount on cloud-influencing factors are weaker in summer than in winter, and (4) neither group exhibits a dependence of the average cloud fraction on SIC. Only cloud amount dependencies with −ω500, IWP, and CLWVI illustrate a noteworthy gradient in summer, where Group 2 produces a stronger low cloud amount increase as rising motion increases and at larger IWP/CLWVI values.
The winter and summer analyses reveal several key takeaways. First, the primary intergroup differences are found at pressures > 950 hPa in the thin, low ice cloud regime (IWP <35 g m−2) in winter and the thicker low cloud regime (IWP > 70 g m−2) in summer. Second, the differences in the cloud amount dependence on cloud-influencing factors are larger during winter than summer. Third, the largest intergroup differences are found under stable conditions (LTS > 20 K) and sinking motion in winter and under rising motion in summer. The fact that intergroup differences in the cloud amount dependence are largest for LTS and −ω500, and the expectation of significant covariances between these two variables warrants simultaneous analysis using a joint distribution to address the question, why are Group 1 models able to maintain large low cloud fraction under strong stability and subsidence?
3.5 Joint PDFs: LTS and −ω500
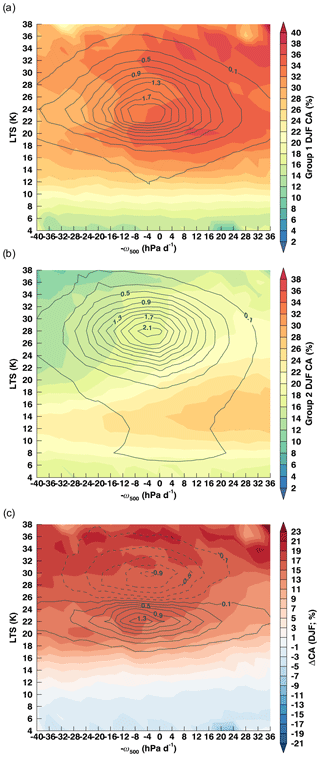
Figure 8 shows the joint distribution of average low cloud amount in winter stratified by both LTS and −ω500 (Fig. 8a–b), and superimposed with the corresponding frequency of occurrence (contours) for Group 1 (Fig. 8a) and Group 2 (Fig. 8b). Cloud amount depends on both (1) the relationship between the cloud amount and LTS and −ω500 and (2) how frequently each LTS and −ω500 bin occurs. For regions with LTS <12 K, low cloud amount for both groups is primarily a function of LTS with little dependence on −ω500; the intergroup differences illustrate the same behavior (Fig. 8c). Considering LTS > 12 K, low cloud amount exhibits a dependence on both LTS and −ω500; however, the intergroup differences (Fig. 8c) still correspond only to variations in LTS.
While both groups simulated the highest frequency of occurrence of −ω500 bin around −4 hPa d−1, Group 1 most frequently simulates LTS values between 22 and 24 K, whereas Group 2 simulates slightly higher values between 26 and 30 K (Fig. 8a, b contours). Thus, the intergroup difference is marked by a dipole pattern along the LTS axis between 22–24 and 26–30 K, and these regions contribute most to the winter low cloud amount between Group 1 and Group 2.
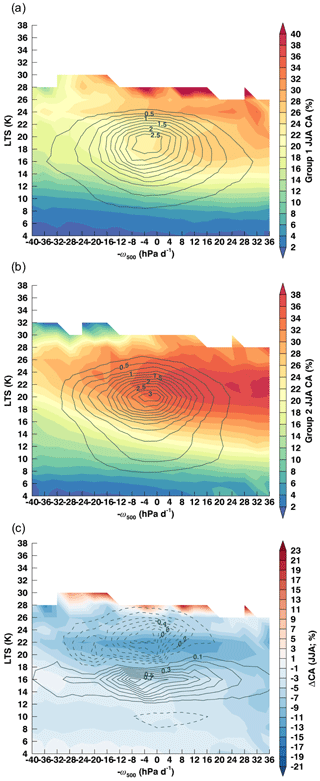
Figure 9Contours of average low cloud amount for JJA in the LTS and −ω500 joint distribution for (a) Group 1, (b) Group 2, and (c) Group 1 minus Group 2. The frequency of occurrence for each LTS and −ω500 bin is contoured in solid black with an interval of 0.2 %.
Figure 9 shows the joint distribution of low cloud amount by LTS and −ω500 bins and the corresponding frequency of occurrence in summer. The pattern in the summer average low cloud amount is more similar between the groups (Fig. 9a, b) compared to winter, yielding smaller intergroup differences (Fig. 9c). For LTS <14 K, low cloud amount depends primarily on LTS with a weak dependence on −ω500; whereas for LTS > 14 K, low cloud amount depends on both LTS and −ω500, a behavior similar to winter. Additionally, the low cloud amount gradients are sharper in summer than winter, meaning that summer low cloud amount is more susceptible to small changes in LTS and −ω500 than in winter. The intergroup differences in frequency of occurrence indicates that Group 2 exhibits higher LTS values (20–25 K) and lower LTS values (<12 K) more frequently than Group 1.
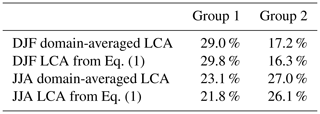
Table 3Summary of the average low cloud amount for each group from model output and as computed using Eq. (1).
Based on the relationships between low cloud amount and LTSi and , as illustrated in Figs. 8 and 9, the winter or summer average low cloud amount can be estimated using
This expression describes the weighted sum of the low cloud amount over all LTSi and from each i, j bin, where LCA corresponds to the low cloud amount as a function of LTSi and and RFO corresponds to the relative frequency of occurrence of each LTSi and bin. Applying Eq. (1) to compute the average low cloud amount, , in either winter or summer reproduces the winter and summer average low cloud amount for each group to within 1 %–2 % (Table 3). We construct LCA by averaging across months and models, thus removing some variability. As such, Eq. (1) parameterizes low cloud amount and is not expected to exactly reproduce . This exercise indicates that can be accurately reconstructed using the LCA and RFO suggesting that this approach is applicable to interpreting drivers of interannual variability or feedbacks in low cloud amount.
Equation (1) can be applied to both Group 1 and Group 2, and then the intergroup differences (Group 1 minus Group 2; ) can be estimated and decomposed using a first-order Taylor series approximation to further quantify the relative contributions from differences in Eq. (1) and Eq. (2) .
In Eq. (2), corresponds to the intergroup difference (Group 1 minus Group 2) in average low cloud amount, corresponds to the intergroup difference in the dependence of low cloud amount on LTS and −ω500, and corresponds to the intergroup difference in the relative frequency of occurrence of LTS and −ω500 bins. In this framework, the first term on the right-hand side represents the influence of the parameterized cloud physics (due to ) and the second term represents the influence of atmospheric state occurrence (due to ). Table 4 summarizes the results, indicating that the term is responsible for the summer and winter intergroup differences in low cloud amount.
Table 4Summary of decomposition results attributing Group 1 minus Group 2 differences in the average low cloud amount following Eq. (2).
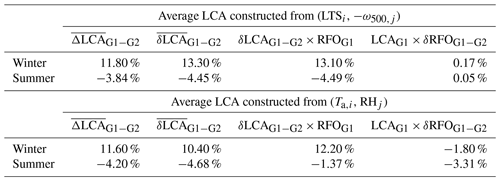
While this result attributes the Group 1 minus Group 2 differences to parameterized cloud physics and not the atmospheric state occurrence, it does not explain the fundamental cause. The cause(s) is(are) due to differences in the specifics of the parameterized cloud physics, systematic differences in the atmospheric conditions within LTS and −ω500 bins, or a combination of both. A systematic exploration of the intergroup differences in cloud physics parameterizations is beyond the scope of this study. However, we explore the intergroup differences in atmospheric conditions within LTS and −ω500 bins and perform an additional stratification, based upon specifics of the cloud microphysical schemes (Table 1), to assess the influence on low cloud amount differences.
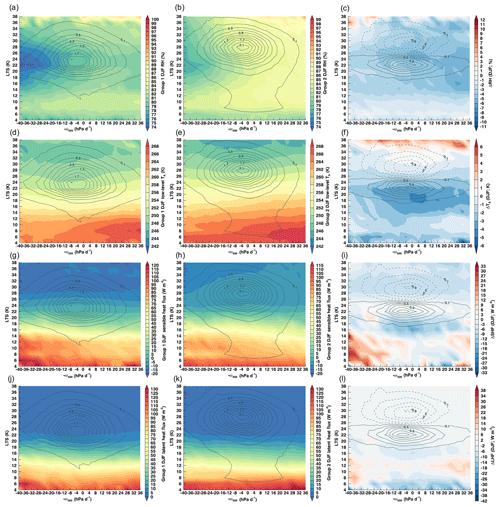
Figure 10Contours of DJF atmospheric and surface conditions in the LTS and −ω500 joint distribution for (a, d, g, j) Group 1, (b, e, h, k) Group 2, and (c, f, i, l) Group 1 minus Group 2 for (a–c) RH, (d–f) TA at 950 hPa, (g–l) SHF, and (j–l) LHF.
Characterizing atmospheric state by LTS and −ω500 bins does not account for all intergroup differences in atmospheric state. Thus, we consider atmospheric and surface conditions stratified by LTS and −ω500 (Fig. 10). Both groups exhibit similar distributions of lower tropospheric RH, 950 hPa TA, SHF, LHF, and SIC (not shown) within the LTS and −ω500 bins in winter (Fig. 10) and summer (Fig. S3). Intergroup differences in RH (Fig. 10c) are generally <5 % and anticorrelate with intergroup low cloud amount differences; in other words, Group 2 exhibits smaller low cloud amount than Group 1 and yet has a larger RH and more frequently simulates values >80 % (Fig. 5g). Alternatively, Group 1 is colder than Group 2 in the most frequently occurring bins (Fig. 10f), suggesting differences in cloud microphysics and ice formation. Inter-model differences in SHF and LHF indicate that the intergroup differences change sign with increasing LTS; however, these differences anticorrelate with the differences in low cloud amount.
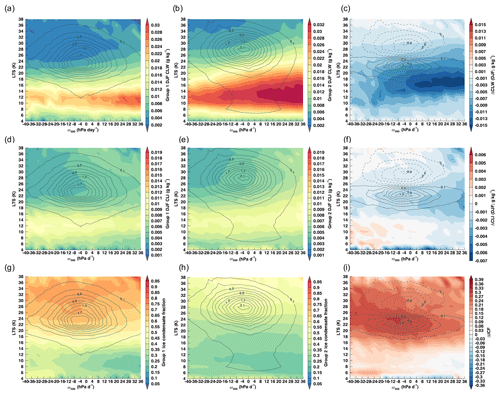
Figure 11Contours of winter low cloud CLW for (a) Group 1, (b) Group 2, and (c) Group 1 minus Group 2; CLI for (d) Group 1, (e) Group 2, and (f) Group 1 minus Group 2; and ice condensate fraction for (g) Group 1, (h) Group 2, and (i) Group 1 minus Group 2.
Intergroup differences in cloud microphysics and specifically the production of cloud liquid vs. ice strongly corresponds to intergroup differences in low cloud amount. Figure 11 illustrates the differences in winter lower tropospheric CLW (Fig. 11a–c), CLI (Fig. 11d–f), and ice condensate fraction (ICF; Fig. 11g–i), stratified by LTS and −ω500. ICF is defined as the ratio of CLI and CLWVI. Results for summer are presented in Fig. 12. Both groups exhibit similar overall dependencies of the liquid and ice water mixing ratio on LTS and −ω500 with Group 2 producing more cloud liquid than Group 1 (Fig. 11c) and slightly more cloud ice (Fig. 11f). The ICF (Fig. 11g, h), however, indicates that Group 1 produces a much higher percentage of total condensate as ice (ICF greater than 0.5 in the most frequently occurring regimes). Figures 11 and 12 support the idea that Group 1 models sustain a larger fraction of thin ice clouds at cold temperatures, supporting larger low cloud amount in winter. Moreover, the finding that Group 1 models are drier than Group 2 suggests that the enhanced cloud ice formation dehydrates the winter Arctic atmosphere. The smaller CLW in Group 1 may also be related to the greater CLI, as some models do not allow supersaturation with respect to ice, meaning that liquid supersaturation would not be reached under most Arctic winter conditions. This result is consistent with Kretzschmar et al. (2018), showing that not allowing ice supersaturation corresponds to a positive bias in low cloud cover in ECHAM6. Alternatively, the larger cloud liquid production by Group 2 corresponds to a larger low cloud amount in summer. The results support the argument that cloud-phase partitioning and cloud microphysical parameterizations explain the differences in the Arctic cloud amount annual cycle, and differences in the surface turbulent fluxes and atmospheric circulation contribute little. Therefore, improved representation of the Arctic cloud amount annual cycle requires improvements in the representation of cloud microphysical processes, especially in thin, low clouds.
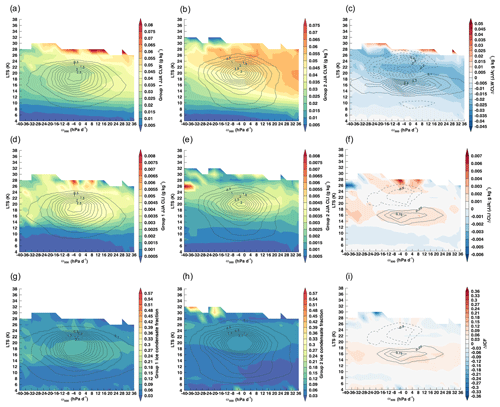
Figure 12Contours of JJA low cloud CLW for (a) Group 1, (b) Group 2, and (c) Group 1 minus Group 2; CLI for (d) Group 1, (e) Group 2, and (f) Group 1 minus Group 2; and ice condensate fraction for (g) Group 1, (h) Group 2, and (i) Group 1 minus Group 2.
To further investigate the role of microphysics, we first set out to stratify the models into new groups based upon whether or not supersaturation with respect to ice was allowed. However, we were not able to and found that the required information about whether a particular model allows ice supersaturation or not is not consistently identified in the cited literature (Table 1). Sufficient detail is provided in the literature to partition the models into Group A (those that treat cloud ice and water as prognostic variables) and Group B (those that treat total water as a prognostic variable and use a temperature-dependent phase partitioning). Figure 13 illustrates the joint distributions of low cloud amount, CLW, CLI, and ICF in DJF. While Groups A and B both contain Groups 1 and 2 models, the distributions of CLW, CLI, and ICF in Fig. 13 resemble those shown in Fig. 11. The results indicate that models treating total cloud water as a prognostic variable and that use a temperature-dependent phase partitioning have a smaller ICF (less cloud ice and more cloud water) than those that treat cloud ice and liquid as separate prognostic variables. The cloud fraction differences between this microphysical-scheme-based grouping is smaller than the original group but also takes on the same shape. Thus, the cloud microphysical treatment is a principle factor explaining the differences in the intergroup low cloud amount differences.
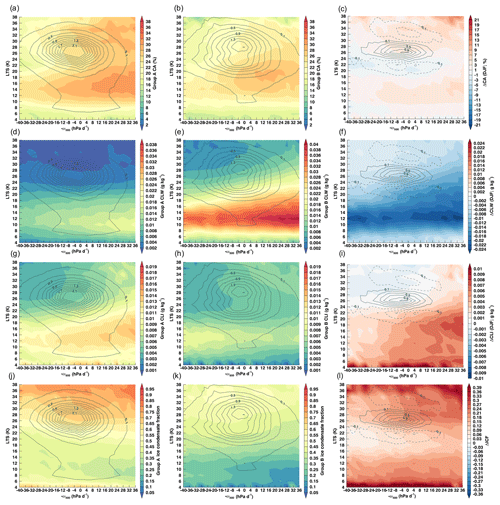
Figure 13Contours of winter low cloud amount for (a) Group A, (b) Group B, and (c) Group A minus Group B; low liquid water mixing ratio for (d) Group A, (e) Group B, and (f) Group A minus Group B; low cloud ice water mixing ratio for Group A (g), Group B (h), and Group A minus Group B (i). and ice condensate fraction for Group A (j), Group B (k), and (l) Group A minus Group B.
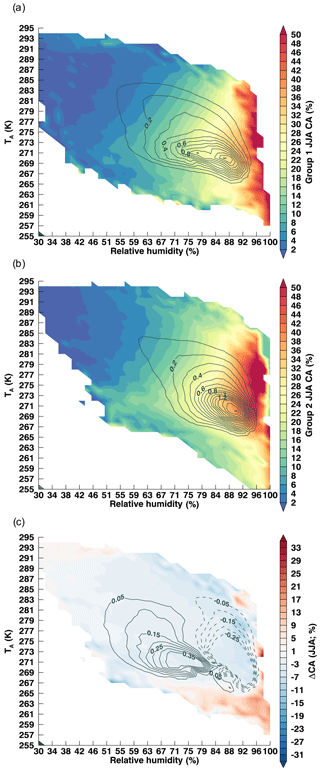
Due to the importance of TA and RH to this explanation, we further investigate the dependence of low cloud amount on TA and RH, as both variables influence the cloud microphysics parameterization. Figures 14 and 15 illustrate the joint distribution of the average low cloud amount stratified by lower tropospheric TA and RH and frequency of occurrence of each bin in winter and summer, respectively. The largest intergroup differences are found at the coldest temperatures and highest RH values for both winter (Fig. 14) and summer (Fig. 15). Group 1 favors cooler and drier atmospheric conditions than Group 2 (Fig. 14c), while also producing more clouds under those conditions. In summer, Group 2 models produce larger low cloud amounts compared to Group 1, occurring most frequently in the warmer and more humid conditions (Fig. 15). Group 2 also slightly favors more humid conditions in summer than Group 1, contributing to larger summer low cloud amount. Results applying the decomposition from Eq. (2) to the TA and RH joint distribution indicate that in winter differences in the parameterized cloud physics are primarily responsible for δLCAG1−G2, whereas in summer the relative frequency of occurrence is primarily responsible for δLCAG1−G2 (Table 4). This result supports our conclusion that cloud microphysical processes explain the model differences in Arctic low cloud amount in winter. In summer, however, Fig. 15 indicates that processes that control the frequency of occurrence of TA and RH states are also important to explain low cloud amount differences.
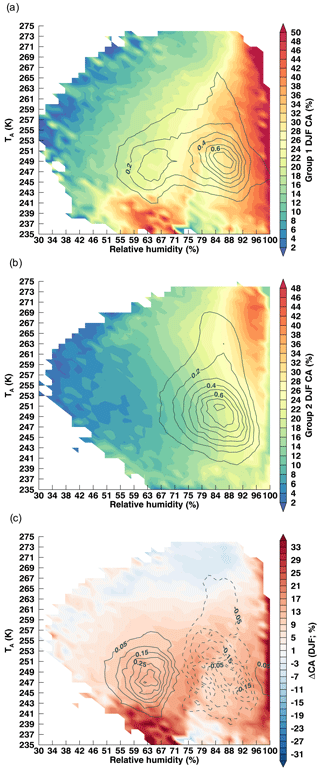
Figure 14Contours of average low cloud amount for DJF in the TA-RH joint distribution for (a) Group 1, (b) Group 2, and (c) Group 1 minus Group 2. The frequency of occurrence of TA–RH bins is contoured in solid black with an interval of 0.2 %.
This analysis explores the factors that influence Arctic cloud amount within contemporary climate models with the specific focus on understanding the factors that drive differences in the simulated Arctic cloud amount annual cycle. In comparing our results with previous work, the vertically resolved cloud amount dependencies (Figs. 6 and 7) on cloud-influencing factors agree with the observationally based analysis of Li et al. (2014). It should be noted that this result is despite differences in the temporal characteristics of the two analyses: monthly averaged model output vs. instantaneous satellite data. This result suggests that the use of monthly averages is not as big of a limiting factor for investigating the cloud dependence on atmospheric and surface conditions as previously assumed. Our results demonstrate that climate model parameterizations realistically reproduce the general Arctic cloud amount dependence on atmospheric conditions, yet subtle differences produce large discrepancies in the Arctic' cloud amount annual cycle between models and between models and observations. While a thorough model–observation comparison using CALIPSO-CloudSAT satellite simulator output is the subject of ongoing work, our results indicate that neither Group 1 nor 2 reproduces the observations (Fig. 3). Individual models significantly outperform the Group 1 and 2 averages, as indicated by the close proximity of five models (bcc-csm1-1, CMCC-CM, CanESM2, MPI-ESM-MR, and MPI-ESM-LR) to the observations (denoted by stars) in Fig. 2.
We argue that the primary cause of the larger cloud amount in Group 1 during winter is due to the production and maintenance of low, thin ice clouds at colder surface air temperatures than Group 2. We hypothesize that Group 1 maintains low cloud amount at colder temperatures as a result of cloud microphysical parameterization differences that produce a larger fraction of cloud ice than Group 2 overall and especially at colder temperatures and lower RH (Figs. S4 and S5 illustrate the ICF stratified by RH and TA). This hypothesis seems at odds with previous cloud process studies considering the mixed-phase cloud system, where high cloud ice production desiccates super cooled liquid and more efficiently precipitates, reducing low cloud amount (Morrison et al., 2012). In this case, the results suggest that Group 1 overcomes this by producing more cloud ice and not by not precipitating the ice out of the atmosphere. In addition, we do not know the frequency of mixed-phase clouds from monthly averaged output. Overall, the importance of cloud microphysics to model cloud amount is consistent with previous work illustrating that Arctic clouds and their radiative effects strongly respond to changes in ice microphysics (English et al., 2014; Kay et al., 2016; McCoy et al., 2016; Pithan et al., 2014; Tan and Storelvmo, 2015).
What do our results argue about the drivers of the Arctic cloud annual cycle? The climate model results argue that the Arctic cloud annual cycle is most strongly driven by the seasonality of cloud microphysics, specifically the cloud phase and temperature relationship. The SIC in both the intergroup differences, as well as the cloud amount dependence on sea ice, shows a weaker relationship than other factors indicating a limited role in driving the Arctic cloud annual cycle. The results do not support assigning a significant role to the seasonality of relative humidity in forcing the Arctic low cloud annual cycle because (1) the seasonality of RH is similar between the two groups (Fig. S3) and (2) models that produce fewer winter clouds possess higher RH. Rather, the cloud microphysics appear to shape Arctic lower tropospheric RH. Changes in atmospheric conditions, specifically LTS and −ω500, are significant between winter and summer indicating a role for the large-scale circulation. Our results support the idea of Beesley and Moritz (1999) that the covariance between atmospheric temperature and cloud microphysics is a major factor responsible for the Arctic cloud annual cycle.
A critical consideration is the cloud ice formation process. Models that do not allow supersaturation with respect to ice implicitly assume that deposition freezing is the dominant ice formation process in Arctic low clouds. However, observational evidence indicates that supercooled liquid must first be present before cloud ice is observed at temperatures warmer than −25 ∘C, supporting the notion that immersion freezing is the dominant ice nucleation process (de Boer et al., 2011). Our results indicate that a better understanding of ice formation mechanisms operating in the Arctic and the conditions under which each dominates would provide an important constraint on climate model physics and Arctic climate simulations. Moreover, additional model studies like Kretzschmar et al. (2018) that investigate the influence of ice supersaturation on Arctic low cloud amount are needed.
A new idea from this analysis is one of Arctic cloud susceptibility. Returning to the LTS and −ω500 joint distributions, summer vs. winter differences (Figs. 8a, b, and 9a, b) in the low cloud amount dependence are significant. Figures 8 and 9 show that the most frequently occurring atmospheric conditions in summer are found along a strong gradient in the low cloud amount dependence on LTS and −ω500, not the case for winter. This suggests that summer low cloud amount is more susceptible to changes in atmospheric conditions than winter low clouds. This apparent difference in the susceptibility of low cloud amount to changes in atmospheric conditions could have important implications for Arctic cloud feedback, as Taylor (2016) illustrates that changes in LTS imply large changes in the surface cloud radiative effect.
Surface- and space-based observations of Arctic clouds exhibit a robust annual cycle with maximum cloud amount in fall and a minimum in winter. Variations in cloud amount affect energy flows in the Arctic and strongly influence the surface energy budget. Therefore, understanding the role of clouds in the context of the present-day Arctic climate is imperative for improving predictions of surface temperature and sea ice variability, as well as for projecting Arctic climate change. As we and several authors before have demonstrated, contemporary climate models struggle to reproduce observed Arctic cloud amount and its variability, especially within the context of the annual cycle.
Our analysis focuses on identifying the causes of the climate model differences in the annual cycle representation. We find that most climate models tend to fall into one of two groups: one favoring larger winter cloud amount and another favoring larger summer cloud amount. The results demonstrate that differences in low, thin ice clouds at pressures >950 hPa, not middle or high clouds, are primarily responsible for the total cloud amount annual cycles within each group. These discrepancies between the two model groups exhibit little spatial variability, are consistent between land and ocean, and are only weakly influenced by sea ice concentration, suggesting that the cause of the cloud amount differences operates Arctic-wide.
Differences in atmospheric and surface conditions represent an important potential source of the low cloud amount differences. The results show small differences in the annual, domain-averaged atmospheric and surface conditions between the two groups and indicate that these are not responsible for the low cloud amount differences. Considering specific atmospheric and surface conditions, we find that models disagree most under strong lower tropospheric stability, weak to moderate mid-tropospheric subsidence, and cold lower tropospheric air temperatures. Overall, the cloud amount dependence on cloud-influencing factors explains most of the intergroup differences in cloud amount. Since the cloud amount dependence on cloud-influencing factors in climate models is governed by parameterized cloud physics, the results indicate that parameterization differences are responsible for the cloud amount discrepancies and that differences in the frequency of occurrence of atmospheric and surface conditions between the models are not a significant factor.
Why do models simulate different low cloud amounts under specific atmospheric conditions? Models produce similar dependencies of low cloud amount on atmospheric and surface conditions in summer but not in winter. Models able to sustain larger low cloud amounts at colder surface air temperatures simulate more winter clouds, and we argue that the details of the cloud microphysical parameterization are responsible by maintaining a larger fraction of cloud ice in some models than others. The present analysis is unable to isolate the specific characteristics of the ice microphysical parameterization (e.g., ice formation, crystal habit, mass–diameter relationship, fall speed, gamma size distribution parameters, etc.) that drive these differences; however, this should be the focus of future investigation. A commonality of these ice microphysical parameterization characteristics is that few observational constraints are available.
Our results have several implications to our understanding and modeling of Arctic climate.
-
Cloud ice microphysical processes are important contributors to the Arctic low cloud amount annual cycle and therefore are important to the seasonality of the Arctic surface energy budget and sea ice cover.
-
Mean Arctic low cloud amount is strongly constrained by atmospheric variability, namely by the lower tropospheric stability and mid-tropospheric vertical motion fields.
-
Lower tropospheric stability plays an important role in explaining the inter-model differences in low cloud amount.
-
Cloud microphysical parameterizations drive significant inter-model differences in Arctic cloud amount and annual cycle.
-
Improved modeling of the Arctic cloud amount annual cycle and its influences on Arctic climate variability and change requires observational constraints on ice microphysical processes, particularly on cloud-phase partitioning and ice formation mechanisms.
-
The general thinking that models producing too much ice then desiccate supercooled liquid and yield fewer clouds does not explain model biases in low cloud amount. Our results indicate that in winter a larger ice condensate fraction supports larger low cloud amounts, likely because models simulate very little supercooled liquid in winter. Larger supercooled liquid water is associated with larger low cloud amounts in summer.
-
Lastly, we were surprised to find that models treating cloud ice and liquid condensate as separate prognostic variables simulate larger ice condensate fractions than those that treat total cloud condensate as a prognostic variable and use a temperature-dependent phase partitioning.
In closing, Arctic cloud amount plays a significant role in shaping Arctic climate system evolution. Given the stark evidence that the Arctic climate is changing more rapidly than the rest of the globe, an improved modeling capability in this highly varying, highly susceptible, and geopolitically important region is urgent. A better understanding of Arctic clouds is vital to providing this improved capability. This analysis advances our understanding of the factors that drive Arctic cloud behavior in climate models and points to unresolved issues in ice microphysics as the likely explanation. Thus, our results underscore the vital need for observational constraints on these critical processes.
Computer code used for the analysis was written in IDL and is available from the authors upon request.
The CMIP5 model data analyzed are deposited in the Earth System Grid Federation Peer-to-Peer enterprise system and are available at https://esgf-node.llnl.gov/projects/esgf-llnl/ (Taylor et al., 2012).
The supplement related to this article is available online at: https://doi.org/10.5194/acp-19-8759-2019-supplement.
PCT and RCB formulated the study and performed the analysis. PCT, RCM, YL, and DWJT synthesized the results and collectively wrote and edited the paper.
The authors declare that they have no conflict of interest.
The authors would like to thank Abhay Devasthale and an anonymous reviewer for the helpful comments. We acknowledge the World Climate Research Programme's Working Group on Coupled Modelling, which is responsible for CMIP. The U.S. Department of Energy's Program for Climate Model Diagnosis and Intercomparison provides coordinating support for CMIP and leads development of software infrastructure in partnership with the Global Organization for Earth System Science Portals.
This research has been supported by NASA (grant no. NNH16ZDA001N-NDOA).
This paper was edited by Radovan Krejci and reviewed by Abhay Devasthale and one anonymous referee.
Barton, N. P., Klein, S. A., Boyle, J. S., and Zhang, Y. Y.: Arctic synoptic regimes: Comparing domain-wide Arctic cloud observations with CAM4 and CAM5 during similar dynamics, J. Geophys. Res.-Atmos., 117, D15205, https://doi.org/10.1029/2012JD017589, 2012.
Beesley, J. A. and Moritz, R. E.: Toward an Explanation of the Annual Cycle of Cloudiness over the Arctic Ocean, J. Climate, 12, 395–415, https://doi.org/10.1175/1520-0442(1999)012<0395:TAEOTA>2.0.CO;2, 1999.
Boeke, R. C. and Taylor, P. C.: Evaluation of the Arctic surface radiation budget in CMIP5 models, J. Geophys. Res.-Atmos., 121, 2016JD025099, https://doi.org/10.1002/2016JD025099, 2016.
Boer, G., de Morrison, H., Shupe, M. D., and Hildner, R.: Evidence of liquid dependent ice nucleation in high-latitude stratiform clouds from surface remote sensors, Geophys. Res. Lett., 38, L01803, https://doi.org/10.1029/2010GL046016, 2011.
Cesana, G., Kay, J. E., Chepfer, H., English, J. M., and de Boer, G.: Ubiquitous low-level liquid-containing Arctic clouds: New observations and climate model constraints from CALIPSO-GOCCP, Geophys. Res. Lett., 39, L20804, https://doi.org/10.1029/2012GL053385, 2012.
Coopman, Q., Garrett, T. J., Finch, D. P., and Riedi, J.: High Sensitivity of Arctic Liquid Clouds to Long-Range Anthropogenic Aerosol Transport, Geophys. Res. Lett., 45, 372–381, https://doi.org/10.1002/2017GL075795, 2018.
Curry, J. A., Schramm, J. L., Rossow, W. B., and Randall, D.: Overview of Arctic Cloud and Radiation Characteristics, J. Climate, 9, 1731–1764, https://doi.org/10.1175/1520-0442(1996)009<1731:OOACAR>2.0.CO;2, 1996.
English, J. M., Kay, J. E., Gettelman, A., Liu, X., Wang, Y., Zhang, Y., and Chepfer, H.: Contributions of Clouds, Surface Albedos, and Mixed-Phase Ice Nucleation Schemes to Arctic Radiation Biases in CAM5, J. Climate, 27, 5174–5197, https://doi.org/10.1175/JCLI-D-13-00608.1, 2014.
English, J. M., Gettelman, A., and Henderson, G. R.: Arctic Radiative Fluxes: Present-Day Biases and Future Projections in CMIP5 Models, J. Climate, 28, 6019–6038, https://doi.org/10.1175/JCLI-D-14-00801.1, 2015.
Hahn, C. J., Warren, S. G., and London, J.: The Effect of Moonlight on Observation of Cloud Cover at Night, and Application to Cloud Climatology, J. Climate, 8, 1429–1446, https://doi.org/10.1175/1520-0442(1995)008<1429:TEOMOO>2.0.CO;2, 1995.
Huschke, R. E.: Arctic cloud statistics from “Air-Calibrated” surface weather observations, rand corp santa monica calif, available at: http://www.dtic.mil/docs/citations/AD0698740 (last access: 29 October 2018), 1969.
Jackson, R. C., McFarquhar, G. M., Korolev, A. V., Earle, M. E., Liu, P. S. K., Lawson, R. P., Brooks, S., Wolde, M., Laskin, A., and Freer, M.: The dependence of ice microphysics on aerosol concentration in arctic mixed-phase stratus clouds during ISDAC and M-PACE, J. Geophys. Res.-Atmos., 117, D15207, https://doi.org/10.1029/2012JD017668, 2012.
Karlsson, J. and Svensson, G.: The simulation of Arctic clouds and their influence on the winter surface temperature in present-day climate in the CMIP3 multi-model dataset, Clim. Dynam., 36, 623–635, https://doi.org/10.1007/s00382-010-0758-6, 2011.
Karlsson, J. and Svensson, G.: Consequences of poor representation of Arctic sea-ice albedo and cloud-radiation interactions in the CMIP5 model ensemble, Geophys. Res. Lett., 40, 4374–4379, https://doi.org/10.1002/grl.50768, 2013.
Kato, S., Sun-Mack, S., Miller, W. F., Rose, F. G., Chen, Y., Minnis, P., and Wielicki, B. A.: Relationships among cloud occurrence frequency, overlap, and effective thickness derived from CALIPSO and CloudSat merged cloud vertical profiles, J. Geophys. Res.-Atmos., 115, https://doi.org/10.1029/2009JD012277, 2010.
Kay, J. E. and Gettelman, A.: Cloud influence on and response to seasonal Arctic sea ice loss, J. Geophys. Res., 114, D18204, https://doi.org/10.1029/2009JD011773, 2009.
Kay, J. E. and L'Ecuyer, T.: Observational constraints on Arctic Ocean clouds and radiative fluxes during the early 21st century, J. Geophys. Res.-Atmos., 118, 7219–7236, https://doi.org/10.1002/jgrd.50489, 2013.
Kay, J. E., L'Ecuyer, T., Gettelman, A., Stephens, G., and O'Dell, C.: The contribution of cloud and radiation anomalies to the 2007 Arctic sea ice extent minimum, Geophys. Res. Lett., 35, L08503, https://doi.org/10.1029/2008GL033451, 2008.
Kay, J. E., L'Ecuyer, T., Chepfer, H., Loeb, N., Morrison, A., and Cesana, G.: Recent Advances in Arctic Cloud and Climate Research, Curr. Clim. Change Rep., 2, 159–169, https://doi.org/10.1007/s40641-016-0051-9, 2016.
Komurcu, M., Storelvmo, T., Tan, I., Lohmann, U., Yun, Y., Penner, J. E., Wang, Y., Liu, X., and Takemura, T.: Intercomparison of the cloud water phase among global climate models, J. Geophys. Res.-Atmos., 119, 3372–3400, https://doi.org/10.1002/2013JD021119, 2014.
Kretzschmar, J., Salzmann, M., Mülmenstädt, J., and Quaas, J.: Arctic cloud cover bias in ECHAM6 and its sensitivity to cloud microphysics and surface fluxes, Atmos. Chem. Phys. Discuss., https://doi.org/10.5194/acp-2018-1135, in review, 2018.
Li, Y., Thompson, D. W. J., Stephens, G. L., and Bony, S.: A global survey of the instantaneous linkages between cloud vertical structure and large-scale climate, J. Geophys. Res.-Atmos., 119, 3770–3792, https://doi.org/10.1002/2013JD020669, 2014a.
Li, Y., Thompson, D. W. J., Huang, Y., and Zhang, M.: Observed linkages between the northern annular mode/North Atlantic Oscillation, cloud incidence, and cloud radiative forcing, Geophys. Res. Lett., 41, 1681–1688, https://doi.org/10.1002/2013GL059113, 2014b.
Liu, Y. and Key, J. R.: Assessment of Arctic Cloud Cover Anomalies in Atmospheric Reanalysis Products Using Satellite Data, J. Climate, 29, 6065–6083, https://doi.org/10.1175/JCLI-D-15-0861.1, 2016.
Liu, Y., Key, J. R., Ackerman, S. A., Mace, G. G., and Zhang, Q.: Arctic cloud macrophysical characteristics from CloudSat and CALIPSO, Remote Sens. Environ., 124, 159–173, https://doi.org/10.1016/j.rse.2012.05.006, 2012.
Liu, Z. and Schweiger, A.: Synoptic Conditions, Clouds, and Sea Ice Melt Onset in the Beaufort and Chukchi Seasonal Ice Zone, J. Climate, 30, 6999–7016, https://doi.org/10.1175/JCLI-D-16-0887.1, 2017.
Liu, Y., Shupe, M. D., Wang, Z., and Mace, G.: Cloud vertical distribution from combined surface and space radar–lidar observations at two Arctic atmospheric observatories, Atmos. Chem. Phys., 17, 5973–5989, https://doi.org/10.5194/acp-17-5973-2017, 2017.
McCoy, D. T., Tan, I., Hartmann, D. L., Zelinka, M. D., and Storelvmo, T.: On the relationships among cloud cover, mixed-phase partitioning, and planetary albedo in GCMs, J. Adv. Model. Earth Sy., 8, 650–668, https://doi.org/10.1002/2015MS000589, 2016.
Minnis, P., Sun-Mack, S., Young, D. F., Heck, P. W., Garber, D. P., Chen, Y., Spangenberg, D. A., Arduini, R. F., Trepte, Q. Z., Smith, W. L., Ayers, J. K., Gibson, S. C., Miller, W. F., Hong, G., Chakrapani, V., Takano, Y., Liou, K., Xie, Y., and Yang, P.: CERES Edition-2 Cloud Property Retrievals Using TRMM VIRS and Terra and Aqua MODIS Data – Part I: Algorithms, IEEE T. Geosci. Remote, 49, 4374–4400, https://doi.org/10.1109/TGRS.2011.2144601, 2011.
Molod, A., Takacs, L., Suarez, M., and Bacmeister, J.: Development of the GEOS-5 atmospheric general circulation model: evolution from MERRA to MERRA2, Geosci. Model Dev., 8, 1339–1356, https://doi.org/10.5194/gmd-8-1339-2015, 2015.
Morrison, H., de Boer, G., Feingold, G., Harrington, J., Shupe, M. D., and Sulia, K.: Resilience of persistent Arctic mixed-phase clouds, Nat. Geosci., 5, 11–17, https://doi.org/10.1038/ngeo1332, 2012.
Morrison, A. L., Kay, J. E., Chepfer, H., Guzman, R., and Yettella, V.: Isolating the Liquid Cloud Response to Recent Arctic Sea Ice Variability Using Spaceborne Lidar Observations, J. Geophys. Res.-Atmos., 123, 473–490, https://doi.org/10.1002/2017JD027248, 2018.
Pavelsky, T. M., Boé, J., Hall, A., and Fetzer, E. J.: Atmospheric inversion strength over polar oceans in winter regulated by sea ice, Clim. Dynam., 36, 945–955, https://doi.org/10.1007/s00382-010-0756-8, 2011.
Persson, P. O. G., Fairall, C. W., Andreas, E. L., Guest, P. S., and Perovich, D. K.: Measurements near the Atmospheric Surface Flux Group tower at SHEBA: Near-surface conditions and surface energy budget, J. Geophys. Res., 107, 8045, https://doi.org/10.1029/2000JC000705, 2002.
Persson, P. O. G., Shupe, M. D., Perovich, D., and Solomon, A.: Linking atmospheric synoptic transport, cloud phase, surface energy fluxes, and sea-ice growth: observations of midwinter SHEBA conditions, Clim. Dynam., 49, 1341–1364, https://doi.org/10.1007/s00382-016-3383-1, 2017.
Pithan, F., Medeiros, B., and Mauritsen, T.: Mixed-phase clouds cause climate model biases in Arctic wintertime temperature inversions, Clim. Dynam., 43, 289–303, https://doi.org/10.1007/s00382-013-1964-9, 2014.
Shupe, M. D. and Intrieri, J. M.: Cloud Radiative Forcing of the Arctic Surface: The Influence of Cloud Properties, Surface Albedo, and Solar Zenith Angle, J. Climate, 17, 616–628, https://doi.org/10.1175/1520-0442(2004)017<0616:CRFOTA>2.0.CO;2, 2004.
Stephens, G. L., Vane, D. G., Tanelli, S., Im, E., Durden, S., Rokey, M., Reinke, D., Partain, P., Mace, G. G., Austin, R., L'Ecuyer, T., Haynes, J., Lebsock, M., Suzuki, K., Waliser, D., Wu, D., Kay, J., Gettelman, A., Wang, Z., and Marchand, R.: CloudSat mission: Performance and early science after the first year of operation, J. Geophys. Res.-Atmos., 113, D00A18, https://doi.org/10.1029/2008JD009982, 2008.
Tan, I. and Storelvmo, T.: Sensitivity Study on the Influence of Cloud Microphysical Parameters on Mixed-Phase Cloud Thermodynamic Phase Partitioning in CAM5, J. Atmos. Sci., 73, 709–728, https://doi.org/10.1175/JAS-D-15-0152.1, 2015.
Taylor, P. C.: Does a relationship between Arctic low clouds and sea ice matter?, in: AIP Conference Proceedings, Vol. 1810, American Institue of Physics, 4 pp., 2016.
Taylor, K. E., Stouffer, R. J., and Meehl, G. A.: An Overview of CMIP5 and the Experiment Design, B. Am. Meteorol. Soc., 93, 485–498, https://doi.org/10.1175/BAMS-D-11-00094.1, 2011.
Taylor, P. C., Kato, S., Xu, K.-M., and Cai, M.: Covariance between Arctic sea ice and clouds within atmospheric state regimes at the satellite footprint level, J. Geophys. Res.-Atmos., 120, 12656–12678, https://doi.org/10.1002/2015JD023520, 2015.
Taylor, P. C., Hegyi, B. M., Boeke, R. C., and Boisvert, L. N.: On the Increasing Importance of Air-Sea Exchanges in a Thawing Arctic: A Review, Atmosphere, 9, 41, https://doi.org/10.3390/atmos9020041, 2018.
Winker, D. M., Pelon, J., Coakley, J. A., Ackerman, S. A., Charlson, R. J., Colarco, P. R., Flamant, P., Fu, Q., Hoff, R. M., Kittaka, C., Kubar, T. L., Le Treut, H., Mccormick, M. P., Mégie, G., Poole, L., Powell, K., Trepte, C., Vaughan, M. A., and Wielicki, B. A.: The CALIPSO Mission, B. Am. Meteorol. Soc., 91, 1211–1230, https://doi.org/10.1175/2010BAMS3009.1, 2010.


