the Creative Commons Attribution 4.0 License.
the Creative Commons Attribution 4.0 License.
Effects of Arctic stratospheric ozone changes on spring precipitation in the northwestern United States
Xuan Ma
Fei Xie
Jianping Li
Xinlong Zheng
Wenshou Tian
Ruiqiang Ding
Cheng Sun
Jiankai Zhang
Using observations and reanalysis, we find that changes in April precipitation variations in the northwestern US are strongly linked to March Arctic stratospheric ozone (ASO). An increase in ASO can result in enhanced westerlies in the high and low latitudes of the North Pacific but weakened westerlies in the midlatitudes. The anomalous circulation over the North Pacific can extend eastward to western North America, decreasing the water vapor concentration in the air over the northwestern United States and enhancing downwelling in the northwestern US, which results in decreased precipitation there and vice versa for the decrease in ASO. Model simulations using the Whole Atmosphere Community Climate Model version 4 (WACCM4) support the statistical analysis of observations and reanalysis data and further reveal that the ASO influences circulation anomalies over the northwestern US in two ways. Stratospheric circulation anomalies caused by the ASO changes can propagate downward to the troposphere in the North Pacific and then eastward to influence the strength of the circulation anomalies over the northwestern US. In addition, sea surface temperature anomalies over the North Pacific, which may be related to the ASO changes, would cooperate with the ASO changes to modify the circulation anomalies over the northwestern US. Our results suggest that ASO variations could be a useful predictor of spring precipitation changes in the northwestern US.
- Article
(4991 KB) - Full-text XML
- BibTeX
- EndNote
Stratospheric circulation anomalies can affect tropospheric climate via chemical–radiative–dynamical feedback processes (Baldwin and Dunkerton, 2001; Graf and Walter, 2005; Cagnazzo and Manzini, 2009; Ineson and Scaife, 2009; Thompson et al., 2011; Reichler et al., 2012; Karpechko et al., 2014; Kidston et al., 2015; Li et al., 2016; Zhang et al., 2016; Wang et al., 2017). Since stratospheric ozone can influence stratospheric temperature and circulation via the atmospheric radiation balance (Tung, 1986; Haigh, 1994; Ramaswamy et al., 1996; Forster and Shine, 1997; Pawson and Naujokat, 1999; Solomon, 1999; Randel and Wu, 1999, 2007; Labitzke and Naujokat, 2000; Gabriel et al., 2007; Gillett et al., 2009; McCormack et al., 2011), the impact of ozone on tropospheric climate change has recently received widespread attention (e.g., Nowack et al., 2015, 2017, 2018).
In recent decades, Antarctic stratospheric ozone has decreased dramatically due to the increase in anthropogenic emissions of ozone-depleting substances (Solomon, 1990, 1999; Ravishankara et al., 1994, 2009). Numerous studies have found that the decreased Antarctic ozone has contributed substantially to climate change in the Southern Hemisphere. The Southern Hemisphere circulation underwent a marked change during the late 20th century, with a slight poleward shift of the westerly jet (Thompson and Solomon, 2002; Archer and Caldeira, 2008). The poleward circulation shift would cause surface temperature anomalies by affecting localized wind patterns and associated thermal advection (Son et al., 2010; Thompson et al., 2011; Feldstein, 2011). Subsequent studies concluded that Antarctic ozone depletion is responsible for at least 50 % of the circulation shift (Lu et al., 2009; Son et al., 2010; McLandress et al., 2011; Polvani et al., 2011; Hu et al., 2013; Gerber and Son, 2014; Waugh et al., 2015). In addition, the poleward displacement of the westerly jet has been linked to an extension of the Hadley cell (Son et al., 2009, 2010; Min and Son, 2013) and variations in mid- to high-latitude precipitation during austral summer, i.e., increased rainfall in the subtropics and high latitudes and reduced rainfall in the midlatitudes of the Southern Hemisphere (Son et al., 2009; Feldstein, 2011; Kang et al., 2011; Polvani et al., 2011). The changes in Antarctic ozone are not only related to the displacement of the westerly jet in the Southern Hemisphere but also affect its intensity. Thompson and Solomon (2002) argued that Antarctic ozone depletion can also enhance westerly winds via the strong radiative cooling effect and thermal wind relationship. The westerly winds are enhanced from the stratosphere to the midlatitude troposphere in the case of wave–mean flow interaction (Son et al., 2010; Thompson et al., 2011), thereby accelerating circumpolar currents in the midlatitudes. Moreover, changes in subtropical drought, storm tracks and ocean circulation in the Southern Hemisphere are also closely related to Antarctic ozone variations (Yin, 2005; Russell et al., 2006; Son et al., 2009; Polvani et al., 2011; Bitz and Polvani, 2012).
The variations in Arctic stratospheric ozone (ASO) in the past 5 decades are quite different from those of Antarctic stratospheric ozone, as the multi-decadal loss of ASO is much smaller than that of Antarctic stratospheric ozone (WMO, 2011). However, sudden stratospheric warming in the Arctic (Randel, 1988; Charlton and Polvani, 2007; Manney et al., 2011; Manney and Lawrence, 2016) means that the year-to-year variability in ASO has an amplitude equal to or even larger than that of Antarctic stratospheric ozone. Thus, the effect of ASO on Northern Hemisphere climate change has also become a matter of concern.
Similar to the effects of winter stratospheric dynamical processes on the tropospheric North Atlantic Oscillation and the incidence of extreme weather events (Baldwin and Dunkerton, 2001; Black et al., 2005, 2006, 2009), the depletion of spring ASO can cause circulation anomalies that influence the tropospheric North Atlantic and North Pacific sectors. Cheung et al. (2014) used the UK Met Office operational weather forecasting system, and Karpechko et al. (2014) used ECHAM5 simulations to investigate the relationship between extreme Arctic ozone anomalies in 2011 and tropospheric climate. Smith and Polvani (2014) used an atmospheric global climate model to reveal a significant influence of ASO changes on tropospheric circulation, surface temperature and precipitation when the amplitudes of the forcing ASO anomaly in the model are larger than those historically observed. Subsequently, using a fully coupled chemistry–climate model, Calvo et al. (2015) again confirmed that changes in ASO can produce robust anomalies in Northern Hemisphere temperature, wind and precipitation. Furthermore, the effects of ASO on the Northern Hemisphere climate can be seen in observations. Ivy et al. (2017) presented observational evidence for the relationship between ASO and tropospheric climate, revealing that the maximum daily surface temperature anomalies in spring (March–April) in some regions of the Northern Hemisphere occurred during years with low ASO in March. Xie et al. (2016, 2017a, b) demonstrated that the tropical climate can also be affected by ASO. They pointed out that stratospheric circulation anomalies caused by March ASO changes can rapidly extend to the lower troposphere and then propagate horizontally to the North Pacific in about 1 month, influencing the North Pacific sea surface temperature (SST) in April. The induced SST anomalies (Victoria Mode) associated with the circulation anomalies can influence El Niño–Southern Oscillation (ENSO) and tropical rainfall over a timescale of ∼20 months.
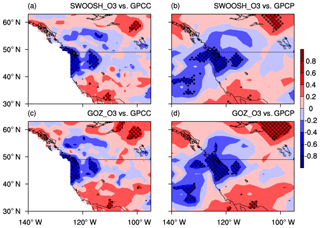
Figure 1Correlation coefficients between March ASO and April precipitation variations calculated from SWOOSH (a, b) and GOZCARDS (c, d) ozone, and GPCC (a, c) and GPCP (b, d) rainfall for the period 1984–2016. Dots denote significance at the 95 % confidence level, according to Student's t test. The long-term linear trend and seasonal cycle in all variables were removed before the correlation analysis.
Table 1The Community Earth System Model (CESM) WACCM4 experiments with various specified ozone and SST forcing.
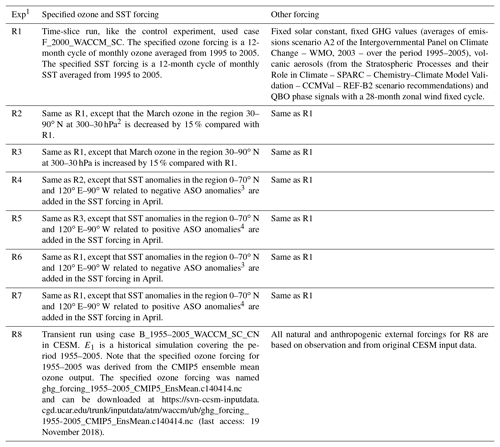
1 Integration time for time-slice runs is 33 years and is 51 years for transient run. 2 To avoid the effect of the boundary of ozone change on the Arctic stratospheric circulation simulation, the replaced region (30–90∘ N, 300–30 hPa) was larger than the region used to define the ASO index (60–90∘ N, 100–50 hPa). 3 For SST anomalies, see Fig. 9a. 4 For SST anomalies, see Fig. 9b.
As shown above, a large number of observations and simulations have shown that ASO variations have a significant impact on Northern Hemisphere tropospheric climate, but few studies have focused on regional characteristics. Xie et al. (2018) found that the ASO variations could significantly influence rainfall in the central China, since the circulation anomalies over the North Pacific caused by ASO variations can extend westward to China. This motivates us to investigate whether the circulation anomalies extend eastward to affect the precipitation in North America. In this study, we find a strong link between ASO and precipitation in the northwestern US in spring. We focus on analyzing the characteristics of the impact of ASO on precipitation in the northwestern US in spring and the associated mechanisms. The remainder of this paper is organized as follows. Section 2 describes the data and numerical simulations, and Sect. 3 discusses the relationship between the ASO anomalies and precipitation variations in the northwestern US, as well as the underlying mechanisms. The results of simulations are presented in Sect. 4, and conclusions are given in Sect. 5.
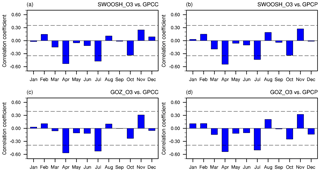
Figure 2(a) Correlation coefficients between March ASO index and precipitation anomalies in the northwestern US (43–50∘ N, 115–130∘ W) for each month calculated from SWOOSH (a, b) and GOZCARDS (c, d) ozone, and GPCC (a, c) and GPCP (b, d) rainfall for the period 1984–2016. The dashed black lines refer to the correlation coefficient that is significance at 95 % confidence level. The long-term linear trend and seasonal cycle were removed from the original datasets before calculating the correlation coefficients.
The ASO variations are defined as the Arctic stratospheric ozone averaged over the latitude of 60–90∘ N at an altitude of 100–50 hPa after removing the seasonal cycle and trend. Ozone values used in the present analysis are derived from the Stratospheric Water and OzOne Satellite Homogenized (SWOOSH) dataset (Davis et al., 2016), which is a collection of stratospheric ozone and water vapor measurements obtained by multiple limb-sounding and solar-occultation satellites over the previous 30 years. Monthly mean ozone data from SWOOSH (1984–2016) form a zonal-mean gridded dataset at a horizontal resolution of 2.5∘ (latitude: 89∘ S to 89∘ N) and vertical pressure range of 31 levels from 316 to 1 hPa. Another set of ozone data is taken from Global OZone Chemistry And Related trace gas data records for the Stratosphere (GOZCARDS, 1984–2013) project (Froidevaux et al., 2015), based on high-quality data from past missions (e.g., the Stratospheric Aerosol and Gas Experiment – SAGE – and the Halogen Occultation Experiment – HALOE – data) and ongoing missions (ACE-FTS and Aura MLS). It is also a zonal-mean dataset with a meridional resolution of 10∘, extending from the surface to 0.1 hPa (25 levels).
In addition, two sets of global precipitation reanalysis datasets are employed in this study: monthly mean precipitation data constructed by the Global Precipitation Climatology Project (GPCP), which is established by the World Climate Research program (WCRP) in 1986 aiming to observe and estimate the spatial and temporal global precipitation (Huffman et al., 1997), with a latitude and longitude grid with a resolution of 2.5∘ for the analysis period 1984–2016; global terrestrial rainfall dataset derived from the Global Precipitation Climatology Centre (GPCC) based on quality-controlled data from 67 200 stations worldwide, with a resolution of 1.0∘ latitude/longitude grid. In addition, SST is taken from the UK Met Office Hadley Centre for Climate Prediction and Research SST (HadSST; Rayner et al., 2003). Other atmospheric datasets including monthly mean wind and vertical velocity fields for the period 1984–2016 are obtained from the NCEP – Department of Energy (DOE) Reanalysis 2 (NCEP-2) project, regarded as an updated NCEP and National Center for Atmospheric Research's (NCAR) Reanalysis Project (NCEP-1).
We use the Whole Atmosphere Community Climate Model version 4 (WACCM4), a part of the National Center for Atmospheric Research (NCAR) Community Earth System Model (CESM), version 1.0.6, to investigate precipitation response in the northwestern United States to the ASO anomalies. WACCM4 encompasses the Community Atmospheric Model version 4 (CAM4) and as such includes all of its physical parameterizations (Neale et al., 2013). It uses a system made up of four components, namely atmosphere, ocean (specified SST), land and sea ice (Holland et al., 2012) and has detailed mid-atmosphere chemistry. This improved version of WACCM uses a finite-volume dynamical core, and it extends from the surface to an approximately 145 km geometric altitude (66 levels), with a vertical resolution of about 1 km in the tropical tropopause layer and the lower stratosphere. Note that the simulations in the present paper are without interactive chemistry like the WACCM4 greenhouse-gas (GHG) scheme (WACCM4-GHG; Garcia et al., 2007), with a 1.9∘ × 2.5∘ horizontal resolution. In the WACCM4-GHG, the chemistry is specified in this scheme, i.e., the volume mixing ratios of forcings such as O3, CO2, CH4, N2O, CFC11 and CFC12 are prescribed in WACCM4-GHG (Marsh et al., 2013). The model's radiation scheme uses these conditions: fixed GHG values (averages of emissions scenario A2 of the Intergovernmental Panel on Climate Change – WMO, 2003 – over the period 1995–2005). The prescribed ozone forcing used in the experiments is a 12–month seasonal cycle averaged over the period 1995–2005 from CMIP5 ensemble mean ozone output. The quasi-biennial oscillation (QBO) phase signals with a 28–month fixed cycle are included in WACCM4 as an external forcing for zonal wind.
Seven time-slice experiments (R1–R7) and a transient experiment with specified ozone (R8) are designed to investigate the precipitation changes in the northwestern US due to the ASO anomalies. Details of the eight experiments are given in Table 1. Seven time-slice experiments (R1–R7) are run for 33 years, with the first 3 years excluded for the model spin-up, and only the last 30 years are used. The transient experiment (R8) is run for 51 years.
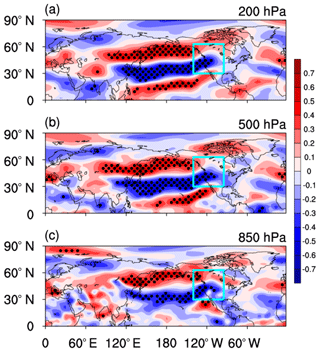
Figure 3Correlation coefficients between March ASO index and April zonal wind variations (m s−1; from NCEP-2) from 1984 to 2016 at 200 hPa (a), 500 hPa (b) and 850 hPa (c). Dots denote significance at the 95 % confidence level, according to Student's t test. Blue square is the area shown in Fig. 1. Before performing the analysis, the seasonal cycle and linear trend were removed from the original datasets.
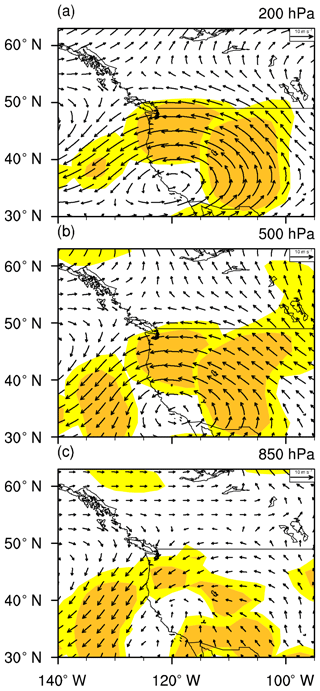
Figure 4Differences in composite April winds (vectors, m s−1; from NCEP-2) between positive and negative ASO anomaly events at 200 hPa (a), 500 hPa (b) and 850 hPa (c) for 1984–2016. Colored regions are statistically significant at the 90 % (light yellow) and 95 % (dark yellow) confidence levels. The seasonal cycle and linear trend were removed from the original dataset. The ASO anomaly events are selected based on Table 2.
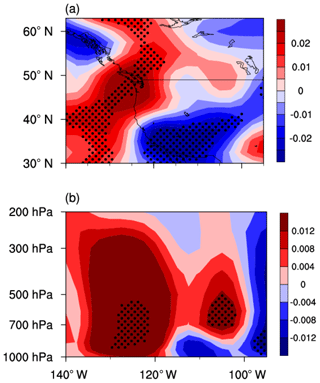
Figure 5(a) Longitude–latitude cross section of differences in composite April vertical velocity anomalies (averaged over 1000–500 hPa) between positive and negative ASO anomaly events for 1984–2016. (b) Longitude–height cross section of differences in composite April vertical velocity anomalies (averaged over 43–50∘ N) between positive and negative ASO anomaly events from 1984 to 2016. Blue is upward motion, and red is downward motion. Dots denote significance at the 95 % confidence level. Before performing the analysis, the seasonal cycle and linear trend were removed from the original dataset. The ASO anomaly events are selected based on Table 2. The vertical velocity (Pa s−1) dataset is from NCEP-2.
Since the variations in ASO are most obvious in March due to the Arctic polar vortex breakdown (Manney et al., 2011), previous studies have reported that the ASO changes in March have the strongest influence on the Northern Hemisphere (Ivy et al., 2017; Xie et al., 2017a). In addition, these studies pointed out that the changes in ASO affect the tropospheric climate with a lead of about 1–2 months, which is similar to the troposphere response to the Northern Hemisphere sudden stratospheric warmings (Baldwin and Dunkerton, 2001; Black et al., 2005, 2006, 2009) and Southern Hemisphere stratospheric ozone depletion (Thompson and Solomon 2002); the relevant mechanisms have been investigated in detail by Xie et al. (2017a). In Fig. 1, we therefore show the correlation coefficients between ASO variations in March from SWOOSH and GOZCARDS data and precipitation anomalies in April from GPCC and GPCP data over western North America. In all cases in Fig. 1, the March ASO changes are significantly anticorrelated with April precipitation anomalies in the northwestern US (mainly in Washington and Oregon), implying that positive spring ASO anomalies are associated with less spring precipitation in the northwestern US and vice versa for the negative spring ASO anomalies. Note that since this kind of feature appears in the northwestern US, Fig. 1 shows only the western side of North America.
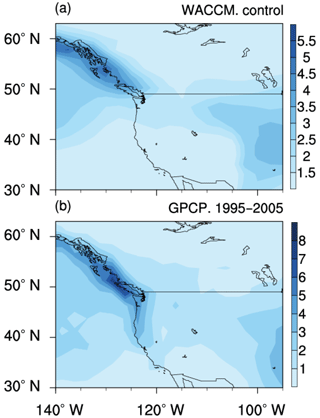
Figure 6(a) Spatial distribution of April precipitation (mm day−1) climatology in the control experiment (R1). (b) Same as (a), but precipitation from the GPCP for the period 1995–2005. For details of specific experiments, see Table 1.
The correlation coefficients between March ASO variations and precipitation anomalies (January to December are in the same year) in the northwestern US are shown in Fig. 2. The correlation coefficients between March ASO variations and April precipitation anomalies in the northwestern US are the largest and are significant at the 95 % confidence level. Note that the correlation coefficients between March ASO variations and July precipitation anomalies are also significant. The impact of March ASO on precipitation in the northwestern US in summer and the associated mechanisms are different from those considered in this study (not shown) and will be presented in another paper but will not be investigated further here. March ASO changes are not significantly correlated with simultaneous (March) precipitation variations (Fig. 2), illustrating that the ASO changes lead precipitation anomalies by about 1 month. Since the results from four sets of observations show a common feature, and SWOOSH and GPCP data span a longer period, only SWOOSH ozone and GPCP precipitation are used in the following analysis.
The above statistical analysis shows a strong negative correlation between March ASO variations and April precipitation anomalies in the northwestern US, meaning that the ASO can be used to predict changes in spring precipitation in the northwestern US. The process and underlying mechanism that are responsible for the impact of ASO anomalies on precipitation changes need further analysis.
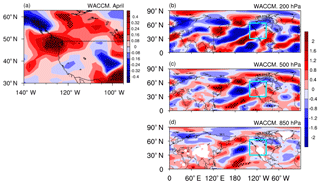
Figure 7Differences between experiments R3 and R2 in terms of April (a) precipitation (mm day−1) and (b–d) zonal wind at 200, 500 and 850 hPa, respectively. Dots denote significance at the 95 % confidence level.
Figure 3 shows the correlation coefficients between March ASO anomalies and April zonal wind variations at 200, 500 and 850 hPa, respectively. The spatial distribution of significant correlation coefficients over the North Pacific exhibits a tripolar mode with a zonal distribution at 200 and 500 hPa; i.e. a positive correlation in the high and low latitudes in the North Pacific and a negative correlation in midlatitudes. This implies that the increase in ASO can result in enhanced westerlies in the high and low latitudes of the North Pacific but weakened westerlies in the midlatitudes, corresponding to the weakened Aleutian Low in April and vice versa for the decrease in ASO. The Aleutian Low acts as a bridge connecting variations in ASO and circulation anomalies over the North Pacific (Xie et al., 2017a). At 850 hPa, the anomalous circulation signal in the low latitudes of the North Pacific has weakened and disappeared. It is evident that the anomalous changes in the zonal wind over the North Pacific can extend westward to East Asia. Xie et al. (2018) identified the effect of spring ASO changes on spring precipitation in China. Note that the weakened westerlies in the midlatitudes and the enhanced westerlies at low latitudes can also extend eastward to the western United States. This kind of circulation anomaly corresponds to two barotropic structures, i.e., an anomalous anticyclone in the Northeast Pacific and a cyclone in the southwestern United States at 500 and 200 hPa. Coincidentally, the northwestern United States is located to the north of the intersection of the anticyclone and cyclone, corresponding to convergence of the airflow at high levels, which may lead to downwelling in the northwestern United States and vice versa for negative March ASO anomalies.
To further validate our inference regarding the response of the circulation in the western United States to ASO changes, we analyze the differences between April horizontal wind anomalies during positive and negative March ASO anomaly events at 200, 500 and 850 hPa (Fig. 4). As in the increased ASO case, the difference shows an anomalous anticyclone in the Northeast Pacific and an anomalous cyclone in the southwestern United States. The climatological wind over the northwestern United States blows from west to east, bringing moisture from the Pacific to the western United States. Such circulation anomalies force an anomalous cyclone in the western United States in the middle and upper troposphere, which reduces the climatological wind. It would decrease the water vapor concentration in the air over the northwestern United States. In addition, the northwestern United States is located to the north of the intersection of the anticyclone and cyclone, suggesting downwelling flow in the region.
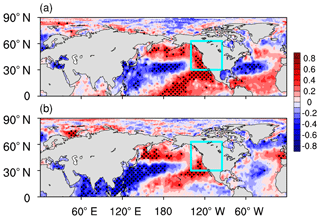
Figure 8(a) Correlation coefficients between regional precipitation (43–50∘ N, 115–130∘ W) and SST variations in April for 1984–2016. (b) Correlation coefficients between March ASO (ASO multiplied by −1) and April SST variations for 1984–2016. Dots denote significance at the 95 % confidence level, according to Student's t test. Before performing the analysis, the seasonal cycle and linear trend were removed from the original data. ASO data are from SWOOSH, precipitation from GPCP and SST from HadSST.
Figure 5a shows a longitude–latitude cross section of differences in April vertical velocity anomalies averaged over 1000–500 hPa between positive and negative March ASO anomaly events. When the March ASO increases, anomalous downwelling is found in the northwestern United States (115–130∘ W). This situation may inhibit precipitation in the northwestern United States in April. Figure 5b depicts the longitude–height cross section of differences in April vertical velocity averaged over 43–50∘ N between positive and negative March ASO anomaly events, which further shows an anomalous downwelling over the northwestern United States when the ASO increases. Based on the above analysis, the circulation anomalies in the northwestern United States associated with positive March ASO anomalies may inhibit the formation of local precipitation in April and vice versa for that with negative March ASO anomalies.
Using observations and reanalysis data, we investigated the relationship between March ASO and April precipitation in the northwestern US and revealed the underlying mechanisms in Sect. 3. In this section, we use WACCM4 simulations (see Sect. 2) to confirm the above conclusions. First, we check the model performance in simulating precipitation over western North America. Figure 6 shows the April precipitation climatology over the region 95–140∘ W, 30–63∘ N from the control experiment R1 (Table 1) and from GPCP for the period 1995–2005. The model simulates a center of high precipitation over the West Coast of North America (Fig. 6a). It is clear that the spatial distribution of the simulated precipitation climatology is similar to that calculated by GPCP (Fig. 6b).
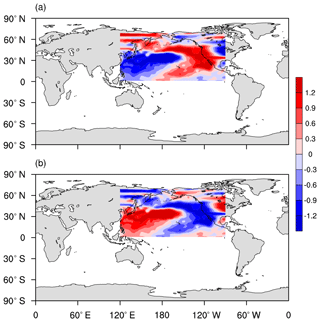
Figure 9(a) Composite SST anomalies during negative ASO anomaly events. (b) Composite SST anomalies during positive ASO anomaly events. The ASO anomaly events are selected based on Table 2. SST data are from CESM SST forcing data.
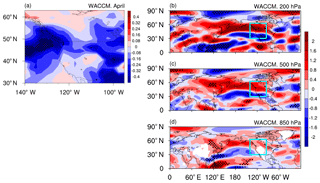
Figure 7a displays the differences in April precipitation between experiments R3 and R2. The pattern of simulated April precipitation anomalies forced by ASO changes in western North America (Fig. 7a) is different from that observed (Fig. 1), i.e., the increased March ASO forces an increase in precipitation in the northwestern United States. The differences in April zonal wind at 200, 500 and 850 hPa between experiments R3 and R2 are shown in Fig. 7b, c and d, respectively. The simulated pattern of April zonal wind anomalies in western North America (Fig. 7b, c and d) shifted a little further to the north than in the observations (Fig. 3). Comparing the global pattern of simulated April zonal wind anomalies with the observations, it is surprising to find that the positions of simulated zonal wind anomalies over the Northeast Pacific and western North America are shifted northward. This results in the simulated precipitation anomalies over western North America also shifting northward so that a decrease in precipitation on the western coast of Canada in April is found in Fig. 7a. This explains why we find that the pattern of simulated April precipitation anomalies in the North America (Fig. 7a) is nearly opposite to that observed (Fig. 1). Figure 7 shows that the results of the model simulation in which we only change the ASO forcing do not reflect the real situation of April precipitation anomalies in the northwestern United States, with a shift in position compared with observations. This leads us to consider whether other factors interact with March ozone to influence April precipitation in the northwestern United States.
Previous studies have found that the North Pacific SST has a significant effect on precipitation in the United States (e.g., Namias, 1983; Ting and Wang, 1997; Wang and Ting, 2000; Barlow et al., 2001; Lau et al., 2002; Wang et al., 2014). Figure 8a shows the correlation coefficients between regional averaged (43–50∘ N, 115–130∘ W) precipitation anomalies and SST variations in April. Interestingly, the results show that the distribution of correlation coefficients over the North Pacific has a meridional tripole structure, which is referred to as the Victoria-mode SST anomaly pattern. Xie et al. (2017a) demonstrated that the ASO has a lagged impact on the sea surface temperature in the North Pacific mid-to-high latitudes based on observation and simulation. They showed that stratospheric circulation anomalies caused by ASO changes can rapidly extend to the lower troposphere in the high latitudes of the Northern Hemisphere. The circulation anomalies in the high latitudes of the lower troposphere take about a month to propagate to the North Pacific midlatitudes and then influence the North Pacific SST. Figure 8b shows the correlation coefficients between March ASO (multiplied by −1) and April SST variations. The pattern in Fig. 8b is in good agreement with that in Fig. 8a. It is further found that removing the Victoria-mode signal from the time series of precipitation in the northwestern United States reduces the correlation coefficient between March ASO anomalies and filtered April precipitation variations in the northwestern United States to −0.40 (the correlation coefficient is −0.55 for the original time series; see Fig. 2), but it remains significant. Figure 8 indicates that the ASO possibly influences precipitation anomalies in the northwestern United States in two ways. First, the stratospheric circulation anomalies caused by the ASO changes can propagate downward to the North Pacific troposphere and eastward to influence precipitation over northwestern United States. Second, the ASO changes generate SST anomalies over the North Pacific that act as a bridge for ASO to affect precipitation in the northwestern United States (Xie et al., 2017a). The SST anomalies caused by ASO change likely interact with the direct changes in atmospheric circulation driven by the ASO change to jointly influence precipitation in the northwestern United States. Experiments R2 and R3 do not include the effects of SST, which may explain why the results of the model simulation in which we only change the ASO forcing do not reflect the observed precipitation anomalies in the northwestern United States (Fig. 7).
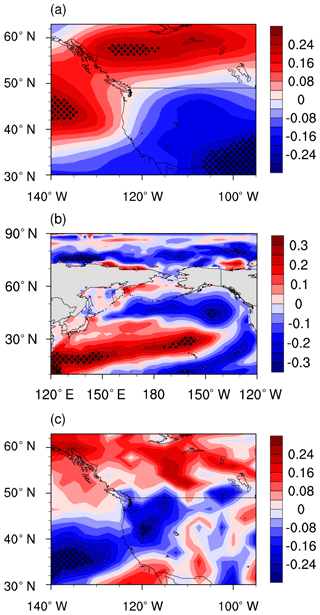
Figure 12Correlation coefficients between the specified March ASO variations and simulated anomalies of April U (a), SST (b) and precipitation (c) for the period 1955–2005, based on the transient experiment R8. Regions above the 95 % confidence level are dotted. The seasonal cycle and linear trend were removed from all quantities before correlation.
Table 2Selected positive and negative years for March ASO anomaly events based on SWOOSH data for the period 1984–2016. Positive and negative March ASO anomaly events are defined using a normalized time series of March ASO variations from 1984 to 2016. Values larger than 1 standard deviation are defined as positive March ASO anomaly events, and those below −1 standard deviation are defined as negative March ASO anomaly events.

Two sets of experiments (R4 and R5) that include the joint effects of ASO and SST changes (Fig. 9) are added. Details of the experiments are given in Table 1. Figure 10 shows the differences in April precipitation and zonal wind between experiments R5 and R4. It is clear that the simulated changes in precipitation in the northwestern United States (Fig. 10a) are in good agreement with the observed anomalies shown in Fig. 1, i.e., the increase in March ASO forces a decrease in April precipitation in the northwestern United States. In addition, the spatial distributions of simulated zonal wind anomalies (Fig. 10b–d) are consistent with the observations (Fig. 3). Overall, the simulated precipitation and circulation in R4 and R5 are no longer shifted northward and are closer to the observations.
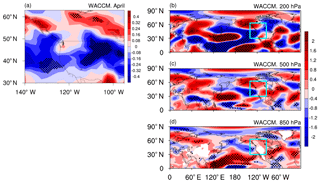
To further emphasize the importance of the joint effects of ASO and ASO-related SST anomalies on precipitation in the northwestern United States, we investigate whether the spring Victoria-mode-like SST anomalies alone could force the observed precipitation anomalies in the northwestern United States. Two sets of experiments are performed here (R6 and R7), in which only April SST anomalies over the North Pacific have been changed (Fig. 9). Details of the experiments are given in Table 1. Figure 11 shows the differences in April precipitation and zonal wind between experiments R7 and R6. The simulated precipitation anomalies over the West Coast of the United States (Fig. 11a) are much weaker, and the simulated circulation anomalies (Fig. 11b–d) are quite different from those in Fig. 3. This suggests that the ASO-related North Pacific SST anomalies alone cannot force the observed precipitation anomalies in the northwestern United States but that the combined effect of ASO and ASO-related North Pacific SST anomalies is required (Fig. 10).
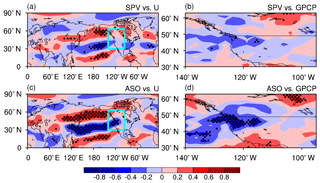
Figure 13(a) Correlation coefficients between the index of February SPV multiplied by −1 (105 K m2 kg−1 s−1) defined by Zhang et al. (2018) and April zonal wind variations at 200 hPa for 1984–2016. (b) Correlation coefficients between the index of February SPV multiplied by −1 and April precipitation variations. In (c) and (d), it is the same as for (a) and (b) but between March ASO and April 200 hPa zonal wind and April precipitation variations. Dots denote significance at the 95 % confidence level, according to the Student's t test. The long-term linear trend and seasonal cycle in all variables were removed before the correlation analysis. The ASO data are from SWOOSH, zonal wind from NCEP-2 and precipitation from GPCP.
In order to further confirm the possible influence of ASO on precipitation in the northwestern United States, a transient experiment (1955–2005) based on the atmosphere–ocean coupled WACCM4 model is added to confirm whether the ASO can cause the Victoria-mode SST in the North Pacific and rainfall anomalies in the northwestern United States by itself. Note that the ozone forcing in the experiment is specified, which is derived from the CMIP5 ensemble mean ozone output. Please refer to R8 in Table 1 for a detailed description of the experiment. Figure 12 shows the correlation coefficients between the specified March ASO variations and simulated April zonal wind (U) at 500 hPa, SST and precipitation anomalies for the period 1955–2005. The significant and leading effects of the specified ASO anomalies on 500 hPa U, the Victoria mode in the North Pacific and rainfall anomalies in the northwestern United States are well captured (Fig. 12). As the ozone forcing in the experiment is specified, the relationships between ASO and U and SST and precipitation could only be caused by ASO influencing U and then U influencing SST and precipitation; the ASO changes are completely independent of polar vortex. The leading relationship between ASO and precipitation in the northwestern United States can be found in observations, time-slice experiments (R1–7) and a transient experiment with specified ozone (R8). Thus, we have shown that the relationship between March ASO and April precipitation in the northwestern US in the observations and the underlying mechanisms can be verified by WACCM4.
Many observations and simulations have shown that ASO variations have a significant impact on Northern Hemisphere tropospheric climate, but few studies have focused on regional characteristics. Using observations, reanalysis datasets and WACCM4, we have shown that the March ASO changes have a significant effect on April precipitation in the northwestern United States (mainly in Washington and Oregon), with a lead of 1–2 months. When the March ASO is anomalously high, April precipitation decreases in the northwestern United States and vice versa for low ASO.
During positive ASO events, the zonal wind changes over the North Pacific exhibit a tripolar mode with a zonal distribution, i.e., enhanced westerlies in the high and low latitudes of the North Pacific and weakened westerlies in the midlatitudes. The anomalous wind can extend eastward to North America, causing anomalous circulation in western North America. The climatological wind over the northwestern United States blows from west to east, bringing moisture from the Pacific to the western United States. Such circulation anomalies force an anomalous cyclone in the western United States in the middle and upper troposphere, which reduces the climatological wind. It would decrease the water vapor concentration in the air over the northwestern United States. At the same time, downwelling in the northwestern US is enhanced. The two processes possibly decrease April precipitation in the northwestern US. When the March ASO decreases, the effect is just the opposite.
The WACCM4 model is used to confirm the statistical results of observations and the reanalysis data. The results of the model simulation in which we only change the ASO forcing do not reflect the observed precipitation anomalies in the northwestern United States in April, i.e., the pattern of simulated April precipitation and circulation anomalies in the western North America shifted a little further to the north than observed. It is found that SST anomalies over North Pacific caused by ASO changes are likely to interact with ASO changes to jointly influence precipitation in the northwestern United States. Thus, the ASO influences precipitation anomalies over the northwestern United States in two ways. First, the stratospheric circulation anomalies caused by the ASO change can propagate downward to the North Pacific troposphere and directly influence precipitation over the northwestern United States. Second, the ASO changes generate SST anomalies over the North Pacific that act as a bridge (Xie et al., 2017a), allowing the ASO changes to affect precipitation in the northwestern United States.
It is well known that the spring ASO variations are related to changes in the winter Arctic stratospheric vortex (SPV). The strength of the winter SPV can affect spring ASO, and then the ASO affects tropospheric teleconnection and precipitation in the northwestern United States (indirect effect of the SPV). The strength of the winter SPV may also have a direct leading effect on tropospheric teleconnection (Baldwin and Dunkerton, 2001; Black et al., 2005, 2006, 2009) and precipitation in the northwestern United States in spring. A question arises here: can the stratospheric polar vortex variability in late winter be a better factor for leading spring precipitation variations in the northwestern United States than the spring ASO anomalies? Figure 13 shows the correlation coefficients between the February SPV (multiplied by −1) index and April 200 hPa zonal wind and precipitation variations (Fig. 13a and b) and between March ASO and April 200 hPa zonal wind and precipitation (Fig. 13c and d). The SPV index is defined as the strength of the stratospheric polar vortex, following Zhang et al. (2018). It is found that the relationship between the strength of February SPV and the variations in 200 hPa zonal wind and precipitation is significant (Fig. 13a and b), indicating indirect or direct effects of winter SPV on spring tropospheric climate. However, the relationship is not stronger than that between March ASO and April 200 hPa zonal wind and precipitation (Fig. 13c and d). In this study, we try to state that the ASO changes could influence precipitation in the northwestern United States, emphasizing the influence of stratospheric ozone on tropospheric regional climate. As for the effect of coupling between dynamical and radiative processes in spring on precipitation, this is an interesting question that deserves further investigation.
The SWOOSH ozone dataset is available at https://www.esrl.noaa.gov/csd/groups/csd8/swoosh/ (last access: 25 April 2018; Davis et al., 2016). The GOZCARDS ozone dataset is available at https://disc.gsfc.nasa.gov/datasets/GozSmlpO3_V1/summary?keywords=gozcards (last access: 18 January 2019; Froidevaux et al., 2015). The precipitation dataset from GPCC can be obtained via the website https://climatedataguide.ucar.edu/climate-data/gpcc-global-precipitation-climatology-centre (last access: 18 January 2019; Schneider et al., 2008) and that from GPCP is available at http://gpcp.umd.edu/ (last access: 18 January 2019; Adler et al., 2003). The CESM can be downloaded at http://www.cesm.ucar.edu/models/current.html (last access: 18 January 2019; Garcia et al., 2007).
XM and FX designed the study and contributed to data analysis, interpretation and paper writing. JL and XZ contributed to the discussion and interpretation of the paper. WT, RD, CS and JZ contributed to paper writing. All authors reviewed the paper.
The authors declare that they have no conflict of interest.
This article is part of the special issue “The Polar Stratosphere in a Changing Climate (POLSTRACC) (ACP/AMT inter-journal SI)”. It is not associated with a conference.
Funding for this project was provided by the National
Natural Science Foundation of China (41630421, 41790474 and 41575039). We
acknowledge ozone datasets from the SWOOSH and GOZCARDS, precipitation from
GPCC and GPCP, meteorological fields from NCEP-2, SST from the UK Met Office
Hadley Centre, and WACCM4 from NCAR.
Edited by: Bjoern-Martin Sinnhuber
Reviewed by: two anonymous referees
Adler, R. F., Huffman, G. J., Chang, A., Ferraro, R., Xie, P. P., Janowiak, J., Rudolf, B., Schneider, U., Curtis, S., Bolvin, D., Gruber, A., Susskind, J., Arkin, P., and Nelkin, E.: The version-2 global precipitation climatology project (GPCP) monthly precipitation analysis (1979–present), J. Hydrometeorol., 4, 1147–1167, 2003.
Archer, C. L. and Caldeira, K.: Historical trends in the jet streams, Geophys. Res. Lett., 35, L08803, https://doi.org/10.1029/2008GL033614, 2008.
Baldwin, M. P. and Dunkerton, T. J.: Stratospheric harbingers of anomalous weather regimes, Science, 294, 581–584, https://doi.org/10.1126/science.1063315, 2001.
Barlow, M., Nigam, S., and Berbery, E. H.: ENSO, Pacific decadal variability, and US summertime precipitation, drought, and stream flow, J. Climate, 14, 2105–2128, https://doi.org/10.1175/1520-0442(2001)014<2105:EPDVAU>2.0.CO;2, 2001.
Bitz, C. M. and Polvani, L. M.: Antarctic climate response to stratospheric ozone depletion in a fine resolution ocean climate model, Geophys. Res. Lett., 39, L20705, https://doi.org/10.1029/2012GL053393, 2012.
Black, R. X. and Mcdaniel, B. A.: The Dynamics of Northern Hemisphere Stratospheric Final Warming Events, J. Atmos. Sci., 64, 2932–2946, https://doi.org/10.1175/Jas3981.1, 2006.
Black, R. X. and Mcdaniel, B. A.: SubMonthly polar vortex variability and stratosphere-troposphere coupling in the Arctic, J. Climate, 22, 5886–5901, https://doi.org/10.1175/2009JCLI2730.1, 2009.
Black, R. X., Mcdaniel, B. A., and Robinson, W. A.: Stratosphere Troposphere Coupling during Spring Onset, J. Climate, 19, 4891–4901, https://doi.org/10.1175/Jcli3907.1, 2005.
Cagnazzo, C. and Manzini, E.: Impact of the Stratosphere on the Winter Tropospheric Teleconnections between ENSO and the North Atlantic and European Region, J. Climate, 22, 1223–1238, https://doi.org/10.1175/2008JCLI2549.1, 2009.
Calvo, N., Polvani, L. M., and Solomon, S.: On the surface impact of Arctic stratospheric ozone extremes, Environ. Res. Lett., 10, 094003, https://doi.org/10.1088/1748-9326/10/9/094003, 2015.
Charlton, A. J. and Polvani, L. M.: A new look at stratospheric sudden warmings. Part I: Climatology and modeling benchmarks, J. Climate, 20, 449–469, https://doi.org/10.1175/JCLI3996.1, 2007.
Cheung, J. C. H., Haigh, J. D., and Jackson, D. R.: Impact of EOS MLS ozone data on medium-extended range ensemble weather forecasts, J. Geophys. Res., 119, 9253–9266, https://doi.org/10.1002/2014JD021823, 2014.
Davis, S. M., Rosenlof, K. H., Hassler, B., Hurst, D. F., Read, W. G., Vömel, H., Selkirk, H., Fujiwara, M., and Damadeo, R.: The Stratospheric Water and Ozone Satellite Homogenized (SWOOSH) database: a long-term database for climate studies, Earth Syst. Sci. Data, 8, 461–490, https://doi.org/10.5194/essd-8-461-2016, 2016.
Feldstein, S. B.: Subtropical Rainfall and the Antarctic Ozone Hole, Science, 332, 925–926, https://doi.org/10.1126/science.1206834, 2011.
Forster, P. M. D. and Shine, K. P.: Radiative forcing and temperature trends from stratospheric ozone changes, J. Geophys. Res., 102, 10841–10855, https://doi.org/10.1029/96JD03510, 1997.
Froidevaux, L., Anderson, J., Wang, H.-J., Fuller, R. A., Schwartz, M. J., Santee, M. L., Livesey, N. J., Pumphrey, H. C., Bernath, P. F., Russell III, J. M., and McCormick, M. P.: Global OZone Chemistry And Related trace gas Data records for the Stratosphere (GOZCARDS): methodology and sample results with a focus on HCl, H2O, and O3, Atmos. Chem. Phys., 15, 10471–10507, https://doi.org/10.5194/acp-15-10471-2015, 2015.
Gabriel, A., Peters, D., Kirchner, I., and Graf, H. F.: Effect of zonally asymmetric ozone on stratospheric temperature and planetary wave propagation, Geophys. Res. Lett., 34, L06807, https://doi.org/10.1029/2006GL028998, 2007.
Garcia, R. R., Marsh, D. R., Kinnison, D. E., Boville, B. A., and Sassi, F.: Simulation of secular trends in the middle atmosphere, 1950–2003, J. Geophys. Res., 112, D09301, https://doi.org/10.1029/2006JD007485, 2007.
Gerber, E. P. and Son, S. W.: Quantifying the Summertime Response of the Austral Jet Stream and Hadley Cell to Stratospheric Ozone and Greenhouse Gases, J. Climate, 27, 5538–5559, https://doi.org/10.1175/JCLI-D-13-00539.1, 2014.
Gillett, N. P., Scinocca, J. F., Plummer, D. A., and Reader, M. C.: Sensitivity of climate to dynamically-consistent zonal asymmetries in ozone, Geophys. Res. Lett., 36, L10809, https://doi.org/10.1029/2009GL037246, 2009.
Graf, H. F. and Walter, K.: Polar vortex controls coupling of North Atlantic Ocean and atmosphere, Geophys. Res. Lett., 32, L01704, https://doi.org/10.1029/2004GL020664, 2005.
Haigh, J. D.: The Role of Stratospheric Ozone in Modulating the Solar Radiative Forcing of Climate, Nature, 370, 544–546, https://doi.org/10.1038/370544a0, 1994.
Holland, M. M., Bailey, D. A., Briegleb, B. P., Light, B., and Hunke, E.: Improved Sea Ice Shortwave Radiation Physics in CCSM4: The Impact of Melt Ponds and Aerosols on Arctic Sea Ice, J. Climate, 25, 1413–1430, https://doi.org/10.1175/JCLI-D-11-00078.1, 2012.
Hu, Y., Tao, L., and Liu, J.: Poleward expansion of the Hadley circulation in CMIP5 simulations, Adv. Atmos. Sci., 30, 790–795, https://doi.org/10.1007/s00376-012-2187-4, 2013.
Huffman, G. J., Adler, R. F., Arkin, P., Chang, A., Ferraro, R., Gruber, A., Janowiak, J., McNab, A., Rudolf, B., and Schneider, U.: The Global Precipitation Climatology Project (GPCP) Combined Precipitation Dataset, B. Am. Meteorol. Soc., 78, 5–20, https://doi.org/10.1175/1520-0477(1997)078<0005:TGPCPG>2.0.Co;2, 1997.
Ineson, S. and Scaife, A. A.: The role of the stratosphere in the European climate response to El Nino, Nat. Geosci., 2, 32–36, https://doi.org/10.1038/NGEO381, 2009.
Ivy, D. J., Solomon, S., Calvo, N., and Thompson, D. W.: Observed connections of Arctic stratospheric ozone extremes to Northern Hemisphere surface climate, Environ. Res. Lett., 12, 024004, https://doi.org/10.1088/1748-9326/aa57a4, 2017.
Kang, S. M., Polvani, L. M., Fyfe, J. C., and Sigmond, M.: Impact of Polar Ozone Depletion on Subtropical Precipitation, Science, 332, 951–954, https://doi.org/10.1126/science.1202131, 2011.
Karpechko, A. Y., Perlwitz, J., and Manzini, E.: A model study of tropospheric impacts of the Arctic ozone depletion 2011, J. Geophys. Res., 119, 7999–8014, https://doi.org/10.1002/2013JD021350, 2014.
Kidston, J., Scaife, A. A., Hardiman, S. C., Mitchell, D. M., Butchart, N., Baldwin, M. P., and Gray, L. J.: Stratospheric influence on tropospheric jet streams, storm tracks and surface weather, Nat. Geosci., 8, 433–440, https://doi.org/10.1038/NGEO2424, 2015.
Labitzke, K. and Naujokat, B.: The lower Arctic stratosphere in winter since 1952, Sparc Newsletter, 15, 11–14, 2000.
Lau, K. M., Kim, K. M., and Shen, S. S.: Potential predictability of seasonal precipitation over the U.S. from canonical ensemble correlation predictions, Geophys. Res. Lett., 29, 1–4, https://doi.org/10.1029/2001GL014263, 2002.
Li, F., Vikhliaev, Y. V., Newman, P. A., Pawson, S., Perlwitz, J., Waugh, D. W., and Douglass, A. R.: Impacts of Interactive Stratospheric Chemistry on Antarctic and Southern Ocean Climate Change in the Goddard Earth Observing System, Version 5 (GEOS-5), J. Climate, 29, 3199–3218, https://doi.org/10.1175/JCLI-D-15-0572.1, 2016.
Lu, J., Deser, C., and Reichler, T.: Cause of the widening of the tropical belt since 1958, Geophys. Res. Lett., 36, L03803, https://doi.org/10.1029/2008GL036076, 2009.
Manney, G. L., Santee, M. L., Rex, M., Livesey, N. J., Pitts, M. C., Veefkind, P., Nash, E. R., Wohltmann, I., Lehmann, R., Froidevaux, L., Poole, L. R., Schoeberl, M. R., Haffner, D. P., Davies, J., Dorokhov, V., Gernandt, H., Johnson, B., Kivi, R., Kyrö, E., Larsen, N., Levelt, P. F., Makshtas, A., McElroy, C. T., Nakajima, H., Parrondo, M. C., Tarasick, D. W., von der Gathen, P., Walker, K. A., and Zinoviev, N. S.: Unprecedented Arctic ozone loss in 2011, Nature, 478, 469–475, https://doi.org/10.1038/nature10556, 2011.
Manney, G. L. and Lawrence, Z. D.: The major stratospheric final warming in 2016: dispersal of vortex air and termination of Arctic chemical ozone loss, Atmos. Chem. Phys., 16, 15371–15396, https://doi.org/10.5194/acp-16-15371-2016, 2016.
Marsh, D. R., Mills, M. J., Kinnison, D. E., Lamarque, J. F., Calvo, N., and Polvani, L. M.: Climate Change from 1850 to 2005 Simulated in CESM1(WACCM), J. Climate, 26, 7372–7391, https://doi.org/10.1175/JCLI-D-12-00558.1, 2013.
McCormack, J. P., Nathan, T. R., and Cordero, E. C.: The effect of zonally asymmetric ozone heating on the Northern Hemisphere winter polar stratosphere, Geophys. Res. Lett., 38, 1–5, https://doi.org/10.1029/2010GL045937, 2011.
McLandress, C., Shepherd, T. G., Scinocca, J. F., Plummer, D. A., Sigmond, M., Jonsson, A. I., and Reader, M. C.: Separating the dynamical effects of climate change and ozone depletion. Part II: Southern Hemisphere troposphere, J. Climate, 24, 1850–1868, https://doi.org/10.1175/2010JCLI3958.1, 2011.
Min, S. K. and Son, S. W.: Multimodel attribution of the Southern Hemisphere Hadley cell widening: Major role of ozone depletion, J. Geophys. Res., 118, 3007–3015, https://doi.org/10.1002/jgrd.50232, 2013.
Namias, J.: Some causes of U.S. drought, J. Clim. Appl. Meteorol., 22, 30–39, https://doi.org/10.1175/1520-0450(1983)022<0030:Scousd>2.0.Co;2, 1983.
Neale, R. B., Richter, J., Park, S., Lauritzen, P. H., Vavrus, S. J., Rasch, P. J., and Zhang, M. H.: The Mean Climate of the Community Atmosphere Model (CAM4) in Forced SST and Fully Coupled Experiments, J. Climate, 26, 5150–5168, https://doi.org/10.1175/JCLI-D-12-00236.1, 2013.
Nowack, P. J., Abraham, N. L., Maycock, A. C., Braesicke, P., Gregory, J. M., Joshi, M. M., Osprey, A., and Pyle, J. A.: A large ozone-circulation feedback and its implications for global warming assessments, Nat. Clim. Change, 5, 41–45, https://doi.org/10.1038/NCLIMATE2451, 2015.
Nowack, P. J., Braesicke, P., Abraham, N. L., and Pyle, J. A.: On the role of ozone feedback in the ENSO amplitude response under global warming, Geophys. Res. Lett., 44, 3858–3866, https://doi.org/10.1002/2016GL072418, 2017.
Nowack, P. J., Abraham, N. L., Braesicke, P., and Pyle, J. A.: The impact of stratospheric ozone feedbacks on climate sensitivity estimates, J. Geophys. Res., 123, 4630–4641, https://doi.org/10.1002/2017JD027943, 2018.
Pawson, S. and Naujokat, B.: The cold winters of the middle 1990s in the northern lower stratosphere, J. Geophys. Res., 104, 14209–14222, https://doi.org/10.1029/1999JD900211, 1999.
Polvani, L. M., Waugh, D. W., Correa, G. J., and Son, S.-W.: Stratospheric ozone depletion: The main driver of twentieth-century atmospheric circulation changes in the Southern Hemisphere, J. Climate, 24, 795–812, https://doi.org/10.1175/2010JCLI3772.1, 2011.
Ramaswamy, V., Schwarzkopf, M. D., and Randel, W. J.: Fingerprint of ozone depletion in the spatial and temporal pattern of recent lower-stratospheric cooling, Nature, 382, 616–618, https://doi.org/10.1038/382616a0, 1996.
Randel, W. J.: The Seasonal Evolution of Planetary-Waves in the Southern-Hemisphere Stratosphere and Troposphere, Q. J. Roy. Meteorol. Soc., 114, 1385–1409, https://doi.org/10.1002/qj.49711448403, 1988.
Randel, W. J. and Wu, F.: Cooling of the arctic and antarctic polar stratospheres due to ozone depletion, J. Climate, 12, 1467–1479, https://doi.org/10.1175/1520-0442(1999)012<1467:COTAAA>2.0.Co;2, 1999.
Randel, W. J. and Wu, F.: A stratospheric ozone profile data set for 1979-2005: Variability, trends, and comparisons with column ozone data, J. Geophys. Res., 112, D06313, https://doi.org/10.1029/2006JD007339, 2007.
Ravishankara, A. R., Turnipseed, A. A., Jensen, N. R., Barone, S., Mills, M., Howard, C. J., and Solomon, S.: Do hydrofluorocarbons destroy stratospheric ozone?, Science, 263, 71–75, https://doi.org/10.1126/science.263.5143.71, 1994.
Ravishankara, A. R., Daniel, J. S., and Portmann, R. W.: Nitrous oxide (N2O): the dominant ozone-depleting substance emitted in the 21st century, Science, 326, 123–125, https://doi.org/10.1126/science.1176985, 2009.
Rayner, N. A., Parker, D. E., Horton, E. B., Folland, C. K., Alexander, L. V., and Rowell, D. P.: Global analyses of sea surface temperature, sea ice, and night marine air temperature since the late nineteenth century, J. Geophys. Res., 108, 4407, 2003.
Reichler, T., Kim, J., Manzini, E., and Kroger, J.: A stratospheric connection to Atlantic climate variability, Nat. Geosci., 5, 783–787, https://doi.org/10.1038/NGEO1586, 2012.
Russell, J. L., Dixon, K. W., Gnanadesikan, A., Stouffer, R. J., and Toggweiler, J. R.: The Southern Hemisphere westerlies in a warming world: Propping open the door to the deep ocean, J. Climate, 19, 6382–6390, https://doi.org/10.1175/JCLI3984.1, 2006.
Schneider, U., Fuchs, T., Meyer-Christoffer, A., and Rudolf, B.: Global precipitation analysis products of the GPCC, Global Precipitation Climatology Centre, 12 pp., 2008.
Smith, K. L. and Polvani, L. M.: The surface impacts of Arctic stratospheric ozone anomalies, Environ. Res. Lett., 9, 074015, https://doi.org/10.1088/1748-9326/9/7/074015, 2014.
Solomon, S.: Antarctic ozone: Progress towards a quantitative understanding, Nature, 347, 354, https://doi.org/10.1038/347347a0, 1990.
Solomon, S.: Stratospheric ozone depletion: A review of concepts and history, Rev. Geophys., 37, 275–316, https://doi.org/10.1029/1999RG900008, 1999.
Son, S.-W., Tandon, N. F., Polvani, L. M., and Waugh, D. W.: Ozone hole and Southern Hemisphere climate change, Geophys. Res. Lett., 36, L15705, https://doi.org/10.1029/2009GL038671, 2009.
Son, S.-W., Gerber, E. P., Perlwitz, J., Polvani, L. M., Gillett, N. P., Seo, K.-H., Eyring, V., Shepherd, T. G., Waugh, D., Akiyoshi, H., Austin, J., Baumgaertner, A., Bekki, S., Braesicke, P., Brühl, C., Butchart, N., Chipperfield, M. P., Cugnet, D., Dameris, M., Dhomse, S., Frith, S., Garny, H., Garcia, R., Hardiman, S. C., Jöckel, P., Lamarque, J. F., Mancini, E., Marchand, M., Michou, M., Nakamura, T., Morgenstern, O., Pitari, G., Plummer, D. A., Pyle, J., Rozanov, E., Scinocca, J. F., Shibata, K., Smale, D., Teyssèdre, H., Tian, W., and Yamashita, Y.: Impact of stratospheric ozone on Southern Hemisphere circulation change: A multimodel assessment, J. Geophys. Res., 115, D00M07, doi.org/10.1029/2010JD014271, 2010.
Thompson, D. W. J. and Solomon, S.: Interpretation of recent Southern Hemisphere climate change, Science, 296, 895–899, https://doi.org/10.1126/science.1069270, 2002.
Thompson, D. W. J., Solomon, S., Kushner, P. J., England, M. H., Grise, K. M., and Karoly, D. J.: Signatures of the Antarctic ozone hole in Southern Hemisphere surface climate change, Nat. Geosci., 4, 741–749, https://doi.org/10.1038/NGEO1296, 2011.
Ting, M. and Wang, H.: Summertime US Precipitation Variability and Its Relation toPacific Sea Surface Temperature, J. Climate, 10, 1853–1873, https://doi.org/10.1175/1520-0442(1997)010<1853:SUSPVA>2.0.CO;2, 1997.
Tung, K. K.: On the Relationship between the Thermal Structure of the Stratosphere and the Seasonal Distribution of Ozone, Geophys. Res. Lett., 13, 1308–1311, https://doi.org/10.1029/GL013i012p01308, 1986.
Wang, F., Yang, S., Higgins, W., Li, Q. P., and Zuo, Z. Y.: Long-term changes in total and extreme precipitation over China and the U.S. and their links to oceanic-atmospheric features, Int. J. Climatol., 34, 286–302, https://doi.org/10.1002/joc.3685, 2014.
Wang, H. and Ting, M. F.: Covariabilities of winter US precipitation and Pacific Sea surface temperatures, J. Climate, 13, 3711–3719, https://doi.org/10.1175/1520-0442(2000)013<3711:Cowusp>2.0.Co;2, 2000.
Wang, L., Ting, M., and Kushner, P. J.: A robust empirical seasonal prediction of winter NAO and surface climate, Sci. Rep., 7, 279, 2017.
Waugh, D. W., Garfinkel, C. I., and Polvani, L. M.: Drivers of the Recent Tropical Expansion in the Southern Hemisphere: Changing SSTs or Ozone Depletion?, J. Climate, 28, 6581–6586, https://doi.org/10.1175/JCLI-D-15-0138.1, 2015.
WMO: Scientific Assessment of Ozone depletion: 2002. In: Global Ozone Research and Monitoring Project, Report No. 47, Geneva, 498 pp., 2003.
WMO: Scientific Assessment of Ozone Depletion: 2010. WMO Tech. Note 52, World Meteorological Organization, Geneva, Switzerland, 516 pp., 2011.
Xie, F., Li, J., Tian, W., Fu, Q., Jin, F.-F., Hu, Y., Zhang, J., Wang, W., Sun, C., Feng, J., Yang, Y., and Ding, R.: A connection from Arctic stratospheric ozone to El Niño-Southern Oscillation, Environ. Res. Lett., 11, 124026, https://doi.org/10.1088/1748-9326/11/12/124026, 2016.
Xie, F., Li, J., Zhang, J., Tian, W., Hu, Y., Zhao, S., Sun, C., Ding, R., Feng, J., and Yang, Y.: Variations in North Pacific sea surface temperature caused by Arctic stratospheric ozone anomalies, Environ. Res. Lett., 12, 114023, https://doi.org/10.1088/1748-9326/aa9005, 2017a.
Xie, F., Zhang, J., Sang, W., Li, Y., Qi, Y., Sun, C., and Shu, J.: Delayed effect of Arctic stratospheric ozone on tropical rainfall, Atmos. Sci. Lett., 18, 409–416, 2017b.
Xie, F., Ma, X., Li, J., Huang, J., Tian, W., Zhang, J., Hu, Y., Sun, C., Zhou, X., Feng, J., and Yang, Y.: An advanced impact of Arctic stratospheric ozone changes on spring precipitation in China, Clim. Dynam., 51, 4029–4041, do:10.1007/s00382-018-4402-1, 2018.
Yin, J. H.: A consistent poleward shift of the storm tracks in simulations of 21st century climate, Geophys. Res. Lett., 32, L18701, https://doi.org/10.1029/2005GL023684, 2005.
Zhang, J. K., Tian, W. S., Chipperfield, M. P., Xie, F., and Huang, J. L.: Persistent shift of the Arctic polar vortex towards the Eurasian continent in recent decades, Nat. Clim. Change., 6, 1094–1099, https://doi.org/10.1038/nclimate3136, 2016.
Zhang J. K., Tian, W. S., Xie, F., Chipperfield, M. P., Feng, W. H., Son, S-W., Abraham, N. L., Archibald, A. T., Bekki, S., Butchart, N., Deushi, M., Dhomse, S., Han, Y. Y., Jöckel, P., Kinnison, D., Kirner, O., Michou, M., Morgenstern, O., O'Connor, F. M., Pitari, G., Plummer, D. A., Revell, L. E., Rozanov, E., Visioni, D., Wang, W. K., and Zeng, G.: Stratospheric ozone loss over the Eurasian continent induced by the polar vortex shift, Nat. Commun., 9, 206, https://doi.org/10.1038/s41467-017-02565-2, 2018.
- Abstract
- Introduction
- Data and simulations
- Response of precipitation in the northwestern US to ASO anomalies in spring
- Simulations of the effect of ASO variations on precipitation in the northwestern US during spring
- Discussion and summary
- Data availability
- Author contributions
- Competing interests
- Special issue statement
- Acknowledgements
- References


