the Creative Commons Attribution 4.0 License.
the Creative Commons Attribution 4.0 License.
 | 05 Jul 2019
Impact of air pollution control measures and regional transport on carbonaceous aerosols in fine particulate matter in urban Beijing, China: insights gained from long-term measurement
Wenkang Gao
Jiwei Li
Wupeng Du
Lili Wang
Yang Sun
Jinyuan Xin
Bo Hu
Yuesi Wang
As major chemical components of airborne fine particulate matter (PM2.5), organic carbon (OC) and elemental carbon (EC) have vital impacts on air quality, climate change, and human health. Because OC and EC are closely associated with fuel combustion, it is helpful for the scientific community and policymakers assessing the efficacy of air pollution control measures to study the impact of control measures and regional transport on OC and EC levels. In this study, hourly mass concentrations of OC and EC associated with PM2.5 were semi-continuously measured from March 2013 to February 2018. The results showed that annual mean OC and EC concentrations declined from 14.0 to 7.7 µg m−3 and from 4.0 to 2.6 µg m−3, respectively, from March 2013 to February 2018. In combination with the data of OC and EC in previous studies, an obvious decreasing trend in OC and EC concentrations was found, which was caused by clean energy policies and effective air pollution control measures. However, no obvious change in the ratios of OC and EC to the PM2.5 mass (on average, 0.164 and 0.049, respectively) was recorded, suggesting that inorganic ions still contributed a lot to PM2.5. Based on the seasonal variations in OC and EC, it appeared that higher OC and EC concentrations were still observed in the winter months, with the exception of winter of 2017–2018. Traffic policies executed in Beijing resulted in nighttime peaks of OC and EC, caused by heavy-duty vehicles and heavy-duty diesel vehicles being permitted to operate from 00:00 to 06:00 (China standard time, UTC+8, for all times throughout the paper). In addition, the fact that there was no traffic restriction in weekends led to higher concentrations on weekends compared to weekdays. Significant correlations between OC and EC were observed throughout the study period, suggesting that OC and EC originated from common emission sources, such as exhaust of vehicles and fuel combustion. OC and EC levels increased with enhanced SO2, CO, and NOx concentrations while the O3 and OC levels were enhanced simultaneously when O3 concentrations were higher than 50 µg m−3. Non-parametric wind regression analysis was performed to examine the sources of OC and EC in the Beijing area. It was found that there were distinct hot spots in the northeast wind sector at wind speeds of approximately 0–6 km h−1, as well as diffuse signals in the southwestern wind sectors. Source areas further away from Beijing were assessed by potential source contribution function (PSCF) analysis. A high-potential source area was precisely pinpointed, which was located in the northwestern and southern areas of Beijing in 2017 instead of solely in the southern areas of Beijing in 2013. This work shows that improvement of the air quality in Beijing benefits from strict control measures; however, joint prevention and control of regional air pollution in the regions is needed for further improving the air quality. The results provide a reference for controlling air pollution caused by rapid economic development in developing countries.
- Article
(3257 KB) - Full-text XML
-
Supplement
(1838 KB) - BibTeX
- EndNote


Worldwide attention on atmospheric organic carbon (OC) and elemental carbon (EC) has been paid by the public and the scientific community because OC and EC have vital effects on air quality, atmospheric visibility, climate, and human health (Bond et al., 2013; Boucher et al., 2013; WHO, 2012). OC is composed of thousands of organic compounds and occupies 10 %–50 % of the ambient PM2.5 mass (Seinfeld and Pandis, 1998) while EC, which is emitted from fuel combustion, represents 1 %–13 % of the ambient PM2.5 mass (Shah et al., 1986; Tao et al., 2017; Malm et al., 1994). Considering that OC and EC occupy high fractions of the PM2.5, a decline in OC and EC concentrations will improve air quality. Due to the light-scattering potential of OC and the light absorption ability of EC, high concentrations of OC and EC can impair the atmospheric visibility. In addition, OC and EC can affect the atmospheric energy balance through scattering and absorbing incoming and outgoing solar and terrestrial radiation (direct effect) and through modifying the microphysical properties of clouds, like influencing cloud condensation nuclei and/or ice nuclei (indirect effects). Direct and indirect effects of OC and EC remain one of the principal uncertainties in estimates of anthropogenic radiative forcing (Boucher et al., 2013). In particular, black carbon (BC also called EC) coated with secondary particles can enhance aerosol radiative forcing (Wang et al., 2013; Zhang et al., 2008). BC is found to aggravate haze pollution in megacities (Ding et al., 2016; Zhang et al., 2018). Most of all, OC and EC adversely affect human health. As important constituents of OC, polycyclic aromatic hydrocarbons (PAHs) are well-known as carcinogens, mutagens, and teratogens and therefore pose a serious threat to the health and the well-being of humans (Boström et al., 2002). Short-term epidemiological studies provide sufficient evidence of all-cause and cardiovascular mortality and cardiopulmonary hospital admissions associated with daily variations in BC concentrations; in addition, cohort studies proved that all-cause and cardiopulmonary mortality are linked with long-term average BC exposure (WHO, 2012). Thus, long-term continuous observations of OC and EC are a prerequisite to further study air quality, atmospheric visibility, climate effects, and human health. However, long-term continuous observations of OC and EC in China are scarce.
In the world, China is considered to be one of the regions of high emissions of OC and EC due to high energy consumption and increasing vehicle population, accompanying rapid economic development and urbanization for decades (http://www.stats.gov.cn/tjsj/ndsj/2017/indexch.htm, last access: 26 June 2019). As the capital of China, Beijing with a residential population of 21.7 million, domestic tourists of 2.9×10² million, and foreign tourists of approximately 3.3 million in 2017 (http://tjj.beijing.gov.cn/English/AD/, last access: 26 June 2019) faces severe air pollution problems, which have attracted worldwide attention. A series of studies on OC and EC have already been performed in Beijing. Lang et al. (2017) indicated that OC showed a downward trend and EC had almost no change before 2003; both increased from 2003 to 2007, but decreased after 2007. The decline in OC concentrations was associated with coal combustion and motor vehicle emission control measures, while that in EC was caused by the replacement of fossil fuel and control of biomass emissions. Tao et al. (2017) stated that the nearly 30 % reduction in total carbon (TC) in recent years in Beijing can be taken as a real trend. Lv et al. (2016) found that the concentrations of OC and EC remained unchanged from 2000 to 2010 in Beijing. Yang et al. (2011a) conducted a long-term study of carbonaceous aerosol from 2005 to 2008 in urban Beijing and found a decline in the ratio of carbonaceous species to the PM2.5 mass in contrast to what was observed 10 years earlier, which indicated that the importance of carbonaceous species in PM2.5 had decreased. In addition, pronounced seasonal variations were recorded with the highest concentrations occurring in winter and the lowest ones in summer. Overall, this previous research seems somewhat inconsistent and seldom focused on studying the impact of air pollution control measures and regional transport on the carbonaceous aerosol levels in detail.
Notably, a series of the strictest measures on emission abatement and pollution control were implemented in China in September 2013 (Jin et al., 2016). Substantial manpower and material resources have been put into improving the air quality in the past 5 years and significant measures are being taken for the atmospheric environment and ecosystem (Gao et al., 2017). To evaluate the effectiveness of air pollution control measures, it is necessary to conduct a long-term continuous observation of OC and EC and to study their long-term variation. Most of the previous studies showed average information for certain periods based on filter sampling and laboratory analysis and did not reflect the dynamic evolution processes of OC and EC with hourly resolution, which can provide important and detailed information for the potential health risk in the area with frequent occurrence of air pollution episodes. In addition, long-term measurements in urban areas of China with high population density were scarce (Yang et al., 2005, 2011a; Zhang et al., 2011; Li et al., 2015; Chang et al., 2017) and the knowledge of long-term continuous hourly observations is still lacking, which is still important for recognizing the influence of source emissions on air quality.
Based on the abovementioned background, it is necessary to perform a long-term continuous hourly observation to explore the characteristics of OC and EC, to examine the relationship between OC and EC and with major air pollutants and their sources so as to better assess the influence of emission control measures on the OC and EC levels. In this study, inter-annual, seasonal, weekly, and diurnal variation in OC and EC was investigated. The influence of local and regional anthropogenic sources was evaluated using non-parametric wind regression (NWR) and potential contribution source function (PSCF) methods. This study will be helpful for improving the understanding of the variation and sources of OC and EC associated with PM2.5 and assessing the effectiveness of local and national PM control measures, and it provides a valuable dataset for atmospheric modelling study and assessing the health risk. It is also the first time that a continuous hourly measurement for a 5-year period based on the thermal–optical method is reported for urban Beijing.
2.1 Description of the site
The study site ( N, E, 44 m above ground) was set up in the second floor in the campus of the state key laboratory of atmospheric boundary physics and atmospheric chemistry of the Institute of Atmospheric Physics, Chinese Academy of Science (Fig. 1). The site is approximately 1 km south of the 3rd Ring Road (main road), 1.2 km north of the 4th Ring Road (main road), 200 m west of the G6 highway (which runs north–south) and 50 m south of the Beitucheng West Road (which runs east–west). The annual average vehicular speeds in the morning and evening traffic peaks were approximately 27.8 and 24.6 km h−1, respectively, in the past 5 years. During the whole study period the level of traffic congestion is mild based on the traffic performance index published by the Beijing Traffic Management Bureau (http://www.bjtrc.org.cn/, last access: 26 June 2019), which indicated 1.5–1.8 times more time will be taken to publicly travel during traffic peaks than during smooth traffic. The study site is surrounded by residential zones, a street park, and a building of ancient relics without industrial sources. The experimental campaign was performed from 1 March 2013 to 28 February 2018. The periods of 1 March 2013 to 28 February 2014, 1 March 2014 to 28 February 2015, 1 March 2015 to 29 February 2016, 1 March 2016 to 28 February 2017, and 1 March 2017 to 28 February 2018 are, hereinafter, called 2013, 2014, 2015, 2016, and 2017, respectively, for short.
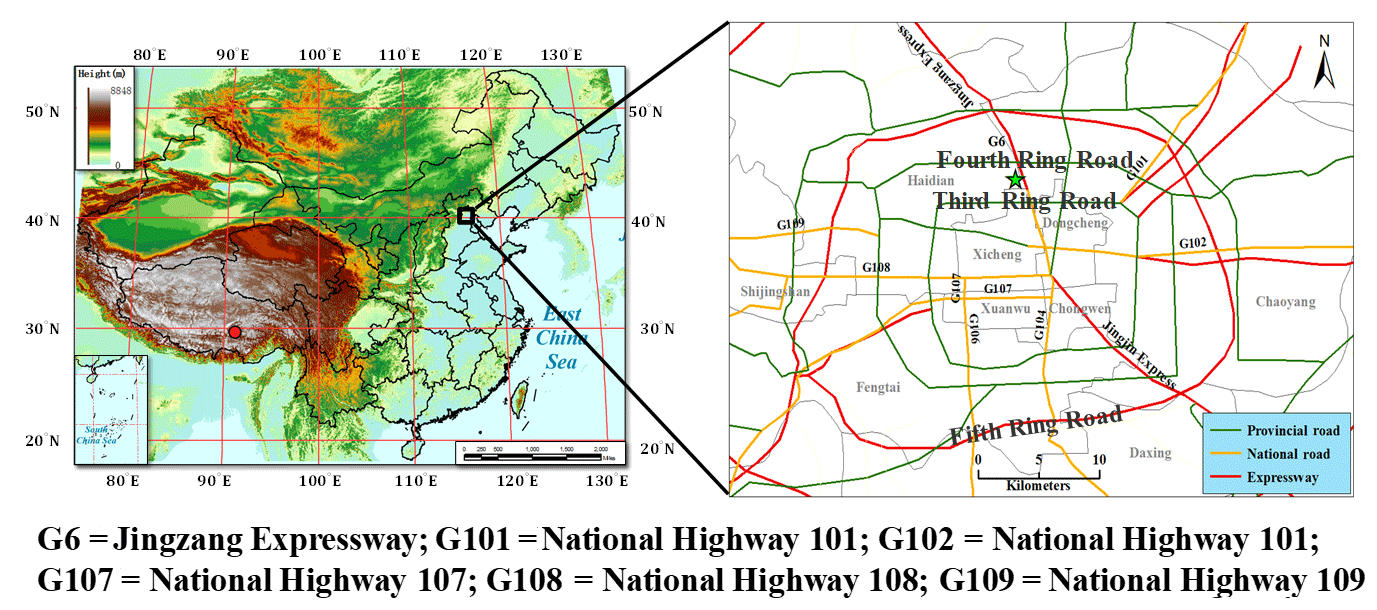
Figure 1Map with location of the sampling site (the asterisk in the right figure indicates the sampling site).
2.2 Instrumentation
Concentrations of PM2.5-associated OC and EC were hourly measured with semi-continuous thermal–optical transmittance method OC∕EC analysers (model 4, Sunset Laboratory Inc., Oregon, USA). The operation and maintenance are strictly executed according to standard operating procedures (SOPs, https://www3.epa.gov/ttnamti1/spesunset.html, last access: 26 June 2019). Volatile organic gases are removed by an inline parallel carbon denuder installed upstream of the analyser. A round 16 mm quartz filter is used to collect PM2.5 with a sampling flow rate of 8 L m−1. A modified NIOSH thermal protocol (RT-Quartz) is used to measure OC and EC. The sampling period is 30 min and the analysis process lasts for 15 min. Calibration is performed according to the SOP. An internal standard CH4 mixture (5.0 %; ultra-high-purity He) is automatically injected to calibrate the analyser at the end of every analysis. In addition, off-line calibration was conducted with an external amount of sucrose standard (1.06 µg) every 3 months. The quartz fibre filters used for sample collection were replaced by new ones before the laser correction factor dropped below 0.90. After replacement, a blank measurement of the quartz fibre filters is carried out. The uncertainty of the TC measurement has been estimated to be approximately ±20 % (Peltier et al., 2007). The analyzers/monitors for O3, CO, SO2, NOx, and PM2.5 and their precision, detection limits, and calibration methods have been described in detail elsewhere (Ji et al., 2014). Briefly, O3 was measured using an ultraviolet photometric analyser (model 49i, Thermo Fisher Scientific (Thermo), USA), CO with a gas filter correlation non-dispersive infrared method analyser (model 48i, Thermo, USA), SO2 using a pulsed-fluorescence analyser (model 43i, Thermo, USA), NO–NO2–NOx with a chemiluminescence analyser (model 42, Thermo, USA), and PM2.5 using a U.S. Environmental Protection Agency Federal Equivalent Method analyser of PM2.5 (SHARP 5030, Thermo, USA). Meteorological data such as wind speed (WS), wind direction (WD), relative humidity (RH), and atmospheric temperature (T) were recorded via an automatic meteorological station (model AWS310; Vaisala, Finland). The data were processed using an Igor-based software (Wu et al., 2018) and the commercial software of Origin.
2.3 NWR and PSCF methods
2.3.1 NWR method
NWR is a source-to-receptor source identification model, which provides a meaningful allocation of local sources (Henry et al., 2009; Petit et al., 2017). Wind analysis results using NWR were obtained using a new Igor-based tool, named ZeFir, which can perform a comprehensive investigation of the geographical origins of the air pollutants (Petit et al., 2017). The principle of NWR is to smooth the data over a fine grid so that concentrations of air pollutants of interest can be estimated by any coupling of wind direction (θ) and wind speed (u). The smoothing is based on a weighing average where the weighing coefficients are determined using a weighting function K(θ, u, σ, h)=K1(θ, σ)×K2 (u, h) (i.e. Kernel functions). The estimated value (E) given θ and u is calculated by Eqs. (1)–(3):
where σ and h were smoothing parameters, which can be suggested by clicking on the button “suggest estimate” in the software ZeFir; Ci, Wi, and Yi are the observed concentration of a pollutant of interest and resultant wind speed and direction, respectively, for the ith observation in a time period starting at time ti; N is the total number of observations.
After the calculation, graphs of the estimated concentration and the joint probability are generated. The NWR graph of the air pollutant of interest, acquired directly via the NWR calculation, represents an integrated picture of the relationship of estimated concentration of the specific pollutant, wind direction and wind speed. The graph of the joint probability for the wind data, equivalent to a wind rose, shows the occurrence probability distribution of the wind speed and wind direction.
2.3.2 PSCF method
The PSCF method is based on the residence time probability analysis of air pollutants of interest (Ashbaugh et al., 1985). Source locations and preferred transport pathways can be identified (Poirot and Wishinski, 1986; Polissar et al., 2001; Lupu and Maenhaut, 2002). The potential locations of the emission sources are determined using backward trajectories. A detailed description can be found in Wang et al. (2009). In principle, the PSCF is expressed using Eq. (4):
where wij is an empirical weight function proposed to reduce the uncertainty of nij during the study period, mij is the total number of endpoints in (i, j) with concentration value at the receptor site exceeding a specified threshold value (the 75th percentiles for OC and EC each year were used as threshold values to calculate mij), and nij is the number of back-trajectory segment endpoints that fall into the grid cell (i, j) over the period of study. The National Oceanic and Atmospheric Administration Hybrid Single-Particle Lagrangian Integrated Trajectory model (https://ready.arl.noaa.gov/HYSPLIT.php, last access: 26 June 2019) was used for calculating the 48 h backward trajectories terminating at the study site at a height of 100 m every 1 h from 1 March 2013 to 28 February 2018. In this study, the domain for the PSCF was set in the range of (30–70∘ N, 65–150∘ E) with the grid cell size of ∘.
3.1 Levels of OC and EC
Statistics for the OC and EC concentrations from 1 March 2013 to 28 February 2018 are summarized in Table 1. Benefiting from the Air Pollution Prevention and Control Action Plan and increasing atmospheric self-purification capacity (ASC, shown in Table S1 in the Supplement), a decline in annual average concentrations is, on the whole, recorded. In detail, the annual average concentrations of both OC and EC peaked in 2014 and then started to decline gradually during the remainder of the study period. Nonetheless, the annual average concentrations of PM2.5 generally decreased from 2013 to 2017. To assess whether the decreases are statistically significant, two-tailed paired t tests were applied for OC, EC, and PM2.5 using their monthly average concentrations in 2013 and 2016 as paired datasets. At a confidence level of 98 %, from March to October, the paired data are statistically different, indicating that the concentrations of OC, EC, and PM2.5 declined during the above period from 2013 to 2016; however, the concentrations of OC, EC and PM2.5 during November and February from 2013 to 2016 are not statistically different. The decline in OC and EC concentrations is closely associated with decreasing coal consumption, increasing usage of natural gases, and the implementation of a stricter vehicular emission standard and increasing atmospheric self-purification capacity (Tables S1–S3). Knowledge of the relative contribution of OC and EC to PM2.5 is important in formulating effective control measures for ambient PM (L. Wang et al., 2016). The ratios of OC and EC to PM2.5 varied little during the whole study period, suggesting that vehicular emission might be an important contributor of OC and EC although several other pollution sources also contributed to the OC and EC loadings. The ratios of OC to PM2.5 ranged from 15.5 % to 17.8 % with the average of 16.4 %, while those of EC to PM2.5 ranged from 4.5 % to 5.2 % with the average of 4.9 %. OC accounted, on average, for 77.0 %±9.3 % of the total carbon (TC, the sum of OC and EC), while EC amounted for 23.0 %±9.3 % of the TC. These results are consistent with those in previous studies (L. Wang et al., 2016; Tao et al., 2017; Lang et al., 2017). The contribution of TC to PM2.5, 21.3 %±15.8 %, is also similar to that reported in previous studies, listed in Table S4, for example, at urban sites of Hong Kong, China (23.5 %–23.6 % in 2013), and Hasselt (23 %) and Mechelen (24 %) in northern Belgium, rural sites in Europe (19 %–20 %), and some sites in India (on average 20 %; Bisht et al., 2015; Ram and Sarin, 2010, 2012), but lower than those observed historically at multiple sites in China (on average 27 %; L. Wang et al., 2016), with Beijing (27.6 %, from March 2005 to February 2006), Chongqing (28.3 %, from March 2005 to February 2006), Shanghai (34.5 %, from March 1999 to May 2000), and Guangzhou (26.4 %, December 2008 to February 2009), in Budapest (40 %), Istanbul (30 %), and many sites in the USA, like Fresno (43.2 %), Los Angeles (36.9 %) and Philadelphia (33.3 %) (Na et al., 2004). Compared to previous studies in Beijing (Table S4), the TC-to-PM2.5 ratio became smaller in this study, indicating a relatively lower contribution from carbonaceous aerosols to PM2.5 in this study. The difference in the TC∕PM2.5 ratio could be ascribed to two factors. One factor is the difference in characteristics of sampling locations between that in our study and those in the earlier studies. However, our site and those in the previous studies used for comparison are all located in urban areas of Beijing (Chaoyang and Haidian districts). It is reasonable to assume that they are affected by common sources since the surrounding environments exhibit similar features. In addition, the annual average PM2.5 concentrations in both districts published by the Ministry of Environmental Protection, China (http://106.37.208.233:20035/, last access: 26 June 2019), were quite comparable to each other from 2013 to 2017 (y=0.99x, r2=0.92), indicating that both areas had particle pollution of a similar degree. The other factor is that the contribution from secondary inorganic ions to the PM2.5 became more important because of a stronger atmospheric oxidation capacity (the annual average O3 concentrations were 102, 109, 116, 119, and 136 µg m−3, respectively, from 2013 to 2017 in the Beijing–Tianjin–Hebei region; published by http://106.37.208.233:20035/, last access: 26 June 2019), which could give rise to a lower TC-to-PM2.5 ratio. A higher TC-to-PM2.5 ratio suggests that there is a lower contribution from secondary inorganic ions to PM2.5, while a lower ratio may indicate a larger contribution from secondary inorganic ions to PM2.5. The carbonaceous aerosol (the sum of multiplying the measured OC by a factor of 1.4 and EC) represented, on average, 27.7 %±16.7 % of the observed PM2.5 concentration, making it a dominant contributor to PM2.5.
Table 1Medians, averages, and associated standard deviations for the OC, EC, and PM2.5 concentrations (in micrograms per cubic metre) and averages for the OC∕PM2.5, EC∕PM2.5, and TC∕PM2.5 ratios from March 2013 to February 2018.
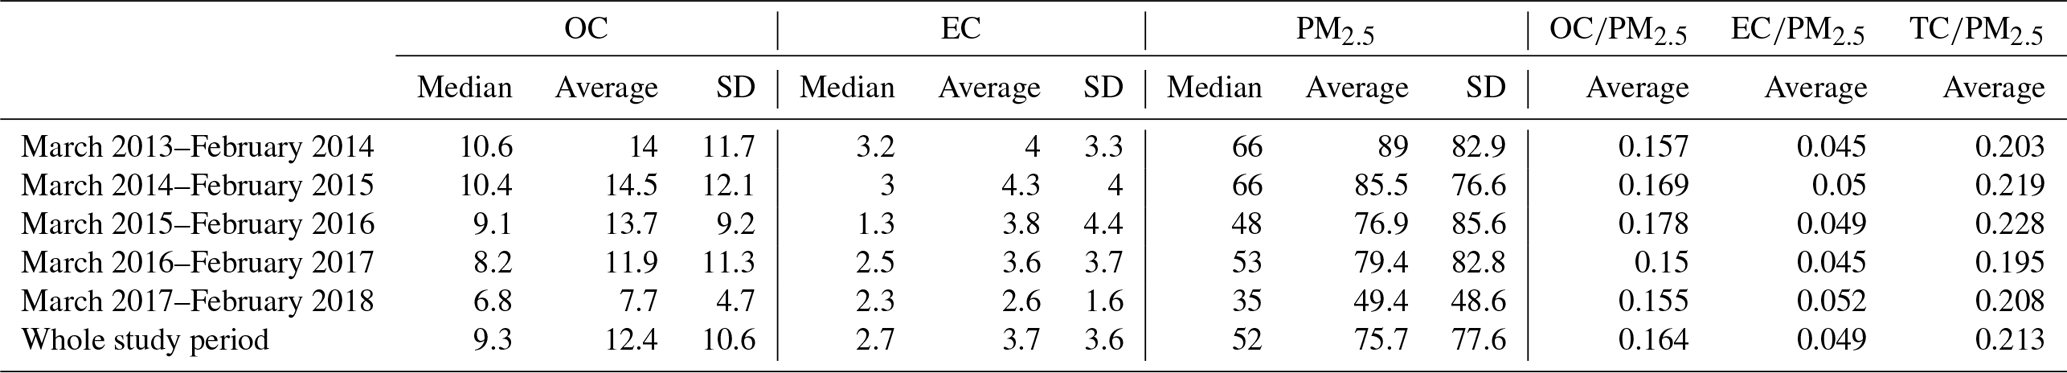
Table 2Mean or median OC and EC mass concentrations (in micrograms per cubic metre) observed in major megacities of the world published in the literature and obtained in this study.
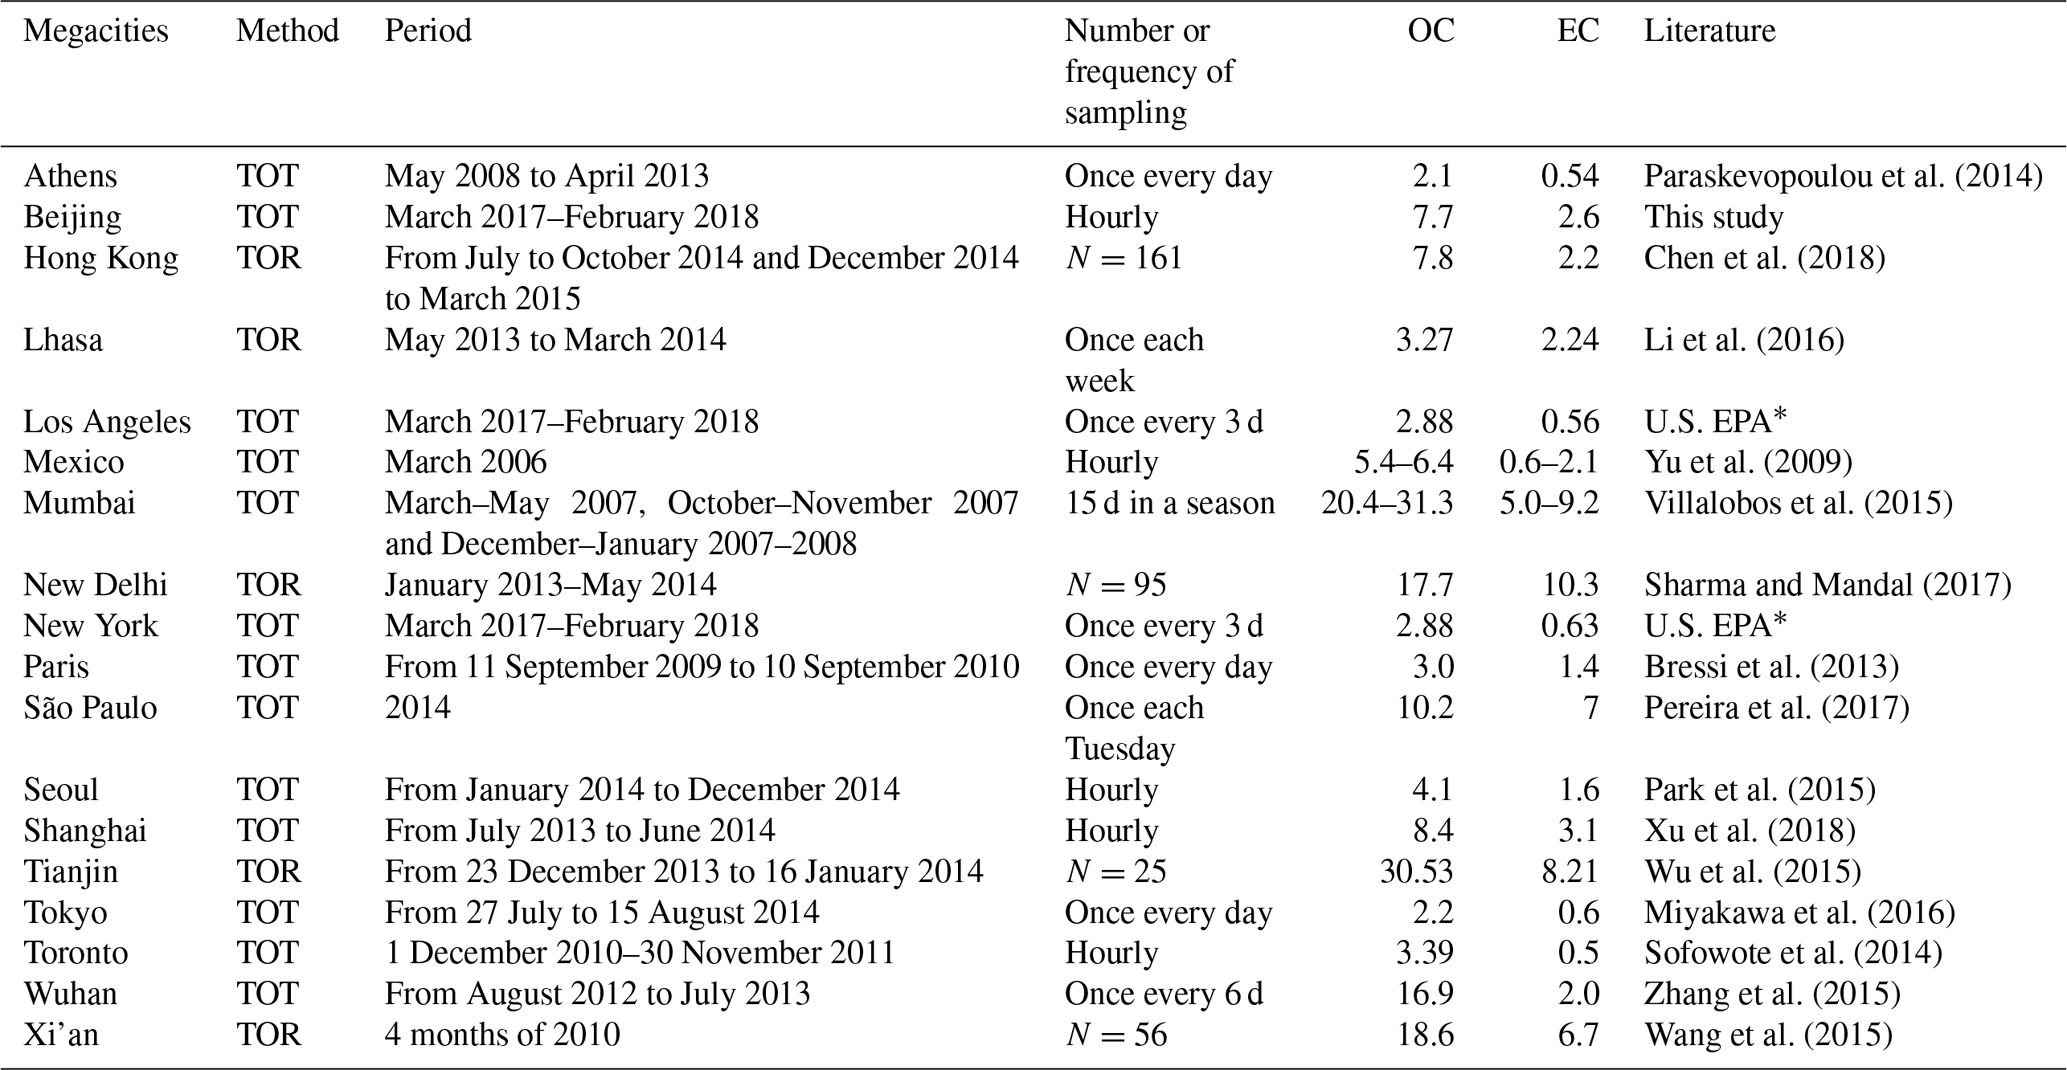
* https://aqs.epa.gov/api (last access: 26 June 2019). TOR: thermal–optical reflectance; TOT: thermal–optical transmittance.
Table 2 lists recently published results for OC and EC mass concentrations in major megacities. Although the observation periods were not same, a comparative analysis of OC and EC concentrations between different megacities could show the status of energy consumption for policymakers, drawing lessons and experience from other countries. It is obvious that the PM2.5-associated OC and EC levels in the megacities in the developing countries were far higher than those in the developed countries. The PM2.5-associated OC and EC concentrations in Beijing were higher than those in Athens, Greece (2.1 and 0.54 µg m−3); Los Angeles (2.88 and 0.56 µg m−3) and New York (2.88 and 0.63 µg m−3), USA; Paris, France (3.0 and 1.4 µg m−3); Seoul, South Korea (4.1 and 1.6 µg m−3); Tokyo, Japan (2.2 and 0.6 µg m−3); and Toronto, Canada (3.39 and 0.5 µg m−3). That is because clean energy has been widely used and strict control measures are taken to improve the air quality step by step in developed countries. Of the megacities in the developing countries, OC and EC concentrations in Beijing were lower than those in most other megacities, like Mumbai and New Delhi, India, and Xi'an and Tianjin, China, but close to those in Shanghai and Hong Kong, China, and higher than those in Lhasa, China. These differences/similarities indicate that OC and EC gradually declined in Beijing and that a series of measures had progressive effects. However, to further improve the air quality, more synergetic air pollution abatement measures of carbonaceous aerosols and volatile organic compound (VOC) emissions need to be performed.
Table 3OC∕EC ratios in main domestic and foreign cities.
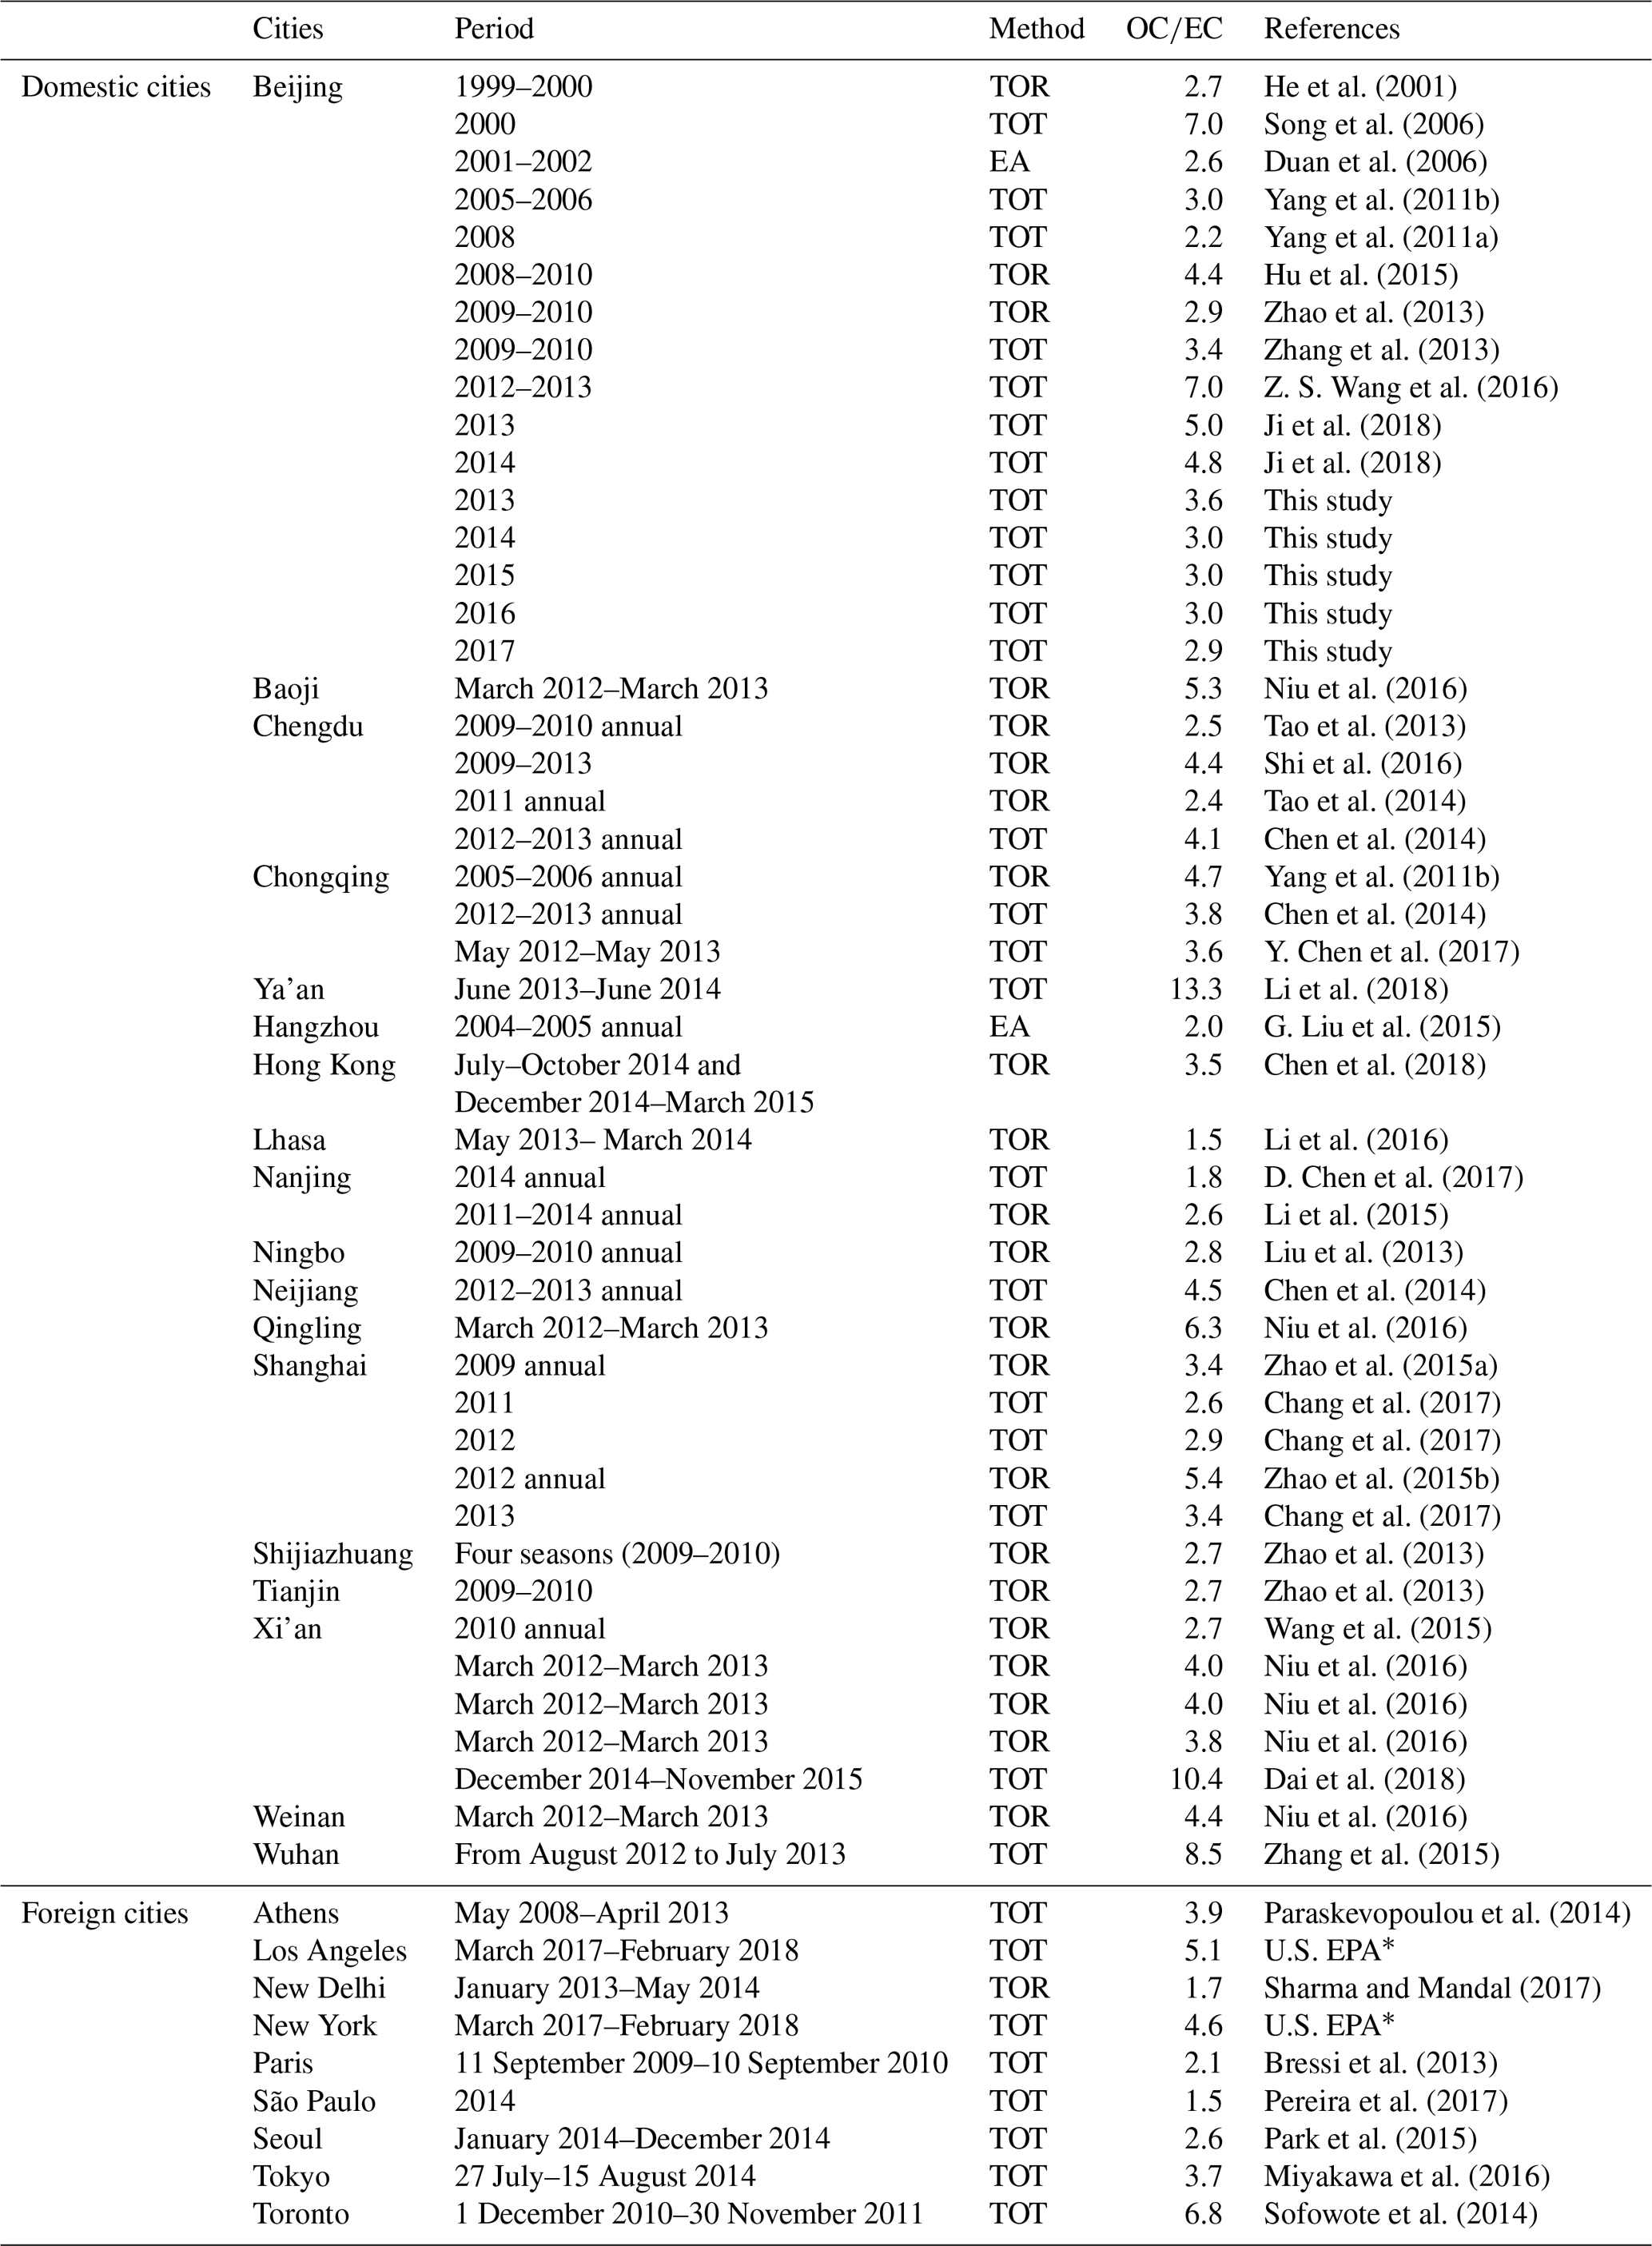
* https://aqs.epa.gov/api (last access: 26 June 2019). TOR: thermal–optical reflectance; TOT: thermal–optical transmittance; EA: elemental analysis.
Figure 2 shows the mass fractions of carbonaceous aerosols in different PM2.5 levels classified according to PM2.5 concentrations during the whole study period. There were 571, 561, 310, 169, 142, and 74 d for excellent, good, lightly polluted (LP), moderately polluted (MP), heavily polluted (HP), and severely polluted (SP) air quality levels during the whole period. The criteria used to classify the air quality were as follows: excellent, good, LP, MP, HP, and SP were based on the daily average PM2.5 concentration, i.e., excellent (0< PM2.5≤35 µg m−3), good (35< PM2.5≤75 µg m−3), lightly polluted (75< PM2.5≤115 µg m−3), moderately polluted (115< PM2.5≤150 µg m−3), heavily polluted (150< PM2.5≤250 µg m−3), and severely polluted (PM2.5>250 µg m−3), respectively. It was obvious that OC and EC concentrations increased with the degradation of air quality. OC and EC concentrations were 6.3 and 1.7, 10.2 and 2.9, 13.7 and 4.1, 17.3 and 5.3, 24.6 and 7.9, and 35.5 and 11.3 µg m−3 for excellent, good, slightly polluted, moderately polluted, heavily polluted, and severely polluted air quality days, respectively. However, the percentages of OC and EC accounting for PM2.5 decreased with the deterioration of air quality. OC and EC made up 31.5 % and 8.3 %, 18.9 % and 5.4 %, 14.7 % and 4.4 %, 13.4 % and 4.1 %, 12.9 % and 4.2 %, and 11.4 % and 3.6 % during excellent, good, slightly polluted, moderately polluted, heavily polluted, and severely polluted air quality days, respectively. The percentage for OC decreased from 31.5 % to 11.4 % while that for EC decreased from 8.3 % to 3.6 % with the deterioration of air quality, indicating that PM2.5 constituents other than OC and EC contributed more to the increased PM2.5 levels. This is consistent with previous studies showing that secondary inorganic ions play a more important role in the increase in PM2.5 concentrations (Ji et al., 2014, 2018).

Figure 2Variation in average OC, EC, and PM2.5 concentrations (a) and in the percentages of OC, EC, and other components in PM2.5 (b) for different air quality levels.
3.2 Inter-annual variation in OC and EC
To evaluate the effect of the clean air act over a prolonged period, our OC and EC data were combined with the data of previous studies for Beijing (He et al., 2011; Zhao et al., 2013; Ji et al., 2016; Tao et al., 2017; Lang et al., 2017). As shown in Fig. 3, a decreasing trend in OC and EC concentrations is, on the whole, observed. Table S2 summarizes a variety of policies and actions to reduce pollutant emissions in power plants, coal-fired boilers, residential heating, and traffic areas in Beijing since 2002. Although the gross domestic product, population, energy consumption, and vehicular population rapidly increased (Table S3), the general decreasing trends in OC and EC concentrations could be attributed to the combined effect of the more stringent traffic emission standards and traffic restriction, the energy structure evolving from intensive coal and diesel consumption to natural gas and electricity, and retrofitting with SO2 and NO2 removal facilities to meet the new emission standards applicable to different coal-fired facilities, etc. In particular, there is an obvious dividing line of OC and EC concentrations in 2010. After 2010, the OC and EC concentrations became substantially lower than those observed previously. In addition to the measures mentioned in Table S2, the relocation of Shougang Group, which is one of China's largest steel companies, and other highly polluting factories out of Beijing might have helped to some extent; all the small coal mines in Beijing were shut down and plenty of yellow label (heavily polluting) vehicles were forced off road. Note that the OC and EC levels in 2008 and 2009 were also somewhat lower, which was caused by a series of radical measures to improve the air quality for the Olympic Games in 2008 and a decline in industrial production because of China's export crash in 2009. This suggests that a stringent clean air act and improving industry standards played important roles in the air quality improvement.
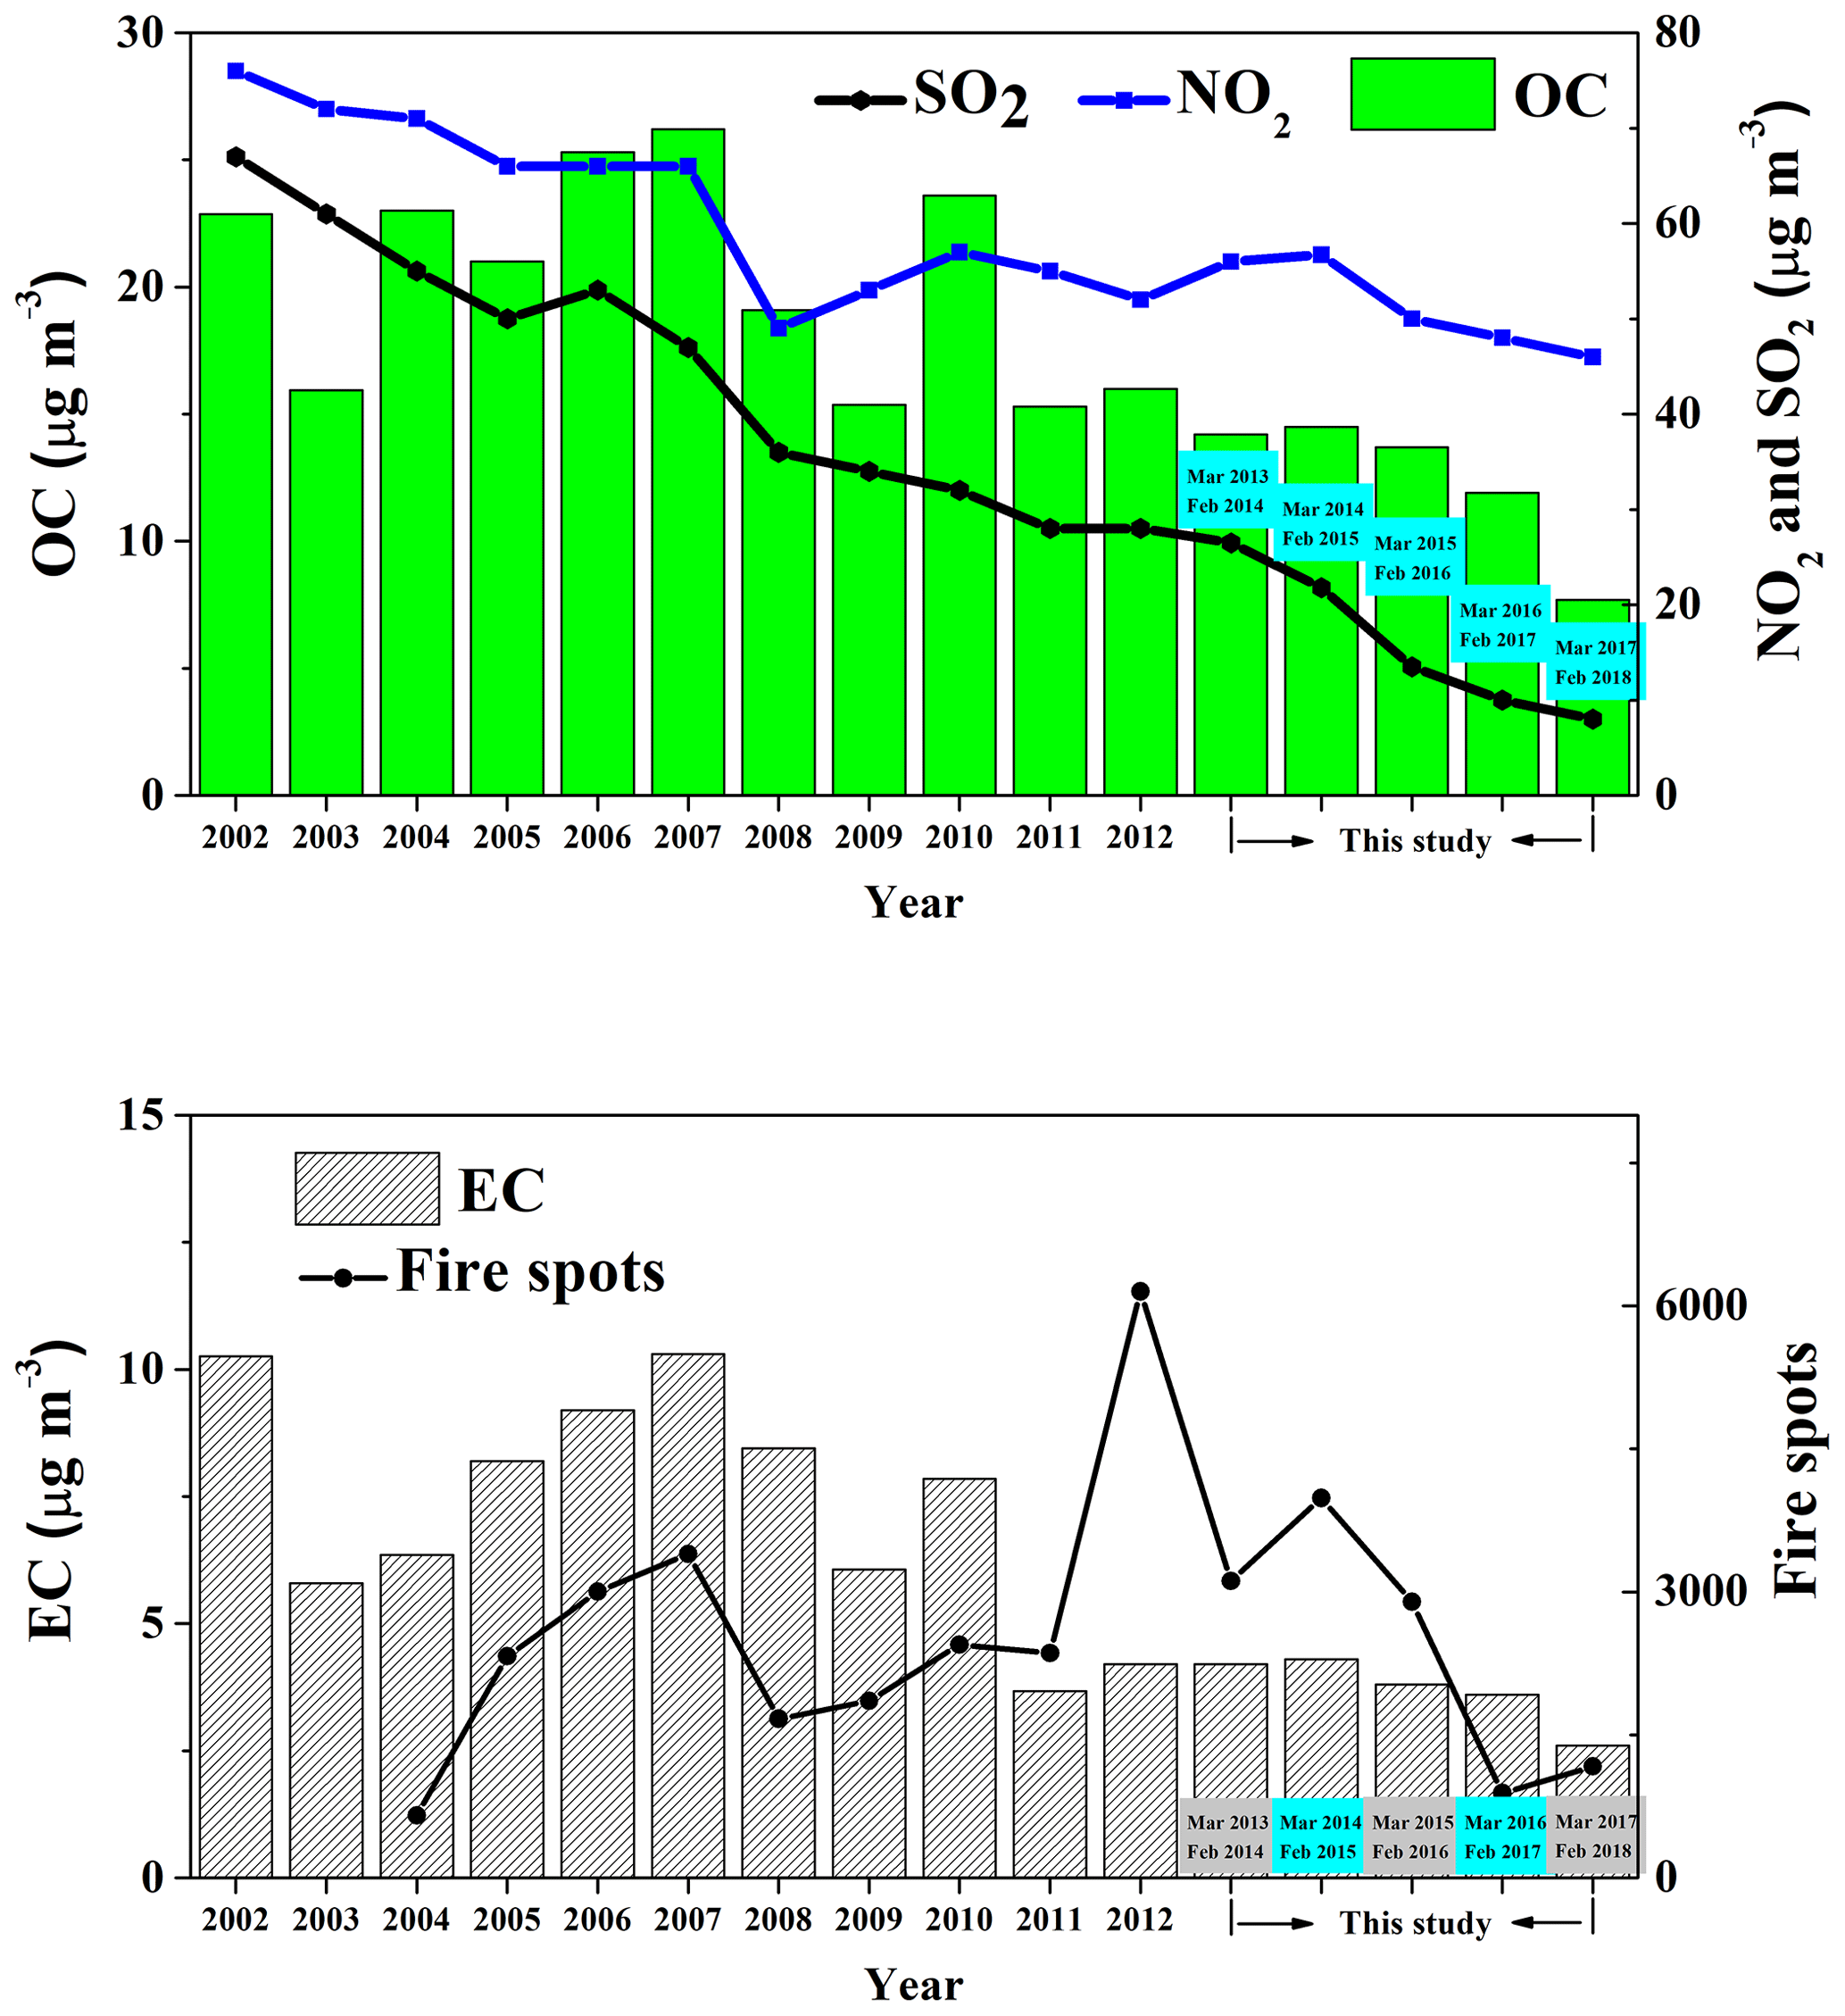
Figure 3Variation in the annual mean OC and EC concentrations in PM2.5 from 2002 to 2018 in Beijing. The variation in NO2 and SO2 concentrations and in the number of fire spots counted for the domain of (30–70∘ N, 65–150∘ E) is also shown.
In this study, the fire spots were counted in the domain of (30–70∘ N, 65–150∘ E) using the MODIS Fire Information for Resource Management System (Giglio, 2013). Note also that the effective control of biomass burning might contribute to the decrease in OC and EC concentrations. In Fig. 3, it can be seen that the annual average EC concentration and fire spot counts exhibit a rather similar variation from 2004 to 2017, except in the year 2012, which suggests that the EC levels are somewhat correlated with the biomass burning; this might indicate that biomass burning contributed somewhat to the EC levels. The reduction in fire spot counts from 2014 to 2017, which resulted from efforts to control agricultural field residue burning since 2013, helped to reduce the EC concentrations to some extent, but the low EC levels during 2014–2017 are likely mostly due to the implementation of the clean air act. With regard to the anomaly in the year 2012, based on the MODIS data for this year, a very non-uniform distribution of fire spots in the Beijing–Tianjin–Hebei (BTH) region was observed, with a distinct decrease in fire spot counts in Beijing, but higher fire spot counts in the southern Hebei Province; this may be ascribed to the fact that the policy of banning straw burning in summer and autumn was executed to different degrees in the whole region, with better implementation in the Beijing area and worse action in other parts (http://www.beijing.gov.cn/zfxxgk/110029/qtwj22/2012-12/11/content_357114.shtml, last access: 26 June 2019). In addition, for the years from 2002 to 2017, the highest precipitation volume in Beijing was recorded in 2012, i.e. 733.2 mm, and the rainy days mainly occurred in the intensive straw burning periods, accounting for 76.4 % of all rainy days in 2012. Frequent wet scavenging might have suppressed the EC concentrations during the intensive straw burning periods, so that the annual EC level for 2012 was comparable to that recorded from 2011 onward.
Similar to OC and EC, the annual mean SO2 and NO2 concentrations also showed a decreasing trend. As is well-known, SO2 originates from coal combustion and sulfur-containing oil (Seinfeld and Pandis, 1998). With the replacement of coal for industrial facilities, residential heating, and cooking by clean energy (e.g. natural gases, electricity, and lower sulfur content in oil), a clear decline in annual SO2 concentrations was observed in the Beijing area starting from 2002. Compared to SO2, the annual decreasing rate of NO2 was relatively lower. In addition to the power plants and other boilers, traffic emissions are another major source of NO2. The rapid increase in vehicle population may partly offset the great effort in reducing coal consumption to lower NO2 levels despite the transition to more stringent traffic emission standards.
3.3 Monthly and seasonal variations
Figure S1 shows the monthly mean OC and EC concentrations at our study site for the whole 5-year period. Similar variations are observed with generally higher mean OC and EC levels in the cold season (from November to February next year when the centralized urban residential heating is provided) and lower ones in the warm season (from April to October). The highest average OC and EC concentrations were 24.1±18.7 µg m−3 in December 2016 and 9.3±8.5 µg m−3 in December 2015, respectively. However, the lowest OC and EC levels were not observed in the warm months; they were 5.0±4.6 µg m−3 in January 2018 and 1.5±1.7 µg m−3 in December 2017; this was associated with both frequent occurrence of cold air mass and the implementation of a winter radical pollution control action plan (Chen and Chen, 2019) in Beijing from November 2017. Overall, the increased fuel consumption for domestic heating in addition to unfavourable meteorological conditions (lower mixing layer height, temperature inversion, and calm wind) in the colder months is considered to lead to higher OC and EC levels (Ji et al., 2014). In addition, the lower air temperature in the cold months led to shifting the gas–particle equilibrium of semi-volatile organic compounds (SVOCs) into the particle phase, leading to higher OC levels. In the cold months, the cold start of vehicles (5.64 million vehicles in Beijing at the end of 2017) also increased the emission of OC. In the warm season, lower OC and EC levels were observed, which could be attributed to the following factors: no extra energy consumed for domestic heating, strong wet scavenging by frequent precipitation occurring in these months, and more unstable atmospheric conditions favourable for pollutant dispersion; in addition, during this period, the monthly mean OC and EC concentrations generally decreased from year to year. In contrast, for the cold season, the monthly mean OC and EC concentrations did not show a clear decreasing trend from year to year. In addition to more intensive energy consumption in the cold season, the EC and OC levels could also be enhanced strongly by regional transport and stagnant meteorology, leading to ground surface accumulation in the autumn and winter (Wang et al., 2019; Yi et al., 2019); this would have counteracted the efficacy of the energy structure change in the Beijing–Tianjin–Hebei region in the past few years. It is worth pointing out that, on a year-to-year basis, the monthly average OC and EC concentrations in the cold seasons of 2017 and 2018 were generally lower than those in 2016, demonstrating to some extent the effectiveness of the execution of the radical pollution control measures for cities in the Beijing–Tianjin–Hebei region. The interquartile ranges of OC and EC in the warm months were narrower than in the cold months, indicating that there was more substantial variation in concentration in the latter months. The larger variation in the colder months could be caused by the cyclic accumulation and scavenging processes. In this region, due to these processes, the concentration of particulate matter increases rapidly when the air mass back trajectories change from the northwest and north to the southwest and south over successive days in Beijing; in contrast, the concentration of particulate matter declines sharply when a cold front causes a shift of back trajectories from the southwest and south to the north and northwest (Ji et al., 2012). The accumulation processes are closely associated with unfavourable meteorological conditions, which give rise to higher OC and EC concentrations, while more scavenging of aerosols by cold fronts leads to lower levels.
As for the seasonality in OC and EC, similar seasonal variations are observed in the various years with generally higher mean concentrations in autumn and winter and lower levels in spring and summer (Fig. 4). Remarkably, the OC and EC concentrations in the autumn and winter of 2017 were lower than those in the previous years. This was due to the combined effect of strictly controlling anthropogenic emissions and favourable meteorological conditions. Since September 2017, a series of the most stringent measures within the Action Plan on Prevention and Control of Air Pollution was implemented to improve the air quality; these measures included restricting industrial production by shutting down thousands of polluting plants, suspending the work of iron and steel plants in 28 major cities, and limiting the use of vehicles and reducing coal consumption as a heating source in northern China. In addition, air quality improvement in the autumn and winter of 2017 was closely tied to frequent cold fronts accompanied by strong winds, which was favourable for dispersing the pollutants. The average OC and EC concentrations in the winter were 1.69 and 1.14, 2.17 and 1.93, 1.49 and 2.14, 2.41 and 2.29, and 0.80 and 0.88 times higher than those in the summer for 2013, 2014, 2015, 2016, and 2017, respectively. The difference in the ratios for 2017 was due to the series of the most stringent measures taking effect and favourable meteorology. The Beijing municipal government in particular has made great efforts to replace coal with natural gases and electricity-powered facilities. In addition, “new energy vehicles” are increasingly used to replace gasoline vehicles.
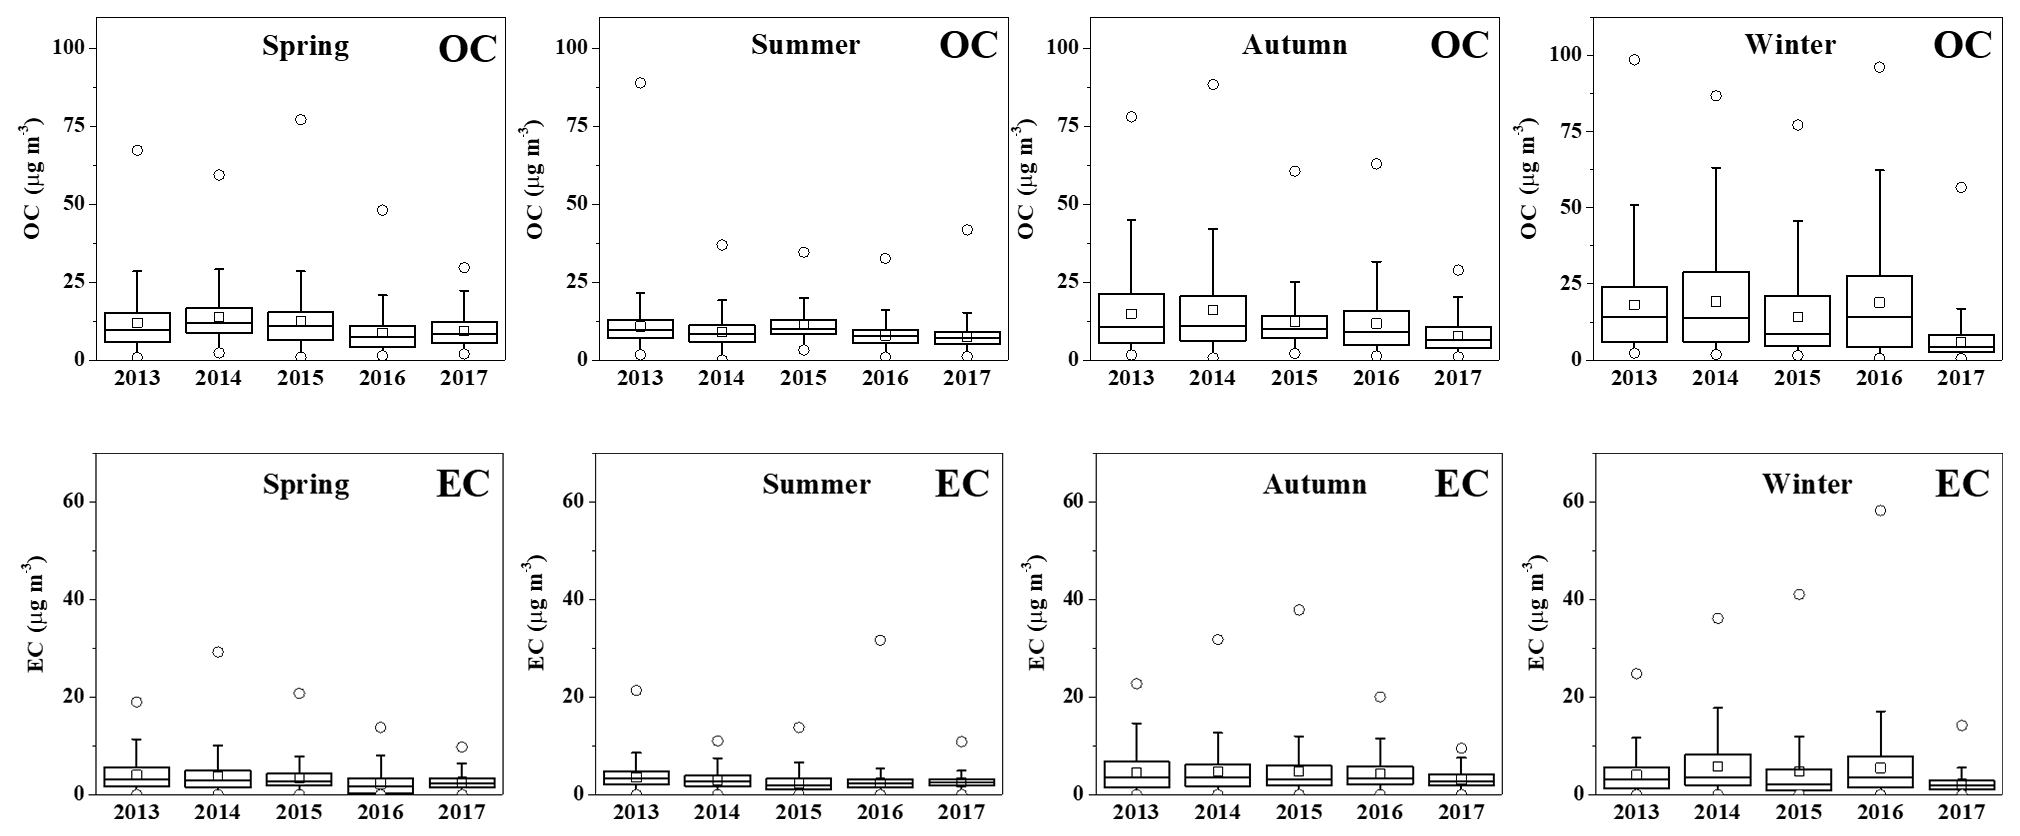
Figure 4Seasonal variations in OC and EC concentrations from March 2013 to February 2018. The mean (square in the box), median (horizontal line in the box), 25th and 75th percentiles (lower and upper ends of the box), 10th and 90th percentiles (lower and upper whiskers), and maximum and minimum (hollow circles) are shown.
3.4 Diurnal variation and weekly pattern for OC and EC
As can be seen in Figs. S2 and S3, a clear diurnal variation is observed for both OC and EC in each year. This variation is closely tied to the combined effect of diurnal variation in emission strength and evolution of the planetary boundary layer (PBL). The pattern for EC with higher concentrations in the nighttime and lower levels in the daytime (from 09:00 to 16:00) is largely linked to vehicular emissions. The EC concentrations increased starting from 17:00, corresponding with the evening rush hour, emission from nighttime heavy-duty diesel trucks (HDDTs) and heavy-duty vehicles (HDVs) and the formation of a stable nocturnal PBL. As regulated by the Beijing Traffic Management Bureau (http://www.ebeijing.gov.cn/feature_2/BeijingDrivingLicenseApplication, last access: 26 June 2019), HDVs and HDDTs are allowed to enter the urban area inside the 5th Ring Road from 00:00 to 06:00. At other times, both the higher PBL height and lower traffic intensity resulted in lower EC concentrations. The amplitude of the diurnal variation in the EC concentrations was smaller in the last 3 years. The maximum peak concentration (22:00–07:00) was 1.68, 1.62, 1.43, 1.40, and 1.40 times higher than that observed in the low period (13:00–15:00) for 2013, 2014, 2015, 2016, and 2017, respectively. Similar to EC, the diurnal pattern for OC was also characterized by higher concentrations in the nighttime (from 20:00 to 04:00) and lower levels in the daytime (from 14:00 to 16:00). However, the formation of secondary organic carbon from gas-phase oxidation of VOCs with increased solar radiation during midday gave rise to a small additional peak of OC. Like for EC, the amplitude of the diurnal variation in the OC concentrations was smaller in the last 3 years. The maximum peak concentration (19:00–03:00) was 1.47, 1.47, 1.30, 1.34, and 1.26 times higher than that observed in the low period (14:00–16:00) for 2013, 2014, 2015, 2016, and 2017, respectively. Unfortunately no diurnal variation in traffic counts is available but the hourly average traffic counts in 2015, 2016, and 2017 could be found in the Beijing Transportation Annual Report, http://www.bjtrc.org.cn/List/index/cid/7.html (last access: 26 June 2019). Considering that the hourly average traffic counts varied little in urban Beijing and they were 5969, 5934, and 6049 h−1 in 2015, 2016, and 2017, respectively, the small amplitude of the diurnal variation in the last 3 years might be related to local emission intensities; these might have been significantly affected by the enforcement of a series of traffic emission control measures since 2015, including more strict restriction of emission from heavy-duty diesel vehicles, public buses, wider usage of electric public buses, and scrappage of all the high-emitting (yellow-labelled) vehicles (Table S2). All these actions led to a decline in emissions of OC and EC and narrowed the amplitude of the diurnal variation in the EC concentration.
Separate diurnal variations in OC and EC for each season in each year are shown in Figs. S4 and S5. Similar patterns are observed in the four seasons but the difference between peak and valley levels is larger in the winter than in the other three seasons. The larger variation in the winter is due to the additional emission from residential heating and more unfavourable meteorological conditions (Ji et al., 2016).
The difference in diurnal pattern between weekdays and weekends was also examined; see Figs. S6 and S7. Similar diurnal variations are found on weekdays and weekends. The maximum peak concentration for EC (22:00–07:00) was 1.55, 1.43, 1.55, 1.51, 1.51, 1.46, and 1.59 times higher than the low concentration (13:00–15:00) for Monday, Tuesday, Wednesday, Thursday, Friday, Saturday, and Sunday, respectively, while the maximum peak concentration for OC (19:00–03:00) was 1.41, 1.32, 1.38, 1.43, 1.37, 1.31, and 1.43 times higher than the low concentration (14:00–16:00) for Monday, Tuesday, Wednesday, Thursday, Friday, Saturday, and Sunday, respectively. In contrast to previous studies (Grivas et al., 2012; Jeong et al., 2017; Chang et al., 2017), OC and EC exhibited statistically significant higher concentrations on weekends than on weekdays in this study (statistically significant based on the analysis of the weekly data using t test statistics, p<0.05). The average OC and EC concentrations on Saturday and Sunday were 13.2±11.8 and 3.9±2.7 and 12.0±10.4 and 3.7±3.6 µg m−3, respectively, whereas the average OC and EC levels during the weekdays were 11.8±10.8 and 3.6±3.5 µg m−3, respectively. This indicates that there is no significant decline in anthropogenic activity in the weekends compared to weekdays. In fact, enhanced anthropogenic emissions could be caused by no limit on driving vehicles based on license plate on weekends. The larger OC and EC concentrations on the weekend are thus mainly attributed to enhanced traffic emissions, which is consistent with higher NO2 and CO concentrations on the weekend (on average 56.6±35.9 µg m−3 for NO2 and 1.16±1.18 mg m−3 for CO on weekdays (number of samples =29 492); 57.8±37.0 µg m−3 for NO2 and 1.25±1.18 mg m−3 for CO on weekends (number of samples =11 881)).
3.5 Relationship between OC and EC and with gaseous pollutants
The relationship between particulate OC and EC is an important indicator that can give information on the origin and chemical transformation of carbonaceous aerosols (Chow et al., 1996). Primary OC and EC are mainly derived from vehicular emissions, coal combustion, biomass burning, etc. in urban areas (Bond et al., 2013). Primary OC and EC could correlate well with each other under the same meteorology. However, the correlation would become gradually less significant with the enhancement of secondary OC formation via complex chemical conversion of VOCs (gas-to-particle or heterogeneous conversion). In addition, it should be noted that EC is more stable than OC (Bond et al., 2013). Hence, the relationship between OC and EC can to some extent be used as a parameter reflecting the source types and contributions (Blando and Turpin, 2000). Figure 5 presents the regression between the OC and EC concentrations for the PM2.5 samples of the separate years 2013 to 2017. Significant correlations (R2 ranging from 0.87 to 0.66) were observed with the slopes declining from 3.6 to 2.9 throughout the study period. The significant correlations suggest that in most cases OC and EC originated from similar primary sources. The slopes are consistent with the OC∕EC ratios ranging from 2.0 to 4.0 for urban Beijing in previous studies (He et al., 2001; Dan et al., 2004; Zhao et al., 2013; Ji et al., 2016). In addition, the average OC∕EC ratios observed in this study are comparable to those observed at other urban sites with vehicular emission as a dominant source in China and foreign countries, but lower than those in cities where coal is an important source of energy (Table 3). The decline in the OC∕EC ratio may be caused by decline in coal consumption and restrictions on biomass burning. Coal combustion, biomass burning, and secondary formation give rise to higher OC∕EC ratios while vehicular emissions result in lower ratios (Cao et al., 2005).
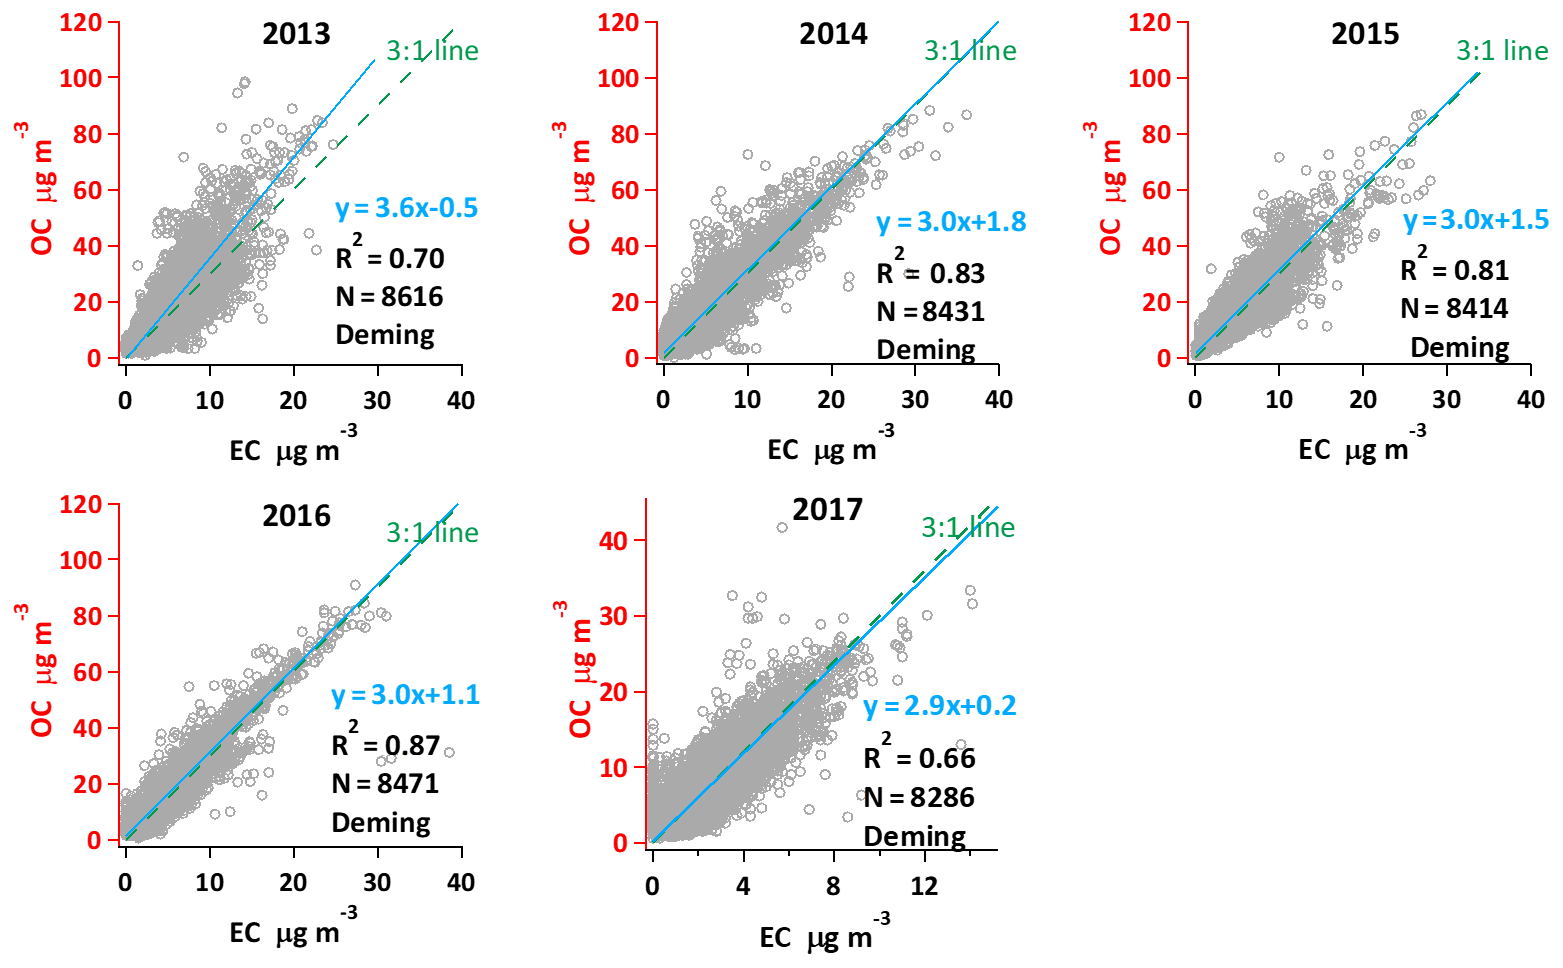
Figure 5Relationship between OC and EC using the Deming regression method from 2013 to 2017 (the dashed line indicates a OC∕EC ratio of 3:1).
EC and part of OC originate from primary anthropogenic emissions, including fossil fuel combustion and biomass burning (Bond et al., 2013), and secondary OC is formed along with ozone formation. Hence, long-term and concurrent measurement of OC, EC, SO2, NOx, CO, and O3 is helpful for understanding emission features or formation processes and for providing tests to current emission inventories. The variation in OC and EC as a function of the SO2, NOx, CO, and O3 concentration is shown in Fig. 6. There is a clear increase in OC and EC with increasing SO2, NOx, and CO, suggesting that the latter played a role in the enhancement of the former and that these various species shared common sources although they have a different lifetime. OC and EC increased, on average, by approximately 8.9 and 5.7 µg m−3, respectively, with an increase of 2 mg m−3 in CO. Considering that CO has a long lifetime (Liang et al., 2004) and that its increase depends on source strength and meteorology, high CO concentrations usually occur in the heating season when unfavourable meteorological conditions prevail. At very high CO concentrations, the increase in OC becomes slower than that in EC. This can be explained by local emissions becoming dominant because unfavourable meteorological conditions corresponding with high CO concentrations resulted in a weak exchange of air on the regional scale. The OC∕EC ratio declined at very high CO concentrations. This could be because vehicular emissions played an important role in the OC and EC loadings (Ji et al., 2019). As documented by previous studies (Schauer et al., 2002; Na et al., 2004), emission of gasoline vehicles results in an OC∕EC ratio varying from 3 to 5 while that of diesel vehicles is below 1. The above results are consistent with previous studies which showed that gasoline and diesel vehicles give rise to higher CO emissions (Wu et al., 2016).
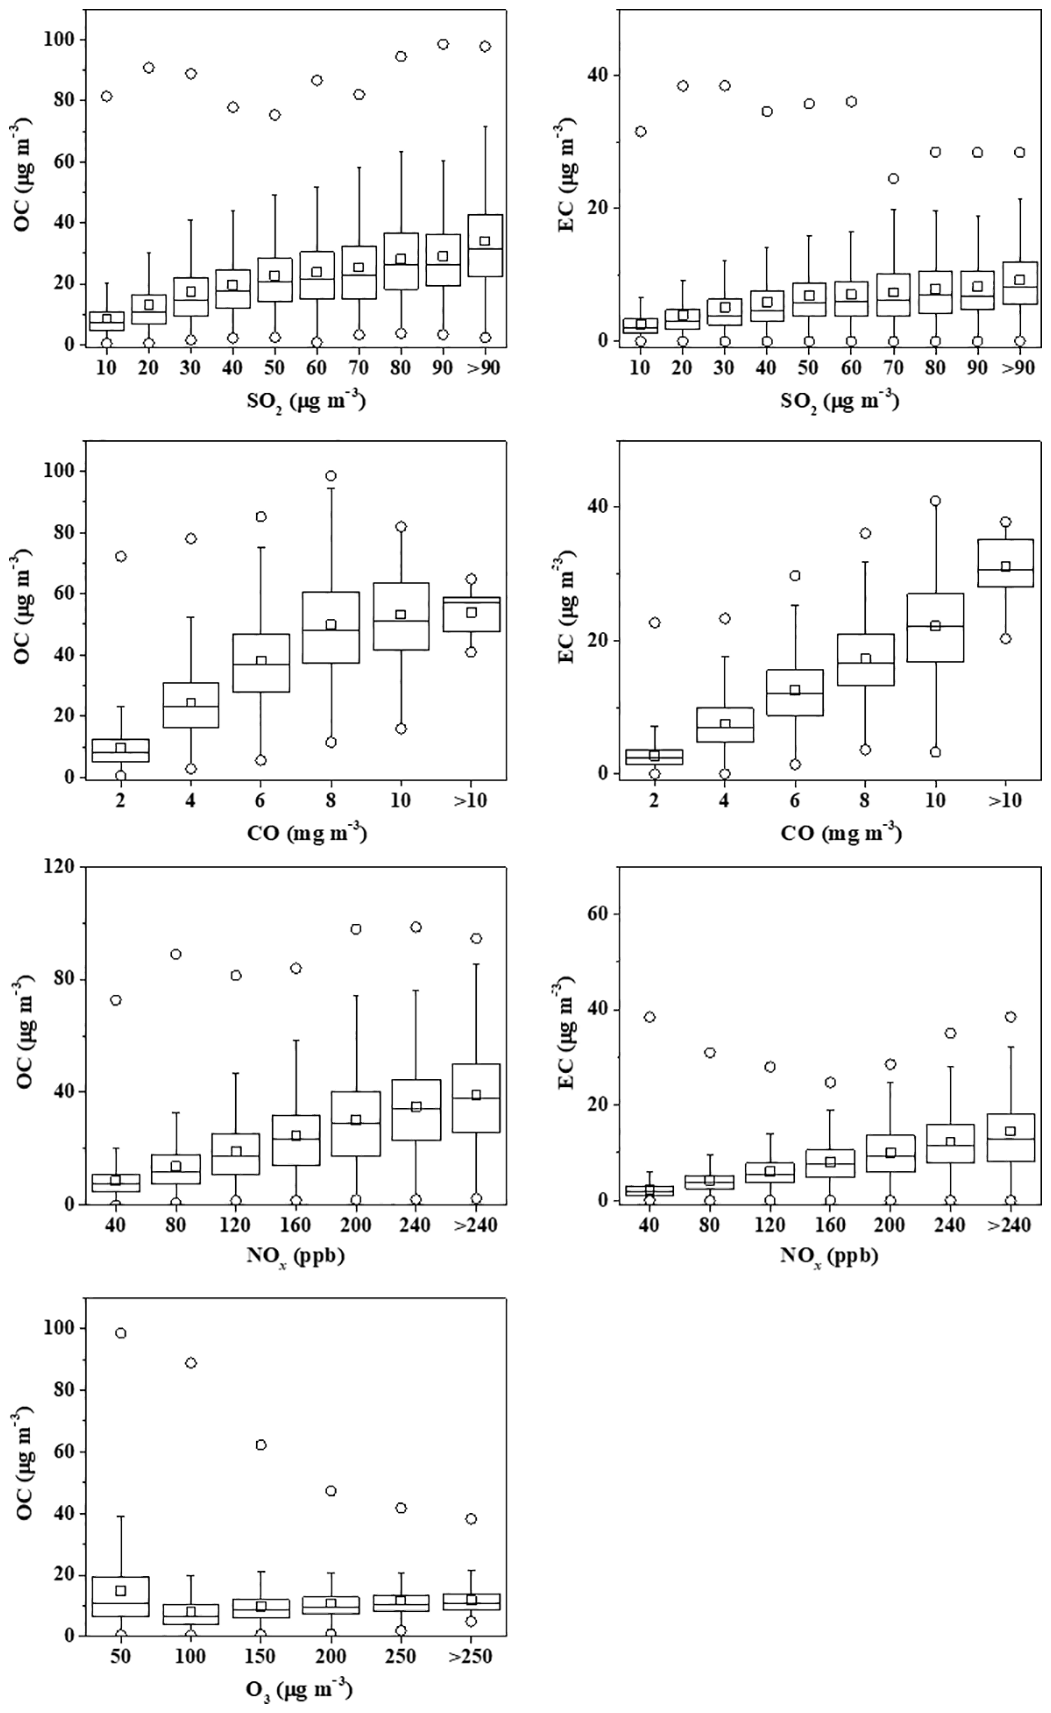
Given that NOx and CO have some common emission sources (Hassler et al., 2016), the OC and EC levels were also analysed in different intervals of NOx concentrations. Both OC and EC are enhanced with increasing NOx concentrations. Their enhancements were 5.0 and 2.1 µg m−3, respectively, for an increase in NOx concentration of 40 µg m−3. Although NOx is highly reactive and has a short lifetime (Seinfeld and Pandis, 1998) in contrast to CO, the OC∕EC ratio also declined at very high NOx concentrations, albeit to a lesser extent than was the case at very high CO concentrations. As was the case for high CO concentrations, more stable meteorological conditions and local emissions prevailed when higher concentrations of NOx were observed. In fact, 63.5 % of all NOx emissions come from vehicular emissions based on the statistical data of air pollutant emissions in Beijing (http://www.bjepb.gov.cn/bjhrb/xxgk/ywdt/zlkz/hjtj37/827051/index.html, last access: 26 June 2019).
Examining the variation in OC and EC for different intervals of SO2 concentrations allows us to further study the impacts of industrial production or coal combustion on the OC and EC levels. Similar to the relationship between CO and carbonaceous species, the OC and EC concentrations enhanced with increasing SO2 concentrations. Their enhancements were 2.8 and 0.7 µg m−3, respectively, for an increase in SO2 concentration of 10 µg m−3. An increase in the OC∕EC ratio occurred at large SO2 concentrations, suggesting that coal consumption provided a substantial contribution to the OC and EC levels in Beijing. Because oil with a low sulfur content has been widely used in Beijing since 2008 and little coal was used in the urban areas of Beijing, the SO2 mostly originated from industrial production in the surrounding areas of Beijing and from coal combustion for residential heating in the suburban and rural areas of Beijing. Previous studies also showed that a higher OC∕EC ratio is due to coal consumption and not from vehicular emissions (Cao et al., 2005). Hence, coal combustion (for industrial production) on the regional scale led to the enhancement of both the OC∕EC ratio and SO2 concentrations in Beijing via long-range transport.
Emissions of primary air pollutants lead through multiple pathways to the formation of ozone and secondary organic carbon (SOC) (Seinfeld and Pandis, 1998), both of which are the principal components of photochemical smog. The relationship between OC and O3 is of use for understanding their variation and formation. The OC concentrations were highest for an O3 concentration of 50 µg m−3, which is approximately the average O3 concentration in Beijing in winter (Cheng et al., 2018). During the period of an O3 concentration of 50 µg m−3, low atmospheric temperature (9.4±9.9 ∘C), relatively high RH (59.2±23.7 %), lower WS (1.1±0.8 m s−1), and higher NOx concentrations (72.7±57.5 ppb) were observed and a lower mixed layer height was recorded in winter (Tang et al., 2016), which were favourable for accumulation and formation of OC. A relatively lower temperature is beneficial for condensation/absorption of SVOCs into existing particles (Ji et al., 2019), which would then experience further chemical reactions to generate secondary organic aerosol (SOA). Note that a low temperature does not significantly reduce SOA formation rates (Huang et al., 2014) in the winter. In addition, processes including aqueous-phase oxidation and NO3-radical-initiated nocturnal chemistry may contribute to or even dominate SOA formation during winter (Hallquist et al., 2009; Rollins et al., 2012; Huang et al., 2014). Hence, the above factors gave rise to the higher OC concentration at an O3 concentration of 50 µg m−3, particularly in winter. In addition, scattering and absorbing effects of aerosols that were trapped in the lower mixed layer height led to less solar radiation reaching the ground and further restrained the O3 formation in the cold season (Xing et al., 2017; J. Wang et al., 2016). OC declined when O3 concentrations increased from 50 to 100 µg m−3. Usually moderate O3 concentrations accompanying lower OC concentrations are caused by increasing T (19.5±8.3 ∘C), increasing WS (2.0±1.3 m s−1), and less titration of relatively lower observed NO concentrations (6.4±14.6 ppb). It can also be seen that there was a concurrent increasing trend of OC and ozone when the O3 concentration was above 100 µg m−3, which generally occurred in the warmer season. In addition to the impact of meteorological conditions, such a trend might not be dominated by gas-to-particle partitioning of low-volatility organic compounds but by the oxidation of VOCs driven by hydroxyl radicals to generate both SOC and O3 with relatively long lifetimes (>12 h; Wood et al., 2010).
3.6 Impact of atmospheric transport on the OC and EC concentrations
Figures 7 and 8 show the results of the NWR analysis applied to 1 h PM2.5-associated OC and EC concentrations measured from 2013 and 2017 in Beijing. Figure S8 presents the gridded emissions of OC and BC for the Beijing–Tianjin–Hebei (BTH) region and China, based on emission inventories (Zheng et al., 2018). The NWR results exhibit distinct hot spots (higher concentrations) in the northeast wind sector at wind speeds of approximately 0–6 km h−1, which were closely associated with local emissions under stagnant meteorological conditions (low wind speed), as well as diffuse signals in the southwestern wind sector. The joint probability data in Figs. 7 and 8 show prevailing winds were from N to E and from S to W with wind speeds of approximately 1–6 km h−1 and of approximately 4–9 km h−1, respectively. Note further that the hot spots of OC are broader than those of EC in the graphs of estimated concentrations; this might be due to the fact that VOCs (the precursors of SOC) emitted from upwind areas at a relatively higher WS in contrast to EC, including the SW wind sector, led to an increase in OC concentrations at the receptor site while the EC concentrations slowly decreased due to dilution and deposition.
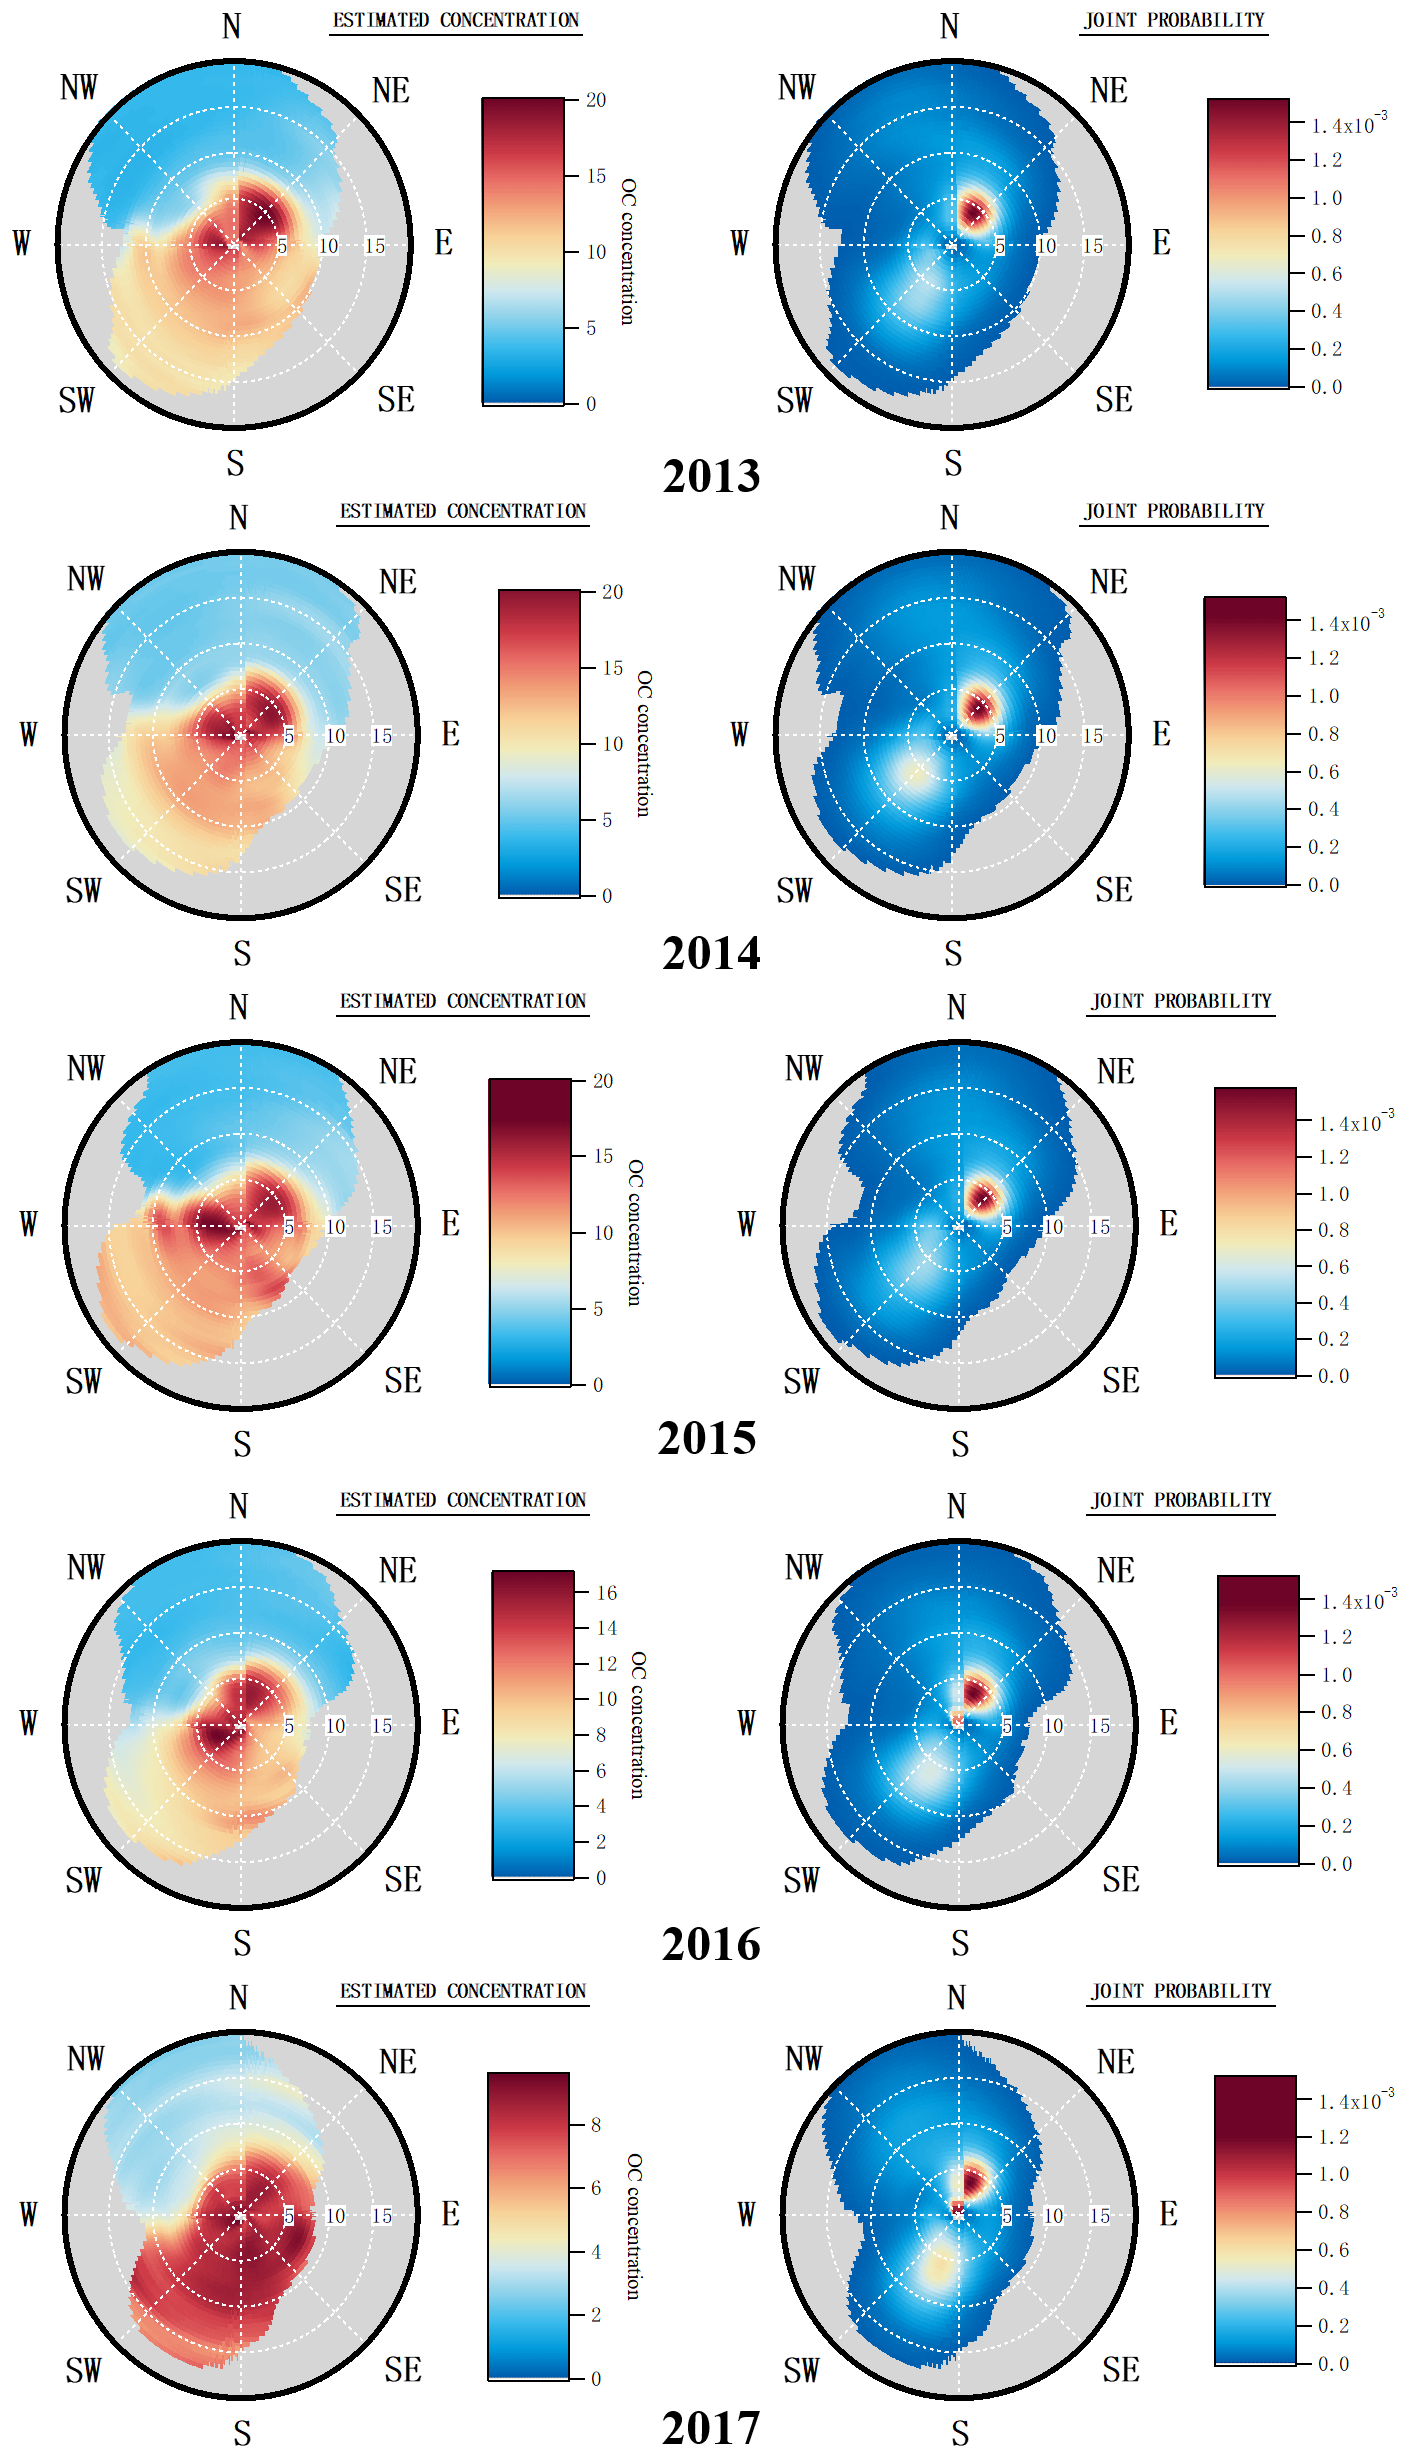
Figure 7Wind analysis results using NWR on 1 h OC concentrations measured in Beijing from 2013 to 2017 (wind speed in kilometres per hour).
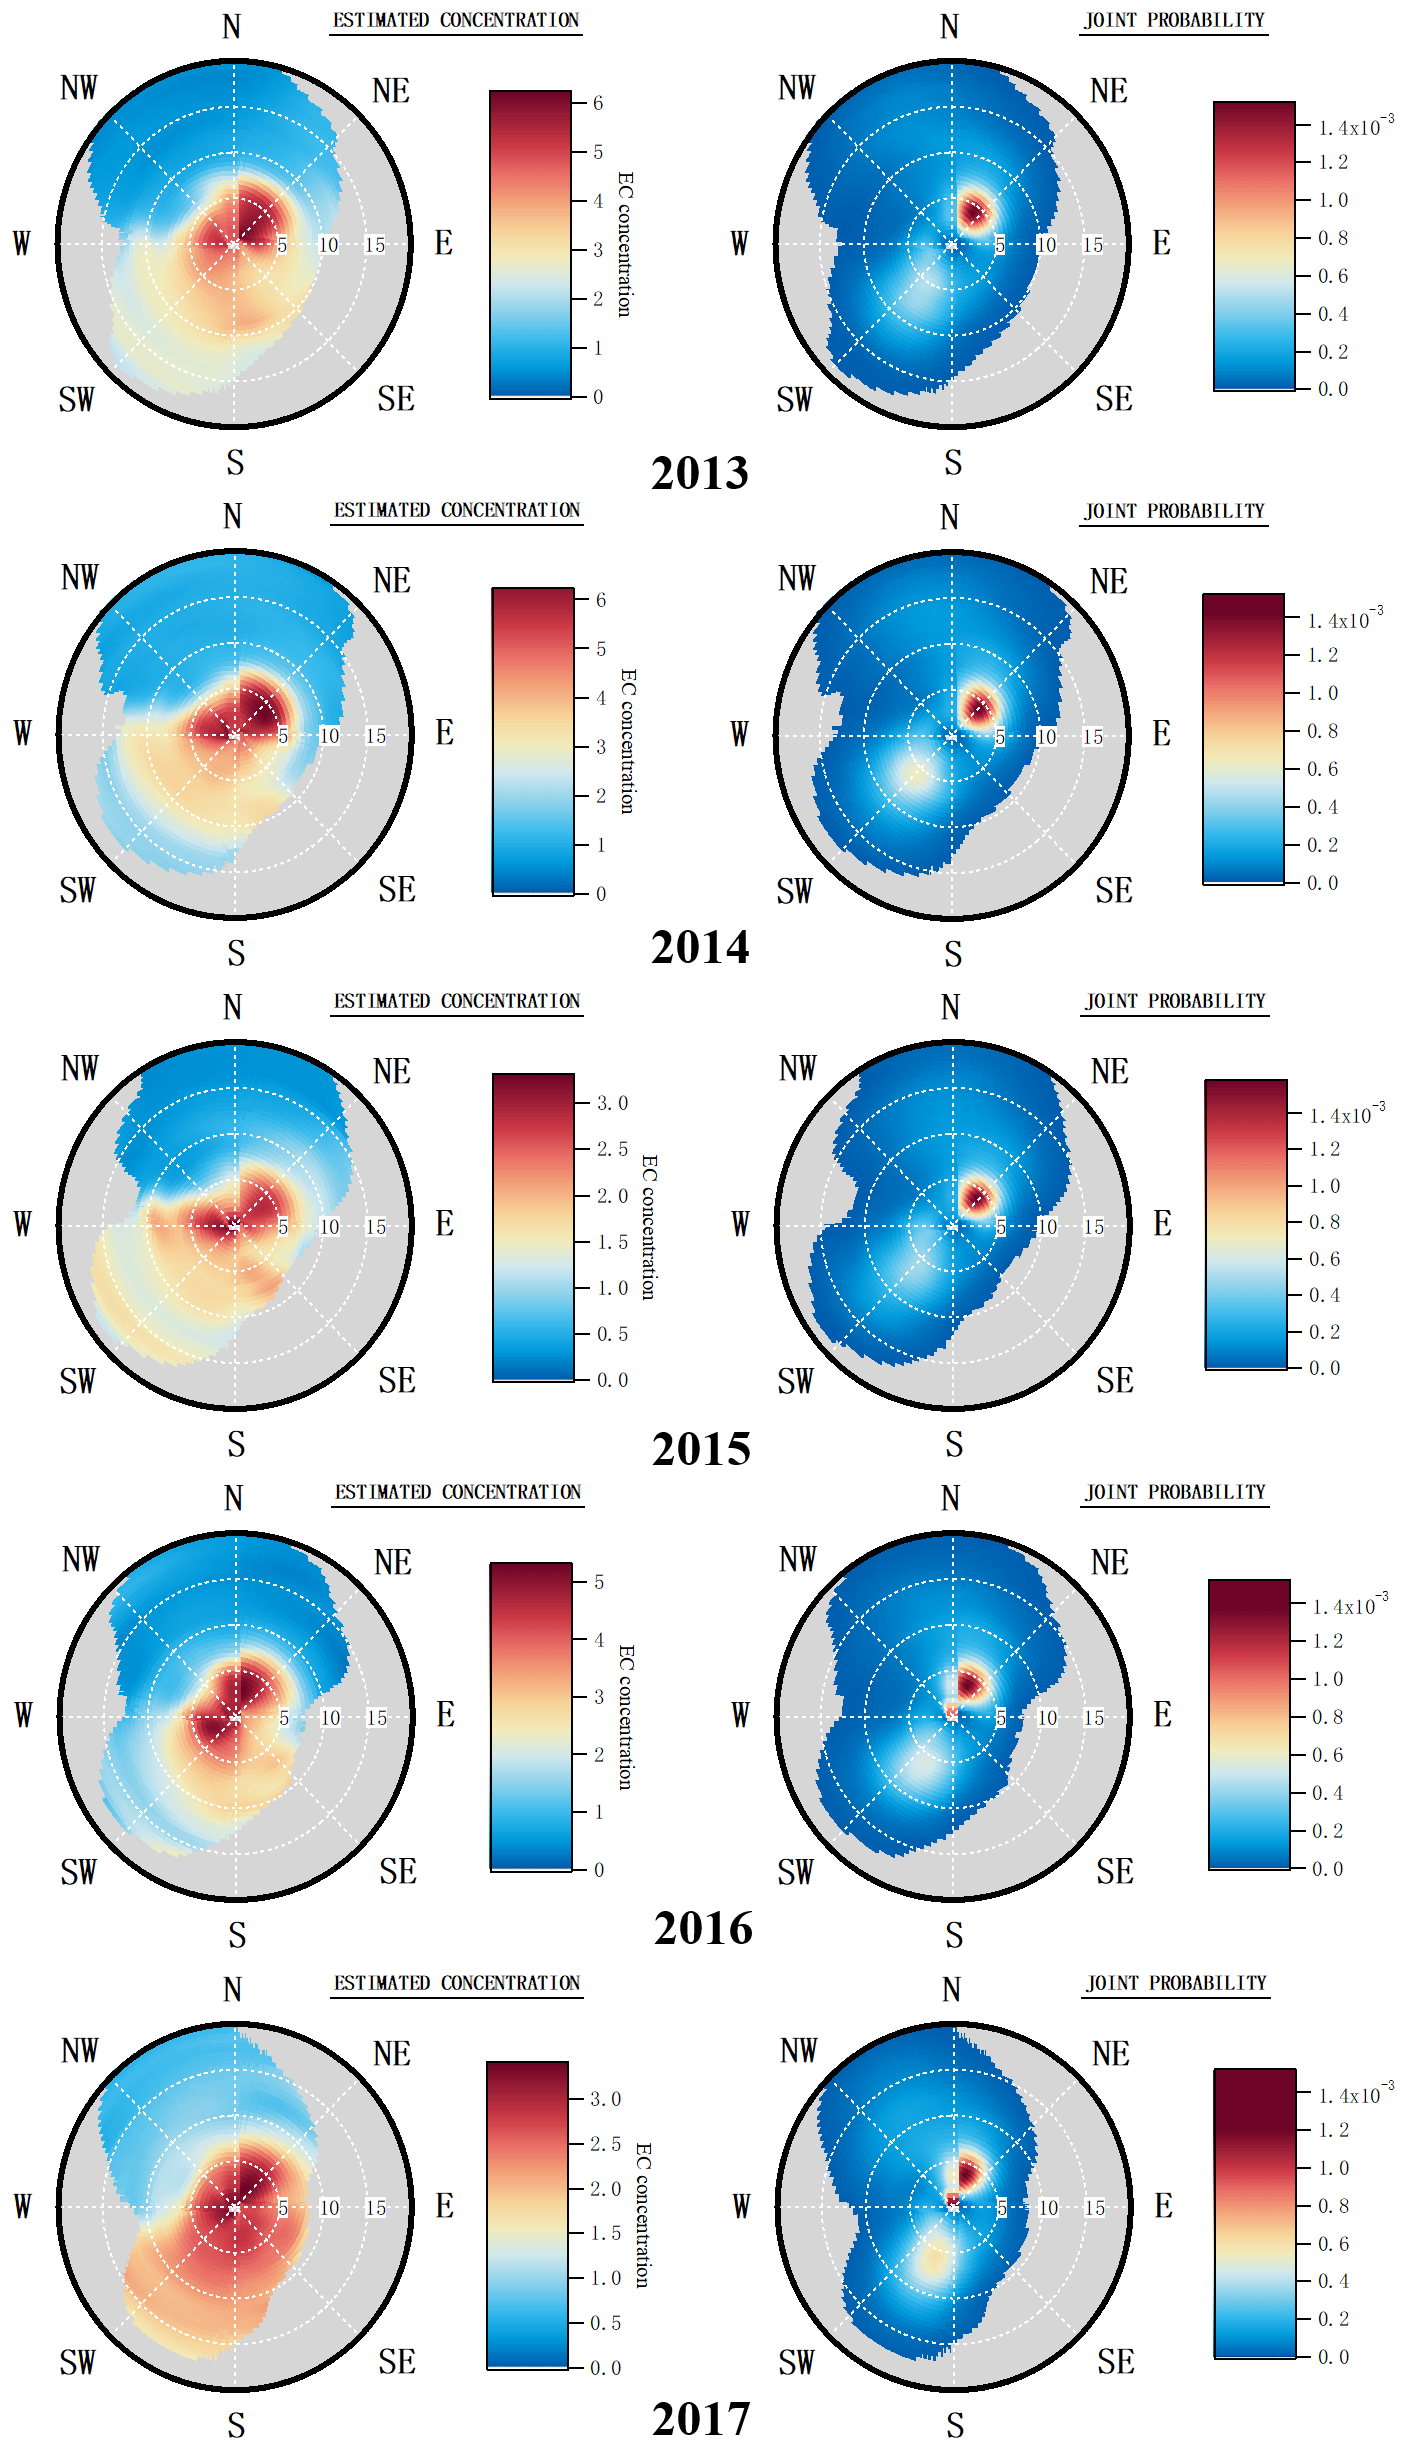
Figure 8Wind analysis results using NWR on 1 h EC concentrations measured in Beijing from 2013 to 2017.
Considering that the NWR analysis can only provide an allocation of local sources, the PSCF analysis is a helpful complement to investigate potential advection of pollution over larger geographical scales (Petit et al., 2017). Figure 9 presents the PSCF results for OC and EC for the years 2013 to 2017. Similar to the NWR analysis, the PSCF results indicated that local emissions and regional transport from southerly areas were important contributors to the OC and EC loadings during the whole study period. Only slight differences in the potential source regions are observed between the different years. In 2013, a clear high potential source area was recorded for both OC and EC; it was located in the southern plain areas of Beijing, particularly in the adjacent areas of the Hebei, Henan, Shandong, Anhui, and Jiangsu provinces. This was because there were intensified anthropogenic emissions from these provinces in 2013. The high pollutant emissions were caused by rapid economic growth, urbanization, and an increase in vehicle population, energy consumption, and industrial activity in the southern plain areas of Beijing (Zhu et al., 2018), which resulted in a high aerosol loading in the downwind areas. This result is consistent with previous studies (Ren et al., 2004; Wu et al., 2014; Ji et al., 2018). In contrast to 2013, in the years 2014 to 2017 the high potential source regions for OC and EC stretched to the juncture of Inner Mongolia and the Shaanxi and Shanxi provinces, and even to the juncture of Inner Mongolia and the Ningxia Hui Autonomous Region and Inner Mongolia and Gansu Province. This is consistent with coal power plants being abundant in the above areas (F. Liu et al., 2015). As is well-known, coal power plants are also important emitters of SO2, and those emissions were seen in satellite images (Li et al., 2017; Zhang et al., 2017), thus providing evidence for those sources. The potential source areas for OC and EC were similar in 2013 and 2014. Overall, the potential source areas were more intense for OC than for EC. The emission of OC precursors (i.e. volatile organic compounds) from the Hebei, Henan, Shandong, Anhui, Jiangsu, Shanxi, and Shaanxi provinces led to OC concentrations downwind via chemical conversion during atmospheric transport. The widest potential source areas for OC and EC were recorded in 2016 and they expanded into the eastern areas of Xinjiang Uyghur Autonomous Region. They are probably associated with the economic boom in western areas of China. In 2015, the potential source areas were, like in 2013 and 2014, also more intense for OC than for EC. Although the winter action plan was enforced in Beijing, Tianjin, and 26 surrounding cities (the so-called “2+26 cities”), whereby the industrial output was curtailed, inspections of polluting factories were ramped up and small-scale coal burning was banned at the end of 2017, there was still a clear spatial difference in emission of air pollutants, with relatively higher PM2.5 concentrations in the southern areas of Beijing. Hence, these areas still contributed substantially to OC and EC loading in Beijing.

Figure 9Potential source areas for OC and EC in Beijing from 2013 to 2017. The colour code denotes the PSCF probability. The measurement site is indicated with a red circle. The identification of the provinces is given in Fig. S9.
As found in earlier studies (Ji et al., 2018; Zhu et al., 2018), the southern areas of Beijing were main source areas. Despite the ever-stringent air pollution control measures, which are enforced in key areas of China, the economic boom in the western areas of China gave rise to substantial air pollution, and high emissions were also recorded in the adjacent areas of several provinces and the northwestern areas of China. To further improve the air quality in Beijing, strict emission restrictions should be launched in the above areas and joint control and prevention of air pollution should be enforced on the regional scale. It should be avoided that polluted enterprises, which are closed in key regions, are moved to the western areas of China or to areas where there is no supervision and control of the emission of air pollutants.
In this study, hourly mass concentrations of OC and EC in PM2.5 were semi-continuously measured from 1 March 2013 to 28 February 2018 at a study site in Beijing. The inter-annual, monthly, seasonal, and diurnal variations in OC and EC are presented, the relationship between the carbonaceous species and other pollutants was examined, and the source regions were assessed using both NWR and PSCF analysis. The impact of the air pollution control measures and of the regional transport on carbonaceous species in PM2.5 was investigated. The following main conclusions can be drawn.
-
OC and EC occupied a high fraction of the observed PM2.5 concentrations, making it a dominant contributor of PM2.5. Their concentrations increased with degrading air quality whereas their percentage in PM2.5 declined, which was consistent with previous studies showing that secondary inorganic ions played a relatively more important role in increasing PM2.5 concentrations.
-
A clear decline in OC and EC levels was observed after a series of energy policies for air pollution abatement and control had been implemented. To further improve air quality, more synergistic air pollution abatement measures of carbonaceous aerosols and VOCs emissions are needed.
-
OC and EC showed marked seasonal, monthly, weekly, and diurnal variations. The seasonal patterns were characterized by higher concentrations in the colder months (from November to February) and lower ones in the warm months (from April to October) of the various years. Because of stringent measures for air pollution abatement, the difference between the winter and summer levels decreased. The EC diurnal pattern was characterized by higher concentrations in the nighttime and lower ones in the daytime. The higher OC and EC levels during the weekend can be attributed to the traffic regulation in Beijing. The diurnal fluctuation in OC and EC was closely tied to a combined effect of change in emission sources and evolution of the PBL.
-
Significant correlations between OC and EC were observed throughout the study period, suggesting that OC and EC originated from common sources, such as vehicle exhaust, coal combustion, etc. The contribution of coal combustion and biomass burning decreased and this resulted in lower OC∕EC ratios. The OC and EC concentrations increased with higher SO2, CO, and NOx levels, while the O3 and OC concentrations increased simultaneously for O3 levels above 50 µg m−3.
-
Local emissions and regional transport played an important role in the OC and EC concentrations. Higher concentrations were observed for winds from the northeast sector at wind speeds of approximately 0–6 km h−1, but there were also diffuse signals in the southwestern wind sectors. The potential source regions of OC and EC stretched to the broader areas in northwestern and western regions where coal and coal power plants are abundant. Some slight differences in the potential source regions were observed from 2013 to 2017, which was closely associated with the economic boom in the western areas of China. In addition, the southern areas of Beijing still contributed a lot to OC and EC loading in Beijing.
In summary, this study will be helpful for improving the understanding of sources of OC and EC associated with PM2.5 and for assessing the effectiveness of local and national PM control measures. In addition, it provides valuable datasets for modelling studies and for assessing the health risk.
The data are available on request to the lead corresponding author.
The supplement related to this article is available online at: https://doi.org/10.5194/acp-19-8569-2019-supplement.
DJ, WM, and YW designed the research. DJ, WM, JH, ZW, WG, WD, YW, JX, BH, and YS performed the research. DJ, ZW, and WM analysed the data. DJ, JH, and WM wrote and edited the paper. All other authors commented on the paper.
The authors declare that they have no conflict of interest.
This article is part of the special issue “Regional transport and transformation of air pollution in eastern China”. It is not associated with a conference.
This work was supported by the National Key Research and Development Program of China (2016YFC0202701 and 2017YFC0210000), the Beijing Municipal Science and Technology projects (D17110900150000 and Z171100000617002), the CAS Key Technology Talent Program, and the National Research Program for Key Issues in Air Pollution Control (DQGG0101 and DQGG0102). The authors would like to thank all members of the LAPC/CERN in IAP, CAS, for maintaining the instruments used in the current study. We would also like to thank NOAA for providing the HYSPLIT and TrajStat models.
This research was supported by the National Key Research and Development Program of China (grant nos. 2016YFC0202701 and 2017YFC0210000), the Beijing Municipal Science and Technology projects (grant nos. D17110900150000 and Z171100000617002), the CAS Key Technology Talent Program, and the National Research Program for Key Issues in Air Pollution Control (grant nos. DQGG0101 and DQGG0102).
This paper was edited by Jianmin Chen and reviewed by three anonymous referees.
Ashbaugh, L. L., Malm, W. C., and Sadeh, W. Z.: A residence time probability analysis of sulfur concentrations at Grand Canyon National Park, Atmos. Environ., 19, 1263–1270, 1985.
Bisht, D. S., Srivastava, A. K., Pipal, A. S., Srivastava, M. K., Pandey, A. K., Tiwari, S., and Pandithurai, G.: Aerosol characteristics at a rural station in southern peninsular India during CAIPEEX-IGOC: physical and chemical properties, Environ. Sci. Pollut. R., 22, 5293–5304, 10.1007/s11356-014-3836-1, 2015.
Blando, J. and Turpin, B.: Secondary organic aerosol formation in cloud and fog droplets: a literature evaluation of plausibility, Atmos. Environ., 34, 1623–1632, 2000.
Bond, T. C., Doherty, S. J. Fahey, D. W., Forster, P. M., Berntsen, T., DeAngelo, B. J., Flanner, M. G., Ghan, S., Kärcher, B., Koch, D., Kinne, S., Kondo, Y., Quinn, P. K., Sarofim, M. C., Schultz, M. G., Schulz, M., Venkataraman, C., Zhang, H., Zhang, S., Bellouin, N., Guttikunda, S. K., Hopke, P. K., Jacobson, M. Z., Kaiser, J. W., Klimont, Z., Lohmann, U., Schwarz, J. P., Shindell, D., Storelvmo, T., Warren, S. G., and Zender, C. S.: Bounding the role of black carbon in the climate system: A scientific assessment, J. Geophys. Res.-Atmos., 118, 5380–5552, 2013.
Boström, C. E., Gerde, P., Hanberg, A., Jernström, B., Johansson, C., Kyrklund, T., Rannug, A., Torngvist, M., Victorin, K., and Westerholm, R.: Cancer risk assessment, indicators, and guidelines for polycyclic aromatic hydrocarbons in the ambient air, Environ. Health Persp., 110, 451–488, 2002.
Boucher, O., Randall, D., Artaxo, P., Bretherton, C., Feingold, G., Forster, P., Kerminen, V. M., Kondo, Y., Liao, H., Lohmann, U., Rasch, P., Satheesh, S. K., Sherwood, S., Stevens, B., and Zhang, X. Y.: Contribution of working group to the fifth assessment report of the Intergovernmental Panel on Climate Change. Clouds and aerosols, in: Climate change 2013: the physical science basis, edited by: Stocker, T. F., Qin, D., Plattner, G. K., Tignor, M., Allen, S. K., Doschung, J., Nauels, A., Xia, Y., Bex, V., and Midgley, P. M., Cambridge University Press, Cambridge, United Kingdom and New York, 616–617, 2013.
Bressi, M., Sciare, J., Ghersi, V., Bonnaire, N., Nicolas, J. B., Petit, J.-E., Moukhtar, S., Rosso, A., Mihalopoulos, N., and Féron, A.: A one-year comprehensive chemical characterisation of fine aerosol (PM2.5) at urban, suburban and rural background sites in the region of Paris (France), Atmos. Chem. Phys., 13, 7825–7844, https://doi.org/10.5194/acp-13-7825-2013, 2013.
Cao, J. J., Lee, S. C., Zhang, X. Y., Chow, J. C., An, Z. S., Ho, K. F., Watson, J. G., Fung, K., Wang, Y. Q., and Shen, Z. X.: Characterization of airborne carbonate over a site near Asian dust source regions during spring 2002 and its climatic and environmental significance, J. Geophys. Res.-Atmos., 110, D03203, https://doi.org/10.1029/2004JD005244, 2005.
Chang, Y., Deng, C., Cao, F., Cao, C., Zou, Z., Liu, S., Lee, X., Li, J., Zhang, G., and Zhang, Y.: Assessment of carbonaceous aerosols in Shanghai, China – Part 1: long-term evolution, seasonal variations, and meteorological effects, Atmos. Chem. Phys., 17, 9945–9964, https://doi.org/10.5194/acp-17-9945-2017, 2017.
Chen, D., Cui, H., Zhao, Y., Yin, L., Lu, Y., and Wang, Q.: A two-year study of carbonaceous aerosols in ambient PM2.5 at a regional background site for western Yangtze River Delta, China, Atmos. Res., 183, 351–361, 2017.
Chen, H. and Chen, W.: Potential impact of shifting coal to gas and electricity for building sectors in 28 major northern cities of China, Appl. Energ., 236, 1049–1061, 2019.
Chen, X. C., Ward, T. J., Cao, J. J., Lee, S. C., Chow, J. C., Lau, G. N. C., Yim, S. H. L., and Ho, K. F.: Determinants of personal exposure to fine particulate matter (PM2.5) in adult subjects in Hong Kong, Sci. Total Environ., 628–629, 1165–1177, https://doi.org/10.1016/j.scitotenv.2018.02.049, 2018.
Chen, Y., Xie, S., Luo, B., and Zhai, C.: Characteristics and origins of carbonaceous aerosol in the Sichuan Basin, China, Atmos. Environ., 94, 215–223, 2014.
Chen, Y., Xie, S. D., Luo, B., and Zhai, C. Z.: Particulate pollution in urban Chongqing of southwest China: Historical trends of variation, chemical characteristics and source apportionment, Sci. Total Environ., 584, 523–534, 2017.
Cheng, N., Chen, Z., Sun, F., Sun, R., Dong, X., Xie, X., and Xu, C.: Ground ozone concentrations over Beijing from 2004 to 2015: Variation patterns, indicative precursors and effects of emission reduction, Environ. Pollut., 237, 262–274, https://doi.org/10.1016/j.envpol.2018.02.051, 2018.
Chow, J. C., Watson, J. G., Lu, Z., Lowenthal, D. H., Frazier, C. A., Solomon, P. A., Thuillier, R. H., and Magliano, K.: Descriptive analysis of PM2.5 and PM10 at regionally representative locations during SJVAQS/AUSPEX, Atmos. Environ., 30, 2079–2112, https://doi.org/10.1016/1352-2310(95)00402-5, 1996.
Dai, Q. L., Bi, X. H., Liu, B. S., Li, L. W., Ding, J., Song, W. B., Bi, S. Y., Schulze, B. C., Song, C. B., Wu, J. H., Zhang, Y. F., Feng, Y. C., and Hopke, P. K.: Chemical nature of PM2.5 and PM10 in Xi'an, China: Insights into primary emissions and secondary particle formation, Environ. Pollut., 240, 155–166, 2018.
Dan, M., Zhuang, G., Li, X., Tao, H., and Zhuang, Y.: The characteristics of carbonaceous species and their sources in PM2.5 in Beijing, Atmos. Environ., 38, 3443–3452, https://doi.org/10.1016/j.atmosenv.2004.02.052, 2004.
Ding, A. J., Huang, X., Nie, W., Sun, J. N., Kerminen, V. M., Petäjä, T., Su, H., Cheng, Y. F., Yang, X. Q., Wang, M. H., Chi, X. G., Wang, J. P., Virkkula, A., Guo, W. D., Yuan, J., Wang, S. Y., Zhang, R. J., Wu, Y. F., Song, Y., Zhu, T., Zilitinkevich, S., Kulmala, M., and Fu, C. B.: Enhanced haze pollution by black carbon in megacities in China, Geophys. Res. Lett., 43, 2873–2879, 2016.
Duan, F., He, K., Ma, Y., Yang, F., Yu, X., Cadle, S., Chan, T., and Mulawa, P.: Concentration and chemical characteristics of PM2.5 in Beijing, China: 2001–2002, Sci. Total Environ., 355, 264–275, 2006.
Gao, J., Woodward, A., Vardoulakis, S., Kovats, S., Wilkinson, P., Li, L., Xu, L., Li, J., Yang, J., Li, J., Cao, L., Liu, X., Wu, H., and Liu, Q.: Haze, public health and mitigation measures in China: A review of the current evidence for further policy response, Sci. Total Environ., 578, 148–157, https://doi.org/10.1016/j.scitotenv.2016.10.231, 2017.
Giglio, L.: MODIS Collection 5 Active Fire Product User's Guide Version 2.5, available at: http://earthdata.nasa.gov/files/MODIS_Fire_Users_Guide_2.5.pdf (last access: 26 June 2019), 2013.
Grivas, G., Cheristanidis, S., and Chaloulakou, A.: Elemental and organic carbon in the urban environment of Athens. Seasonal and diurnal variations and estimates of secondary organic carbon, Sci. Total Environ., 414, 535–545, 2012.
Hallquist, M., Wenger, J. C., Baltensperger, U., Rudich, Y., Simpson, D., Claeys, M., Dommen, J., Donahue, N. M., George, C., Goldstein, A. H., Hamilton, J. F., Herrmann, H., Hoffmann, T., Iinuma, Y., Jang, M., Jenkin, M. E., Jimenez, J. L., Kiendler-Scharr, A., Maenhaut, W., McFiggans, G., Mentel, Th. F., Monod, A., Prévôt, A. S. H., Seinfeld, J. H., Surratt, J. D., Szmigielski, R., and Wildt, J.: The formation, properties and impact of secondary organic aerosol: current and emerging issues, Atmos. Chem. Phys., 9, 5155–5236, https://doi.org/10.5194/acp-9-5155-2009, 2009.
Hassler, B., McDonald, B. C., Frost, G. J., Borbon, A., Carslaw, D. C., Civerolo, K., Granier, C., Monks, P. S., Monks, S., Parrish, D. D., Pollack, I. B., Rosenlof, K. H., Ryerson, T. B., Schneidemesser, E., and Trainer, M.: Analysis of long-term observations of NOx and CO in megacities and application to constraining emissions inventories, Geophys. Res. Lett., 43, 9920–9930, https://doi.org/10.1002/2016GL069894, 2016.
He, K., Yang, F., Ma, Y., Zhang, Q., Yao, X., Chan, C. K., Cadle, S., Chan, T., and Mulawa, P.: The characteristics of PM2.5 in Beijing, China, Atmos. Environ., 35, 4959–4970, https://doi.org/10.1016/S1352-2310(01)00301-6, 2001.
He, K. B., Yang, F. M., Duan, F. K., and Ma, Y. L.: Atmospheric particulate matter and regional complex pollution, Science Press, Beijing, China, 310–327, 2011.
Henry, R., Norris, G. A., Vedantham, R., and Turner, J. R.: Source region identification using Kernel smoothing, Environ. Sci. Technol., 43, 4090–4097, https://doi.org/10.1021/es8011723, 2009.
Hu, G., Sun, J., Zhang, Y., Shen, X., and Yang, Y.: Chemical composition of PM2.5 based on two-year measurements at an urban site in Beijing, Aerosol Air Qual. Res., 15, 1748–1759, 2015.
Huang, R. J., Zhang, Y. L., Bozzetti, C., Ho, K. F., Cao, J. J., Han, Y. M., Dällenbach, K. R., Slowik, J. G., Platt, S. M., Canonaco, F., Zotter, P., Wolf, R., Pieber, S. M., Bruns, E. A., Crippa, M., Ciarelli, G., Piazzalunga, A., Schwikowski, M., Abbaszade, G., Schnelle-Kreis, J., Zimmermann, R., An, Z. S., Szidat, S., Baltensperger, U., EI Haddad, I., and Prévôt, A. S. H.: High secondary aerosol contribution to particulate pollution during haze events in China, Nature, 514, 218–222, 2014.
Jeong, B., Bae, M. S., Ahn, J., and Lee, J.: A study of carbonaceous aerosols measurement in metropolitan area performed during Korus-AQ 2016 campaign, J. Kor. Soc. Atmos. Environ., 33, 205–216, https://doi.org/10.5572/KOSAE.2017.33.3.205, 2017.
Ji, D., Li, L., Wang, Y., Zhang, J., Cheng, M., Sun, Y., Liu, Z. R., Wang, L. L., Tang, G. Q., Hu, B., Chao, N., Wen, T. X., and Miao, H. Y.: The heaviest particulate air-pollution episodes occurred in northern China in January, 2013: Insights gained from observation, Atmos. Environ., 92, 546–556, 2014.
Ji, D. S., Wang, Y. S., Wang, L. L., Chen, L. F., Hu, B., Tang, G. Q., Xin, J. Y., Song, T., Wen, T. X., Sun, Y., Pan, Y. P., and Liu, Z. R.: Analysis of heavy pollution episodes in selected cities of northern China, Atmos. Environ., 50, 338–348, 2012.
Ji, D. S., Zhang, J. K., He, J., Wang, X. J., Pang, B., Liu, Z. R., Wang, L. L., and Wang, Y. S.: Characteristics of atmospheric organic and elemental carbon aerosols in urban Beijing, China, Atmos. Environ., 125, 293–306, 2016.
Ji, D. S., Yan, Y. C., Wang, Z. S., He, J., Liu, B., Sun, Y., Gao, M., Li, Y., Cao, W., Cui, Y., Hu, B., Xin, J. Y., Wang, L. L., Liu, Z. R., Tang, G. Q., and Wang, Y. S.: Two-year continuous measurements of carbonaceous aerosols in urban Beijing, China: Temporal variations, characteristics and source analyses, Chemosphere, 200, 191–200, 2018.
Ji, D. S., Gao, M., Maenhaut, W., He, J., Wu, C., Cheng, L. J., Gao, W. K., Sun, Y., Sun, J. R., Xin, J. Y., Wang, L. L., and Wang, Y. S.: The carbonaceous aerosol levels still remain a challenge in the Beijing-Tianjin-Hebei region of China: Insights from continuous high temporal resolution measurements in multiple cities, Environ. Int., 126, 171–183, 2019.
Jin, Y., Andersson, H., and Zhang, S.: Air pollution control policies in China: a petrospective and prospects, Int. J. Env. Res. Pub. He., 13, 1219, https://doi.org/10.3390/ijerph13121219, 2016.
Lang, J., Zhang, Y., Zhou, Y., Cheng, S., Chen, D., Guo, X., Chen, S., Li, X. X., Xing, X. F., and Wang, H. Y.: Trends of PM2.5 and chemical composition in Beijing, 2000–2015, Aerosol Air Qual. Res., 17, 412–425, 2017.
Li, B., Zhang, J., Zhao, Y., Yuan, S., Zhao, Q., Shen, G., and Wu, H.: Seasonal variation of urban carbonaceous aerosols in a typical city Nanjing in Yangtze River Delta, China, Atmos. Environ., 106, 223–231, 2015.
Li, C., Chen, P., Kang, S., Yan, F., Hu, Z., Qu, B., and Sillanpää, M.: Concentrations and light absorption characteristics of carbonaceous aerosol in PM2.5 and PM10 of Lhasa city, the Tibetan Plateau, Atmos. Environ., 127, 340–346, https://doi.org/10.1016/j.atmosenv.2015.12.059, 2016.
Li, C., McLinden, C., Fioletov, V., Krotkov, N., Carn, S., Joiner, J., Streets, D., He, H., Ren, X., Li, Z., and Dickerson, R.: India is overtaking China as the world's largest emitter of anthropogenic sulfur dioxide, Sci. Rep., 7, 14304 https://doi.org/10.1038/s41598-017-14639-8, 2017.
Li, Y. C., Shu, M., Ho, S. S. H., Yu, J. Z., Yuan, Z. B., Liu, Z. F., Wang, X. X., and Zhao, X, Q.: Effects of chemical composition of PM2.5 on visibility in a semi-rural city of Sichuan Basin, Aerosol Air Qual. Res., 18, 957–968, 2018.
Liang, Q., Jaeglé, L., Jaffe, D. A., Weiss-Penzias, P., Heckman, A., and Snow, J. A.: Long-range transport of Asian pollution to the northeast Pacific: Seasonal variations and transport pathways of carbon monoxide, J. Geophys. Res.-Atmos., 109, D23S07, https://doi.org/10.1029/2003JD004402, 2004.
Liu, D., Li, J., Zhang, Y., Xu, Y., Liu, X., Ding, P., Shen, C., Chen, Y., Tian, C., and Zhang, G.: The use of levoglucosan and radiocarbon for source apportionment of PM2.5 carbonaceous aerosols at a background site in east China, Environ. Sci. Technol., 47, 10454–10461, https://doi.org/10.1021/es401250k, 2013.
Liu, F., Zhang, Q., Tong, D., Zheng, B., Li, M., Huo, H., and He, K. B.: High-resolution inventory of technologies, activities, and emissions of coal-fired power plants in China from 1990 to 2010, Atmos. Chem. Phys., 15, 13299–13317, https://doi.org/10.5194/acp-15-13299-2015, 2015.
Liu, G., Li, J., Wu, D., and Xu, H.: Chemical composition and source apportionment of the ambient PM2.5 in Hangzhou, China, Particuology, 18, 135–143, 2015.
Lupu, A. and Maenhaut, W.: Application and comparison of two statistical trajectory techniques for identification of source regions of atmospheric aerosol species, Atmos. Environ., 36, 5607–5618, 2002.
Lv, B., Zhang, B., and Bai, Y.: A systematic analysis of PM2.5 in Beijing and its sources from 2000 to 2012. Atmos. Environ., 124, 98–108, 2016.
Malm, W. C., Sisler, J. F., Huffman, D., Eldred, R. A., and Cahill, T. A.: Spatial and seasonal trends in particle concentration and optical extinction in the United States, J. Geophys. Res.-Atmos., 99, 1347–1370, https://doi.org/10.1029/93JD02916, 1994.
Miyakawa, T., Kanaya, Y., Komazaki, Y., Miyoshi, T., Nara, H., Takami, A., Moteki, N., Koike, M., and Kondo, Y.: Emission regulations qltered the concentrations, origin, and formation of carbonaceous aerosols in the Tokyo metropolitan area, Aerosol Air Qual. Res., 16, 1603–1614, https://doi.org/10.4209/aaqr.2015.11.0624, 2016.
Na, K., Sawant, A. A., Song, C., and Cocker, D. R.: Primary and secondary carbonaceous species in the atmosphere of Western Riverside County, California, Atmos. Environ., 38, 1345–1355, https://doi.org/10.1016/j.atmosenv.2003.11.023, 2004.
Niu, X. Y., Cao, J. J., Shen, Z. X., Ho, S. S. H., Tie, X. X., Zhao, S. Y., Xue, H. M., Zhang, T., and Huang, R. J.: PM2.5 from the Guanzhong Plain: Chemical composition and implications for emission reductions, Atmos. Environ., 147, 458–469, 2016.
Paraskevopoulou, D., Liakakou, E., Gerasopoulos, E., Theodosi, C., and Mihalopoulos, N.: Long-term characterization of organic and elemental carbon in the PM2.5 fraction: the case of Athens, Greece, Atmos. Chem. Phys., 14, 13313–13325, https://doi.org/10.5194/acp-14-13313-2014, 2014.
Park, J. S., Song, I. H., Park, S. M., Shin, H., and Hong, Y.: The characteristics and seasonal variations of OC and EC for PM2.5 in Seoul metropolitan area in 2014, J. Environ. Impact Assess., 24, 578–592, 2015.
Peltier, R. E., Weber, R. J., and Sullivan, A. P.: Investigating a liquid-based method for online organic carbon detection in atmospheric particles, Aerosol Sci. Tech., 41, 1117–1127, https://doi.org/10.1080/02786820701777465, 2007.
Pereira, G. M., Teinilä, K., Custódio, D., Gomes Santos, A., Xian, H., Hillamo, R., Alves, C. A., Bittencourt de Andrade, J., Olímpio da Rocha, G., Kumar, P., Balasubramanian, R., Andrade, M. D. F., and de Castro Vasconcellos, P.: Particulate pollutants in the Brazilian city of São Paulo: 1-year investigation for the chemical composition and source apportionment, Atmos. Chem. Phys., 17, 11943–11969, https://doi.org/10.5194/acp-17-11943-2017, 2017.
Petit, J. E., Favez, O., Albinet, A., and Canonaco, F.: A user-friendly tool for comprehensive evaluation of the geographical origins of atmospheric pollution: Wind and trajectory analyses, Environ. Modell. Softw., 88, 183–187, 2017.
Poirot, R. L. and Wishinski, P. R.: Visibility, sulfate and air mass history associated with the summertime aerosol in northern Vermont, Atmos. Environ., 20, 1457–1469, 1986.
Polissar, A. V., Hopke, P. K., and Harris, J. M.: Source regions for atmospheric aerosol measured at Barrow, Alaska, Environ. Sci. Technol., 35, 4214–4226, 2001.
Ram, K. and Sarin, M. M.: Spatio-temporal variability in atmospheric abundances of EC, OC and WSOC over Northern India, J. Aerosol Sci., 41, 88–98, https://doi.org/10.1016/j.jaerosci.2009.11.004, 2010.
Ram, K. and Sarin, M.: Carbonaceous aerosols over Northern India: sources and spatio-temporal variability, Proc. Indian Natn. Sci. Acad., 78, 523–533, 2012.
Ren, Z. H., Wan, B. T., Yu, T., Su, F. Q., Zhang, Z. G., Gao, Yang, X. X., Hu, H. L., Wu, Y. H., Hu, F., and Hong, Z. X.: Influence of weather system of different scales on pollution boundary layer and the transport in horizontal current field, Res. Environ. Sci., 17, 7–13, 2004.
Rollins, A. W., Browne, E. C., Min, K. E., Pusede, S. E., Wooldridge, P. J., Gentner, D. R., Goldstein, A. H., Liu, S., Day, D. A., Russell, L. M., and Cohen, R. C.: Evidence for NOx control over nighttime SOA formation, Science, 337, 1210–1212, 2012.
Schauer, J. J., Kleeman, M. J., Cass, G. R., and Simoneit, B. R.: Measurement of emissions from air pollution sources. 5. C1-C32 organic compounds from gasoline-powered motor vehicles, Environ. Sci. Technol., 36, 1169–1180, 2002.
Seinfeld, J. H. and Pandis, S. N.: Atmospheric chemistry and physics: from air pollution to climate change, John Wiley & Sons, 1998.
Shah, J. J., Johnson, R. L., Heyerdahl, E. K., and Huntzicker, J. J.: Carbonaceous aerosol at urban and rural sites in the United States, J. Air Pollut. Control Assoc., 36, 254–257, 1986.
Sharma, S. K. and Mandal, T. K.: Chemical composition of fine mode particulate matter (PM2.5) in an urban area of Delhi, India and its source apportionment, Urban Clim., 21, 106–122, https://doi.org/10.1016/j.uclim.2017.05.009, 2017.
Shi, G. L., Peng, X., Liu, J. Y., Tian, Y. Z., Song, D. L., Yu, H. F., Feng, Y. C., and Russell, A. G.: Quantification of long-term primary and secondary source contributions to carbonaceous aerosols, Environ. Pollut., 219, 897–905, 2016.
Sofowote, U. M., Rastogi, A. K., Debosz, J., and Hopke, P. K.: Advanced receptor modeling of near–real–time, ambient PM2.5 and its associated components collected at an urban–industrial site in Toronto, Ontario, Atmos. Pollut. Res., 5, 13–23, https://doi.org/10.5094/APR.2014.003, 2014.
Song, Y., Xie, S., Zhang, Y., Zeng, L., Salmon, L. G., and Zheng, M.: Source apportionment of PM2.5 in Beijing using principal component analysis/absolute principal component scores and UNMIX, Sci. Total Environ., 372, 278–286, 2006.
Tang, G., Zhang, J., Zhu, X., Song, T., Münkel, C., Hu, B., Schäfer, K., Liu, Z., Zhang, J., Wang, L., Xin, J., Suppan, P., and Wang, Y.: Mixing layer height and its implications for air pollution over Beijing, China, Atmos. Chem. Phys., 16, 2459–2475, https://doi.org/10.5194/acp-16-2459-2016, 2016.
Tao, J., Cheng, T., Zhang, R., Cao, J., Zhu, L., Wang, Q., Luo, L., and Zhang, L.: Chemical composition of PM2.5 at an urban site of Chengdu in southwestern China, Adv. Atmos. Sci., 30, 1070–1084, 2013.
Tao, J., Gao, J., Zhang, L., Zhang, R., Che, H., Zhang, Z., Lin, Z., Jing, J., Cao, J., and Hsu, S.-C.: PM2.5 pollution in a megacity of southwest China: source apportionment and implication, Atmos. Chem. Phys., 14, 8679–8699, https://doi.org/10.5194/acp-14-8679-2014, 2014.
Tao, J., Zhang, L., Cao, J., and Zhang, R.: A review of current knowledge concerning PM2.5 chemical composition, aerosol optical properties and their relationships across China, Atmos. Chem. Phys., 17, 9485–9518, https://doi.org/10.5194/acp-17-9485-2017, 2017.
Villalobos, A. M., Amonov, M. O., Shafer, M. M., Devi, J. J., Gupta, T., Tripathi, S. N., Rana, K. S., McKenzie, M., Bergin, M. H., and Schauer, J. J.: Source apportionment of carbonaceous fine particulate matter (PM2.5) in two contrasting cities across the Indo–Gangetic Plain, Atmos. Pollut. Res., 6, 398–405, https://doi.org/10.5094/APR.2015.044, 2015.
Wang, C., An, X., Zhang, P., Sun, Z., Cui, M., and Ma, L.: Comparing the impact of strong and weak East Asian winter monsoon on PM2.5 concentration in Beijing, Atmos. Res., 215, 165–177, 2019.
Wang, J., Allen, D. J., Pickering, K. E., Li, Z., and He, H.: Impact of aerosol direct effect on East Asian air quality during the EAST AIRE campaign, J. Geophys. Res.-Atmos., 121, 6534–6554, 2016.
Wang, L., Zhou, X., Ma, Y., Cao, Z., Wu, R., and Wang, W.: Carbonaceous aerosols over China-review of observations, emissions, and climate forcing, Environ. Sci. Pollut. Res., 23, 1671–1680, 2016.
Wang, P., Cao, J. J., Shen, Z. X., Han, Y. M., Lee, S. C., Huang, Y., Zhu, C. S., Wang, Q. Y., Xu, H. M., and Huang, R. J.: Spatial and seasonal variations of PM2.5 mass and species during 2010 in Xi'an, China, Sci. Total Environ., 508, 477–487, https://doi.org/10.1016/j.scitotenv.2014.11.007, 2015.
Wang, Y., Khalizov, A., Levy, M., and Zhang, R. Y.: New Directions: light absorbing aerosols and their atmospheric impacts, Atmos. Environ., 81, 713–715, 2013.
Wang, Y. Q., Zhang, X. Y., and Draxler, R. R.: TrajStat: GIS-based software that uses various trajectory statistical analysis methods to identify potential sources from long-term air pollution measurement data, Environ. Modell. Softw., 24, 938–939, 2009.
Wang, Z. S., Zhang, D. W., Liu, B. X., Li, Y. T., Chen, T., Sun, F., Yang, D. Y., Liang, Y. P., Chang, M., Liu, Y., and Lin, A. G.: Analysis of chemical characteristics of PM2.5 in Beijing over a 1-year period, J. Atmos. Chem., 73, 407–425, 2016.
WHO: Health effects of black carbon, available at: http://wedocs.unep.org/handle/20.500.11822/8699 (last access: 26 June 2019), 2012.
Wood, E. C., Canagaratna, M. R., Herndon, S. C., Onasch, T. B., Kolb, C. E., Worsnop, D. R., Kroll, J. H., Knighton, W. B., Seila, R., Zavala, M., Molina, L. T., DeCarlo, P. F., Jimenez, J. L., Weinheimer, A. J., Knapp, D. J., Jobson, B. T., Stutz, J., Kuster, W. C., and Williams, E. J.: Investigation of the correlation between odd oxygen and secondary organic aerosol in Mexico City and Houston, Atmos. Chem. Phys., 10, 8947–8968, https://doi.org/10.5194/acp-10-8947-2010, 2010.
Wu, C., Wu, D., and Yu, J. Z.: Quantifying black carbon light absorption enhancement with a novel statistical approach, Atmos. Chem. Phys., 18, 289–309, https://doi.org/10.5194/acp-18-289-2018, 2018.
Wu, D., Liao B. T, Wu M., Chen, H., Wang, Y., Niao, X., Gu, Y., Zhang, X., Zhao, X. J., Quan, J. N., Liu, W. D., Meng, J., and Sun, D.: The long-term trend of haze and fog days and the surface layer transport conditions under haze weather in North China, Acta Sci Circumst., 34, 1–11, 2014.
Wu, H., Zhang, Y. F., Han, S. Q., Wu, J. H., Bi, X. H., Shi, G. L., Wang, J., Yao, Q., Cai, Z. Y., Liu, J. L., and Feng, Y. C.: Vertical characteristics of PM2.5 during the heating season in Tianjin, China, Sci. Total Environ., 523, 152–160, https://doi.org/10.1016/j.scitotenv.2015.03.119, 2015.
Wu, X., Wu, Y., Zhang, S., Liu, H., Fu, L., and Hao, J.: Assessment of vehicle emission programs in China during 1998–2013: achievement, challenges and implications, Environ. Pollut., 214, 556–567, 2016.
Xing, J., Wang, J., Mathur, R., Wang, S., Sarwar, G., Pleim, J., Hogrefe, C., Zhang, Y., Jiang, J., Wong, D. C., and Hao, J.: Impacts of aerosol direct effects on tropospheric ozone through changes in atmospheric dynamics and photolysis rates, Atmos. Chem. Phys., 17, 9869–9883, https://doi.org/10.5194/acp-17-9869-2017, 2017.
Xu, J., Wang, Q., Deng, C., McNeill, V. F., Fankhauser, A., Wang, F., Zheng, X., Shen, J., Huang, K., and Zhuang, G.: Insights into the characteristics and sources of primary and secondary organic carbon: High time resolution observation in urban Shanghai, Environ. Pollut., 233, 1177–1187, https://doi.org/10.1016/j.envpol.2017.10.003, 2018.
Yang, F., He, K., Ye, B., Chen, X., Cha, L., Cadle, S. H., Chan, T., and Mulawa, P. A.: One-year record of organic and elemental carbon in fine particles in downtown Beijing and Shanghai, Atmos. Chem. Phys., 5, 1449–1457, https://doi.org/10.5194/acp-5-1449-2005, 2005.
Yang, F., Huang, L., Duan, F., Zhang, W., He, K., Ma, Y., Brook, J. R., Tan, J., Zhao, Q., and Cheng, Y.: Carbonaceous species in PM2.5 at a pair of rural/urban sites in Beijing, 2005–2008, Atmos. Chem. Phys., 11, 7893–7903, https://doi.org/10.5194/acp-11-7893-2011, 2011a.
Yang, F., Tan, J., Zhao, Q., Du, Z., He, K., Ma, Y., Duan, F., Chen, G., and Zhao, Q.: Characteristics of PM2.5 speciation in representative megacities and across China, Atmos. Chem. Phys., 11, 5207–5219, https://doi.org/10.5194/acp-11-5207-2011, 2011b.
Yi, K., Liu, J. F., Wang, X. J., Ma, J. M., Hu, J. Y., Wan, Y., Xu, J. Y., Yang H. Z., Liu, H. Z., Xiang, S. L., and Tao, S.: A combined Arctic-tropical climate pattern controlling the inter-annual climate variability of wintertime PM2.5 over the North China Plain, Environ. Pollut., 245, 607–615, 2019.
Yu, X.-Y., Cary, R. A., and Laulainen, N. S.: Primary and secondary organic carbon downwind of Mexico City, Atmos. Chem. Phys., 9, 6793–6814, https://doi.org/10.5194/acp-9-6793-2009, 2009.
Zhang, F., Zhao, J., Chen, J., Xu, Y., and Xu, L.: Pollution characteristics of organic and elemental carbon in PM2.5 in Xiamen, China, J. Environ. Sci., 23, 1342–1349, 2011.
Zhang, F., Wang, Z. W., Cheng, H. R., Lv, X. P., Gong, W., Wang, X. M., and Zhang, G.: Seasonal variations and chemical characteristics of PM2.5 in Wuhan, central China, Sci. Total Environ., 518–519, 97–105, https://doi.org/10.1016/j.scitotenv.2015.02.054, 2015.
Zhang, R., Jing, J., Tao, J., Hsu, S.-C., Wang, G., Cao, J., Lee, C. S. L., Zhu, L., Chen, Z., Zhao, Y., and Shen, Z.: Chemical characterization and source apportionment of PM2.5 in Beijing: seasonal perspective, Atmos. Chem. Phys., 13, 7053–7074, https://doi.org/10.5194/acp-13-7053-2013, 2013.
Zhang, R. Y., Khalizov, A. F., Pagels, J., Zhang, D., Xue, H., and McMurry, P. H.: Variability in morphology, hygroscopicity, and optical properties of soot aerosols during atmospheric processing, P. Natl. Acad. Sci. USA, 105, 10291–10296, 2008.
Zhang, Y., Li, C., Krotkov, N. A., Joiner, J., Fioletov, V., and McLinden, C.: Continuation of long-term global SO2 pollution monitoring from OMI to OMPS, Atmos. Meas. Tech., 10, 1495–1509, https://doi.org/10.5194/amt-10-1495-2017, 2017.
Zhang, Y., Zhang, Q., Cheng, Y., Su, H., Li, H., Li, M., Zhang, X., Ding, A., and He, K.: Amplification of light absorption of black carbon associated with air pollution, Atmos. Chem. Phys., 18, 9879–9896, https://doi.org/10.5194/acp-18-9879-2018, 2018.
Zhao, M., Huang, Z., Qiao, T., Zhang, Y., Xiu, G., and Yu, J.: Chemical characterization, the transport pathways and potential sources of PM2.5 in Shanghai: Seasonal variations, Atmos. Res., 158, 66–78, 2015a.
Zhao, M., Qiao, T., Huang, Z., Zhu, M., Xu, W., Xiu, G., Tao, J., and Lee, S.: Comparison of ionic and carbonaceous compositions of PM2.5 in 2009 and 2012 in Shanghai, China, Sci. Total Environ., 536, 695–703, 2015b.
Zhao, P., Dong, F., and Yang, Y.: Characteristics of carbonaceous aerosol in the region of Beijing, Tianjin, and Hebei, China, Atmos. Environ., 71, 389–398, 2013.
Zheng, B., Tong, D., Li, M., Liu, F., Hong, C., Geng, G., Li, H., Li, X., Peng, L., Qi, J., Yan, L., Zhang, Y., Zhao, H., Zheng, Y., He, K., and Zhang, Q.: Trends in China's anthropogenic emissions since 2010 as the consequence of clean air actions, Atmos. Chem. Phys., 18, 14095–14111, https://doi.org/10.5194/acp-18-14095-2018, 2018.
Zhu, C., Tian, H., Hao, Y., Gao, J., Hao, J., Wang, Y., Hua, S., Wang, K., and Liu, H.: A high-resolution emission inventory of anthropogenic trace elements in Beijing-Tianjin-Hebei (BTH) region of China, Atmos. Environ., 191, 452–462, https://doi.org/10.1016/j.atmosenv.2018.08.035, 2018.