the Creative Commons Attribution 4.0 License.
the Creative Commons Attribution 4.0 License.
 | 12 Jun 2019
Impacts of black carbon on the formation of advection–radiation fog during a haze pollution episode in eastern China
Qiuji Ding
Aijun Ding
Jun Zou
Xiuqun Yang
Congbin Fu
Aerosols can not only participate in fog formation by acting as condensation nuclei of droplets but also modify the meteorological conditions such as air temperature and moisture, planetary boundary layer height (PBLH) and regional circulation during haze events. The impact of aerosols on fog formation, yet to be revealed, can be critical in understanding and predicting fog–haze events. In this study, we used the Weather Research and Forecasting model coupled with Chemistry (WRF-Chem) to investigate a heavy fog event during a multiday intense haze pollution episode in early December 2013 in the Yangtze River Delta (YRD) region in eastern China. Using the WRF-Chem model, we conducted four parallel numerical experiments to evaluate the roles of aerosol–radiation interaction (ARI), aerosol–cloud interaction (ACI), black carbon (BC) and non-BC aerosols in the formation and maintenance of the heavy fog event. We find that only when the aerosols' feedback processes are considered can the model capture the haze pollution and the fog event well. And the effects of ARI during the fog–haze episode in early December 2013 played a dominant role, while the effects of ACI were negligible. Furthermore, our analyses show that BC was more important in inducing fog formation in the YRD region on 7 December than non-BC aerosols. The dome effect of BC leads to an increase in air moisture over the sea by reducing PBLH and weakening vertical mixing, thereby confining more water vapor to the near-surface layer. The strengthened daytime onshore flow by a cyclonic wind anomaly, induced by contrast temperature perturbation over land and sea, transported moister air to the YRD region, where the suppressed PBLH and weakened daytime vertical mixing maintained the high moisture level. Then heavy fog formed due to the surface cooling at night. This study highlights the importance of anthropogenic emissions in the formation of advection–radiation fog in the polluted coastal areas.
- Article
(7465 KB) - Full-text XML
-
Supplement
(3056 KB) - BibTeX
- EndNote


Fog, defined as visible water droplets or ice crystals suspended in the near-surface atmosphere (Gultepe et al., 2007), has been considered as hazardous weather that affects airline, marine transport and highway traffic (S. Niu et al., 2010). The economic loss caused by low visibility due to fog has become comparable to that of tornadoes or even hurricanes (Gultepe et al., 2007). Fog often forms in the polluted atmosphere when the air moisture is relatively high, so the relationship between aerosols and fog droplets is complex in the polluted area (Guo et al., 2015). On the one hand, aerosols can act as cloud condensation nuclei (CCN) during the activation and diffusion growth of fog droplets (Kuroiwa, 1951) and determine the properties of droplets such as its microstructure (Hudson, 1980) or chemical composition (Munger et al., 1983; Wang et al., 2011; Yang et al., 2012). On the other hand, the fog water can provide a medium for aqueous-phase reactions and transform primary pollutants into secondary aerosols (Graedel et al., 1985; Dall'Osto et al., 2009; Xie et al., 2015; Wang et al., 2016; Cheng et al., 2016). As an important removal process of aerosols, the wet scavenging effect of fog can also significantly reduce aerosol concentration in the atmosphere (Yuskiewicz et al., 1998; S. Niu et al., 2010). Thus, the interrelations between fog and aerosols are crucial for better understanding of the formation and evolution of both fog and haze pollution.
Due to intensive emission and unfavorable meteorological conditions, China has been undergoing a number of severe haze pollution events during the last two decades (Wu et al., 2005; Ding et al., 2013a; Zhao et al., 2013; Y. Zhang et al., 2016; Huang et al., 2018). Many studies investigated the responses of mesoscale circulation to the high aerosol loading during air pollution events over eastern China (Ding et al., 2013b, 2016a; J. Wang et al., 2014; H. Wang et al., 2015; Gao et al., 2015; Huang et al., 2018). Recently, black carbon (BC) has attracted a lot of attention (Bond et al., 2013), since it can significantly influence the planetary boundary layer (PBL) structure (Ding et al., 2016a; Wang et al., 2018; Huang et al., 2018). By absorbing the incident shortwave radiation and warming the atmosphere, BC can stabilize the PBL, which leads to heavy air pollution in megacities (Ding et al., 2016a; Huang et al., 2018; Wang et al., 2018) and even changes the weather such as precipitation in heavily polluted areas (Ding et al., 2013b; Huang et al., 2016). In addition to its impact on the PBL, recent studies also found BC can change the land–sea thermal contrast and weaken the East Asian winter monsoon (Lou et al., 2019), as well as large-scale circulations (Yang et al., 2019).
Meteorological conditions are important in the persistent severe fog and haze events over eastern China (Zhang et al., 2014; Y. Zhang et al., 2016). Winter fog over eastern China is typically advection–radiation fog (Lin et al., 2017). It results from the radiative cooling of moist air which is advected from any nearby large waterbody (Ryznar, 1977). Since aerosols can impact the meteorological field, such as by changing the distribution of temperature and moisture and modifying the atmospheric stratification, their influences on fog formation should not be neglected. Bott et al. (1990) pointed out that the radiative effect of absorbing aerosols can modify the structure of nocturnal PBL and favor the formation of fog in an urban environment. F. Niu et al. (2010) studied the impact of high-loading aerosols on the increase of winter fog and found that the warming effect of absorbing aerosols can promote fog formation over southern China by weakening the eastern Asian monsoon circulation and increasing the aerosol concentration. Since the dynamics and/or thermodynamics of the interaction between the atmosphere and aerosols are complex, the details about the impacts of aerosols on fog process have not been well understood yet. Eastern China has a relatively high BC emission rate and a high loading of BC (Qin and Xie, 2012; Andersson et al., 2015), which has been found to significantly influence the PBL structure and to enhance haze pollution (Ding et al., 2016a). However, the impact of BC on fog, an important PBL phenomenon in winter, has not been fully understood by existing studies.
During 1–10 December 2013, eastern China suffered from a multi-day severe haze and fog event with high PM2.5 concentrations and low visibility (Ding et al., 2016a; Sun et al., 2017). On 7 December, a heavy fog event was recorded by many meteorological stations in the Yangtze River Delta (YRD) region. In this work, we study the impacts of aerosols, especially the BC, on this fog event and the associated meteorological conditions based on numerical simulations using the Weather Research and Forecasting model coupled with Chemistry (WRF-Chem). In Sect. 2, the WRF-Chem model, observational data and experiment design are introduced. In Sect. 3, the simulation results are evaluated by observational data, the different roles of aerosol–radiation interaction (ARI), aerosol–cloud interaction (ACI), BC and non-BC aerosols in affecting the meteorological conditions and fog processes are analyzed, and the mechanism of enhanced moisture advection induced by radiative effect of BC is investigated. Section 4 provides summaries and conclusions.
2.1 WRF-Chem model and configuration
In the numerical simulation of fog, not only the accurate meteorological background conditions are needed (Gultepe et al., 2007), but also the high grid resolution and adequate representation of underlying surface are vital to resolve the physical process and patchy structure of fog (Steeneveld et al., 2015). Therefore mesoscale weather models have been extensively applied to simulate fog episodes (Shi et al., 2010; Lin et al., 2017). However, in previous studies the effects of ARI or ACI on fog are rarely considered. Hence, in this study we use the mesoscale non-hydrostatic WRF-Chem model (version 3.8.1) to investigate the heavy fog–haze event over eastern China during 1–10 December 2013. WRF-Chem is an online-coupled air quality model which can simultaneously calculate the meteorology field, the transport, mixing and chemical transformation of trace gas and aerosols and the effects of ARI and ACI (Grell et al., 2005; Fast et al., 2006; Chapman et al., 2009).
The physical and chemical parameterization schemes adopted in this study are listed in Table 1. The Morrison double-moment microphysics scheme is linked with cloud chemistry, washout of trace gases and explicit aerosol aqueous-phase chemistry (Morrison et al., 2009). The Grell 3-D cumulus scheme which allows subsidence in neighboring columns is coupled with cloud chemistry and tracer transport (Grell and Devenyi, 2002). The RRTMG radiation scheme (Iacono et al., 2008), which is linked with aerosol optical properties, is applied to both longwave and shortwave radiations. The Noah land surface scheme is used together with land-use data from the Moderate Resolution Imaging Spectroradiometer (MODIS) (Chen and Dudhia, 2001), whereby the urban surface process was simulated by the single-layer urban canopy model (UCM) (Chen et al., 2011). The PBL scheme of Mellor–Yamada–Nakanishi–Niino level 2.5 (MYNN2) (Nakanishi and Niino, 2006) is a 1.5-order and local turbulence closure scheme, which can estimate the PBL height (PBLH) according to the prognostic turbulence kinetic energy (TKE). The gas-phase mechanism of Model for Ozone And Related chemistry Tracers (MOZART) contains a detailed description of tropospheric chemistry (Emmons et al., 2010). The aerosol scheme of Model for Simulating Aerosol Interactions and Chemistry (MOSAIC) (Zaveri et al., 2008) treats major aerosol species including sulfate, sulfonate, nitrate, chloride, carbonate, ammonium, sodium, calcium, black carbon, primary organic mass and other inorganic matter. Secondary organic aerosol formation based on Lane et al. (2008) is included in MOSAIC with a volatility basis set which provides an empirical representation of the aging and volatility of the organic aerosol and its precursors. Four sectional size bins are employed to represent particle size distribution in the MOSAIC scheme, in which aerosols are assumed to be internally mixed within each bin. The photolysis rates are simulated with the Fast Tropospheric Ultraviolet–Visible (FTUV) model (Tie et al., 2003).
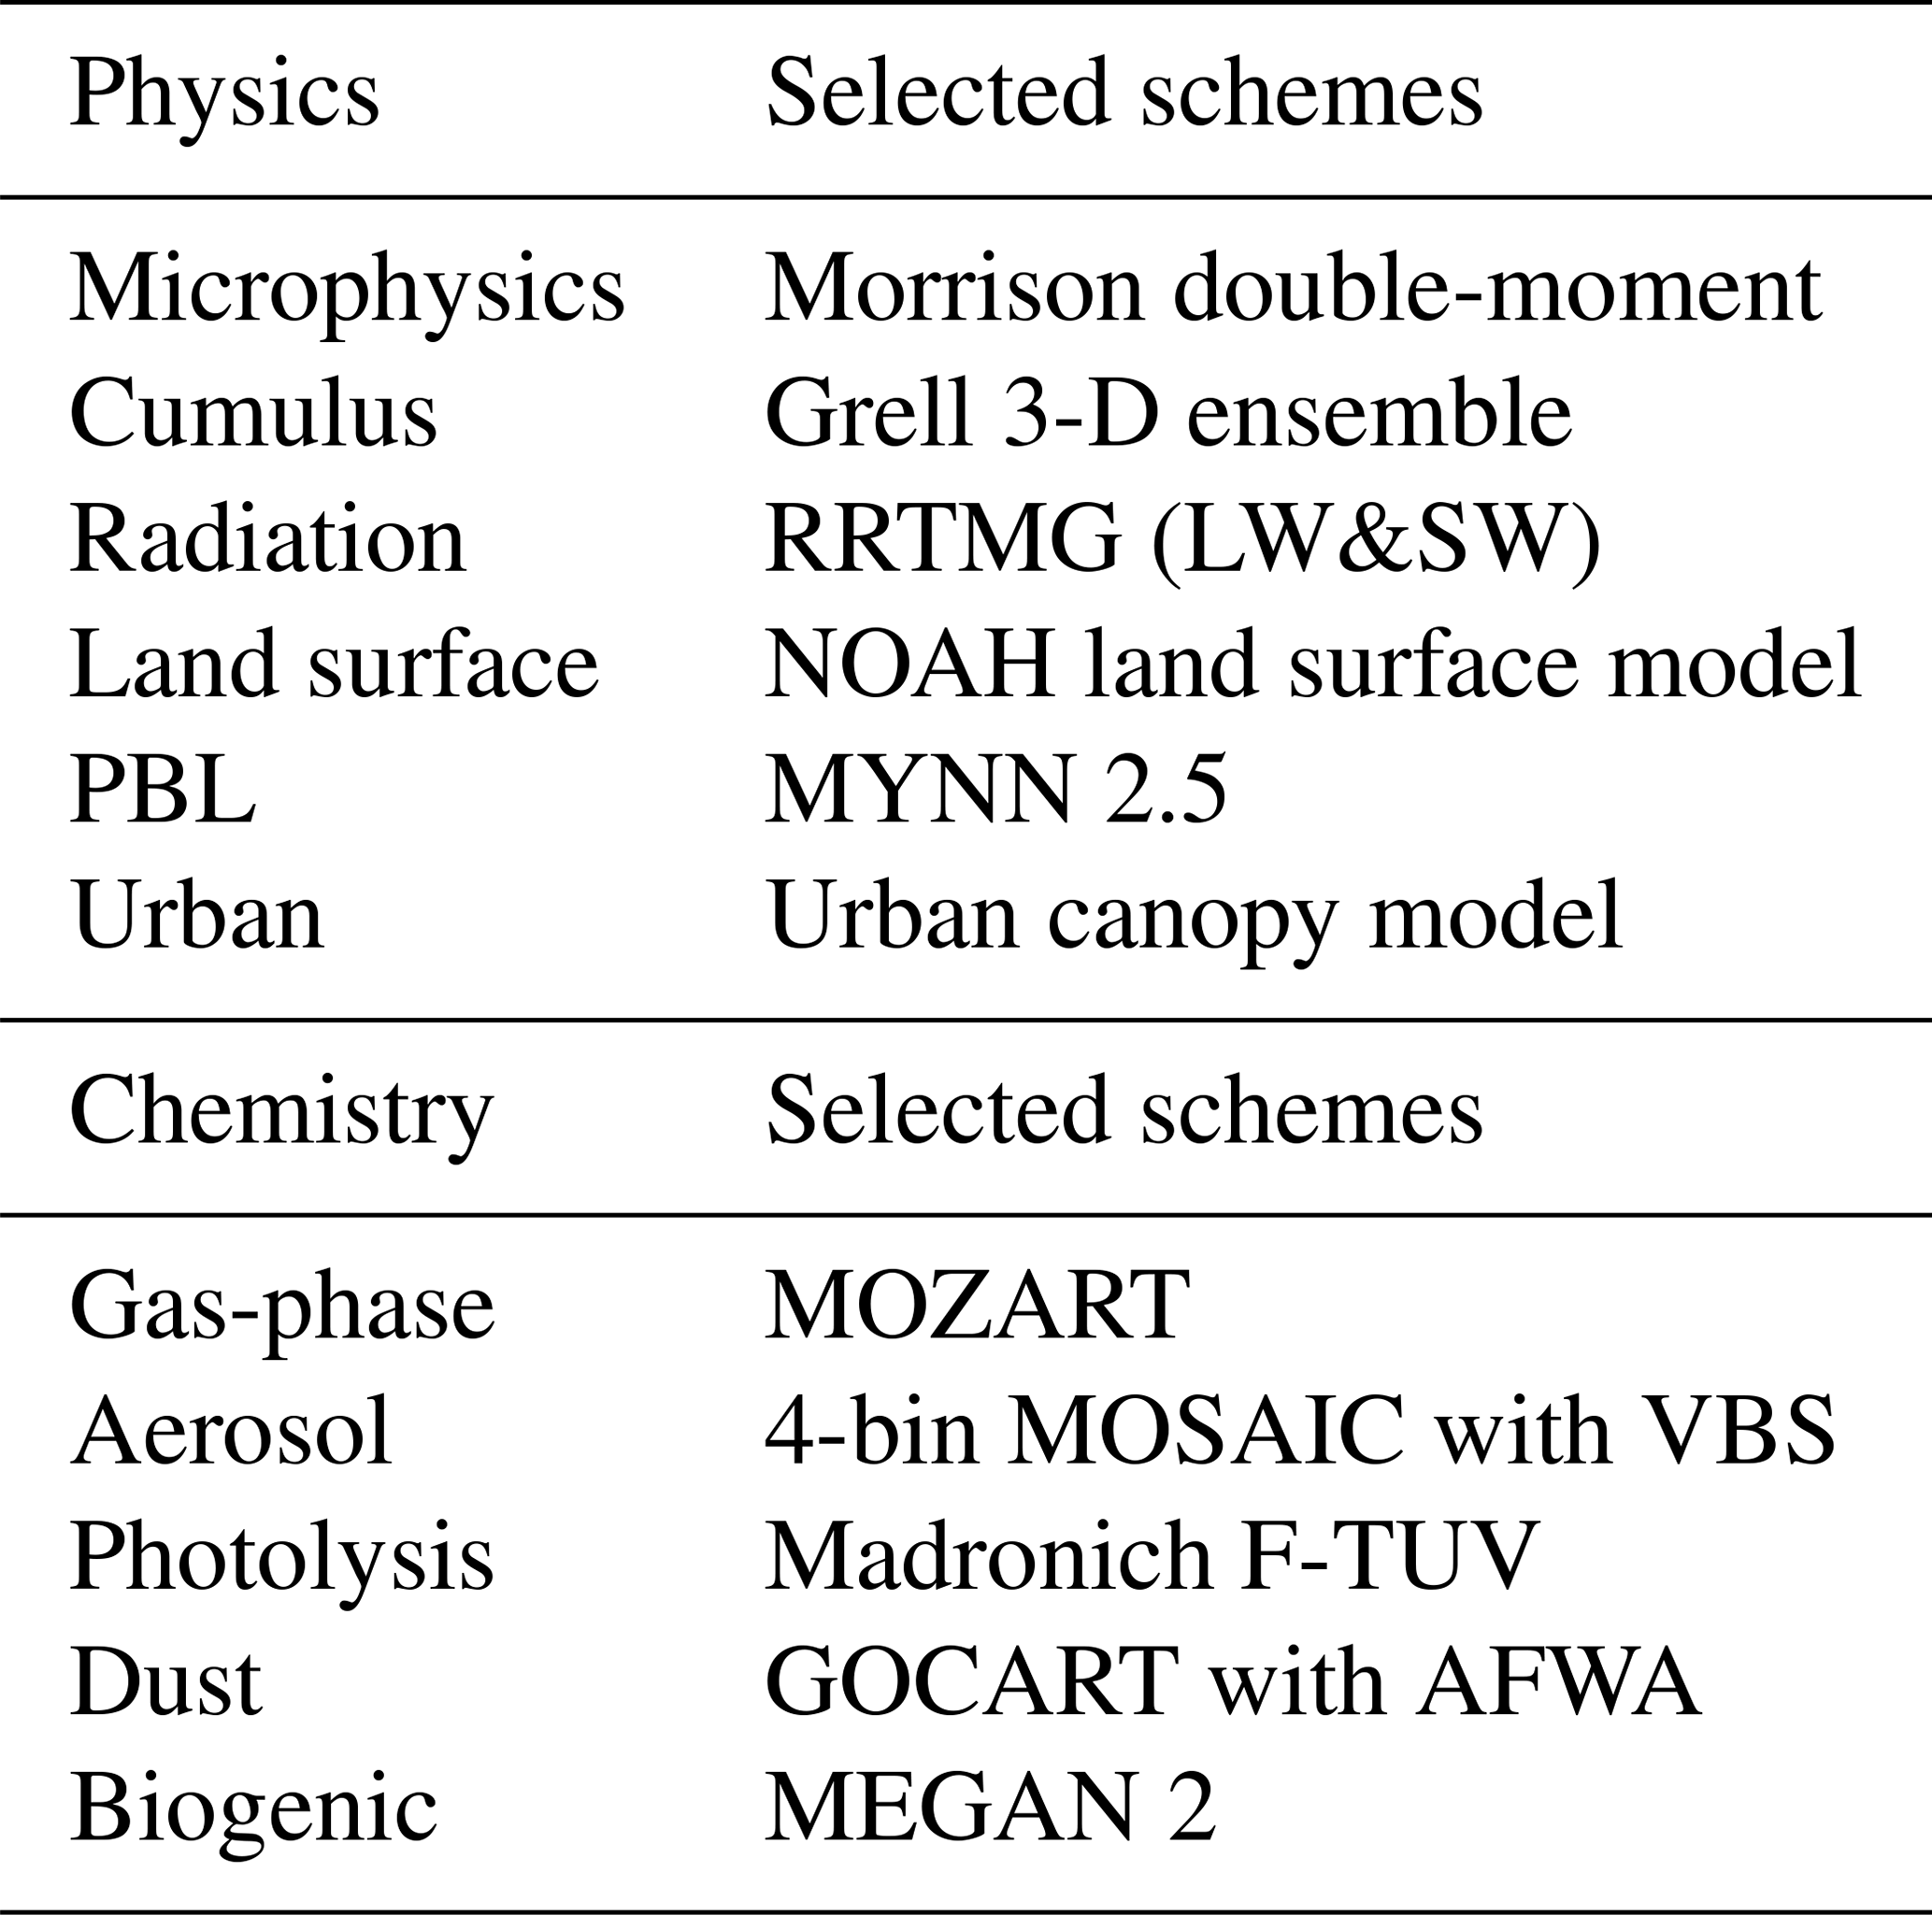
Anthropogenic emission is from the Hemispheric Transport of Air Pollution (HTAP v2.2) monthly sector-specific emission inventory for the year 2010, with 0.1∘ × 0.1∘ grid maps. Figure 1 shows the horizontal distribution of BC emission over eastern China. This dataset, which combines nationally reported emissions and regional scientific inventories, is obtained from Emission Database for Global Atmospheric Research (EDGAR) (Janssens-Maenhout et al., 2015). Biogenic emission is calculated online by Model of Emissions of Gases and Aerosol from Nature (MEGAN) (Guenther et al., 2006), while dust emission is simulated online using the Georgia Tech–Goddard Global Ozone Chemistry Aerosol Radiation and Transport (GOCART) parameterization (Zhao et al., 2010).
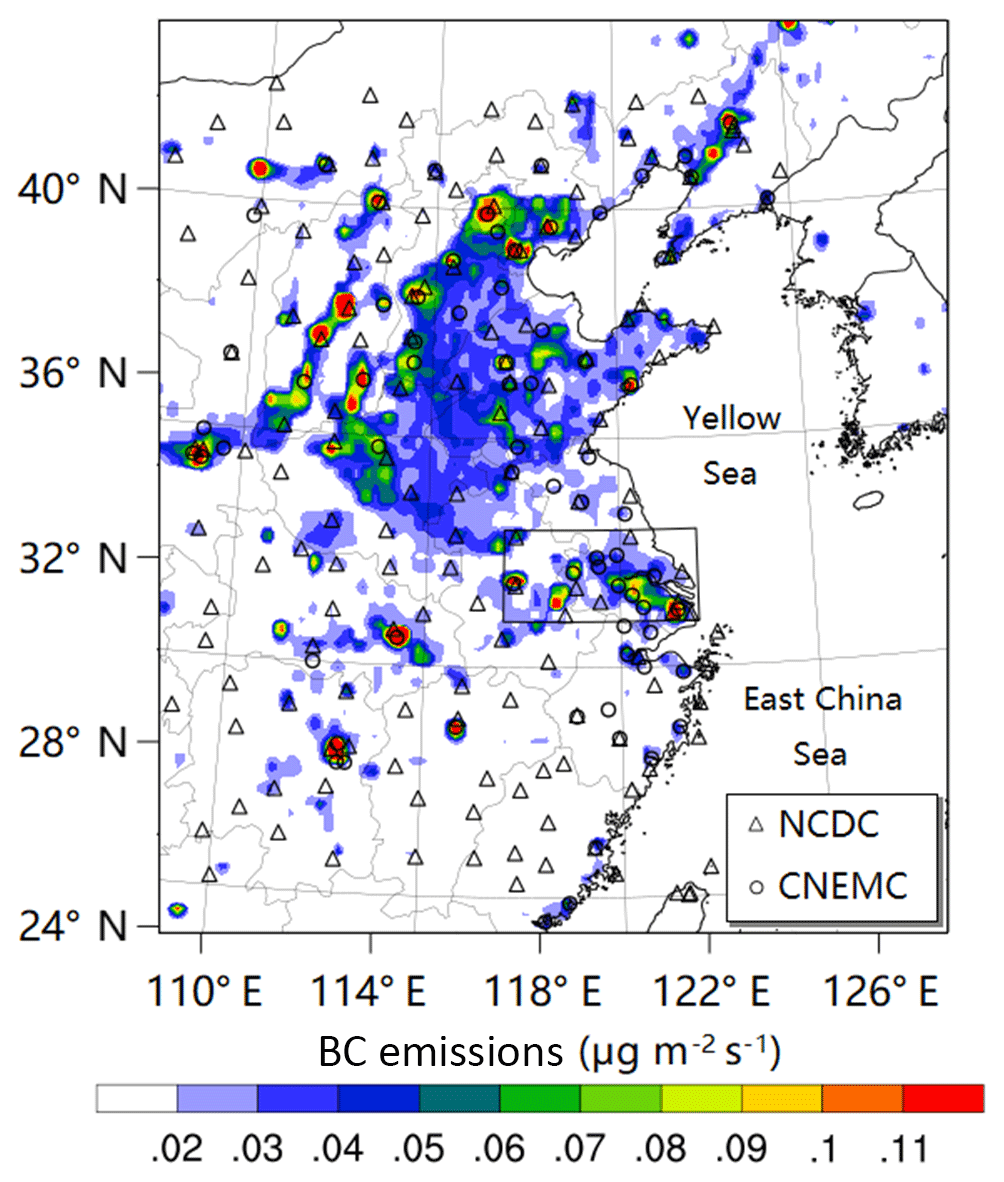
Figure 1A map showing the WRF-Chem model domain, BC emission and observation sites for meteorological parameters and air pollutants. Color-filled contours represent the BC emission from the EDGAR-HTAP dataset. The triangles represent the locations of 153 meteorological stations over eastern China from NCDC, and the circles represent the locations of the 74 cities where the pollutant observations are recorded. The rectangle denotes the YRD region.
The period of simulation is from 30 November to 10 December in 2013, with the first 24 h as the spin-up time. The simulation domain, as shown in Fig. 1, covers eastern China and the surrounding area by a horizontal resolution of 15 km. There are 26 vertical levels extending from the ground surface up to 50 hPa, with about 15 levels below the altitude of 1.5 km. The lowest level is located at approximately 60 m above the ground. The initial and boundary conditions of the meteorological field are provided by the National Centers for Environmental Prediction (NCEP) with a horizontal resolution of 1∘ × 1∘ for every 6 h. The chemical initial and boundary conditions are provided by MOZART-4 global model output at 1.9∘ × 2.5∘ for WRF-Chem (Emmons et al., 2010).
2.2 Experiment design
In WRF-Chem, ARI is simulated through coupling the aerosol optical properties with the radiation transfer calculation. The radiative properties of aerosols are estimated based on Mie theory. ACI is simulated by coupling the cloud physics and aerosol scheme. Based on Kohler theory, CCN is calculated as a function of aerosol number concentrations and updraft velocity according to the parameterization of aerosol's activation by Abdul-Razzak and Ghan (2002). Since both ARI and ACI play important roles in affecting meteorology, parallel numerical experiments were designed to quantify their individual effect. The control experiment (EXP_CTL), in which both ARI and ACI are turned on, represents the scenario including the complex physical and chemical processes between aerosols and the atmosphere. Two experiments, of which one turns off ARI (EXP_NORAD) and the other turns off both ARI and ACI (EXP_NOAER), are conducted to simulate the scenarios in absence of the aerosol radiative effect and without any aerosol effects, respectively. Thus, the difference between EXP_CTL and EXP_NORAD represents the effect of ARI (EF_ARI). The difference between EXP_NORAD and EXP_NOAER is expected to represent the effect of ACI (EF_ACI). The roles of BC and non-BC aerosols in modifying meteorological conditions can be very different and need to be treated separately. Hence, another experiment was designed to include only the scattering effect of aerosols, in which anthropogenic BC emission is removed, but both ARI and ACI are turned on (EXP_NOBC). In EXP_NOAER, we turn off the aerosol feedback to the radiation and cloud as well as the wet removal and cloud chemistry, which makes this experiment equivalent to the one that removes all aerosol (either from emission or new particle formation) in the respective of affecting the meteorological condition and fog formation. So the difference between EXP_CTL and EXP_NOBC is regarded as the effect of BC (EF_BC), and the difference between EXP_NOBC and EXP_NOAER can be considered as the effect of non-BC (EF_NBC). The total effect of aerosols (EF_TOT) is derived from the difference between EXP_CTL and EXP_NOAER. We did not apply any nudging in all the aforementioned simulations, so as to separate the perturbations caused by aerosol well. To make this more clear, a brief description of the aforementioned experiments and the effects of different aerosol feedback processes are listed in Table 2.
Table 2Experiments and the effects of different aerosol feedback processes.

2.3 Observational data
The observational data on both meteorology and air quality are employed to evaluate the model performance. Hourly measurements of air temperature and relative humidity (RH) at the altitude of 2 m above the ground (T2 and RH2) and wind speed at the altitude of 10 m above the ground (WS10) at 153 meteorological stations in eastern China are collected from the National Climate Data Center (NCDC) of China. Hourly PM2.5 concentrations are obtained from the China National Environmental Monitoring Center (CNEMC). This dataset includes hourly concentrations of SO2, NO2, CO, O3, PM2.5 and PM10 at 74 cities, covering emission-intensive regions such as the YRD and Beijing–Tianjin–Hebei (BTH). The observational data of all sites within each city are averaged to represent the local pollution levels. The geographical positions of NCDC and CNEMC observations are illustrated in Fig. 1. The data of vertical profiles of air temperature, RH and water vapor mixing ratio (Q) in Nanjing are obtained from the atmospheric sounding dataset of the Earth Observing Laboratory, National Center for Atmospheric Research (NCAR). The data of downward shortwave radiation (DSR) and the surface sensible heat flux (SHF) in northeastern suburban Nanjing are used to validate the simulation results. These datasets are obtained from the Station for Observing Regional Processes of the Earth System (SORPES) at the Xianlin Campus of Nanjing University (Ding et al., 2013a, 2016b; Zou et al., 2017).
Table 3Statistics for evaluation of model (EXP_CTL) performance against observations.

3.1 Validation of simulated meteorological variables, PM2.5 concentration and fog events
The interaction between the atmosphere and aerosols influences both meteorological conditions and the spatiotemporal distribution of aerosols (Ding et al., 2013b, 2016a; Huang et al., 2016). In this section, evaluations of meteorological field and PM2.5 concentration are carried out for EXP_CTL, the experiment including full physical and chemical processes. The statistics of T2, RH2, WS10 and PM2.5 mass concentration between the simulation and observation are summarized in Table 3. Mean observation (mean obs.), simulation (mean sim.), bias (MB), root mean square error (RMSE) and correlation coefficient (R) are calculated for T2, RH2 and WS10 over 153 NCDC stations and PM2.5 concentrations over 74 CNEMC sites. Overall, the model reproduced a satisfying representation of meteorological conditions with acceptable biases. T2 is simulated with a cold bias of −0.76 ∘C, a RMSE of 2.92 and a correlation of 0.86. The RH2 simulation has a negligible MB of −0.09 %, a RMSE of 15.70 and a correlation of 0.69. WS10 is overestimated, with a MB of +0.78 m s−1. As for surface pollutants, the model successfully reproduces PM2.5 concentration, with a relatively small MB of +8.88 µg m−3. The mean simulated and observed PM2.5 concentrations are 159.07 and 150.19 µg m−3 respectively. The simulated PM2.5 concentrations agree well with the observations at 74 sites over eastern China during this haze event (Fig. 2). However, PM2.5 temporal variations are not well reproduced, with a relatively large RMSE of 108.77 µg m−3 and relatively small correlation of 0.48. This is probably because the measured PM2.5 concentrations are averaged on a city scale, which does not match the exact grid of WRF-Chem.
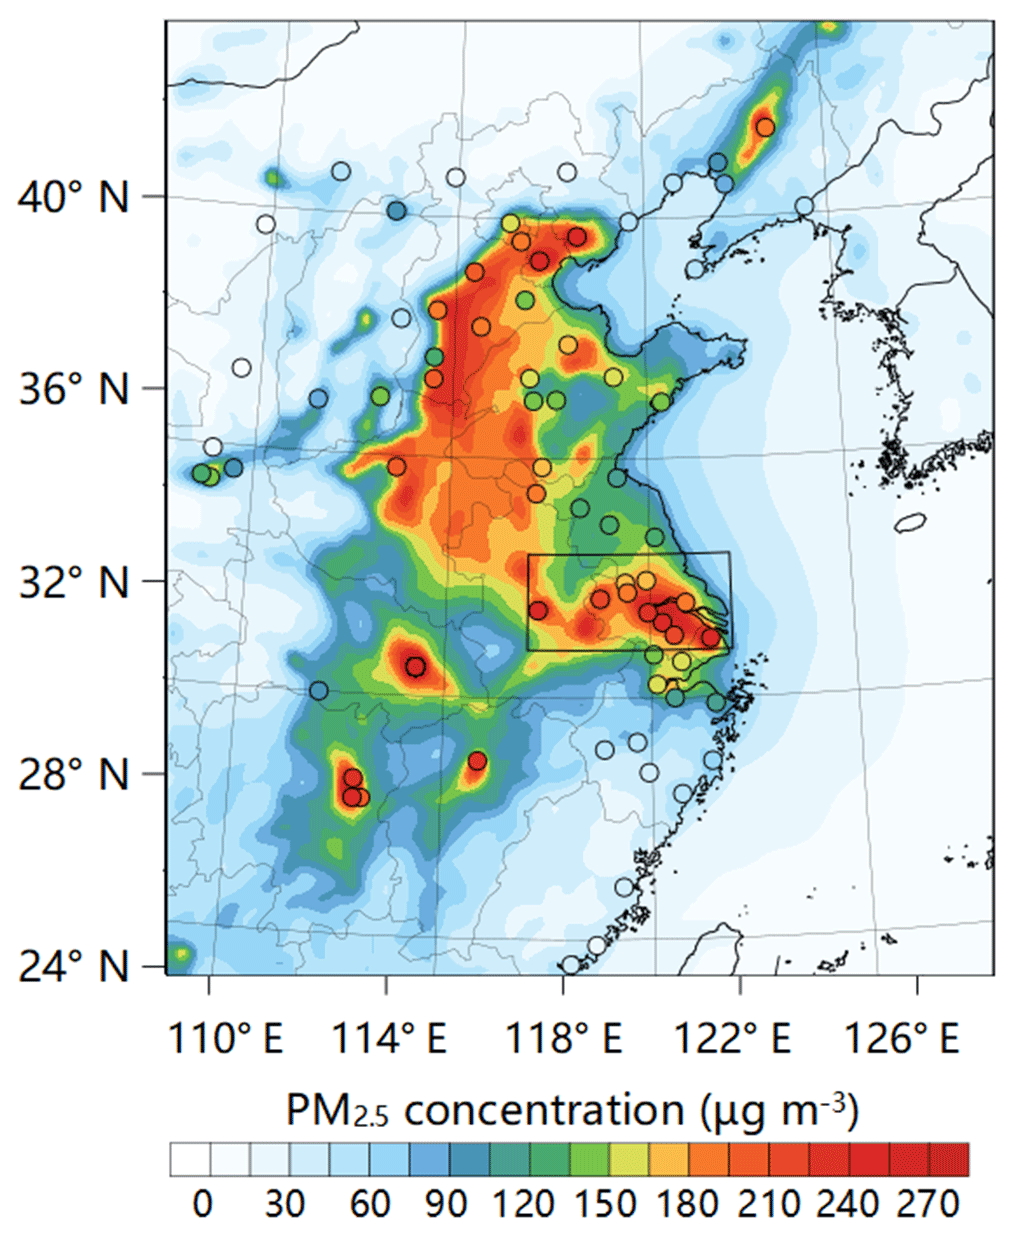
Figure 2Spatial distribution of simulated (colored area) and observed (color-coded dots) mean PM2.5 concentrations during 1–10 December 2013 over eastern China. The black rectangle denotes the YRD region.
A previous observational study demonstrated that the reduced DSR and SHF are subject to the increase of aerosol concentration, which consequently leads to suppression of daytime PBL development (Zou et al., 2017). We also compared the simulated DSR and SHF in different experiments with the observations at SORPES in Nanjing. The comparisons show that DSR and SHF in EXP_CTL agreed well with the observational data; however, they were overestimated by EXP_NORAD, EXP_NOAER and EXP_NOBC (Fig. S1 in the Supplement). These results suggest that the radiative effect of aerosols can be reproduced reasonably when both the ARI and ACI processes are included in the simulations.
The evolution of the fog–haze event during 1–10 December 2013 over eastern China is illustrated in four stages as shown in Figs. 3 and 4. First, during the daytime of 2 December, the northern part of eastern China was under the control of southwest wind, and the horizontal distribution of air pollutants shows that PM2.5 concentration was relatively high in BTH, while it was relatively low in the YRD (Fig. 3a). The air quality measurements show that surface PM2.5 concentration was high in Zhengzhou and Nanjing (about 150 µg m−3) and relatively low in Beijing (less than 100 µg m−3) (Fig. 4). Second, on 5 December a large amount of PM2.5 was transported to the mid-eastern China from BTH by the north wind. Meanwhile the west wind transported PM2.5 to the Yellow Sea (Fig. 3b). In Nanjing, the surface concentration of PM2.5 exceeded 300 µg m−3 during the daytime, with a maximum value of 370 µg m−3 at 12:00 LST (Fig. 4). Third, on 6 December the heavy haze pollution in the YRD region continued, and the PM2.5 concentration in Nanjing stayed around 300 µg m−3. As shown in Fig. 3c, the PM2.5 concentration in the southern part of this region reached a very high level, with a maximum value of about 400 µg m−3. Moreover, the eastward wind transported a large amount of PM2.5 from the YRD region into the northern part of the East China Sea. Finally, the fog–haze event in eastern China dissipated on 9 December (Fig. 3d) due to the arrival of strong cold air from northern China. Figure 4 shows that the model can successfully capture the main features of fog–haze evolution. However, PM2.5 and BC concentrations were substantially underestimated during the occurrence of fog in Nanjing in the model. This discrepancy may be caused by the absence of cloud-borne aerosol in the simulation result of PM2.5. During the fog occurrences, the cloud-borne aerosol and interstitial aerosol are both measured, but the PM2.5 provided by the simulation result was the dry mass that only includes interstitial aerosol. A relatively larger bias between observation and simulation in PM2.5 than BC during the daytime of 7 December also indicates a possible enhancement of the formation of secondary aerosols through aqueous-phase or heterogeneous reactions in the real world (Xie et al., 2015; Zheng et al., 2015; Wang et al., 2016; Cheng et al., 2016).
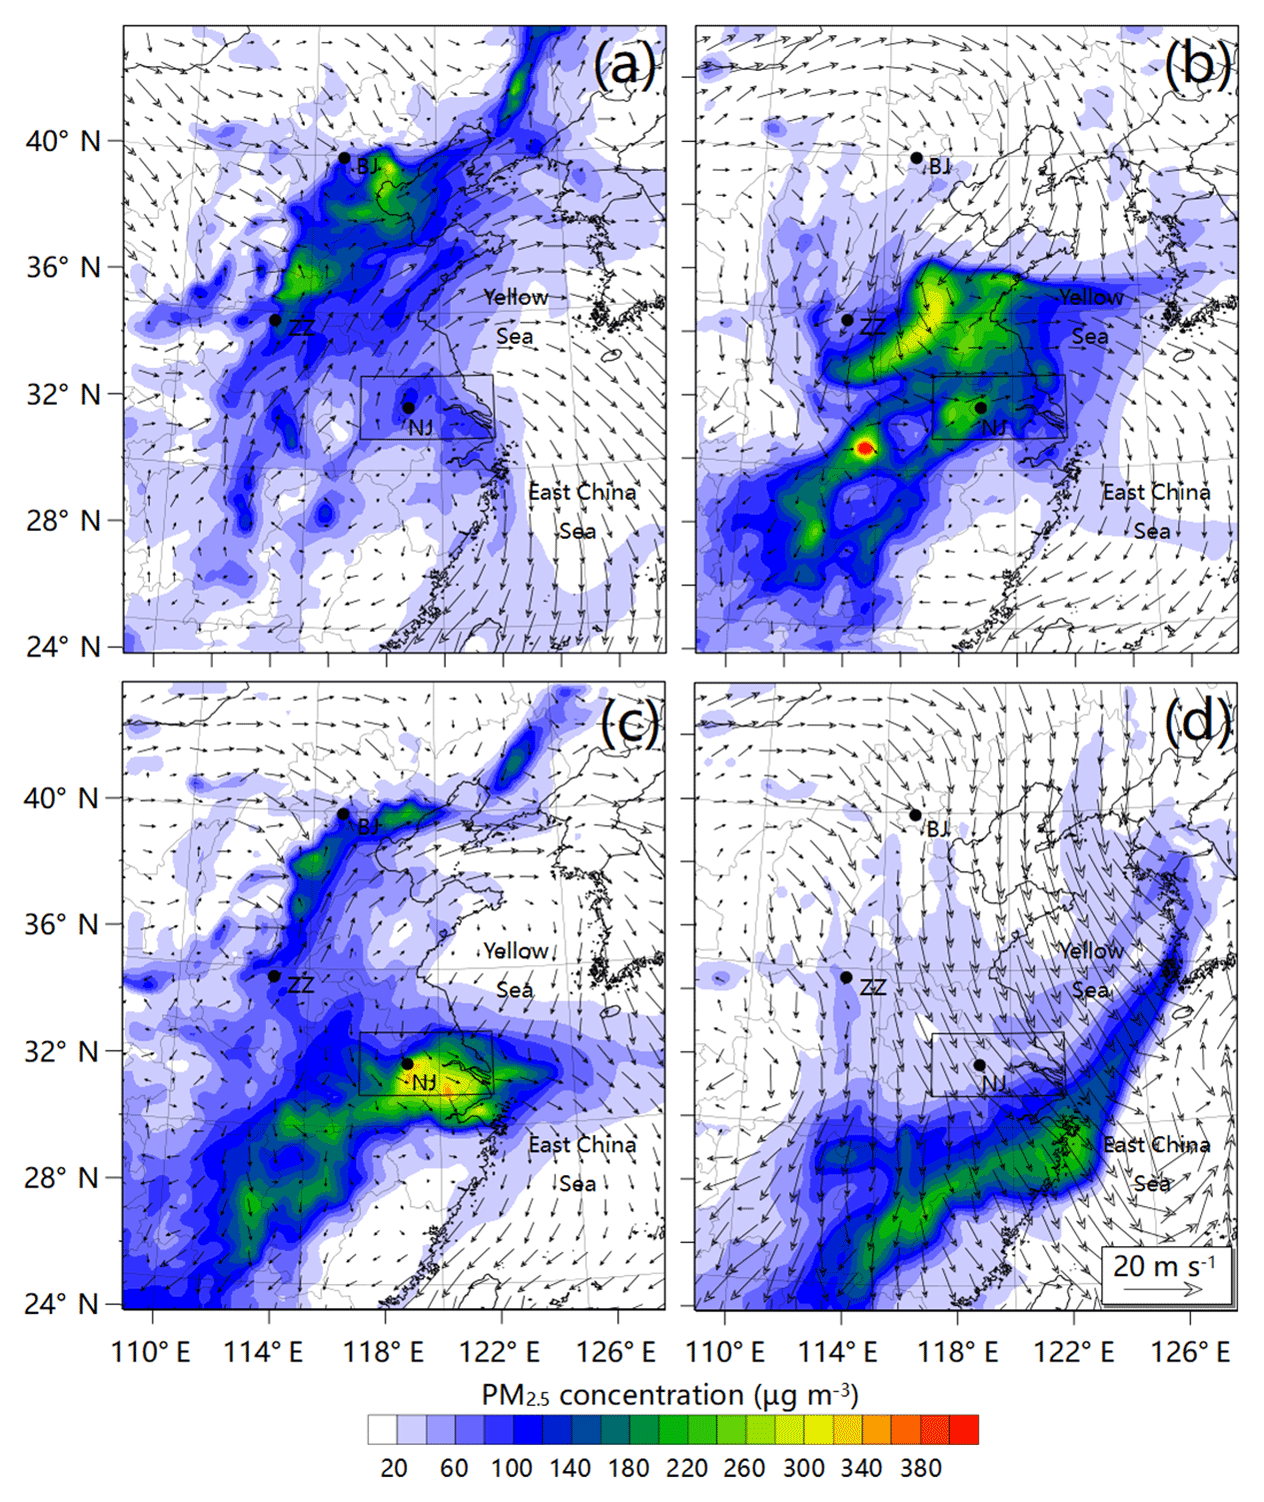
Figure 3Spatial distribution of PM2.5 mass concentration (µg m−3) and wind field (m s−1) near the ground surface from EXP_CTL at 14:00 on 2 (a), 5 (b), 6 (c) and 9 (d) December. The black rectangle denotes the YRD region, and the black dots represent locations of Beijing (BJ), Zhengzhou (ZZ) and Nanjing (NJ).

Figure 4Temporal variation of surface aerosol concentration in Beijing (BJ), Zhengzhou (ZZ) and Nanjing (NJ). Observational data (blue dashed line) of PM2.5 are from CNEMC and observational data of BC are from SORPES in NJ. The simulated results are from EXP_CTL. The vertical green dashed lines labeled (a)–(d) denote the corresponding time as in Fig. 3a–d. The blue area denotes the duration of fog episode in the YRD region.
On 7 December, fog events were recorded by many meteorological stations in the YRD region. Simulation results show that this fog episode was successfully predicted by EXP_CTL (fog is simulated by the numerical model when RH reaches 100 % and liquid water has accumulated near the surface). Figure S2a and b show the comparisons between the observed and simulated RH2 and T2 at the Lukou site, which is located 36 km south of Nanjing. They agree very well for the period before the onset of fog and during the fog event. The fog began at 00:00 LST on 7 December when RH2 reached 100 % (Fig. S2a). Before this time, T2 decreased in the early night on 6 December due to radiative cooling, which led to an increase of RH2 and finally caused the water vapor to be saturated. During the fog event, the decreasing trend of T2 was greatly alleviated because the radiative cooling can be compensated by the latent heat release in the process of fog formation during the night, while after sunrise the heating effect of solar radiation can be exhausted by the evaporation of fog droplets. The fog dissipated at about 12:00 LST on 7 December. The EXP_CTL can capture the evolution of T2 and RH2 during this fog episode (Fig. S2a and b) and also the vertical profiles of Q and RH in the PBL at 08:00 LST on 7 December (Fig. S2c and d).
3.2 Impact of aerosols on the formation and evolution of the fog event
3.2.1 Effects of ARI and ACI
High loading of BC and non-BC aerosols can substantially reduce the solar radiation reaching the Earth's surface, resulting in a significant change in surface meteorological conditions (Ding et al., 2013b, 2016a; Gao et al., 2015; H. Wang et al., 2015; Huang et al., 2018). Meanwhile, aerosol particles can act as CCN, and ACI can modify the solar radiation, which also leads to the change of surface meteorological conditions (K. Wang et al., 2015; Liu et al., 2016). To disentangle their individual contribution, Fig. 5 shows the average distributions of EF_TOT, EF_ARI and EF_ACI on the DSR, the near-surface temperature (Tns) and the near-surface water vapor mixing ratio (Qns) in the daytime (08:00–17:00 LST) during 1–10 December. It shows that the magnitude of EF_ACI on DSR, Tns and Qns was negligible, suggesting an insignificant role of ACI during this fog–haze episode. Since the winter haze in eastern China is often associated with a high-pressure system, subsidence of air mass can lead to less cloud cover, which consequently weakens the effect of ACI (B. Zhang et al., 2015). Figure 5b and e show that ΔDSR and ΔTns had different patterns in spatial distribution. The distribution of ΔDSR followed the pattern of PM2.5 concentration shown in Fig. 2. In the YRD region, ΔDSR was more than −75 W m−2, while in the adjacent offshore region, ΔDSR ranged from −25 to −50 W m−2 (Fig. 5b). However, as shown in Fig. 5e, the EF_ARI resulted in a cooling effect over land but a warming effect over sea. The maximum cooling effect occurred in the eastern part of the YRD region, where the magnitude of ΔTns reached −1.0∘. The maximum warming effect took place in the East China Sea, with the magnitude of ΔTns as high as +0.8∘. The different patterns of ΔDSR and ΔTns were attributed to the competition of the warming effect of BC in the atmosphere and the cooling effect of the extinction caused by both BC and non-BC aerosols. The distribution of ΔTns suggests that the cooling effect exceeded the warming effect over the land while the inverse situation occurred over the sea. To the best of our knowledge, by scattering and absorbing the solar radiation, aerosols reduce DSR reaching the Earth's surface, which leads to the reduction of surface temperature. However, the atmospheric heating due to absorbing aerosols (e.g., BC) is somehow offset by surface dimming through turbulent heat exchange. Comparatively, the sea surface has a larger capacity to store heat than the land, and hence the near-surface temperature over the sea was less sensitive to the reduction of incoming solar radiation and is more effectively increased by the aerosol warming effect (K. Wang et al., 2015). This is why the cooling effect was found over the land, while a warming effect was found over the sea. Figure 5g shows a significant EF_ARI on Qns in the YRD region and the East China Sea. In this area, the increase of the near-surface water vapor mixing ratio was associated with the occurrence of an advection–radiation fog event on 7 December.
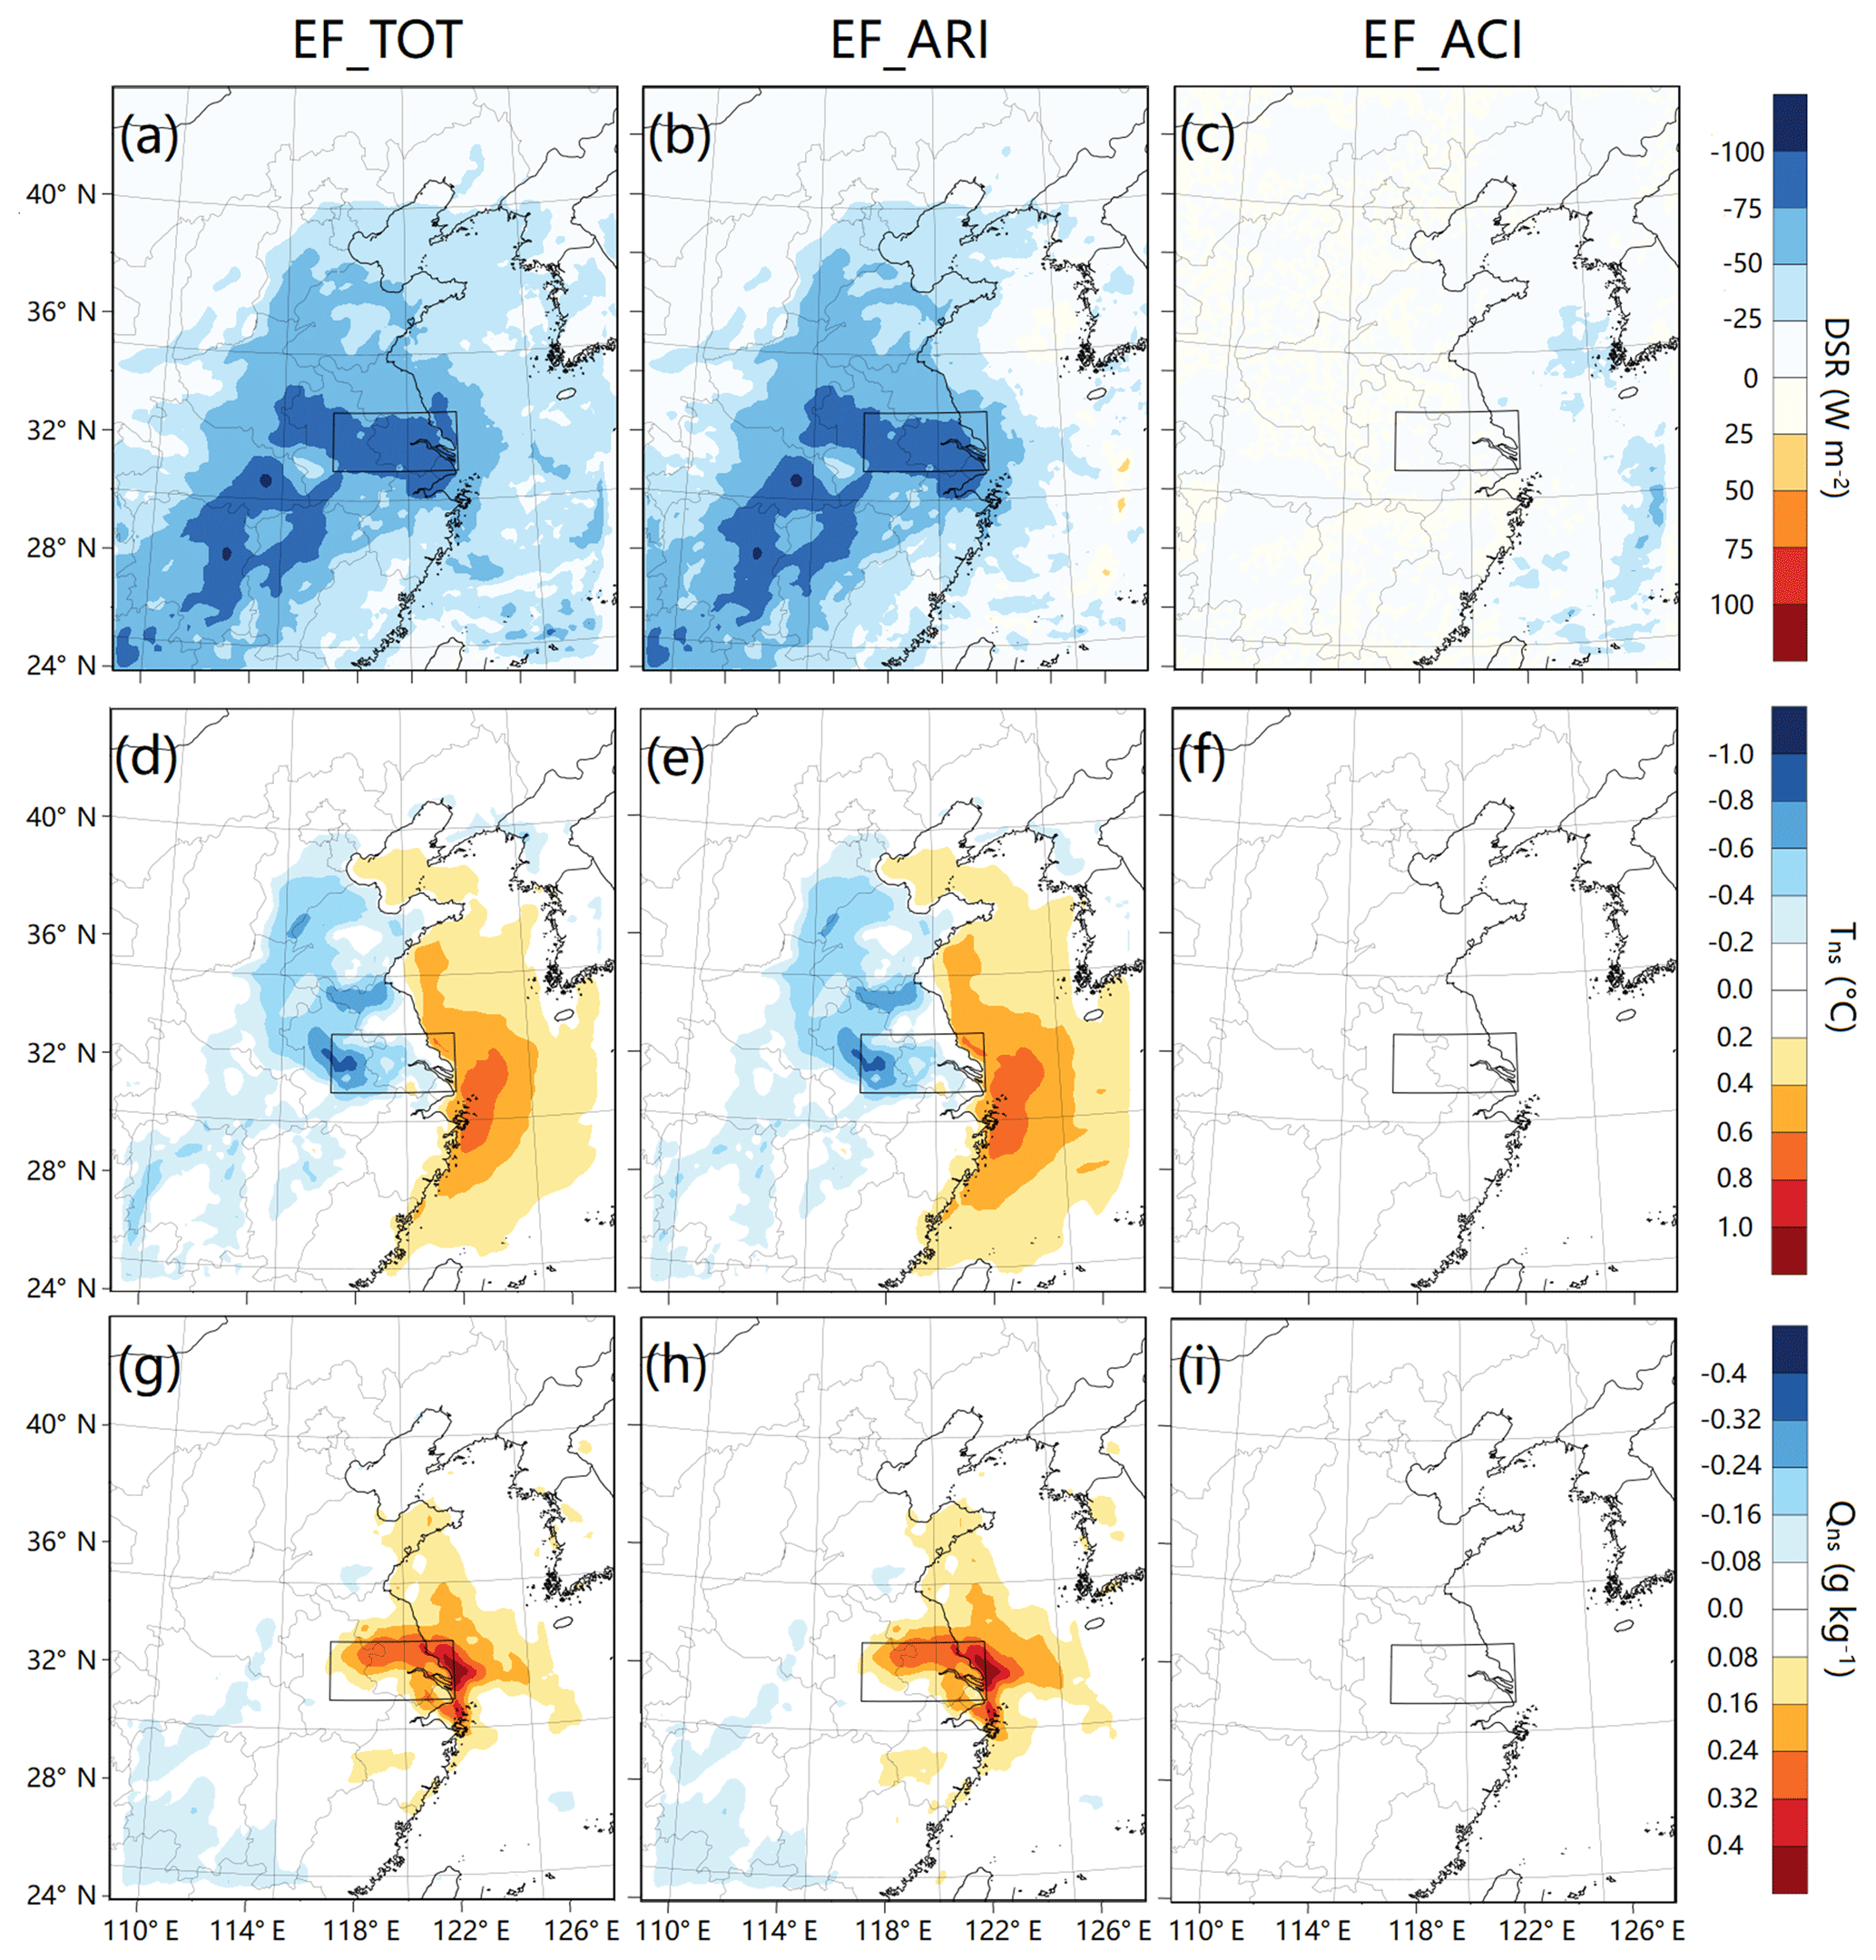
Figure 5Average changes of DSR (a, b, c), Tns (d, e, f) and Qns (g, h, i) induced by EF_TOT (a, d, g), EF_ARI (b, e, h) and EF_ACI (c, f, i) in the daytime (08:00–17:00 LST) during 1–10 December 2013. The subscript “ns” represents “near the surface”, i.e., the surface layer. The physical properties are calculated from the simulated results at the lowest grid level (approximately 60 m above the ground).
For the fog episode on 7 December, Fig. 6 shows the simulation results of liquid water content (LWC) near the surface and the temporal change of vertical distribution of LWC in EXP_CTL and EXP_NOAER. When considering the feedback processes of all aerosols, the spatial distribution of near-surface LWC in EXP_CTL shows that at 08:00 LST the dense fog was located mainly in the YRD region (Fig. 6a). The temporal change of vertical distribution of LWC in Nanjing shows that the fog episode began at 00:00 LST and dissipated at 12:00 LST (Fig. 6b). In the EXP_NOAER, which excluded the effects of both ARI and ACI, the fog only appeared in a very small area located at the upper edge of the YRD region (Fig. 6c), and no fog occurred in Nanjing (Fig. 6d). These discrepancies confirm that fog formation was promoted by ARI and ACI. However, the results in Fig. 5 suggest that the EF_ACI is negligible small in this fog–haze episode. It can be expected that the widespread fog in the YRD region was mainly induced by the EF_ARI. The mechanisms of fog formation will be discussed later.
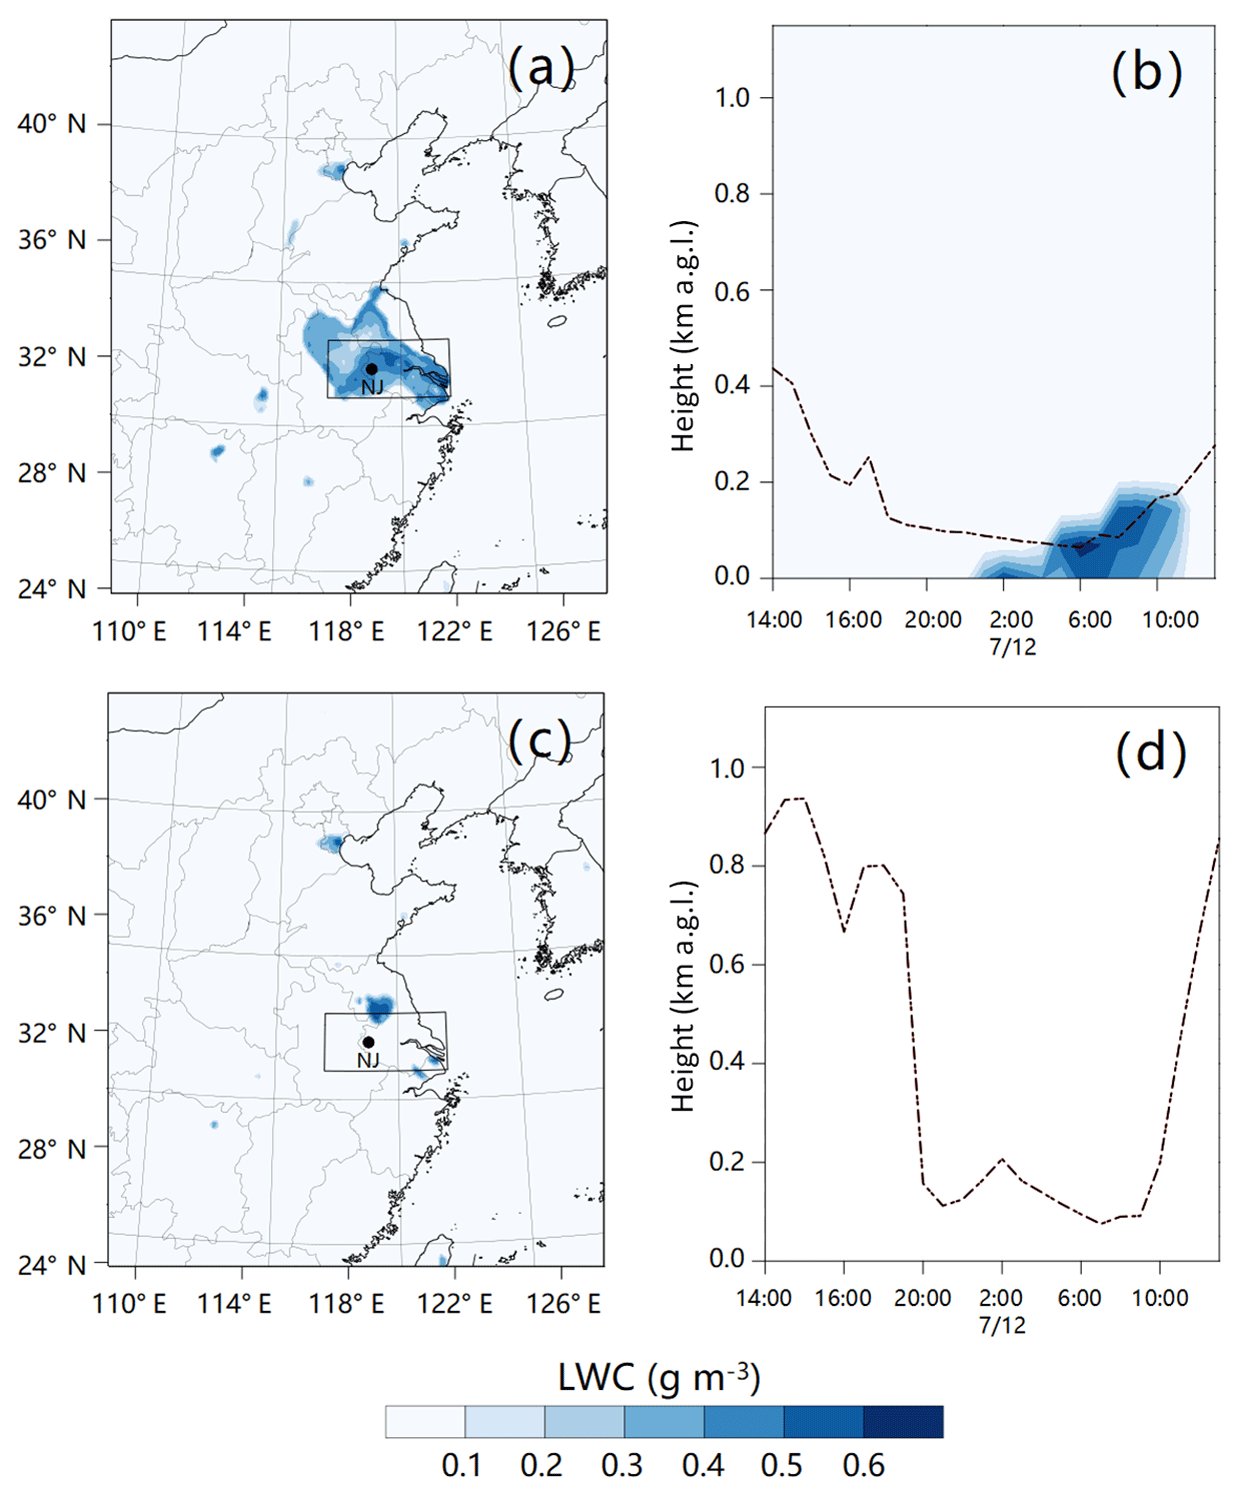
Figure 6The distribution of LWCns from EXP_CTL (a) and EXP_NOAER (c) at 08:00 LST on 7 December and the vertical distribution of LWC at Nanjing from EXP_CTL (b) and EXP_NOAER (d), varying from 14:00 LST on 6 December to 14:00 LST on 7 December. The dashed line denotes the PBLH.
3.2.2 Contributions from BC and non-BC aerosols
The physical processes of fog development are subject to various factors such as radiative cooling, moisture advection, evaporation and even turbulent mixing. Our simulations show that during the haze–fog event ARI played a dominant role, which was caused by the radiative effects of BC and non-BC aerosols. To investigate the roles of different types of aerosols, as well as their total effect, we evaluated the contribution of each feedback process on DSR, SHF, surface water vapor flux (QFX), Tns, Qns, RHns and PBLH based on different experiments. How to calculate the contribution of the corresponding feedback process is explained in Table 2. For example, the contribution of BC was derived from the difference between EXP_CTL and EXP_NOBC. Calculations were only conducted in the significantly influenced area, i.e., the YRD region, at 14:00 LST during 1–10 December. The quantities were averaged over this area (the grid points of the waterbody are excluded). The relative contributions are illustrated in Fig. 7.
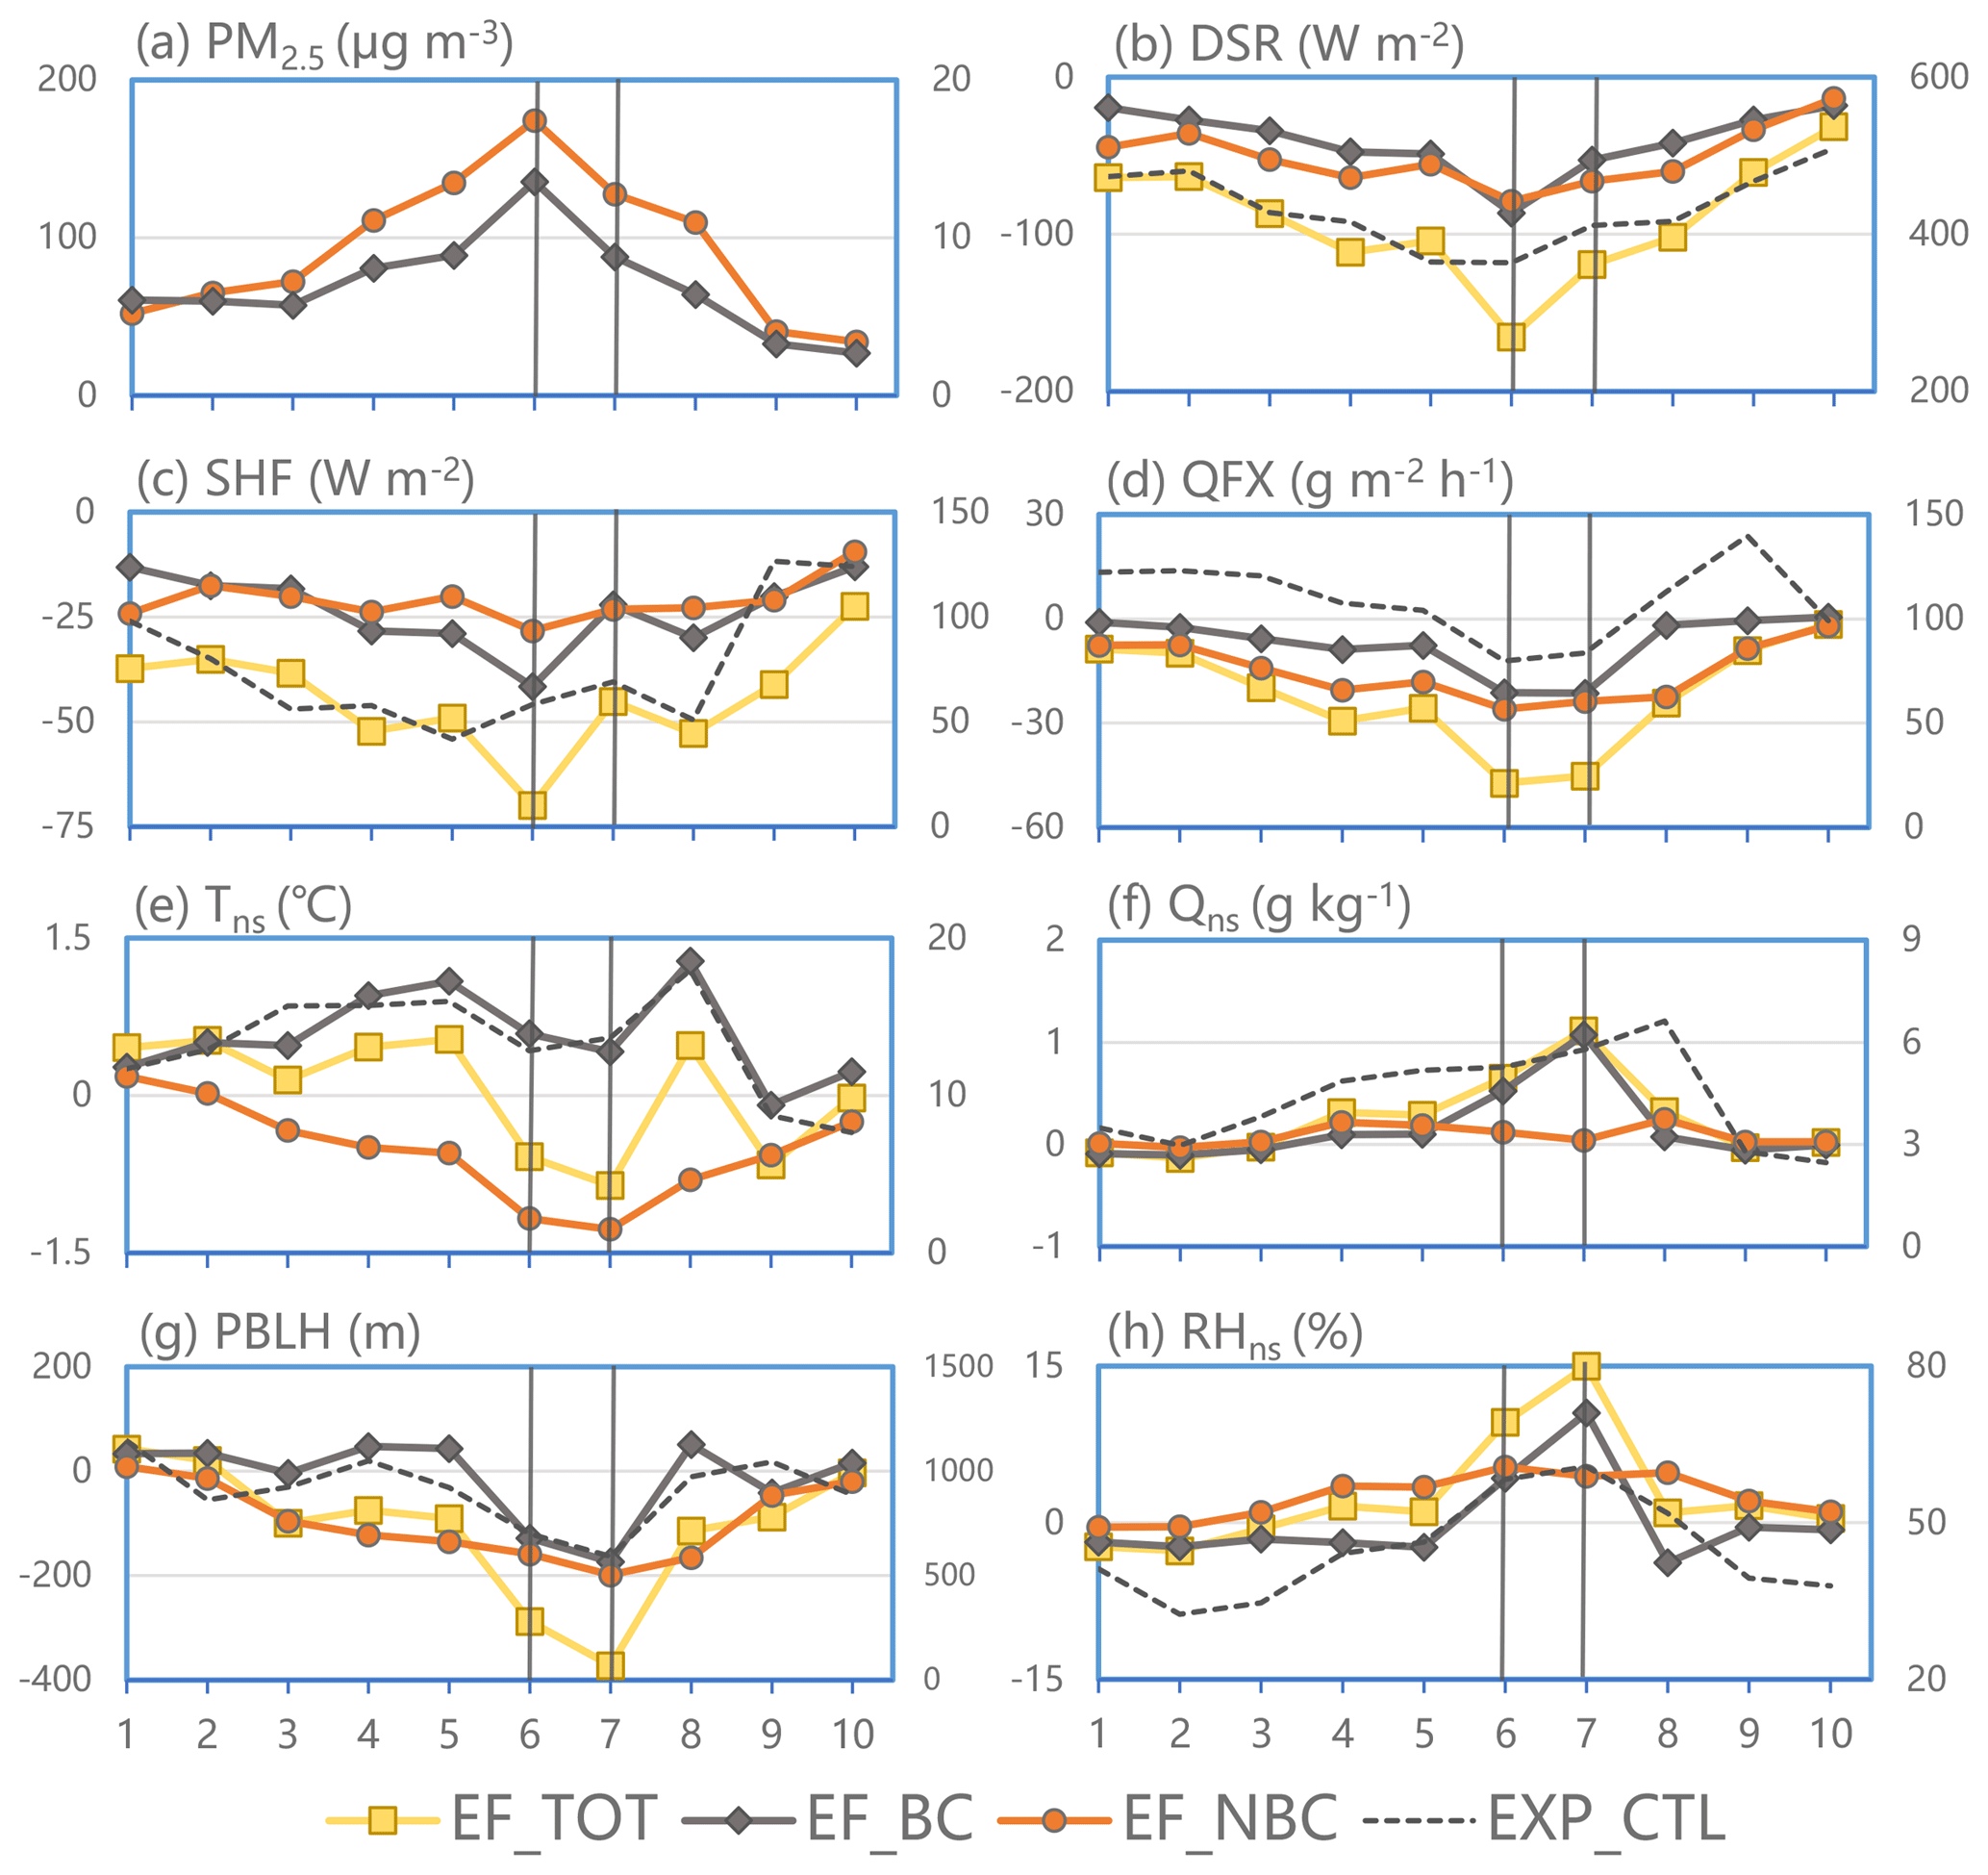
Figure 7The contributions of EF_TOT, EF_BC and EF_NBC to the change of near-surface layer properties (the magnitude is denoted by the left axis) at 14:00 LST each day during 1–10 December 2013, and the results from EXP_CTL (the magnitude is denoted by the right axis) are plotted as references. The data are calculated from the simulated results at the lowest grid level over the YRD region.
The highest concentrations of BC (13.56 µg m−3) and non-BC aerosols (174.42 µg m−3) appeared on 6 December (Fig. 7a), and the corresponding contributions of BC and non-BC aerosols to the decrease of DSR are −86.39 and −78.98 W m−2 respectively (Fig. 7b). Although the concentration of BC was much smaller than that of non-BC aerosols, the cooling effect of BC on the incoming solar radiation at the surface was comparable to that of non-BC aerosols. As a result, the decreases of SHF induced by BC and non-BC aerosols were comparable, and the maximum decreases occurred on 6 December (Fig. 7c). The relative contributions and variation patterns were similar in terms of QFX (Fig. 7d). However, the response of near-surface atmospheric temperature to the radiative effect of BC was quite different to that of non-BC aerosols. As shown in Fig. 7e, the non-BC aerosols had a negative contribution to Tns (i.e., to decrease the near-surface temperature), while BC had a positive impact on Tns (i.e., to increase the near-surface temperature). This is because BC traps parts of the solar energy in the atmosphere that is supposed to reach the ground surface. On the one hand, this effect reduces incoming solar radiation and cools near-surface atmosphere; on the other hand, the near-surface BC particles can absorb the sunlight and directly warm the surrounding air. The BC impact on Tns highly relies on the vertical distribution of BC (Wang et al., 2018) and even depends on models. Our simulations suggest that, during this heavy air pollution event in the YRD region, the warming effect of BC can exceed its cooling effect, and the net effect is an increase of the air temperature. A decrease of temperature directly led to an increase of relative humidity. Thus, Fig. 7h shows that non-BC aerosols increased RHns. However, this figure also shows that BC decreased RHns before 6 December but had a positive contribution to RHns during 6–7 December. The positive contribution of BC to RHns on 6–7 December implies that RH was not only influenced by the local temperature perturbation but also that it could have been affected by other factors such as moisture advection. Figure 7f shows that the BC has a positive contribution to Qns during 6–7 December, suggesting that the effect of BC was to increase the moisture in this area through other processes. Figure 7g shows that the non-BC aerosols always have a negative contribution to PBLH because the shadowing effect reduces the SHF and consequently decreases the PBLH (Zou et al., 2017). Meanwhile, BC also had a negative impact on PBLH during 6–7 December, although BC aerosols tended to increase the near-surface temperature in this period. The reason is that during the heavy air pollution event, the heating effect of BC was more effective in the upper air than in that of the lower part of the PBL, which stabilized the atmospheric stratification and suppressed the PBL development in the daytime. This effect has been well documented and named the “dome effect” of BC (Ding et al., 2016a; Wang et al., 2018).
To better understand the roles of BC and non-BC aerosols in the fog episode, we calculated their individual contributions to Tns, Qns, RHns and LWCns from 14:00 LST on 6 December to 14:00 LST on 7 December in the YRD region. Figure 8a shows that the total effect of BC and non-BC aerosols was to decrease the near-surface air temperature, although BC tended to increase the temperature on 6 December. It means that Tns in EXP_CTL is lower than that in EXP_NOAER, and the cooling effect of aerosols was favorable for fog formation. However, Fig. 8b shows that BC significantly increased Qns in the afternoon and early night on 6 December, while the contribution of non-BC aerosols was quite small. A significant increase of water vapor induced by BC led to a relatively high RHns (above 60 %) in the afternoon. Due to the decrease in temperature, the RHns increased, and then the fog formed around 00:00 LST on 7 December (Fig. 8c). After the onset of fog, the Qns decreased (Fig. 8b), and the LWCns increased (Fig. 8d) because the condensation process changed water vapor into liquid water during fog development. As shown in Fig. 8d, BC played a dominant role in fog formation. Spatially, the contribution of BC is also significantly larger than that of non-BC aerosols to the enlargement of the fog area (Fig. S3). Overall, the above results suggest that in this fog episode the most important factor is the increase of water vapor in this area, and BC plays an important role in fog formation. However, as pointed out previously, the local effect of BC on meteorological conditions alone cannot explain the increase of water vapor. It can be expected that the significant increase of water vapor in the YRD region is caused by moisture advection.

Figure 8The temporal evolution of the contributions of EF_TOT, EF_BC and EF_NBC to the change of Tns (a), Qns (b), RHns (c) and LWCns (d) from 14:00 LST on 6 December to 14:00 LST on 7 December in the YRD region (the magnitude is denoted by the left axis) and the results from EXP_CTL (the magnitude is denoted by the right axis).
3.3 BC-induced moisture advection between sea and land
Besides the radiative cooling of the surface and the adjacent atmosphere, a long-duration and thick-layered fog often requires other conditions such as turbulent mixing and advection (Wobrock et al., 2010). When not considering BC aerosol (EXP_NOBC), in the coastal area of the north of the YRD region the wind was from the Yellow Sea towards the land, and the onshore flow brought the moist air to the north of the YRD region, producing an isolated high moisture area at 14:00 LST on 6 December (see the central part around 32∘ N in Fig. 9b). At the same time in the EXP_CTL, which included the effect of BC, the moisture over the Yellow Sea was increased, and the onshore flow was enhanced. This led to an enlarged and amplified high moisture center in the northern part of the YRD region (the central part in Fig. 9a). The comparison between EXP_CTL and EXP_NOBC suggests that BC enhanced the moisture advection from the Yellow Sea to the northern part of the YRD region. Figure 9 also shows that the southward wind in this area was enhanced by BC, which increased the transport of the moister air into the YRD region where the fog formed that night.
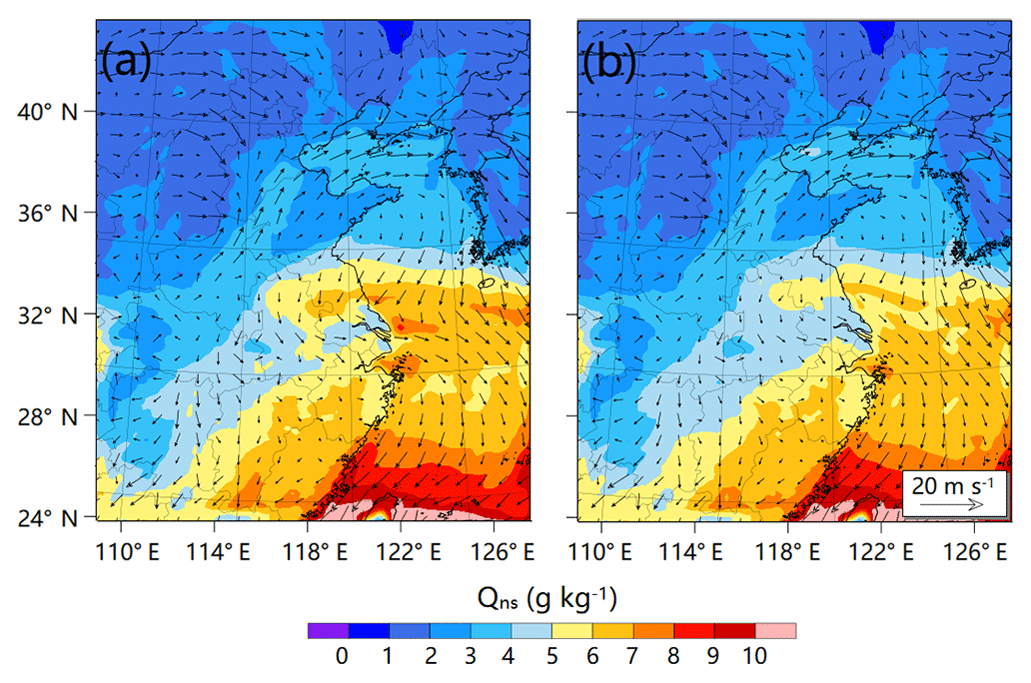
Figure 9Spatial distribution of Qns (g kg−3) and Vns (m s−1) from EXP_CTL (a) and EXP_NOBC (b) at 14:00 LST on 6 December.
Figure 10a shows that high values of BC concentration covered the eastern part of the YRD region and the nearby offshore area at 14:00 LST on 6 December (denoted by the isolines), which led to a warming effect in the near-surface layer of the atmosphere in this area. Then the warmed atmosphere resulted in a low-pressure perturbation in this area, which consequently led to a cyclonic anomaly in wind field (Fig. 10b). This cyclonic anomaly strengthened the onshore wind speed in the northeastern part of the YRD region because the background wind direction here was approximately the same. Meanwhile, the surface layer over the nearby sea was moisturized due to the heating effect of BC (Fig. 10d). Thus, the moisture advection from the sea to the land was mainly promoted by BC. To better understand the enhancement of moisture advection induced by BC, we calculated the difference of horizontal moisture flux in the surface layer between EXP_CTL and EXP_NOBC. The horizontal moisture flux MF is defined as the production of specific humidity q (in units of g m−3) and velocity V. We calculate the magnitude of ΔMF as (i.e., the difference in magnitude of the horizontal moisture flux between the two cases) and denote the direction of ΔMF by an arrow, whose direction is the direction of ΔV and whose length represents the magnitude of ΔV. Figure 10c shows that the area with a large value of was located at the northern edge of the YRD region and the nearby offshore area at 14:00 on 6 December, and the enhanced advection was onshore (only the arrows showing magnitude larger than 3 m s−1 are denoted in this figure). Since the wind direction in this area was mainly southward, the enhanced moisture advection moved into the YRD region at the later time. To make this more clear, an animation, which demonstrates BC's perturbation on moisture advection and the fog evolution, is provided in the Supplement. A link for the animation can be found in the caption of Fig. S4, which shows the state at the beginning time of 10:00 on 6 December.

Figure 10BC-introduced increase of air temperature (a), low-pressure perturbation and cyclonic anomaly in wind field (b), increase of moisture advection (c) and increase of water vapor mixing ratio (d) in the surface layer at 14:00 LST on 6 December. Arrows shown in (c) are the BC-induced velocity change with magnitude larger than 3 m s−1, which are used to represent the direction of the enhanced horizontal moisture flux. The line in (d) denotes the location where the cross section of BC-induced increase of temperature and moisture (as well as the PBLH in different experiments) is plotted in Fig. S5, and the rectangle denotes the offshore area in which the average profiles of potential temperature and water vapor mixing ratio in EXP_CTL and EXP_NOBC are calculated and plotted in Fig. S6.
Another role of BC is to depress the PBLH in the daytime. Figure S5 shows a vertical cross section of BC impact on water vapor and temperature at the location denoted in Fig. 10d. The largest increase of air temperature caused by the heating effect of BC occurred in the upper part of PBL over the land, and the PBLH over Nanjing was only half of that when excluding BC's effect. This is consistent with the previous study by Ding et al. (2016a), in which the dome effect of BC, which stabilizes the PBL and suppresses PBL development in the daytime, was discovered for the first time. A decreased PBLH restricted the water vapor within a shallow layer near the ground surface, which can increase the moisture in the PBL (if the PBL is well developed, the water vapor will be spread vertically in a deeper layer, which can reduce the water vapor near the ground surface). The stabilized PBL weakened the vertical mixing, which made near-surface air moister (Fig. S5), which promoted the accumulation of water vapor in the near surface during the daytime when the moister air was transported to the land. Therefore, the fog can form in the whole YRD region in the night when the role of BC is included. Meanwhile, a stabilized PBL and a decreased PBLH caused by the dome effect of BC can also explain the increase of moisture in the surface layer over the sea (Fig. S6).
During 1–10 December 2013 eastern China underwent a haze pollution episode, and on 7 December, a heavy fog, associated with a haze event with high- concentration PM2.5, occurred over the YRD region. In order to better understand the impacts of aerosols on fog formation and the associated meteorological conditions, we applied numerical modeling with the online-coupled air quality model WRF-Chem to simulate this fog–haze event and to explore the main mechanisms of aerosol impact on fog formation. By conducting four parallel numerical experiments, we analyzed the effects of ARI, ACI, BC and non-BC aerosols. We find that BC played a key role in this fog–haze event by producing favorable local and regional meteorological conditions for the formation of advection–radiation fog in the YRD region.
First of all, evaluation of the model performance shows that WRF-Chem can capture the air pollution process and the fog episode well. The simulated meteorological conditions, such as temperature, relative humidity and wind speed in the surface layer, agree well with the observations. However, when excluding the interaction between meteorology and aerosols, there are large biases in meteorological conditions, and the fog cannot be reproduced. Our results support previous studies that showed that intense atmospheric pollution can modify weather (e.g., Ding et al. 2013b; Huang et al., 2016).
Comparison between ARI and ACI shows that the effect of ARI was dominant over the effect of ACI in the surface meteorological conditions in early December. The reason may be that during this haze pollution episode, there was little cloud, and ACI was very weak. Further analyses are conducted to reveal the different roles of BC and non-BC aerosols in fog formation. The results show that they both contribute to fog formation. However, non-BC aerosols have a relatively small contribution by decreasing temperature in the surface layer, while BC has a larger contribution by significantly increasing moisture in this layer. The radiative effect of BC was to reduce the local surface evaporation, which can reduce the air moisture, but BC-induced circulation anomalies could increase moisture by enhanced advection between land and sea.
The mechanism of BC-induced moisture advection was explored based on the detailed analysis of modeling results from different experiments. High loading of BC in the YRD region and the nearby offshore area exerted a dome effect on the PBL, which directly increased moisture over the sea by reducing PBLH and weakening vertical mixing because more water vapor was confined to the lower part of a shallow PBL. The regional warming effect of BC on the air temperature led to a low-pressure perturbation in this area and consequently resulted in a cyclonic anomaly in wind field. The cyclonic anomaly enhanced the onshore flow, which brought more moisture from the sea into the YRD region in the north during the daytime. Then the increased moisture helped to form heavy advection–radiation fog during nighttime. Meanwhile, the dome effect of BC produced lower PBLH and weaker vertical mixing in the daytime. These were favorable conditions for the maintenance of high moisture in the daytime and the formation of fog in the night.
This study highlights a complexity of interaction among ARI, regional circulation and the PBL, in which the effect of BC is very important in the fog formation that occurred in the YRD region in early December 2013, and suggests that in heavy polluted areas, numerical weather prediction models should include feedback processes, especially those induced by radiatively active species like BC.
The reanalysis and observational datasets used in this work are available in the NCDC dataset (https://gis.ncdc.noaa.gov/maps/ncei/cdo/hourly, last access: 29 April 2018), CNEMC observations (http://106.37.208.233:20035/, last access: 11 December 2013) and the atmospheric sounding dataset from the Earth Observing Laboratory of NCAR (http://weather.uwyo.edu/upperair/sounding.html, last access: 28 July 2017).
The supplement related to this article is available online at: https://doi.org/10.5194/acp-19-7759-2019-supplement.
JS designed the study. JS, AD, XY and CF developed the measurement station to record meteorology and atmospheric chemical composition. QD and XH conducted model simulations. QD and ZJ analyzed the data. JS and AD prepared the paper with contributions from all authors.
The authors declare that they have no conflict of interest.
We are grateful to the High-Performance Computing & Massive Data Center (HPC&MDC) of the School of Atmospheric Science, Nanjing University, for supporting the numerical calculations in this paper.
This research has been supported by the National Natural Science Foundation of China (grant no. 91544231) and the National Key Research and Development Program of China (grant no. 2016YFC0200500).
This paper was edited by Qiang Zhang and reviewed by two anonymous referees.
Abdul-Razzak, H. and Ghan, S. J.: A Parameterization of Aerosol Activation. 3. Sectional Representation, J. Geophys. Res., 107, 4026, https://doi.org/10.1029/2001JD000483, 2002.
Andersson, A., Deng, J., Ke, D., Zheng, M., Yan, C., Sköld, M., and Gustafsson, Ö.: Regionally-varying combustion sources of the January 2013 severe haze events over eastern China, Environ. Sci. Technol., 49, 2038–2043, https://doi.org/10.1021/es503855e, 2015.
Bond, T. C., Doherty, S. J., Fahey, D. W., Forster, P. M., Berntsen, T., DeAngelo, B. J., Flanner, M. G., Ghan, S., Karcher, B., Koch, D., Kinne, S., Kondo, Y., Quinn, P. K., Sarofim, M. C., Schultz, M. G., Schulz, M., Venkataraman, C., Zhang, H., Zhang, S., Bellouin, N., Guttikunda, S. K., Hopke, P. K., Jacobson, M. Z., Kaiser, J. W., Klimont, Z., Lohmann, U., Schwarz, J. P., Shindell, D., Storlvmo, T., Warren, S. G., and Zender, C. S.: Bounding the role of black carbon in the climate system: A scientific assessment, J. Geophys. Res.-Atmos., 118, 5380–5552, https://doi.org/10.1002/jgrd.50171, 2013.
Bott, A.: On the influence of the physico-chemical properties of aerosols on the life cycle of radiation fogs, J. Aerosol. Sci., 21, 1–31, https://doi.org/10.1007/BF00119960, 1990.
Chapman, E. G., Gustafson Jr., W. I., Easter, R. C., Barnard, J. C., Ghan, S. J., Pekour, M. S., and Fast, J. D.: Coupling aerosol-cloud-radiative processes in the WRF-Chem model: Investigating the radiative impact of elevated point sources, Atmos. Chem. Phys., 9, 945–964, https://doi.org/10.5194/acp-9-945-2009, 2009.
Chen, F. and Dudhia, J.: Coupling an advanced land surface hydrology model with the Penn State-NCAR MM5 modeling system – Part I: Model implementation and sensitivity, Mon. Weather Rev., 129, 569–585, 2001.
Chen, F., Kusaka, H., Bornstain, R., Ching, J., Grimmond, C. S. B., Grossman-Clarke, S., Loridan, T., Manning, K., Martilli, A., Miao, S., Sailor, D., Salamanca, F., Taha, H., Tewari, M., Wang, X., Wyszogrodzki, A., and Zhang, C.: The integrated WRF/urban modeling system: development, evaluation, and applications to urban environmental problems, Int. J. Climatol., 31, 273–288, https://doi.org/10.1002/joc.2158, 2011.
Cheng, Y., Zheng, G., Wei, C., Mu, Q., Zheng, B., Wang, Z., Gao, M., Zhang, Q., He Q., Carmichael, G., Pöschl, U., and Su, H.: Reactive nitrogen chemistry in aerosol water as a source of sulfate during haze events in China, Sci. Adv., 2, e1601530, https://doi.org/10.1126/sciadv.1601530, 2016.
Dall'Osto, M., Harrison, R. M., Coe, H., and Williams, P.: Real-time secondary aerosol formation during a fog event in London, Atmos. Chem. Phys., 9, 2459–2469, https://doi.org/10.5194/acp-9-2459-2009, 2009.
Ding, A. J., Fu, C. B., Yang, X. Q., Sun, J. N., Zheng, L. F., Xie, Y. N., Herrmann, E., Nie, W., Petäjä, T., Kerminen, V.-M., and Kulmala, M.: Ozone and fine particle in the western Yangtze River Delta: an overview of 1 yr data at the SORPES station, Atmos. Chem. Phys., 13, 5813–5830, https://doi.org/10.5194/acp-13-5813-2013, 2013a.
Ding, A. J., Fu, C. B., Yang, X. Q., Sun, J. N., Petäjä, T., Kerminen, V. M., Wang, T., Xie, Y., Herrmann, E., Zheng, L. F., Nie, W., Liu, Q., Wei, X. L., and Kulmala, M.: Intense atmospheric pollution modifies weather: a case of mixed biomass burning with fossil fuel combustion pollution in eastern China, Atmos. Chem. Phys., 13, 10545–10554, https://doi.org/10.5194/acp-13-10545-2013, 2013b.
Ding, A. J., Huang, X., Nie, W., Sun, J. N., Kerminen, V. M., Petäjä, T., Su, H., Cheng, Y. F., Yang, X. Q., Wang, M. H., Chi, X. G., Wang, J. P., Virkkula, A., Guo, W. D., Yuan, J., Wang, S. Y., Zhang, R. J., Wu, Y. F., Song, Y., Zhu, T., Zilitinkevich, S., Kulmala, M., and Fu, C. B.: Enhanced haze pollution by black carbon in megacities in China, Geophys. Res. Lett., 43, 2873–2879, https://doi.org/10.1002/2016GL067745, 2016a.
Ding, A., Nie, W., Huang, X., Chi, X., Sun, J., Kerminen, V.-M., Xu, Z., Guo, W., Petäjä, T., Yang, X., Kulmala, M., and Fu, C.: Long-term observation of air pollution-weather/climate interactions at the SORPES station: a review and outlook, Front. Environ. Sci. Eng., 10, 1–15, https://doi.org/10.1007/s11783-016-0877-3, 2016b.
Emmons, L. K., Walters, S., Hess, P. G., Lamarque, J.-F., Pfister, G. G., Fillmore, D., Granier, C., Guenther, A., Kinnison, D., Laepple, T., Orlando, J., Tie, X., Tyndall, G., Wiedinmyer, C., Baughcum, S. L., and Kloster, S.: Description and evaluation of the Model for Ozone and Related chemical Tracers, version 4 (MOZART-4), Geosci. Model Dev., 3, 43–67, https://doi.org/10.5194/gmd-3-43-2010, 2010
Fast, J. D., Gustafson Jr., W. I., Easter, R. C., Zaveri, R. A., Barnard, J. C., Chapman, E. G., Grell, G. A., and Peckham, S. E.: Evolution of Ozone, Particulates and Aerosol Direct Radiative Forcing in the Vicinity of Houston Using a Fully Coupled Meteorology-Chemistry-Aerosol Model, J. Geophys. Res., 111, D21305, https://doi.org/10.1029/2005JD006721, 2006.
Gao, Y., Zhang, M., Liu, Z., Wang, L., Wang, P., Xia, X., Tao, M., and Zhu, L.: Modeling the feedback between aerosol and meteorological variables in the atmospheric boundary layer during a severe fog–haze event over the North China Plain, Atmos. Chem. Phys., 15, 4279–4295, https://doi.org/10.5194/acp-15-4279-2015, 2015.
Graedel, T. E., Weschler, C. J., and Mandich, M. L.: Influence of transition metal complexes on atmospheric droplet acidity, Nature, 317, 240–242, https://doi.org/10.1038/317240a0, 1985.
Grell, G. A. and Devenyi, D.: A generalized approach to parameterizing convection combining ensemble and data assimilation, Geophys. Res. Lett., 29, 587–590, https://doi.org/10.1029/2002GL015311, 2002.
Grell, G. A., Peckham, S. E., Schmitz, R., Mckeen, S. A., Frost, G., Skamarock, K., and Eder, B.: Fully coupled “online” chemistry within the WRF model, Atmos. Environ., 39, 6957–6975, 2005.
Guenther, A., Karl, T., Harley, P., Wiedinmyer, C., Palmer, P. I., and Geron, C.: Estimates of global terrestrial isoprene emissions using MEGAN (Model of Emissions of Gases and Aerosols from Nature), Atmos. Chem. Phys., 6, 3181–3210, https://doi.org/10.5194/acp-6-3181-2006, 2006.
Gultepe, I., Tardif, R., Michaelides, S. C., Cermak, J., Bott, A., Bendix, J., Müller, M. D., Pagowski, M., Hansen, B., and Ellrod, G.: Fog Research: A Review of Past Achievements and Future Perspectives, Pure. Appl. Geophys, 164, 1121–1159, https://doi.org/10.1007/s00024-007-0211-x, 2007.
Guo, L. J., Guo, X. L., Fang, C. G., and Zhu, S. C.: Observation analysis on characteristics of formation, evolution and transition of a long-lasting severe fog and haze episode in North China, Sci. China. Earth. Sci., 58, 329–344, https://doi.org/10.1007/s11430-014-4924-2, 2015.
Huang, X., Ding, A., Liu, L., Liu, Q., Ding, K., Niu, X., Nie, W., Xu, Z., Chi, X., Wang, M., Sun, J., Guo, W., and Fu, C.: Effects of aerosol-radiation interaction on precipitation during biomass-burning season in East China, Atmos. Chem. Phys., 16, 10063–10082, https://doi.org/10.5194/acp-16-10063-2016, 2016.
Huang, X., Wang, Z. L., and Ding, A. J.: Impact of Aerosol-PBL Interaction on Haze Pollution: Multi-Year Observational Evidences in North China, Geophys. Res. Lett., 45, 8596–8603, https://doi.org/10.1029/2018GL079239, 2018.
Hudson, J. G.: Relationship Between Fog Condensation Nuclei and Fog Microstructure, J. Atmos. Sci., 37, 1854–1867, https://doi.org/10.1175/1520-0469(1980)037<1854:RBFCNA>2.0.CO;2, 1980.
Iacono, M. J., Delamere, J. S., Mlawer, E. J., Shephard, M. W., Clough, S. A., and Collins, W. D.: Radiative forcing by long-lived greenhouse gases: Calculations with the AER radiative transfer models, J. Geophys. Res., 113, D13103, https://doi.org/10.1029/2008JD009944, 2008.
Janssens-Maenhout, G., Crippa, M., Guizzardi, D., Dentener, F., Muntean, M., Pouliot, G., Keating, T., Zhang, Q., Kurokawa, J., Wankmüller, R., Denier van der Gon, H., Kuenen, J. J. P., Klimont, Z., Frost, G., Darras, S., Koffi, B., and Li, M.: HTAP_v2.2: a mosaic of regional and global emission grid maps for 2008 and 2010 to study hemispheric transport of air pollution, Atmos. Chem. Phys., 15, 11411–11432, https://doi.org/10.5194/acp-15-11411-2015, 2015.
Jones, A., Roberts, D. L., and Slingo, A.: A Climate Model Study of Indirect Radiative Forcing by Anthropogenic Sulphate Aerosols, Nature, 370, 450–453, https://doi.org/10.1038/370450a0, 1994.
Kuroiwa, D.: Electron-microscope study of fog nuclei, J. Meteorol., 8, 157–160, https://doi.org/10.1175/1520-0469(1951)008<0157:emsofn>2.0.co;2, 1951.
Lane, T. E., Donahue, N. M., and Pandis, S. N.: Simulating secondary organic aerosol formation using the volatility basis-set approach in a chemical transport model, Atmos. Environ., 42, 7439–7451, https://doi.org/10.1016/j.atmosenv.2008.06.026, 2008.
Lin, C., Zhang, Z., Zhao, P. U., and Wang, F.: Numerical simulations of an advection fog event over shanghai pudong international air-port with the WRF model, J. Meteorol. Res-PRC, 31, 874–889, https://doi.org/10.1007/s13351-017-6187-2, 2017.
Liu, X. Y., Zhang, Y., Zhang, Q., and He, K. B.: Application of online-coupled WRF/Chem-MADRID in East Asia: Model evaluation and climatic effects of anthropogenic aerosols, Atmos. Environ., 124, 321–336, https://doi.org/10.1007/s13351-017-6187-2, 2016.
Lou, S., Yang, Y., Wang, H., Smith, S. J., Qian, Y., and Rasch, P. J.: Black carbon amplifies haze over the North China Plain by weakening the East Asian winter monsoon, Geophys. Res. Lett., 46, 452–460, https://doi.org/10.1029/2018GL080941, 2019.
Morrison, H., Thompson, G., and Tatarskii, V.: Impact of cloud microphysics on the development of trailing stratiform precipitation in a simulated squall line: comparison of one- and two-moment schemes, Mon. Weather Rev., 137, 991–1007, https://doi.org/10.1175/2008MWR2556.1, 2009.
Munger, J. W., Jacob, D. J., Waldman, J. M., and Hoffmann, M. R.: Fog water Chemistry in an Urban Atmosphere, J. Geophys. Res.-Oceans., 88, 5109–5121, https://doi.org/10.1029/JC088iC09p05109, 1983.
Nakanishi, M. and Niino, H.: An Improved Mellor–Yamada Level-3 Model: Its Numerical Stability and Application to a Regional Prediction of Advection Fog, Bound-Lay. Meteorol., 119, 397–407, https://doi.org/10.1007/s10546-005-9030-8, 2006.
Niu, F., Li, Z., Li, C., Lee, K. H., and Wang, M.: Increase of wintertime fog in China: Potential impacts of weakening of the Eastern Asian monsoon circulation and increasing aerosol loading, J. Geophys. Res.-Atmos., 115, D00K20, https://doi.org/10.1029/2009JD013484, 2010.
Niu, S., Lu, C., Yu, H., Zhao, L., and Lu, J.: Fog research in China: An overview. Adv. Atmos. Sci., 27, 639–662, https://doi.org/10.1007/ s00376-009-8174-8, 2010.
Qin, Y. and Xie, S. D.: Spatial and temporal variation of anthropogenic black carbon emissions in China for the period 1980–2009, Atmos. Chem. Phys., 12, 4825–4841, https://doi.org/10.5194/acp-12-4825-2012, 2012.
Ryznar, E.: Advection-radiation fog near lake Michigan, Atmos. Environ., 11, 427–430, https://doi.org/10.1016/0004-6981(77)90004-X, 1977.
Shi, C., Yang, J., Qiu, M., Hao, Z., Su, Z., and Li, Z.: Analysis of an extremely dense regional fog event in Eastern China using a mesoscale model, Atmos. Res., 95, 428–440, https://doi.org/10.1016/j.atmosres.2009.11.006, 2010.
Steeneveld, G. J., Ronda, R. J., and Holtslag, A. A. M.: The Challenge of Forecasting the Onset and Development of Radiation Fog Using Mesoscale Atmospheric Models, Bound-Lay. Meteorol., 154, 265–289, https://doi.org/10.1007/s10546-014-9973-8, 2015.
Sun, K., Liu, H., Wang, X., Peng, Z., and Xiong, Z.: The aerosol radiative effect on a severe haze episode in the Yangtze River Delta, J. Meteorol. Res.-PRC, 31, 865–873, https://doi.org/10.1007/s13351-017-7007-4, 2017.
Tie, X., Madronich, S., Walters, S., Rasch, P., and Collins, W.: Effect of Clouds on photolysis and oxidants in the troposphere, J. Geophys. Res., 108, 4642, https://doi.org/10.1029/2003JD003659, 2003.
Wang, G., Zhang, R., Gomez, E. M., Yang, L., Zamora, L. M., Hu, M., Lin, Y., Peng, J., Guo, S., Meng, J., Li, J., Cheng, C., Hu, T., Ren, Y., Wang, Y., Gao, J., Cao, J., An, Z., Zhou, W., Li, G., Wang, J., Tian, P., Marrero-Ortiz, W., Secrest, J., Du, Z., Zheng, J., Shang, D., Zeng, L., Shao, M., Wang, W., Huang, Y., Wang, Y., Zhu, Y., Li, y., Hu, J., Pan, B., Cai, L., Cheng, Y., Ji, Y., Zhang, F., Rosenfeld, D., Liss, S. P., Duce, A. R., Kolb, E. C., and Molina J. M.: Persistent sulfate formation from London Fog to Chinese haze, P. Natl. Acad. Sci. USA, 113, 13630–13635, 2016.
Wang, H., Shi, G. Y., Zhang, X. Y., Gong, S. L., Tan, S. C., Chen, B., Che, H. Z., and Li, T.: Mesoscale modelling study of the interactions between aerosols and PBL meteorology during a haze episode in China Jing-Jin-Ji and its near surrounding region – Part 2: Aerosols' radiative feedback effects, Atmos. Chem. Phys., 15, 3277–3287, https://doi.org/10.5194/acp-15-3277-2015, 2015.
Wang, J., Wang, S., Jiang, J., Ding, A., Mei, Z., Zhao, B., Wong, D. C., Wei, Z., Zheng, G., and Long, W.: Impact of aerosol–meteorology interactions on fine particle pollution during China's severe haze episode in January 2013, Environ. Res. Lett., 9, 094002, https://doi.org/10.1088/1748-9326/9/9/094002, 2014.
Wang, K., Zhang, Y., Yahya, K., Wu, S. Y., and Grell, G.: Implementation and initial application of new chemistry-aerosol options in WRF/Chem for simulating secondary organic aerosols and aerosol indirect effects for regional air quality, Atmos. Environ., 115, 716–732, https://doi.org/10.1016/j.atmosenv.2014.12.007, 2015.
Wang, Y., Guo, J., Wang, T., Ding, A., Gao, J., Zhou, Y., Collett Jr., J. L., and Wang, W.: Influence of regional pollution and sandstorms on the chemical composition of cloud/fog at the summit of Mt. Taishan in northern China, Atmos. Res., 99, 434–442, https://doi.org/10.1016/j.atmosres.2010.11.010, 2011.
Wang, Z., Huang, X., and Ding, A.: Dome effect of black carbon and its key influencing factors: a one-dimensional modelling study, Atmos. Chem. Phys., 18, 2821–2834, https://doi.org/10.5194/acp-18-2821-2018, 2018.
Wobrock, W., Schell, D., Maser, R., Kessel, M., Jaeschke, W., Fuzzi, S., Facchini, M. C., Orsi, G., Marzorati, A., and Winkler, P.: Meteorological characteristics of the Po Valley fog, Tellus. B, 44, 469–488, https://doi.org/10.1034/j.1600-0889.1992.t01-4-00003.x, 2010.
Wu, D., Li, T. C., Ying, Z., Lau, K. H., Huang, J., Deng, X., and Bi, X.: An extremely low visibility event over the Guangzhou region: A case study, Atmos. Environ., 39, 6568–6577, https://doi.org/10.1016/j.atmosenv.2005.07.061, 2005.
Xie, Y., Ding, A., Nie, W., Mao, H., Qi, X., Huang, X., Xu, Z., Kerminen, V.-M. Petäjä, T., Chi, X., Virkkula, A., Boy, M., Xue, L., Guo, J., Sun, J., Yang, X., Kulmala, M., and Fu, C.: Enhanced sulfate formation by nitrogen dioxide: implications from in situ observations at the SORPES station, J. Geophys. Res. -Atmos., 120, 12679–12694, https://doi.org/10.1002/2015JD023607, 2015.
Yang, J., Xie, Y. J., Shi, C. E., Liu, D. Y., Niu, S. J., and Li, Z. H.: Ion Composition of Fog Water and Its Relation to Air Pollutants during Winter Fog Events in Nanjing, China, Pure. Appl. Geophys., 169, 1037–1052, https://doi.org/10.1007/s00024-011-0342-y, 2012.
Yang, Y., Smith, S. J., Wang, H., Mills, C. M., and Rasch, P. J.: Variability, timescales, and nonlinearity in climate responses to black carbon emissions, Atmos. Chem. Phys., 19, 2405–2420, https://doi.org/10.5194/acp-19-2405-2019, 2019.
Yu, H., Liu, S. C., and Dickinson, R. E.: Radiative effects of aerosols on the evolution of the atmospheric boundary layer, J. Geophys. Res.-Atmos., 107, AAC-1–AAC3-14, https://doi.org/10.1029/2001JD000754, 2002.
Yuskiewicz, B. A., Orsini, D., Stratmann, F., Wendisch, M., Wiedensohler, A., Heintzenberg, J., Martinsson, B. G., Frank, G., Wobrock, W., and Schell, D.: Changes in submicrometer particle distributions and light scattering during haze and fog events in a highly polluted environment, Contri. Atmos. Phys., 71, 33–45, 1998.
Zaveri, R. A., Easter, R. C., Fast, J. D., and Peters, L. K.: Model for simulating aerosol interactions and chemistry (MOSAIC), J. Geophys. Res., 113, D13204, https://doi.org/10.1029/2007JD008782, 2008.
Zhang, B., Wang, Y., and Hao, J.: Simulating aerosol-radiation-cloud feedbacks on meteorology and air quality over eastern China under severe haze conditions in winter, Atmos. Chem. Phys., 15, 2387–2404, https://doi.org/10.5194/acp-15-2387-2015, 2015.
Zhang, R. H., Li, Q., and Zhang, R. N.: Meteorological conditions for the persistent severe fog and haze event over eastern China in January 2013, Sci. China Earth Sci., 57, 26–35, https://doi.org/10.1007/s11430-013-4774-3, 2014.
Zhang, Y., Ding, A., Mao, H., Nie, W., Zhou, D., Liu, L., Huang, X., and Fu, C.: Impact of synoptic weather patterns and inter-decadal climate variability on air quality in the North China Plain during 1980–2013, Atmos. Environ., 124, 119–128, 2016.
Zhao, X. J., Zhao, P. S., Xu, J., Meng, W., Pu, W. W., Dong, F., He, D., and Shi, Q. F.: Analysis of a winter regional haze event and its formation mechanism in the North China Plain, Atmos. Chem. Phys., 13, 5685–5696, https://doi.org/10.5194/acp-13-5685-2013, 2013.
Zhao, C., Liu, X., Leung, L. R., Johnson, B., McFarlane, S. A., Gustafson Jr., W. I., Fast, J. D., and Easter, R.: The spatial distribution of mineral dust and its shortwave radiative forcing over North Africa: modeling sensitivities to dust emissions and aerosol size treatments, Atmos. Chem. Phys., 10, 8821–8838, https://doi.org/10.5194/acp-10-8821-2010, 2010.
Zheng, G. J., Duan, F. K., Su, H., Ma, Y. L., Cheng, Y., Zheng, B., Zhang, Q., Huang, T., Kimoto, T., Chang, D., Pöschl, U., Cheng, Y. F., and He, K. B.: Exploring the severe winter haze in Beijing: the impact of synoptic weather, regional transport and heterogeneous reactions, Atmos. Chem. Phys., 15, 2969–2983, https://doi.org/10.5194/acp-15-2969-2015, 2015.
Zou, J., Sun, J. N., Ding, A. J., Wang, M. H., Guo, W. D., and Fu, C. B.: Observation-based estimation of aerosol-induced reduction of planetary boundary layer height. Adv. Atmos. Sci., 34, 1057–1068, https://doi.org/10.1007/s00376-016-6259-8, 2017.