the Creative Commons Attribution 4.0 License.
the Creative Commons Attribution 4.0 License.
Impacts of household sources on air pollution at village and regional scales in India
Brigitte Rooney
Yuan Wang
Kelvin H. Bates
Ajay Pillarisetti
Sumit Sharma
Seema Kundu
Tami C. Bond
Nicholas L. Lam
Bora Ozaltun
Li Xu
Varun Goel
Lauren T. Fleming
Robert Weltman
Simone Meinardi
Donald R. Blake
Sergey A. Nizkorodov
Rufus D. Edwards
Ankit Yadav
Narendra K. Arora
Approximately 3 billion people worldwide cook with solid fuels, such as wood, charcoal, and agricultural residues. These fuels, also used for residential heating, are often combusted in inefficient devices, producing carbonaceous emissions. Between 2.6 and 3.8 million premature deaths occur as a result of exposure to fine particulate matter from the resulting household air pollution (Health Effects Institute, 2018a; World Health Organization, 2018). Household air pollution also contributes to ambient air pollution; the magnitude of this contribution is uncertain. Here, we simulate the distribution of the two major health-damaging outdoor air pollutants (PM2.5 and O3) using state-of-the-science emissions databases and atmospheric chemical transport models to estimate the impact of household combustion on ambient air quality in India. The present study focuses on New Delhi and the SOMAARTH Demographic, Development, and Environmental Surveillance Site (DDESS) in the Palwal District of Haryana, located about 80 km south of New Delhi. The DDESS covers an approximate population of 200 000 within 52 villages. The emissions inventory used in the present study was prepared based on a national inventory in India (Sharma et al., 2015, 2016), an updated residential sector inventory prepared at the University of Illinois, updated cookstove emissions factors from Fleming et al. (2018b), and PM2.5 speciation from cooking fires from Jayarathne et al. (2018). Simulation of regional air quality was carried out using the US Environmental Protection Agency Community Multiscale Air Quality modeling system (CMAQ) in conjunction with the Weather Research and Forecasting modeling system (WRF) to simulate the meteorological inputs for CMAQ, and the global chemical transport model GEOS-Chem to generate concentrations on the boundary of the computational domain. Comparisons between observed and simulated O3 and PM2.5 levels are carried out to assess overall airborne levels and to estimate the contribution of household cooking emissions. Observed and predicted ozone levels over New Delhi during September 2015, December 2015, and September 2016 routinely exceeded the 8 h Indian standard of 100 µg m−3, and, on occasion, exceeded 180 µg m−3. PM2.5 levels are predicted over the SOMAARTH headquarters (September 2015 and September 2016), Bajada Pahari (a village in the surveillance site; September 2015, December 2015, and September 2016), and New Delhi (September 2015, December 2015, and September 2016). The predicted fractional impact of residential emissions on anthropogenic PM2.5 levels varies from about 0.27 in SOMAARTH HQ and Bajada Pahari to about 0.10 in New Delhi. The predicted secondary organic portion of PM2.5 produced by household emissions ranges from 16 % to 80 %. Predicted levels of secondary organic PM2.5 during the periods studied at the four locations averaged about 30 µg m−3, representing approximately 30 % and 20 % of total PM2.5 levels in the rural and urban stations, respectively.
- Article
(6866 KB) - Full-text XML
- BibTeX
- EndNote
Although outdoor air pollution is widely recognized as a health risk, quantitative understanding remains uncertain on the degree to which household combustion contributes to unhealthy air. Recent studies in China, for example, show that 50 %–70 % of black carbon (BC) emissions and 60 %–90 % of organic carbon (OC) emissions can be attributed to residential coal and biomass burning (Cao et al., 2006; Klimont et al., 2009; Lai et al., 2011). Moreover, existing global emissions inventories show a significant contribution of household sources to primary PM2.5 (particulate matter of diameter less than or equal to 2.5 µm) emissions. The Indo-Gangetic Plain of northern India (23–31∘ N, 68–90∘ E) has among the world's highest values of PM2.5. In this region, the major sources of emissions of primary PM2.5 and of precursors to secondary PM2.5 are coal-fired power plants, industries, agricultural biomass burning, transportation, and combustion of biomass fuels for heating and cooking (Reddy and Venkataraman, 2002; Rehman et al., 2011). The southwest monsoon in summer months in India leads to lower pollution levels than in winter months, which are characterized by low wind speeds, shallow boundary layer depths, and high relative humidity (Sen et al., 2017). With the difficulty in determining representative emissions estimates (Jena et al., 2015; Zhong et al., 2016), simulating the extremely high PM2.5 observations in the Indo-Gangetic Plain has remained a challenge (Schnell et al., 2018).
Approximately 3 billion people worldwide cook with solid fuels, such as wood, charcoal, and agricultural residues (Bonjour et al., 2013; Chafe et al., 2014; Smith et al., 2014; Edwards et al., 2017). Used also for residential heating, such solid fuels are often combusted in inefficient devices, producing BC and OC emissions. Between 2.6 and 3.8 million premature deaths occur as a result of exposure to fine particulate matter from household air pollution (Health Effects Institute, 2018a; World Health Organization, 2018). In India, more than 50 % of households report the use of wood or crop residues, and 8 % report the use of dung as cooking fuel (Klimont et al., 2009; Census of India, 2011; Pant and Harrison, 2012). Residential biomass burning is one of the largest individual contributors to the burden of disease in India, estimated to be responsible for 780 000 premature deaths in 2016 (Indian Council of Medical Research et al., 2017). The recent GBD MAPS Working Group (Health Effects Institute, 2018b) estimated that household emissions in India produce about 24 % of ambient air pollution exposure. Coal combustion, roughly evenly divided between industrial sources and thermal power plants, was estimated by this study to be responsible for 15.3 % of exposure in 2015. Open burning of agricultural crop stubble was estimated annually to be responsible for 6.1 % nationally, although it was higher in some areas.
Traditional biomass cookstoves, with characteristic low combustion efficiencies, produce significant gas- and particle-phase emissions. An early study of household air pollution in India found outdoor total suspended particulate matter (TSP) levels in four Gujarati villages well over 2 mg m−3 during cooking periods (Smith et al., 1983). Secondary organic aerosol (SOA), produced by gas-phase conversion of volatile organic compounds to the particulate phase, is also important in ambient PM levels, yet there is a dearth of model predictions to which data can be compared. Overall, household cooking in India has been estimated by various groups to produce 22 %–50 % of ambient PM2.5 exposure (Butt et al., 2016; Chafe et al., 2014; Conibear et al., 2018; Health Effects Institute, 2018b; Lelieveld et al., 2015; Silva et al., 2016), and Fleming et al. (2018a, b) report characterization of a wide range of particle-phase compounds emitted by cookstoves. In a multi-model evaluation, Pan et al. (2015) concluded that an underestimation of biomass combustion emissions, especially in winter, was the dominant source of model underestimation. Here, we address both primary and secondary organic particulate matter from household burning of biomass for cooking.
Air quality in urban areas in India is determined largely, but not entirely, by anthropogenic fuel combustion. In rural areas, residential combustion of biomass for household uses, such as cooking, also contributes to nonmethane volatile organic carbon (NMVOC) and particulate emissions (Sharma et al., 2015, 2018). Average daily PM2.5 levels frequently exceed the 24 h Indian standard of 60 µg m−3 and can exceed 150 µg m−3, even in rural areas. The local region on which the present study focuses is the SOMAARTH Demographic, Development, and Environmental Surveillance Site (DDESS) run by the International Clinical Epidemiological Network (INCLEN) in the Palwal District of Haryana (Fig. 1). Located about 80 km south of New Delhi, SOMAARTH covers an approximate population of 200 000 in 52 villages. Particular focus in the present study is given to the SOMAARTH Headquarters (HQ) and the village of Bajada Pahari within DDESS, coinciding with the work of Fleming et al. (2018b), who studied cookstove nonmethane hydrocarbon (NMHC) emissions and ambient air quality. Demographically, with a coverage of almost 308 km2, the DDESS has a mix of populations from different religions and socioeconomic and development statuses.
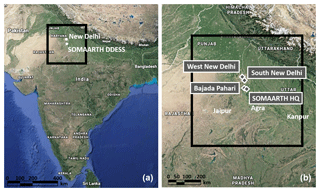
Figure 1Geographic area of simulation. Panel (a) shows the entirety of India, and (b) shows a close-up of the model domain. The domain spans a 600 km by 600 km area with a grid resolution of 4 km (150 cells along each axis) and includes both New Delhi and SOMAARTH DDESS.
The climate of the region of interest in the present study is primarily influenced by monsoons, with a dry winter and very wet summer. The rainy season, July through September, is characterized by average temperatures around 30 ∘C and primarily easterly and southeasterly winds. In a study related to the present one, Schnell et al. (2018) used emission datasets developed for the Coupled Model Intercomparison Project Phases 5 (CMIP5) and 6 (CMIP6) to evaluate the impact on predicted PM2.5 over northern India, October–March 2015–2016, with special attention paid to the effect of meteorology of the region, including relative humidity, boundary layer depth, strength of the temperature inversion, and low-level wind speed. In that work, nitrate and organic matter (OM) were predicted to be the dominant components of total PM2.5 over most of northern India.
The goal of the present work is to simulate the distribution of primary and secondary PM2.5 and O3 using recently updated emissions databases and atmospheric chemical transport models to obtain estimates of the total impact on ambient air quality attributable to household combustion. With respect to ozone, the present work follows that of Sharma et al. (2016), who simulated regional and urban ozone concentrations in India using a chemical transport model and included a sensitivity analysis to highlight the effect of changing precursor species on O3 levels. The present work is based on simulating the levels of both O3 and PM2.5 at the regional level based on recent emissions inventories using state-of-the-science atmospheric chemical transport models.
2.1 Nonresidential sectors emissions
The present study uses an emissions inventory conglomerated from two primary sources: (1) an India-scale inventory for all nonresidential sectors prepared by TERI (Sharma et al., 2015, 2016) and (2) a high-resolution residential sector inventory detailed here. Emissions data from each source were distributed to a 4 km grid for the present study. The TERI national inventory was prepared at a resolution of 36 km × 36 km using the Greenhouse Gas and Air Pollution Interactions and Synergies (GAINS ASIA) emission model (Amann et al., 2011). GAINS ASIA estimated emissions based on energy and nonenergy sources using an emission factor approach after taking into account various fuel-sector combinations. Following the approach of Kilmont et al. (2002), the emissions were estimated using the basic equation:
where E denotes the pollutant emissions (in kt); k, l, m, and n are region, sector, fuel or activity type, and control technology, respectively; A is the activity rate; ef is the unabated emission factor (kt per unit of activity); η is the removal efficiency (%∕100); and X is the application rate of control technology n (%∕100) where . The energy sources considered include coal, natural gas, petroleum products, biomass fuels, and others and are categorized into five sectors – transport, industries, residential, power, and others. The model uses the state-wise energy data and generates emissions of species such as PM, NOx, SO2, NMVOCs, NH3, and CO.
For activity data of source sectors, TERI employed published statistics (mainly population, vehicle registration, energy use, and industrial production) where possible. Energy-use data for industry and power sectors were compiled based on a bottom-up approach, collected from the Ministry of Petroleum and Natural Gas (MoPNG, 2010), the Central Statistics Office (CSO, 2011), and the Central Electricity Authority (CEA, 2011). Transportation activity data were compiled from information on vehicle registrations (Ministry of Road Transport and Highways, 2011), emission standards (MoPNG, 2001), travel demand (CPCB, 2000), and mileage (TERI, 2002). Emission factors for energy-based sources from the GAINS ASIA database were used. Speciation factors are adopted from sector-specific profiles from Wei et al. (2014), primarily developed for China as there is a lack of information for India. In the transportation sector, the Chinese species profiles are dependent on fuel type but not technology.
The TERI inventory was compiled on a yearly basis, with monthly variations for brick kilns and agricultural burning, at a native resolution of 36 km × 36 km then equally distributed to grid resolution of 4 km × 4 km for this study. Emissions for nonresidential sectors have no specified diurnal or daily variations; thus, the inventory for nonresidential sectors is the same for each simulated day. Transportation sector emissions were estimated using population and vehicle fleet data at the district level and distributed to the grid using the administrative boundaries. Industry, power, and oil and gas sector emissions were assigned to the grid by their respective locations. Emissions from agriculture were allocated by crop-types produced by state in India. The inventory was vertically distributed to three layers with the lowest layer extending to 30–43 m, the middle layer to 75–100 m, and the top layer to 170–225 m. Volatile organic compound (VOC) emissions were assumed to occur only in the bottom layer. Industry and power emissions were distributed based on stack heights and allocated to the second and third layers.
We incorporated biogenic emissions by using daily-averaged emission rates of isoprene (0.8121 moles s−1) and terpenes (0.8067 moles s−1) per 4 km grid cell, predicted by GEOS-Chem for the region of study. The TERI inventory additionally includes isoprene emissions from the residential sector, so isoprene from natural sources was calculated as the difference of the total rate predicted by GEOS-Chem and the rate of emissions solely from the residential sector. Terpene emissions are assumed to occur only in nonresidential source sectors. Isoprene and terpene emission rates were applied to all computational cells as an hourly average (with no diurnal profile) in the nonresidential inventory.
2.2 Residential sector emissions
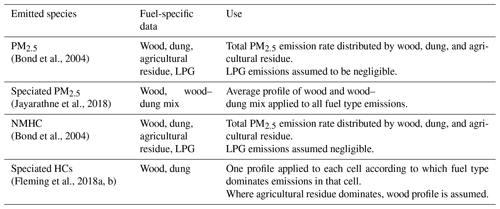
To examine local and regional impacts of residential sector emissions in greater detail, an update to the TERI inventory was performed using various sources to consider more granular input data specific to the residential sector (Table 1). Bottom-up estimates of delivered energy for cooking, space heating, water heating, and lighting were informed by those used in Pandey et al. (2014) and converted to fuel consumption at the village level using population size and percentage of reported primary cooking and lighting fuels from the 2011 Census of India (2011). Urban areas of the domain were assumed to have the average cooking and lighting fuel use profiles of the average urban areas of their district. Fuel consumption was converted to emission rates using fuel-specific emission factors informed by a review of field and laboratory studies, which was used to update the Speciated Pollutant Emissions Wizard (SPEW) inventory (Bond et al., 2004) and to generate summary estimates by fuel type. Hourly emissions were generated using source-specific diurnal emissions profiles (Fig. 2). The same diurnal emissions profile is applied to all species from a source category and was informed by real-time emissions measurements taken in homes during cooking reported by Fleming et al. (2018a, b). Profiles for fuel-based lighting were informed by real-time measurements of kerosene lamp usage data reported in Lam et al. (2018). The residential sector inventory represents surface emissions with a native spatial resolution of 30 arcsec (∼1 km).
Table 1Residential emissions inventory sources by species.
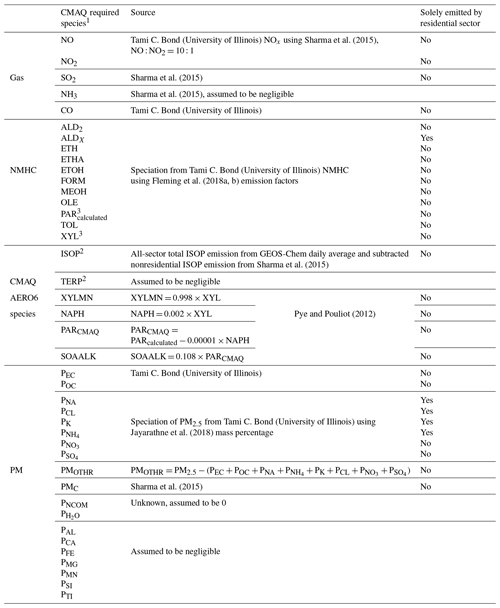
1 Bolded species contribute to SOA production via the AERO6 module. 2 Total isoprene and terpene emissions from all sectors are taken from GEOS-Chem and were included only in the O3 simulations. 3 PARcalculated and XYL are excluded from CMAQ and replaced with PARCMAQ, XYLMN, NAPH, and SOAALK.
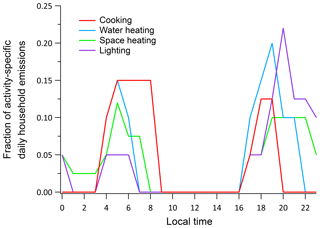
Figure 2Fraction of daily household emissions by quantifiable fuel-use activity. Red, green, blue, and purple indicate cooking, space heating, water heating, and lighting, respectively. This represents the fraction of activity-specific daily emissions at each hour. Each species obeys the same profile. While profiles for heating are shown, the inventory assumes temperatures too high for this activity to take effect.
In deriving summary estimates of emission factors, priority was given to emission factor measurements from field-based studies. Several studies have shown that laboratory-based measurements of stove and lighting emissions tend to be lower than those of devices measured in actual homes (Roden et al., 2009), perhaps due to higher variation in fuel quality and operator behavior. Field-based emission factors utilized in this study include those for nonmethane hydrocarbons, measured from fuels and stoves within the study domain (Fleming et al., 2018a, b). PM2.5 speciation from cooking fires was informed by Jayarathne et al. (2018) (Tables 2 and 3). Residential emission rates for PM2.5, BC, OC, CO, NOx, CH4, CO2, and NMHCs were generated from SPEW, which estimates emissions from combustion by fuel type. As such, solvent emissions are not included for lack of specific input data. Additionally, while SPEW incorporates temperature-dependent heating combustion activity, the inventory assumes temperatures too high for this activity to take effect. Thus, our inventory has no emissions from heating.
Table 3PM2.5 speciation by fuel type.
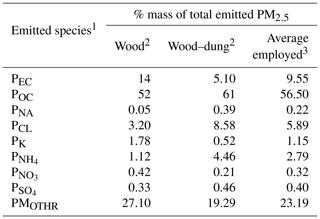
1 Total PM2.5 mass emission rates from residential combustion were estimated and distributed by fuel type (wood, dung, or agricultural residue) by University of Illinois. 2 Emitted PM2.5 weight percent reported by Jayarathne et al. (2018). 3 An average profile applied to all cells, indiscriminate of fuel type.
We employed various methods to account for pollutant species not explicitly reported by SPEW (Tables 1 and 2). Gas-phase SO2 and NH3 emissions were informed by existing residential emissions in the TERI inventory (Sharma et al., 2015); NO and NO2 were estimated from NOx emissions, assuming a NO : NO2 emission ratio of 10 : 1. Total NMHC and PM2.5 emission factors from SPEW are distributed by fuel type (wood, dung, agriculture residue, or LPG) (Table 2). Given the low PM2.5 emission rate of LPG (Shen et al., 2018), emissions from LPG are assumed to be negligible. To further speciate NMHCs, we employed HC species-specific emission factors (Fleming et al., 2018b), differentiated by fuel and stove type (i.e., traditional stove, or chulha, with wood or dung, and simmering stove, or angithi, with dung). We assume that all NMHC emissions in each computational grid cell are produced by either wood or dung, whichever contributes the greater fraction of total PM2.5 emissions in that cell (Fig. 3). The NMHC emission profile of dung was assumed to be the average of measurements from chulha and angithi stoves. The emission profile for agricultural residue is similar to that of wood; therefore, wood speciation profiles are applied in cells where agricultural residue dominates.
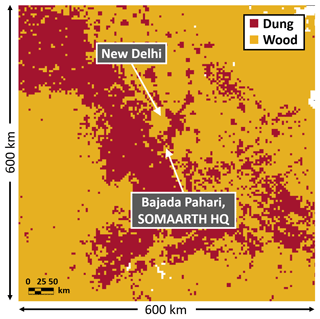
Figure 3Fuel type assumed for speciation of household NMHC emissions. Study domain: 600 km by 600 km at 4 km resolution. Red indicates cells where dung use dominated emissions and thus was assumed to be the sole fuel type used. Orange indicates cells where wood and agricultural residue use dominated emissions and was thus assumed to be the sole fuel type used.
Particle-phase speciation of total PM2.5 was based on PM mass emissions from wood- and wood–dung-fueled cooking fires as reported by Jayarathne et al. (2018), and primary cooking fuel type distribution data from the 2011 census (Tables 2 and 3). A single PM2.5 speciation profile, defined as the average of that of wood and that of the wood–dung mixture, was applied in all cells for lack of information on pure dung emissions (Table 3). Noncarbon organic particulate matter (PNCOM) and particulate water (P) were assumed to be negligible owing to a lack of information on these species. Emissions of remaining particle-phase species (i.e., Al, Ca, Fe, Mg, Mn, Si, and Ti) were also assumed to be negligible for lack of information. Unspeciated fine particulate matter (PMothr) is defined in CMAQ as the portion of total PM2.5 unassigned to any other species:
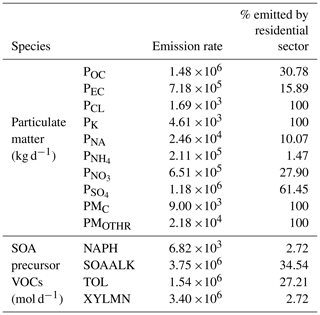
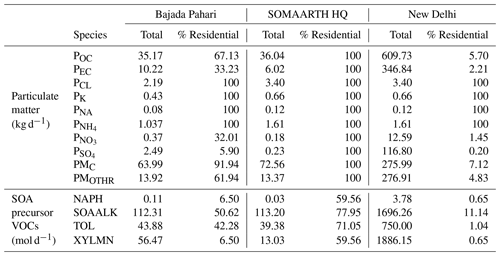
Tables 4 and 5 summarize emission rates for the study domain.
To study the impact of household emissions on ambient air pollution, we simulated two emission scenarios each for three time periods which coincide with available INCLEN observation data (Tables 6 and 7). A “total” emission scenario represents the overall atmospheric environment by including emissions from all source sectors in the inventory. A “nonresidential” emission scenario represents zeroing-out or “turning-off” of all household emissions. By considering these scenarios independently, we can isolate the effect of the residential sector on the ambient atmosphere. Each scenario was simulated over a region in northern India (Fig. 1) for those periods when measurements were carried out in the region of interest. Figure 1 shows the 600 km by 600 km domain with 4 km grid resolution. The domain is centered over the Palwal District and the SOMAARTH DDESS and includes New Delhi and portions of surrounding states.
Table 6Ambient observation data availability.
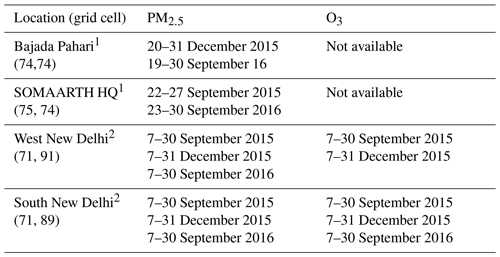
1 Data from the International Epidemiological Clinical Network. Observations at Bajada Pahari are the average of two monitoring locations that coincide within the same grid cell. 2 Data from the Central Pollution Control Board of India at New Delhi Punjabi Bagh monitoring station.
Table 7Simulation durations.

1 Five days prior to date shown were run and omitted from analysis as spinup. 2 One day prior to date shown was run and omitted from analysis as spinup. 3 GEOS-Chem was run for 1 year before extracting atmospheric diagnostics.
Simulation of regional air quality was carried out using the US Environmental Protection Agency Community Multiscale Air Quality modeling system (CMAQ), version 5.2 (Appel et al., 2017; US EPA, 2017). CMAQ is a three-dimensional chemical transport model (CTM) that predicts the dynamic concentrations of airborne species. CMAQ includes modules of radiative processes, aerosol microphysics, cloud processes, wet and dry deposition, and atmospheric transport. Required input to the model includes emissions inventories, initial and boundary conditions, and meteorological fields. The domain-specific, gridded emissions inventory provides hourly-resolved total emission rates for each species (not differentiated by source) by cell, time step, and vertical layer. Initial conditions (ICs) and boundary conditions (BCs) are necessary to define the atmospheric chemical concentrations in the domain at the first time step and at the domain edges, respectively. The present study uses the global chemical transport model GEOS-Chem v11-02c (http://acmg.seas.harvard.edu/geos/index.html, last access: 28 May 2019) to generate concentrations on the boundary of the computational domain. Meteorological conditions (including temperature, relative humidity, wind speed and direction and land use and terrain data) drive the atmospheric processes represented in CMAQ. The Weather Research and Forecasting modeling system (WRF) Advanced Research WRF (WRF-ARW, version 3.6.1) was used to simulate the meteorological input for CMAQ (Skamarock et al., 2008).
3.1 GEOS-Chem
We used GEOS-Chem v11-02c, a global chemical transport model driven by assimilated meteorological observations from the NASA Goddard Earth Observing System Fast Processing (GEOS-FP) of the Global Modeling and Assimilation Office (GMAO), to simulate the boundary conditions for the CMAQ modeling. Simulations are performed at horizontal resolution with 72 vertical layers, including both the full tropospheric chemistry with complex SOA formation (Marais et al., 2016) and UCX stratospheric chemistry (Eastham et al., 2014). Emissions used the standard HEMCO configuration (Keller et al., 2014), including EDGAR v4.2 anthropogenic emissions (http://edgar.jrc.ec.europa.eu/overview.php?v=42, last access: 28 May 2019), biogenic emissions from the MEGAN v2.1 inventory (Guenther et al., 2012), and GFED biomass burning emissions (http://www.globalfiredata.org, last access: 28 May 2019). Simulations were run for 1 year, after which hourly time series diagnostics were compiled for the CMAQ modeling period. Using the PseudoNetCDF processor, we remapped a subset of the 616 GEOS-Chem-produced species to CMAQ species (https://github.com/barronh/pseudonetcdf, last access: 28 May 2019). The resulting ICs and BCs include 119 gas- and particle-phase species, 80 adapted from GEOS-Chem and the remaining 39 (including OH, HO2, ROOH, oligomerized secondary aerosols, coarse aerosol, and aerosol number concentration distributions) from the CMAQ default initial and boundary conditions data (which were developed to represent typical clean-air pollutant concentrations in the United States).
3.2 Weather Research and Forecasting (WRF) model
Three monthly WRF version 3.6.1 simulations were conducted in the absence of nudging or data assimilation. The large-scale forcing to generate initial and boundary meteorological fields is adopted from the latest version of the European Centre for Medium-Range Weather Forecasts (ECMWF) ERA5 released in January 2019 (Copernicus Climate Change Services, 2017). These reanalysis data are on a 31 km grid and resolve the atmosphere using 137 levels from the surface to a height of 80 km. WRF simulations were performed with 4 km horizontal resolution and 24 vertical layers (the lowest layer of about 50 m depth), consistent with the setup of the CMAQ model. No cumulus parameterization was used in the simulations. Meteorological outputs from WRF were prepared as inputs to CMAQ by the Meteorology-Chemistry Interface Processor (MCIP) version 4.4 (Otte et al., 2010).
3.3 Community Multiscale Air Quality (CMAQ) modeling system
Within the chemical transport portion of CMAQ, there are two primary components: a gas-phase chemistry module and an aerosol chemistry, gas-to-particle conversion module. The present study employs a CMAQ-adapted gas-phase chemical mechanism, CB6R3 (derived from the Carbon Bond Mechanism 06) (Yarwood et al., 2010), and the aerosol-phase mechanism, AERO6, which define the gas-phase and aerosol-phase chemical resolution. The present study considers 70 NMHC compounds lumped into 12 groups of VOCs. The emissions inventory provides emission rates for 28 chemical species, including 18 gas-phase species and 10 particle-phase species. The CB6R3 adaptation describes atmospheric oxidant chemistry with 127 gas-phase species and 220 gas-phase reactions, including chlorine and heterogenous reactions. The CMAQ aerosol module (AERO6) describes aerosol chemistry and gas-to-particle conversion with 12 traditional SOA precursor classes, and 10 semivolatile primary organic aerosol (POA) precursor reactions. The majority of the gas-phase organic species are apportioned to lumped groups by their carbon bond characteristics, such as single bonds, double bonds, ring structure, and number of carbons. Some organic compounds are apportioned based on reactivity, and others, like isoprene, ethene, and formaldehyde, are treated explicitly.
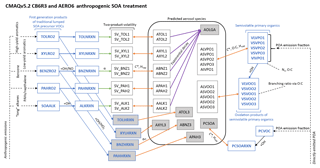
Figure 4Treatment of anthropogenic SOA in CMAQv5.2. Predicted aerosol species are included in the black box. Species in white boxes are semivolatile and species in gray boxes are nonvolatile. Blue indicates species and processes predicted by CB6R3. All other coloring indicates the AERO6 mechanism where green arrows are two-product volatility distribution, orange arrows are particle- and vapor-phase partitioning, and purple arrows are oligomerization. In AERO6, anthropogenic and biogenic VOC emissions (lumped by category) are oxidized by OH, NO, and HO2 and OH, O3, NO, and NO3 respectively, to semivolatile products that undergo partitioning to the particle phase (Pye et al., 2015). Semivolatile primary organic pathways in CMAQv5.2 are described by Murphy et al. (2017).
The secondary organic aerosol module, AERO6, developed specifically for CMAQ, interfaces with the gas-phase mechanism, predicts microphysical processes of emission, condensation, evaporation, coagulation, new particle formation, and chemistry, and produces a particle size distribution comprising the sum of the Aitken, Accumulation, and Coarse log-normal modes (Fig. 4). AERO6 predicts the formation of SOA from anthropogenic and biogenic VOC precursors (properties of which are shown in Table 8), as well as semivolatile POA and cloud processes. CB6R3 accounts for the oxidation of the first-generation products of the anthropogenic lumped VOCs: high-yield aromatics, low-yield aromatics, benzene, PAHs, and long-chain alkanes (Pye and Pouliot, 2012).
Table 8Properties of anthropogenic traditional semivolatile SOA precursors in CMAQv5.2. NA denotes not applicable.
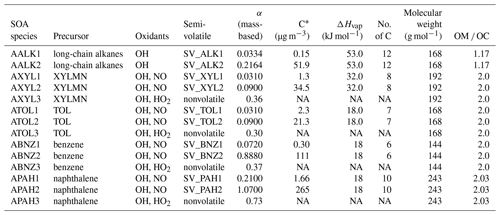
The semivolatile reaction products of “long alkanes” (SV_ALK1 and SV_ALK2) are parameterized by Presto et al. (2010). Values for “low-yield aromatics” products (SV_XYL1 and SV_XYL2) are based on xylene, with the enthalpy of vaporization (ΔHvap) from studies of m-xylene and 1,3,5-trimethylbenzene. ΔHvap for products of “high-yield aromatics” (SV_TOL1 and SV_TOL2) are based on the higher end of the range for toluene. The products of benzene (SV_BNZ1 and SV_BNZ2) assume the same value for ΔHvap. All semivolatile aromatic products are assigned stoichiometric yield (α) and effective saturation concentration (C*) values from laboratory measurements by Ng et al. (2007). Remaining parameters for PAH reaction products (SV_PAH1 and SV_PAH2) are taken from Chan et al. (2009). Properties of semivolatile primary organic aerosol precursors are given in Murphy et al. (2017).
Table 9Quantification of WRF model biases in meteorological fields.
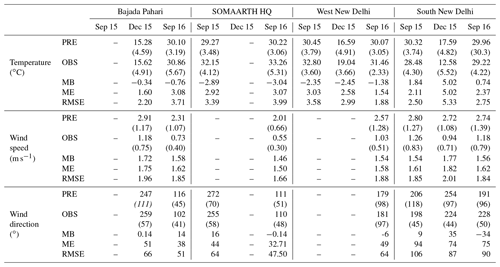
PRE is mean predictions. OBS is mean observations. MB is mean bias. ME is mean error. and RMSE is root mean square error. Standard deviation of predictions and observations are noted in parentheses.
In addition to SOA formation from traditional precursors, CMAQv5.2 accounts for the semivolatile partitioning and gas-phase aging of POA using the volatility basis set (VBS) framework independently from the rest of AERO6 (Murphy et al., 2017). The module distributes directly emitted POA (as the sum of primary organic carbon, POC, and noncarbon organic matter, NCOM) from the emissions inventory input into five new emitted species grouped by volatility: LVPO1, SVPO1, SVPO2, SVPO3, and IVPO1 (where LV is low volatility, SV is semivolatile, IV is intermediate volatility, and PO is primary organic). POA is apportioned to these lumped vapor species using an emission fraction and is oxidized in CB6R3 by OH to LVOO1, LVOO2, SVOO1, SVOO2, and SVOO3 (where OO denotes oxidized organics) with stoichiometric coefficients derived from the 2D-VBS model. AERO6 then partitions the semivolatile primary organics and their oxidation products to the aerosol phase (Fig. 4). Thus, the treatment of POA as semivolatile products leads to an additional twenty species, a particle- and vapor-phase component for each primary organic and oxidation product (Murphy et al., 2017).
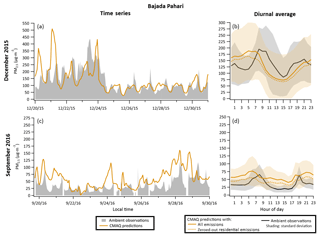
Figure 6Measured and predicted PM2.5 (a, c) and average diurnal cycle (b, d) in Bajada Pahari for 20–31 December 2015 (a, b) and 20–30 September 2016 (c, d). Here the yellow lines correspond to CMAQ predictions of the “total” (solid) and “nonresidential” (dotted) simulations. The solid black line represents ambient observations. Standard deviations of the diurnal profiles for observations and predictions are indicated, respectively, by colored shading. Diurnal profiles were averaged over simulation durations (Table 7). Computations were carried out at 4 km resolution.
Emissions inventory modifications were required to match the most recent aerosol module, AERO6, in the CMAQ model. Initially, the lumped emissions of PAR (a lumped VOC group characterized by alkanes) and XYL (a lumped VOC group characterized by xylene) derived from grouping specific NMHCs, calculated using the University of Illinois estimation and the Fleming et al. (2018a) emission factors, accounted for characteristics of naphthalene (NAPH) and SOA-producing alkanes (SOAALK), which are not individually described by any of the sources used to construct the inventory. Moreover, only a subset of VOCs in the plume could be measured. However, CMAQv5.2 simulations incorporate a surrogate species, potential secondary organic aerosol from combustion emissions (pcSOA), to address sources of missing SOA, including unspeciated emissions of semivolatile and intermediate volatility organic compounds. AERO6 predicts the formation of SOA from NAPH and SOAALK independently as well as from XYL and PAR; these secondary aerosol precursor emission rates are calculated with the following:
where XYLMN, NAPH, PARCMAQ, and SOAALK are the new inventory species (Pye and Pouliot, 2012). SOA-producing alkanes are treated separately in AERO6.
Gas-phase air quality data analyzed in the present study come from the Central Pollution Control Board (CPCB) of the Ministry of Environment, Forest & Climate Change of the Government of India at two sites in New Delhi (one in the west, and one in the south) (CPCB, 2019). The particle-phase data analyzed come from the SOMAARTH Demographic, Development, and Environmental Surveillance Site (Mukhopadhyay et al., 2012; Pillarisetti et al., 2014; Balakrishnan et al., 2015) managed by INCLEN. Palwal District has a population of ∼ 1 million over an area of 1400 km2. In this district, ∼ 39 % of households utilize wood burning as their primary cooking fuel, with dung (∼ 25 %) and crop residues (∼ 7 %) (Census of India, 2011). The specific sites studied are the SOMAARTH HQ in Aurangabad (15 km south of Palwal) and the village of Bajada Pahari (8 km northwest of SOMAARTH HQ). Ambient measurement sites are shown in Fig. 1, and Table 6 details available data for each location. We used meteorological data (hourly surface temperature and near-surface wind speed and direction) from INCLEN and CPCB at the two rural and two urban sites, respectively, to evaluate the WRF simulations performance.
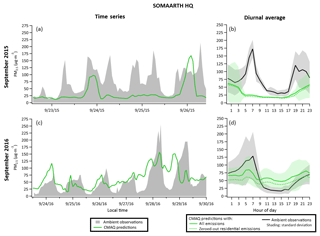
Figure 7Measured and predicted PM2.5 (a, c) and average diurnal cycle (b, d) at SOMAARTH HQ for 20–31 December 2015 (a, b) and 20–30 September 2016 (c, d). Here the green lines correspond to CMAQ predictions of the “total” (solid) and “nonresidential” (dotted) simulations. The solid black line represents ambient observations. Standard deviations of the diurnal profiles for observations and predictions are indicated by gray and green colored shading, respectively. Diurnal profiles were averaged over simulation durations (Table 7). Computations were carried out at 4 km resolution.
5.1 WRF evaluation
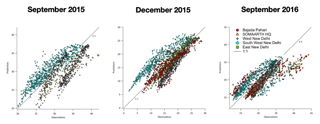
We evaluated WRF-simulated meteorology against the available surface observations at different sites during the same periods. Figure 5 shows that there is generally good agreement in surface temperature between WRF and observations for all three months. The surface wind direction is found to be consistent between model and observations for each site and each month (Table 9). The simulated near-surface wind speeds are overestimated in WRF, with an averaged mean bias (MB) of about +1.5 m s−1. Such a bias is partly a result of the difference in the definition of “near-surface” between the model and observations.
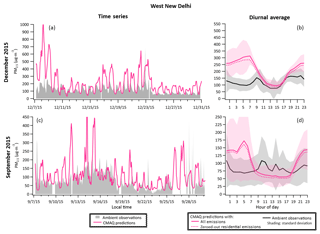
Figure 8Measured and predicted PM2.5 (a, c) and average diurnal cycle (b, d) in West New Delhi for 20–31 December 2015 (a, b) and 20–30 September 2016 (c, d). Here the pink lines correspond to CMAQ predictions of the “total” (solid) and “nonresidential” (dotted) simulations. The solid black line represents ambient observations. Standard deviations of the diurnal profiles for observations and predictions are indicated by gray and pink colored shading, respectively. Diurnal profiles were averaged over simulation durations (Table 7). Computations were carried out at 4 km resolution.
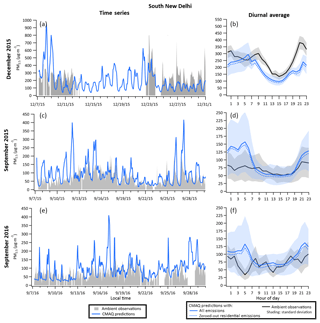
Figure 9Measured and predicted PM2.5 (a, c, e) and average diurnal cycle (b, d, f) in South New Delhi for 20–31 December 2015 (a, b) and 20–30 September 2016 (c–f). Here the blue lines correspond to CMAQ predictions of the “total” (solid) and “nonresidential” (dotted) simulations. The solid black line represents ambient observations. Standard deviations of the diurnal profiles for observations and predictions are indicated by gray and blue colored shading, respectively. Diurnal profiles were averaged over simulation durations (Table 7). Computations were carried out at 4 km resolution.
5.2 Particulate matter
Figures 6–9 show measured and predicted total PM2.5 and the average diurnal profile at each site for the periods with available measurements. The diurnal profile in these figures includes that of both emission scenarios: the total scenario with all emissions and the nonresidential scenario with zeroed-out residential sector. The simulations capture the general trend well and produce significant diurnal profiles (Table 10). Rural sites show typical PM2.5 levels are predicted between 50 and 125 µg m−3 in December and 25 and 75 µg m−3 in September months (Figs. 6 and 7). On the other hand, typical values at urban sites range from 100 to 300 µg m−3 in December and 50 to 125 µg m−3 in September months (Figs. 8 and 9). Observations and predictions show higher PM2.5 levels in December than September, owing to frequent temperature inversions in winter and shallower planetary boundary layers. Two daily peaks and lows of PM2.5 compare with ambient observations at Bajada Pahari in December 2015 and September 2016, SOMAARTH HQ in September 2015 and 2016, West New Delhi in December 2015, and South New Delhi in December and September 2015. Average daily PM2.5 levels regularly exceed the 24 h Indian standard of 60 µg m−3 in each month in both rural and urban locations, surpassing even double the standard in the village of Bajada Pahari during mealtimes in December. Afternoon minima tend to be underestimated in September and December 2015. Diurnal trends of PM2.5 were weaker in September 2016 than the other months, with lower predictions but overestimated minima. Urban sites show greater overestimation than rural sites. This is likely due in part to the granularity of the primary emissions inventory datasets. The nonresidential sector was prepared from data with a native resolution of 36 km, while the residential sector used data with ∼ 1 km resolution. Underpredictions of peak PM2.5 concentrations in September could also result because the emission inventory does not account for day-to-day variations, especially in the agricultural burning sector in which emissions can change significantly on a daily basis. Observed and predicted PM2.5 levels in New Delhi can exceed 300 µg m−3, especially in winter. In this highly populated urban environment, particulate matter levels are more than double those reported in the nearby rural areas. The employed emissions inventory specifies particulate matter surface emissions, which surpass those of Bajada Pahari and SOMAARTH HQ more than 30-fold (Table 5). Biogenic emissions are predicted to be of little importance, accounting for less than 10 % on average of total PM2.5 concentrations for most stations and months (Table 10).
Table 10CMAQ model performance and summary statistics.
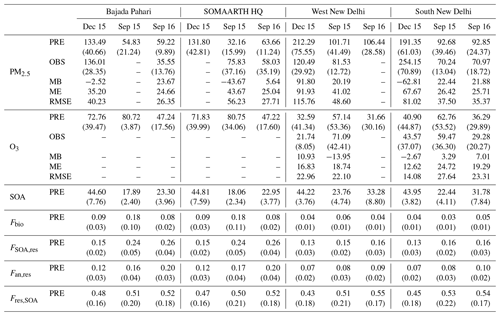
Statistics are calculated for average diurnal profiles of predicted parameters. PM2.5, O3, and SOA are the mass concentrations in micrograms per cubic meter (µg m−3) of total fine particulate matter, ozone, and secondary organic matter, respectively. Fbio is the fraction of total PM2.5 that is produced by biogenic emissions, FSOA,res is the fraction of total secondary organic matter attributable to the residential sector, Fan,res is the fraction of total anthropogenic PM2.5 attributable to the residential sector, and Fres,SOA is the fraction of residential PM2.5 attributable to SOA. PRE is mean predictions, OBS is mean observations, MB is mean bias, ME is mean error, and RMSE is root mean square error. Standard deviation of predictions and observations are noted in parentheses.
Figure 10 shows CMAQ predictions of secondary organic PM2.5 (SOA). Like PM2.5, SOA is typically predicted to be higher in New Delhi than in the rural sites, due to higher PM2.5 and precursor VOC emissions and ambient concentrations in urban environments (Tables 5 and 6). Higher levels are similarly attained in December than in September due to longer residence times and more aging during winter. SOA has high day-to-day variability. Values range from below 20 µg m−3 to over 200 µg m−3 in December, with average peaks up to 55 µg m−3 at the rural sites. September months predict lower SOA, ranging from 10 to 130 µg m−3. Diurnal average SOA maximum in December for the rural stations is nearly double that of September 2016, which can be attributed to temperature inversions and a shallower planetary boundary layer in winter.
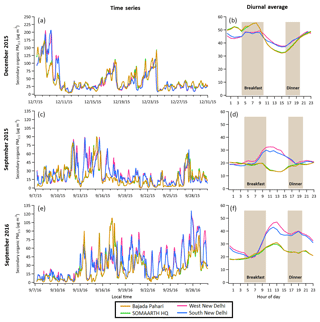
Figure 10Predicted secondary organic PM2.5 (a, c, e) and average diurnal cycle (b, d, f) for 20–31 December 2015 (a, b), 7–30 September 2015 (c, d), and 20–30 September 2016 (e, f). Bajada Pahari is shown in yellow, SOMAARTH HQ in green, West New Delhi in pink, and South New Delhi in blue. Diurnal profiles were averaged over simulation durations (Table 7). Computations were carried out at 4 km resolution. Statistics are shown in Table 10.
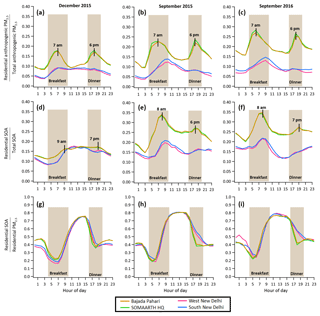
Figure 11Average diurnal (a–c), (d–f), and (g–i). Bajada Pahari is shown in yellow, SOMAARTH HQ in green, West New Delhi in pink, and South New Delhi in blue. Shading indicates mealtimes. Residential PM is calculated as the difference in predictions from the nonresidential and total emission scenario and averaged over simulation durations (Table 7). Computations were carried out at 4 km resolution. Statistics are shown in Table 10.
The significance of household emissions on outdoor PM2.5 concentrations is demonstrated by the diurnal profiles in Fig. 11. Figure 11a, b, and c the predicted contribution of the residential sector to anthropogenic PM2.5, while Fig. 11 d, e, and f describe the predicted contribution of the residential sector to secondary organic PM2.5, as in Eqs. (7) and (8) respectively:
Figure 11g, h, and i show the predicted SOA portion of residential PM2.5, as
where residential PM is calculated as the difference in predictions from the nonresidential and total emission scenario and averaged over simulation durations (Table 7). The importance of household emissions to ambient PM is strongly correlated with mealtimes. Predicted maximum contributions to anthropogenic PM2.5 in Bajada Pahari and SOMAARTH HQ are about double that of South and West New Delhi for each month. Household energy use is estimated to account for up to 27 % of anthropogenic PM2.5 (at SOMAARTH HQ during September 2016), remaining consistently above 10 % for each rural site during all months. Similar behavior is predicted for SOA (Fig. 11b, e, and h). An estimated 15 % to 34 % of secondary organic matter is attributable to residential emissions in September and 2016. Again, the impact is smaller in West and South New Delhi (up to 19 % and 21 %, respectively in September 2016), where there are greater emissions of SOA precursors from other sectors. The diurnal profile of the contribution to SOA is subdued for all sites in December, suggesting that SOA generation is less efficient in winter when radiation and temperatures are lower. The aging of VOCs is captured by the phase shift of the impact on SOA daily trend, where peaks consistently occur an hour after the residential sector shows the greatest importance to anthropogenic PM2.5.
At each measurement site during all months, SOA is predicted to make up more than 40 % of PM2.5 produced by the residential sector on average (Fig. 11g–i). SOA is least significant to residential PM2.5 in the first half of mealtimes (∼ 20 % during breakfast and ∼ 40 % during dinner) at rural sites, when primary particulate matter is largest. The aging of precursor VOCs from cooking emissions, paired with maximum incoming radiation, leads to maximum values in early afternoon, when SOA accounts for more than 75 % of residential PM2.5 at both rural and urban sites during each simulated month.
The fractional contribution of total SOA to total PM2.5 is shown in Fig. 12. While concentrations of SOA depend significantly on the site and time period, their contribution to total PM2.5 shows little variation. At all stations, SOA is predicted to make up to 55 % of PM2.5 in September months and to be most significant around midday. However, diurnal variation of the significance of SOA is greater in New Delhi than in Bajada Pahari or SOMAARTH HQ, owing to greater diversity of energy-use activities and emissions characteristics in the urban environment.
5.3 Ozone
The 8 h India Central Pollution Control Board (CPCB) standard for ozone is 100 µ m−3 for an 8 h average. In the alternative unit of ozone mixing ratio, a mass concentration of ozone of 100 µg m−3 at a temperature of 298 K at the Earth's surface equates to a mixing ratio of 51 parts per billion (ppb). A number of atmospheric modeling studies of ozone over India exist (Kumar et al., 2010; Chatani et al., 2014; Sharma et al., 2016).
Sharma et al. (2016) carried out baseline CMAQ simulations for 2010 and compared ozone predictions with measurements at six monitoring locations in India (Thumba, Gādanki, Pune, Anantpur, Mt. Abu, and Nainital). Also carried out were sensitivity simulations in which each emissions sector (transport, domestic, industrial, power, etc.) was systematically set to zero. The domestic sector was predicted to contribute ∼ 60 % of the nonmethane volatile organic carbon emissions, followed by 12 % from transportation and 20 % from solvent use and the oil and gas sector. The overall NOx-to-VOC mass ratio in the region simulated by Sharma et al. (2016) was 0.55. This exceptionally low NOx-to-VOC ratio was attributed, in part, to the widespread use of biomass fuel for cooking (leading to high VOC emissions), coupled with relatively low NOx emissions. (Although vehicle emissions are high in urban areas, overall vehicle ownership is relatively low at the national level. In addition, Euro-equivalent norms have led to a reduction in NOx emissions.) Predicted O3 levels at the six observation sites tended to exceed measured values, with the ratio of predicted to observed annual average O3 being in the range of 1.04–1.37 at the six locations. Moreover, the overall low NOx-to-VOC ratios in India lead to NOx-sensitive O3 formation conditions. Based on emissions inventories, the overall anthropogenic NMVOC ∕ NOx mass emissions ratio in India in 2010 as computed by Sharma et al. (2016) was 1.82. Considering only ground-level sources, the ratio increases to 3.68.
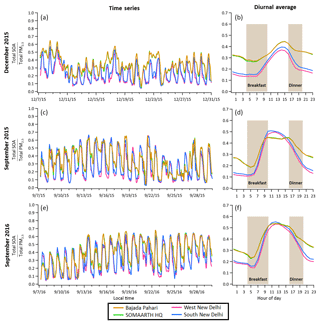
Figure 12Predicted (a, c, e) and average diurnal cycle (b, d, f) for 20–31 December 2015 (a, b), 7–30 September 2015 (c, d), and 20–30 September 2016 (e, f). Bajada Pahari is shown in yellow, SOMAARTH HQ in green, West New Delhi in pink, and South New Delhi in blue. Diurnal profiles were averaged over simulation durations (Table 7). Computations were carried out at 4 km resolution.
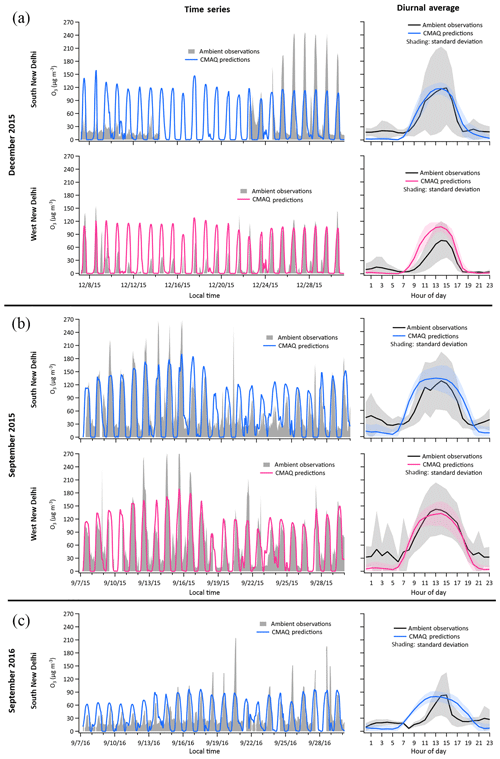
Figure 13Predicted O3 (left) and average diurnal cycle (right) for 20–31 December 2015 (a), 7–30 September 2015 (b), and 20–30 September 2016 (c) in West New Delhi (pink), and South New Delhi (blue). Standard deviations of the diurnal profiles for observations and predictions are indicated, respectively, by colored shading. Diurnal profiles were averaged over simulation durations (Table 7). Computations were carried out at 4 km resolution.
Ozone surface measurements and predicted mass concentrations based on the CMAQ 4 km resolution simulations at two sites in New Delhi over the periods 7–29 September 2015, 7–30 December 2015, and 7–29 September 2016 in the present study are shown in Fig. 13a–c. The predicted O3 concentrations are reproduced well at the West New Delhi and South New Delhi stations, especially in September (Table 10). However, when NO concentrations are higher due to meteorological inversion conditions, ozone concentrations are underestimated, as local NO+O3 titration reactions near the monitoring site are not resolved. The performance of the model improves with regard to its prediction of higher values of ozone (as in the case of September), which are of greater importance for assessing exposures. High ozone concentrations in September are quite well reproduced by the model. This shows that, on the larger scale, the model captures photochemistry quite well; however, micro-scale titration is not well represented due to the limitations of inventory resolution. This would require further enhancement of emission inventories at even higher resolution. The results of ozone simulations in the present study are generally consistent with those of previous simulations over India. For example, also using WRF-CMAQ, Kota et al. (2018) showed that the relative bias in ozone simulation ranges from −30 % to +50 % in the major cities of India. In South New Delhi, the bias in O3 predictions in the present study lies between −2.67 and +7.01 µg m−3, as compared to the observations of 29.28 to 62.76 µg m−3.
Air quality in India is determined by a mixture of industrial and motor vehicle emissions, and anthropogenic fuel combustion, that includes residential burning of biomass for household uses, such as cooking. Average daily PM2.5 levels frequently exceed the 24 h standard of 60 µg m−3 and can exceed 200 µg m−3, even in rural areas. PM2.5 is a mixture of directly emitted particulate matter and that formed by the atmospheric conversion of volatile organic compounds to secondary organic aerosol. Here, we assess the extent to which observed O3 and PM2.5 levels in India can be predicted using state-of-the-science emissions inventories and atmospheric chemical transport models. We have focused on the 308 km2 of the SOMAARTH Demographic, Development, and Environmental Surveillance Site (DDESS) in the Palwal District of Haryana, India.
Atmospheric simulation of particulate matter levels over a complex region like India tends to be demanding, owing to the combination of a wide range of primary particulate emissions and the presence of secondary organic matter from atmospheric gas-phase reactions generating low-volatility gas-phase products that condense into the particulate phase, forming secondary organic aerosol (SOA). Consequently, the main focus of the present work has been the evaluation of the extent to which ambient particulate matter levels over the current region of India can be predicted. Simulations capture the general trend of observed daily peaks and lows of particulate matter, with PM2.5 reaching values as high as 250 µg m−3. Secondary organic matter accounts for 10 % to 55 % of total PM2.5 mass on average. In India, over 50 % of households report use of wood, crop residues, or dung as cooking fuel; such fuels produce significant gas- and particle-phase emissions. We evaluated the fractional impact of the residential sector emissions on the formation of secondary organic aerosol, as a function of time of day, for New Delhi, SOMAARTH HQ, and Bajada Pahari. The predicted fractional contribution of residential sector emissions to secondary organic PM2.5 in Bajada Pahari and SOMAARTH HQ reaches values as high as 34 % and, moreover, displays a distinct diurnal profile, with maxima corresponding to the morning and evening mealtimes. In both rural and urban areas, SOA is predicted to account for more than 40 % of residential PM2.5, reaching up to 80 % in early afternoon in September months.
Simulations of ozone levels in New Delhi reported here are largely in agreement with ambient monitoring data, although the simulations fail to capture several 1- to 2-day ozone episodes that exceed predictions by a factor of 2 or more. The overall agreement between observed and predicted O3 levels, also demonstrated in the study of Sharma et al. (2016), suggests that gas-phase atmospheric chemistry over India is reasonably well understood. While ozone and particulate matter were simulated for September and December months, we employed a single emissions inventory, regardless of season. Thus, the inventory does not capture December-specific characteristics, including heating combustion. Furthermore, information regarding household solvent use, emissions profiles by fuel type, and speciation of certain emissions (such as semivolatile organic compounds and intermediate volatility organic compounds) is lacking. Variation in the resolution of specific input data additionally contributes to uncertainty.
Air quality studies such as the present one provide a quantification of the elements of atmospheric composition in India, especially that owing to household sources. The importance of replacing traditional household combustion devices with modern technology is evident in studies such as the present one.
The gridded data files of PM2.5 used in this study are available from the authors upon request by email. Surface measurements of various atmospheric chemicals and meteorology are available from the Central Pollution Control Board (CPCB) of the Ministry of Environment and Forests of the Government of India at http://www.cpcb.gov.in/CAAQM/frmUserAvgReportCriteria.aspxTS1 (CPCB, 2019; last access: 28 May 2019). Initial and boundary condition data for WRF meteorological simulations are from the European Centre for Medium-Range Weather Forecasts (ECMWF) ERA5, generated using Copernicus Climate Change Service Information and available at https://cds.climate.copernicus.eu/cdsapp\#!/home (Copernicus Climate Change Services, 2017; last access: 28 May 2019). Neither the European Commission nor ECMWF is responsible for any use that may be made of the Copernicus information or data it contains.
BR carried out the simulations and wrote the paper. RZ, YW and KB assisted with the simulations. AP carried out field measurements. SS, SK, TB, NL, BO, LX, and VG helped formulate the emissions inventory. LF, RW, SM, and DB designed and carried out measurements. SN, RE, AY, and NA performed data analysis. KS designed the research. JS designed the research and wrote the paper.
The authors declare that they have no conflict of interest.
This work was supported by EPA STAR grant R835425 Impacts of Household Sources on Outdoor Pollution at Village and Regional Scales in India. The contents are solely the responsibility of the authors and do not necessarily represent the official views of the US EPA. Yuan Wang appreciates the support from the Jet Propulsion Laboratory, California Institute of Technology, under a contract with the National Aeronautics and Space Administration, and support from the US National Science Foundation (award no. 1700727).
This research has been supported by EPA STAR (grant no. R835425).
This paper was edited by Qiang Zhang and reviewed by three anonymous referees.
Amann, M., Bertok, I., Borken-Kleefeld, J., Cofala, J., Heyes, C., Hoeglund-Isaksson, L., Klimont, Z., Nguyen, B., Posch, M., Rafaj, P., Sandler, R., Schoepp, W., Wagner, F., and Winiwarter, W.: Cost-effective control of air quality and greenhouse gases in Europe: modeling and policy applications, Environ. Model. Softw., 26, 1489–1501, 2011.
Appel, K. W., Napelenok, S. L., Foley, K. M., Pye, H. O. T., Hogrefe, C., Luecken, D. J., Bash, J. O., Roselle, S. J., Pleim, J. E., Foroutan, H., Hutzell, W. T., Pouliot, G. A., Sarwar, G., Fahey, K. M., Gantt, B., Gilliam, R. C., Heath, N. K., Kang, D., Mathur, R., Schwede, D. B., Spero, T. L., Wong, D. C., and Young, J. O.: Description and evaluation of the Community Multiscale Air Quality (CMAQ) modeling system version 5.1, Geosci. Model Dev., 10, 1703–1732, https://doi.org/10.5194/gmd-10-1703-2017, 2017.
Balakrishnan, K., Sambandam, S., Ghosh, S., Mukhopadhyay, K., Vaswani, M., Arora, N. K., Jack, D., Pillarisetti, A., Bates, M. N., and Smith, K. R.: Household air pollution exposures of pregnant women receiving advanced combustion cookstoves in India: Implications for intervention, Ann. Glob. Health, 81, 375–385, 2015.
Bond, T. C., Streets, D. G., Yarber, K. F., Nelson, S. M., Woo, J.-H., and Klimont, Z.: A technology-based global inventory of black and organic carbon emissions from combustion, J. Geophys. Res., 109, D14203, 2004.
Bonjour, S., Adair-Rohani, H., Wolf, J., Bruce, N. G., Mehta, S., Prüss-Ustün, A., Lahiff, M., Rehfuess, E. A., Mishra, V., and Smith, K. R.: Solid fuel use for household cooking: Country and regional estimates for 1980–2010, Environ. Health Persp., 121, 784–790, 2013.
Butt, E. W., Rap, A., Schmidt, A., Scott, C. E., Pringle, K. J., Reddington, C. L., Richards, N. A. D., Woodhouse, M. T., Ramirez-Villegas, J., Yang, H., Vakkari, V., Stone, E. A., Rupakheti, M., S. Praveen, P., G. van Zyl, P., P. Beukes, J., Josipovic, M., Mitchell, E. J. S., Sallu, S. M., Forster, P. M., and Spracklen, D. V.: The impact of residential combustion emissions on atmospheric aerosol, human health, and climate, Atmos. Chem. Phys., 16, 873–905, https://doi.org/10.5194/acp-16-873-2016, 2016.
Cao, G., Zhang, X., and Zheng, F.: Inventory of black carbon and organic carbon emissions from China, Atmos. Environ., 40, 6516–6527, 2006.
CEA: Performance Review of Thermal Power Stations 2009–10, Central Electricity Authority, New Delhi, available at: http://www.cea.nic.in/reports/annual/thermalreview/thermal_review-2009.pdf, (last access: 28 May 2019), 2011.
Census of India: http://censusindia.gov.in/2011census/Hlo-series/HH10.html (last access: 28 May 2019), 2011.
Chafe, Z. A., Brauer, M., Klimont, Z., Van Dingenen, R., Mehta, S., Rao, S., Riahi, K., Dentener, F., and Smith, K. R.: Household cooking with solid fuels contributes to ambient PM2.5 air pollution and the burden of disease, Environ. Health Persp., 122, 1314–1320, 2014.
Chan, A. W. H., Kautzman, K. E., Chhabra, P. S., Surratt, J. D., Chan, M. N., Crounse, J. D., Kürten, A., Wennberg, P. O., Flagan, R. C., and Seinfeld, J. H.: Secondary organic aerosol formation from photooxidation of naphthalene and alkylnaphthalenes: implications for oxidation of intermediate volatility organic compounds (IVOCs), Atmos. Chem. Phys., 9, 3049–3060, https://doi.org/10.5194/acp-9-3049-2009, 2009.
Chatani, S., Amann, M., Goel, A., Hao, J., Klimont, Z., Kumar, A., Mishra, A., Sharma, S., Wang, S. X., Wang, Y. X., and Zhao, B.: Photochemical roles of rapid economic growth and potential abatement strategies on tropospheric ozone over South and East Asia in 2030, Atmos. Chem. Phys., 14, 9259–9277, https://doi.org/10.5194/acp-14-9259-2014, 2014.
Conibear, L., Butt, E. W., Knote, C., Arnold, S. R., and Spracklen, D. V.: Residential energy use emissions dominate health impacts from exposure to ambient particulate matte in India, Nat. Commun., 9, 1–9, 2018.
Copernicus Climate Change Service (C3S): ERA5: Fifth generation of ECMWF atmospheric reanalyses of the global climate, Copernicus Climate Change Service Climate Data Store (CDS), available at: https://cds.climate.copernicus.eu/cdsapp\#!/home (last access: 28 May 2019), 2017.
CPCB: Transport Fuel Quality 2005, Central Pollution Control Board, New Delhi, 2000.
CPCB: Average Report Criteria, Central Pollution Control Board, New Delhi, available at: http://www.cpcb.gov.in/CAAQM/frmUserAvgReportCriteria.aspxTS1, last access: 28 May 2019.
CSO: Energy Statistics, Central Statistics Office, New Delhi, available at: http://mospi.nic.in/publication/energy-statistics-2011 (last access: 28 May 2019), 2011.
Derwent, R. G., Jenkin, M. E., Utembe, S. R., Shallcross, D. W., Murrells, T. P., and Passant, N. R.: Secondary organic aerosol formation from a large number of reactive man-made compounds, Sci. Total Environ., 408, 3374–3381, 2010.
Eastham, S. D., Weisenstein, D. K., and Barrett, S. R. H.: Development and evaluation of the unified tropospheric-stratospheric chemistry extension (UCX) for the global chemistry-transport model GEOS-Chem, Atmos. Environ., 89, 52–63, 2014.
Edwards, R., Princevac, M., Weltman, R., Ghasemian, M., Arora, N. K., and Bond, T.: Modeling emission rates and exposures from outdoor cooking, Atmos. Environ., 164, 50–60, 2017.
Fleming, L. T., Lin, P., Laskin, A., Laskin, J., Weltman, R., Edwards, R. D., Arora, N. K., Yadav, A., Meinardi, S., Blake, D. R., Pillarisetti, A., Smith, K. R., and Nizkorodov, S. A.: Molecular composition of particulate matter emissions from dung and brushwood burning household cookstoves in Haryana, India, Atmos. Chem. Phys., 18, 2461–2480, https://doi.org/10.5194/acp-18-2461-2018, 2018a.
Fleming, L. T., Weltman, R., Yadav, A., Edwards, R. D., Arora, N. K., Pillarisetti, A., Meinardi, S., Smith, K. R., Blake, D. R., and Nizkorodov, S. A.: Emissions from village cookstoves in Haryana, India, and their potential impacts on air quality, Atmos. Chem. Phys., 18, 15169–15182, https://doi.org/10.5194/acp-18-15169-2018, 2018b.
Guenther, A. B., Jiang, X., Heald, C. L., Sakulyanontvittaya, T., Duhl, T., Emmons, L. K., and Wang, X.: The Model of Emissions of Gases and Aerosols from Nature version 2.1 (MEGAN2.1): an extended and updated framework for modeling biogenic emissions, Geosci. Model Dev., 5, 1471–1492, https://doi.org/10.5194/gmd-5-1471-2012, 2012.
Health Effects Institute: State of Global Air 2018, Special Report, available at: http://stateofglobalair.org/sites/default/files/soga-2018-report.pdf (last access: 28 May 2019), 2018a.
Health Effects Institute: Burden of Disease Attributable to Major Air Pollution Sources in India, Special Report 21, GBD MAPS Working Group, available at: https://www.healtheffects.org/publication/gbd-air-pollution-india (last access: 28 May 2019), 2018b.
Indian Council of Medical Research, Public Health Foundation of India, and Institute for Health Metrics and Evaluation: GBD India Compare Data Visualization, available at: http://vizhub.healthdata.org/gbd-compare/india (last access: 28 May 2019), 2017.
Jayarathne, T., Stockwell, C. E., Bhave, P. V., Praveen, P. S., Rathnayake, C. M., Islam, Md. R., Panday, A. K., Adhikari, S., Maharjan, R., Goetz, J. D., DeCarlo, P. F., Saikawa, E., Yokelson, R. J., and Stone, E. A.: Nepal Ambient Monitoring and Source Testing Experiment (NAMaSTE): emissions of particulate matter from wood- and dung-fueled cooking fires, garbage and crop residue burning, brick kilns, and other sources, Atmos. Chem. Phys., 18, 2259–2286, https://doi.org/10.5194/acp-18-2259-2018, 2018.
Jena, C., Ghude, S. D., Beig, G., Chate, D. M., Kumar, R., Pfister, G. G., Lal, D. M., Surendran, D. E., Fadnavis, S., and van der A, R. J.: Inter-comparison of different NOx emission inventories and associated variation in simulated surface ozone in Indian region, Atmos. Environ., 117, 61–73, 2015.
Keller, C. A., Long, M. S., Yantosca, R. M., Da Silva, A. M., Pawson, S., and Jacob, D. J.: HEMCO v1.0: a versatile, ESMF-compliant component for calculating emissions in atmospheric models, Geosci. Model Dev., 7, 1409–1417, https://doi.org/10.5194/gmd-7-1409-2014, 2014.
Kleindienst, T. E., Lewandowski, M., Offenberg, J. H., Jaoui, M., and Edney, E. O.: Ozone-isoprene reaction: reexamination of the formation of secondary organic aerosol, Geophys. Res. Lett., 34, L01805, https://doi.org/10.1029/2006GL027485, 2007.
Klimont, Z., Cofala, J., Xing, J., Wei, W., Zhang, C., and Wang, S.: Projections of SO2, NOx and carbonaceous aerosol emissions in Asia, Tellus B, 61, 602–617, 2009.
Klimont, Z., Streets, D. G., Gupta, S., Cofala, J., Fu, L., and Ichikawa, Y.: Anthropogenic emissions of non-methane volatile organic compounds in China, Atmos. Environ., 36, 1309–1322, 2002.
Kota, S.H., Guo, H., Myllyvirta, L., Hu, J., Sahu, S., Garaga, R., Ying, Q., Gao, A., Dahiya, S., Wang, Y., and Zhang, H.: Year-long simulation of gaseous and particulate air pollutants in India, Atmos. Environ., 180, 244–255, 2018.
Kumar, R., Naja, M., Venkataramani, M., and Wild, S.: Variations in surface ozone at Nainital: A high-altitude site in the central Himalayas, J. Geophys. Res., 115, D16302, https://doi.org/10.1029/2009JD013715, 2010.
Kumar, R., Naja, M., Pfister, G. G., Barth, M. C., Wiedinmyer, C., and Brasseur, G. P.: Simulations over South Asia using the Weather Research and Forecasting model with Chemistry (WRF-Chem): chemistry evaluation and initial results, Geosci. Model Dev., 5, 619–648, https://doi.org/10.5194/gmd-5-619-2012, 2012.
Lam, N. L., Muhwezi, G., Isabirye, F., Harrison, K., Ruiz-Mercado, I., Amukoye, E., Mokaya, T., Wambua, M., and Bates, N.: Exposure reductions associated with introduction of solar lamps to kerosene lamp-using households in Busia County, Kenya, Indoor Air, 28, 218–227, 2018.
Lei, Y., Zhang, Q., He, K. B., and Streets, D. G.: Primary anthropogenic aerosol emission trends for China, 1990–2005, Atmos. Chem. Phys., 11, 931–954, https://doi.org/10.5194/acp-11-931-2011, 2011.
Lelieveld, J., Evans, J. S., Fnais, M., Giannadaki, D., and Pozzer, A.: The contribution of outdoor air pollution sources to premature mortality on a global scale, Nature, 525, 367–371, 2015.
Marais, E. A., Jacob, D. J., Jimenez, J. L., Campuzano-Jost, P., Day, D. A., Hu, W., Krechmer, J., Zhu, L., Kim, P. S., Miller, C. C., Fisher, J. A., Travis, K., Yu, K., Hanisco, T. F., Wolfe, G. M., Arkinson, H. L., Pye, H. O. T., Froyd, K. D., Liao, J., and McNeill, V. F.: Aqueous-phase mechanism for secondary organic aerosol formation from isoprene: application to the southeast United States and co-benefit of SO2 emission controls, Atmos. Chem. Phys., 16, 1603–1618, https://doi.org/10.5194/acp-16-1603-2016, 2016.
Ministry of Environment and Forest, Government of India, Central Pollution Control Board, Continuous Ambient Air Quality Monitoring, available at: http://www.cpcb.gov.in/CAAQM/frmUserAvgReportCriteria.aspx, last access: 28 May 2019.
MoPNG: Auto Fuel Policy of India. Ministry of Petroleum & Natural Gas, Government of India, New Delhi, 2002.
MoPNG: Indian Petroleum and Natural Gas Statistics, Ministry of Petroleum & Natural Gas, Government of India, New Delhi, 2009e10, 2010. MoRTH: Road Transport Yearbook, Ministry of Road Transport and Highways, Government of India, New Delhi, 2009e10 & 2010e11, 2011.
Mukhopadhyay, R., Sambandam, S., Pillarisetti, A., Jack, D., Mukhopadhyay, K., Balakrishnan, K., Vaswani, M., Bates, M. N., Kinney, P. L., Arora, N., and Smith, K. R.: Cooking practices, air quality, and the acceptability of advanced cookstoves in Haryana, India: An exploratory study to inform large-scale interventions, Glob. Health Action, 5, 1–13, 2012.
Murphy, B. N., Woody, M. C., Jimenez, J. L., Carlton, A. M. G., Hayes, P. L., Liu, S., Ng, N. L., Russell, L. M., Setyan, A., Xu, L., Young, J., Zaveri, R. A., Zhang, Q., and Pye, H. O. T.: Semivolatile POA and parameterized total combustion SOA in CMAQv5.2: impacts on source strength and partitioning, Atmos. Chem. Phys., 17, 11107–11133, https://doi.org/10.5194/acp-17-11107-2017, 2017.
Ng, N. L., Kroll, J. H., Chan, A. W. H., Chhabra, P. S., Flagan, R. C., and Seinfeld, J. H.: Secondary organic aerosol formation from m-xylene, toluene, and benzene, Atmos. Chem. Phys., 7, 3909–3922, https://doi.org/10.5194/acp-7-3909-2007, 2007.
Otte, T. L. and Pleim, J. E.: The Meteorology-Chemistry Interface Processor (MCIP) for the CMAQ modeling system: updates through MCIPv3.4.1, Geosci. Model Dev., 3, 243–256, https://doi.org/10.5194/gmd-3-243-2010, 2010.
Pan, X., Chin, M., Gautam, R., Bian, H., Kim, D., Colarco, P. R., Diehl, T. L., Takemura, T., Pozzoli, L., Tsigaridis, K., Bauer, S., and Bellouin, N.: A multi-model evaluation of aerosols over South Asia: common problems and possible causes, Atmos. Chem. Phys., 15, 5903–5928, https://doi.org/10.5194/acp-15-5903-2015, 2015.
Pandey, A., Sadavarte, P., Rao, A. B., and Venkataraman, C.: Trends in multi-pollutant emissions from a technology-linked inventory for India: II. Residential, agricultural and informal industry sectors, Atmos. Environ., 99, 341–352, 2014.
Pant, P. and Harrison, R. M.: Critical review of receptor modelling for particulate matter: A case study of India, Atmos. Environ., 49, 1–12, 2012.
Pillarisetti, A., Vaswani, M., Jack, D., Balakrishnan, K., Bates, M. N., Arora, N. K., and Smith, K. R.: Patterns of stove usage after introduction of an advanced cookstove: The long-term application of household sensors, Environ. Sci. Technol., 48, 14525–14533, 2014.
Presto, A. A., Miracolo, M. A., Donahue, N. M., and Robinson, A. L.: Secondary organic aerosol formation from high-NOx photooxidation of low volatility precursors: n-Alkanes, Environ. Sci. Technol., 44, 2029–2034, 2010.
Pye, H. O. T. and Pouliot, G. A.: Modeling the role of alkanes, polycyclic aromatic hydrocarbons, and their oligomers in secondary organic aerosol formation, Environ. Sci. Technol., 46, 6041–6047, 2012.
Pye, H. O. T., Luecken, D. J., Xu, L., Boyd, C. M., Ng, N. L., Baker, K. R., Ayres, B. R., Bash, J. O., Baumann, K., Carter, W. P. L., Edgerton, E., Fry, J. L., Hutzell, W. T., Schwede, D. B., and Shepson, P. B.: Modeling the current and future roles of particulate organic nitrates in the southeastern United States, Environ. Sci. Technol., 49, 14195–14203, 2015.
Reddy, M. S. and Venkataraman, C.: Inventory of aerosol and sulphur dioxide emissions from India: I-Fossil fuel combustion, Atmos. Environ., 36, 677–697, 2002.
Reddy, B .S. K., Kumar, K. R., Balakrishnaiah, G., Gopal, K. R., Reddy, R. R., Sivakumar, V., Lingaswamy, A. P., Arafath, S. M., Umadevi, K., Kumari, S. P., Ahammed, Y. N., and Lal, S.: Analysis of diurnal and seasonal behavior of surface ozone and its precursors (NOx) at a semi-arid rural site in southern India, Aerosol Air Qual. Res., 12, 1081–1094, 2012.
Rehman, I. H., Ahmed, T., Praveen, P. S., Kar, A., and Ramanathan, V.: Black carbon emissions from biomass and fossil fuels in rural India, Atmos. Chem. Phys., 11, 7289–7299, https://doi.org/10.5194/acp-11-7289-2011, 2011.
Roden, C. A., Bond, T. C., Conway, S., Osorto Pinel, A. B., MacCarty, N., and Still, D.: Laboratory and field investigations of particulate and carbon monoxide emissions from traditional and improved cookstoves, Atmos. Environ., 43, 1170–1181, 2009.
Schnell, J. L., Naik, V., Horowitz, L. W., Paulot, F., Mao, J., Ginoux, P., Zhao, M., and Ram, K.: Exploring the relationship between surface PM2.5 and meteorology in Northern India, Atmos. Chem. Phys., 18, 10157–10175, https://doi.org/10.5194/acp-18-10157-2018, 2018.
Sen, A., Abdelmaksoud, A. S., Ahammed, Y. N., Alghamdi, M. A., Banerjee, T., Bhat, M. A., Chatterjee, A., Choudhuri, A. K., Das, T., Dhir, A., Dhyani, P. P., Gadi, R., Ghosh, S., Kumar, K., Khan, A. H., Khoder, M., Kumari, K. M., Kuniyal, J. C., Kumar, M., Lakhani, A., Mahapatra, P. S., Naja, M., Pal, D., Pal, S., Rafiq, M., Romshoo, S. A., Rashid, I., Saikia, P., Shenoy, D. M., Sridhar, V., Verma, N., Vyas, B. M., Saxena, M., Sharma, A., Sharma, S. K., and Mandal, T. K.: Variations in particulate matter over the Indo-Gangetic Plain and Indo-Himalayan Range during four field campaigns in winter monsoon and summer monsoon: Role of pollution pathways, Atmos. Environ., 154, 200–224, 2017.
Sharma, S. and Khare, M.: Simulating ozone concentrations using precursor emission inventories in Delhi National Capital Region of India, Atmos. Environ., 151, 117–132, 2017.
Sharma, S., Goel, A., Gupta, D., Kumar, A., Mishra, A., Kundu, S., Chatani, S., and Klimont, Z.: Emission inventory of non-methane volatile organic compounds from anthropogenic sources in India, Atmos. Environ., 102, 209–219, 2015.
Sharma, S., Chatani, S., Mahtta, R., Goel, A., and Kumar, A.: Sensitivity analysis of ground level ozone in India using WRF-CMAQ models, Atmos. Environ., 131, 29–40, 2016.
Sharma, S., Bawase, M. A., Ghosh, P., Saraf, M. R., Goel, A., Suresh, R., Datta, A., Jhajhjra, A. S., Kundu, S., Sharma, V. P., Kishan, J., Mane, S. P., Reve, S. D., Markad, A. N., Vijayan, V., Jadhav, D. S., and Shaikh, A. R.: Source apportionment of PM2.5 and PM10 of Delhi NCR for identification of major sources, The Energy Resources Institute, Delhi and Automative Research Association of India, 2018.
Shen, G., Hays, M. D., Smith, K. R., Williams, C., Faircloth, J. W., and Jetter, J. J.: Evaluating the performance of household liquified petroleum gas cookstoves, Environ. Sci. Technol., 52, 904–915, 2018.
Silva, R. A., Adelman, Z., Fry, M. M., and West, J. J.: The impact of individual anthropogenic emissions sectors on the global burden of human mortality due to ambient air pollution, Environ. Health Persp., 124, 1776–1784, 2016.
Skamarock, W. C., Klemp, J. B., Dudhia, J., Gill, D. O., Barker, D. M., Duda, M. G., Huang, X. Y., Wang, W., and Powers, J. G.: A description of the advanced research WRF Version 3, NCAR Technical Note, NCAR/TN-475+STR, 2008.
Smith, K. R., Aggarwal, A. L., and Dave, R. M.: Air pollution and rural biomass fuels in developing countries – A pilot study in India and implications for research and policy, Atmos. Environ., 17, 2343–2362, 1983.
Smith, K. R., Uma, R., Kishore, V. V. N., Zhang, J., Joshi, V., Khalil, M. A. K.: Greenhouse implications of household stoves: An analysis for India, Ann. Rev. Energy Environ., 25, 741–763, 2000.
Smith, K. R., Bruce, N., Balakrishnan, K., Adair-Rohani, H., Balmes, J., Chafe, Z., Dherani, M., Hosgood, H. D., Mehta, S., Pope, D., and Rehfuess, E.: Millions dead: How do we know and what does it mean? Methods used in the comparative risk assessment of household air pollution, Annu. Rev. Publ. Health, 35, 185–206, 2014.
TERI: Pricing and Infrastructure Costing, for Supply and Distribution of CNG and ULSD to the Transport Sector, Mumbai, India (Supported by Asian Development Bank), The Energy and Resources Institute, New Delhi, 2002.
US EPA Office of Research and Development: CMAQ (Version 5.2), Zenodo, https://doi.org/10.5281/zenodo.1167892, 2017.
World Health Organization: Household air pollution and health, available at: http://www.who.int/en/news-room/fact-sheets/detail/household-air-pollution-and-health (last access: 28 May 2019), 2018.
Yarwood, G., Jung, J., Whitten, G. Z., Heo, G., Melberg, J., and Estes, M.: CB6: Version 6 of the Carbon Bond Mechanism, 2010 CMAS Conference, Chapel Hill, NC, 2010.
Zhong, M., Saikawa, E., Liu, Y., Naik, V., Horowitz, L. W., Takigawa, M., Zhao, Y., Lin, N.-H., and Stone, E. A.: Air quality modeling with WRF-Chem v3.5 in East Asia: sensitivity to emissions and evaluation of simulated air quality, Geosci. Model Dev., 9, 1201–1218, https://doi.org/10.5194/gmd-9-1201-2016, 2016.


