the Creative Commons Attribution 4.0 License.
the Creative Commons Attribution 4.0 License.
 | 05 Jun 2019
Secondary organic aerosol enhanced by increasing atmospheric oxidizing capacity in Beijing–Tianjin–Hebei (BTH), China
Tian Feng
Shuyu Zhao
Naifang Bei
Jiarui Wu
Suixin Liu
Xia Li
Lang Liu
Yang Qian
Qingchuan Yang
Yichen Wang
Weijian Zhou
Junji Cao
Guohui Li
The implementation of the Air Pollution Prevention and Control Action Plan in China since 2013 has profoundly altered the ambient pollutants in the Beijing–Tianjin–Hebei (BTH) region. Here we show observations of substantially increased O3 concentrations (about 30 %) and a remarkable increase in the ratio of organic carbon (OC) to elemental carbon (EC) in BTH during the autumn from 2013 to 2015, revealing an enhancement in atmospheric oxidizing capacity (AOC) and secondary organic aerosol (SOA) formation. To explore the impacts of increasing AOC on the SOA formation, a severe air pollution episode from 3 to 8 October 2015 with high O3 and PM2.5 concentrations is simulated using the WRF-Chem model. The model performs reasonably well in simulating the spatial distributions of PM2.5 and O3 concentrations over BTH and the temporal variations in PM2.5, O3, NO2, OC, and EC concentrations in Beijing compared to measurements. Sensitivity studies show that the change in AOC substantially influences the SOA formation in BTH. A sensitivity case characterized by a 31 % O3 decrease (or 36 % OH decrease) reduces the SOA level by about 30 % and the SOA fraction in total organic aerosol by 17 % (from 0.52 to 0.43, dimensionless). Spatially, the SOA decrease caused by reduced AOC is ubiquitous in BTH, but the spatial relationship between SOA concentrations and the AOC is dependent on the SOA precursor distribution. Studies on SOA formation pathways further show that when the AOC is reduced, the SOA from oxidation and partitioning of semivolatile primary organic aerosol (POA) and co-emitted intermediate volatile organic compounds (IVOCs) decreases remarkably, followed by those from anthropogenic and biogenic volatile organic compounds (VOCs). Meanwhile, the SOA decrease in the irreversible uptake of glyoxal and methylglyoxal on the aerosol surfaces is negligible.
- Article
(29521 KB) - Full-text XML
- BibTeX
- EndNote


Severe haze pollution characterized by exceedingly high concentrations of fine particulate matter (PM2.5) in Beijing–Tianjin–Hebei (BTH), China, has drawn much attention from the public, government, and science community (Han et al., 2014; Jiang et al., 2015; Li et al., 2017a; Quan et al., 2014; G. Wang et al., 2016). Elevated levels of PM2.5 concentrations not only deteriorate air quality and visibility (Cao et al., 2012a; Feng et al., 2016; Seinfeld and Pandis, 2006) but are also a threat to public health and the ecosystem (Cao et al., 2012b; Tie et al., 2016). In addition, PM2.5 also modulates the energy budget of the earth system directly through absorbing and scattering the incident solar radiation and indirectly via acting as cloud condensation nuclei (CCN) and ice nuclei (IN) and subsequently altering the cloud albedo and lifetime (Li et al., 2008, 2009; Y. Wang et al., 2013, 2016, 2018; Zhou et al., 2017).
Organic aerosol (OA) is a key component of PM2.5 in ambient air, constituting of 20 %–90 % of the PM2.5 mass concentration (Kanakidou et al., 2005; Zhang et al., 2007). Previous studies have confirmed a large mass fraction of OA in ambient PM2.5 in various Chinese cities. For example, Huang et al. (2014) reported that OA accounts for 30 %–50 % of the total PM2.5 mass in megacities in China (e.g., Beijing, Shanghai, Guangzhou, and Xi'an) during severe haze episodes. Positive matrix factorization (PMF) analyses of the aerosol chemical speciation monitor (ACSM) measurements in Beijing have shown that OA contributes 40 % and 52 % of refractory submicron particulate matters in summer 2011 and winter 2012, respectively (Sun et al., 2013, 2012). Over BTH, Huang et al. (2017) demonstrated that OA constitutes the most important part in the major chemical components of gravimetric PM2.5 (20 %–25 %) based on measurements at three urban sites from June 2014 to April 2015.
OA is traditionally categorized into primary and secondary organic aerosol (referred to as POA and SOA, respectively) in terms of its source and formation in the atmosphere. POA is the OA directly emitted into the atmosphere, and SOA is formed through a series of chemical conversions of precursors and gas–particle partitioning, closely associated with the abundance of oxidants in the atmosphere and ambient temperature (Feng et al., 2016; Li et al., 2011b; Tsimpidi et al., 2010). SOA precursors mainly include volatile organic compounds (VOCs) emitted from anthropogenic and biogenic sources (Odum et al., 1996; Pankow, 1994), primary organic gases (POGs) emitted or formed in the evaporation of POA, and intermediate volatile organic compounds (IVOCs) co-emitted with the POA (Lipsky and Robinson, 2006; Robinson et al., 2007; Shrivastava et al., 2006). The pathway of SOA formation is illustrated as follows (Li et al., 2011b; Robinson et al., 2007):
where the subscript g and p denote the gas and particle phase, respectively. OVOCs, OIVOCs, and OPOGs are oxidized VOCs, IVOCs, and POGs, respectively. The oxidants in the chemical reactions mainly include ozone (O3), the hydroxyl radical (OH), and the nitrate radical (NO3). Apparently, the abundance of oxidants in the atmosphere plays an important role in the SOA formation, and increasing oxidants potentially enhance SOA formation. It is worth noting that heterogeneous reactions also play a considerable role in SOA formation (Fu et al., 2009; Li et al., 2011b).
Over the last decade, O3 concentrations have dramatically increased in eastern China. For example, Cheng et al. (2016) reported an increasing trend of the daily maximum 1 h O3 concentration over Beijing from 2004 to 2015. Ma et al. (2016) observed a significant increase of surface O3 concentrations at a rural station in the north of eastern China from 2003 to 2015. Since 2013, the implementation of the Air Pollution Prevention and Control Action Plan (APPCAP) in China has profoundly altered the air pollutants in BTH (He et al., 2017; Li et al., 2017b; Wu et al., 2017). He et al. (2017) reported that the ambient OA concentration was significantly reduced by 27.5 %, 17.4 %, and 14.0 % in Beijing, Tianjin, and Hebei, respectively, from 2013 to 2017. The increasing O3 concentration has become a new culprit for the deterioration of the air quality in eastern China (Li et al., 2017b; Wu et al., 2017). Li et al. (2017b) reported that the O3 concentration increased by 10 % from 2013 to 2015 averaged over 65 cities of eastern China during April–September. In Beijing, the summertime O3 concentration has increased by 23 % from 2013 to 2015 (Wu et al., 2017). Such an increasing trend of O3 concentrations reflects an enhancement of the atmospheric oxidizing capacity (AOC), which, as expected, potentially influences the SOA formation and OA components. Therefore, it is imperative to evaluate the impact of the increasing AOC on the SOA formation over BTH.
The objective of this study is to evaluate the impact of the increasing AOC on OA components in BTH (Fig. 1) during a haze episode in the autumn of 2015 using the WRF-Chem model. The model and configuration are described in Sect. 2; the results and discussion are presented in Sect. 3. The conclusions are drawn in Sect. 4.
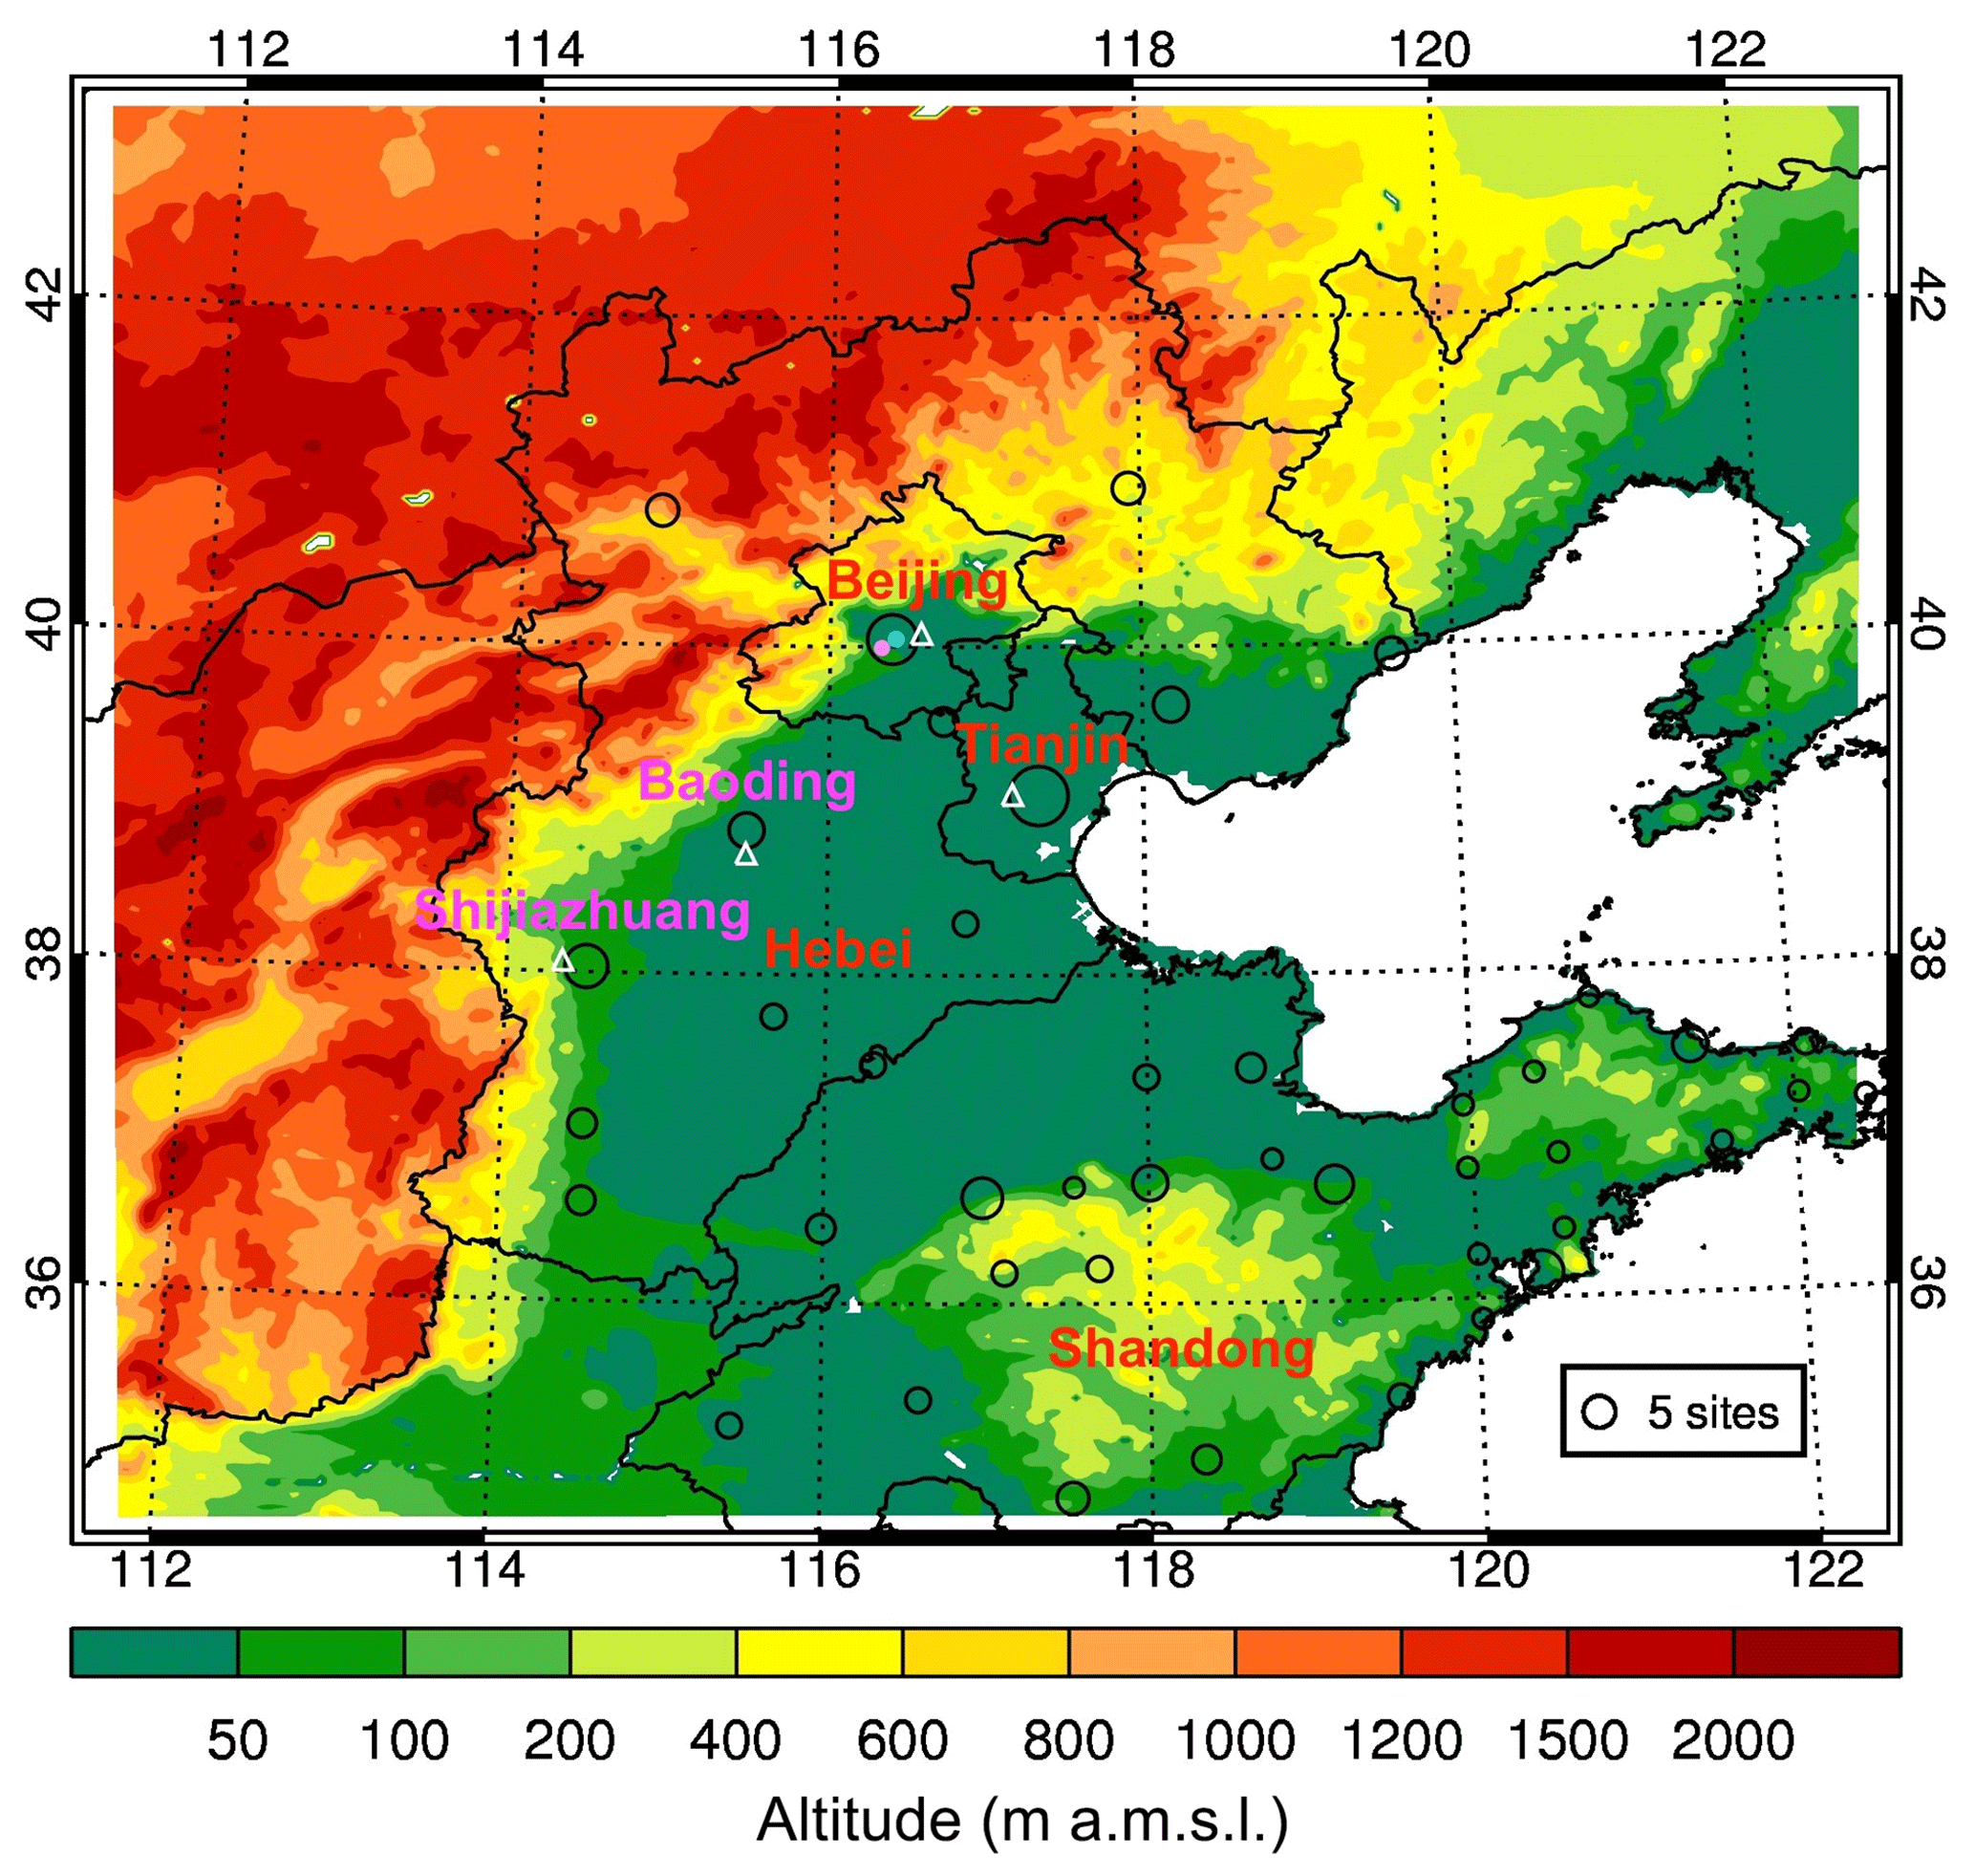
Figure 1Model domain with the topography. The black circles denote the locations of the cities with ambient air quality monitoring sites, and the size of the circles represents the number of sites in each city. The white triangles show the location of the meteorological stations in Beijing, Tianjin, Shijiazhuang, and Baoding. The light blue and pink dots in Beijing show the observation sites with the POA∕SOA (NCNT) and OC∕EC (CRAES) measurements, respectively.
2.1 WRF-Chem model and configuration
In this study, simulations are performed using a specific version of the WRF-Chem model (Grell et al., 2005) developed by Li et al. (2011a, b, 2012, 2010). The model includes a flexible gas-phase chemical module and the Models-3 Community Multiscale Air Quality (CMAQ) aerosol module (Binkowski and Roselle, 2003). The photolysis rates are calculated using the Fast Tropospheric Ultraviolet and Visible Radiation (FTUV) module (Li et al., 2005; Tie et al., 2003) which takes into account the effects of clouds and aerosols on photochemistry. A nontraditional SOA module based on the volatility basis-set (VBS) method (Donahue et al., 2006; Robinson et al., 2007) is incorporated into the model to simulate organic aerosols. In this module, POA is distributed in logarithmically spaced volatility bins and presumed to be semivolatile and photochemically reactive (Li et al., 2011b). The module uses nine surrogate species with saturation concentration ranging from 10−2 to 106 µg m−3 at room temperature to represent POA compositions (Shrivastava et al., 2008). IVOCs, co-emitted with the POA but in the gas phase, are also oxidized by OH to form SOA. In addition, the SOA formation from glyoxal and methylglyoxal is included in the module, which is parameterized as a first-order irreversible uptake on the aerosol surface with a reactive uptake coefficient of (Volkamer et al., 2007; Zhao et al., 2006). Inorganic aerosols are calculated by the ISORROPIA version 1.7 (Nenes et al., 1998). The GOCART (Georgia Tech/Goddard Global Ozone Chemistry Aerosol Radiation and Transport model) dust module is used to estimate the emission, transport, dry deposition, and gravitational settling of dust (Ginoux et al., 2001). The biomass burning emissions are from the Fire INventory from NCAR (FINN; Wiedinmyer et al., 2011, 2006). The dry deposition of chemical species is parameterized following Wesely (1989), and the wet deposition is calculated using the method in the CMAQ module (Binkowski and Roselle, 2003). Specifically, the surface and upper air observational wind fields from China Meteorological Administration (CMA) during the study period are assimilated using the four-dimensional data assimilation (FDDA) method to better simulate meteorological fields.
A severe haze episode from 3 to 8 October 2015 in BTH with high O3 and PM2.5 concentrations is simulated. The model is configured with one single domain which is centered at 38∘ N and 116∘ E with grid spacing of 6 km × 6 km (200 × 200 grid cells). Thirty-five stretched vertical levels with spacing ranging from about 30 m near surface to 500 m at 2.5 km and 1 km above 14 km are used in the model configuration. The monthly average anthropogenic emission inventory is developed by Zhang et al. (2009) and Li et al. (2017), with the base year of 2013, including agriculture, industry, power generation, residential, and transportation sources. The temporal resolution of emissions used in simulations is 1 h, and the temporal allocation for different sources follows that in Zhang et al. (2009). Figure 2 presents the spatial distributions of anthropogenic VOCs and organic carbon (OC) emissions in October, showing high emissions in urban areas. The emissions of various species in Beijing, Tianjin, Hebei, and the entire domain in October 2015 are summarized in Table 1. Biogenic emissions are calculated online using MEGAN (Model of Emissions of Gases and Aerosol from Nature; Guenther et al., 2006). The model configuration is presented in Table 2.
Table 1Anthropogenic emissions of various species in the simulation domain in October 2015 (unit: Mton month−1).

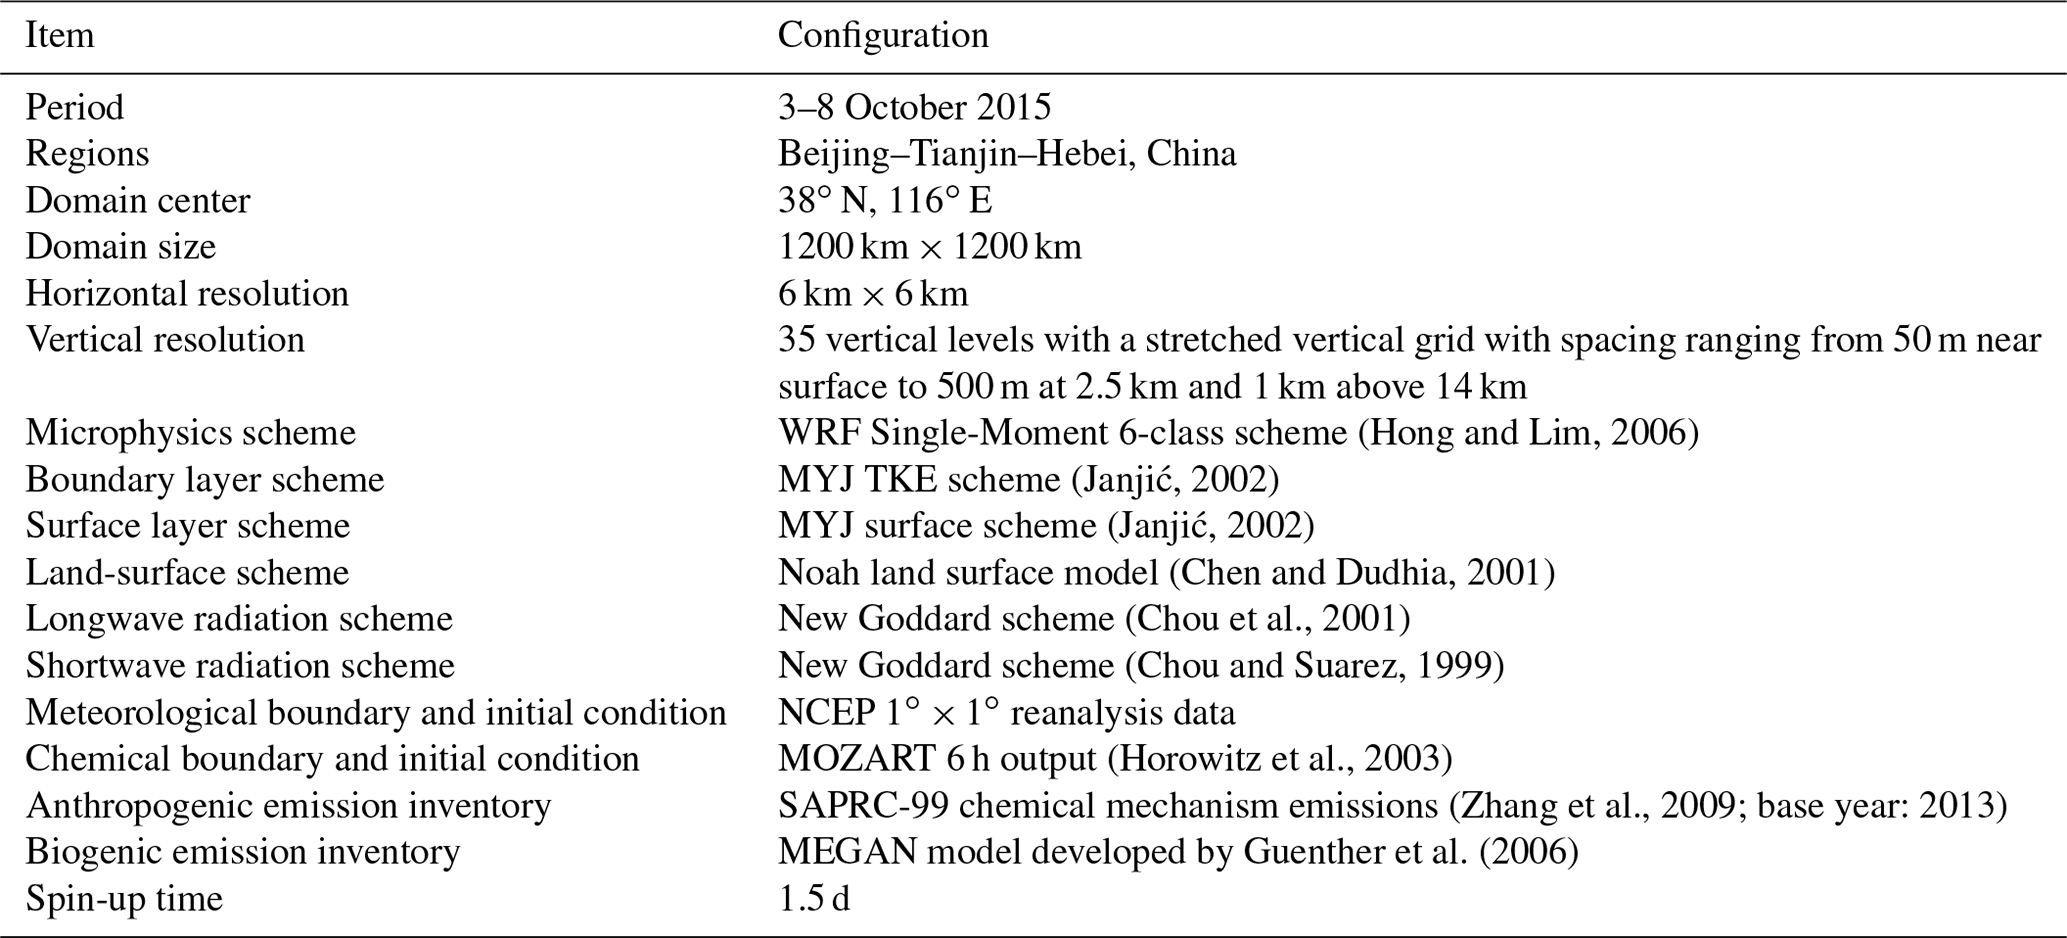
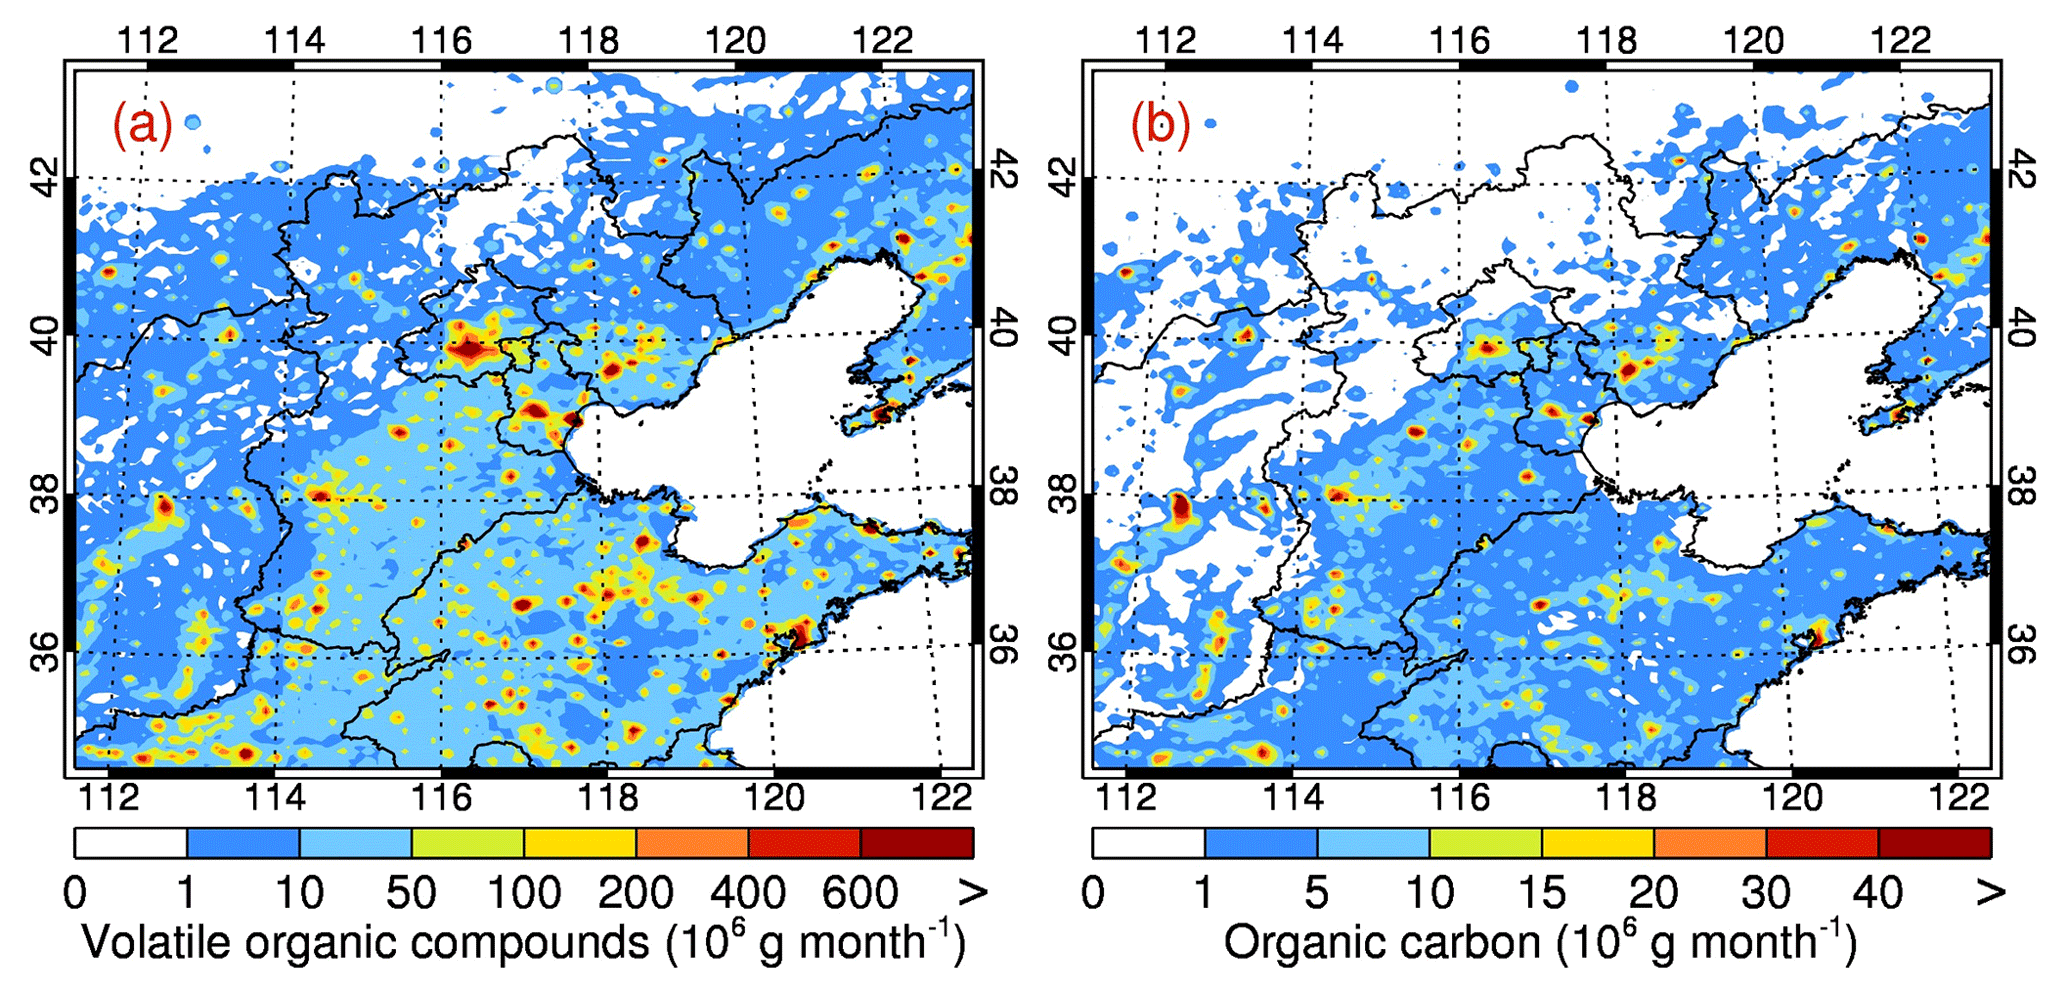
Figure 2Geographic distributions of anthropogenic emissions of (a) volatile organic compounds and (b) organic carbon in October in the simulation domain. The black lines present provincial boundaries in China.
2.2 Pollutant measurements
Measurement data used in this study include the hourly concentrations of O3, NO2, SO2, CO, and PM2.5 from ambient monitoring stations of China's Ministry of Environment and Ecology (China MEE) and hourly OC and elemental carbon (EC) concentrations in PM2.5 measured hourly at the Chinese Research Academy of Environmental Sciences (CRAES) using a Sunset OC∕EC Analyzer (RT-4, Sunset Laboratory, USA). The OC–EC analyzer has been widely used in ambient and indoor OC∕EC detections in China (Liu et al., 2018; Wei et al., 2014). In addition, hourly submicron POA and SOA concentrations are obtained from the ACSM measurement analyzed using the PMF method at National Center for Nanoscience and Technology (NCNT) in Beijing.
2.3 Model simulations
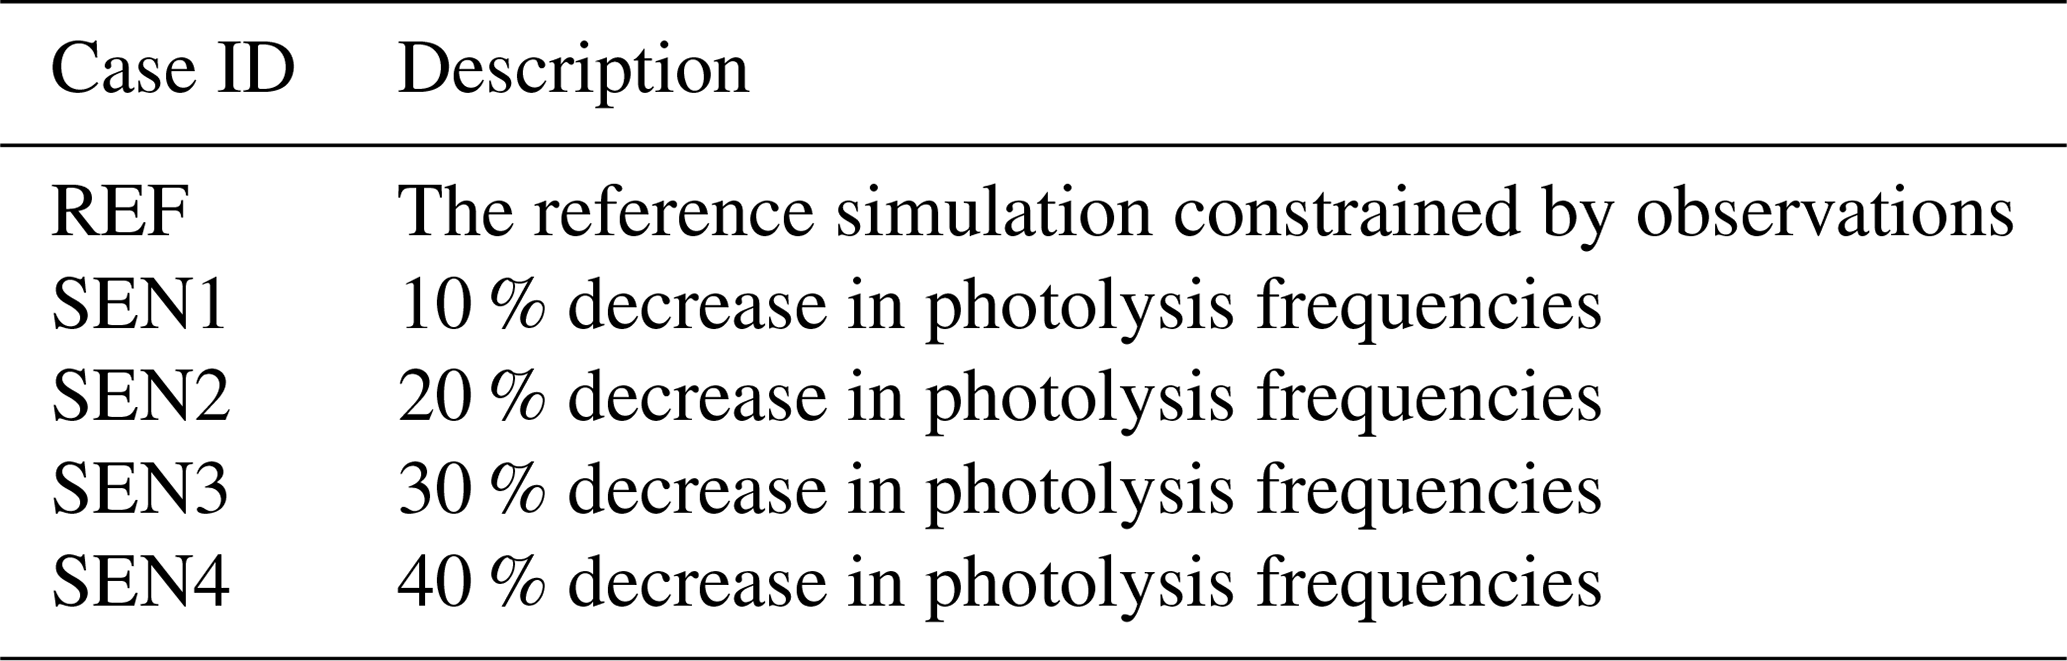
We define the simulation with the AOC in October 2015 as the reference (REF). The model result in REF is compared with the observations to evaluate the model performance. To examine the impact of increasing AOC on OA components, we perform four sensitivity experiments (SEN1–SEN4) by varying the AOC. Compared with the REF simulation, we decrease all the photolysis frequencies by 10 %, 20 %, 30 %, and 40 %, respectively, in the model simulations (Table 3).
2.4 Statistic method
The mean bias (MB), normalized mean bias (NMB), root-mean-square error (RMSE), index of agreement (IOA), and linear Pearson correlation coefficient (r) are selected to evaluate the WRF-Chem model simulations against observations:
where Pi and Oi are the simulated and observed variables, respectively. N is the total number of predictions. and denote the average of predictions and observations, respectively. IOA ranges from 0 to 1 theoretically, with 1 suggesting perfect agreement between predictions and observations.
Table 3Description of the reference simulation and sensitivity experiments.
3.1 Observed increasing O3 concentration and OC∕EC ratio
Figure 3a shows the annual variation in measured mean concentrations of O3, NO2, SO2, CO, and PM2.5 over BTH in the autumn from 2013 to 2017. To better present the pollution characteristics in autumn, the observations from 15 September to 14 November are selected in this study, which avoids the heating period (starting from 15 November) in northern China. Obvious decreasing trends in NO2, SO2, CO, and PM2.5 concentrations during recent years have been observed since the implementation of APPCAP (Fig. 3a). The O3 concentration, however, has increased by about 30 % during the same period. Such an O3 increase indicates a considerable enhancement of the AOC, considering the controlling role of O3 in the AOC in the troposphere (Brasseur et al., 1999). The reason for the AOC or O3 increase since 2013 still remains elusive. Li et al. (2018) proposed that the O3 increase in China since 2013 is associated with the decreased removal efficiency of HOx (OH + peroxy) on the aerosol surfaces caused by the reduced aerosol concentrations since the implementation of APPCAP. However, further studies need to be conducted to evaluate the O3 contribution of the photolysis change caused by the aerosol–radiation interaction and aerosol–cloud interaction induced by decreasing aerosols in China.
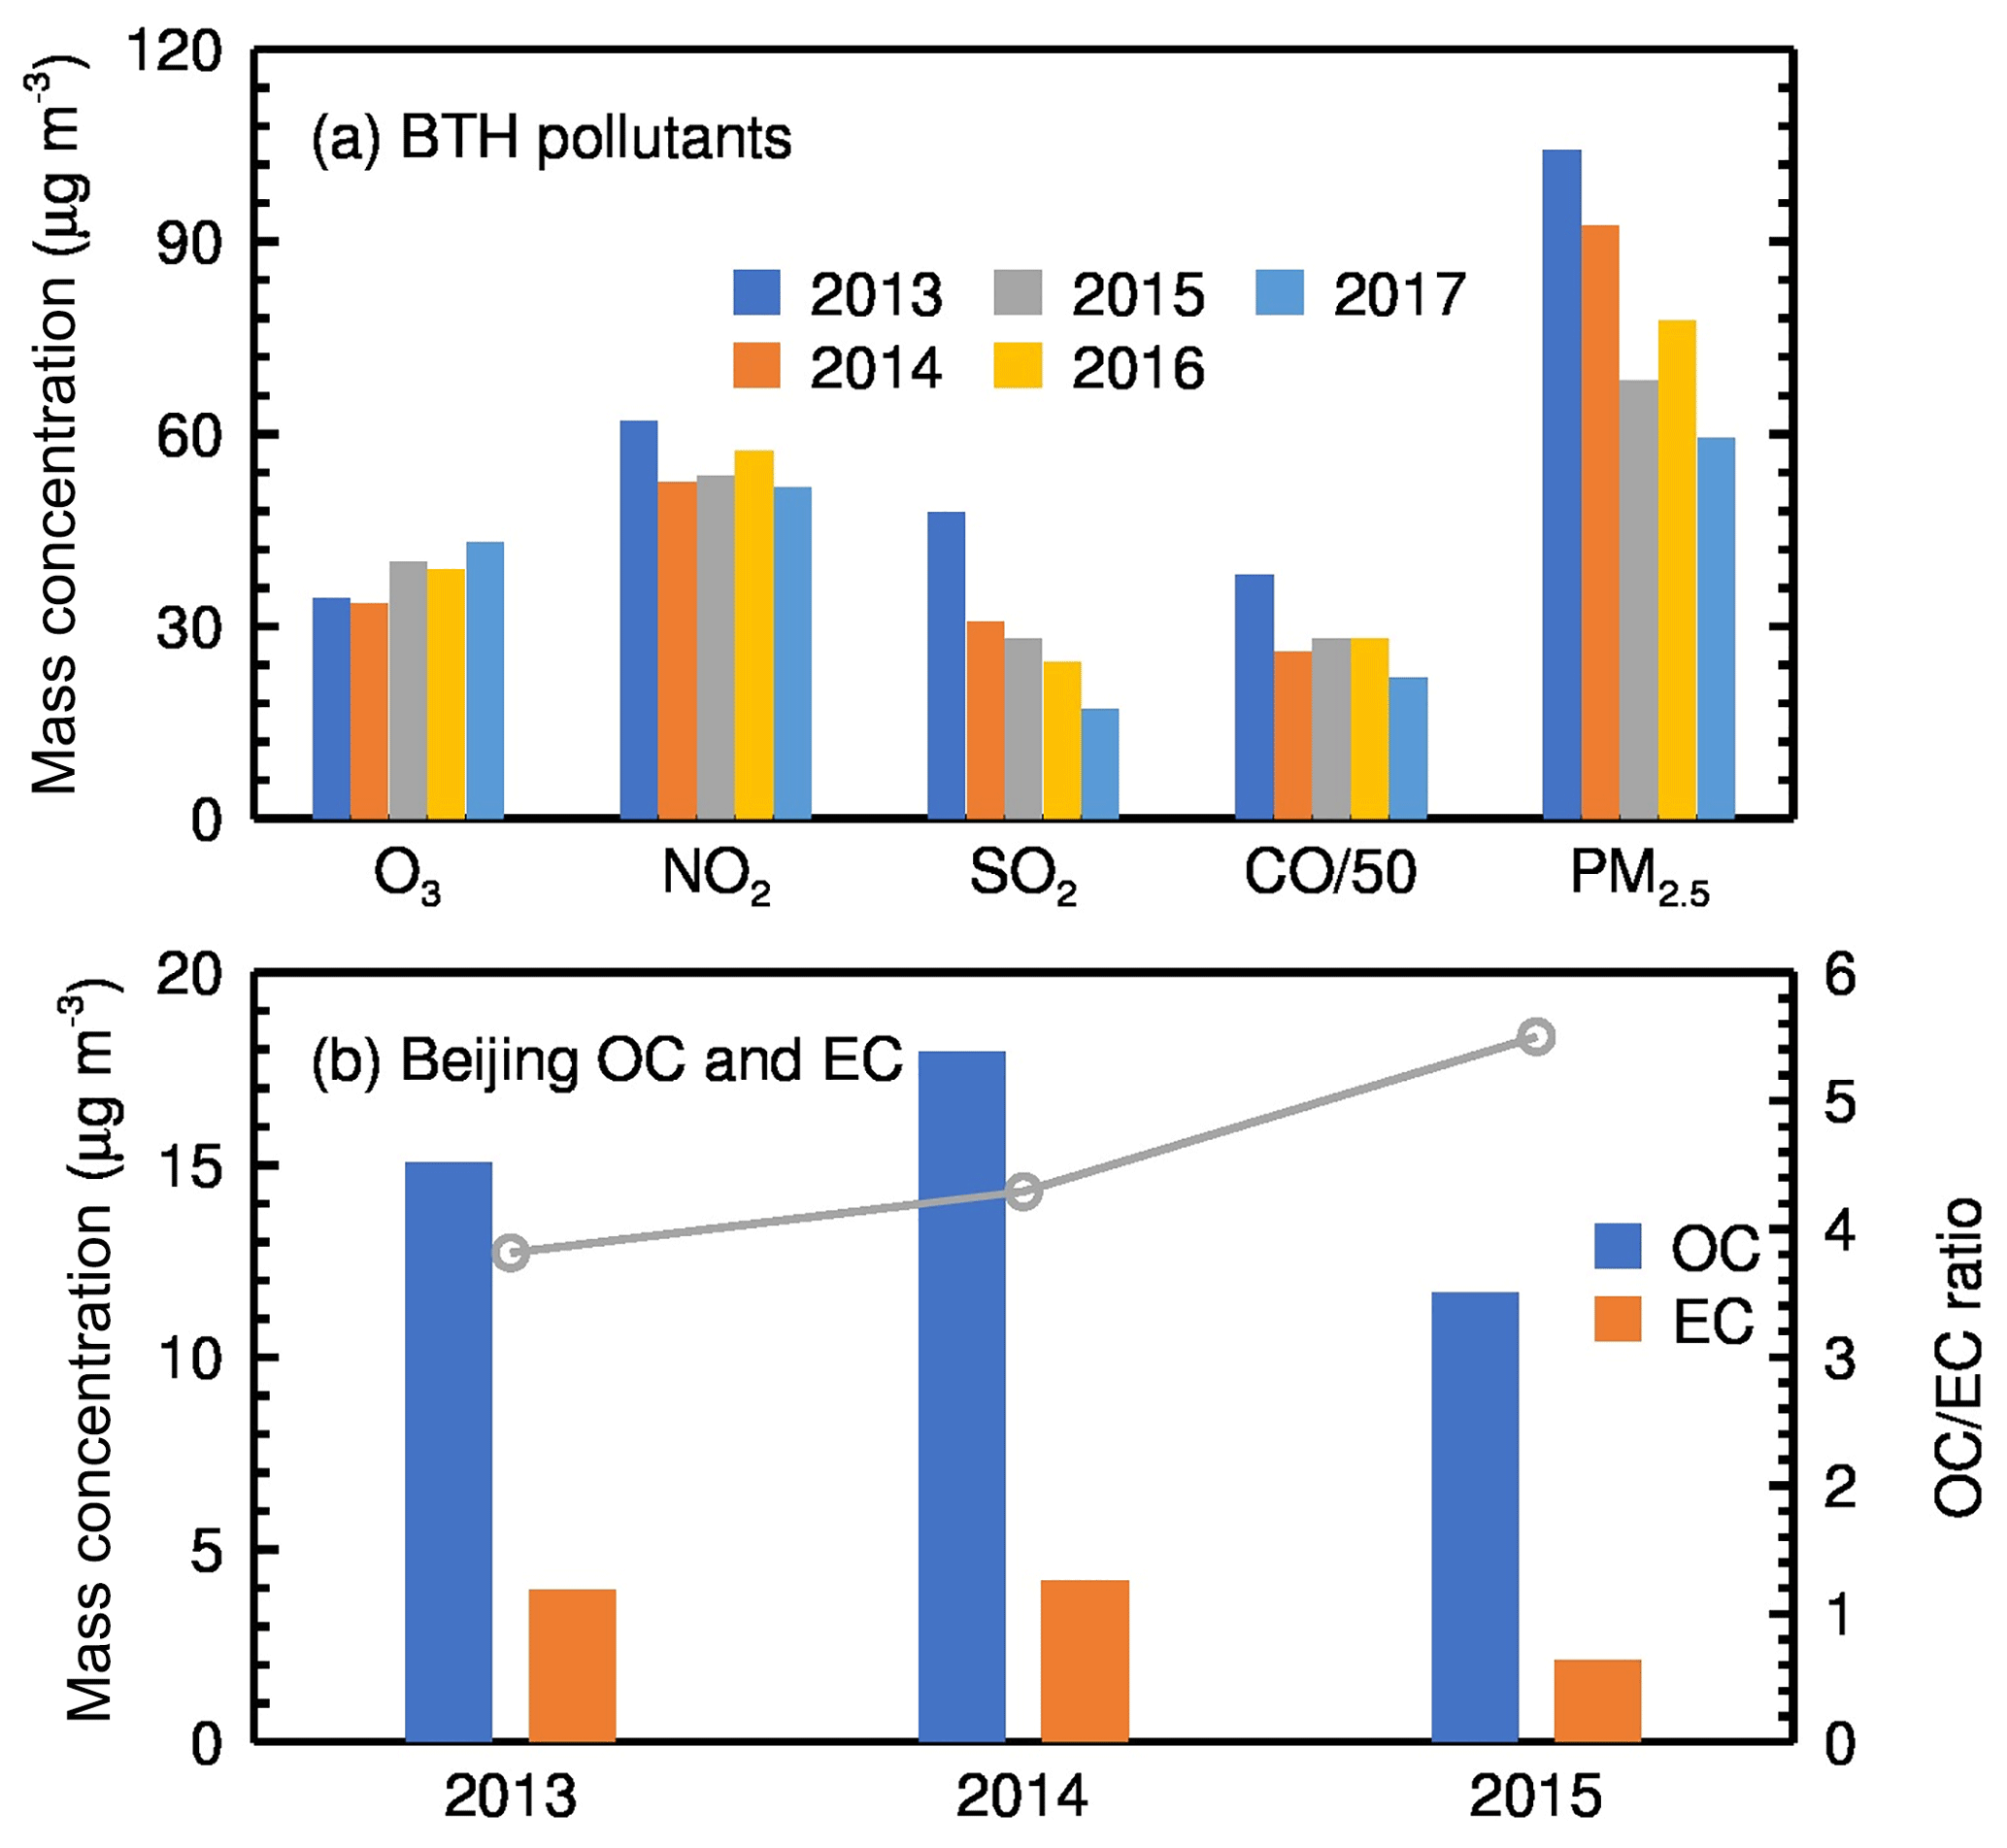
Figure 3(a) Measured concentrations of O3, NO2, SO2, CO, and PM2.5 in BTH averaged during 15 September–14 November from 2013 to 2017, and (b) OC and EC concentrations (bars) and OC∕EC ratios (line) measured in Beijing averaged during 15 September–14 November from 2013 to 2015.
As important PM2.5 components, OC and EC are measured in Beijing in the autumns from 2013 to 2015 (Fig. 3b). The measured OC∕EC ratio has substantially increased during the 3 years (about 44 %). There are two possible reasons for this. Firstly, the increase might be attributed, at least in part, to the increasing AOC, which enhances the SOA formation. Secondly, the increase might be caused by the changes in OC and EC emissions due to the implementation of APPCAP. The large variability in OC and EC concentrations in Fig. 3b suggests considerable emission changes, although it is still difficult to evaluate exactly how much the emissions have been changed. Since SOA formation is closely associated with the abundance of oxidants (Li et al., 2011b; Robinson et al., 2007), OA in BTH is expected to be more oxygenated (add oxygen) and hence to increase in mass with enhanced AOC.
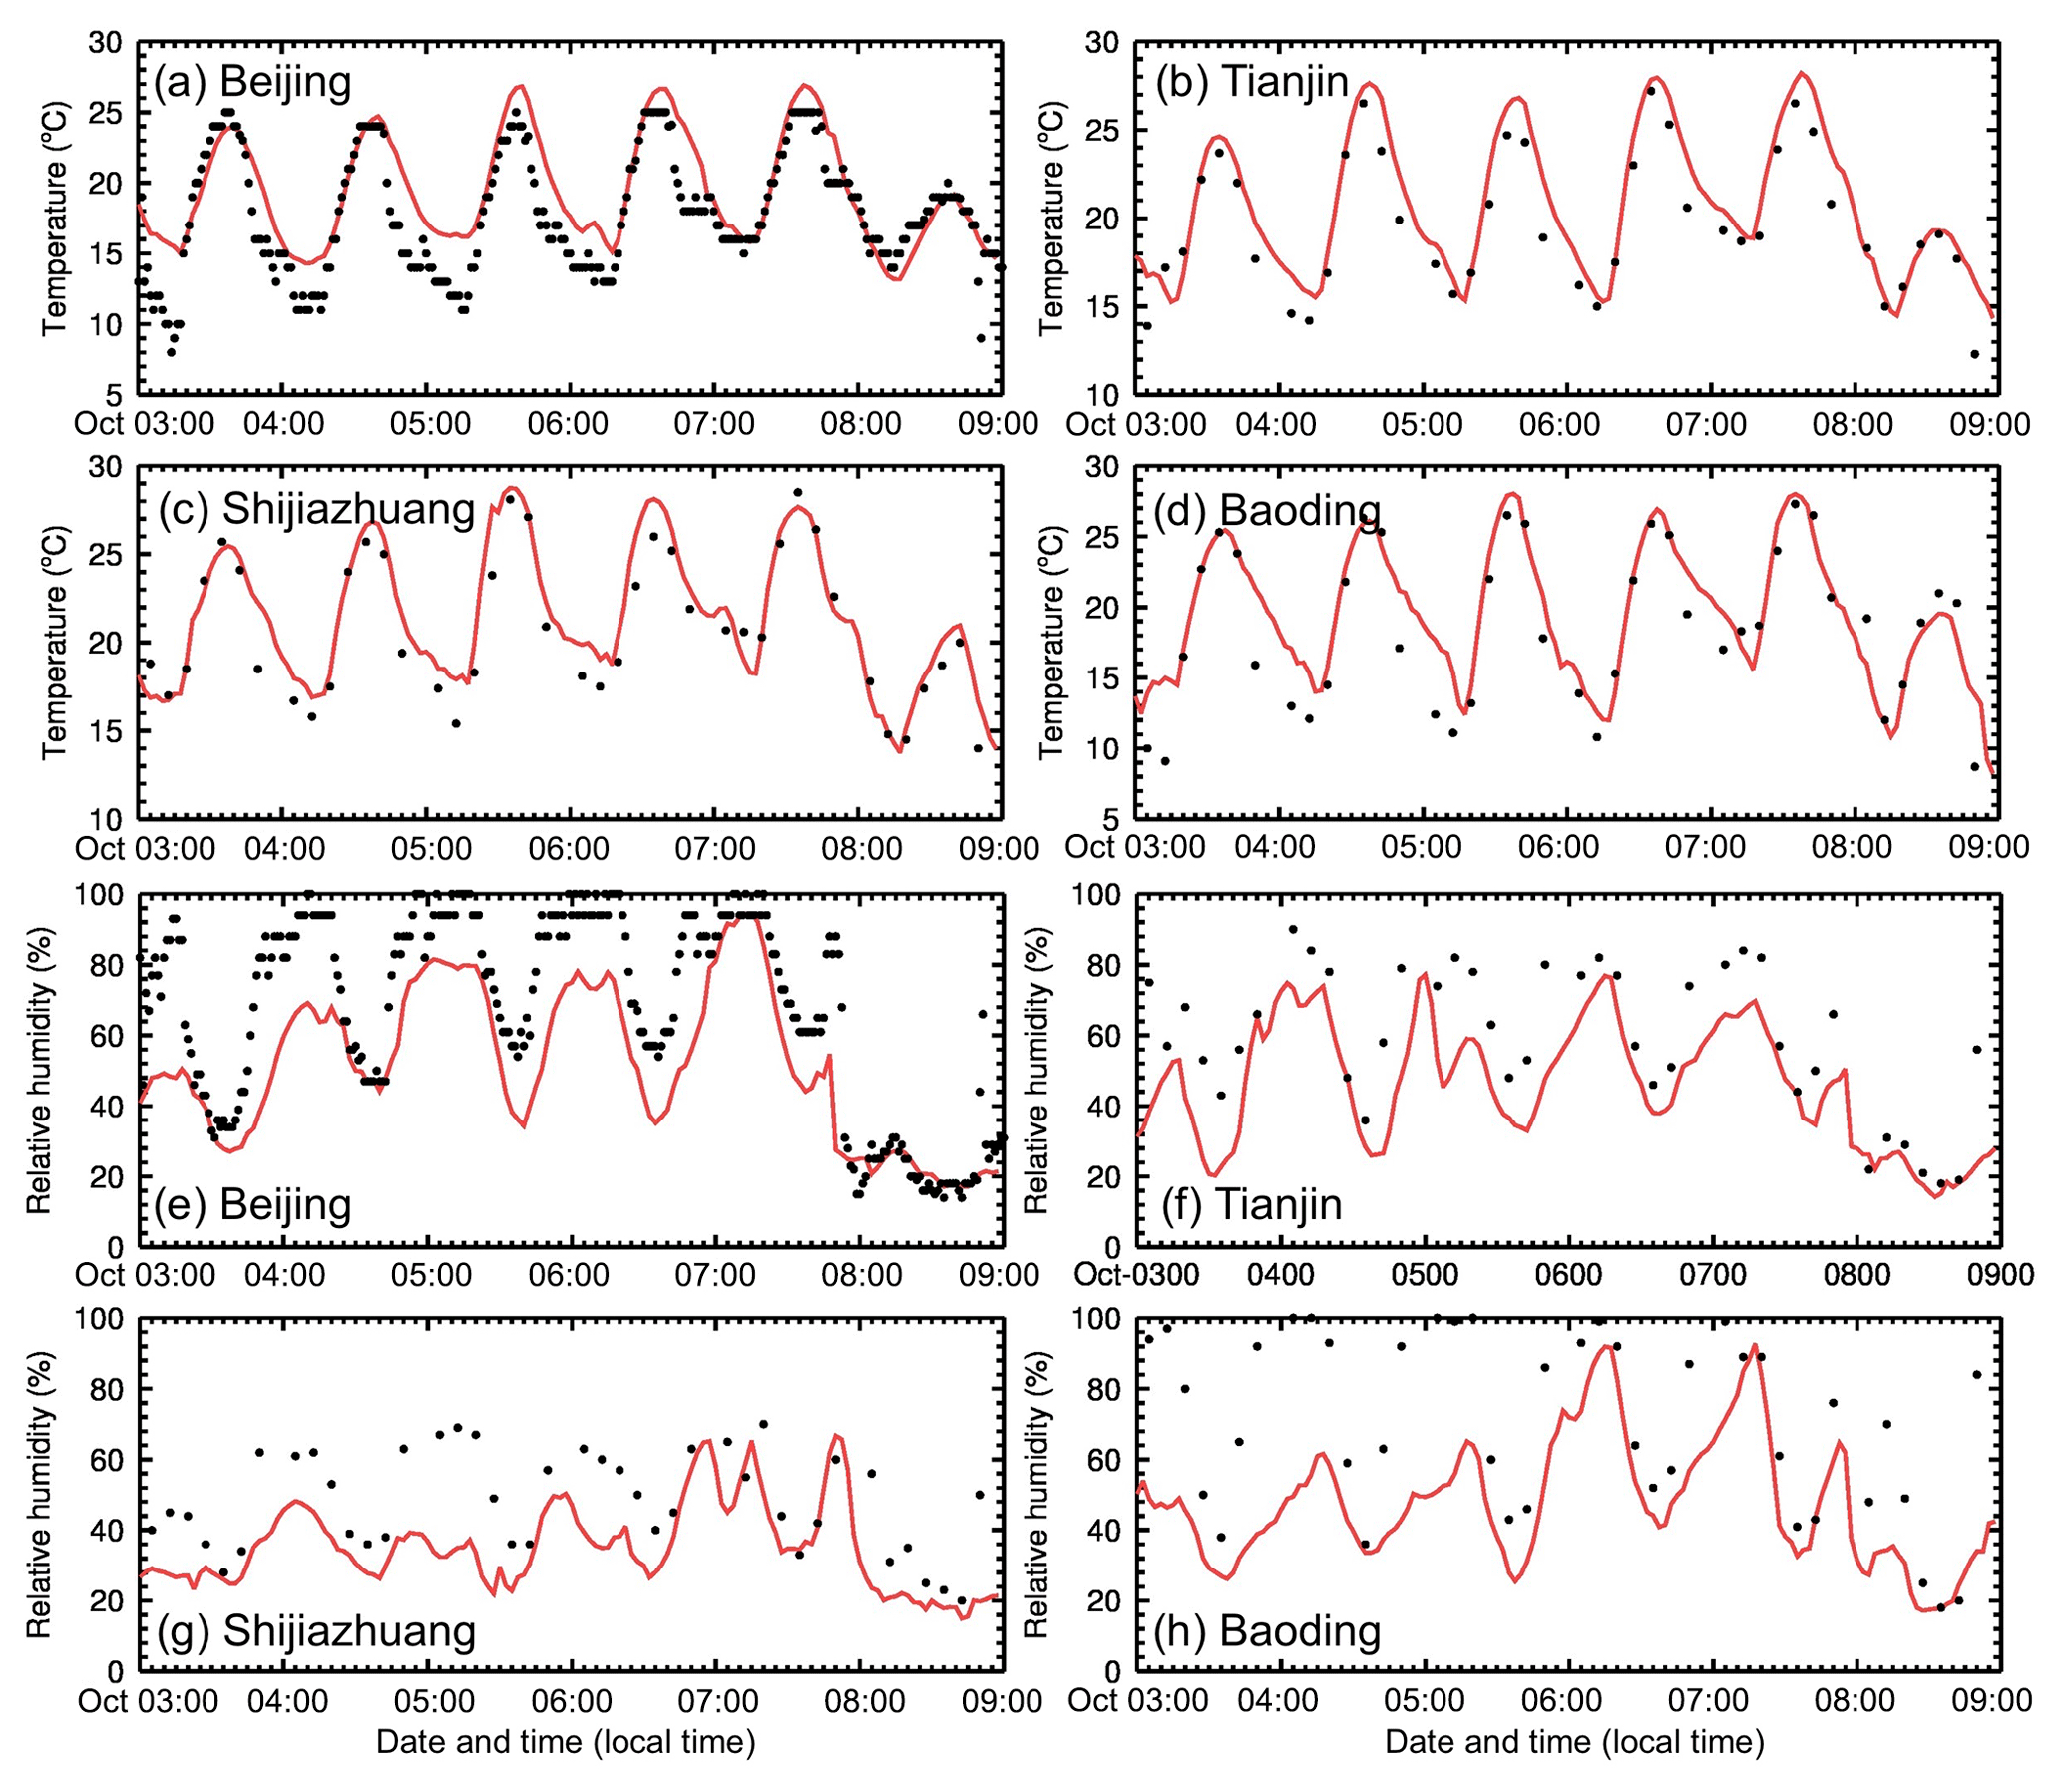
Figure 4Simulated (red curves) and observed (black dots) temporal profiles of surface (a–d) temperature and (e–h) relative humidity in (a, e) Beijing, (b, f) Tianjin, (c, g) Shijiazhuang, and (d, h) Baoding from 3 to 8 October 2015.
3.2 Model evaluation
3.2.1 Meteorological fields
Model performance in meteorological fields is crucial for the simulation of air pollutants (Bei et al., 2010, 2012, 2017). Figures 4 and 5 present the simulated temporal variations in the surface temperature, relative humidity, wind speed, and wind direction against observations at four meteorological stations (Beijing, Tianjin, Shijiazhuang, and Baoding; Fig. 1) in BTH.
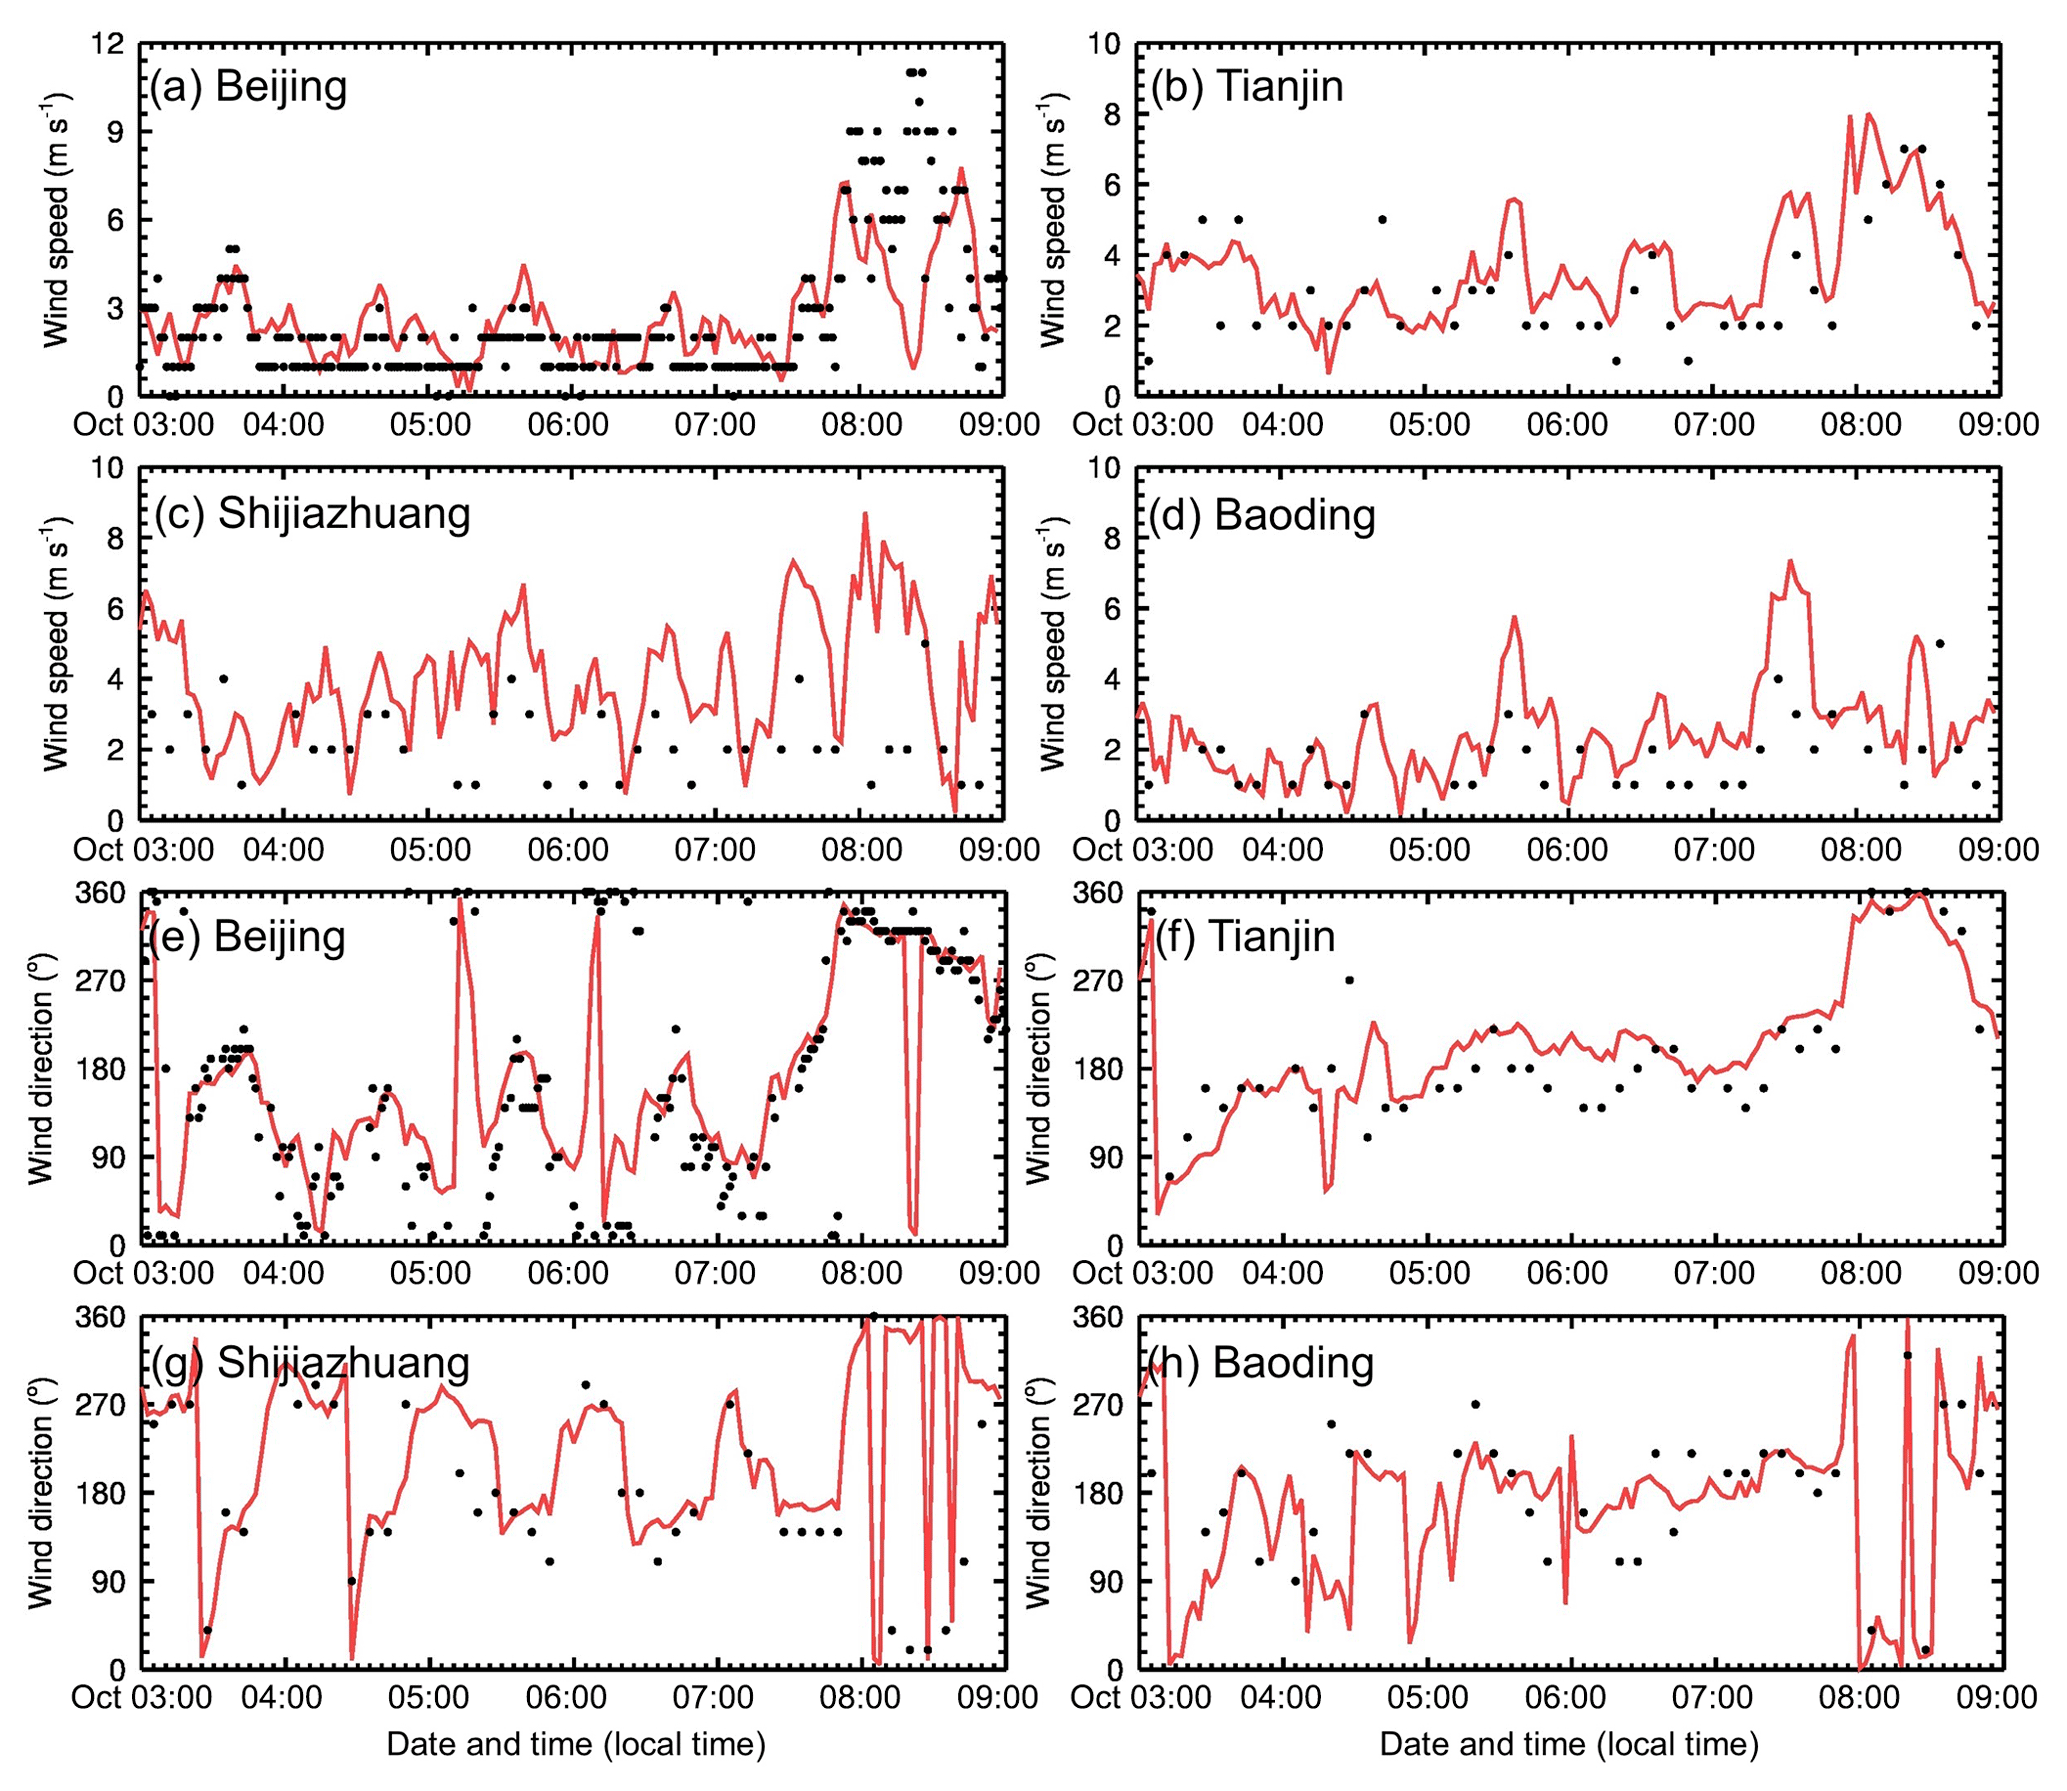
Figure 5Simulated (red curves) and observed (black dots) temporal profiles of surface (a–d) wind speed and (e–h) wind direction in (a, e) Beijing, (b, f) Tianjin, (c, g) Shijiazhuang, and (d, h) Baoding from 3 to 8 October 2015.
The model performs well in reproducing the observed diurnal cycles of the surface temperature and relative humidity at the four stations (Fig. 4). The simulated temporal variations in temperature and relative humidity are in good agreement with the observations at the meteorological station in Tianjin. However, in the other three cities, the model generally cannot reproduce the fairly low temperature and high relative humidity well during nighttime. In general, the model replicates the low winds during 3–7 October in Beijing, Tianjin, and Baoding but slightly overestimates the wind speed in Shijiazhuang, particularly in the morning of 8 October (Fig. 5). The model fails to produce the occurrence of the strong wind with a maximum speed exceeding 10 m s−1 and the wind direction at noon on 8 October in Beijing. Overall, the model still generally captures the temporal variations in wind directions in the four cities.
3.2.2 PM2.5, O3, and NO2
The spatial distributions of simulated and observed daily PM2.5 concentration during the period from 3 to 8 October 2015 are presented in Fig. 6 along with wind fields. This haze event in BTH can be divided into four stages: (1) startup (3 October), (2) development (4 October), (3) maturation (5–7 October), and (4) dissipation (8 October). On 3 October, the haze formed in Shandong and southern BTH, accompanied by weak winds near the surface (<2 m s−1). On 4 October, the southerly wind prevailed, causing transboundary transport of air pollutants from south to north, and the PM2.5 concentration in BTH rapidly increased. From 5 to 7 October, the southerly wind continued and the haze became persistently severe in BTH. Finally, a strong northerly wind cleaned up the haze within several hours on 8 October. The model reasonably reproduces the haze evolution in BTH, but it generally underestimates the PM2.5 concentration in Shandong province.
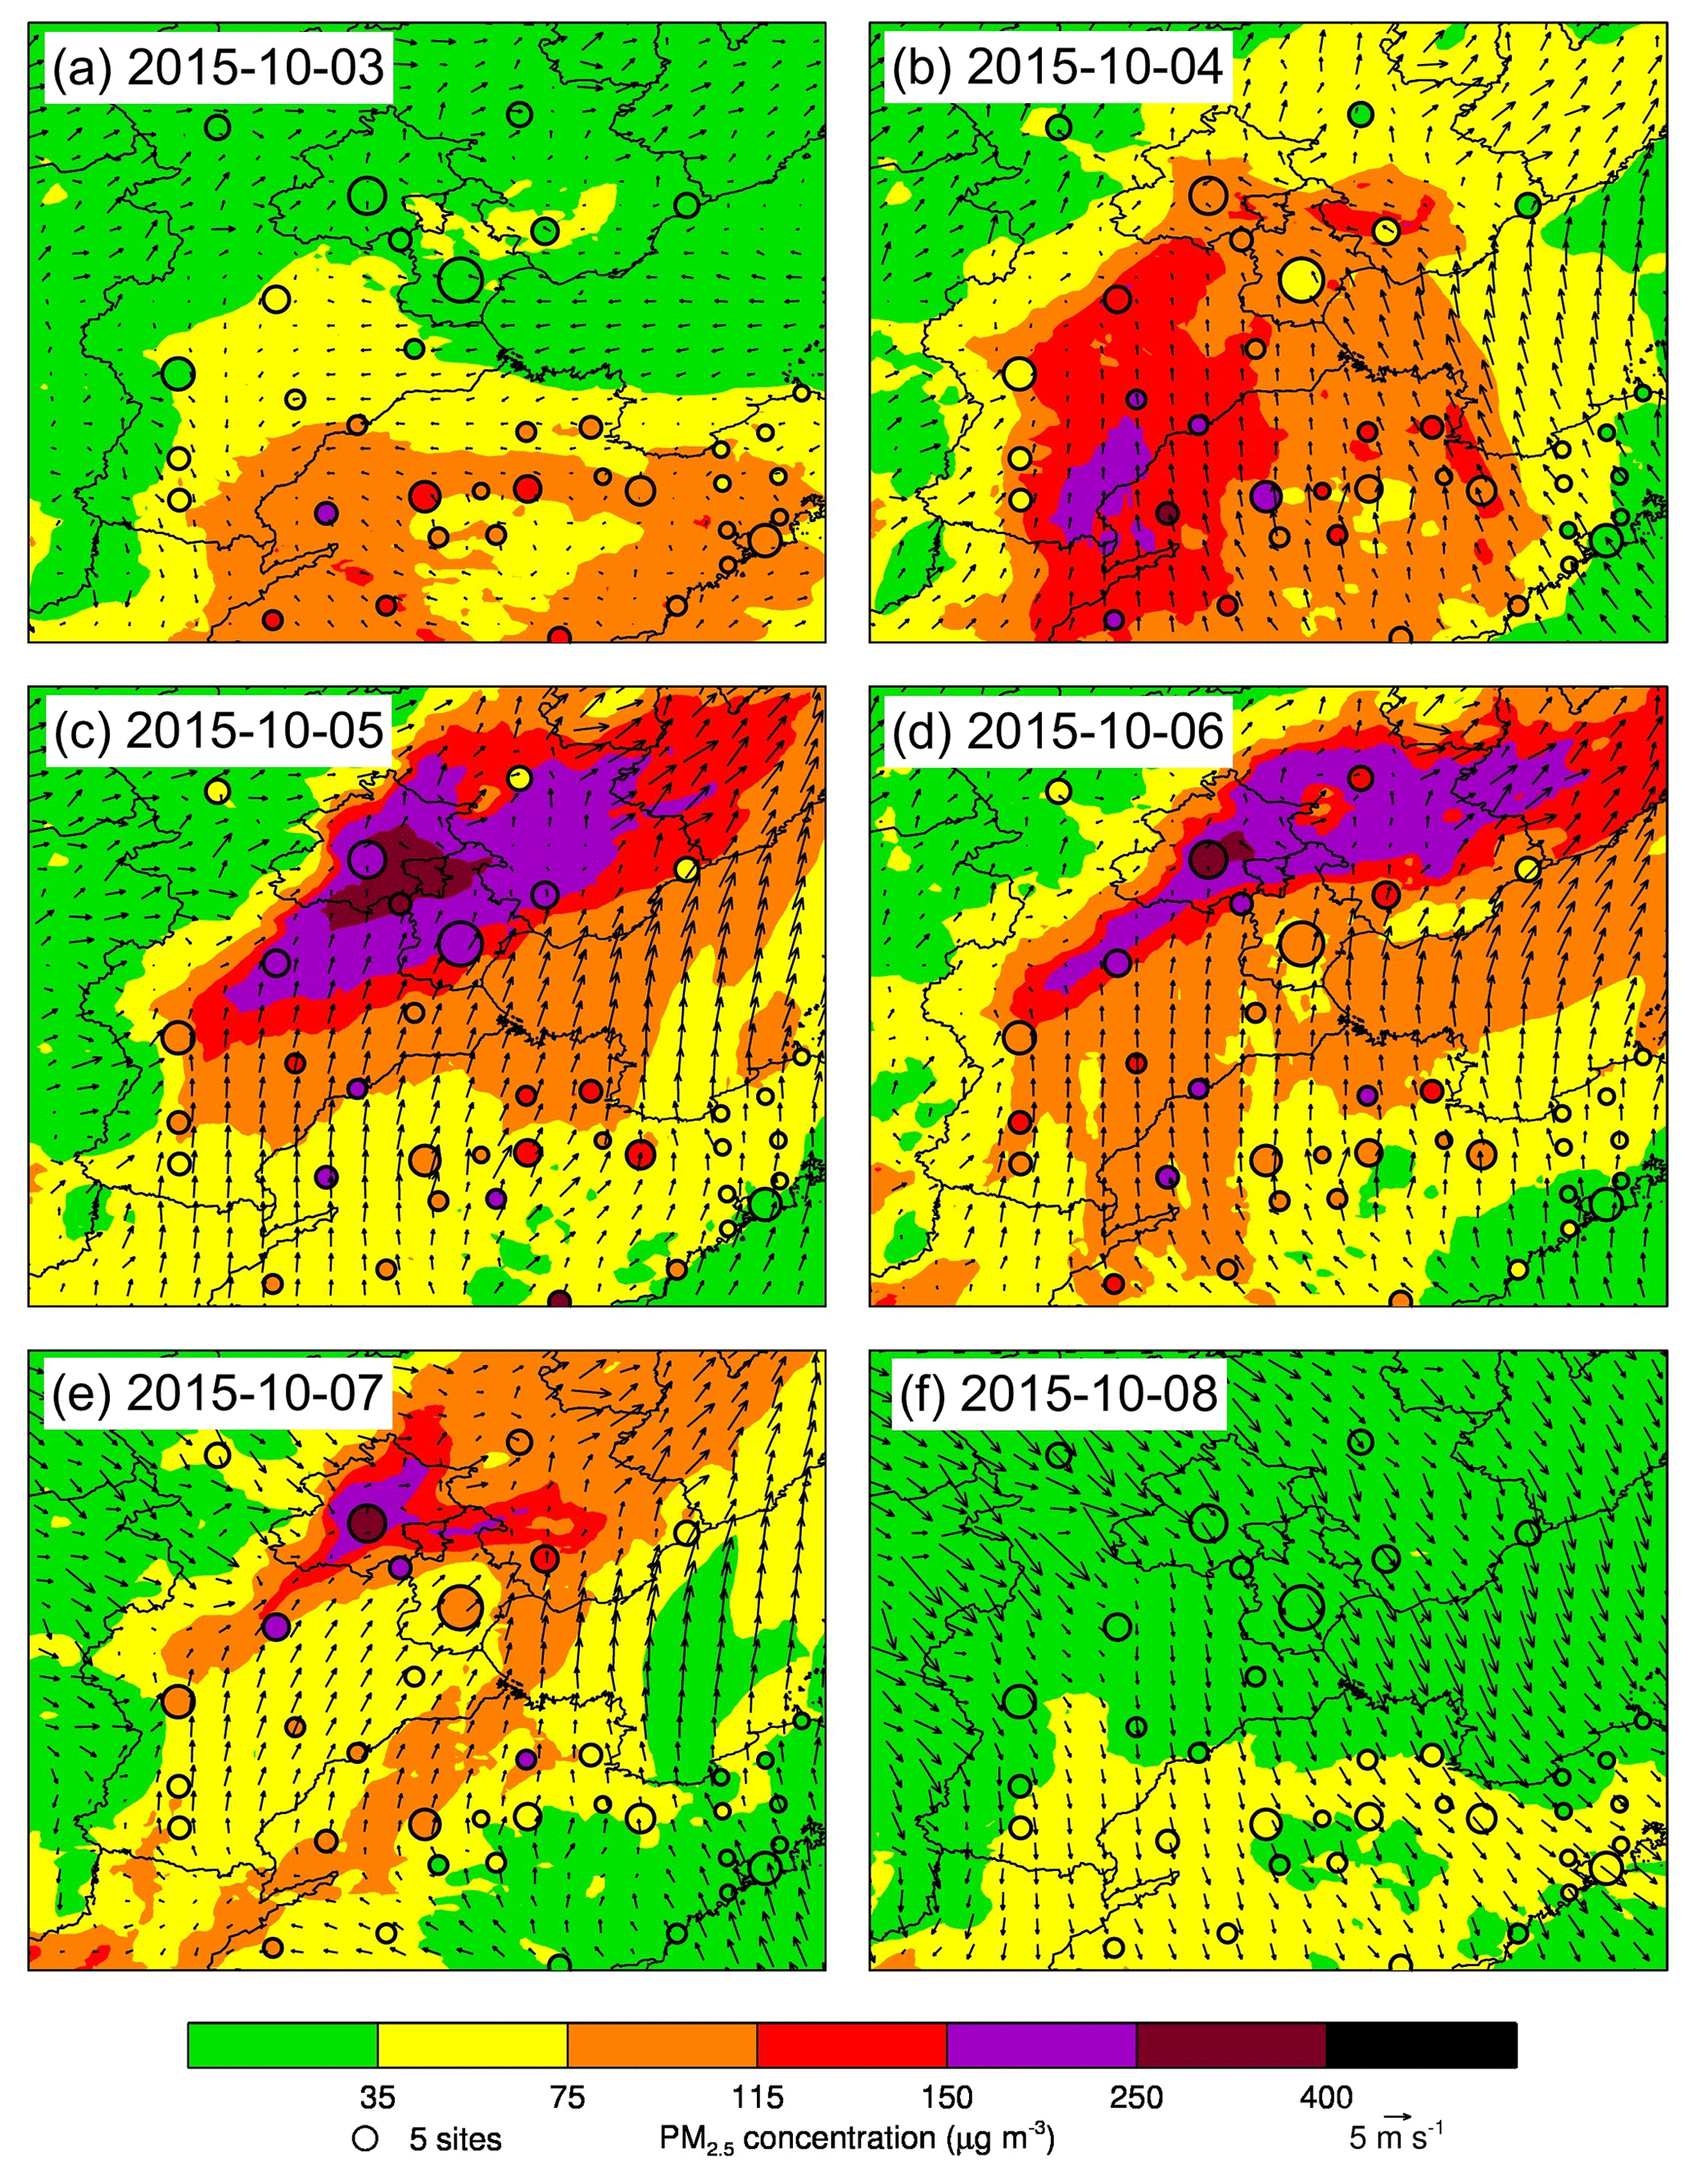
Figure 6Spatial distributions of the modeled (colored shadings) and observed (colored dots) surface daily PM2.5 concentration from 3 to 8 October 2015. Black arrows show the simulated surface winds.
Figure 7 shows the observed and simulated spatial distribution of peak O3 concentrations at 14:00 LT (LT – local time; all times hereafter are in local time) during the episode. Similar to PM2.5, the high O3 concentration first occurred in Shandong province on 3 October and propagated to BTH on 4 October. During the maturation period, the O3 level in BTH still remained high. The simulated spatial distributions of O3 concentrations generally agree well with the observations during the four stages, but underestimation or overestimation still exists.

Figure 7Spatial distributions of the modeled (colored shadings) and observed (colored dots) surface O3 concentration at 14:00 (local time) from 3 to 8 October 2015. Black arrows show the simulated surface winds.
Figure 8 shows the temporal variations in the simulated and observed surface PM2.5, O3, and NO2 concentrations averaged over 12 ambient monitoring stations in Beijing. The simulated and observed PM2.5 temporal pattern clearly shows the four stages of the haze episode, with the PM2.5 concentration increasing from about 20 µg m−3 during the startup stage to more than 300 µg m−3 during the maturation stage. The model generally replicates the evolution of the observed PM2.5 concentration with an IOA (r) of 0.95 (0.91) but slightly underestimates the PM2.5 concentration with an MB (NMB) of −13.0 µg m−3 (−8.7 %). The simulated diurnal profile of the O3 concentration is very consistent with observations, with an IOA (r) of 0.94 (0.92), but the model overestimates the O3 diurnal lows during the maturation stage. Additionally, Fig. 8a and b also show that both O3 and PM2.5 pollution occurs during the maturation stage in Beijing, as previously reported for non-winter seasons (Jia et al., 2017). The model also exhibits good performance in simulating the temporal variation in NO2 concentrations, with an IOA (r) of 0.90 (0.81).
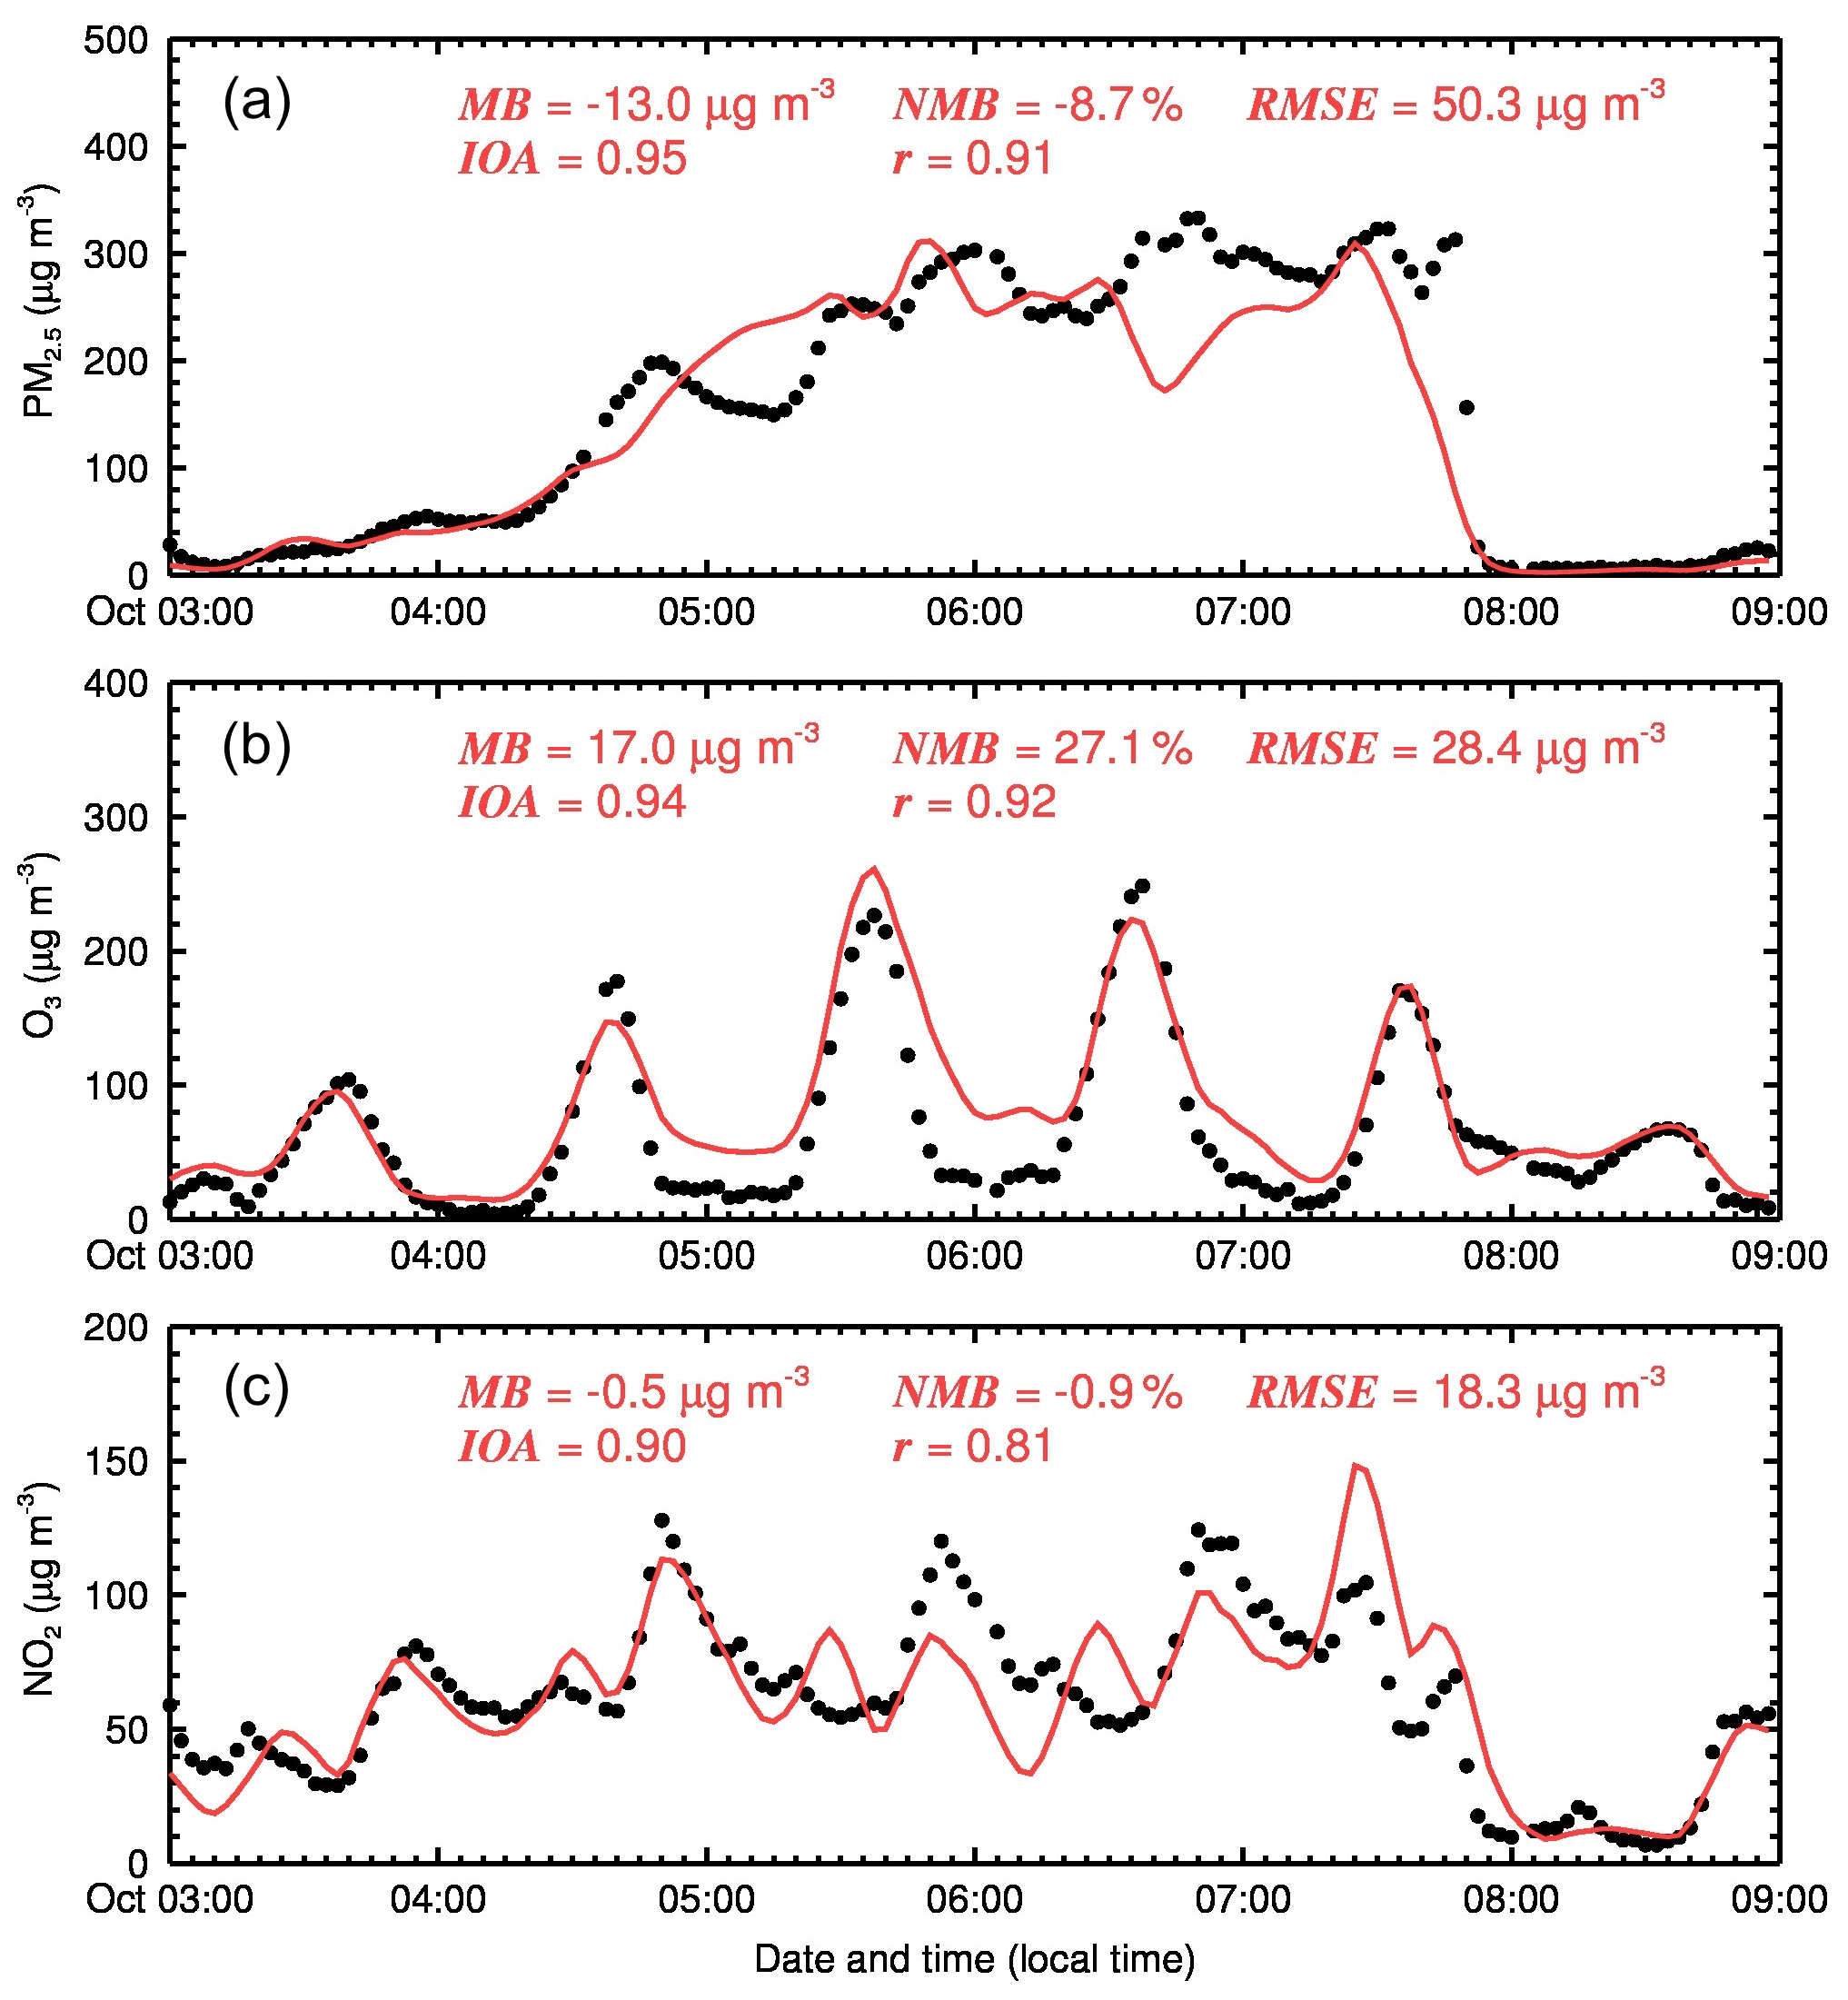
Figure 8Diurnal variations in the modeled (red curves) and observed (black dots) surface (a) PM2.5, (b) O3, and (c) NO2 concentrations averaged over 12 ambient monitoring stations in Beijing from 3 to 8 October 2015.
3.2.3 Carbonaceous aerosols
The simulated carbonaceous aerosols including POA, SOA, and EC in the model are compared with the hourly observations in Beijing (Fig. 9). In general, the temporal variations in the measured carbonaceous aerosols are similar to those of the PM2.5 in Fig. 8a. The model yields the increasing trend of the POA concentration from the startup to maturation stages compared to the measurements but cannot capture the observed spiky peaks well, with an IOA (r) of 0.75 (0.58). Figure 9b shows that the observed SOA concentration is remarkably enhanced during the maturation stage, ranging from 30 to 90 µg m−3, which is predicted well by the model. The MB, NMB, IOA, and r for the simulated SOA concentration are −2.1 µg m−3, −6.9 %, 0.89, and 0.81, respectively. Although the IOA and r for the simulated EC concentration reach 0.92 and 0.90, respectively, the model considerably underestimates the EC concentration against measurement on 6 and 7 October, which is likely caused by the variation in the anthropogenic emissions.
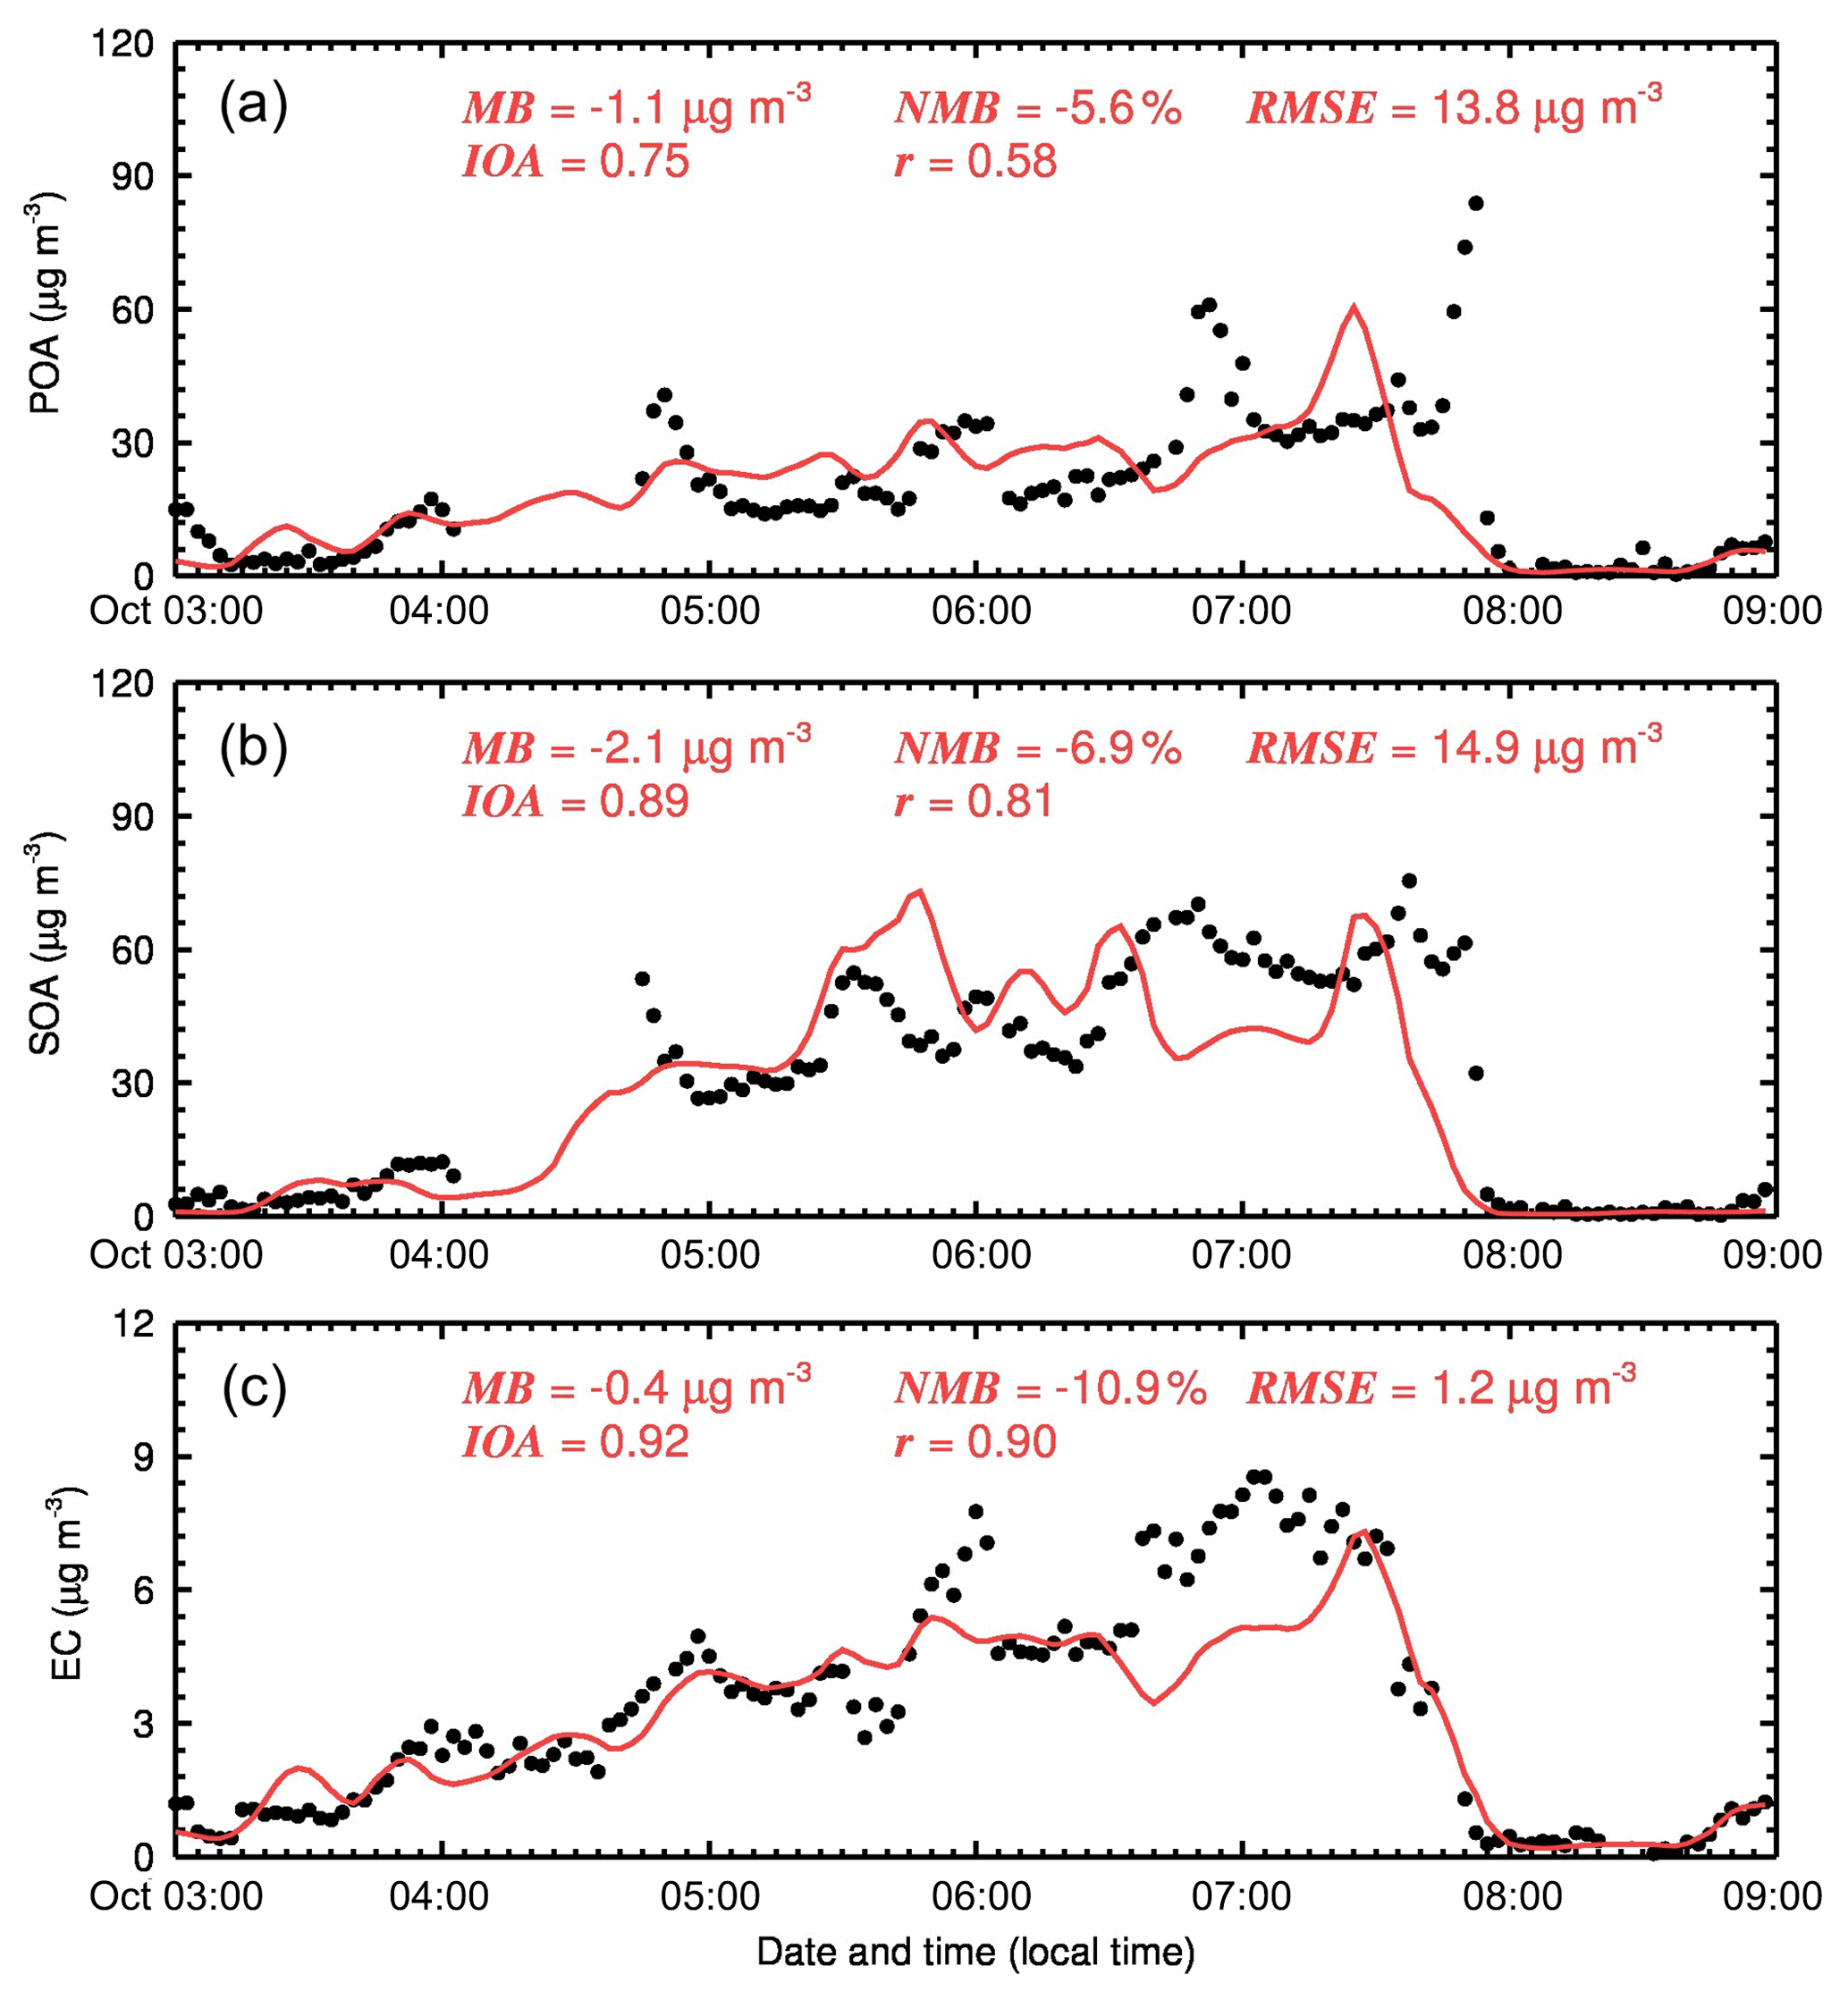
Figure 9Diurnal variations in the modeled (red curves) and observed (black dots) surface submicron (a) POA and (b) SOA concentrations at the NCNT station, and (c) EC concentration in PM2.5 at the CRAES station in Beijing from 3 to 8 October 2015.
Overall, the model performs reasonably in reproducing the observed meteorological fields and the PM2.5 and O3 evolutions, and temporal variations in carbonaceous aerosols during the pollution episode, providing a reliable base for further sensitivity studies.
3.3 Impact of increasing oxidizing capacity on OA
Compared to the REF simulation, when the photolysis frequencies are decreased by 10 %, 20 %, 30 %, and 40 % in the four sensitivity experiments (SEN1–SEN4), respectively, the O3 (OH radical) concentration is correspondingly reduced by 7.4 % (9.2 %), 15.1 % (18.3 %), 22.9 % (26.9 %), and 30.9 % (35.7 %). It is worth noting that the REF experiment is assumed to represent a situation in autumn with the high AOC, and the SEN1–SEN4 experiments could be regarded as four scenarios with the different lower AOC.
3.3.1 OA component changes
Figure 10a and b show the variation in POA, SOA, and total organic aerosol (TOA) concentrations as a function of the O3 and OH concentration changes over BTH by differentiating REF and the four sensitivity experiments, respectively. The SOA level decreases almost linearly with decreasing O3 or OH concentrations, indicating that the AOC plays an important role in the SOA formation over BTH. In the SEN4 experiment with the most reduction of the AOC, the SOA concentration in BTH is reduced by 31.3 % or 5.2 µg m−3 on average during the episode. The reduction in POA level with decreasing O3 and OH concentrations is generally not substantial, indicating that IVOCs and VOCs are the most important SOA contributors. The TOA (sum of POA and SOA) level also exhibits a decreasing trend with O3 and OH concentrations. In Fig. 10c and d, the SOA mass fraction in TOA and OC∕EC ratio is considerably reduced as the AOC decreases. The SOA fraction (OC∕EC ratio) is about 0.52 (6.39) in the REF simulation and almost linearly decreases to around 0.43 (5.49) in the SEN4 experiment, indicating a slower aging process of OA with decreasing AOC. The simulated decrease in OC∕EC ratio due to reduced AOC could interpret the observed change in OC∕EC ratio in Fig. 3b to some degree.
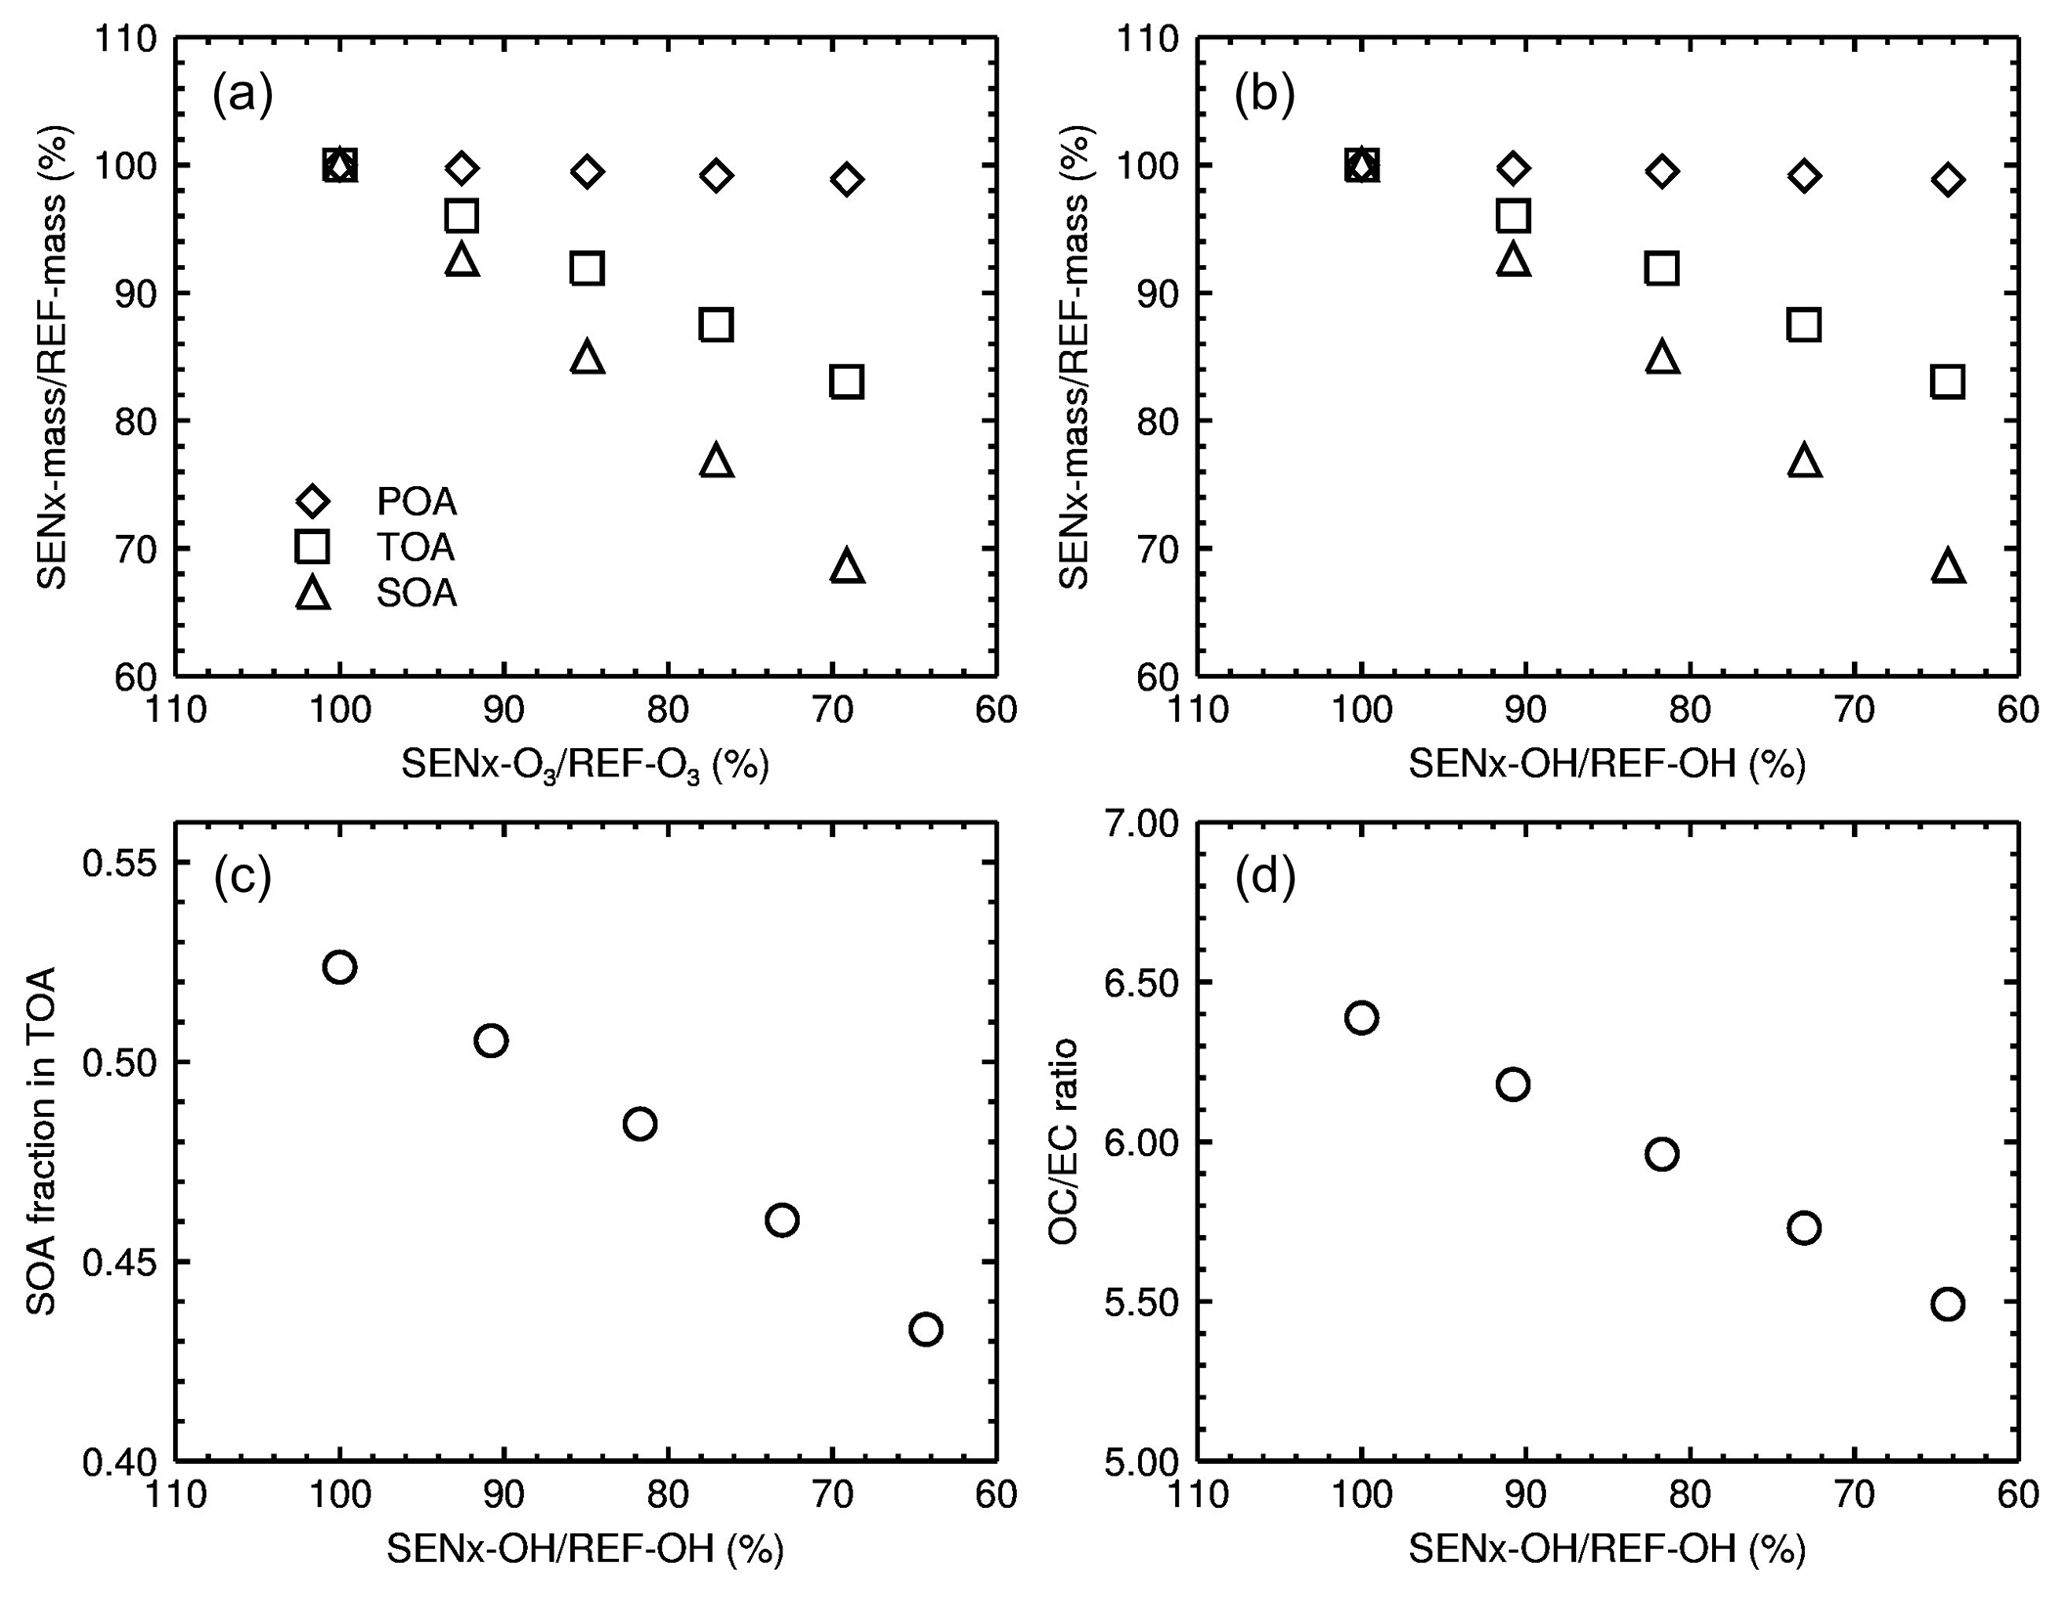
Figure 10Impacts of changes in the AOC on organic aerosol components in BTH in four sensitivity experiments. (a) Concentration changes of POA, SOA, and TOA versus O3. (b) Concentration changes of POA, SOA, and TOA versus OH. (c) SOA fraction in TOA versus OH concentration change. (d) OC∕EC ratio versus OH concentration change.
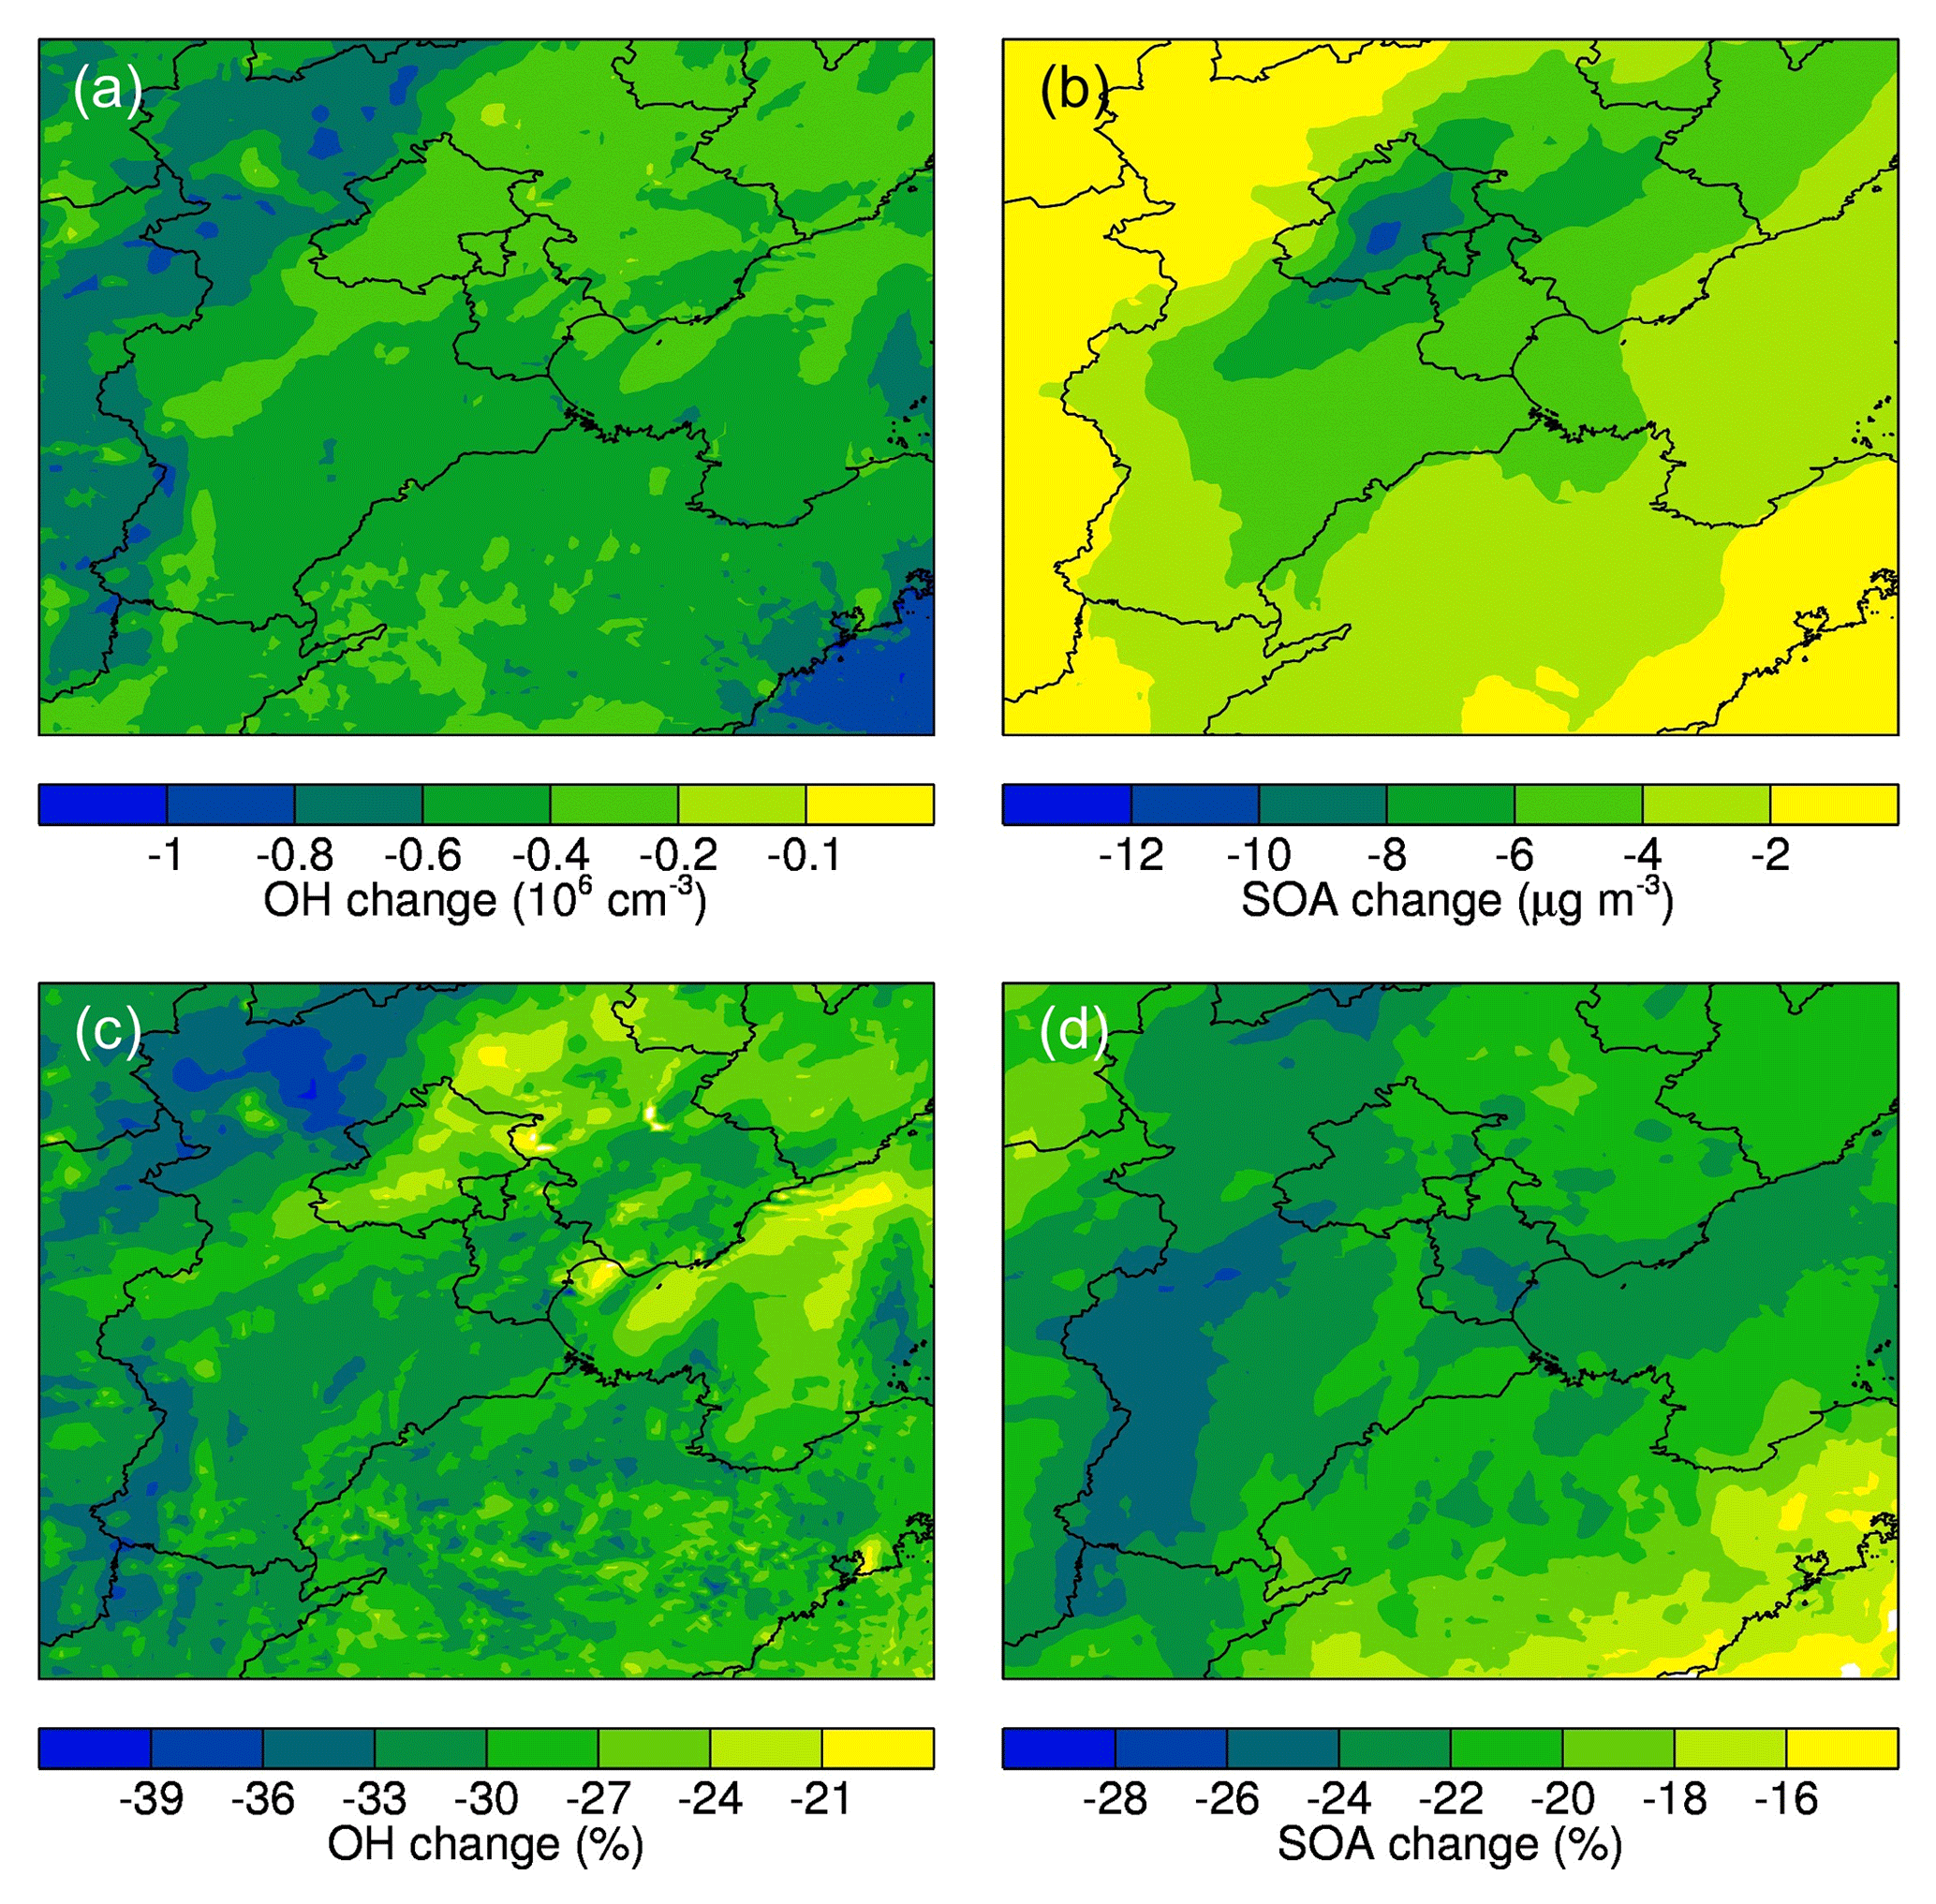
Figure 11Spatial distributions of changes in (a, c) OH and (b, d) SOA concentrations averaged from 4 to 7 October 2015 in the SEN3 experiment compared to the REF simulation (SEN3–REF).
It is worth noting that the increase in OC∕EC ratio potentially influences atmospheric radiation and thermodynamical profiles through enhancing aerosol scattering and absorption simultaneously (Wang et al., 2013). When the photolysis frequencies are reduced by 30 % in the SEN3 experiment, compared to the REF, the downward shortwave radiation is reduced by 1.2 W m−2 on average in BTH, and the surface temperature is decreased by around 0.016 ∘C during the daytime. Effects of the AOC change on the temperature profile is not significant, and the daytime temperature decrease in the SEN3 experiment is less than 0.005 ∘C within 1 km of the surface.
3.3.2 SOA spatial change in SEN3
Among the four experiments, the O3 change over BTH in SEN3 is close to the observed change (about 30 % increase; Fig. 3a). Therefore, we further analyze the SOA spatial change in the SEN3 experiment. To illustrate the impacts of the AOC change on the spatial distribution of SOA concentrations in BTH during the haze episode, Fig. 11 shows the spatial distributions of the variation in the main oxidant (OH) and SOA concentrations averaged from 4 to 7 October by differentiating REF and the SEN3 experiment. When the photolysis rates are reduced by 30 %, the OH concentration over BTH is generally decreased by more than 20 %, but the OH variation distribution is not uniform (Fig. 11c). The OH decrease is remarkable in the west of Hebei province, compared to the other regions of BTH, showing the variety of OH sinks and its reservoirs. The most striking decrease in SOA mass occurs in Beijing and surrounding areas, exceeding 8 µg m−3 (Fig. 11b), while the mass percentage decrease is more noticeable in the west of Hebei province (more than 26 %; Fig. 11d), which generally corresponds to the OH reduction. Although OH is the main oxidant in the SOA formation during daytime, the spatial change of SOA concentration is not very consistent with that of the OH concentration, especially for the mass change (Fig. 11a). The geographical difference probably results from the spatial distribution variation in anthropogenic and biogenic precursors of SOA. In the middle and east of BTH, massive anthropogenic SOA precursors are emitted from residential, transportation, and industrial sources, while in the west of BTH, biogenic precursor emissions are dominant for the SOA formation but much less than those from anthropogenic sources in the middle and east of BTH (Fig. 2).
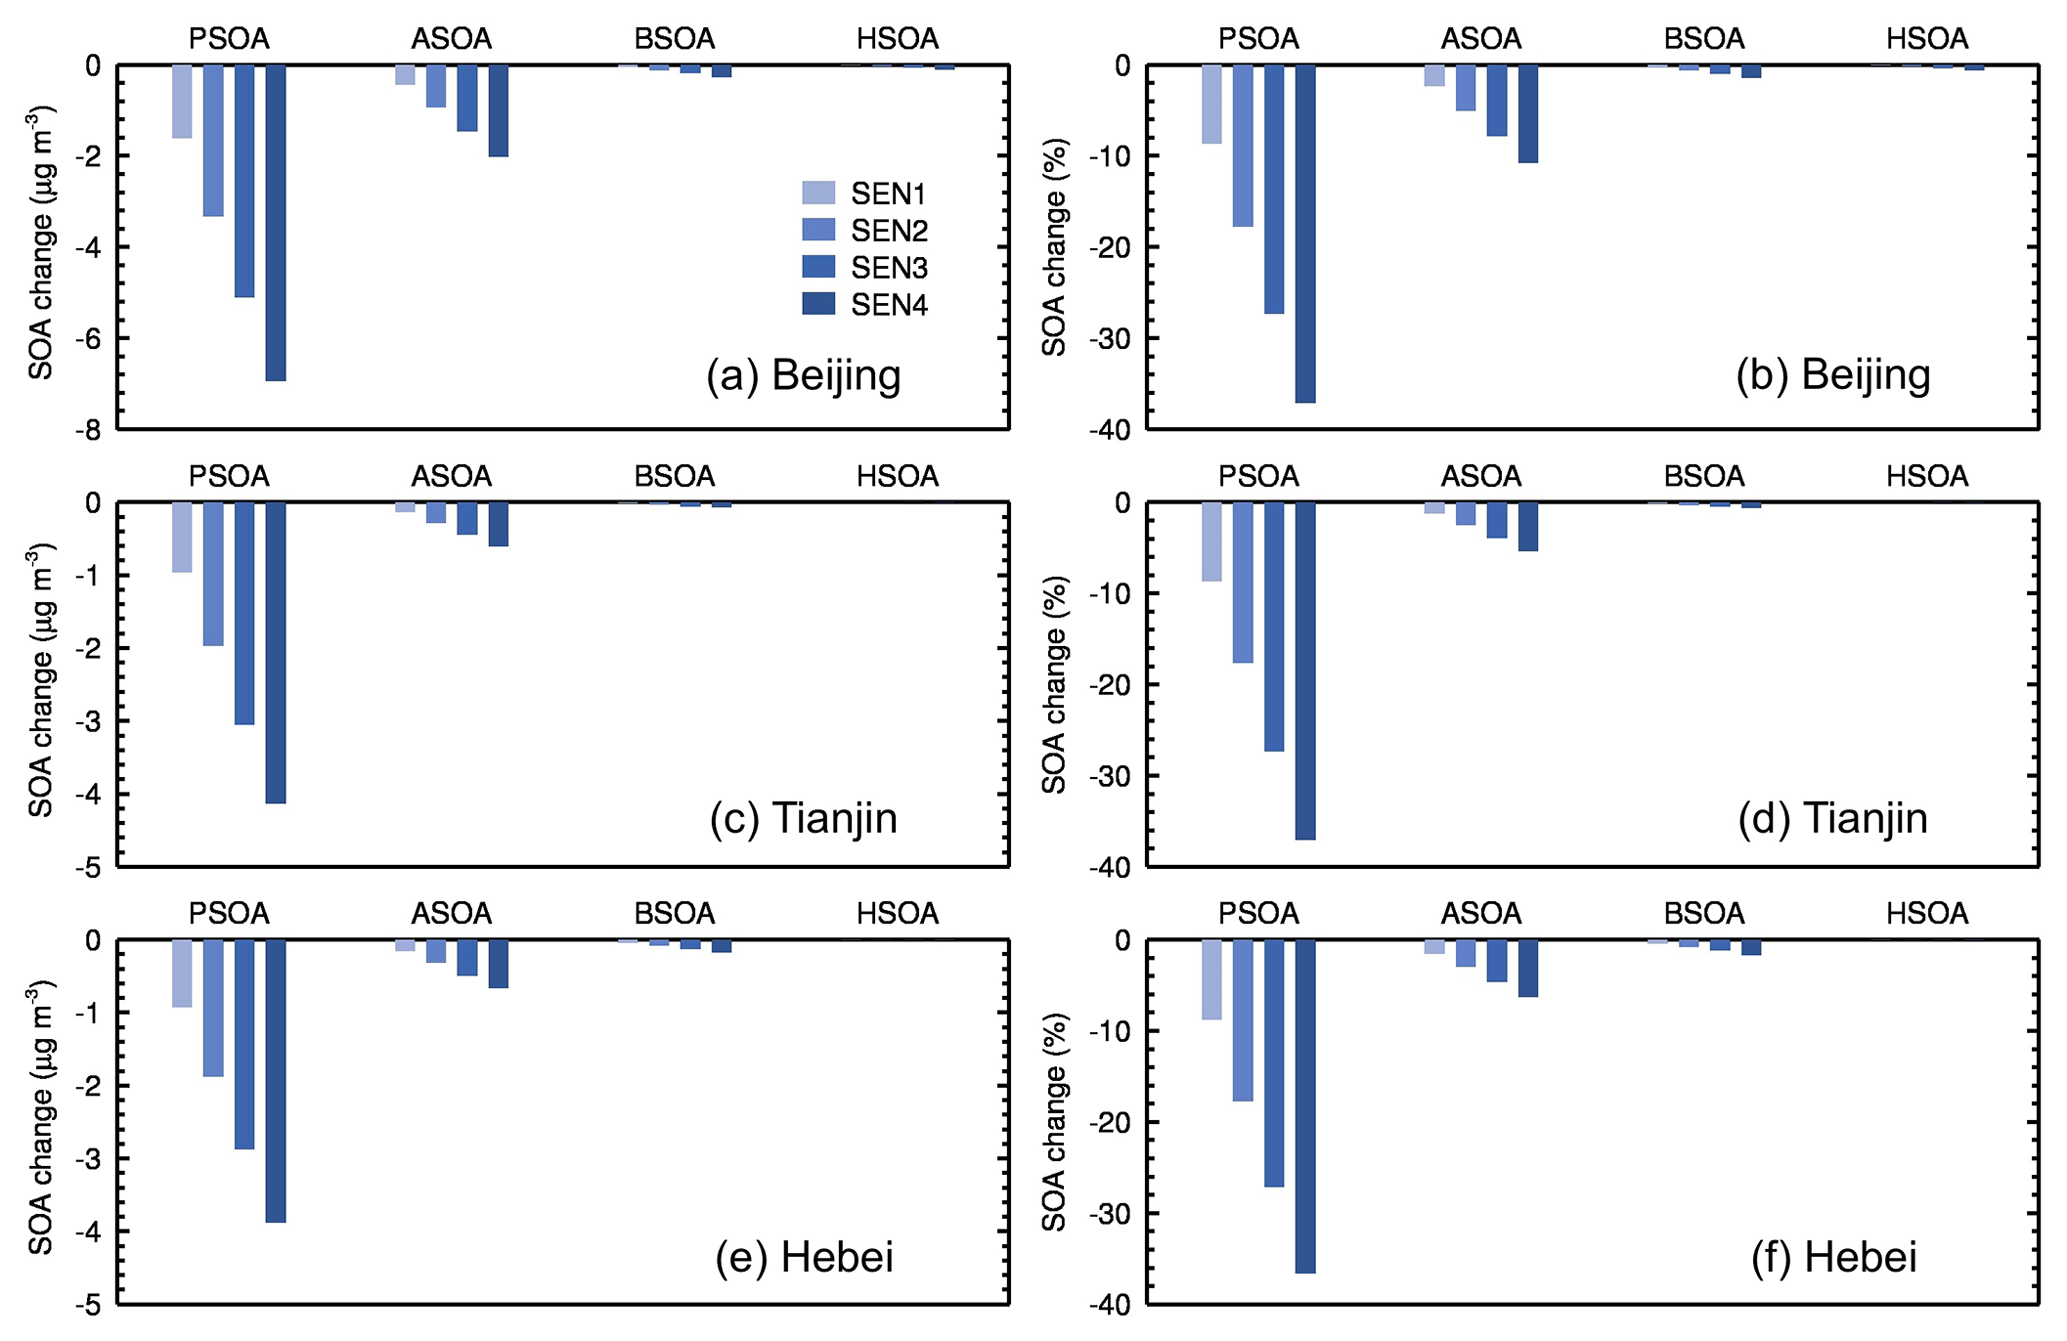
Figure 12Histogram showing the decreases of SOA from various pathways in (a, b) Beijing, (c, d) Tianjin, and (e, f) Hebei in the sensitivity experiments compared to the REF simulation (SENx–REF; x=1, 2, 3, and 4). PSOA represents oxidation and partitioning of semivolatile POA and co-emitted IVOCs, ASOA represents oxidation and partitioning of anthropogenic VOCs, BSOA represents oxidation and partitioning of biogenic VOCs, and HSOA represents heterogeneous reactions of glyoxal and methylglyoxal on aerosol surfaces.
3.3.3 Changes in the secondary organic aerosol pathways
The spatial decrease in SOA concentration highlights the important influence of AOC change on the SOA formation over BTH. To understand how the SOA components are affected by the changing AOC, we further examine the variation in the SOA formation pathways. The nontraditional SOA module employed in the WRF-Chem model includes four SOA formation pathways: oxidation and partitioning of (1) POA treated as semivolatile and co-emitted IVOCs (PSOA), (2) anthropogenic VOCs (ASOA), (3) biogenic VOCs (BSOA), and (4) heterogeneous reactions of glyoxal and methylglyoxal on the aerosol surfaces (HSOA; Feng et al., 2016; Li et al., 2011b). SOA formation from the four pathways in the REF and four sensitivity experiments is analyzed to examine the influence of the changing AOC.
Figure 12 shows the changes in SOA concentrations in the four sensitivity experiments compared with the REF simulation in Beijing, Tianjin, and Hebei, respectively. The impact of AOC reduction on the four pathways and the resulting SOA decreases differ markedly from one another. Since the oxidation and partitioning of semivolatile POA and co-emitted IVOCs contribute the most to the SOA concentration (Feng et al., 2016), the most substantial SOA decrease occurs in the PSOA, followed by the ASOA and BSOA. The decrease from the HSOA in the four experiments is negligible because the HSOA is mainly contributed by the direct emission of glyoxal and methylglyoxal from residential combustion sources (Xing et al., 2019).
It should be noted that the percentage decreases of SOA from the PSOA in Beijing, Tianjin, and Hebei are comparable (Fig. 12b, d, and f), although the mass decrease in Beijing is apparently larger than that in Tianjin and Hebei, indicating the ubiquitous effect of AOC on the PSOA over BTH. The SOA decrease from the ASOA in Beijing is more than that in Tianjin and Hebei, which is likely due to higher and concentrated anthropogenic VOCs emissions in Beijing. By contrast, the SOA decreases from the BSOA are all rather small, and compared with Beijing and Hebei, the SOA decrease from BSOA in Tianjin is even less. In the northwestern part of BTH, the widely distributed forests emit abundant VOCs, whereas the biogenic VOC emissions in Tianjin are much lower, owing to a less vegetation cover. In the SEN3 experiment, the SOA decreases in the PSOA, ASOA, and BSOA are 28 %, 8 %, and 1 % in Beijing, respectively, and slightly less than those in Tianjin and Hebei.
Observations have revealed substantial increase in O3 concentrations (about 30 %) over BTH and in the ratio of OC to EC in Beijing during the autumn from 2013 to 2015, indicating enhanced AOC and SOA formation. We simulate a 6 d haze episode in BTH from 3 to 8 October 2015, using the WRF-Chem model as a case study to explore the influence of the increasing AOC on the SOA formation in BTH.
Generally, the model performs reasonably well in predicting the temporal variations in the temperature, relative humidity, wind speed, and direction at four meteorological stations in BTH. The spatial distributions of PM2.5 and O3 concentrations over BTH and the temporal variations in PM2.5, O3, NO2, and carbonaceous aerosols including POA, SOA, and EC in Beijing are also reproduced well against measurements.
Four sensitivity experiments with different reductions in the AOC show that changing AOC substantially affects the SOA formation. In the SEN4 scenario, characterized by a 30.9 % (35.7 %) decrease in O3 (OH) concentration, the SOA concentration is reduced by 31.3 %, and the SOA mass fraction in TOA is reduced from 0.52 to 0.43. Spatially, the SOA reduction is ubiquitous over BTH, but the spatial relationship between the SOA concentration and AOC is dependent on the SOA precursor distribution. Among the four pathways of the SOA formation in the nontraditional SOA module, the largest SOA reduction in the reduced AOC environment occurs in the PSOA, followed by the ASOA and BSOA. By contrast, the SOA reduction in the HSOA is negligible.
Although the model reasonably reproduces the observed meteorological fields and chemical species in BTH, model discrepancies still exist, especially for the PM2.5 simulation in Shandong. More studies need to be performed to improve the model simulation and evaluate the impact of AOC change on SOA formation using more accurate meteorological fields and updated anthropogenic emissions.
The data used in this study are available from the corresponding author upon request (ligh@ieecas.cn).
GL, as the contact author, provided the ideas and financial support, verified the conclusions, and revised the paper. TF conducted research, designed the experiments, carried out the methodology, performed the simulation, processed the data, prepared the data visualization, and prepared the paper, with contributions from all authors. SZ and NB provided the treatment of meteorological data, analyzed the study data, validated the model performance, and reviewed the paper. SL, YQ, YW, and QY provided the observation data used in the study, synthesized the observation, and reviewed the paper. JW, XL, and LL analyzed the initial simulation data, visualized the model results, and reviewed the paper. WZ and JC provided critical reviews in the pre-publication stage.
The authors declare that they have no conflict of interest.
This article is part of the special issue “Multiphase chemistry of secondary aerosol formation under severe haze”. It is not associated with a conference.
We thank the support from the National Key R&D Plan and National Research Program for Key Issues in Air Pollution Control. Tian Feng is supported by the National Natural Science Foundation of China. We also thank the anonymous reviewers for their comments which were very helpful in improving the paper.
This research has been supported by the National Key R&D Plan (Quantitative Relationship and Regulation Principle between Regional Oxidation Capacity of Atmospheric and Air Quality; grant no. 2017YFC0210000), the National Research Program for Key Issues in Air Pollution Control (grant no. DQGG0105), and the National Natural Science Foundation of China (grant nos. 41703127, 41430424, and 41661144020).
This paper was edited by Maria Kanakidou and reviewed by two anonymous referees.
Bei, N., Lei, W., Zavala, M., and Molina, L. T.: Ozone predictabilities due to meteorological uncertainties in the Mexico City basin using ensemble forecasts, Atmos. Chem. Phys., 10, 6295–6309, https://doi.org/10.5194/acp-10-6295-2010, 2010.
Bei, N., Li, G., and Molina, L. T.: Uncertainties in SOA simulations due to meteorological uncertainties in Mexico City during MILAGRO-2006 field campaign, Atmos. Chem. Phys., 12, 11295–11308, https://doi.org/10.5194/acp-12-11295-2012, 2012.
Bei, N., Wu, J., Elser, M., Feng, T., Cao, J., El-Haddad, I., Li, X., Huang, R., Li, Z., Long, X., Xing, L., Zhao, S., Tie, X., Prévôt, A. S. H., and Li, G.: Impacts of meteorological uncertainties on the haze formation in Beijing–Tianjin–Hebei (BTH) during wintertime: a case study, Atmos. Chem. Phys., 17, 14579–14591, https://doi.org/10.5194/acp-17-14579-2017, 2017.
Binkowski, F. S. and Roselle, S. J.: Models-3 Community Multiscale Air Quality (CMAQ) model aerosol component 1. Model description, J. Geophys. Res., 108, 4183, https://doi.org/10.1029/2001JD001409, 2003.
Brasseur, G. P., Orlando, J. J., and Tyndall, G. S.: Atmospheric Chemistry and Global Change, Oxford University Press, Cambridge, USA, 1999.
Cao, J., Wang, Q. Y., Chow, J. C., Watson, J. G., Tie, X. X., Shen, Z. X., Wang, P., and An, Z. S.: Impacts of aerosol compositions on visibility impairment in Xi'an, China, Atmos. Environ., 59, 559–566, https://doi.org/10.1016/j.atmosenv.2012.05.036, 2012a.
Cao, J., Xu, H., Xu, Q., Chen, B., and Kan, H.: Fine particulate matter constituents and cardiopulmonary mortality in a heavily polluted Chinese city, Environ. Health Persp., 120, 373–378, https://doi.org/10.1289/ehp.1103671, 2012b.
Chen, F. and Dudhia, J.: Coupling an advanced land surface-hydrology model with the Penn State-NCAR MM5 modeling system. Part II: Preliminary model validation, Mon. Weather Rev., 129, 569–585, https://doi.org/10.1175/1520-0493(2001)129<0569:caalsh>2.0.co;2, 2001.
Cheng, N., Li, Y., Zhang, D., Chen, T., Sun, F., Chen, C., and Meng, F.: Characteristics of Ground Ozone Concentration over Beijing from 2004 to 2015: Trends, Transport, and Effects of Reductions, Atmos. Chem. Phys. Discuss., https://doi.org/10.5194/acp-2016-508, 2016.
Chou, M.-D. and Suarez, M. J.: A solar radiation parameterization for atmospheric studies, edited by: Suarez, M. J., No. NASA/TM-1999-10460, NASA Technique Report, 1999.
Chou, M.-D., Suarez, M. J., Liang, X.-Z., and Yan, M. M. H.: A thermal infrared radiation parameterization for atmospheric studies, edited by: Suarez, M. J., No. NASA/TM-2001-104606, NASA Technique Report, 2001.
Donahue, N. M., Robinson, A. L., Stanier, C. O., and Pandis, S. N.: Coupled Partitioning, Dilution, and Chemical Aging of Semivolatile Organics, Environ. Sci. Technol., 40, 2635–2643, https://doi.org/10.1021/es052297c, 2006.
Feng, T., Li, G., Cao, J., Bei, N., Shen, Z., Zhou, W., Liu, S., Zhang, T., Wang, Y., Huang, R.-J., Tie, X., and Molina, L. T.: Simulations of organic aerosol concentrations during springtime in the Guanzhong Basin, China, Atmos. Chem. Phys., 16, 10045–10061, https://doi.org/10.5194/acp-16-10045-2016, 2016.
Fu, T.-M., Jacob, D. J., and Heald, C. L.: Aqueous-phase reactive uptake of dicarbonyls as a source of organic aerosol over eastern North America, Atmos. Environ., 43, 1814–1822, https://doi.org/10.1016/j.atmosenv.2008.12.029, 2009.
Ginoux, P., Chin, M., Tegen, I., Prospero, J. M., Holben, B., Dubovik, O., and Lin, S.-J.: Sources and distributions of dust aerosols simulated with the GOCART model, J. Geophys. Res., 106, 20255–20273, https://doi.org/10.1029/2000JD000053, 2001.
Grell, G. A., Peckham, S. E., Schmitz, R., McKeen, S. A., Frost, G., Skamarock, W. C., and Eder, B.: Fully coupled “online” chemistry within the WRF model, Atmos. Environ., 39, 6957–6975, https://doi.org/10.1016/j.atmosenv.2005.04.027, 2005.
Guenther, A., Karl, T., Harley, P., Wiedinmyer, C., Palmer, P. I., and Geron, C.: Estimates of global terrestrial isoprene emissions using MEGAN (Model of Emissions of Gases and Aerosols from Nature), Atmos. Chem. Phys., 6, 3181–3210, https://doi.org/10.5194/acp-6-3181-2006, 2006.
Han, X., Zhang, M., Gao, J., Wang, S., and Chai, F.: Modeling analysis of the seasonal characteristics of haze formation in Beijing, Atmos. Chem. Phys., 14, 10231–10248, https://doi.org/10.5194/acp-14-10231-2014, 2014.
He, K., Zhang, Q., Hong, C., Xie, T., Bai, Y., Du, J., Zhao, L., Cai, J., Lin, Y., and Zhou, R.: Can Beijing, Tianjin and Hebei Achieve Their PM2.5 Targets by 2017?, Clean Air Alliance of China, Beijing, 2017.
Hong, S. Y. and Lim, J.: The WRF single-moment 6-class microphysics scheme (WSM6), Asia-Pac. J. Atmos. Sci., 42, 129–151, 2006.
Horowitz, L. W., Walters, S., Mauzerall, D. L., Emmons, L. K., Rasch, P. J., Granier, C., Tie, X., Lamarque, J.-F., Schultz, M. G., Tyndall, G. S., Orlando, J. J., and Brasseur, G. P.: A global simulation of tropospheric ozone and related tracers: Description and evaluation of MOZART, version 2, J. Geophys. Res., 108, 4784, https://doi.org/10.1029/2002jd002853, 2003.
Huang, R.-J., Zhang, Y., Bozzetti, C., Ho, K. F., Cao, J., Han, Y., Daellenbach, K. R., Slowik, J. G., Platt, S. M., Canonaco, F., Zotter, P., Wolf, R., Pieber, S. M., Bruns, E. A., Crippa, M., Ciarelli, G., Piazzalunga, A., Schwikowski, M., Abbaszade, G., Schnelle-Kreis, J., Zimmermann, R., An, Z., Szidat, S., Baltensperger, U., Haddad, El, I., and Prévôt, A. S. H.: High secondary aerosol contribution to particulate pollution during haze events in China, Nature, 514, 218–222, https://doi.org/10.1038/nature13774, 2014.
Huang, X., Liu, Z., Liu, J., Hu, B., Wen, T., Tang, G., Zhang, J., Wu, F., Ji, D., Wang, L., and Wang, Y.: Chemical characterization and source identification of PM2.5 at multiple sites in the Beijing–Tianjin–Hebei region, China, Atmos. Chem. Phys., 17, 12941–12962, https://doi.org/10.5194/acp-17-12941-2017, 2017.
Janjić, Z. I.: Nonsingular implementation of the Mellor–Yamada level 2.5 scheme in the NCEP Meso model, 2002.
Jia, M., Zhao, T., Cheng, X., Gong, S., Zhang, X., Tang, L., Liu, D., Wu, X., Wang, L., and Chen, Y.: Inverse Relations of PM2.5 and O3 in Air Compound Pollution between Cold and Hot Seasons over an Urban Area of East China, Atmosphere-Basel, 8, 59–12, https://doi.org/10.3390/atmos8030059, 2017.
Jiang, C., Wang, H., Zhao, T., Li, T., and Che, H.: Modeling study of PM2.5 pollutant transport across cities in China's Jing–Jin–Ji region during a severe haze episode in December 2013, Atmos. Chem. Phys., 15, 5803–5814, https://doi.org/10.5194/acp-15-5803-2015, 2015.
Kanakidou, M., Seinfeld, J. H., Pandis, S. N., Barnes, I., Dentener, F. J., Facchini, M. C., Van Dingenen, R., Ervens, B., Nenes, A., Nielsen, C. J., Swietlicki, E., Putaud, J. P., Balkanski, Y., Fuzzi, S., Horth, J., Moortgat, G. K., Winterhalter, R., Myhre, C. E. L., Tsigaridis, K., Vignati, E., Stephanou, E. G., and Wilson, J.: Organic aerosol and global climate modelling: a review, Atmos. Chem. Phys., 5, 1053–1123, https://doi.org/10.5194/acp-5-1053-2005, 2005.
Li, G., Zhang, R., Fan, J., and Tie, X.: Impacts of black carbon aerosol on photolysis and ozone, J. Geophys. Res., 110, D23206, https://doi.org/10.1029/2005JD005898, 2005.
Li, G., Wang, Y., and Zhang, R.: Implementation of a two-moment bulk microphysics scheme to the WRF model to investigate aerosol-cloud interaction, J. Geophys. Res., 113, D15211, https://doi.org/10.1029/2007JD009361, 2008.
Li, G., Wang, Y., Lee, K.-H., Diao, Y., and Zhang, R.: Impacts of aerosols on the development and precipitation of a mesoscale squall line, J. Geophys. Res., 114, D17205, https://doi.org/10.1029/2008JD011581, 2009.
Li, G., Lei, W., Zavala, M., Volkamer, R., Dusanter, S., Stevens, P., and Molina, L. T.: Impacts of HONO sources on the photochemistry in Mexico City during the MCMA-2006/MILAGO Campaign, Atmos. Chem. Phys., 10, 6551–6567, https://doi.org/10.5194/acp-10-6551-2010, 2010.
Li, G., Bei, N., Tie, X., and Molina, L. T.: Aerosol effects on the photochemistry in Mexico City during MCMA-2006/MILAGRO campaign, Atmos. Chem. Phys., 11, 5169–5182, https://doi.org/10.5194/acp-11-5169-2011, 2011a.
Li, G., Zavala, M., Lei, W., Tsimpidi, A. P., Karydis, V. A., Pandis, S. N., Canagaratna, M. R., and Molina, L. T.: Simulations of organic aerosol concentrations in Mexico City using the WRF-CHEM model during the MCMA-2006/MILAGRO campaign, Atmos. Chem. Phys., 11, 3789-3809, https://doi.org/10.5194/acp-11-3789-2011, 2011b.
Li, G., Lei, W., Bei, N., and Molina, L. T.: Contribution of garbage burning to chloride and PM2.5 in Mexico City, Atmos. Chem. Phys., 12, 8751–8761, https://doi.org/10.5194/acp-12-8751-2012, 2012.
Li, G., Bei, N., Cao, J., Huang, R., Wu, J., Feng, T., Wang, Y., Liu, S., Zhang, Q., Tie, X., and Molina, L. T.: A possible pathway for rapid growth of sulfate during haze days in China, Atmos. Chem. Phys., 17, 3301–3316, https://doi.org/10.5194/acp-17-3301-2017, 2017a.
Li, G., Bei, N., Cao, J., Wu, J., Long, X., Feng, T., Dai, W., Liu, S., Zhang, Q., and Tie, X.: Widespread and persistent ozone pollution in eastern China during the non-winter season of 2015: observations and source attributions, Atmos. Chem. Phys., 17, 2759–2774, https://doi.org/10.5194/acp-17-2759-2017, 2017b.
Li, K., Jacob, D. J., Liao, H., Shen, L., Zhang, Q., and Bates, K. H.: Anthropogenic drivers of 2013–2017 trends in summer surface ozone in China, P. Natl. Acad. Sci. USA, 17, 201812168-6, https://doi.org/10.1073/pnas.1812168116, 2018.
Li, M., Zhang, Q., Kurokawa, J.-I., Woo, J.-H., He, K., Lu, Z., Ohara, T., Song, Y., Streets, D. G., Carmichael, G. R., Cheng, Y., Hong, C., Huo, H., Jiang, X., Kang, S., Liu, F., Su, H., and Zheng, B.: MIX: a mosaic Asian anthropogenic emission inventory under the international collaboration framework of the MICS-Asia and HTAP, Atmos. Chem. Phys., 17, 935–963, https://doi.org/10.5194/acp-17-935-2017, 2017.
Lipsky, E. M. and Robinson, A. L.: Effects of Dilution on Fine Particle Mass and Partitioning of Semivolatile Organics in Diesel Exhaust and Wood Smoke, Environ. Sci. Technol., 40, 155–162, https://doi.org/10.1021/es050319p, 2006.
Liu, W., Shen, G., Chen, Y., Shen, H., Huang, Y., Li, T., Wang, Y., Fu, X., Tao, S., Liu, W., Huang-Fu, Y., Zhang, W., Xue, C., Liu, G., Wu, F., and Wong, M.: Air pollution and inhalation exposure to particulate matter of different sizes in rural households using improved stoves in central China, J. Environ. Sci., 63, 87–95, https://doi.org/10.1016/j.jes.2017.06.019, 2018.
Ma, Z., Xu, J., Quan, W., Zhang, Z., Lin, W., and Xu, X.: Significant increase of surface ozone at a rural site, north of eastern China, Atmos. Chem. Phys., 16, 3969–3977, https://doi.org/10.5194/acp-16-3969-2016, 2016.
Nenes, A., Pandis, S. N., and Pilinis, C.: ISORROPIA: A New Thermodynamic Equilibrium Model for Multiphase Multicomponent Inorganic Aerosols, Aquat. Geochem., 4, 123–152, https://doi.org/10.1023/A:1009604003981, 1998.
Odum, J. R., Hoffmann, T., and Bowman, F.: Gas/particle partitioning and secondary organic aerosol yields, Environ. Sci. Technol., 30, 2580–2585, https://doi.org/10.1021/es950943, 1996.
Pankow, J. F.: An absorption model of gas/particle partitioning of organic compounds in the atmosphere, Atmos. Environ., 28, 185–188, https://doi.org/10.1016/1352-2310(94)90093-0, 1994.
Quan, J., Tie, X., Zhang, Q., Liu, Q., Li, X., Gao, Y., and Zhao, D.: Characteristics of heavy aerosol pollution during the 2012–2013 winter in Beijing, China, Atmos. Environ., 88, 83–89, https://doi.org/10.1016/j.atmosenv.2014.01.058, 2014.
Robinson, A. L., Donahue, N. M., Shrivastava, M. K., Weitkamp, E. A., Sage, A. M., Grieshop, A. P., Lane, T. E., Pierce, J. R., and Pandis, S. N.: Rethinking organic aerosols: semivolatile emissions and photochemical aging, Science, 315, 1259–1262, https://doi.org/10.1126/science.1133061, 2007.
Seinfeld, J. H. and Pandis, S. N.: Atmospheric Chemistry and Physics – From Air Pollution to Climate Change, 2nd Edn., John Wiley & Sons, New Jersey, 2006.
Shrivastava, M. K., Lipsky, E. M., Stanier, C. O., and Robinson, A. L.: Modeling Semivolatile Organic Aerosol Mass Emissions from Combustion Systems, Environ. Sci. Technol., 40, 2671–2677, https://doi.org/10.1021/es0522231, 2006.
Shrivastava, M. K., Lane, T. E., Donahue, N. M., Pandis, S. N., and Robinson, A. L.: Effects of gas particle partitioning and aging of primary emissions on urban and regional organic aerosol concentrations, J. Geophys. Res., 113, D18301, https://doi.org/10.1029/2007JD009735, 2008.
Sun, Y., Wang, Z., Dong, H., Yang, T., Li, J., Pan, X., Chen, P., and Jayne, J. T.: Characterization of summer organic and inorganic aerosols in Beijing, China with an Aerosol Chemical Speciation Monitor, Atmos. Environ., 51, 250–259, https://doi.org/10.1016/j.atmosenv.2012.01.013, 2012.
Sun, Y. L., Wang, Z. F., Fu, P. Q., Yang, T., Jiang, Q., Dong, H. B., Li, J., and Jia, J. J.: Aerosol composition, sources and processes during wintertime in Beijing, China, Atmos. Chem. Phys., 13, 4577–4592, https://doi.org/10.5194/acp-13-4577-2013, 2013.
Tie, X., Madronich, S., Walters, S., Zhang, R., Rasch, P., and Collins, W.: Effect of clouds on photolysis and oxidants in the troposphere, J. Geophys. Res., 108, 4642, https://doi.org/10.1029/2003JD003659, 2003.
Tie, X., Huang, R.-J., Dai, W., Cao, J., Long, X., Su, X., Zhao, S., Wang, Q., and Li, G.: Effect of heavy haze and aerosol pollution on rice and wheat productions in China, Sci. Rep.-UK, 6, 29612, https://doi.org/10.1038/srep29612, 2016.
Tsimpidi, A. P., Karydis, V. A., Zavala, M., Lei, W., Molina, L., Ulbrich, I. M., Jimenez, J. L., and Pandis, S. N.: Evaluation of the volatility basis-set approach for the simulation of organic aerosol formation in the Mexico City metropolitan area, Atmos. Chem. Phys., 10, 525–546, https://doi.org/10.5194/acp-10-525-2010, 2010.
Volkamer, R., San Martini, F., Molina, L. T., Salcedo, D., Jimenez, J. L., and Molina, M. J.: A missing sink for gas-phase glyoxal in Mexico City: Formation of secondary organic aerosol, Geophys. Res. Lett., 34, L19807, https://doi.org/10.1029/2007GL030752, 2007.
Wang, G., Zhang, R., Gomez, M. E., Yang, L., Levy Zamora, M., Hu, M., Lin, Y., Peng, J., Guo, S., Meng, J., Li, J., Cheng, C., Hu, T., Ren, Y., Wang, Y., Gao, J., Cao, J., An, Z., Zhou, W., Li, G., Wang, J., Tian, P., Marrero-Ortiz, W., Secrest, J., Du, Z., Zheng, J., Shang, D., Zeng, L., Shao, M., Wang, W., Huang, Y., Wang, Y., Zhu, Y., Li, Y., Hu, J., Pan, B., Cai, L., Cheng, Y., Ji, Y., Zhang, F., Rosenfeld, D., Liss, P. S., Duce, R. A., Kolb, C. E., and Molina, M. J.: Persistent sulfate formation from London Fog to Chinese haze, P. Natl. Acad. Sci. USA, 113, 13630–13635, https://doi.org/10.1073/pnas.1616540113, 2016.
Wang, Y., Khalizov, A., Levy, M., and Zhang, R.: New Directions: Light absorbing aerosols and their atmospheric impacts, Atmos. Environ., 81, 713–715, https://doi.org/10.1016/j.atmosenv.2013.09.034, 2013.
Wang, Y., Ma, P.-L., Jiang, J. H., Su, H., and Rasch, P. J.: Toward reconciling the influence of atmospheric aerosols and greenhouse gases on light precipitation changes in Eastern China, J. Geophys. Res., 121, 5878–5887, https://doi.org/10.1002/2016JD024845, 2016.
Wang, Y., Ma, P.-L., Peng, J., Zhang, R., Jiang, J. H., Easter, R. C., and Yung, Y. L.: Constraining Aging Processes of Black Carbon in the Community Atmosphere Model Using Environmental Chamber Measurements, J. Adv. Model. Earth Sy., 10, 2514–2526, https://doi.org/10.1029/2018MS001387, 2018.
Wei, S., Shen, G., Zhang, Y., Xue, M., Xie, H., Lin, P., Chen, Y., Wang, X., and Tao, S.: Field measurement on the emissions of PM, OC, EC and PAHs from indoor crop straw burning in rural China, Environ. Pollut., 184, 18–24, https://doi.org/10.1016/j.envpol.2013.07.036, 2014.
Wesely, M. L.: Parameterization of surface resistances to gaseous dry deposition in regional-scale numerical models, Atmos. Environ., 23, 1293–1304, https://doi.org/10.1016/0004-6981(89)90153-4, 1989.
Wiedinmyer, C., Quayle, B., Geron, C., Belote, A., McKenzie, D., Zhang, X., O'Neill, S., and Wynne, K. K.: Estimating emissions from fires in North America for air quality modeling, Atmos. Environ., 40, 3419–3432, https://doi.org/10.1016/j.atmosenv.2006.02.010, 2006.
Wiedinmyer, C., Akagi, S. K., Yokelson, R. J., Emmons, L. K., Al-Saadi, J. A., Orlando, J. J., and Soja, A. J.: The Fire INventory from NCAR (FINN): a high resolution global model to estimate the emissions from open burning, Geosci. Model Dev., 4, 625–641, https://doi.org/10.5194/gmd-4-625-2011, 2011.
Wu, J., Li, G., Cao, J., Bei, N., Wang, Y., Feng, T., Huang, R., Liu, S., Zhang, Q., and Tie, X.: Contributions of trans-boundary transport to summertime air quality in Beijing, China, Atmos. Chem. Phys., 17, 2035–2051, https://doi.org/10.5194/acp-17-2035-2017, 2017.
Xing, L., Wu, J., Elser, M., Tong, S., Liu, S., Li, X., Liu, L., Cao, J., Zhou, J., El-Haddad, I., Huang, R., Ge, M., Tie, X., Prévôt, A. S. H., and Li, G.: Wintertime secondary organic aerosol formation in Beijing–Tianjin–Hebei (BTH): contributions of HONO sources and heterogeneous reactions, Atmos. Chem. Phys., 19, 2343–2359, https://doi.org/10.5194/acp-19-2343-2019, 2019.
Zhang, Q., Jimenez, J. L., Canagaratna, M. R., Allan, J. D., Coe, H., Ulbrich, I., Alfarra, M. R., Takami, A., Middlebrook, A. M., Sun, Y. L., Dzepina, K., Dunlea, E., Docherty, K., DeCarlo, P. F., Salcedo, D., Onasch, T., Jayne, J. T., Miyoshi, T., Shimono, A., Hatakeyama, S., Takegawa, N., Kondo, Y., Schneider, J., Drewnick, F., Borrmann, S., Weimer, S., Demerjian, K., Williams, P., Bower, K., Bahreini, R., Cottrell, L., Griffin, R. J., Rautiainen, J., Sun, J. Y., Zhang, Y. M., and Worsnop, D. R.: Ubiquity and dominance of oxygenated species in organic aerosols in anthropogenically-influenced Northern Hemisphere midlatitudes, Geophys. Res. Lett., 34, L13801, https://doi.org/10.1029/2007GL029979, 2007.
Zhang, Q., Streets, D. G., Carmichael, G. R., He, K. B., Huo, H., Kannari, A., Klimont, Z., Park, I. S., Reddy, S., Fu, J. S., Chen, D., Duan, L., Lei, Y., Wang, L. T., and Yao, Z. L.: Asian emissions in 2006 for the NASA INTEX-B mission, Atmos. Chem. Phys., 9, 5131–5153, https://doi.org/10.5194/acp-9-5131-2009, 2009.
Zhao, J., Levitt, N. P., Zhang, R., and Chen, J.: Heterogeneous Reactions of Methylglyoxal in Acidic Media: Implications for Secondary Organic Aerosol Formation, Environ. Sci. Technol., 40, 7682–7687, https://doi.org/10.1021/es060610k, 2006.
Zhou, X., Bei, N., Liu, H., Cao, J., Xing, L., Lei, W., Molina, L. T., and Li, G.: Aerosol effects on the development of cumulus clouds over the Tibetan Plateau, Atmos. Chem. Phys., 17, 7423–7434, https://doi.org/10.5194/acp-17-7423-2017, 2017.