the Creative Commons Attribution 4.0 License.
the Creative Commons Attribution 4.0 License.
 | 21 May 2019
Contrasting physical properties of black carbon in urban Beijing between winter and summer
Rutambhara Joshi
Junfeng Wang
Chenjie Yu
James D. Allan
Michael J. Flynn
Conghui Xie
James Lee
Freya Squires
Simone Kotthaus
Sue Grimmond
Xinlei Ge
Pingqing Fu
Black carbon (BC) is known to have major impacts on both human health and climate. The populated megacity represents the most complex anthropogenic BC emissions where the sources and related impacts are very uncertain. This study provides source attribution and characterization of BC in the Beijing urban environment during the joint UK–China APHH (Air Pollution and Human Health) project, in both winter (November–December 2016) and summer (May–June 2017). The size-resolved mixing state of BC-containing particles was characterized by a single-particle soot photometer (SP2) and their mass spectra was measured by a soot particle aerosol mass spectrometer (SP-AMS). The refractory BC (rBC) mass loading was around a factor of 2 higher in winter relative to summer, and more variable coatings were present, likely as a result of additional surface emissions from the residential sector and favourable condensation in the cold season. The characteristics of the BC were relatively independent of air mass direction in summer, whereas in winter air masses from the Northern Plateau were considerably cleaner and contained less-coated and smaller BC, but the BC from the Southern Plateau had the largest core size and coatings.
We compare two online source apportionment methods using simultaneous measurements made by the SP2, which measures physical properties of BC, and the chemical approach using the positive matrix factorization (PMF) of mass spectra from the SP-AMS for the first time. A method is proposed to isolate the BC from the transportation sector using a mode of small BC particles (core diameter Dc<0.18 µm and coating thickness ct < 50 nm). This mode of BC highly correlated with NOx concentration in both seasons (∼14 ng m−3 BC ppb−1 NOx) and corresponded with the morning traffic rush hour, contributing about 30 % and 40 % of the total rBC mass (35 % and 55 % in number) in winter and summer respectively. The BC from coal burning or biomass burning was characterized by moderate coatings (ct = 50–200 nm) contributing ∼20 %–25 % of rBC mass. Large uncoated BC particles (Dc>0.18 µm and ct < 50 nm) were more likely to be contributed by coal combustion, as these particles were not present in urban London. This mode was present in Beijing in both winter (∼30 %–40 % rBC mass) and summer (∼40 % rBC mass) but may be dominated by the residential and industrial sector respectively. The contribution of BC thickly coated with secondary species (ct > 200 nm) to the total rBC mass increased with pollution level in winter but was minor in summer. These large BC particles importantly enhanced the absorption efficiency at high pollution levels – in winter when PM1 > 100 µg m−3 or BC > 2 µg m−3, the absorption efficiency of BC increased by 25 %–70 %. The reduction of emissions of these large BC particles and the precursors of the associated secondary coating will be an effective way of mitigating the heating effect of BC in urban environments.
- Article
(8351 KB) - Full-text XML
-
Supplement
(1016 KB) - BibTeX
- EndNote


Black carbon aerosol (BC) has a significant impact on both climate (Bond et al., 2013) and human health (Baumgartner et al., 2014). Its regional impact in the atmosphere may be very large, especially close to polluted hotspots such as in South and East Asia, where anthropogenic emissions are high and population exposure is severe (Ramanathan and Carmichael, 2008). It has been estimated that BC over China could contribute up to 14 % of the global radiative forcing budget (Li et al., 2016). Reducing BC has been postulated as a win-win policy intervention because of the shorter atmospheric lifetime of BC compared to the greenhouse gases, delivering immediate mitigation while at the same time improving air quality (Kopp and Mauzerall, 2010).
Beijing, as one of the most populated megacities in the world, has experienced severe air pollution (Yang et al., 2005; Xu et al., 1994). The complexity of emissions from multiple sectors that are often co-located (Li et al., 2017) make it extremely challenging to attribute source contributions to the BC load, hindering policy making on emission regulations. The source apportionment of BC in urban environments has been studied using both online and offline measurements and using site receptor models (Cao et al., 2005; Viana et al., 2008, and references therein). Most of the techniques separate the fossil fuel BC, such as separate traffic sources from the solid fuel burning fraction such as that from wood burning (Sandradewi et al., 2008; Healy et al., 2012) or open biomass burning (Schwarz et al., 2008). These techniques include using biomass burning tracers in aerosol (Puxbaum et al., 2007) or using individual organic tracer compounds to attribute the sources and provide time series representing the different sources. These are then used to segregate the different BC emission contributions by multilinear regression (Liu et al., 2011; Laborde et al., 2013). An approach using Aethalometer measurements has been widely used based on the spectral dependence of absorption (Sandradewi et al., 2008). This technique needs to assume a prescribed absorption spectrum from traffic or wood burning sources which may be subject to variation under different burning conditions (Zotter et al., 2017). Isotope analysis of elemental carbon, in conjunction with thermal separation, allows identification of modern carbon (e.g. from biomass) from fossil fuel (from diesel or coal) based on the 14C abundance (Bernardoni et al., 2013; Zhang et al., 2012). This method has been considered to be relatively unambiguous in isolating wood burning sources from traffic sources and has been used to validate the other methods in attributing elemental carbon (Liu et al., 2013; Zotter et al., 2017).
These techniques mostly use distinct features in the chemistry or physical properties to isolate one BC source from the other, and to do so requires that there are unique characteristics that are separable. The BC sources in Beijing are combinations of residential, industrial and transport sectors (Li et al., 2017), and the fuel use could be rather more complex than two distinct sources on which most techniques are based. For example, both coal burning and diesel fuel could emit fossil fuel BC, which may not be isolated through isotope analysis, and also the absorption spectrum of BC from different sources may vary considerably, and to assume a single pattern based on Aethalometer measurements may not be suitable to attribute multiple sources. The fast secondary processing of aerosols in Beijing (Sun et al., 2016b) may make the source attribution of primary BC even more challenging as the secondary coating formed on BC may alter its original source-dependent features. Given these difficulties it is unlikely that any single methodology will give unambiguous results, but a combination of different methods may improve the understanding on the source attribution because source-specific physiochemical properties of BC may be reflected in different ways by different methods.
It is also necessary to gain knowledge on the microphysical structure and mixing state of the soot, namely its size and what other materials are present on the individual particles, as these dictate its impact on the wider atmosphere. Other material present on a BC particle (a coating) may alter its optical properties (Liu et al., 2017), affecting the direct radiative effect on the local atmosphere, and it may also make it more susceptible to in-cloud scavenging, meaning that it can perturb the cloud properties or experience a shortened atmospheric lifetime through wet deposition (Hodnebrog et al., 2014). The source profile of the size-resolved mixing state of BC is desired for the evaluation of BC properties in process models (Riemer et al., 2009), especially for environments with combined sources (Fierce et al., 2016).
This study quantifies the source attribution of BC-containing particles in urban Beijing and delivers source-specific information on their properties by combining two techniques, both of which directly characterize BC-containing particles but are based on physical and chemical techniques respectively. The physical technique uses a single-particle soot photometer (DMT, SP2), which was previously used for source apportionment of BC in urban London (Liu et al., 2014). This approach is to examine the mixing state of BC particles as a function of their core size, and this has been used to attribute the BC from traffic diesel and wood burning source. The chemical approach uses the soot particle aerosol mass spectrometer (Aerodyne, SP-AMS) which has been previously used to identify the chemical compositions of coatings associated with BC (Onasch et al., 2012a), which may be used to determine primary sources or secondary processing of BC. The combination of both techniques in this study will give the detailed physiochemical properties of BC influenced by mixed sources. In particular, by combining the approaches the contribution of different emission sources to the optical properties of BC can be quantified and so an attribution of different sources to the BC heating in the atmospheric column can be made.
The experiments were conducted at the tower site of the Institute of Atmospheric Physics (IAP), Chinese Academy of Sciences (39∘58′28∘ N, 116∘22′16∘ E), in Beijing during both winter (November–December 2016) and summer (May–June 2017) periods, as part of the Air Pollution and Human Health-Beijing campaign. This site represents the typical urban Beijing environment with pollution influences from surrounding traffic, commercial activities, residential activities such as cooking and home heating, and regional transport (Sun et al., 2016a).
Figure 1a shows the terrain of the North China Plain (NCP) region to the north of Beijing, and Fig. 1b shows the surface emission inventory of BC for the year 2010 (Li et al., 2017). The high anthropogenic BC emission can be generally divided by the border along the Taihang and Yan (Yanshan) mountain ridges, beyond which the region from north-west Beijing has relatively lower emissions. Considerably higher emissions are also present across the Southern Plateau region. In order to investigate the regional influence of pollutants in Beijing, the regions over the NCP and the plateau are classified according to the terrain and BC surface emission, shown in Fig. 1c. The regions are firstly classified as the plateau and plain according to the terrain height below and above 800 m, and then for the region <800 m, 116.5∘ E (the longitude of central Beijing) is used to separate the Eastern and Western NCP (E and W are used as the abbreviations during the following discussion); the region >800 m is separated as the Northern and Southern Plateau (N and S are used as abbreviations for the following discussion) using the border along 41.5∘ N; the ocean is defined as the terrain height below zero. The Northern Plateau has significantly lower emission, meaning north-westerly air masses will bring clean air into Beijing and are likely to reduce pollution levels in the city, whereas westerlies may bring pollutants from the Southern Plateau and south-westerlies could transport the high emissions from central China to the NCP. The local area is defined in this work as the area within the square ±0.25∘ away from the measurement site. BC emission inventories from different sectors are shown in Fig. S1 in the Supplement. In winter the residential sector, which is mainly composed of residential coal burning, contributes the vast majority of BC emissions; whereas the emissions from the industrial (which also contains significant coal consumption) and transportation sectors are maintained throughout the year. This means the differences in BC emissions between winter and summer will mainly result from changes in the residential sector.
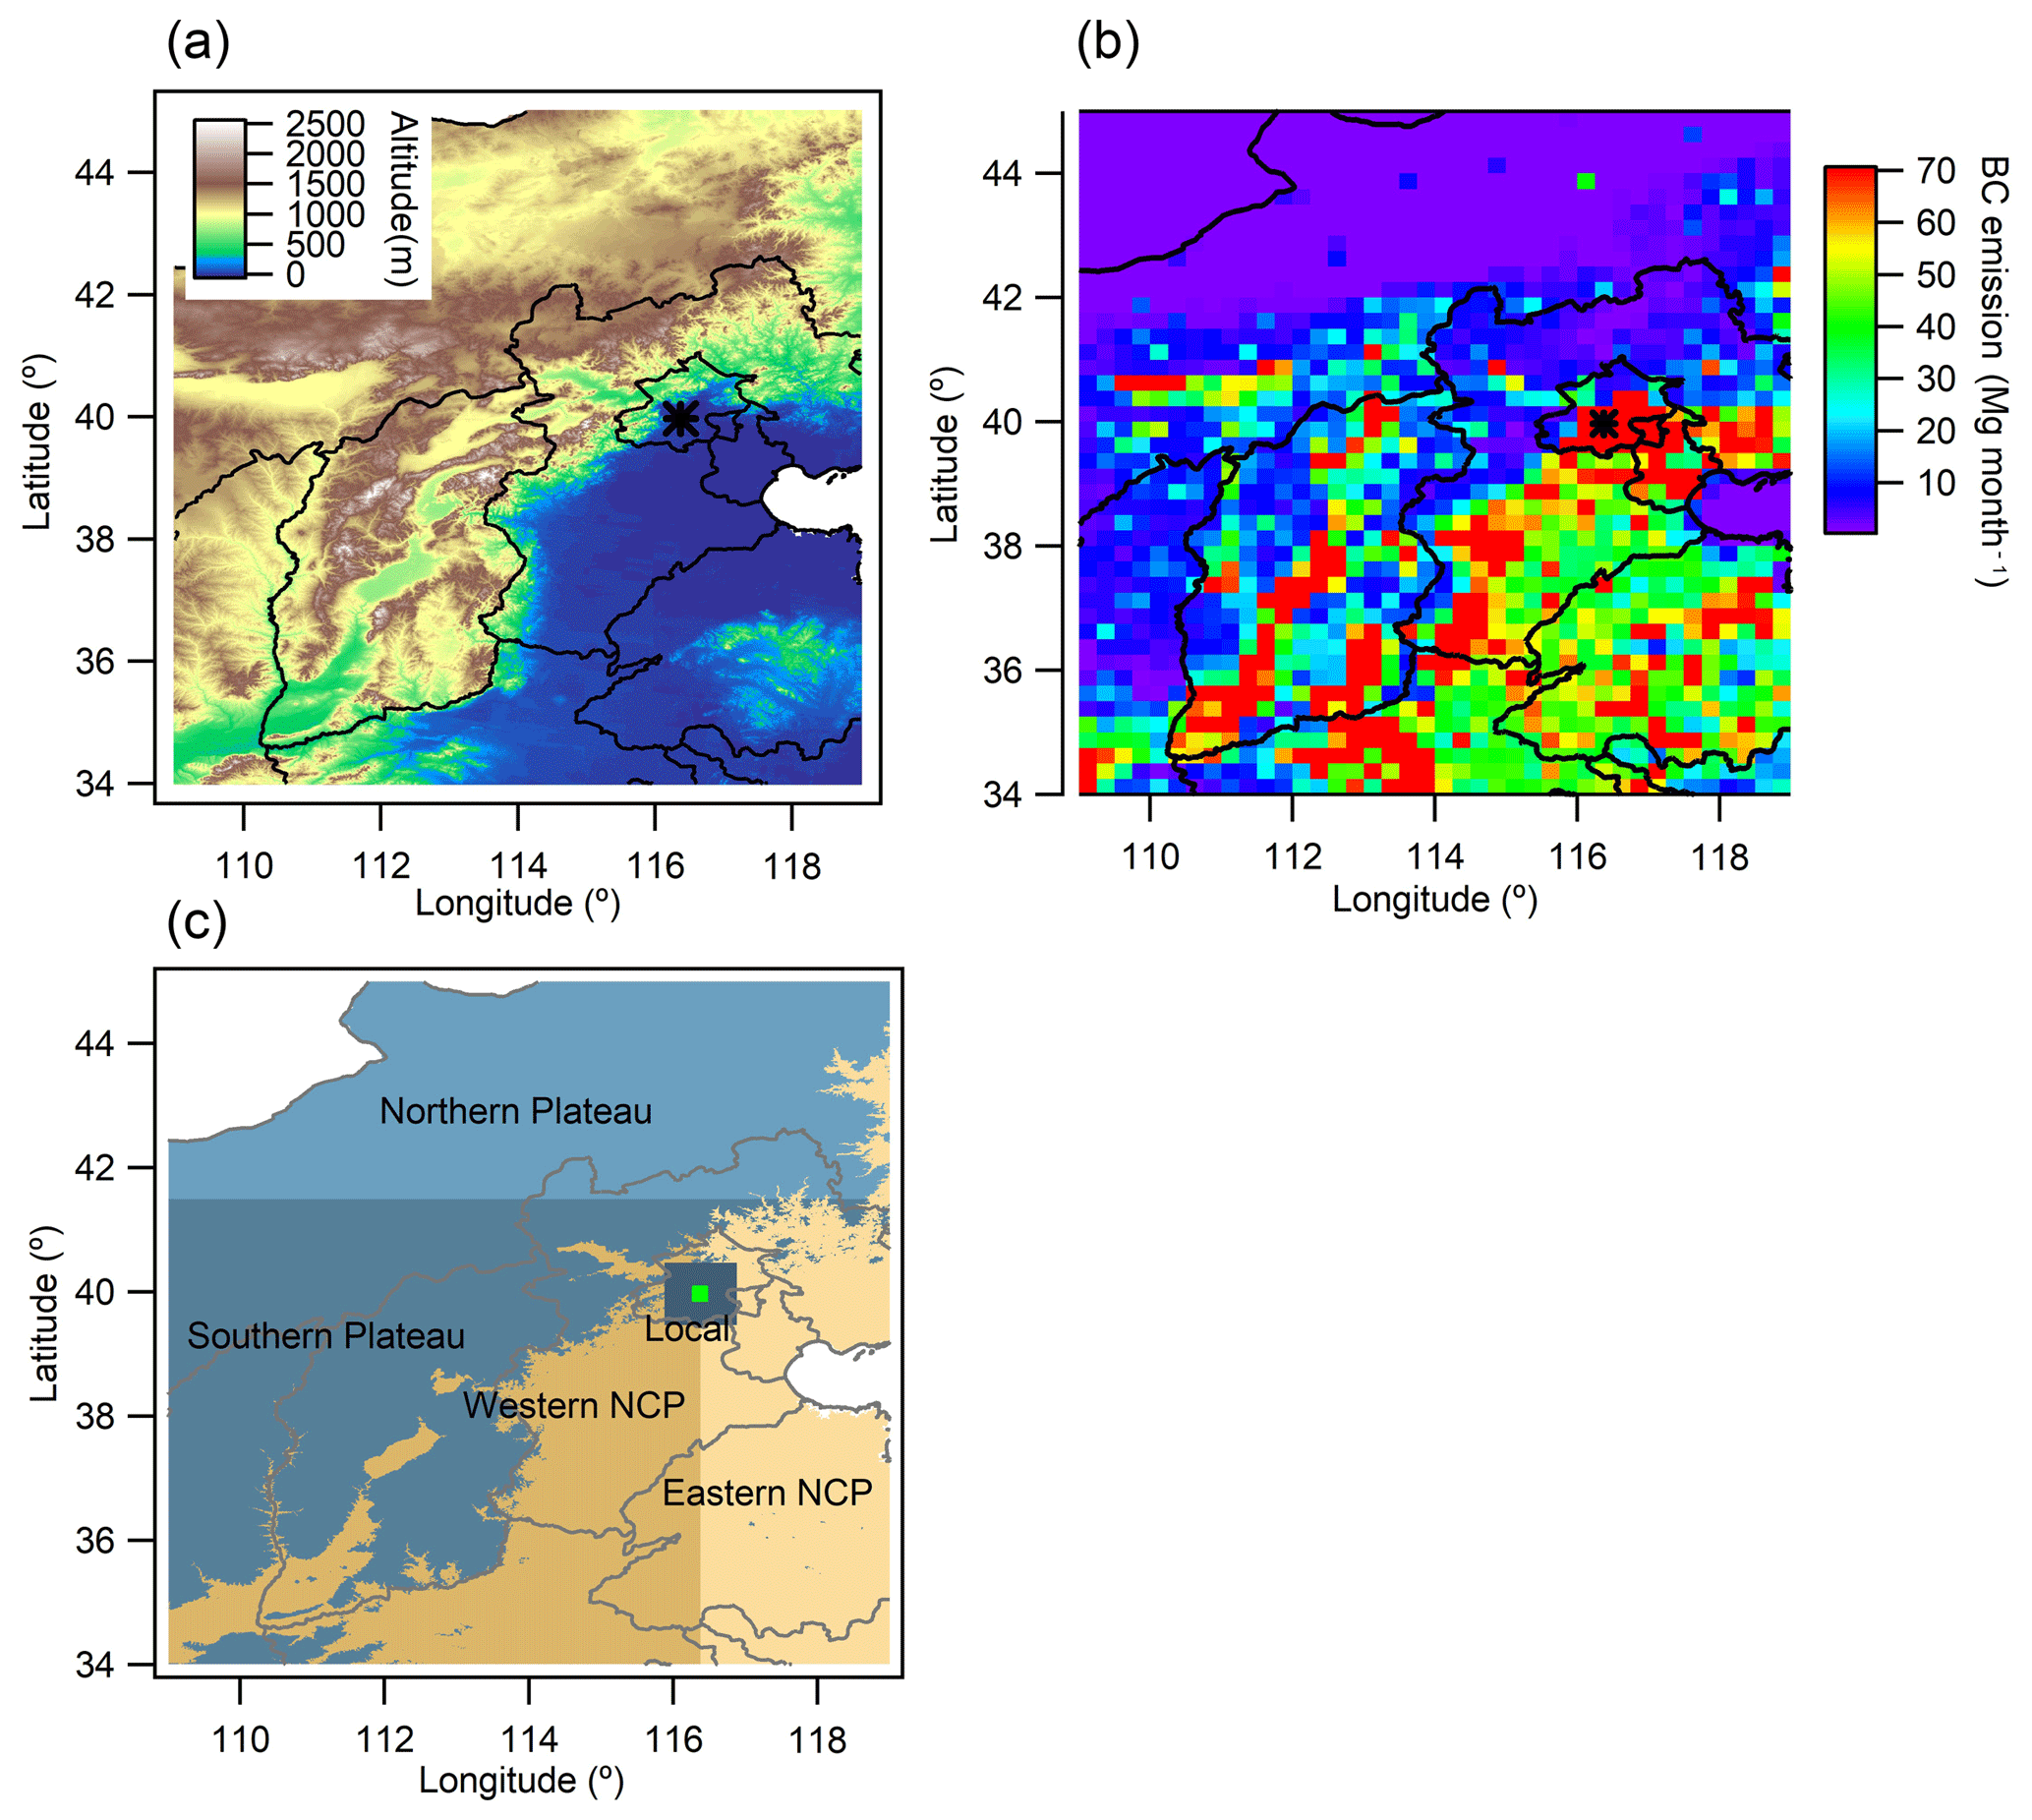
Figure 1(a) Terrain height for the North China Plain (NCP) and the plateau; (b) BC emissions from all sectors in 2010; (c) the regional classification according to terrain height and emission.
The HYSPLIT back-trajectory model (Draxler and Hess, 1998) was run using the 1∘ × 1∘ horizontal and vertical wind fields provided by the GDAS1 reanalysis meteorology. Given that the emissions are intensive around the immediate Beijing area, air mass back trajectories were only followed for the previous 24 h to examine the influence from the most recent air masses. The back trajectories are then mapped onto the classified regions (Fig. 1c) to investigate variations in the potential regional source influence. The back trajectories have a 1 h time resolution and each point along a single 24 h trajectory is assigned to one of the four regional classifications. All the points along a single trajectory are then used to determine the fraction of time during the previous day that the air mass spent above each of the classified regions as shown in the bottom panel of Fig. 3a and b. This method has been applied previously in the western Africa region to identify the potential source contributions (Liu et al., 2018). Note that the HYSPLIT analysis is not able to reproduce the dispersion of the air mass, but such effects are likely to be minimal since the trajectories are only investigated over the previous 24 h.

Figure 2Classified air mass origins based on back-trajectory analysis: Western NCP, Southern Plateau, Northern Plateau and Eastern NCP.
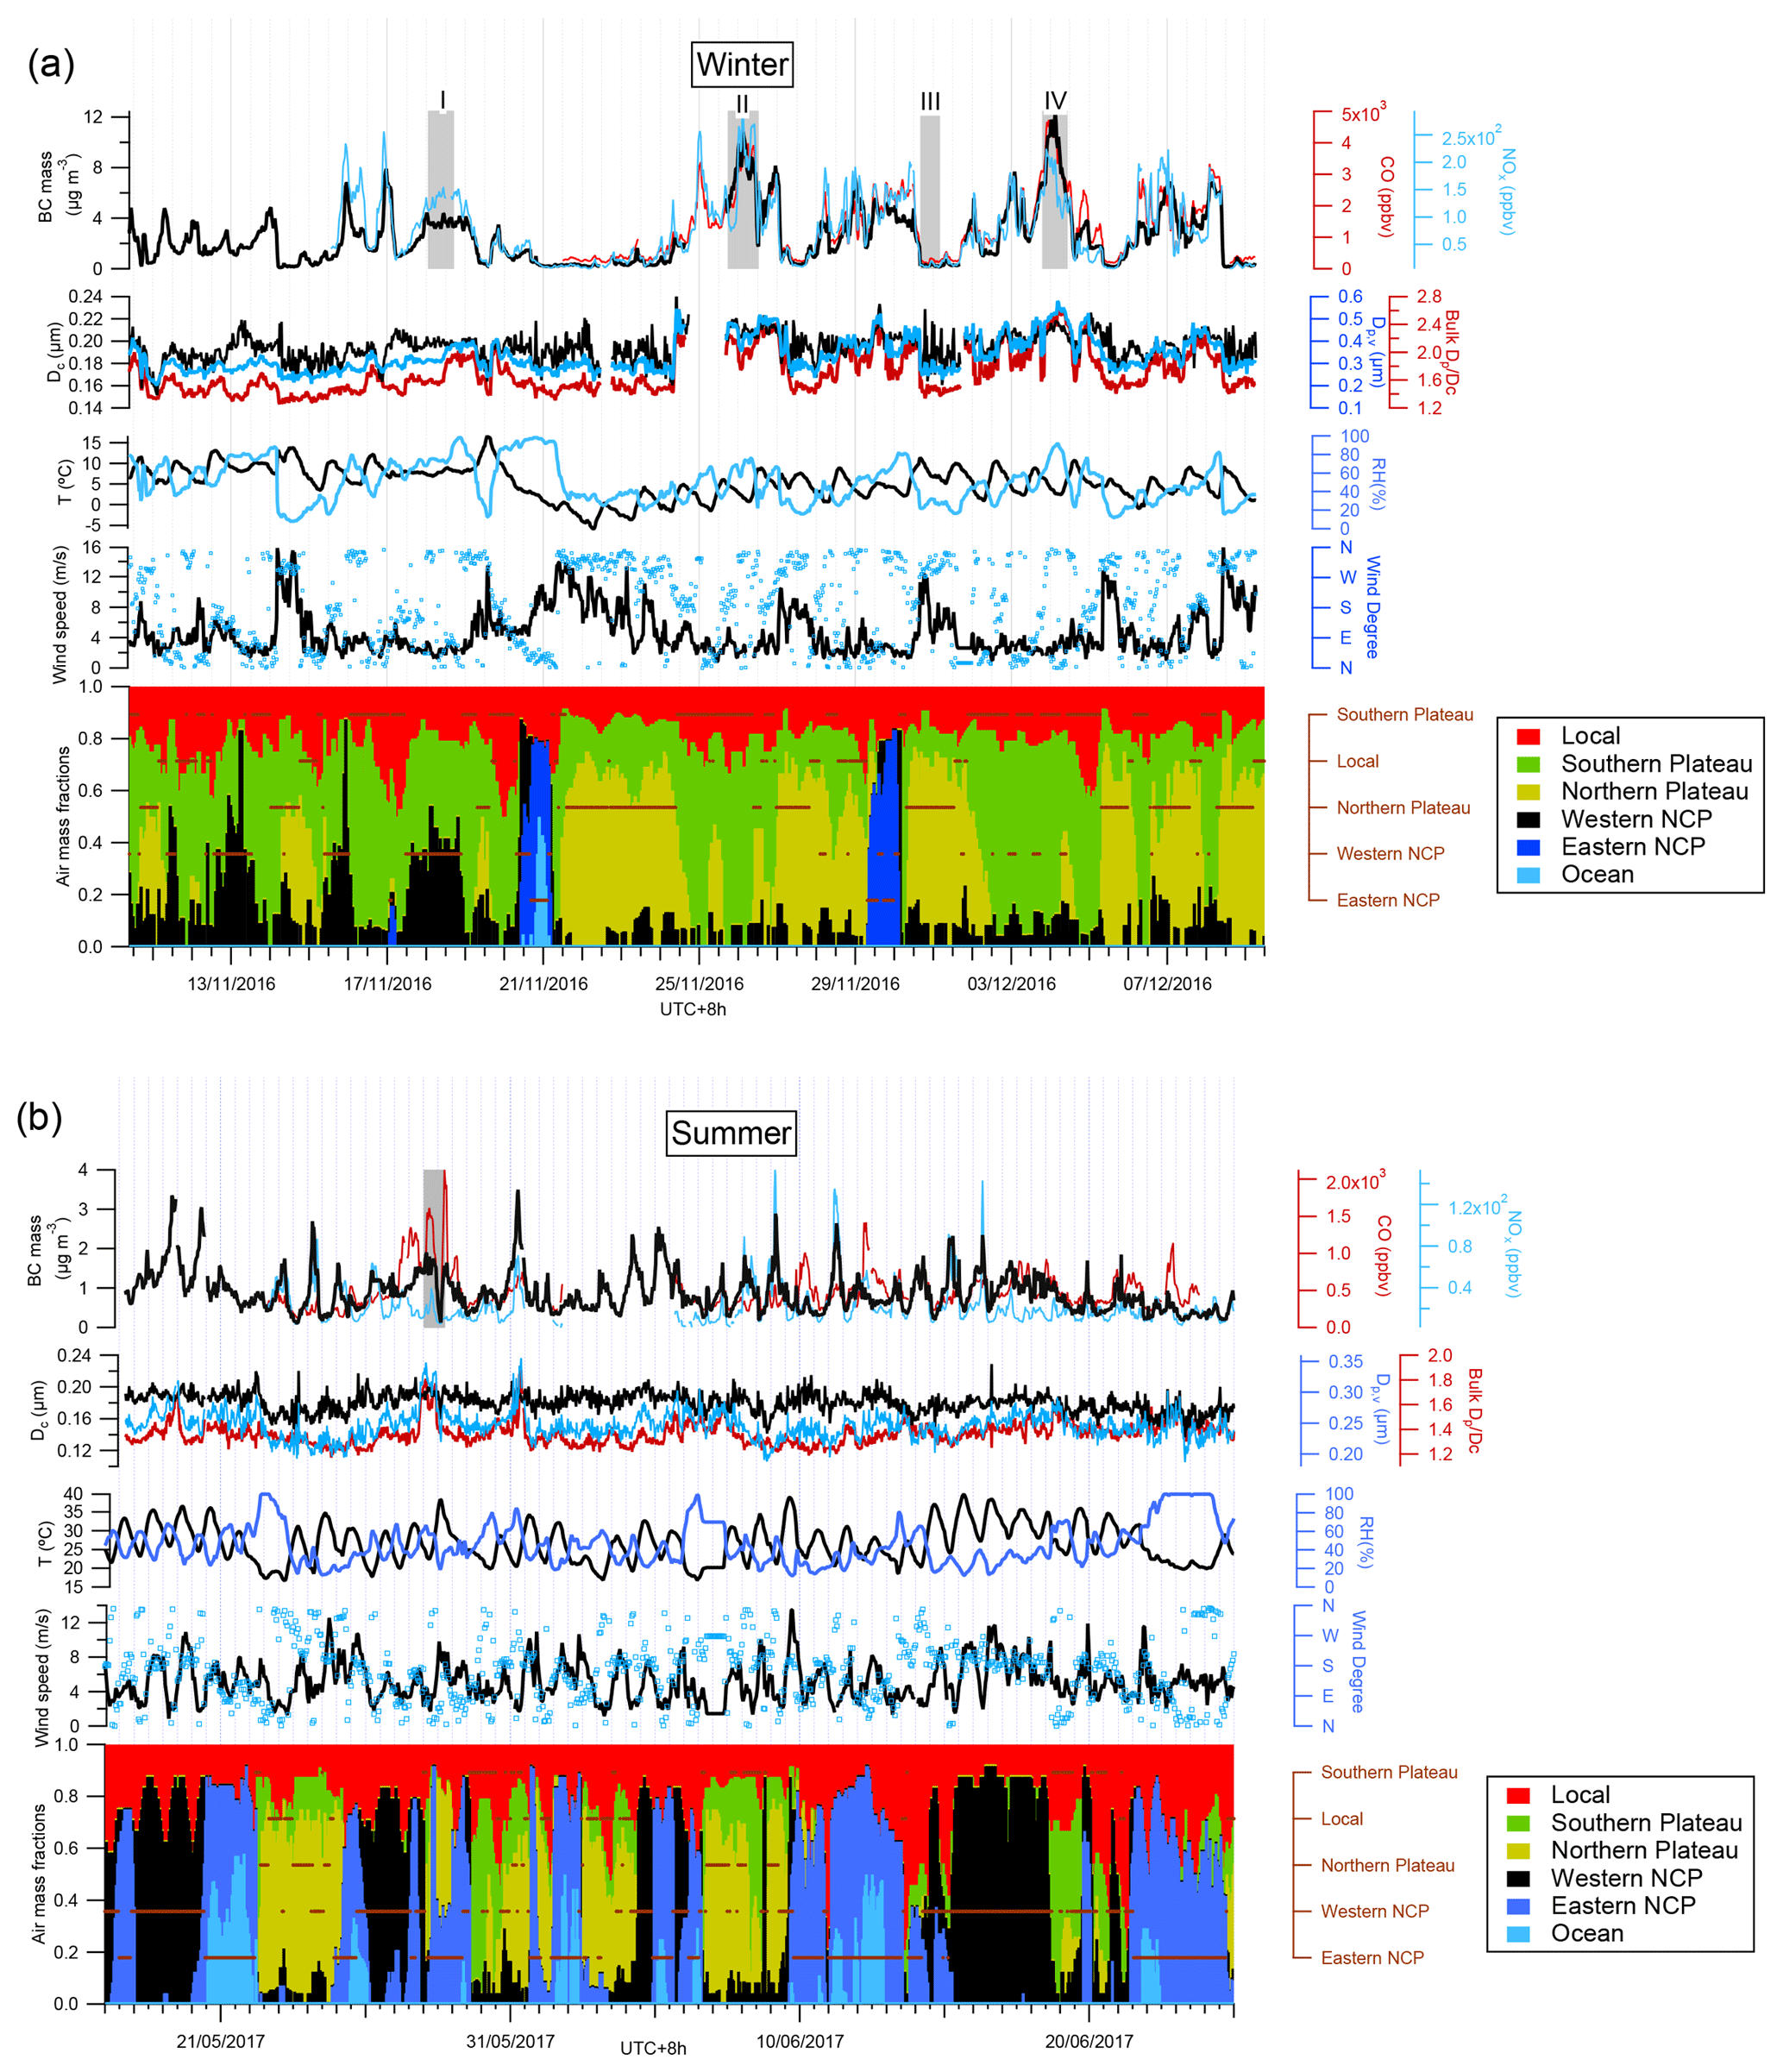
Figure 3Time series of BC-related properties in the winter (a) and summer (b) experiments. From top to bottom subpanels: BC mass loading, CO and NOx; BC bulk Dp∕Dc, core mass median diameter (MMD) and coated volume-equivalent diameter; ambient temperature and RH at z=8 m; wind speed and direction at z=120 m; air mass fractions from different origins based on back-trajectory analysis, with the brown horizontal lines indicating the classified air mass types. The vertical grey shades mark the periods for the detailed mixing state analysis in Fig. 9.
Each back trajectory is assigned to be predominately from one of the regions based on a ranked classification scheme that takes account of the likely greater influence on the pollution at the receptor from closer regions with large emissions. The methodology considers each region in turn, beginning with the Western NCP air mass because it represents the mostly polluted region, and a relatively lower air mass fraction of the Western NCP will make an important contribution to the pollutants measured at the receptor. If the back trajectory spent more than 10 % of the previous 24 h over the Western NCP, it was classified as being from that sector. The 10 % threshold was somewhat arbitrarily set based on an iteration over a range of values – too low a threshold biased air masses towards the very near field, whereas too high a value failed to classify a large fraction of air masses. The sensitivity of the threshold was tested by varying it between 9 % and 11 % (±10 %), and the classification was shown to be insensitive to change. The following regions are then considered in a similar way in turn based on the following order: Eastern NCP, Southern Plateau and Northern Plateau, with each above 10 % air mass fraction. Lastly if the air mass spent more than 20 % in the local area it is defined as having significant local influence.
The meteorological parameters such as wind, relative humidity (RH) and temperature were measured at ground level (z=10 m) and also on the tower at z=120 m. The temperature and RH at z=10 m are used, but the wind at 120 m is used to avoid the surface friction effect. In addition, the planetary boundary layer height (PBLH) spanning the experimental period was determined using lidar and ceilometer measurements (Kotthaus and Grimmond, 2018).
3.1 The physical properties of BC
The physical properties of individual refractory BC particles were characterized using a single-particle soot photometer (SP2) manufactured by DMT Inc. (Boulder, CO, USA). The instrument operation and data interpretation procedures are described elsewhere (Liu et al., 2010; McMeeking et al., 2010). The SP2 incandescence signal was calibrated for refractory BC (rBC) mass using Aquadag® black carbon particle standards (Aqueous Deflocculated Acheson Graphite, manufactured by Acheson Inc., USA) and corrected for ambient rBC with a factor of 0.75 (Laborde et al., 2012). The mass-equivalent diameter of the rBC core (Dc) is obtained from the measured rBC mass assuming a density of 1.8 g cm−3 (Bond and Bergstrom, 2006). For a given time window, the mass median diameter (MMD) of the rBC core is calculated from the Dc distribution below and above which the rBC mass was equal.
The scattering signal of each BC particle measured by the SP2 is determined using a leading edge only (LEO) technique to reconstruct the distorted scattering signal when the particle passes through the SP2 laser beam (Gao et al., 2007). This was used to determine the scattering enhancement (Esca) for each single particle which is defined as the ratio between the measured scattering intensity resulting from the entire BC-containing particle, including any coating, and the calculated scattering intensity resulting from the uncoated BC core of that particle (Liu et al., 2014; Taylor et al., 2015), expressed as
where the numerator is the scattered light intensity of the coated BC particle measured by the SP2, and the denominator is the calculated scattering intensity of the uncoated BC core based on the measured mass and using a refractive index of BC 2.26+1.26i at the SP2 laser wavelength, λ=1064 nm (Moteki et al., 2010). For a given Dc, a higher Esca means a thicker coating and Esca=1 means there is no coating. The coated BC particle size (Dp) is then determined by matching the modelled scattering with the measured scattering by applying a Mie core–shell lookup table (Taylor et al., 2015). For the current SP2 configuration (Liu et al., 2017), the detection efficiency for the coating, taking into account only particles with sufficient signal to noise in the two-element APD (avalanche photodiode) detector signal to perform reliable LEO fitting, is >80 % for Dc=0.12–0.45 µm, >60 % for Dc>0.45 µm (due to partly saturated signal) and >50 % for Dc=0.08–0.12 µm.
The bulk relative coating thickness (Dp∕Dc) in a given time window is calculated as the total volume of coated BC particles divided by the total volume of the rBC cores (Liu et al., 2014), expressed as
where Dp,i and Dc,i are the coated and rBC diameters for each single particle respectively (the abbreviations using subscript i refer to the single particle; variables without a subscript refer to the bulk information). Note that the bulk Dp∕Dc is largely independent of the uncertainties arising from smaller particles because of their less important contribution to the integrated volume.
The volume-weighted coated BC size (Dp,v) is then calculated as the product of the bulk relative coating thickness and the MMD of the BC cores, to indicate the mean coated BC size (Eq. 3). The bulk mixing ratio of coating mass over rBC mass (MR,bulk) can be also derived from Dp∕Dc assuming densities for the bulk coating and rBC core (Eq. 4):
The mass absorption cross section at λ=550 nm (MAC550) is calculated for each single particle by assuming the refractive index of rBC core 1.95+0.79i (Bond and Bergstrom, 2006) and coating refractive index 1.50+0i (Liu et al., 2015), using the Mie core–shell approach (Bohren and Huffman, 2008). Note that the absorption enhancement due to coating is considered to only occur when the coating mass over rBC mass is larger than 3 according to the recent study of (Liu et al., 2017), and the coating here is assumed to be non-absorbing. Figure S3 gives the calculated MAC550 mapped on the Esca−Dc plot. The MAC550 in bulk for a given time window is calculated as the integrated absorption coefficient (MAC×mrBC) for all particles divided by the integrated particle masses, expressed by Eq. (5):
where MACi and mrBC,i are the MAC and rBC mass for each single particle respectively. This calculation is performed for each type of BC.
A Photoacoustic Extinctiometer (PAX; Droplet Measurement Technologies, Boulder, CO, USA) (Wang et al., 2014; Selimovic et al., 2018) was deployed to directly measure the in situ aerosol light absorption every minute using photoacoustic technology. The light-absorbing particles are heated by a laser in the acoustic chamber, and this heating produces pressure waves which are detected by a microphone. The calibration of scattering and absorption for PAX was performed using the polystyrene latex spheres and fullerene soot respectively. The absorption coefficient at λ=870 nm (σabs,870) is measured by the PAX. The mass absorption cross section (MAC) is determined as the absorption coefficient per unit rBC mass. Note that in this study σabs,870 values for rBC mass loadings <0.5 µg m−3 were not used for MAC calculations due to the large uncertainty of absorption measurement at low concentration.
3.2 BC chemical composition
The chemical composition of black-carbon-containing particles, including the refractory BC and coating compositions, is measured by a soot particle mass spectrometer (SP-AMS) (Onasch et al., 2012a; Wang et al., 2017). The results from SP-AMS measurement during the APHH (Air Pollution and Human Health) project are detailed in Wang et al. (2019). The SP-AMS was run in laser-only mode and so only detected compositions for BC-containing particles. In this mode the non-refractory components were not detected if they were not contained within a BC particle. The ionization efficiency (IE) and relative ionization efficiency (RIE) of sulfate and nitrate were calibrated by using ammonium nitrate and ammonium sulfate (Jayne et al., 2000). RIE of rBC was calibrated by using Regal Black (RB, REGAL 400R pigment black, Cabot Corp.) (Onasch et al., 2012b). Positive matrix factorization (PMF) (Paatero and Tapper, 1994) was applied to the mass spectra of the organic and rBC components to attribute the source contribution of BC-containing particle mass, as detailed in Wang et al. (2019). Four types of BC-containing particles associated with different organic coatings were identified: fossil fuel combustion organic aerosol (FOA), biomass burning OA (BBOA), low-volatility organics (OOA1) and semi-volatile organics (OOA2). In addition, a polycyclic aromatic hydrocarbon (PAH) factor was also derived from the SP-AMS measurement, which is associated with coal combustion (Sun et al., 2016a).
4.1 Overview of BC physical properties
The following section describes the measured BC properties in both the winter and the summer seasons. Each property is discussed in turn and the similarities and differences between the seasons highlighted to clearly identify property changes that can be linked to changes in sources or processes in summer and winter.
Figure 3 shows the temporal variation of the physical properties of BC, associated gaseous pollutants, and meteorological parameters and their association with the air mass classifications. As the bottom panels show, the site was mostly influenced by northerly and westerly air masses in winter, and very few air masses came from the Eastern NCP. The first half of the winter campaign up to 20 November was periodically influenced by air masses from the Western NCP, and during the second half the synoptic meteorology shifted appreciably and was dominated by northerly (from the Northern Plateau) or westerly (from the Southern Plateau) air masses, with the period between 2 and 4 December dominated by air from the Southern Plateau. The temperature dropped from ∼10 ∘C to below 5 ∘C when the air mass type shifted to deliver air from the plateau. In summer, Beijing received air from the Western NCP, the Eastern NCP and the Northern Plateau, with southerly air masses more dominant than those from the north.
The classified air mass types are generally consistent with the local wind directions measured at 120 m for both seasons (Fig. 4). In winter, the Northern Plateau air masses were characterised by high speed and dry NW winds; in summer the flow was not as strong. Air masses from the Southern Plateau were associated with both northerly and southerly winds but with much lower wind speed and systematically higher RH than the Northern Plateau air masses. The south-westerly air masses also had the highest RH, which is consistent with previous observations that show air masses from lower latitudes contained more moisture in wintertime (Tao et al., 2012). In summer, air masses from the Western NCP showed lower RH. The site showed lower wind speed and wider variation of RH when influenced by local air masses.
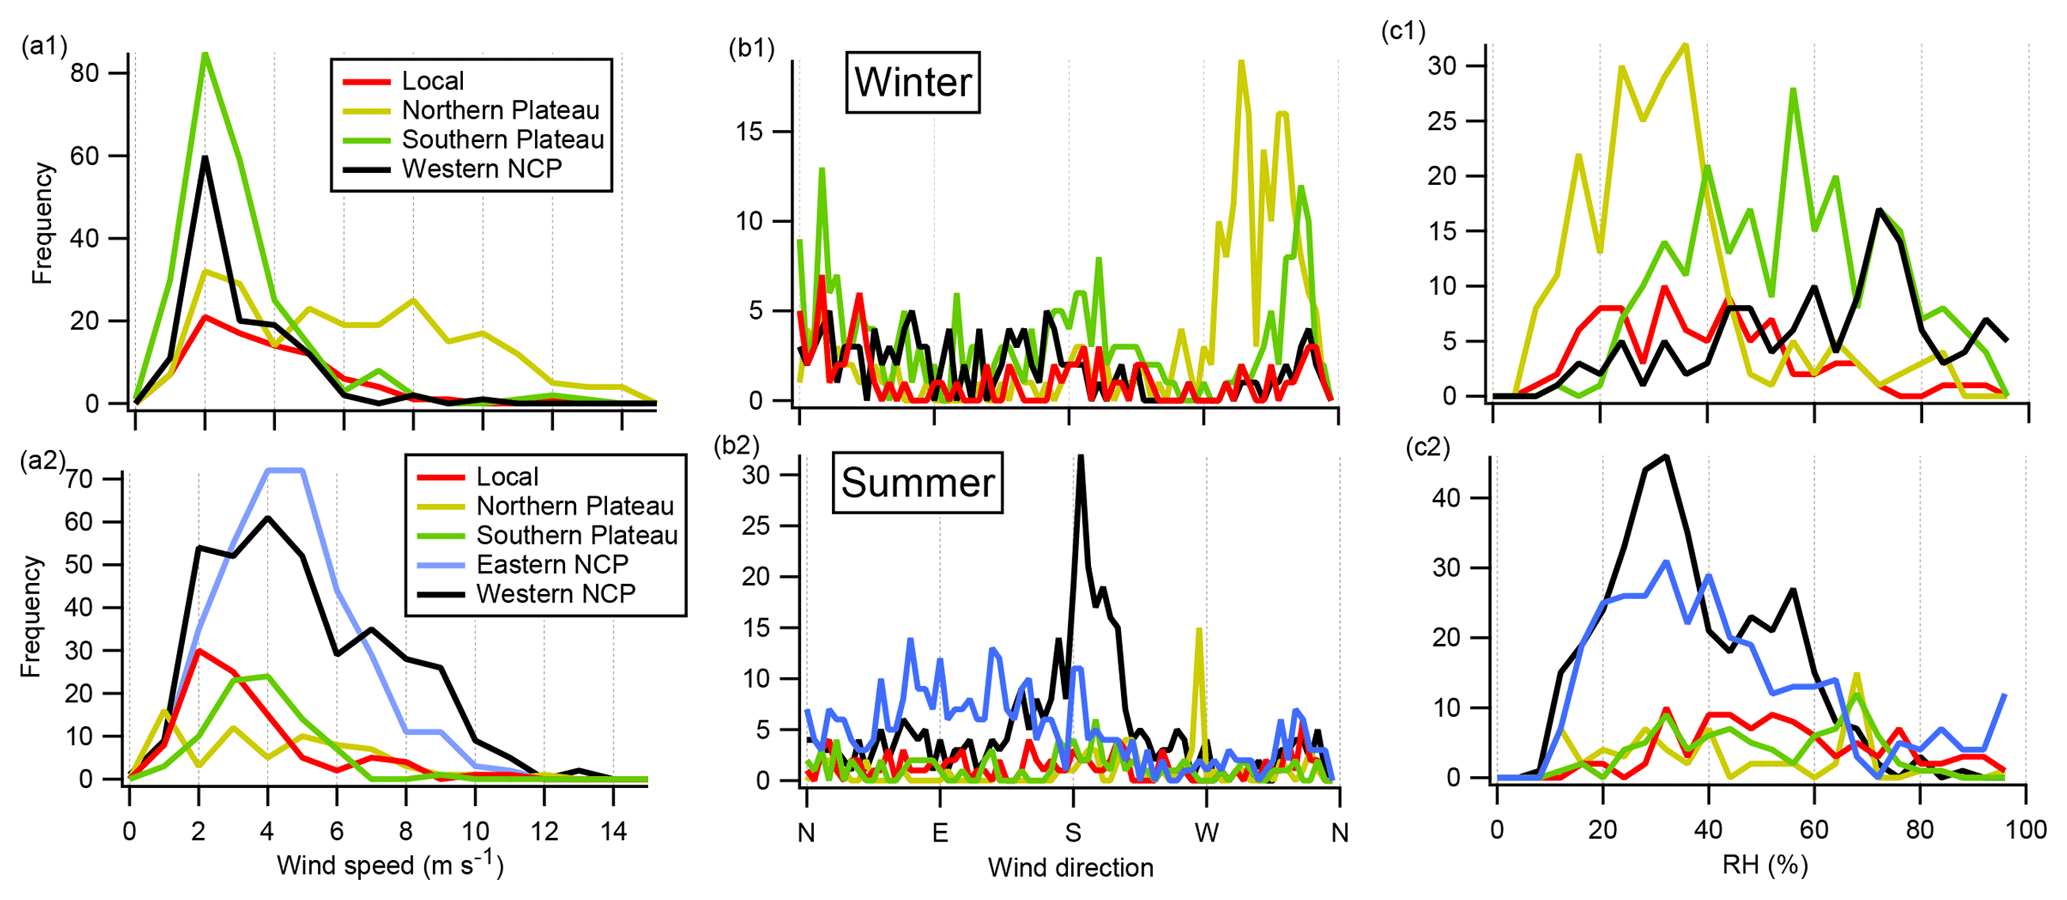
Figure 4Frequency distributions of wind speed and direction (z=120 m) and RH (z=8 m) for classified air mass types in both seasons.
BC properties associated with different air mass types in both the winter and summer seasons are compared in Fig. 5. rBC mass loadings were higher in winter than in summer by around a factor of 2 for both local and regionally transported air masses, mostly likely due to a combination of higher surface emissions from both the local Beijing region and the surrounding area in the cold season, as well as the increased frequency of lower boundary layer heights in winter (Sect. 4.4). However, air masses from the Northern Plateau during periods of strong and dry wind had a notable effect on the rBC mass in winter, greatly reducing the rBC mass in Beijing. This air mass type contributed to over 90 % of the cleaner days (rBC mass concentration < 1 µg m−3) in winter. This is consistent with the emission inventory that shows that the north-west of Beijing is dominated by lower surface emissions over Mongolia. The dilution of Beijing pollution by high wind speeds during NW air flow has been widely observed (Sun et al., 2015; Zhang et al., 2013, 2015). The BC particles during these periods had systematically lower core sizes (Fig. 5b1) and lower coatings (Fig. 5c1) and therefore smaller total particle sizes. This may result from more efficient removal processes for the more coated and larger BC particles in winter.

Figure 5Histograms of BC mass loading, core size MMD, Dp∕Dc and Dp,v for different air masses in both seasons.
No significant differences (p<0.01) in the physical properties of BC particles were observed between the different air mass types in summer; e.g. there is a consistent peak of for all air mass types, which may suggest an almost homogenous mixture or consistent BC sources across a large region around Beijing in China. In winter, the range of Dp∕Dc values extended from similar values to those in the summer up to 2.5. The MMD of BC cores was most often observed to be ∼180 nm for both seasons, but it is noted that the air mass from the Southern Plateau (as the green lines show) had systematically larger MMD, and BC particles in air masses from this region also had the highest coatings and largest coated BC size compared to other air masses. The large BC core size and coatings observed during westerly air masses may arise from ageing of sources in central and western China during transport, though it should be noted that the trajectories presented are only for the previous 24 h. However, the BC core size was significantly higher (p<0.01) in winter than in summer during periods when Beijing received air from the Southern Plateau. This may result from a large contribution of residential heating activities in the Southern Plateau in winter which were not present in summer.
As Fig. 6 shows, the diurnal variation of rBC mass loading in winter showed a strong anti-correlation (R2=0.73) with the mixing layer height (MLH). In winter, surface cooling during the night leads to a shallow nocturnal boundary when coupled with increased emissions from heating activities, which greatly enhances surface pollution. During the day, a deeper boundary layer is re-established, resulting in a much larger volume for emissions to mix into. The diurnal variation in rBC is a combination of both diurnal variations in emissions and marked changes in the boundary layer structure. In summer, the night-time peak of rBC mass loading was absent but peaked during the morning rush hour, which may reflect the important contribution from traffic. Figure 6 shows an evident increase in BC coatings around 10:00 (all times are in local time) in winter and a slight increase around 09:00 in summer, and the coatings in winter were notably higher at night than in the day. In general, larger variations in the physical properties of BC were observed in winter compared to summer.

Figure 6Diurnal variations of mixing layer height (MLH) and BC-related properties in winter and summer. The lines show the mean at each hour and error bars denote ±1σ. The x value for summer is shifted by 0.5 h to avoid the overlap.
4.2 The size distribution and mixing state of BC
Figure 7a gives examples of BC core size distributions for typical periods in both seasons. The BC core size distribution could be modelled as a single log-normal distribution fitted for Dc=100–400 nm,
where A is the peak concentration, Dc is the BC core size measured by the SP2, D0 is the core MMD and σg is the geometric standard deviation (GSD) for the log-normal distribution. The red lines in Fig. 7a show the log-normal fitting to the observations. It is noted that some fraction of the distribution at the larger end is not fitted within the single log-normal distribution, which may require an additional moment of log-normal distribution to be accounted for, as has been shown during previous urban studies (Huang et al., 2011). However, fitting a second log-normal mode will be subject to large uncertainty due to the saturation of the SP2 detector which has an upper cut-off at Dc=550 nm, leading to insufficient data points to constrain such a fit. The additional rBC mass distribution above 550 nm may exist but would require instrument reconfiguration to be fully detected. The two-moment log-normal fitting is thus not performed in this study. The extrapolated rBC mass accounted for 5 %–8 % of the total rBC mass loading which is included for the rBC mass loading reported in this study.

Figure 7(a) BC core size distribution averaged over different rBC mass loading conditions in both seasons, showing the log-normal fitting and the fitted peak diameter (D0) and geometric standard deviation (GSD); (b) BC core MMD as a function of BC mass loading and parameterization; (c) BC core GSD (from the fitting) as a function of BC mass loading and their fitting functions. The line and error bars show the mean ±σ at each rBC mass bin.
Figure 7b shows the fitting parameters of BC core size distribution at different levels of rBC mass concentration. The core size generally increased at higher rBC mass concentration but demonstrated considerable variability ranging between 150 and 220 nm. BC particles were observed to have systematically larger core sizes in winter than in summer at the same rBC mass concentration. In winter, the significant increase in core MMD when the rBC mass concentration >5 µg m−3 may indicate that coagulation is taking place at high concentration. The increased BC coating thickness observed under these conditions is also consistent with BC coagulating with non-BC particles (Fig. 8). The width of the core size distribution σg in winter showed a decreasing trend at higher rBC mass concentration; again this is consistent with the view that coagulation may occur at high rBC mass concentration, reducing the width of the size distribution (Pratsinis, 1988). However, these effects may also reflect a shift in the range of sources present during periods of higher pollution levels that produces proportionally more rBC particles with large core sizes. In summer σg showed an increasing trend with rBC mass concentration, which may result from more diverse source contributions at higher rBC mass concentration. The higher σg in winter than in summer at the same rBC mass concentration suggests a greater complexity of sources in winter.
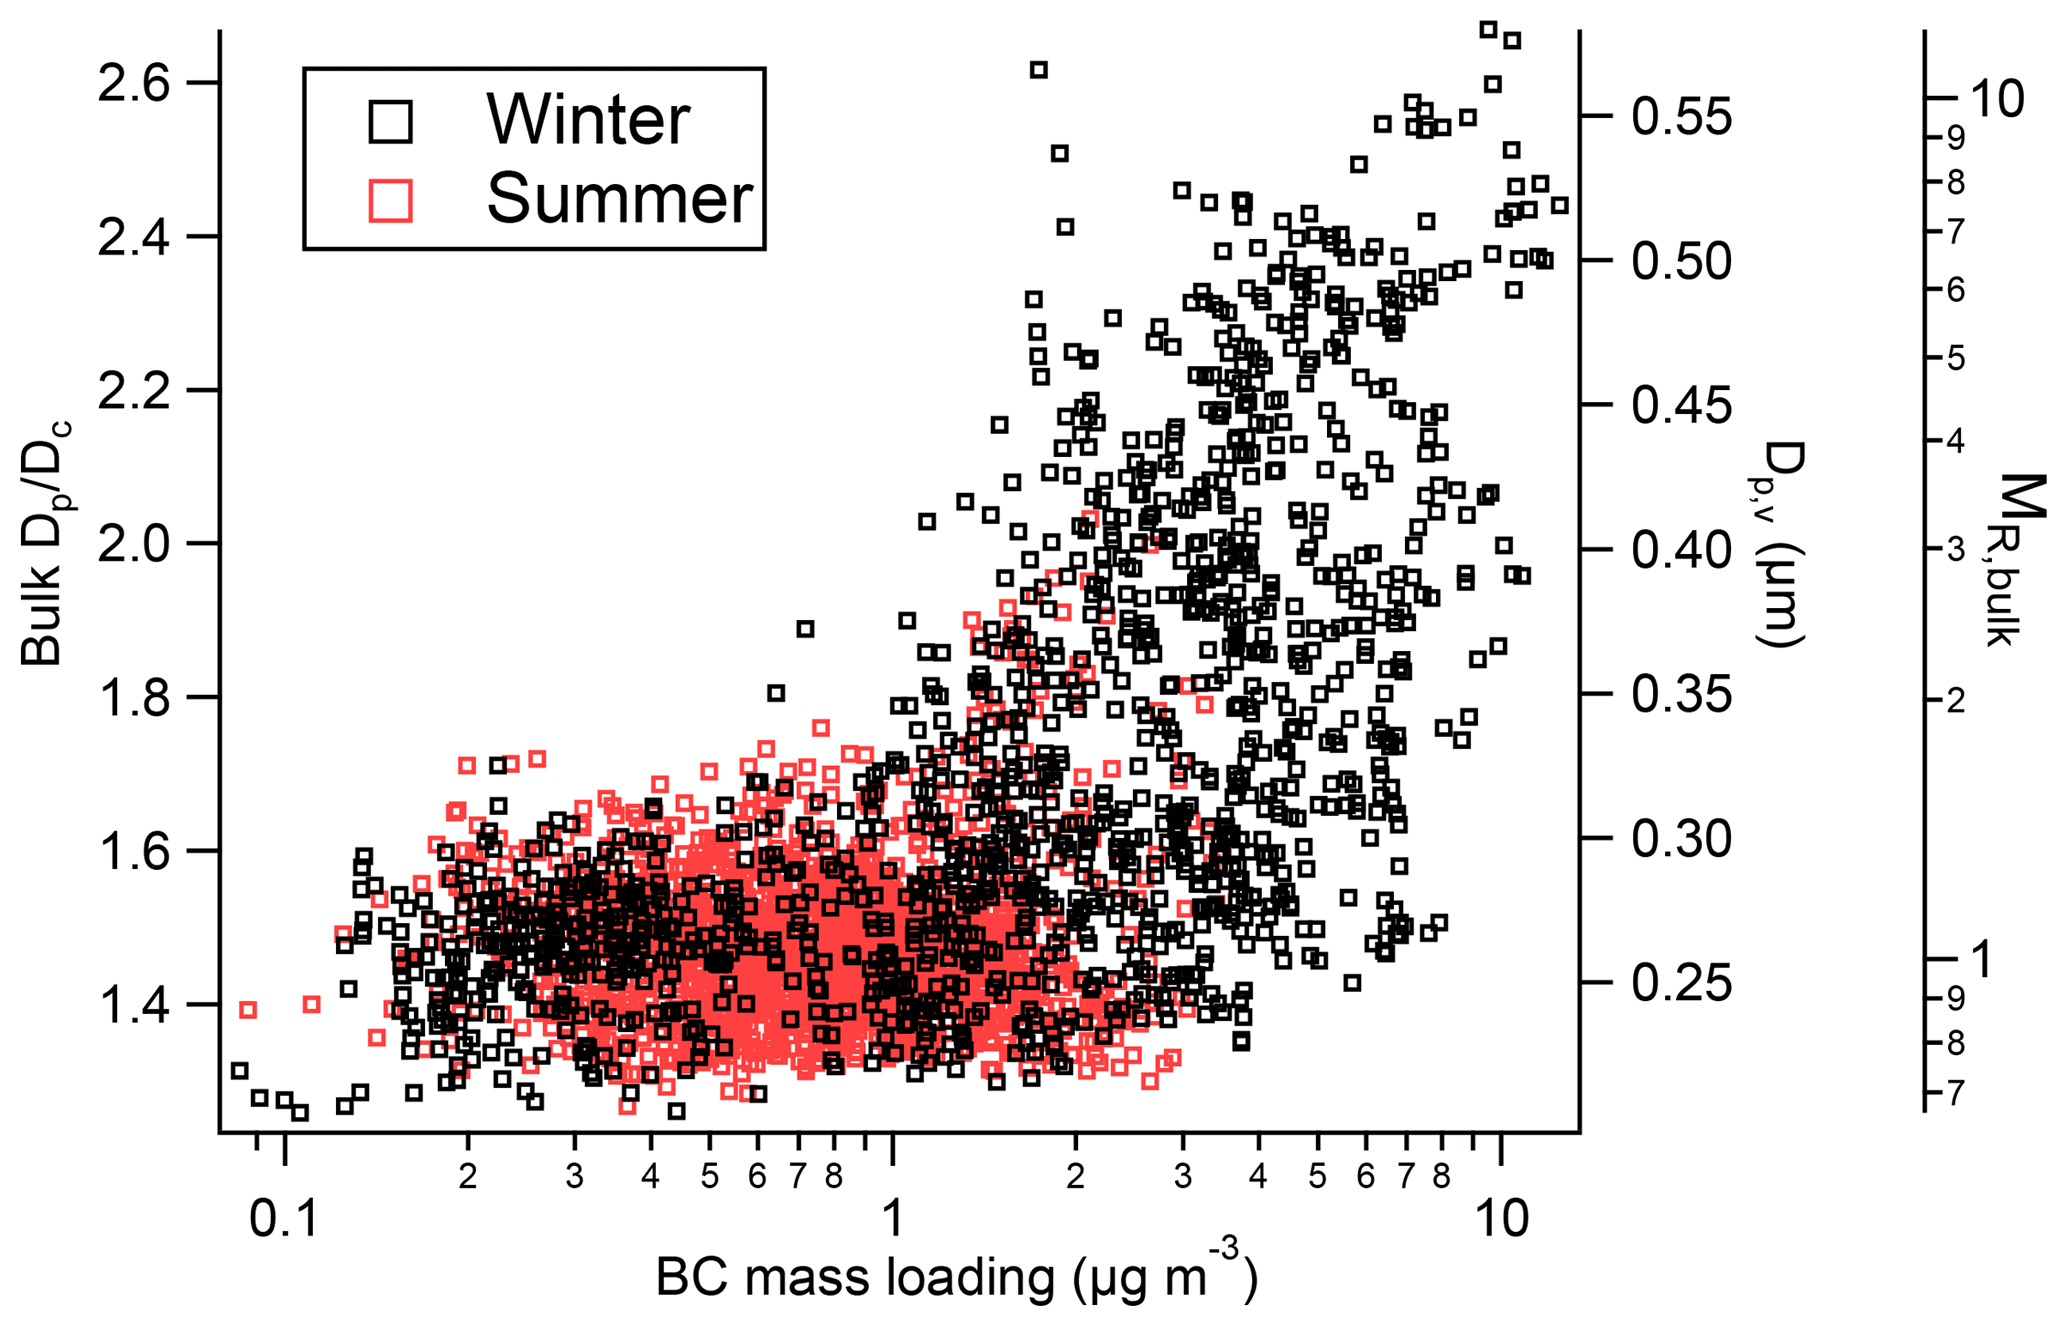
Figure 8Mixing status of BC at different levels of BC mass loading in both seasons, with different y axes showing bulk Dp∕Dc, volume-weighted coated particle size (Dp,v) and bulk mass mixing ratio of coating∕rBC.
The core sizes observed in Beijing are significantly larger (p<0.01) than those observed in London, even when the BC source profile was dominated by wood burning (170 nm), which may result from other sources of BC. Figure 8 shows the coating content of BC was similar between seasons with MR,bulk 1–2 when the rBC mass concentration <2 µg m−3. During summer the coating thickness only periodically increased (), but in winter the coating increased particularly when the rBC mass concentration >3 µg m−3, showing a highly variable MR,bulk ranging between 1.5 and 10 (bulk –2.6). Accordingly, the coated BC size Dp,v peaked at 220–310 nm when rBC mass concentration < 2 µg m−3 in both seasons; however, it reached values as high as 550 nm under highly polluted conditions. The large variation of BC mixing state during wintertime when the rBC mass concentration > 3 µg m−3 may reflect the additional primary sources, such as the large contribution from residential sources during the cold season. However, secondary processing of the complex source mixtures under highly polluted conditions may also play an important role in increasing the coatings. Possible reasons for these differences are investigated in more detail in Sect. 4.4 and 4.6, where the rBC is segregated into characteristic types and compared with PMF results from the SP-AMS and PM1 respectively.
4.3 BC segregation by size-resolved mixing state
Figure 9 shows the BC core size-resolved mixing state during typical periods in both seasons, and the results obtained in London are also shown as a reference (Liu et al., 2014). It is noted that Esca appears to be <1 at larger Dc. This arises for two reasons. Firstly, the assumption of sphericity used in the Mie calculations to derive Esca introduces significant bias for larger BC cores with little or no coating. The resulting scattering for uncoated BC will be lower than that derived by Mie scattering due to geometrical influences as has been shown when comparing with T-matrix calculations (He et al., 2015; Wu et al., 2018), and this increases with rBC core size. Secondly, the BC at larger Dc largely results from coal combustion (Sect. 4.4), and this may have a refractive index (RI) that is different from rBC from traffic sources (2.26, 1,26). Both factors will lead to a lower estimated scattering cross section for uncoated rBC, and hence Esca<1. Since no measurements of BC morphology or source-dependent RI of rBC are available in this study, we are only able to state that this BC with larger Dc is likely to be very thinly coated and assume the particles with Esca<1 had a 1. This assumption is not likely to lead to major biases since the BC at large Dc values has a lower MAC (Fig. S5), and adding material to these particles will only lead to the presence of a thin coating that will not significantly influence the resulting overall MAC (less than 8 %).
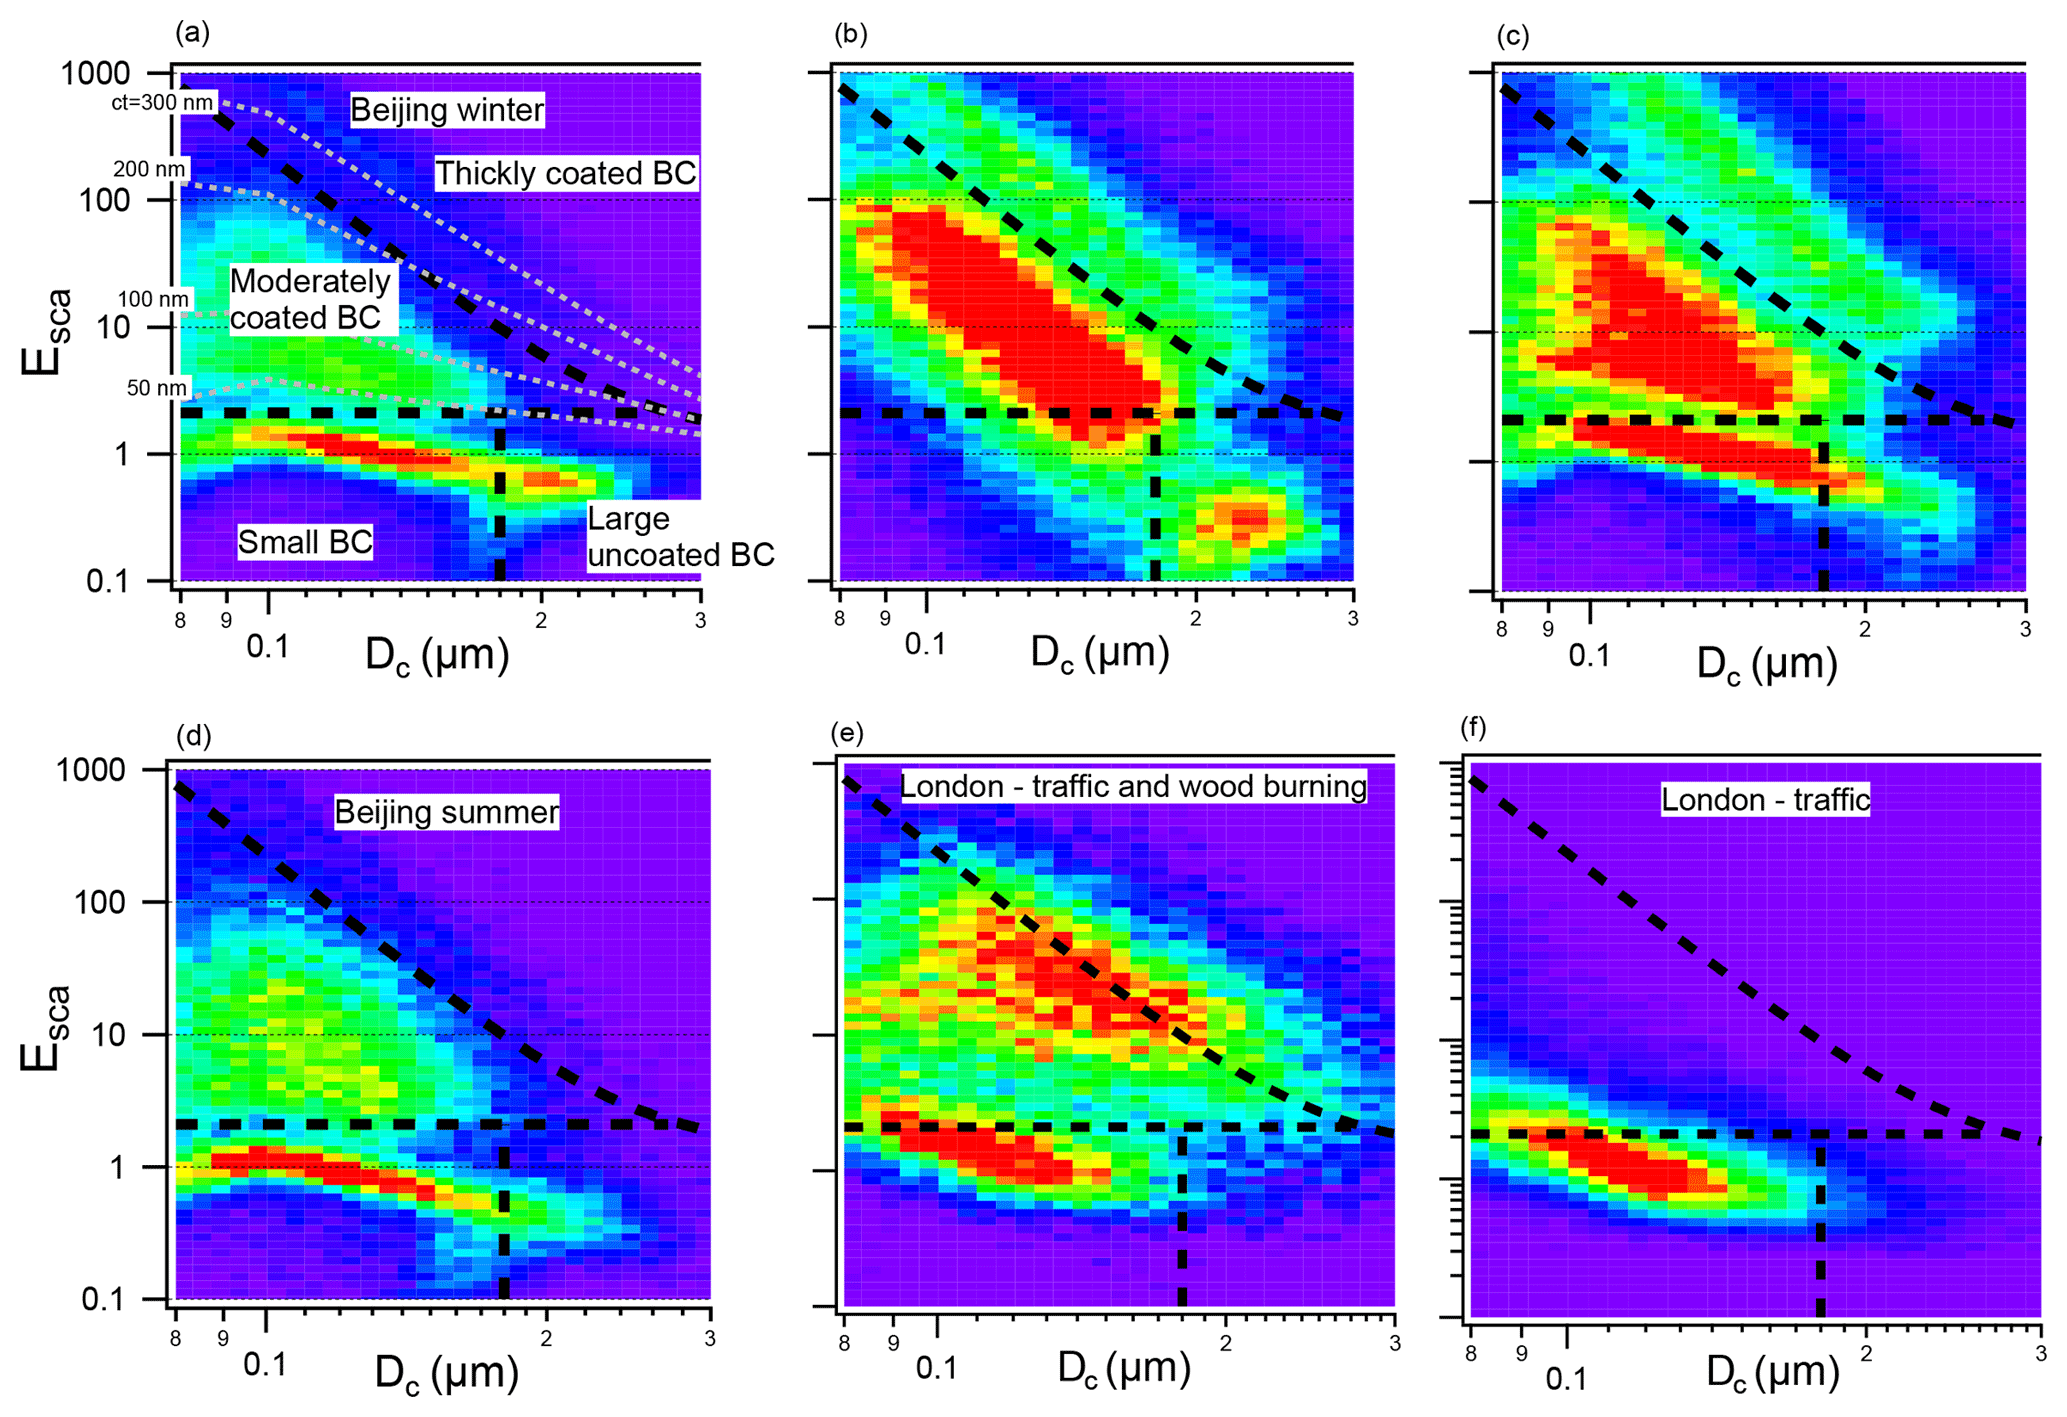
Figure 9Scattering enhancement (Esca) as a function of BC core size (Dc) for the three periods (as period I–III indicated in Fig. 3) in Beijing winter (a–c), Beijing summer (d), London with mixed sources (e), and London with traffic source (f). Each plot is coloured by particle number density (the colour scale is set to be red when the number density is above 70 % of the maxima in each panel). The particles are separated as four groups using the borders (from top to bottom) at , y=2.1, x=0.18, as shown by dashed lines on each plot. The dashed grey lines on (a) denote coating thicknesses mapped on the Esca−Dc plot.
The BC particles were segregated according to the discontinuous distribution in Esca−Dc during different periods. The criteria used is shown by the dashed thick lines in Fig. 9a. Four modes of BC could be segregated: small BC (BCsm) with BC cores smaller than 180 nm and coating thicknesses <50 nm (assuming a core–shell structure); moderately coated BC (BCmod) – moderate coating with coating thicknesses of 50–200 nm; thickly coated BC (BCthick) with coating thicknesses >200 nm; and large uncoated BC (BClg,uncoat) with BC core sizes >180 nm and thicknesses <50 nm. The contribution of these four modes of BC particles to the total rBC number varied during different periods. In summer, the BCthick only contributed a minor fraction of the total number throughout the experiment. The small, moderately coated and BClg,uncoat fractions are all present in both seasons. Compared with the results in London (Fig. 9e and f), the BCsm fraction was consistent with traffic influences with small core and thin coatings, and the BCmod was broadly consistent with the wood burning observed in urban London. It is noted that the BClg,uncoat was not important in urban London under the different air masses or source influences observed, with the mass fraction of BC % and number fraction <3 % throughout the experimental period. This means BClg,uncoat may represent a source which was uniquely present in urban Beijing but not in the UK or surrounding area.
A further analysis on the segregated BC core and coated size distribution (Fig. S2) shows the total size distribution of BC core and coated size distribution could be generally separated as two or three size distributions with BC, BCmod and BCthick, representing the thinly, moderately and thickly coated BC respectively. In particular, the thickly coated BC could well explain the additional mode observed in the coated BC size distribution. This in turn suggests the apportioned BC modes may represent discernible primary sources or sources subject to secondary processing.
4.4 Comparison of BC source estimation
Figure 10 shows the temporal evolution of rBC mass in winter determined by the SP2 and SP-AMS categorized according to the different source contributions derived in Sect. 4.3 and as explored in Wang et al. (2019) respectively. PMF analysis on SP-AMS detected mass spectra identified four factors for BC-containing particles (Wang et al., 2019): fossil fuel BC (FOA_BC) containing BC from vehicle sources and coal burning, BC coated with biomass burning organics (BBOA_BC), BC associated with less-volatile organic coatings (OOA1_BC) and BC associated with semi-volatile organic coatings (OOA2_BC). Note that each PMF factor includes the refractory BC (Cx) and the non-refractory coatings associated with it. In order to directly compare with the rBC mass measured by the SP2, only the mass of the Cx fragments in the PMF factors are used. Table 1 shows the linear correlation coefficient between the different PMF factors and the SP2-segregated BC types, with green shading highlighting the high correlation (r2>0.6).

Figure 10Time series of SP2-separated rBC mass and SP-AMS separated Cx mass by PMF analysis.
Table 1Pearson's correlation coefficients between the time series of SP2 and SP-AMS segregated rBC mass and PAH. The correlations with Pearson's r2 > 0.6 are in bold font. All correlations are significant at the 0.01 level (two-tailed).
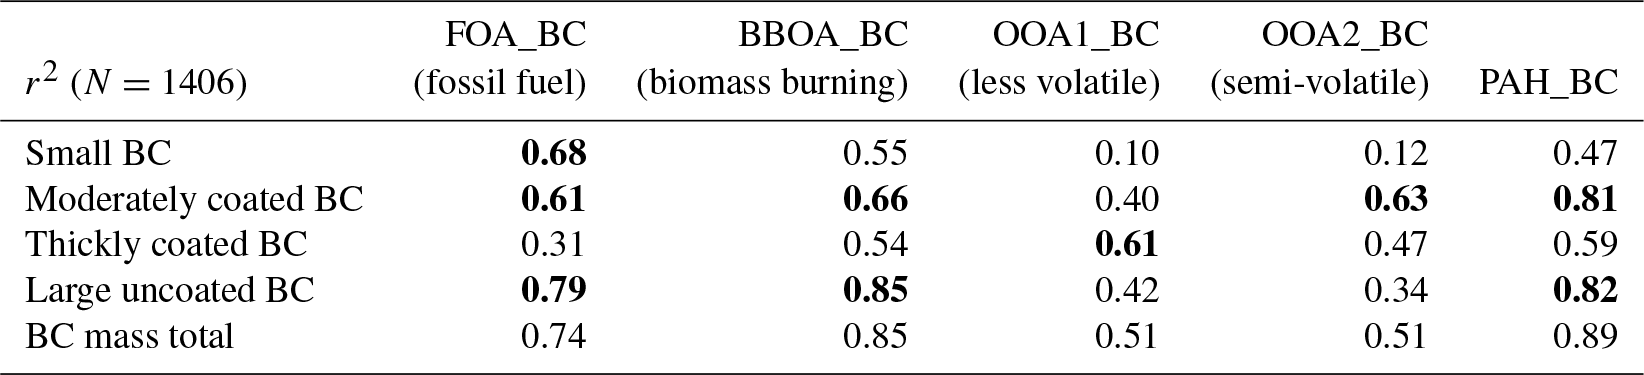
The FOA_BC was not able to be further apportioned via the PMF analysis, and so this factor contains both mobile sources such as from diesel or gasoline engines and importantly the coal burning emissions. Coal burning could result from both the residential and industrial sectors (Finkelman and Tian, 2018), with the former sector overwhelmingly dominating in winter but the contribution from the latter maintained throughout the year (Fig. S1). The small BC particle component is shown to be solely correlated with FOA_BC (r2=0.68), but FOA_BC is also correlated with moderately coated and BClg,uncoat. The multiple correlations of FOA_BC with BC at different core sizes and coating thicknesses mean the fossil-fuel-related BC could exhibit a range of mixing states; however the BCsm particle fraction that has smaller core sizes and thinner coatings tends to be only associated with and contributes to the fossil fuel BC fraction.
BBOA_BC, which mostly resulted from open cooking sources in Beijing (He et al., 2010), is correlated with BCmod and the BClg,uncoat from the SP2 (r2>0.6). Both BC types had high correlation with FOA and BBOA (r2>0.6) since the fossil fuel (excluding the part correlated with BCsm) and biomass burning BC particles have similar core sizes and coating contents. The potential contributions from coal burning sources are further investigated by correlating the SP-AMS-measured PAH with the SP2-segregated BC types, as the PAH is considered to be an ideal marker for coal burning (Xu et al., 2006; Sun et al., 2016a). The moderately coated and BClg,uncoat fractions are found to have the highest correlation with PAH (r2>0.8). This means the BC from coal burning tended to contribute to both the moderately coated and the BClg,uncoat fractions (Y. Zhang et al., 2018a) but not the BCsm, which in turn indicates that the BCsm is mainly a result of mobile sources (such as traffic) rather than coal burning. Previous studies found that the coal emission in urban China may have a larger BC core size compared to traffic sources (Wang et al., 2016; Y. Zhang et al., 2018a) and larger BC cores in the cold season (Yang et al., 2018). This is also consistent with the lack of the BClg,uncoat mode in urban London where there was no coal burning present in the city (Fig. 9). Given that biomass burning was also correlated with moderately coated and BClg,uncoat fractions (r2>0.6), analyses limited to the size-resolved mixing state alone may not be able to distinguish the BC particles derived from coal and biomass burning in urban Beijing. This may be because the contribution of biomass burning to BC was significantly lower (p<0.01) than that from fossil fuel in Beijing (Zhang et al., 2017), and the open biomass burning was only sporadically significant during spring and autumn harvest time over the NCP region (Chen et al., 2017). In addition, even some of the coal burning contribution, especially for the coal from residential use, may be attributed as biomass burning if using levoglucosan as a marker (Yan et al., 2018), which may lead to some fraction of BBOA identified by the SP-AMS containing some fraction of coal burning. BCmod is consistent with wood burning in urban London, but BClg,uncoat is not present from these sources (Fig. 9e and f). It is therefore more likely that the BClg,uncoat was mainly contributed by coal combustion.
The BCthick or BCmod fraction is well correlated (r2>0.6) with the BC coated with less-volatile organics (OOA1_BC) or semi-volatile organics (OOA2_BC) respectively. This means the coating composition would mostly contain less-volatile organic species when BC was thickly coated, whereas the moderate coating BC particle fraction mainly contained semi-volatile species. The coal burning or biomass burning contributions are also significant in the BCmod fraction, which means these primary sources may also emit considerable semi-volatile species internally mixed with BC. Note that the absolute values of rBC mass from SP-AMS or SP2 had not necessarily corresponded with each other for the correlated factors; e.g. the OOA2_BC is higher than OOA1_BC but vice versa for the SP2 factors. This may result from different responses and sensitivities for the measurement techniques of both instruments at different levels of BC mixing state.
4.5 Diurnal variation of different types of BC
Figure 11 shows the diurnal variation of the four different rBC types classified by the SP2. In winter all BC types anticorrelated with the diurnal evolution of MLH, whereas in summer all BC types exhibited a morning rush-hour peak. For BCthick in winter, the average was significantly higher (p<0.01) than the median, indicating the sporadic occurrence of the thickly coated BC. There was no discernible difference in the diurnal patterns of the absolute mass loadings of the different BC types, which means similar emission sources, and the PBL development may have controlled the diurnal pattern of different BC types to a similar extent. Nevertheless, differences could be identified by relative abundances of different BC types as discussed in the following section.
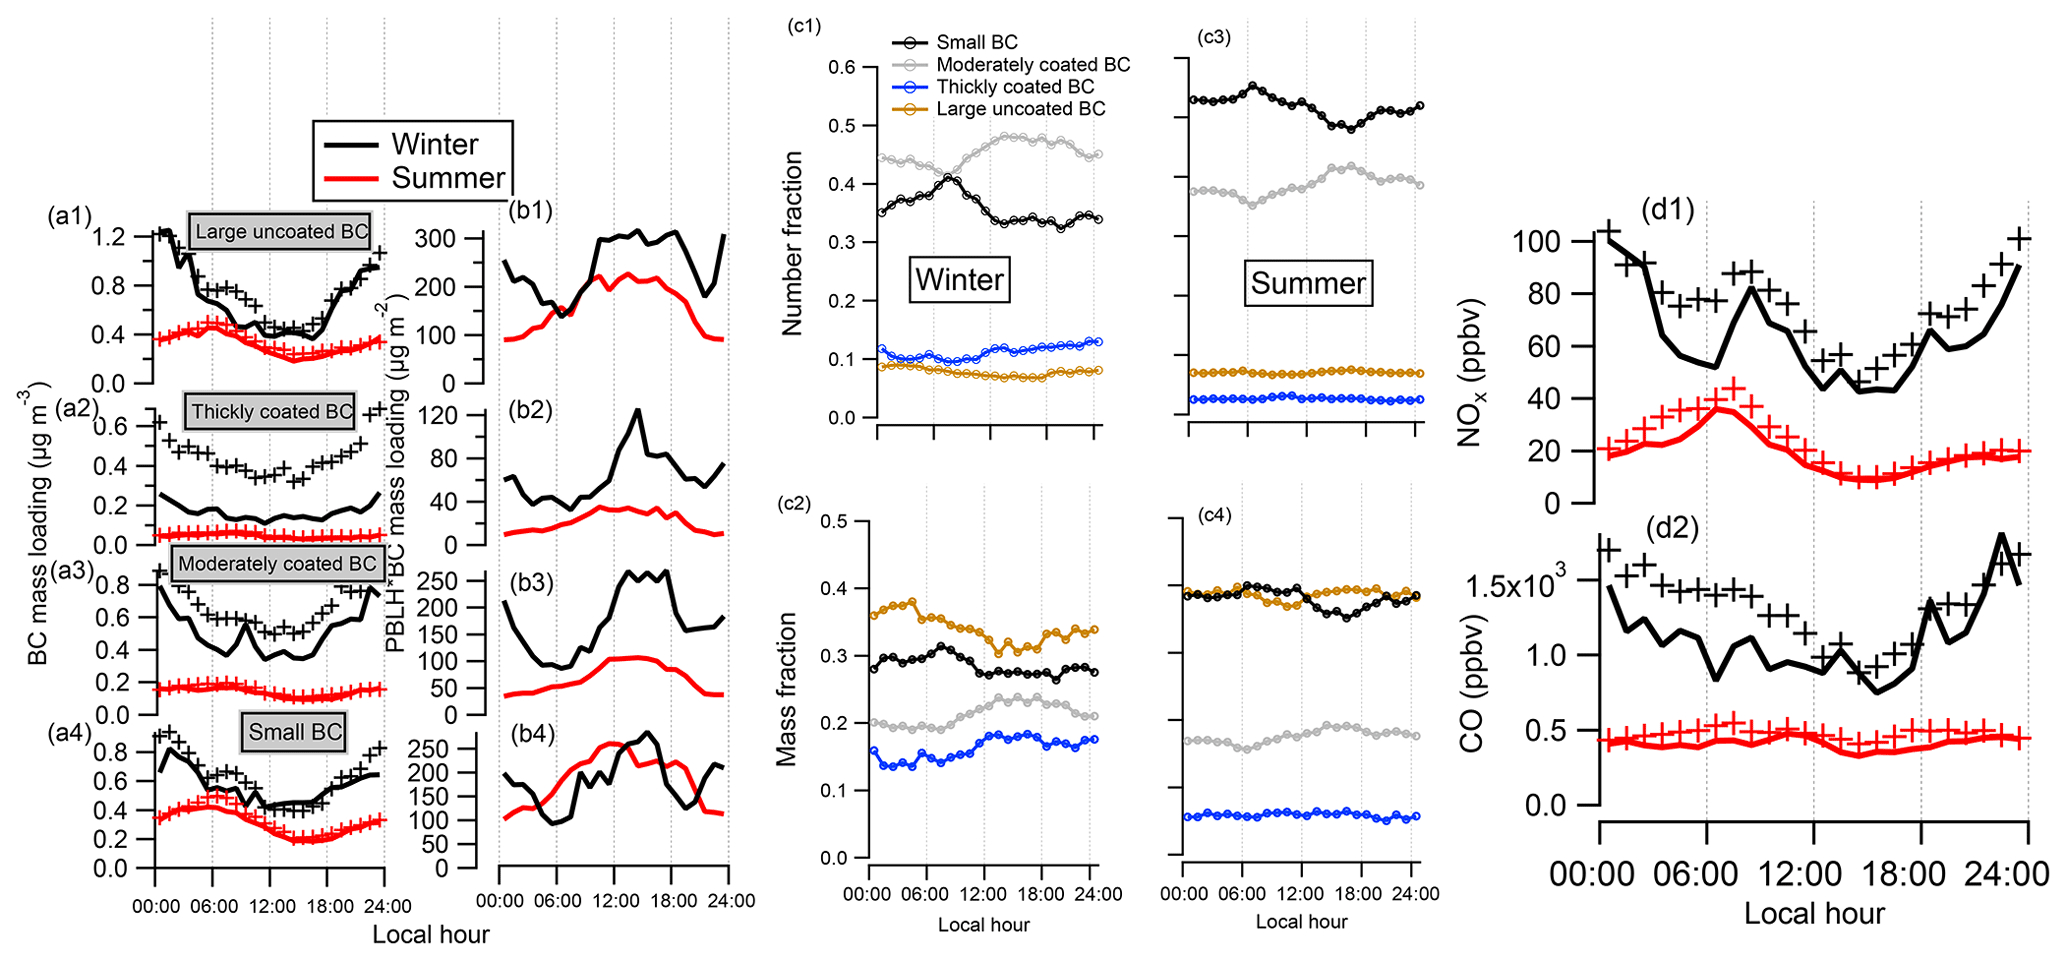
Figure 11Diurnal variation of the rBC mass segregated by their SP2 characteristics in both seasons. (a) shows the median (solid line) and mean (markers) at each hour; (b) shows the median value of PBLH-corrected rBC mass; (c) shows the number and mass fractions for each BC type; (d) shows the NOx and CO.
The diurnal variation of the number or mass fraction of BCsm (Fig. 11c) peaked at 08:00 and 07:00 in the winter and summer respectively, which corresponded with the morning rush hour. This is consistent with the identified possible traffic contribution to the BCsm fraction by comparison with the SP-AMS factors (Sect. 4.4). The diurnal variation of this BC mode also had high correlation with NOx in both seasons (r2>0.7), with the morning rush hour occurring slightly later in winter than in summer, which further confirms the likely origin of the traffic source. The correlation between the NOx concentration and different BC types is further evaluated by a multilinear regression function, expressed as Eq. (7). The fitting parameters are summarized in Table 2.
Among all BC types, a1 shows the highest value in both seasons, which indicates the strong correlation (r2>0.7) between the BCsm mass fraction and the NOx concentration, with almost identical emission factor of 68–72 ppbv NOx (µg m−3)−1 of BCsm. In winter, the BCmod also contributed some fraction of NOx, whereas in summer the contribution of this BC type to NOx was almost negligible. The BClg,uncoat was not correlated with NOx emission (r2<0.3), which in turn suggests the coal combustion may not emit significant NOx (Zhao et al., 2013; Wang and Hao, 2012). The BCsm fraction contributed the most in summer (50 %–60 % in number and 40 % in mass) and the second most in winter (30 %–40 % in number and 30 % in mass). These BC particles had smaller core size and thin coatings, and thus they contributed more significantly to the number than the mass. A similar number fraction of the BC was also present in urban London (Liu et al., 2014) and Paris (Laborde et al., 2013) and had also been identified to be dominated by traffic sources.
Table 2Multilinear regression for Eq. (7) among NOx and different BC types.

BCmod showed comparable contribution in both seasons (40 %–50 % in mass or 20 %–25 % in number). The fraction of these particles slightly increased throughout the afternoon for both seasons, and this may partly result from daytime photochemical processing, though this BC type was also significantly associated with primary sources (Sect. 4.4). The BCthick fraction showed no apparent diurnal pattern (note that BCthick mass fraction in summer was minor ∼5 %) and only made a significant contribution at higher pollution levels (Sect. 4.6).
BClg,uncoat contributed a significant mass fraction (30 %–40 % in winter and 40 % in summer) but contributed little to the number (<10 %) because of the large core sizes. The mass fraction of these BC particles had a pronounced night-time peak in winter, consistent with the view that this BC type may be contributed by coal burning (also identified by comparing with the PAH factor in Sect. 4.4), because in the cold season there were significant residential heating activities at night which may use coal as fuel (Chen et al., 2006). This night-time peak in the mass fraction of BClg,uncoat was missing in summer due to lack of these heating activities. Nevertheless, the BClg,uncoat mass fraction remained substantial in summer, comparable with that of the BCsm fraction at around 40 %. This may be because of the coal consumption from the industrial sector that is maintained throughout the year (Fig. S1).
To account for the dilution effect resulting from the development of the PBL, the rBC mass loading was multiplied by the MLH for every half hour throughout the day. The MLH-corrected rBC mass for each BC type is shown in Fig. 11b and provides a way of assessing the influence of BC emissions, although there are uncertainties associated with the MLH determination from ceilometer measurements (Kotthaus and Grimmond, 2018). All BC types showed a peak in the MLH-corrected concentration at night in winter but showed a night-time minimum in summer, which may reflect a generally higher emission during night-time in winter but not in the summer. During the daytime between the hours of 06:00 and 19:00, BCsm mass corrected for the MLH was similar in both seasons, suggesting that BCsm may have comparable emission rates between seasons, consistent with the view that these BC particles may be dominated by the transportation sector (Sect. 4.4). BClg,uncoat had significantly higher (p<0.01) emission at night in winter than in summer by a factor of 2.5, which is also consistent with the higher coal consumption from the residential sector in winter.
4.6 BC at different pollution levels
Given the complexity of the sources contributing to BC in Beijing, the relative primary source contributions and its interaction with other aerosol species may vary with the overall level of pollution, and this in turn may change both the mixing state and the optical properties of BC. Figure 12 shows mass fractions of different BC types at different PM1 level determined by the total mass of AMS + SP2. The traffic-like BCsm (Fig. 12a) was a constant fraction of the total mass at lower pollution levels (when PM1 < 50 µg m−3) that was around 30 % and 40 % in winter and summer respectively. The decreased mass fraction of BCsm at higher pollution levels occurs in both seasons but is particularly marked in winter and matched by an equal and opposite increase in the mass fraction of BCthick under high pollution loadings. The BClg,uncoat fraction (Fig. 12b) was similar in magnitude to the BCsm fraction in summer across all levels of pollution, which means the coal-burning-like BC was almost as important as the traffic source. In winter, the contribution of BClg,uncoat mass was slightly higher than the traffic-like BCsm mass fraction, whereas in summer the BCsm mass was more significant. At the higher pollution levels in winter, some of the BClg,uncoat may be also contributed by coagulation.
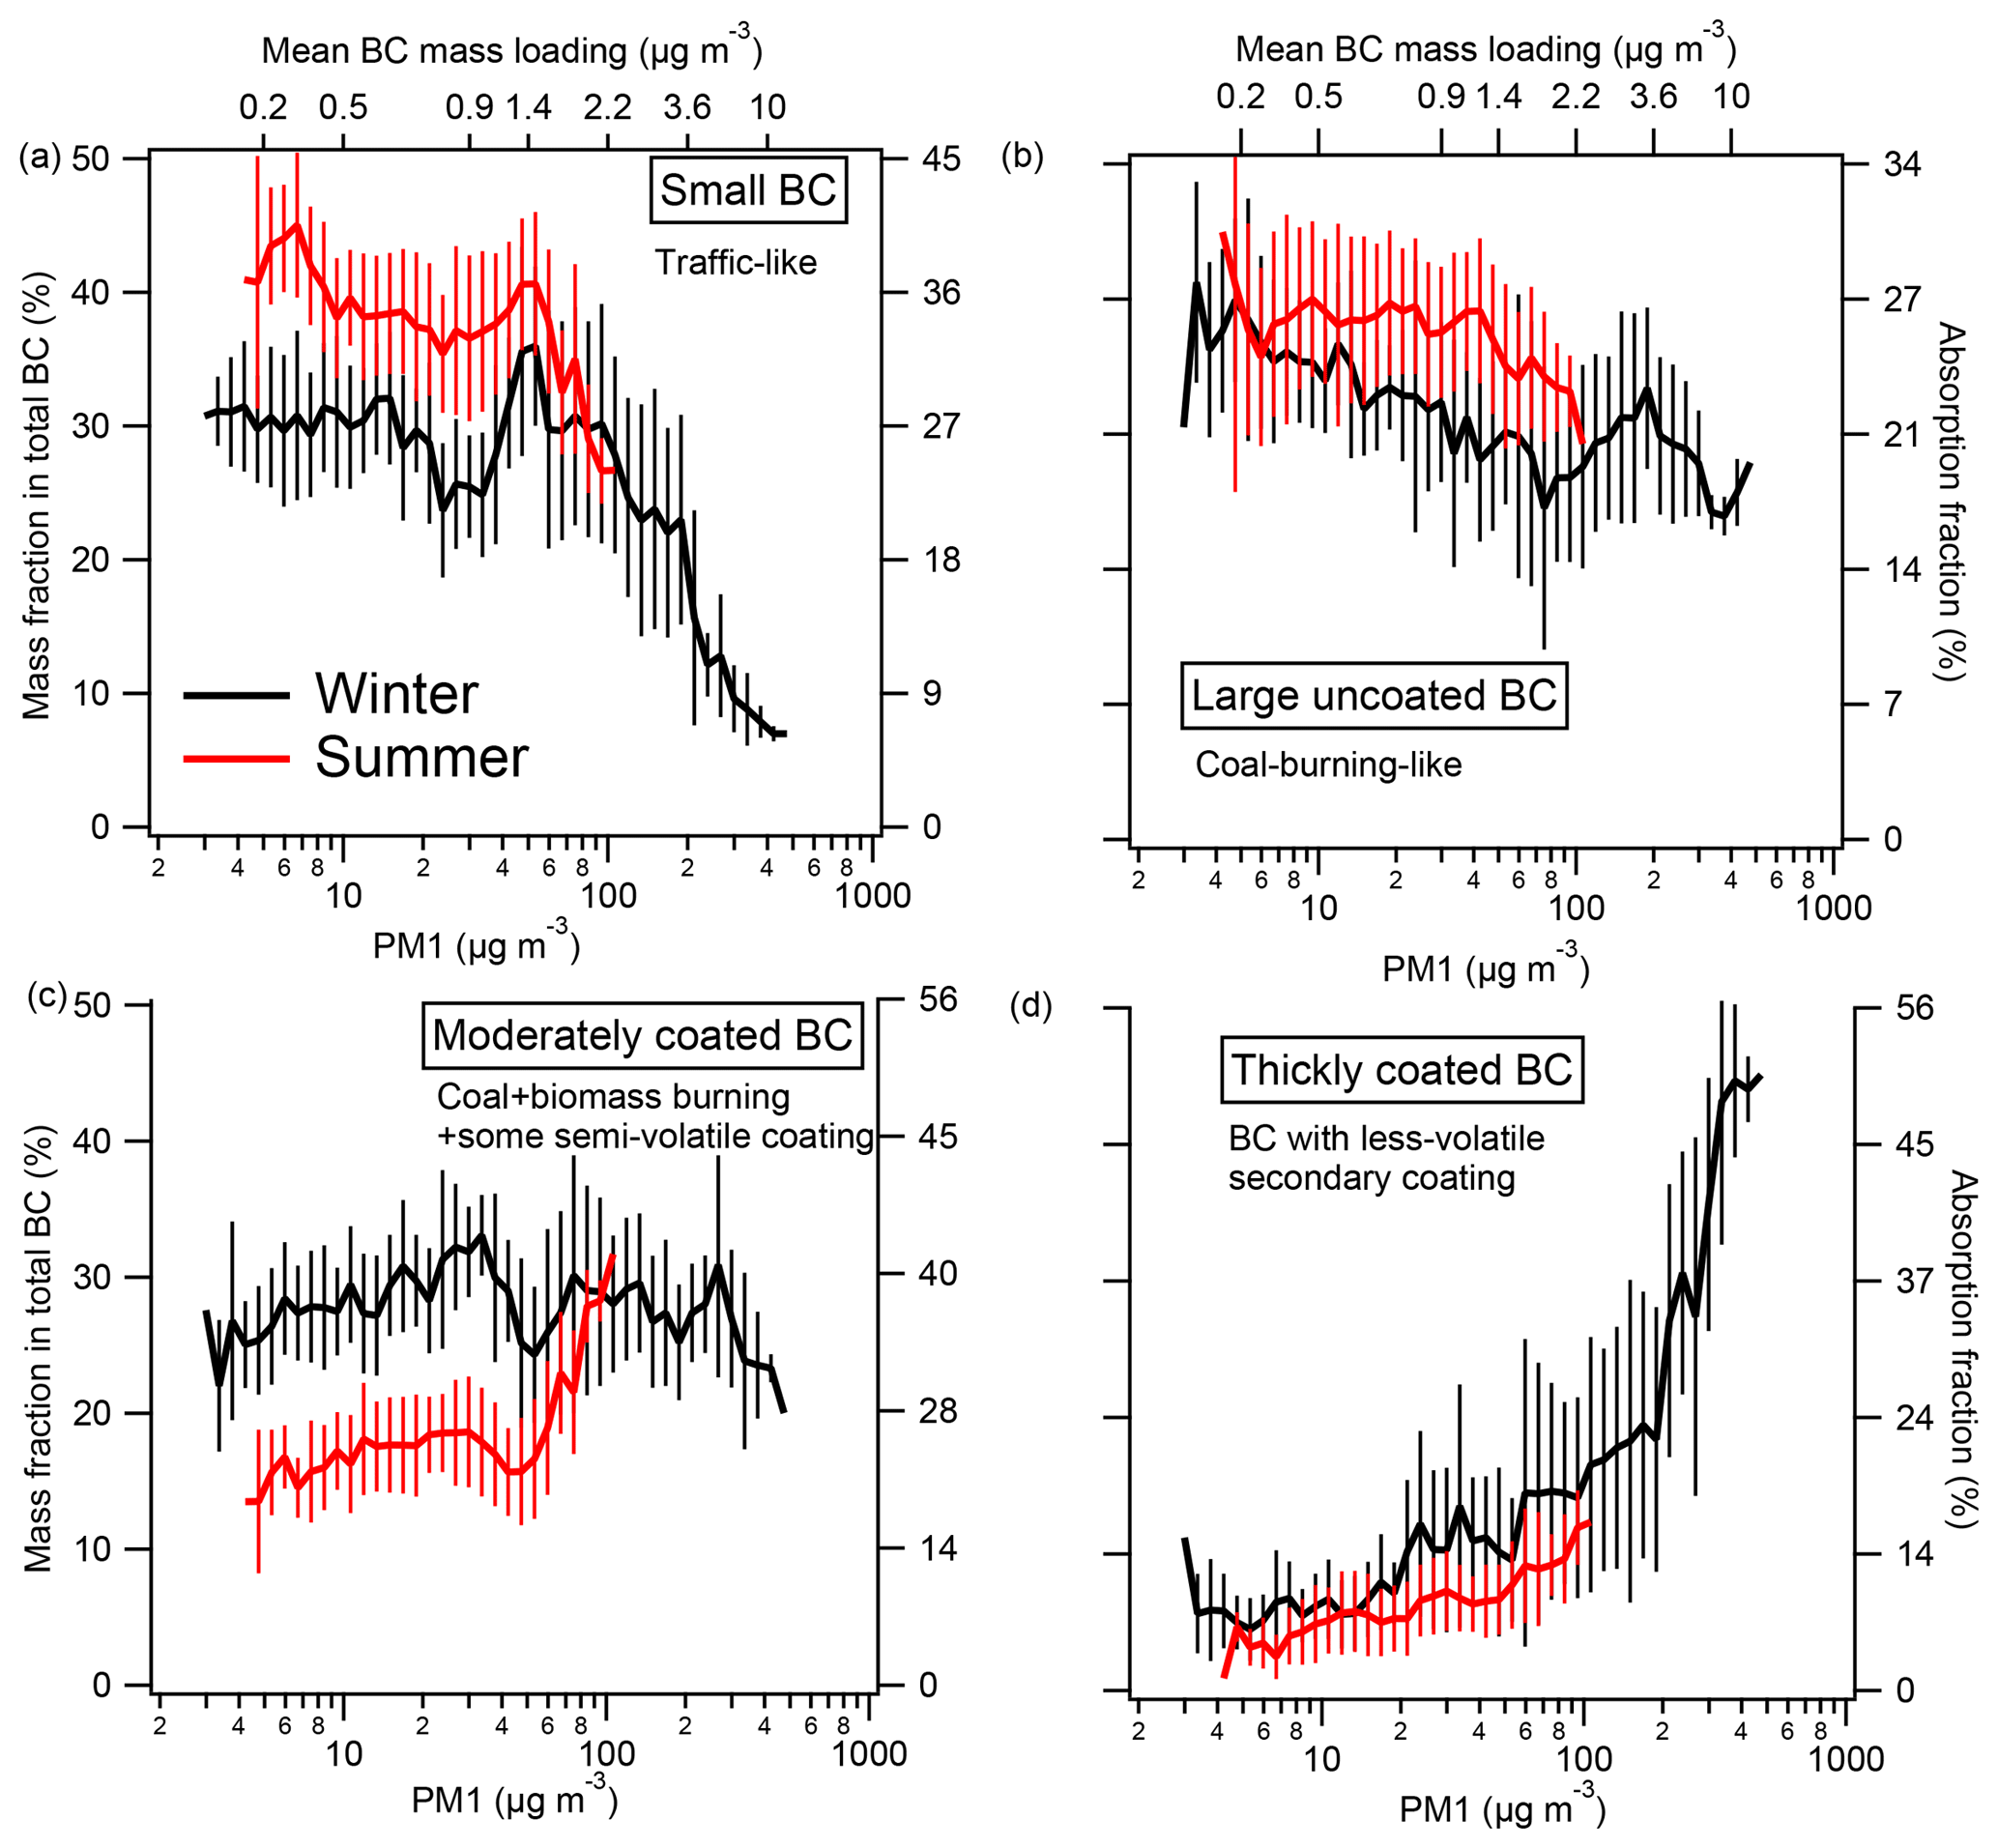
Figure 12The mass (left y axis) contributions of different BC types at different pollution levels during winter and summer. The mean contribution of the absorption corresponding to the mass fraction for each BC type is shown on the right y axis. The mass fraction of each BC type is the average ± standard deviation at each PM1 bin. The top axis shows the averaged rBC mass loading at each PM1 bin, and the right axis indicates the average absorption fraction corresponding with each rBC mass fraction.
The increase in the mass fraction of BCthick at higher pollution levels (Fig. 12d) and the commensurate reduction in the mass fraction of BCsm (Fig. 12a) are very striking, especially when PM1 > 100 µg m−3 with rBC mass loading µg m−3. Under these conditions, BCthick may be up to 50 % of the total rBC mass. The coatings on these BCthick particles were largely contributed by secondary species according to the SP-AMS analysis (Sect. 4.4). In summer, there were no periods of very high pollution in excess of 100 µg m−3 and the BCthick mass fraction was less than 10 %, though the trends in the fraction of BCsm and BCthick with pollution loading are the same in both seasons. This is entirely consistent with coagulation of particulate under very high concentrations. Under such conditions the very high numbers of BCsm may coagulate rapidly with the large numbers of non-BC accumulation mode pollution aerosol that is composed largely of secondary material; this process can happen rapidly at high number concentrations and lead to the small BC particles gaining very think coatings with no change in the core mass distribution (see also Fig. 9). High concentrations of secondary precursor during the higher-pollution episode in the gas phase may lead to nucleation and new particle formation, or size growth on preexisting particles. A further analysis shows high number concentration of particles also corresponded with higher mass concentrations, indicating that the new particle formation and primary emission coincided with particle size growth. These processes will in turn promote the high coatings on BC.
At higher PM1 level in winter, the increased mass fraction of BCthick also led to a decrease in BCmod. However, in summer the BCmod fraction increased when PM1>50 µg m−3; this high-pollution event has previously been shown to be dominated by secondary species (Sun et al., 2015). The higher fraction of BCmod in winter than in summer at the same pollution level may result from greater primary emissions (i.e. more residential coal burning in the cold season) or more condensable semi-volatile species at colder temperatures. The mass contribution of BCmod and BCthick in summer was lower than in winter at the same pollution level, possibly as a result of higher ambient temperatures in summer reducing the amount of semi-volatile material partitioning to the particles.
The contribution of absorption coefficient is calculated based on single-particle information shown in Fig. S4 (note that the coating is assumed to be non-absorbing here). The right axis of Fig. 12 shows the mean contribution of absorption corresponding to the mass fraction for each BC type, implying that different BC types have varying absorption efficiency, but the contribution on absorption is determined by both mass loading and MAC. Figure S5 shows the histogram of occurrence for MAC550 of each BC type during the experimental period: the BCsm and largely uncoated BC had an average MAC550 of about 7.3 and 5.3 m2 g−1 respectively; and BClg,uncoat had a lower MAC because of its larger core size, which is consistent with Mie calculation. The BCmod and BCthick had an average MAC of 11.2 and 12.4 m2 g−1 respectively.
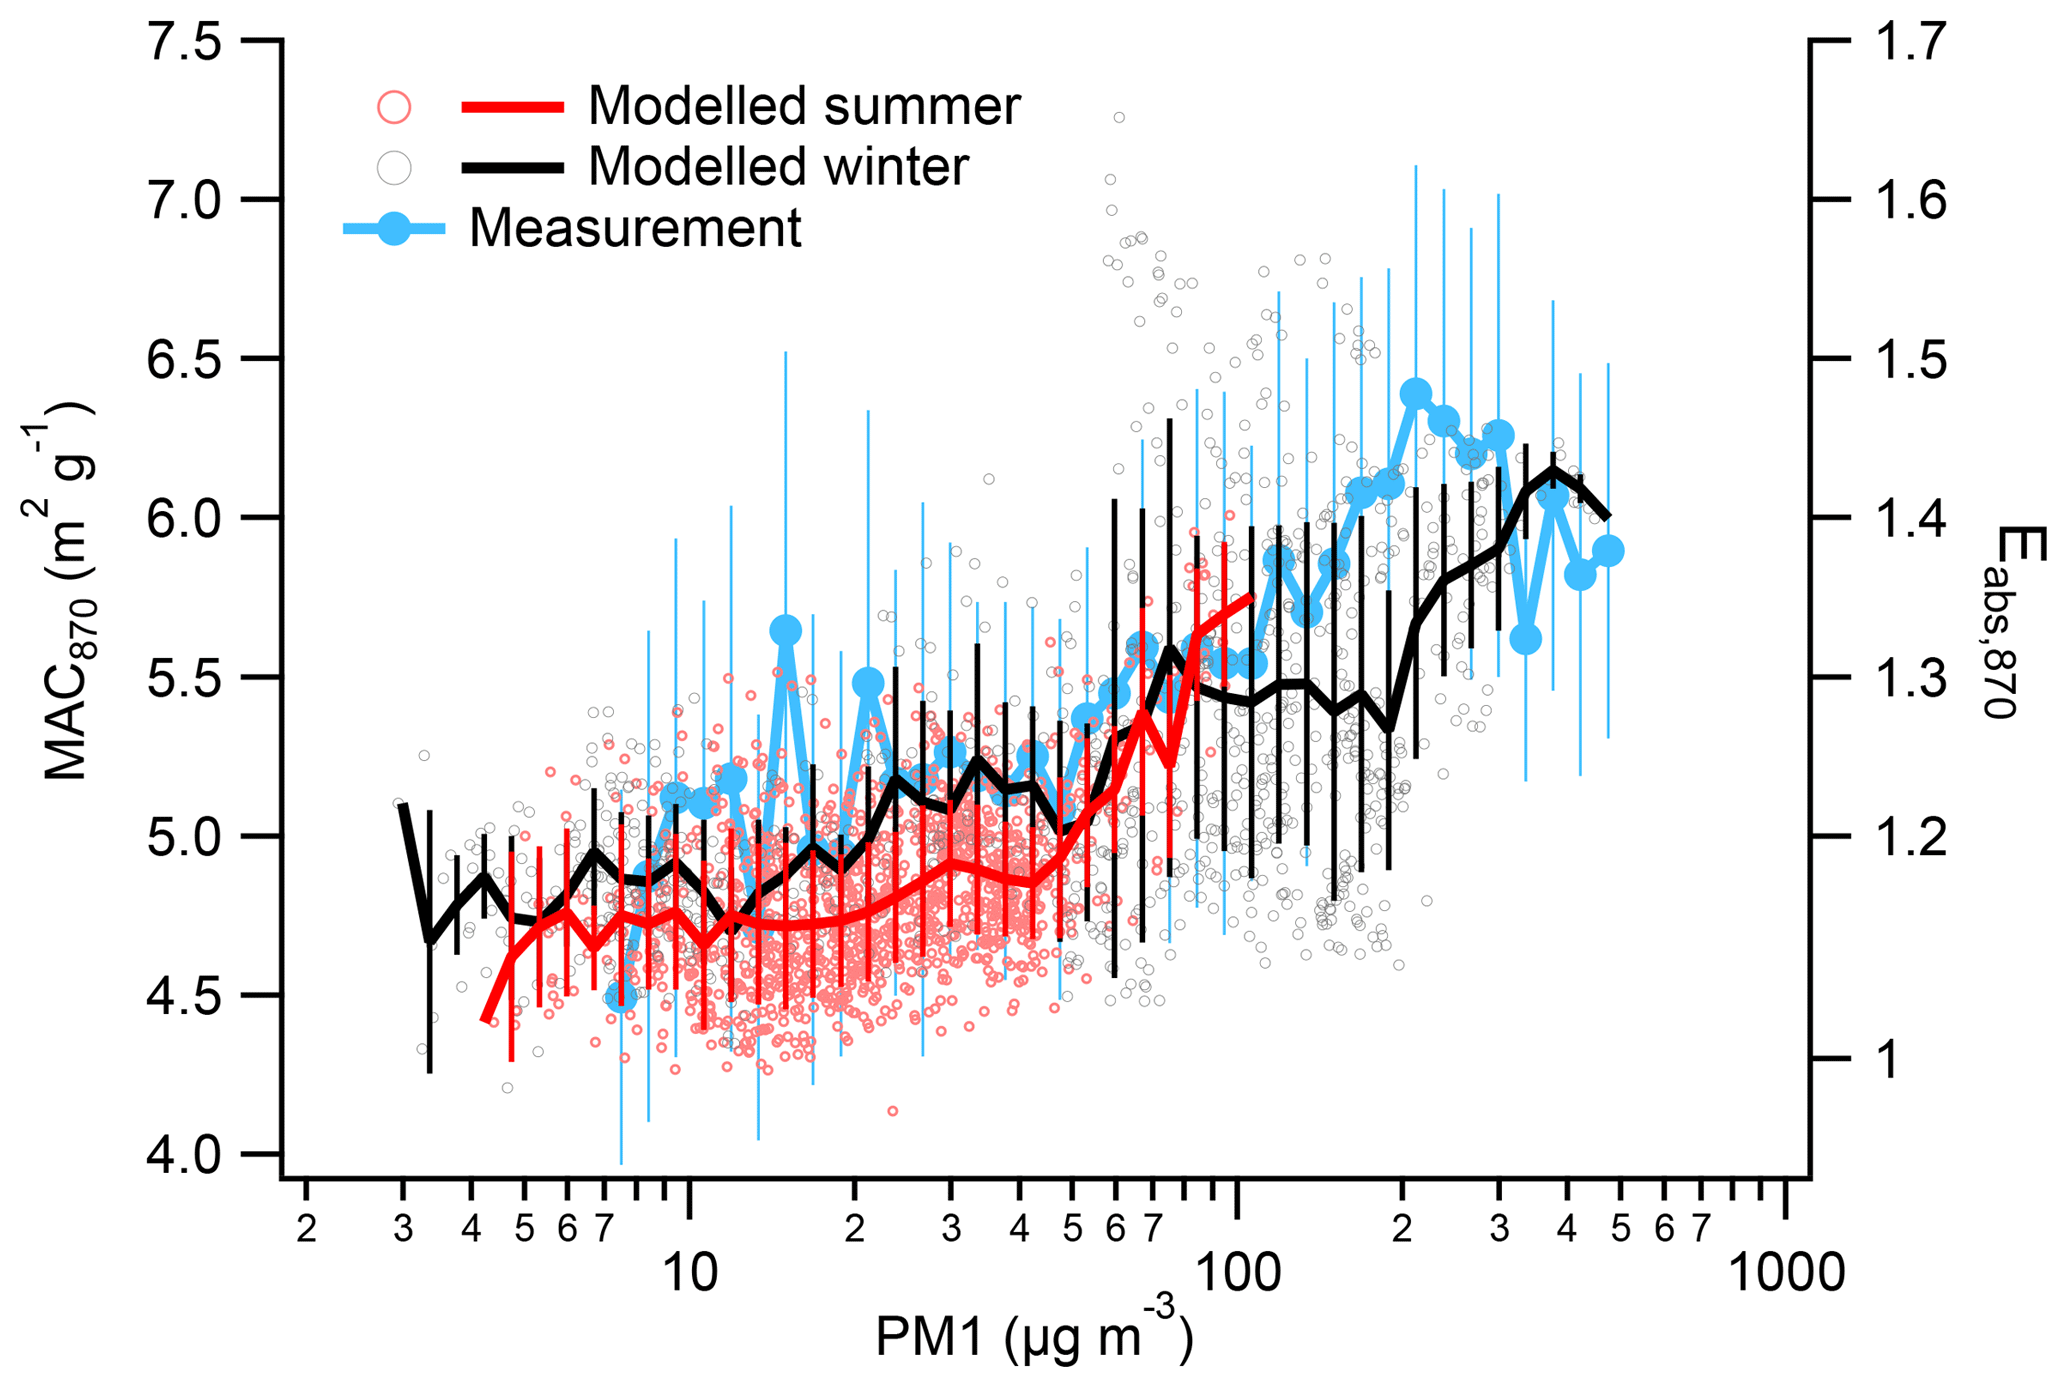
Figure 13 shows both modelled and PAX-measured MAC870 at different pollution levels, the results agree to within 15 %. For both seasons, when PM1<50 µg m−3, the measured absorption efficiency of BC showed little dependence on the concentration of particulate matter with MAC870 4.9±0.4 m2 g−1 and 4.7±0.3 m2 g−1 in winter and summer respectively. The absorption at λ=870 m is deemed to be unaffected by brown carbon (Sun et al., 2007). The MAC870 for uncoated BC was calculated to be 4.3±0.2 m2 g−1 for both seasons, so the enhancement of absorption efficiency (Eabs) is calculated as the modelled MAC870 normalized by this value. Eabs,870 significantly increased at PM1>50 µg m−3 up to 1.4±0.1 and 1.6±0.1 for summer and winter respectively. This increase in absorbing capacity of BC at higher pollution levels implies that both primary emission and secondary processing may both contribute to the coatings and subsequent increased absorption. It also highlights the potential for additional feedback between pollution and radiation under very high pollution loadings (Y. Zhang et al., 2018b). There was a wide variability in MAC or Eabs at PM1 concentrations of between 100 and 200 µg m−3. In addition, the mean PAX-measured MAC870 was higher than the modelled results by 20 % at this pollution level. This suggests complex processes at this moderate pollution level where a large variability of BC coating content was present, but a single mixing scenario based on Mie calculation is not able to fully explain the measurements of absorption. The MAC870 slightly decreased at very high PM1, i.e. >300 µg m−3, and this decrease is more pronounced for measurement (the grey line shows) than Mie-based modelling. This may result from the shadowing effect that very thick coatings may shield incident photons from the core, particularly when the coatings are absorbing (He et al., 2015; X. Zhang et al., 2018).
In order to probe the sources and processes governing atmospheric black carbon in Beijing, measurements were performed in both winter and summer using an SP2, and the core size and coating thickness were examined using the single-particle data. Higher rBC mass loading with more variable coatings was found in winter than in summer. The air mass from the Southern Plateau brought BC with the largest core size and coatings in winter, indicating the appreciable regional influence, whereas in summer the characteristics of BC were relatively independent of air mass direction. In contrast to equivalent measurements in London, where two particle types were observed, corresponding to traffic and wood burning, other types were observed in Beijing, probably reflecting a more complex mixture of sources. rBC number and mass concentrations were quantified according to the following four particle types: small thinly coated BC, moderately coated BC, thickly coated BC and large thinly coated BC. By comparison with other measurements, in particular a factorization of coating materials from the SP-AMS, these were assigned to different soot sources.
The small thinly coated rBC fraction was associated with traffic emissions and made up for 30 % and 40 % of the rBC mass in winter and summer respectively. This particle fraction was strongly associated with NOx, though the implied ratio of 14 ng m−3 ppb−1 was lower than the values of 18–28 ng m−3 ppb−1 reported for London, likely due to differences in the emissions fleet, such as a more widely used gasoline engine in Beijing (Wang et al., 2009). The large thinly coated rBC could be associated with coal combustion and corresponded to around 30 %–40 % and 40 % of the rBC mass in winter and summer respectively.
The moderately coated particle fraction made up 40 %–50 % of the rBC mass and was associated with both emissions and atmospheric processes. As a result, the original source of these particles is currently ambiguous; it is possible that this class has multiple contributions. The thickly coated particle fraction was mainly present during the winter heavy haze events when PM1 was greater than 200 µg m−3 or the rBC mass loading was greater than 4 µg m−3. During these events, these particles made up for around 20 %–45 % of the rBC mass and the coatings could be associated with secondary species, implying that these are rBC particles that have undergone some form of atmospheric processing. Given the thick coatings, it would be expected that these particles would exhibit higher mass absorption and scattering coefficients, higher hygroscopicities (thus high optical thickness in the upper boundary layer) and greater scavenging potential (thus shorter atmospheric lifetime). These large BC particles importantly enhanced the absorption efficiency at high pollution levels, and reduction of emissions of these large BC particles and the precursors of the associated secondary coating will be an effective way of mitigating the heating effect of BC in urban environments.
Processed data are available through the APHH project archive at the Centre for Environmental Data Analysis (http://data.ceda.ac.uk/badc/aphh/data/beijing/, last access: December 2018, CEDA Archive, 2018). Raw data are archived at the University of Manchester and are available on request.
The supplement related to this article is available online at: https://doi.org/10.5194/acp-19-6749-2019-supplement.
DL, JDA and MJF designed the research; JDA, DL, RJ, JW, CY, HC, MJF, CX, JL, FS, XG, YS and PF performed experiments; DL performed the data analysis; JW and XG analysed the SP-AMS data; SK and SG analysed the MLH data; JL and FS analysed the NOx and CO data; DL, JW, JDA and HC wrote the paper.
The authors declare that they have no conflict of interest.
This article is part of the special issue “In-depth study of air pollution sources and processes within Beijing and its surrounding region (APHH-Beijing) (ACP/AMT inter-journal SI)”. It is not associated with a conference.
This work was supported through the UK Natural Environment Research Council (grant refs. NE/N007123/1, NE/N00695X/1 and NE/N00700X/1) and the National Natural Science Foundation of China (41571130024, 41571130034, 21777073).
This research has been supported by the UK Natural Environment Research Council (grant nos. NE/N007123/1, NE/N00695X/1 and NE/N00700X/1) and the National Natural Science Foundation of China (grant nos. 41571130024, 41571130034 and 21777073).
This paper was edited by Frank Keutsch and reviewed by two anonymous referees.
Baumgartner, J., Zhang, Y., Schauer, J. J., Huang, W., Wang, Y., and Ezzati, M.: Highway proximity and black carbon from cookstoves as a risk factor for higher blood pressure in rural China, P. Natl. Acad. Sci. USA, 111, 13229–13234, 2014.
Bernardoni, V., Calzolai, G., Chiari, M., Fedi, M., Lucarelli, F., Nava, S., Piazzalunga, A., Riccobono, F., Taccetti, F., and Valli, G.: Radiocarbon analysis on organic and elemental carbon in aerosol samples and source apportionment at an urban site in Northern Italy, J. Aerosol Sci., 56, 88–99, 2013.
Bohren, C. F. and Huffman, D. R.: Absorption and scattering of light by small particles, John Wiley & Sons, 2008.
Bond, T. C. and Bergstrom, R. W.: Light absorption by carbonaceous particles: An investigative review, Aerosol Sci. Technol., 40, 27–67, 2006.
Bond, T. C., Doherty, S. J., Fahey, D., Forster, P., Berntsen, T., DeAngelo, B., Flanner, M., Ghan, S., Kärcher, B., and Koch, D.: Bounding the role of black carbon in the climate system: A scientific assessment, J. Geophys. Res.-Atmos., 118, 5380–5552, 2013.
Cao, J. J., Wu, F., Chow, J. C., Lee, S. C., Li, Y., Chen, S. W., An, Z. S., Fung, K. K., Watson, J. G., Zhu, C. S., and Liu, S. X.: Characterization and source apportionment of atmospheric organic and elemental carbon during fall and winter of 2003 in Xi'an, China, Atmos. Chem. Phys., 5, 3127–3137, https://doi.org/10.5194/acp-5-3127-2005, 2005.
CEDA Archive: APHH: Atmospheric measurements and model results for the Atmospheric Pollution & Human Health in a Chinese Megacity, available at: http://data.ceda.ac.uk/badc/aphh/data/beijing/, last access: December 2018.
Chen, J., Li, C., Ristovski, Z., Milic, A., Gu, Y., Islam, M. S., Wang, S., Hao, J., Zhang, H., and He, C.: A review of biomass burning: Emissions and impacts on air quality, health and climate in China, Sci. Total Environ., 579, 1000–1034, 2017.
Chen, Y., Zhi, G., Feng, Y., Fu, J., Feng, J., Sheng, G., and Simoneit, B. R.: Measurements of emission factors for primary carbonaceous particles from residential raw-coal combustion in China, Geophys. Res. Lett., 33, L20815, https://doi.org/10.1029/2006GL026966, 2006.
Draxler, R. R. and Hess, G.: An overview of the HYSPLIT_4 modelling system for trajectories, Aust. Meteorol. Mag., 47, 295–308, 1998.
Fierce, L., Bond, T. C., Bauer, S. E., Mena, F., and Riemer, N.: Black carbon absorption at the global scale is affected by particle-scale diversity in composition, Nat. Commun., 7, 12361, https://doi.org/10.1038/ncomms12361, 2016.
Finkelman, R. B. and Tian, L.: The health impacts of coal use in China, Int. Geol. Rev., 60, 579–589, 2018.
Gao, R., Schwarz, J., Kelly, K., Fahey, D., Watts, L., Thompson, T., Spackman, J., Slowik, J., Cross, E., and Han, J.-H.: A novel method for estimating light-scattering properties of soot aerosols using a modified single-particle soot photometer, Aerosol Sci. Tech., 41, 125–135, 2007.
He, C., Liou, K.-N., Takano, Y., Zhang, R., Levy Zamora, M., Yang, P., Li, Q., and Leung, L. R.: Variation of the radiative properties during black carbon aging: theoretical and experimental intercomparison, Atmos. Chem. Phys., 15, 11967–11980, https://doi.org/10.5194/acp-15-11967-2015, 2015.
He, L.-Y., Lin, Y., Huang, X.-F., Guo, S., Xue, L., Su, Q., Hu, M., Luan, S.-J., and Zhang, Y.-H.: Characterization of high-resolution aerosol mass spectra of primary organic aerosol emissions from Chinese cooking and biomass burning, Atmos. Chem. Phys., 10, 11535–11543, https://doi.org/10.5194/acp-10-11535-2010, 2010.
Healy, R. M., Sciare, J., Poulain, L., Kamili, K., Merkel, M., Müller, T., Wiedensohler, A., Eckhardt, S., Stohl, A., Sarda-Estève, R., McGillicuddy, E., O'Connor, I. P., Sodeau, J. R., and Wenger, J. C.: Sources and mixing state of size-resolved elemental carbon particles in a European megacity: Paris, Atmos. Chem. Phys., 12, 1681–1700, https://doi.org/10.5194/acp-12-1681-2012, 2012.
Hodnebrog, Ø., Myhre, G., and Samset, B. H.: How shorter black carbon lifetime alters its climate effect, Nat. Commun., 5, 5065, 2014.
Huang, X. F., Gao, R., Schwarz, J., He, L. Y., Fahey, D., Watts, L., McComiskey, A., Cooper, O., Sun, T. L., and Zeng, L. W.: Black carbon measurements in the Pearl River Delta region of China, J. Geophys. Res.-Atmos., 116, D12208, https://doi.org/10.1029/2010JD014933, 2011.
Jayne, J. T., Leard, D. C., Zhang, X., Davidovits, P., Smith, K. A., Kolb, C. E., and Worsnop, D. R.: Development of an Aerosol Mass Spectrometer for Size and Composition Analysis of Submicron Particles, Aerosol Sci. Technol., 33, 49–70, https://doi.org/10.1016/S0021-8502(98)00158-X, 2000.
Kopp, R. E. and Mauzerall, D. L.: Assessing the climatic benefits of black carbon mitigation, P. Natl. Acad. Sci. USA, 107, 11703–11708, 2010.
Kotthaus, S. and Grimmond, C. S. B.: Atmospheric Boundary Layer Characteristics from Ceilometer Measurements Part 1: A new method to track mixed layer height and classify clouds, Q. J. Roy. Meteorol. Soc.,144, 714, https://doi.org/10.1002/qj.3299, 2018.
Laborde, M., Schnaiter, M., Linke, C., Saathoff, H., Naumann, K.-H., Möhler, O., Berlenz, S., Wagner, U., Taylor, J. W., Liu, D., Flynn, M., Allan, J. D., Coe, H., Heimerl, K., Dahlkötter, F., Weinzierl, B., Wollny, A. G., Zanatta, M., Cozic, J., Laj, P., Hitzenberger, R., Schwarz, J. P., and Gysel, M.: Single Particle Soot Photometer intercomparison at the AIDA chamber, Atmos. Meas. Tech., 5, 3077–3097, https://doi.org/10.5194/amt-5-3077-2012, 2012.
Laborde, M., Crippa, M., Tritscher, T., Jurányi, Z., Decarlo, P. F., Temime-Roussel, B., Marchand, N., Eckhardt, S., Stohl, A., Baltensperger, U., Prévôt, A. S. H., Weingartner, E., and Gysel, M.: Black carbon physical properties and mixing state in the European megacity Paris, Atmos. Chem. Phys., 13, 5831–5856, https://doi.org/10.5194/acp-13-5831-2013, 2013.
Li, B., Gasser, T., Ciais, P., Piao, S., Tao, S., Balkanski, Y., Hauglustaine, D., Boisier, J.-P., Chen, Z., and Huang, M.: The contribution of China's emissions to global climate forcing, Nature, 531, 357–361, 2016.
Li, M., Zhang, Q., Kurokawa, J.-I., Woo, J.-H., He, K., Lu, Z., Ohara, T., Song, Y., Streets, D. G., Carmichael, G. R., Cheng, Y., Hong, C., Huo, H., Jiang, X., Kang, S., Liu, F., Su, H., and Zheng, B.: MIX: a mosaic Asian anthropogenic emission inventory under the international collaboration framework of the MICS-Asia and HTAP, Atmos. Chem. Phys., 17, 935–963, https://doi.org/10.5194/acp-17-935-2017, 2017.
Liu, D., Flynn, M., Gysel, M., Targino, A., Crawford, I., Bower, K., Choularton, T., Jurányi, Z., Steinbacher, M., Hüglin, C., Curtius, J., Kampus, M., Petzold, A., Weingartner, E., Baltensperger, U., and Coe, H.: Single particle characterization of black carbon aerosols at a tropospheric alpine site in Switzerland, Atmos. Chem. Phys., 10, 7389–7407, https://doi.org/10.5194/acp-10-7389-2010, 2010.
Liu, D., Allan, J., Corris, B., Flynn, M., Andrews, E., Ogren, J., Beswick, K., Bower, K., Burgess, R., Choularton, T., Dorsey, J., Morgan, W., Williams, P. I., and Coe, H.: Carbonaceous aerosols contributed by traffic and solid fuel burning at a polluted rural site in Northwestern England, Atmos. Chem. Phys., 11, 1603–1619, https://doi.org/10.5194/acp-11-1603-2011, 2011.
Liu, D., Li, J., Zhang, Y., Xu, Y., Liu, X., Ding, P., Shen, C., Chen, Y., Tian, C., and Zhang, G.: The use of levoglucosan and radiocarbon for source apportionment of PM2.5 carbonaceous aerosols at a background site in East China, Environ. Sci. Technol., 47, 10454–10461, 2013.
Liu, D., Allan, J. D., Young, D. E., Coe, H., Beddows, D., Fleming, Z. L., Flynn, M. J., Gallagher, M. W., Harrison, R. M., Lee, J., Prevot, A. S. H., Taylor, J. W., Yin, J., Williams, P. I., and Zotter, P.: Size distribution, mixing state and source apportionment of black carbon aerosol in London during wintertime, Atmos. Chem. Phys., 14, 10061–10084, https://doi.org/10.5194/acp-14-10061-2014, 2014.
Liu, D., Taylor, J. W., Young, D. E., Flynn, M. J., Coe, H., and Allan, J. D.: The effect of complex black carbon microphysics on the determination of the optical properties of brown carbon, Geophys. Res. Lett., 42, 613–619, 2015.
Liu, D., Whitehead, J., Alfarra, M. R., Reyes-Villegas, E., Spracklen, D. V., Reddington, C. L., Kong, S., Williams, P. I., Ting, Y.-C., Haslett, S., Taylor, J. W., Flynn, M. J., Morgan, W. T., McFiggans, G., Coe, H., and Allan, J. D.: Black-carbon absorption enhancement in the atmosphere determined by particle mixing state, Nat. Geosci., 10, 184–188, https://doi.org/10.1038/ngeo2901, 2017.
Liu, D., Taylor, J. W., Crosier, J., Marsden, N., Bower, K. N., Lloyd, G., Ryder, C. L., Brooke, J. K., Cotton, R., Marenco, F., Blyth, A., Cui, Z., Estelles, V., Gallagher, M., Coe, H., and Choularton, T. W.: Aircraft and ground measurements of dust aerosols over the west African coast in summer 2015 during ICE-D and AER-D, Atmos. Chem. Phys., 18, 3817–3838, https://doi.org/10.5194/acp-18-3817-2018, 2018.
McMeeking, G. R., Hamburger, T., Liu, D., Flynn, M., Morgan, W. T., Northway, M., Highwood, E. J., Krejci, R., Allan, J. D., Minikin, A., and Coe, H.: Black carbon measurements in the boundary layer over western and northern Europe, Atmos. Chem. Phys., 10, 9393–9414, https://doi.org/10.5194/acp-10-9393-2010, 2010.
Moteki, N., Kondo, Y., and Nakamura, S.-I.: Method to measure refractive indices of small nonspherical particles: Application to black carbon particles, J. Aerosol Sci., 41, 513–521, 2010.
Onasch, T., Trimborn, A., Fortner, E., Jayne, J., Kok, G., Williams, L., Davidovits, P., and Worsnop, D.: Soot particle aerosol mass spectrometer: development, validation, and initial application, Aerosol Sci. Technol., 46, 804–817, 2012a.
Onasch, T. B., Trimborn, A., Fortner, E. C., Jayne, J. T., Kok, G. L., Williams, L. R., Davidovits, P., and Worsnop, D. R.: Soot particle aerosol mass spectrometer: Development, validation, and initial application, Aerosol Sci. Technol., 46, 804–817, https://doi.org/10.1080/02786826.2012.663948, 2012b.
Paatero, P. and Tapper, U.: Positive matrix factorization: A non-negative factor model with optimal utilization of error estimates of data values, Environmetrics, 5, 111–126, https://doi.org/10.1002/env.3170050203, 1994.
Pratsinis, S. E.: Simultaneous nucleation, condensation, and coagulation in aerosol reactors, J. Colloid Interf. Sci., 124, 416–427, 1988.
Puxbaum, H., Caseiro, A., Sánchez-Ochoa, A., Kasper-Giebl, A., Claeys, M., Gelencsér, A., Legrand, M., Preunkert, S., and Pio, C.: Levoglucosan levels at background sites in Europe for assessing the impact of biomass combustion on the European aerosol background, J. Geophys. Res.-Atmos., 112, D23S05, https://doi.org/10.1029/2006jd008114, 2007.
Ramanathan, V. and Carmichael, G.: Global and regional climate changes due to black carbon, Nat. Geosci., 1, 221–227, 2008.
Riemer, N., West, M., Zaveri, R. A., and Easter, R. C.: Simulating the evolution of soot mixing state with a particle-resolved aerosol model, J. Geophys. Res.-Atmos., 114, D09202, https://doi.org/10.1029/2008JD011073, 2009.
Sandradewi, J., Prévôt, A. S., Szidat, S., Perron, N., Alfarra, M. R., Lanz, V. A., Weingartner, E., and Baltensperger, U.: Using aerosol light absorption measurements for the quantitative determination of wood burning and traffic emission contributions to particulate matter, Environ. Sci. Technol., 42, 3316–3323, 2008.
Schwarz, J., Gao, R., Spackman, J., Watts, L., Thomson, D., Fahey, D., Ryerson, T., Peischl, J., Holloway, J., and Trainer, M.: Measurement of the mixing state, mass, and optical size of individual black carbon particles in urban and biomass burning emissions, Geophys. Res. Lett., 35, L13810, https://doi.org/10.1029/2008GL033968, 2008.
Selimovic, V., Yokelson, R. J., Warneke, C., Roberts, J. M., de Gouw, J., Reardon, J., and Griffith, D. W. T.: Aerosol optical properties and trace gas emissions by PAX and OP-FTIR for laboratory-simulated western US wildfires during FIREX, Atmos. Chem. Phys., 18, 2929–2948, https://doi.org/10.5194/acp-18-2929-2018, 2018.
Sun, H., Biedermann, L., and Bond, T. C.: Color of brown carbon: A model for ultraviolet and visible light absorption by organic carbon aerosol, Geophys. Res. Lett., 34, L17813, https://doi.org/10.1029/2007GL029797, 2007.
Sun, Y. L., Wang, Z. F., Du, W., Zhang, Q., Wang, Q. Q., Fu, P. Q., Pan, X. L., Li, J., Jayne, J., and Worsnop, D. R.: Long-term real-time measurements of aerosol particle composition in Beijing, China: seasonal variations, meteorological effects, and source analysis, Atmos. Chem. Phys., 15, 10149–10165, https://doi.org/10.5194/acp-15-10149-2015, 2015.
Sun, Y., Du, W., Fu, P., Wang, Q., Li, J., Ge, X., Zhang, Q., Zhu, C., Ren, L., Xu, W., Zhao, J., Han, T., Worsnop, D. R., and Wang, Z.: Primary and secondary aerosols in Beijing in winter: sources, variations and processes, Atmos. Chem. Phys., 16, 8309–8329, https://doi.org/10.5194/acp-16-8309-2016, 2016a.
Sun, Y., Wang, Z., Wild, O., Xu, W., Chen, C., Fu, P., Du, W., Zhou, L., Zhang, Q., Han, T., Wang, Q., Pan, X., Zheng, H., Li, J., Guo, X., Liu, J., and Worsnop, D. R.: “APEC Blue”: Secondary Aerosol Reductions from Emission Controls in Beijing, Sci. Rep, 6, 20668, https://doi.org/10.1038/srep20668, 2016b.
Tao, M., Chen, L., Su, L., and Tao, J.: Satellite observation of regional haze pollution over the North China Plain, J. Geophys. Res.-Atmos., 117, D12203, https://doi.org/10.1029/2012jd017915, 2012.
Taylor, J. W., Allan, J. D., Liu, D., Flynn, M., Weber, R., Zhang, X., Lefer, B. L., Grossberg, N., Flynn, J., and Coe, H.: Assessment of the sensitivity of core/shell parameters derived using the single-particle soot photometer to density and refractive index, Atmos. Meas. Tech., 8, 1701–1718, https://doi.org/10.5194/amt-8-1701-2015, 2015.
Viana, M., Kuhlbusch, T., Querol, X., Alastuey, A., Harrison, R., Hopke, P., Winiwarter, W., Vallius, M., Szidat, S., and Prevot, A.: Source apportionment of particulate matter in Europe: a review of methods and results, J. Aerosol Sci., 39, 827–849, 2008.
Wang, J., Zhang, Q., Chen, M., Collier, S., Zhou, S., Ge, X., Xu, J., Shi, J., Xie, C., Hu, J., Ge, S., Sun, Y., and Coe, H.: First Chemical Characterization of Refractory Black Carbon Aerosols and Associated Coatings over the Tibetan Plateau (4730 m a.s.l), Environ. Sci. Technol., 51, 14072–14082, https://doi.org/10.1021/acs.est.7b03973, 2017.
Wang, J., Liu, D., Ge, X., Wu, Y., Shen, F., Chen, M., Zhao, J., Xie, C., Wang, Q., Xu, W., Zhang, J., Hu, J., Allan, J., Joshi, R., Fu, P., Coe, H., and Sun, Y.: Characterization of black carbon-containing fine particles in Beijing during wintertime, Atmos. Chem. Phys., 19, 447–458, https://doi.org/10.5194/acp-19-447-2019, 2019.
Wang, Q., Huang, R. J., Cao, J., Han, Y., Wang, G., Li, G., Wang, Y., Dai, W., Zhang, R., and Zhou, Y.: Mixing State of Black Carbon Aerosol in a Heavily Polluted Urban Area of China: Implications for Light Absorption Enhancement, Aerosol Sci. Tech., 48, 689–697, https://doi.org/10.1080/02786826.2014.917758, 2014.
Wang, Q., Huang, R. J., Zhao, Z., Cao, J., Ni, H., Tie, X., Zhao, S., Su, X., Han, Y., and Shen, Z.: Physicochemical characteristics of black carbon aerosol and its radiative impact in a polluted urban area of China, J. Geophys. Res.-Atmos., 121, 12505–12519, https://doi.org/10.1002/2016JD024748, 2016.
Wang, S. and Hao, J.: Air quality management in China: Issues, challenges, and options, J. Environ. Sci., 24, 2–13, 2012.
Wang, X., Westerdahl, D., Chen, L. C., Wu, Y., Hao, J., Pan, X., Guo, X., and Zhang, K. M.: Evaluating the air quality impacts of the 2008 Beijing Olympic Games: On-road emission factors and black carbon profiles, Atmos. Environ., 43, 4535–4543, 2009.
Wu, Y., Cheng, T., Liu, D., Allan, J. D., Zheng, L., and Chen, H.: Light Absorption Enhancement of Black Carbon Aerosol Constrained by Particle Morphology, Environ. Sci. Technol., 52, 6912–6919, https://doi.org/10.1021/acs.est.8b00636, 2018.
Xu, S., Liu, W., and Tao, S.: Emission of polycyclic aromatic hydrocarbons in China, Environ. Sci. Technol., 40, 702–708, 2006.
Xu, X., Gao, J., Gao, J., and Chen, Y.: Air pollution and daily mortality in residential areas of Beijing, China, Arch. Environ. Health: An Int. J., 49, 216–222, 1994.
Yan, C., Zheng, M., Sullivan, A. P., Shen, G., Chen, Y., Wang, S., Zhao, B., Cai, S., Desyaterik, Y., and Li, X.: Residential Coal Combustion as a Source of Levoglucosan in China, Environ. Sci. Technol., 52, 1665–1674, 2018.
Yang, J., McBride, J., Zhou, J., and Sun, Z.: The urban forest in Beijing and its role in air pollution reduction, Urban Forest. Urban Green., 3, 65–78, 2005.
Yang, Y., Xu, X., Zhang, Y., Zheng, S., Wang, L., Liu, D., Gustave, W., Jiang, L., Hua, Y., Du, S., and Tang, L.: Seasonal size distribution and mixing state of black carbon aerosols in a polluted urban environment of the Yangtze River Delta region, China, Sci. Total Environ., 654, 300–310, https://doi.org/10.1016/j.scitotenv.2018.11.087, 2018.
Zhang, Q., Quan, J., Tie, X., Li, X., Liu, Q., Gao, Y., and Zhao, D.: Effects of meteorology and secondary particle formation on visibility during heavy haze events in Beijing, China, Sci. Total Environ., 502, 578–584, 2015.
Zhang, R., Jing, J., Tao, J., Hsu, S.-C., Wang, G., Cao, J., Lee, C. S. L., Zhu, L., Chen, Z., Zhao, Y., and Shen, Z.: Chemical characterization and source apportionment of PM2.5 in Beijing: seasonal perspective, Atmos. Chem. Phys., 13, 7053–7074, https://doi.org/10.5194/acp-13-7053-2013, 2013.
Zhang, X., Mao, M., Yin, Y., and Wang, B.: Numerical Investigation on Absorption Enhancement of Black Carbon Aerosols Partially Coated With Nonabsorbing Organics, J. Geophys. Res.-Atmos., 123, 1297–1308, https://doi.org/10.1002/2017jd027833, 2018.
Zhang, Y. L., Perron, N., Ciobanu, V. G., Zotter, P., Minguillón, M. C., Wacker, L., Prévôt, A. S. H., Baltensperger, U., and Szidat, S.: On the isolation of OC and EC and the optimal strategy of radiocarbon-based source apportionment of carbonaceous aerosols, Atmos. Chem. Phys., 12, 10841–10856, https://doi.org/10.5194/acp-12-10841-2012, 2012.
Zhang, Y., Ren, H., Sun, Y., Cao, F., Chang, Y., Liu, S., Lee, X., Agrios, K., Kawamura, K., Liu, D., Ren, L., Du, W., Wang, Z., Prevot, A. S. H., Szidat, S., and Fu, P.: High Contribution of Nonfossil Sources to Submicrometer Organic Aerosols in Beijing, China, Environ. Sci. Technol., 51, 7842–7852, https://doi.org/10.1021/acs.est.7b01517, 2017.
Zhang, Y., Yuan, Q., Huang, D., Kong, S., Zhang, J., Wang, X., Lu, C., Shi, Z., Zhang, X., and Sun, Y.: Direct observations of fine primary particles from residential coal burning: insights into their morphology, composition, and hygroscopicity, J. Geophys. Res.-Atmos., 123, 12964–12979, 2018a.
Zhang, Y., Zhang, Q., Cheng, Y., Su, H., Li, H., Li, M., Zhang, X., Ding, A., and He, K.: Amplification of light absorption of black carbon associated with air pollution, Atmos. Chem. Phys., 18, 9879–9896, https://doi.org/10.5194/acp-18-9879-2018, 2018b.
Zhao, B., Wang, S., Wang, J., Fu, J. S., Liu, T., Xu, J., Fu, X., and Hao, J.: Impact of national NOx and SO2 control policies on particulate matter pollution in China, Atmos. Environ., 77, 453–463, 2013.
Zotter, P., Herich, H., Gysel, M., El-Haddad, I., Zhang, Y., Mocnik, G., Hüglin, C., Baltensperger, U., Szidat, S., and Prévôt, A. S. H.: Evaluation of the absorption Ångström exponents for traffic and wood burning in the Aethalometer-based source apportionment using radiocarbon measurements of ambient aerosol, Atmos. Chem. Phys., 17, 4229–4249, https://doi.org/10.5194/acp-17-4229-2017, 2017.