the Creative Commons Attribution 4.0 License.
the Creative Commons Attribution 4.0 License.
 | 17 May 2019
High-time-resolution source apportionment of PM2.5 in Beijing with multiple models
Yue Liu
Mei Zheng
Mingyuan Yu
Xuhui Cai
Huiyun Du
Jie Li
Tian Zhou
Caiqing Yan
Xuesong Wang
Zongbo Shi
Roy M. Harrison
Qiang Zhang
Kebin He
Beijing has suffered from heavy local emissions as well as regional transport of air pollutants, resulting in severe atmospheric fine-particle (PM2.5) pollution. This study developed a combined method to investigate source types of PM2.5 and its source regions during winter 2016 in Beijing, which include the receptor model (positive matrix factorization, PMF), footprint and an air quality model. The PMF model was performed with high-time-resolution measurements of trace elements, water soluble ions, organic carbon and elemental carbon using online instruments during the wintertime campaign of the Air Pollution and Human Health in a Chinese Megacity – Beijing (APHH-Beijing) program in 2016. Source types and their contributions estimated by PMF model using online measurements were linked with source regions identified by the footprint model, and the regional transport contribution was estimated by an air quality model (the Nested Air Quality Prediction Model System, NAQPMS) to analyze the specific sources and source regions during haze episodes. Our results show that secondary and biomass-burning sources were dominated by regional transport, while the coal combustion source increased with local contribution, suggesting that strict control strategies for local coal combustion in Beijing and a reduction of biomass-burning and gaseous precursor emissions in surrounding areas were essential to improve air quality in Beijing. The combination of PMF with footprint results revealed that secondary sources were mainly associated with southern footprints (53 %). The northern footprint was characterized by a high dust source contribution (11 %), while industrial sources increased with the eastern footprint (10 %). The results demonstrated the power of combining receptor model-based source apportionment with other models in understanding the formation of haze episodes and identifying specific sources from different source regions affecting air quality in Beijing.
- Article
(3098 KB) - Full-text XML
-
Supplement
(1567 KB) - BibTeX
- EndNote


Presently, haze in China has the characteristics of high frequency and long duration on a regional scale and has influenced public life and human health (Xie et al., 2016). High concentrations of fine particulates, which can significantly reduce atmospheric visibility, are one of the main factors in the formation of haze episodes (Y. Sun et al., 2016; Watson et al., 2002; Yang et al., 2015). Previous studies have found that PM2.5 can be emitted from various sources, including residential coal combustion, biomass burning, traffic-related sources, industrial sources and dust (Gao et al., 2016; Kotchenruther et al., 2016; Taghvaee et al., 2018; Watson et al., 2001; Zong et al., 2016). Therefore, it is important to have a better understanding of the major source types and their contribution to PM2.5 in order to formulate effective science-based policies and regulations.
As the capital of China, Beijing has suffered from heavy emissions from various sources, resulting in severe PM2.5 pollution (D. Li et al., 2017; Lv et al., 2016). The source apportionment of PM2.5 in Beijing has received great attention in recent years, which is mostly based on receptor models (Gao et al., 2016; Y. Li et al., 2017; Lv et al., 2016; Song et al., 2006; Yang et al., 2016). Receptor models, including the chemical mass balance model (CMB) and positive matrix factorization model (PMF), are the most commonly used methods of source apportionment in China and are implemented by application of mathematical methods to measurements of chemical composition of fine particles at receptor sites (Cooper et al., 1980; Gao et al., 2016; Lv et al., 2016; Zheng et al., 2005). The receptor model can identify and quantify the contribution of multiple source types based on in situ measurements and specific source tracers. Gao et al. (2016) employed two receptor models, PMF and Multilinear Engine 2 (ME2), to conduct a high-time-resolution source apportionment of PM2.5 in summer in Beijing. The results showed that PMF and ME2 corresponded well with each other, and a secondary sources were predominant in Beijing (38 %–39 %). Similar source apportionment results were reported by in Peng et al. (2016) with secondary sources contributing 35 %–40 %. Y. Sun et al. (2016) used online instruments and PMF to investigate the rapid evolution of a severe haze episode in winter in Beijing and showed the variation of chemical components during four stages of haze. By conducting receptor models based on high-time-resolution online measurements, the source types and source contributions in Beijing have been analyzed in previous studies (Gao et al., 2016; Peng et al., 2016; Song et al., 2006). However, these studies still have limitations in that source apportionment based on receptor models are only restricted to one or several receptor sites without information about detailed source regions or the local and regional source contributions.
Previous studies have indicated that PM2.5 pollution in Beijing has been significantly influenced by regional transport and meteorological conditions (Han et al., 2015; D. Li et al., 2017; Zhao et al., 2013). With the development of the function of source apportionment in air quality models, source regions and relative contributions to the receptor site can be qualitatively estimated, based on emission inventory of pollution sources and meteorological fields (Burr et al., 2011; Kwok et al., 2013; Zhang et al., 2015). Li et al. (2016) found that regional transport highly contributed to the rapid increase stage of PM2.5, with the transport height ranging from 200 to 700 m above ground level with application of the Nested Air Quality Prediction Model System (NAQPMS). Han and Zhang (2018) used a regional air quality modeling system coupling with ISAM (integrated source apportionment method) and found that air pollutants derived from Hebei and Shandong provinces were major contributors to PM2.5 in Beijing, with contributions up to 25 % and 10 %, respectively. The air quality model has advantages of analyzing spatial distribution and regional transport of pollutants, but it also has large uncertainties due to the emission inventory, boundary layer meteorological processes and complex atmospheric chemical processes.
Due to the importance of the regional transport contribution to PM2.5 in Beijing, the limitations of receptor models cannot be ignored. The source types and source contribution derived from receptor models can be combined with the contribution and direction of regional transport derived from chemical transport models. In this study, we employed the receptor model (PMF), the air quality model (NAQPMS) and a footprint model simultaneously based on high-time-resolution online measurement data to investigate sources and regional transport of PM2.5 in Beijing during November to December in 2016, as part of the Air Pollution and Human Health in a Chinese Megacity (APHH) campaign. The goal of the study is to link the contribution of different sources by PMF with the source regions by footprint and the regional transport contribution by NAQPMS. The combination of multiple models gives greater power to identify specific sources and source regions.
2.1 Online measurements of PM2.5
Online sampling of PM2.5 was conducted from November to December 2016 in winter, which was within the heating period of Beijing. The sampler was operated at the Peking University monitoring site (PKU, 39∘59′21′′ N, 116∘18′25′′ E) in the northwestern part of Beijing city. There are no obvious emission sources locally, except two major roads (150 m to the east and 200 m to the south). Situated in a mixed district of teaching, residential and commercial areas, the sampling site is representative of the Beijing urban area (Liu et al., 2018; Yan et al., 2015). The sampling site is located on the sixth floor of a teaching building within PKU. The inlet of the instrument is about 20 m above the ground.
Online PM2.5 mass concentrations were continuously measured using a tapered element oscillating microbalance (TEOM 1405F, Thermo Fisher Scientific Inc.). Organic carbon (OC) and elemental carbon (EC) were simultaneously monitored by a semi-continuous OCEC carbon aerosol analyzer (Sunset Laboratory Inc.) with 1 h time resolution. The Sunset OC/EC analyzer uses a modified NIOSH 5040 thermal–optical protocol as its default protocol, which produces a relatively reliable determination of OC, EC and the OCEC split (Bauer et al., 2009). More detailed information can be found in Bauer et al. (2009).
An in situ Gas and Aerosol Compositions monitor (IGAC, Model S-611, Fortelice International Co. Ltd.), which collects both gases and particles simultaneously, was applied to measure water-soluble ions online with 1 h time resolution in this study. A detailed description of IGAC can be found in Young et al. (2016). Briefly, IGAC was composed of three major units, including a wet annular denuder (WAD), to collect gases into aqueous solution, a scrub and impact aerosol collector (SCI) to collect particles into solution and a sample analysis unit comprised of two ion chromatographs (DionexICS-1000) for analyzing anions and cations (IC). Ambient air was drawn through a PM10 inlet followed by a PM2.5 cyclone at a flow rate of 16.7 L min−1, and then gases and PM2.5 were separately collected by WAD and SCI. Both gaseous and aerosol samples were injected into 10 mL glass syringes which were connected to the IC for analysis (30 min time resolution for each sample). The concentrations of eight water-soluble inorganic ions (e.g., , Na+, K+, Ca2+, Mg2+, , and Cl−) in the fine particles were measured.
Twenty-three trace elements in PM2.5 were measured by an Xact 625 Ambient Metal Monitor (Cooper Environmental Services LLC, USA) with a 1 h time resolution. Among them 12 elements (e.g., K, Ca, Ba, Cr, Mn, Fe, Cu, Ni, Zn, As, Se, Pb) were selected for further analysis, while other trace elements (such as V, Co, Tl) were not used here due to the low concentrations (below the method detection limit). The ambient air was sampled on a Teflon filter tape inside the instrument through a PM2.5 cyclone inlet at a constant flow rate of 16.7 L min−1, and then the sample was automatically analyzed by nondestructive energy-dispersive X-ray fluorescence (XRF) to determine the mass of the species. This instrument has been documented with Environmental Technology Verification (ETV) and certified by the US Environment Protection Agency (EPA, 2012). The detection limit of each species measured by the online instruments can be seen in Table S1 in the Supplement.
Strict quality assurance (QA) and quality control (QC) protocols for online instruments were performed during the whole sampling period. For IGAC, the internal standard (LiBr) was added continuously to each sample and analyzed by the IC system during the analysis to check the stability of the IGAC instrument. During the sampling period, the mean concentrations of Li+ and Br− were within the range of 3 standard deviations, suggesting a stable condition of the IGAC (see Fig. S1 in the Supplement). As shown in Fig. S2, the slope of the linear fitting between the anions and cations was 0.93, and R2 was 0.96. As for the OC/EC analyzer, external standard calibration using the stock sucrose solution was conducted before operation to calibrate carbon analysis. For the Xact, a Pd rod was used as an automatic internal quality control to check the performance of the instrument on a daily basis (see Fig. S3). Additionally, a QA energy calibration test and QA energy level test were performed for half hour after midnight every day to monitor any possible shift and instability of the XRF. During our field campaign, the Xact remained stable and reliable.
Chemical closure has been done between the measured and reconstructed PM2.5. Organic matter (OM) was calculated as OM OC (Turpin and Lim, 2001). Mineral species was calculated as mineral =1.89 Al +2.14 Si +1.4 Ca +1.43 Fe +1.66 Mg (Zhang et al., 2003). The concentrations of Al, Si, Fe and Mg were calculated by the concentration of Ca and the composition of urban soils of Beijing: Al =1.7 Ca, Si =7.3 Ca, Fe =0.7 Ca and Mg =0.3 Ca (An et al., 2016). “Others” were calculated by subtracting OM, EC, mineral and secondary inorganic aerosol (SIA, including , , ) concentration from total PM2.5 concentration. The correlation of measured and reconstructed PM2.5 mass can be seen in Fig. S6 with R2=0.915.
2.2 Methodology
2.2.1 Positive matrix factorization (PMF)
To qualitatively and quantitatively identify sources of PM2.5 and estimate the associated contributions, the USEPA PMF 5.0 model was adopted in this study. The principle and detailed information of this model can be found in Paterson et al. (1999) and the EPA 5.0 Fundamentals and User Guide. Factor contributions and profiles were derived by minimizing the objective function Q in the PMF model, which was determined as follows (Norris et al., 2014; Paatero and Tapper, 2010; Paatero et al., 2014; Paatero, 1997):
Data values below the MDL were substituted with MDL/2. Missing data values were substituted with median concentrations. If the concentration was less than or equal to the MDL, the uncertainty (Unc) was calculated using a fixed fraction of the MDL:
If the concentration was greater than the MDL provided, the calculation was based on the following equation:
In total, 19 chemical components were used in the PMF model, including OC, EC, Cl−, , , Na+, , K, Ca, Ba, Cr, Mn, Fe, Cu, Ni, Zn, As, Se and Pb. To determine the optimal number of source factors, a string of effective tests, in which the number of factors was from four to nine, was carried out. The resulting Q parameters are shown in Fig. S4. Obviously, the lowest QRobust value was (13087) at six factors when moving from four to nine factors. Although Qexpected has been decreasing in the process, Q∕Qexpected shared similar variation with QRobust showing the lowest value at six factors (see Fig. S4). Bootstrapping (BS), displacement (DISP) and bootstrapping with displacement (BS-DISP) were conducted to analyze the uncertainty of the PMF model at six factors. The results were stable with all factors mapped in BS in 100 % and no swaps with DISP and all BS-DISP runs, indicating a convincing source apportionment result (see Table S2).
2.2.2 Footprint analysis model
The footprint model developed by Peking University was used to simulate the potential source region of air pollution. The footprint is a transfer function in a diffusion problem linking the source and the measurement result at a point (receptor) (Pasquill and Smith, 1977). That is,
where c is the measured concentration at a spatial location r, Q is the source strength with spatial location , f is the footprint or the transfer function and R is the integration domain. The footprint links point measurements (receptors) in the atmosphere to upstream forcings, in which turbulent dispersion plays a central role. The Lagrangian stochastic (LS) particle models was used to calculate the footprint function (Cai et al., 2007; Leclerc and Thurtell, 1990; Kurbanmuradov and Sabelfeld, 2000).
The meteorological data used to drive the footprint model were provided by the Weather Research and Forecasting model (WRF-ARWv3.6.1) (http://www.wrf-model.org/, last access: 15 January 2018), initialized using the Final Analysis (FNL) data from the United States National Centers for Environmental Prediction (NCEP). Two nested domains were used in this study with horizontal resolutions of 15 and 5 km and 28 vertical levels. The simulation period was from 1 November to 31 December 2016, with a 12 h spinup time before the start for each 48 h simulation. The domain of the footprint model is the same as the domain 2 in WRF which covers the North China Plain (500×600 km), and the horizontal resolution is 2.5×2.5 km. Every hour, 5000 particles were released 10 m above the ground at the center of Beijing, and then each particle was tracked backward in time for 48 h. The residence time of all particles 0–100 m above the ground was recorded to obtain the footprint. This model has undergone rigorous theoretical discussion and verification and more detailed principle and calculation methods of the model can be found in Cai et al. (2007).
2.2.3 The Nested Air Quality Prediction Model System (NAQPMS)
In this study, the NAQPMS model was applied to analyze the contribution of local emissions and regional transport to PM2.5 in winter in Beijing. NAQPMS is a 3-D Eulerian chemical transport model with terrain-following coordinates, developed by the Institute of Atmospheric Physics, Chinese Academy of Sciences (IAP/CAS) and has been validated by the Ministry of Environmental Protection of China (CMEP, 2013). The main modules in the model include horizontal and vertical advection and diffusion, dry and wet deposition, and gaseous, aqueous, aerosol and heterogeneous chemistry (Li et al., 2007; J. Li et al., 2017). A more detailed description of the model can be found in Li et al. (2008, 2014, 2016; J. Li et al., 2017).
Three nested model domains were used in this study. The coarsest domain (D1) covered most of China and East Asia with a 27 km resolution. The second domain (D2) included most anthropogenic emissions within the North China Plain with a 9 km resolution. The innermost domain (D3) covered the Beijing–Tianjin–Hebei region at a 3 km resolution. The first level of model above the surface is 30 m in height, and the average vertical layer spacing between 30 m and 1 km is around 100 m. The MIX (http://www.meicmodel.org/dataset-mix.html, last access: 12 November 2018) anthropogenic emission inventory was used (M. Li et al., 2017), with the original resolution of 0.25∘ (about 25 km at midlatitudes) and the year of 2010. The NAQPMS meteorological fields were provided by the Weather Research and Forecasting model (WRF-ARWv3.6.1) (http://www.wrf-model.org/) driven by the NCEP FNL data. The simulation was conducted from 10 November to 15 December 2016.
2.2.4 The combination of multiple models
The footprint model was used to provide the direction of source regions, while the NAQPMS model was run to calculate the contribution of local emission and regional transport. To verify the consistency between the two models, the footprint with a time resolution of 6 h was divided into four types (local, south, north and east) according to the direction of potential source regions, and average local contributions of different types obtained from NAQPMS were calculated (See Table S3). Based on the input data availability, the footprint simulation was performed from 1 to 31 December, while the NAQPMS model analysis was carried out from 10 November to 15 December. Therefore, we use the data from 1 to 15 December for the consistency test of NAQPMS and the footprint model. A typical example of different types of footprint can be seen in Fig. S5. The average local contribution estimated by NAQPMS was highest for the local footprint (85 %) and lower for southern (68 %), northern (63 %) and eastern footprints (66 %). The results of the two models correlated well with each other.
Based on online measurements of PM2.5 species including specific source tracers, the receptor model (PMF) can be used to obtain precise source apportionment results but with no information on regional transport. Therefore, the footprint and NAQPMS model were simultaneously conducted and combined with the PMF model to link the source type and contribution to PM2.5 in Beijing by receptor models with different source regions.
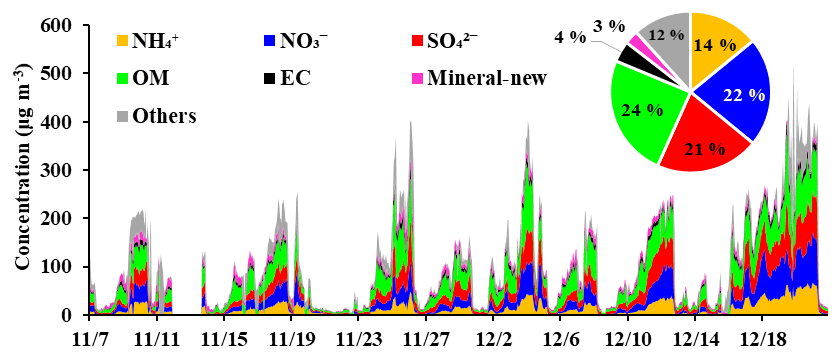
Figure 1Chemical composition of PM2.5 during sampling period (red for , blue for , yellow for , green for OM, black for EC, pink for mineral and grey for others). Dates are mm/dd and are from 7 November to 22 December.
3.1 Mass concentration and chemical composition of PM2.5
Temporal variation in the chemical composition of PM2.5 during the field campaign is shown in Fig. 1. The statistical summary of identified species of PM2.5 in the entire sampling period was summarized in Table S1. Figure 1 shows that SIA and OM were the predominant PM2.5 components in winter in Beijing, accounting for 57 % and 24 % of total PM2.5 mass, respectively. The average concentration of OC was 20.8±17.0 µg m−3, and the average concentration of EC was 5.6±4.4 µg m−3. The OC∕EC ratio is often used to indicate the contribution of primary emission sources and secondary organic aerosols (SOAs) (Lim and Turpin, 2002; Zheng et al., 2014). In this study, the OC∕EC ratio ranged from 1.36 to 7.92 with an average ratio of 3.91±0.91, which was lower than that in the winter of Beijing in 2013 (5.73±2.47) (Yan et al., 2015). is the predominant ion in SIA with an average concentration of 23.5±20.8 µg m−3, which was similar to that of (22.0±23.3 µg m−3). The concentration of elemental components ranked from high to low as K > Fe > Ca > Zn > Pb > Mn > Ba > Cu > As > Cr > Se > Ni, with K contributing 2 % to PM2.5. In general, the large contribution of SIA and OM, as well as the high OC∕EC ratio, indicated the importance of secondary formation in winter in Beijing (Y. Sun et al., 2016), while the high concentration of species like and K suggested a significant contribution of combustion sources including coal combustion and biomass burning to PM2.5 (Achad et al., 2018; Chen et al., 2017; H. Li et al., 2017).
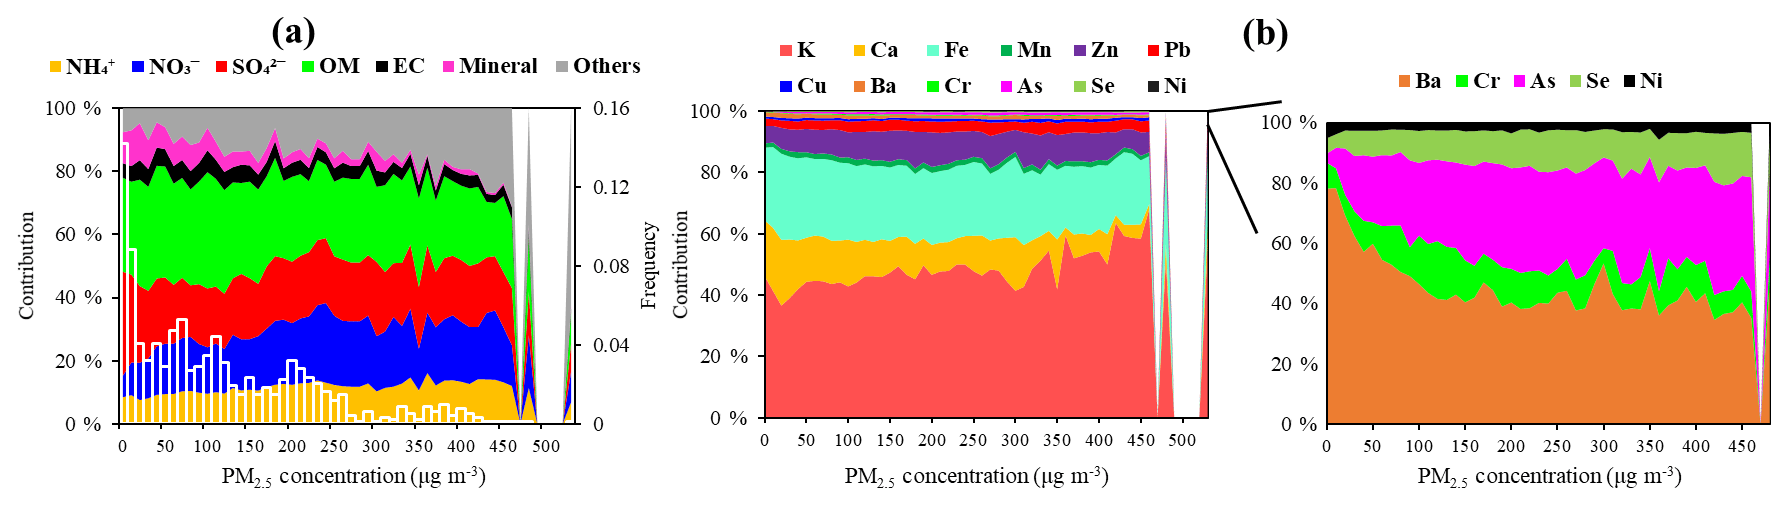
Figure 2Variation in (a) chemical composition and (b) elemental species with PM2.5 concentration. The white bars represent the frequency of PM2.5 concentration.
Figure 2 shows the large differences in chemical composition of PM2.5 concentration between nonhaze and haze episodes. The average concentration of PM2.5 and identified species in different haze and nonhaze periods were summarized in Table S4. Under low PM2.5 concentration (< 50 µg m−3), was one of the major components of PM2.5 with a contribution of around 24 %. When PM2.5 was 50–150 µg m−3, OM was the dominant composition (about 38 %). When PM2.5 was greater than 150 µg m−3, the contribution of SIA increased with concentration level (up to 55 %). The contribution of mineral components decreased from 8 % to 2 % when PM2.5 concentration increased from below 50 to over 250 µg m−3. The proportion of K, Pb, As and Se, which were tracers of biomass burning and coal combustion (Achad et al., 2018; Chen et al., 2017; Vejahati et al., 2010), increased with PM2.5 concentration. However, the contributions of Ca, Ba, Fe and tracers of dust sources (Amato et al., 2013; Shen et al., 2016) decreased with PM2.5 concentration. Taken together, all these variations of source-specific PM2.5 compositions suggested a more significant influence of combustion sources to PM2.5 in haze episodes and relatively higher contributions of dust sources in nonhaze periods.
3.2 Source apportionment during haze and nonhaze periods
To conduct high-time-resolution source apportionment in Beijing, a PMF model was applied to 1 h online measurement data. The six-factor solution gave the best performance. The profile for each factor is shown in Fig. S7. Contribution of different factors to PM2.5 were estimated after considering major sources in Beijing, the similarity of the PMF source profiles with relevant source emission profiles, and distinctively different marker species for different sources. Factor 1 was heavily weighted by secondary inorganic ions (, and ) and moderately weighted by OC, which was typical of the secondary source profiles (Gao et al., 2016; Peng et al., 2016; Shi et al., 2017). Factor 2 was highly loaded on metal species including Mn, Fe, Cu and Zn, which were mostly used as indicators for industrial sources (Hu et al., 2015; Y. Li et al., 2017; Pan et al., 2015; Yu et al., 2013). Factor 3 presented high loading of Ca, Ba and Fe, and the two crustal elements were mainly emitted from dust sources (Amato et al., 2013; Shen et al., 2016). Factor 4 was mostly loaded by EC, OC and moderately loaded by Cu and Zn, which were mainly emitted from lubricant additive of vehicles (Kim et al., 2003; Tao et al., 2014) and wear of brake and tyre (Pant and Harrison, 2013). High loading of As and Se and moderate loading of OC and EC were observed in Factor 5, indicating a typical source profile of coal combustion (Vejahati et al., 2010). Factor 6 was characterized by high loading of K, and OC, which were identified as indicators of biomass burning (Duan et al., 2004). In previous studies, cooking was one of the important sources of PM2.5, contributing to about 10 % on average in East Asia (Chafe et al., 2014; Sun et al., 2013), but in this study, cooking sources were not identified by PMF due to the lack of organic tracers. The relationships between the tracers of identified sources and sources mass concentrations are shown in Fig. S8.
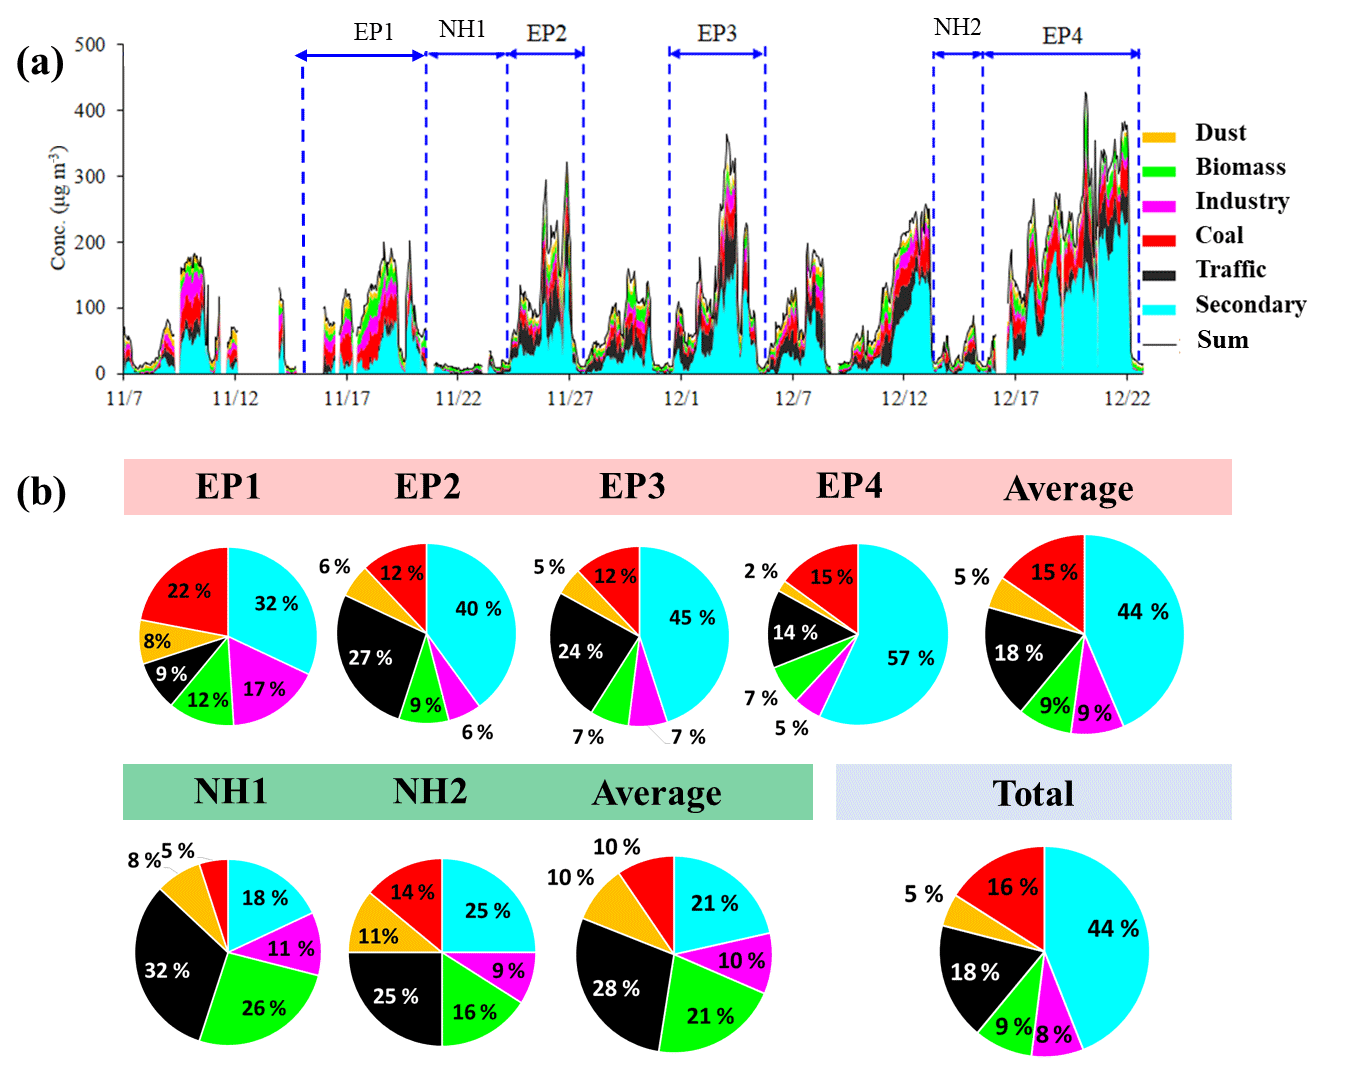
Figure 3Source contribution of PM2.5 (a) in the whole sampling period and (b) in different pollution episodes and nonhaze periods (yellow for dust source, green for biomass burning, pink for industrial source, red for coal combustion, black for traffic sources and blue for secondary sources). Dates are mm/dd.
The source apportionment result of PMF in winter in Beijing is shown in Fig. 3. During the campaign, the source contribution in Beijing ranked as secondary sources (44 %) > traffic sources (18 %) > coal combustion (16 %) > biomass burning (9 %) > industrial sources (8 %) > dust (5 %). The high contribution of secondary sources in winter was similar to previous studies (Gao et al., 2016; Peng et al., 2016; Zhang et al., 2013), which might be attributed to regional transport and heterogeneous reactions (Ma et al., 2017).
Table 1Meteorological conditions during pollution episodes and nonhaze periods.
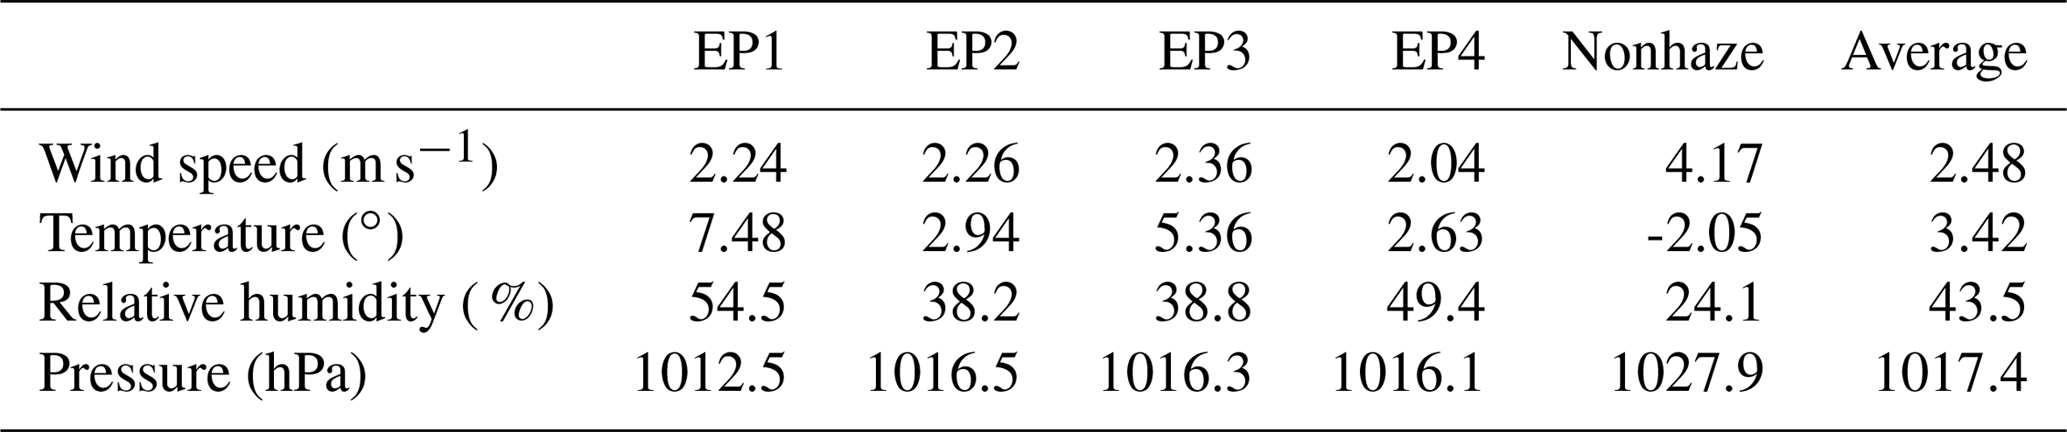
Considering data integrity and representativeness, four typical pollution episodes (EP1-4) and two nonhaze periods (NH1 and NH2) were selected. The average PM2.5 concentrations in four haze episodes were all above 97 µg m−3 (see Table S4). EP1 (14–19 November) and EP2 (24–27 November) represented the pollution episodes in November, and EP3 (1–5 December) and EP4 (16–21 December) were two severe pollution processes in December. The four pollution episodes were characterized by low wind speed around 2 m s−1 and high relative humidity (RH) compared to nonhaze periods (see in Table 1). The chemical composition and sources of the four pollution episodes varied from each other, but relatively high contributions of secondary sources were observed in all episodes (32 %–57 %), and the contribution increased with PM2.5 concentration (see Fig. 2). EP4 was characterized by the highest contribution of secondary sources (57 %). The contribution of coal combustion and industrial sources in EP1 was the most significant compared with other episodes, which were 22 % and 17 %. The traffic source contributions in EP2 and EP3 were higher than other pollution episodes, accounting for about 22 %. The source contribution in nonhaze periods was significantly different from that in pollution episodes. The contribution of secondary sources in the two nonhaze periods, NH1 (22–23 November) and NH2 (13–15 December), decreased to 18 % and 25 %, while traffic and dust source contributions to PM2.5 increased to about 30 % and 10 %, which could be influenced by local emission and regional transport from northern areas to Beijing.
Generally, secondary sources were predominant (∼50 %) to PM2.5 in pollution episodes, while traffic sources (∼30 %) became more important in nonhaze periods. However, source contributions of PM2.5 could vary from episode to episode. EP1 was more influenced by primary sources, while EP4 was characterized by high secondary source contributions (57 %).
3.3 Evolution of different types of haze episodes
The high-time-resolution source apportionment result by PMF was combined with the NAQPMS and footprint modeling outcomes to investigate the variation in source types and contributions with source regions in different haze episodes in Beijing. EP1 and EP4, with the longest duration and significantly different source compositions, were selected as two case episodes for further analysis.
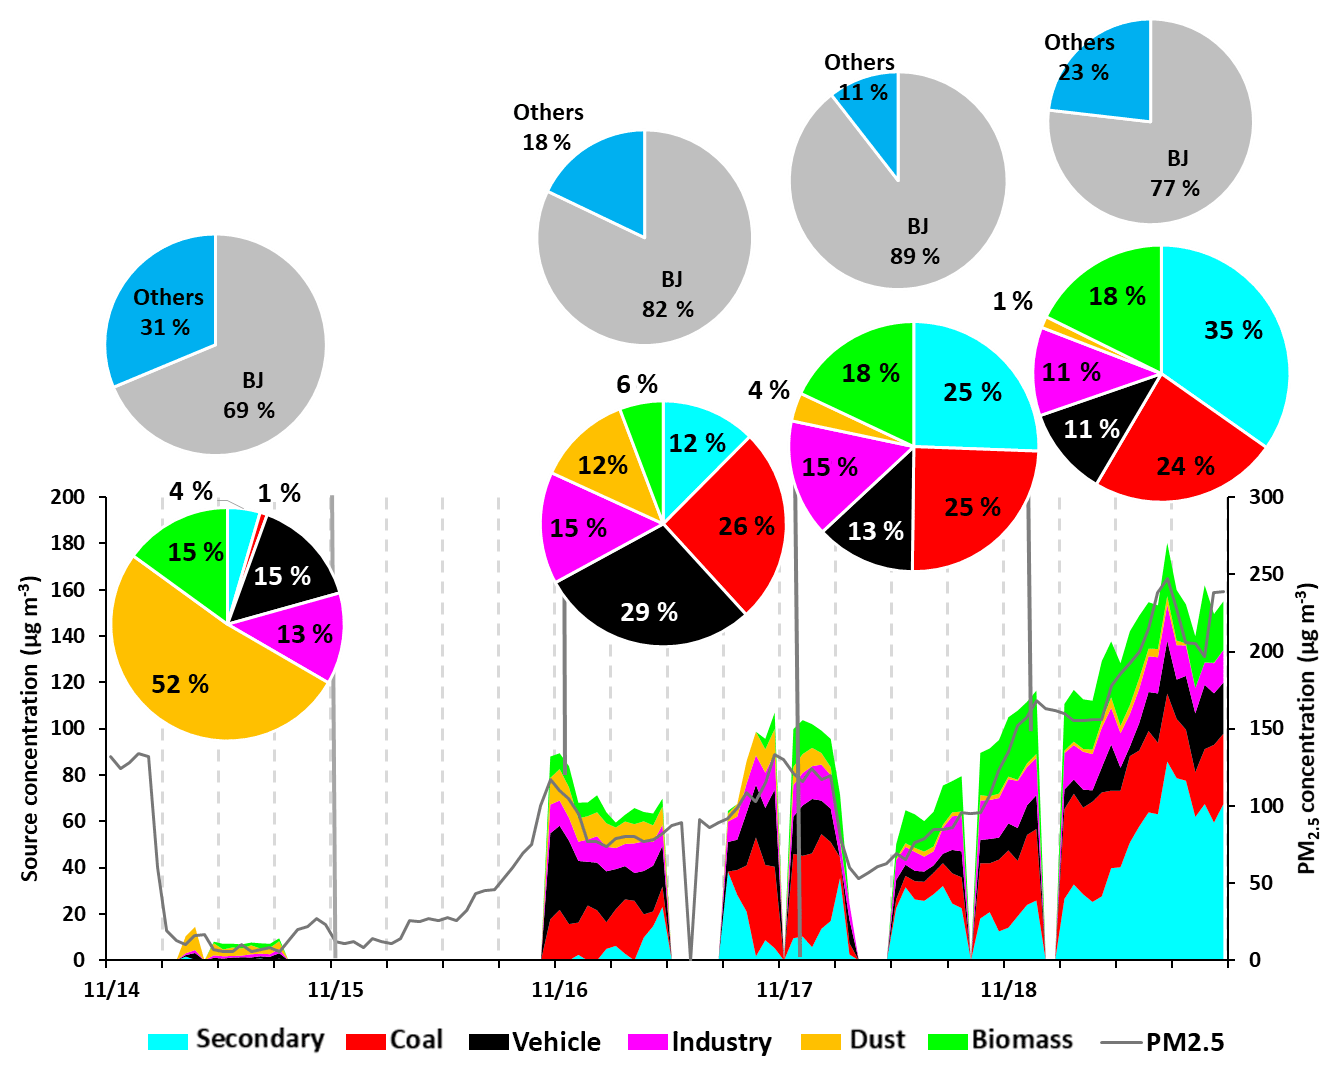
Figure 4Variation in sources and local contribution during EP1. The above pie charts show the daily local (Beijing as BJ) and regional contributions (labeled “others”). The pie charts below show the daily source type and contribution.
3.3.1 A haze episode dominated by local emission
Figure 4 shows the variation in sources and local contribution and Fig. 5 shows the footprint regions and daily source apportionment results by PMF in EP1. The spatial mass concentrations of PM2.5, wind speed and wind direction during EP1 by NAQPMS can be found in Fig. S9. It can be seen that EP1 was characterized with high local contributions (69 %–89 %) and primary source contributions to PM2.5. On November 14, the footprint located in the northeastern part of Beijing (mainly Inner Mongolia) with a low PM2.5 concentration, while the contribution of dust sources was significant (52 %). On November 16 when the formation stage of EP1 started, the footprint concentrated in local areas of Beijing and the local contribution by NAQPMS (82 %) increased simultaneously. The daily average source contribution ranked as traffic sources (29 %) > coal combustion (28 %) > industrial sources (15 %) > dust and secondary sources (12 %) > biomass burning (6 %). The contribution of primary sources, especially for traffic sources, increased when footprints were primarily located in the local area.
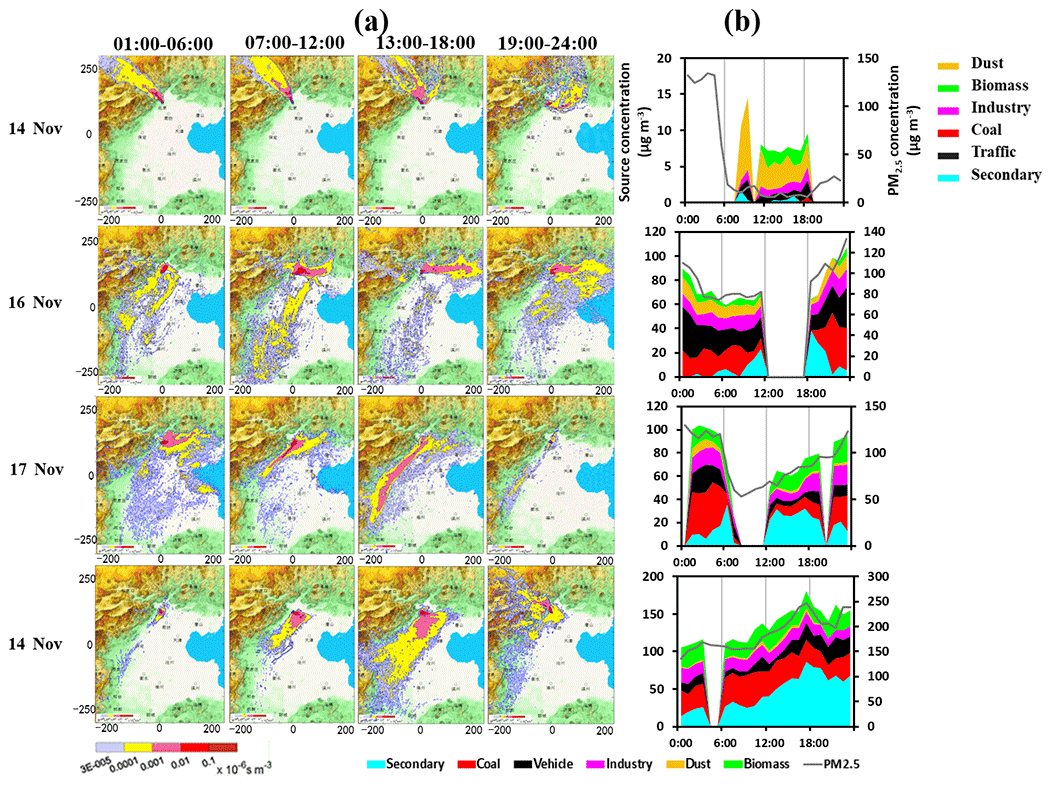
Figure 5(a) Source regions by the footprint model and (b) daily source apportionment results by PMF in EP1.
The relationship between source apportionment and the footprint model results can also be found in the daily variation of 17 November (see Fig. 5). From 01:00 to 12:00 of the day, the footprint remained in local areas, while primary sources were predominant. However, when the footprint changed to southwestern areas to Beijing from 13:00 to 18:00, the contribution of secondary sources increased significantly to 42 %. After the footprint changed back to a local type from 19:00 to 24:00, the secondary source contribution decreased to the previous level (19 %).
3.3.2 A haze episode dominated by regional transport
Figure 6 shows the variation of sources and Fig. 7 shows the footprint regions and daily source apportionment results by PMF in EP4. In contrast to EP1, the footprint in EP4 was mostly located in the southwestern area of Beijing, where there were heavily polluted cities including Baoding and Shijiazhuang (see Fig. 7). The daily local and regional contribution by NAQPMS of this episode was not provided due to lack of data. From the formation stage (16–17 December) to the peak (20 December) of EP4, the contribution of secondary sources increased from 34 % to 58 %, while the contributions of coal combustion and biomass burning were also significant among primary sources (see Fig. 6). Figure 7 shows that the footprint on December 17 was more concentrated in the local and eastern areas of Beijing, while it gradually moved to southwestern areas along with the increase of PM2.5 concentration and the secondary source contribution.
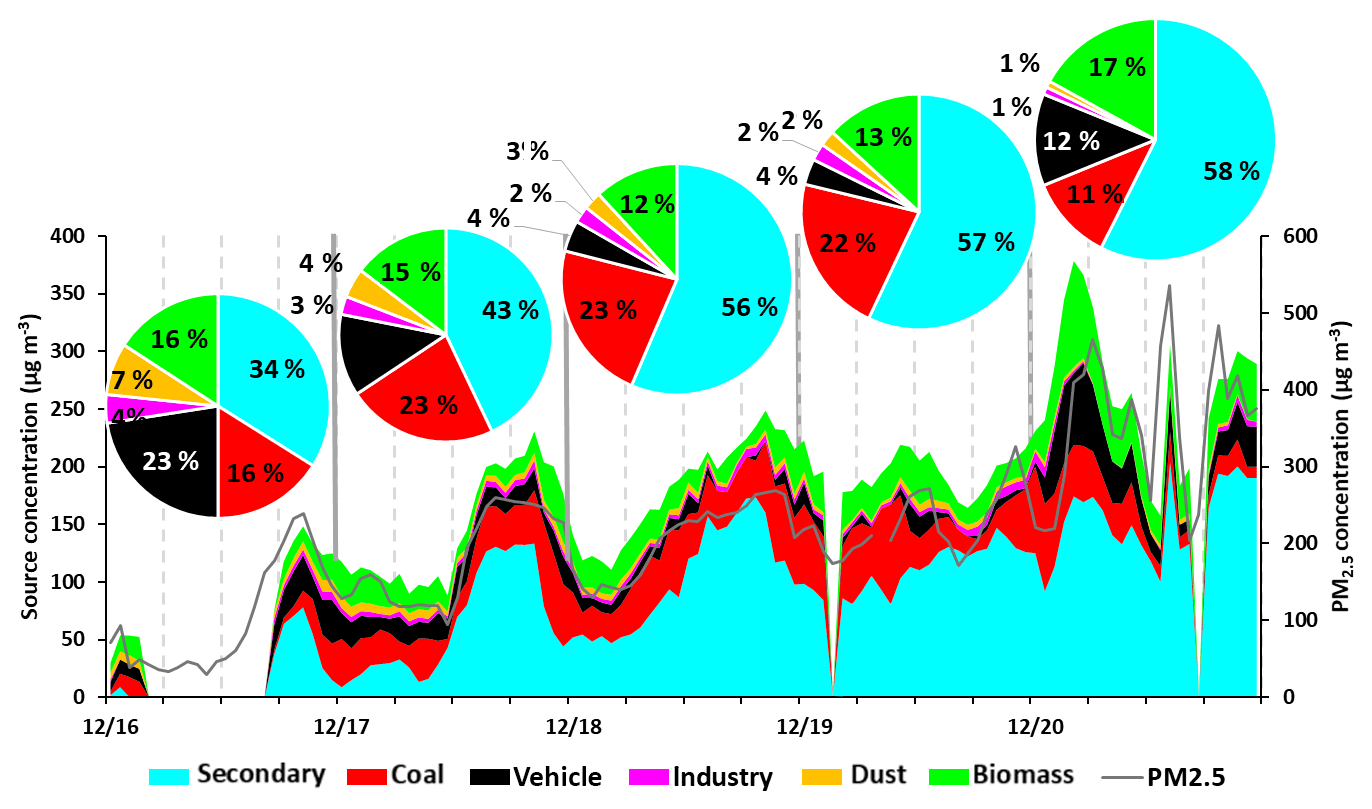
Figure 6Source contribution in EP4. The pie charts show the daily source type and contribution. Dates are mm/dd.
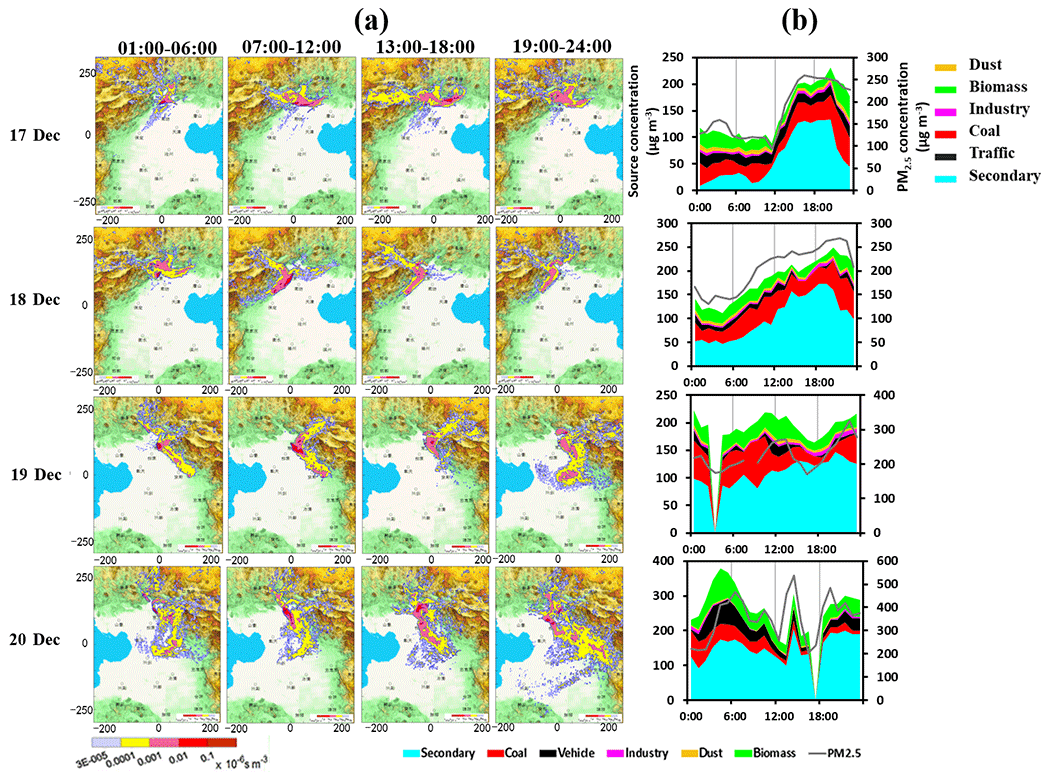
Figure 7(a) Source regions by the footprint model and (b) daily source apportionment results by PMF in EP4.
The above results confirmed that high-time-resolution source apportionment result can be integrated with footprint and NAQPMS model to identify the rapid evolution of different episodes – EP1 was mainly caused by local emission from transportation and coal combustion, while EP4 was typical of regional transport from southwestern areas of Beijing with increasing contributions of secondary sources.
3.4 Relationship of PM2.5 sources by PMF with regional transport estimated by NAQPMS
3.4.1 Sources dominated by local emission and regional transport
Receptor models which are used for source apportionment have the limitation that they cannot quantify the local or regional transport contribution. Therefore, the receptor model was combined with the chemical transport model NAQPMS to investigate the correlation of source contribution with local or regional transport. As shown in Sect. 3.2, secondary and combustion sources were predominant in haze episodes in Beijing. To better control those major sources in winter, it is essential to determine the correlation of source contribution with the contribution of local emission or regional transport. Figure 8 shows the correlations of relative contribution of secondary sources, coal combustion and biomass-burning sources by PMF with local contribution by NAQPMS during the sampling period. The results showed that, for PM2.5 in Beijing, the secondary source contribution decreased when the local emission was more significant (p < 0.05, r=0.4), while coal combustion, as a primary combustion source, showed an increasing trend along with local contribution estimated by NAQPMS (p < 0.05, r=0.3). Comparing with Fig. 8b and c, the two primary combustion sources showed the opposite relationship to the local contribution, indicating that the pollutants from biomass burning were mainly transported from the surrounding areas of Beijing, while those from coal combustion were more influenced by local emission. According to previous studies, biomass burning was an important source in provinces around Beijing including Shandong, Hebei and Inner Mongolia (Khuzestani et al., 2018; J. Sun et al., 2016; Zhang et al., 2010; Zhao et al., 2012; Zong et al., 2016). The surrounding provinces and cities of Beijing are shown in Fig. S10. The results suggested that locally emitted coal combustion contributed significantly to PM2.5 in Beijing in winter 2016 and the strict control strategies for coal combustion were essential to improving air quality in Beijing. In the meantime, more control of biomass burning and precursors of secondary sources in surrounding areas are also needed to mitigate air pollution in Beijing.
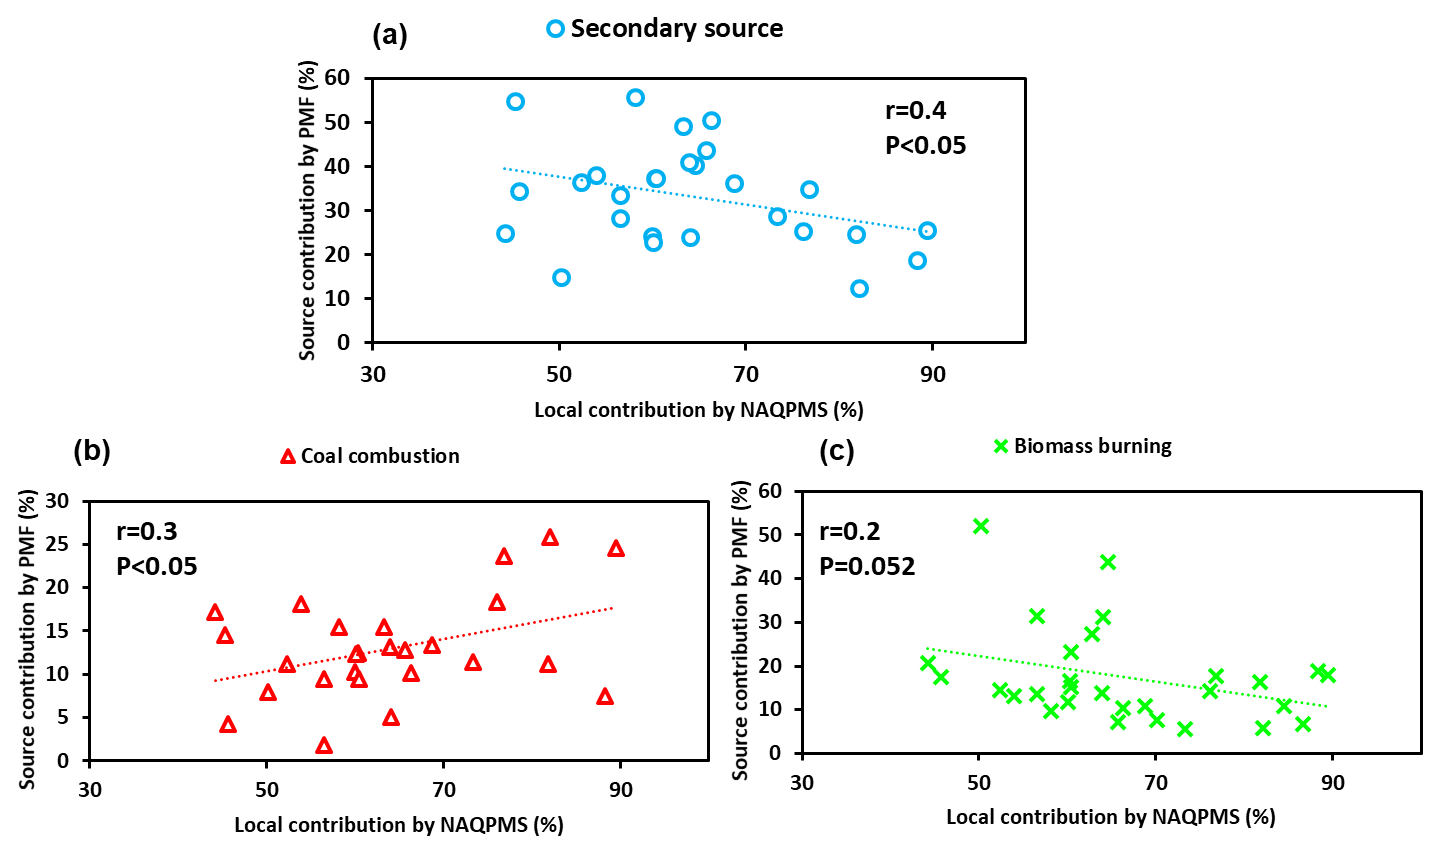
Figure 8Correlations of local contribution by NAQPMS with the relative contribution by PMF of (a) secondary sources, (b) coal combustion sources and (c) biomass-burning sources.
3.4.2 Sources dominated in different potential source regions
The combination of the PMF result with the footprint model was used to further identify specific source type and contribution in different source regions. As mentioned in Sect. 2.2.4, the footprint with the time resolution of 6 h was divided into four types (local, south, north and east) according to the direction of potential source regions. The typical examples of different types of footprint are shown in Fig. S5. The local footprint referred to the cases with source region located within Beijing. The southern footprint mainly covered southwestern areas in Hebei province including Baoding, Shijiazhuang and Xingtai. The northern footprint included Zhangjiakou and Inner Mongolia. The eastern footprint covered the northern part of Hebei, such as Tangshan and Qinhuangdao, and the southern part of the Liaoning province. The local footprint was predominant in winter in Beijing (N=79) with the contribution of 38 %, followed by northern and southern footprint (N=51, 45). The amount of eastern footprint was the lowest in winter. The average value and box chart of source contribution in four types of footprint during the whole sampling period are shown in Fig. 9. It can be seen that local footprint was characterized by traffic (23 %) and coal combustion sources (25 %), while the contribution of secondary sources (26 %) was the lowest among the four types. On the contrary, secondary sources were predominant in southern footprint cases with the contribution of 53 %, while the contribution of traffic sources decreased to 15 %. The results corresponded well with the analysis of two typical episodes in Sect. 3.3. The northern footprint was characterized by the highest contribution of dust sources (11 %), which could be influenced by dust transported from Inner Mongolia (Hoffmann et al., 2008; Park and Park, 2014). Eastern footprint, which mainly covered heavy industrial areas such as Tangshan and Shenyang, showed higher contribution of industrial sources (10 %) and coal combustion sources (18 %). Figure 9b shows that the variation in source contribution had the smallest local footprint, indicating a relatively stable local emission of Beijing, while the source contribution varied more significantly in the eastern footprint.
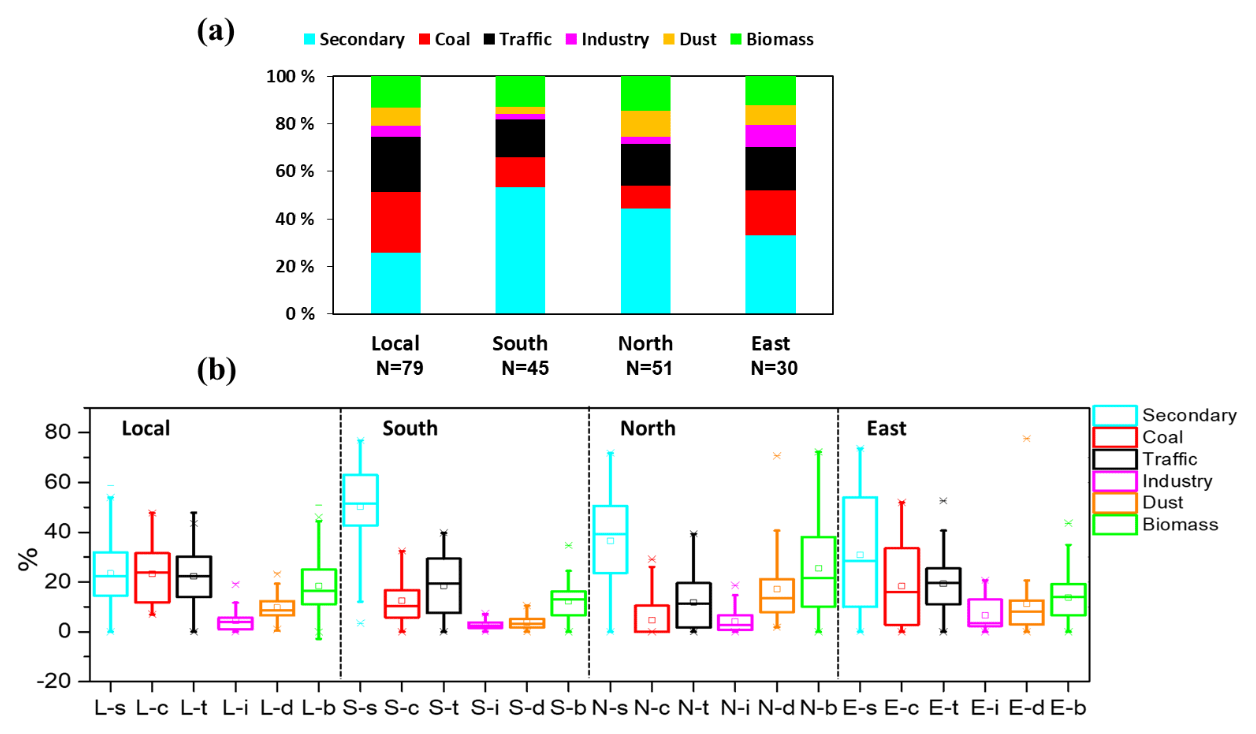
Figure 9(a) The average source contribution (in percentage) for each type of footprint, and (b) a box chart of source contribution for four types of footprint during the whole sampling period. N in (a) represents the number of cases. The capital letters in (b) stand for the type of footprint (L for local, S for south, N for north, E for east) and the lowercase letters stand for different sources (s for secondary source, c for coal combustion, t for traffic source, i for industrial source, d for dust and b for biomass burning).
The results of PMF and the footprint model showed that the source contribution in winter in Beijing was influenced by the potential source regions, and the predominant source could change specifically for different footprint types, which might suggest that source apportionment and footprint analysis need to be combined to better control specific sources from different source regions.
3.5 Future prospects
In this study, the high-time-resolution online measurements were conducted by Xact, IGAC and the Sunset OCEC analyzer, which could measure inorganic species including water-soluble ions, elemental components, OC and EC. As a result, most of the tracers selected for PMF source apportionment were inorganic species. In previous studies based on online measurements, organic tracers are also not commonly used due to current technical difficulties in carrying out online and quantitative measurements of organic species with high-time resolution (Gao et al., 2016; Y. Li et al., 2017; Peng et al., 2016). However, some organic tracers are believed to be more specific for certain sources, such as levoglucosan for biomass burning, hopane and sterane for traffic sources and cholesterol for cooking sources (Fraser et al., 2000; Yin et al., 2010; Zhao et al., 2015). Therefore, future online measurements of organic species could be conducted, which will be very helpful in identifying sources. Besides, vertical measurements of PM2.5 are important for a better understanding of sources and regional transport of PM2.5 in Beijing. Li et al. (2017) found that the height of regional transport ranged from 200 to 700 m above ground level using the NAQPMS model. In the future, the integration of ambient measurements with the air quality model should be considered at a vertical level as well.
High-time-resolution online measurements of PM2.5 were conducted during the APHH winter campaign in Beijing. Considering the limitation of receptor models, which could not identify and quantify regional transport, the receptor model PMF was combined with multiple models, including NAQPMS and the footprint model, to analyze the specific sources from different source regions during haze episodes in Beijing. The source apportionment results by PMF during our sampling period showed that secondary sources were predominant (∼50 %) to PM2.5 in pollution episodes, while traffic sources (∼30 %) became more important in nonhaze periods. Source contributions of PM2.5 can vary from episode to episode.
The multiple models were combined to analyze the evolution of two typical pollution episodes in Beijing. The high-time-resolution results indicated that source contribution can vary rapidly and significantly with source regions within different types of haze episodes. EP1, with a locally concentrated footprint and high local emission, was characterized by coal combustion and traffic sources, while EP4 with a more southwestern footprint was typical of a high secondary source contribution. The relationship of PM2.5 sources by PMF with regional transport during the whole sampling period was further investigated. As the predominant sources of PM2.5 in Beijing, secondary and biomass burning sources were more influenced by regional transport, while coal combustion sources increased with local contribution. The source regions of PM2.5 in Beijing were classified into four types and source contribution varied significantly with potential source regions, with traffic sources dominating in the local footprint, secondary sources dominating in southern footprint and dust and industrial sources increasing in northern and eastern footprints. The results suggested that source contributions of PM2.5 in winter in Beijing could change significantly, along with the contribution and direction of regional transport. Therefore, the combined use of the receptor model, meteorological model and chemical transport model was important in identifying specific sources from different source regions.
The data in this study are available from the corresponding author upon request (mzheng@pku.edu.cn).
The supplement related to this article is available online at: https://doi.org/10.5194/acp-19-6595-2019-supplement.
MZ, XC and JL designed the research. MZ organized the field campaign. YL, TZ and CY conducted the measurements. YL wrote the paper. YL, MY and HD analyzed the data. XW, ZS, RH, QZ and KH took part in data analysis and revised and commented on the paper. All authors contributed to the discussion of this paper.
The authors declare that they have no conflict of interest.
This article is part of the special issue “In-depth study of air pollution sources and processes within Beijing and its surrounding region (APHH-Beijing) (ACP/AMT inter-journal SI)”. It is not associated with a conference.
The authors gratefully thank for the assistance of Jinting Yu in Peking University for maintaining the online instruments in this work.
This research has been supported by the National Natural Science Foundation of China (grant nos. 41571130033, 41430646, 41571130035, 91744203, and 41571130034) and the UK Natural Environment Research Council (grant nos. NE/N006992/1 and NE/R005281/1).
This paper was edited by Leiming Zhang and reviewed by three anonymous referees.
Achad, M., Caumo, S., de Castro Vasconcellos, P., Bajano, H., Gómez, D., and Smichowski, P.: Chemical markers of biomass burning: Determination of levoglucosan, and potassium in size-classified atmospheric aerosols collected in Buenos Aires, Argentina by different analytical techniques, Microchem. J., 139, 181–187, 2018.
Amato, F., Schaap, M., van der Gon, H. A. D., Pandolfi, M., Alastuey, A., Keuken, M., and Querol, X.: Short-term variability of mineral dust, metals and carbon emission from road dust resuspension, Atmos. Environ., 74, 134–140, 2013.
An, Y. L., Huang, Y., Liu, Q. J., Sun, C., Deng, K. W., Li, D., and Huang, D.: The distribution of surface soil elements and the pollution assessment of heavy metal elements in Beijing, Geological Bulletin of China, 35, 2111–2120, 2016 (in Chinese).
Bauer, J. J., Xiao-Ying, Y., Robert, C., Nels, L., and Carl, B.: Characterization of the sunset semi-continuous carbon aerosol analyzer, Air Repair, 59, 826–833, 2009.
Burr, M. J. and Zhang, Y.: Source apportionment of fine particulate matter over the Eastern US Part I: source sensitivity simulations using CMAQ with the Brute Force method, Atmos. Pollut. Res., 2, 300–317, 2011.
Cai, X. and Leclerc, M. Y.: Forward-in-time and backward-in-time dispersion in the convective boundary layer: the concentration footprint, Bound.-Lay. Meteorol., 123, 201–218, 2007.
Chafe, Z. A., Michael, B., Zbigniew, K., Rita, V. D., Sumi, M., Shilpa, R., Keywan, R., Frank, D., and Smith, K. R.: Household cooking with solid fuels contributes to ambient PM2.5 air pollution and the burden of disease, Environ. Health Persp., 122, 1314–1320, 2014.
Chen, S., Guo, Z., Guo, Z., Guo, Q., Zhang, Y., Zhu, B., and Zhang, H.: Sulfur isotopic fractionation and its implication: Sulfate formation in PM2.5 and coal combustion under different conditions, Atmos. Res., 194, 142–149, 2017.
Cooper, J. A. and Watson Jr., J. G.: Receptor oriented methods of air particulate source apportionment, J. Air Pollut. Control Assoc., 30, 1116–1125, 1980.
China Ministry of Environmental Protection: Technical Guidelines for Source Apportionment of Atmospheric Particulate Matter (For Trial Implementation), 2013 (in Chinese).
Duan, F., Liu, X., Yu, T., and Cachier, H.: Identification and estimate of biomass burning contribution to the urban aerosol organic carbon concentrations in Beijing, Atmos. Environ., 38, 1275–1282, 2004.
EPA: Environmental Technology Verification Report: Pall Corporation Xact 625 particulate 527 metals monitor, US EPA, Office of Research and Development, EPA/600/R-12/680, 2012.
Fraser, M. P. and Lakshmanan, K.: Using Levoglucosan as a molecular marker for the long-range transport of biomass combustion aerosols, Environ. Sci. Technol., 34, 4560–4564, 2000.
Gao, J., Peng, X., Chen, G., Xu, J., Shi, G.L., Zhang, Y. C., and Feng, Y. C.: Insights into the chemical characterization and sources of PM2.5 in Beijing at a 1 h time resolution, Sci. Total Environ., 542, 162–171, 2016.
Han, L., Cheng, S., Zhuang, G., Ning, H., Wang, H., Wei, W., and Zhao, X.: The changes and long-range transport of PM2.5 in Beijing in the past decade, Atmos. Environ., 110, 186–195, 2015.
Han, X. and Zhang, M. G.: Assessment of the regional source contributions to PM2.5 mass concentration in Beijing, Atmos. Ocean. Sc. Lett., 11, 143–149, 2018.
Hoffmann, C., Funk, R., Sommer, M., and Li, Y.: Temporal variations in PM10 and particle size distribution during Asian dust storms in Inner Mongolia, Atmos. Environ., 42, 8422–8431, 2008.
Hu, Y., Lin, J., Zhang, S., Kong, L., Fu, H., and Chen, J.: Identification of the typical metal particles among haze, fog, and clear episodes in the Beijing atmosphere, Sci. Total Environ., 511, 369–380, 2015.
Khuzestani, R. B., Schauer, J. J., Shang, J., Cai, T., Fang, D., Wei, Y., Zhang, L., and Zhang, Y.: Source apportionments of PM2.5 organic carbon during the elevated pollution episodes in the Ordos region, Inner Mongolia, China, Environ. Sci. Pollut. Res., 25, 13159–13172, 2018.
Kim, E., Hopke, P. K., and Edgerton, E. S.: Source identification of Atlanta aerosol by positive matrix factorization, J. Air Waste Manage., 53, 731–739, 2003.
Kotchenruther, R. A.: Source apportionment of PM2.5 at multiple Northwest U.S. sites: Assessing regional winter wood smoke impacts from residential wood combustion, Atmos. Environ., 142, 210–219, 2016.
Kurbanmuradov, O. and Sabelfeld, K.: Lagrangian stochastic models for turbulent dispersion in the atmospheric boundary layer, Bound.-Lay. Meteorol., 97, 191–218, 2000.
Kwok, R. H., Napelenok, S., and Baker, K.: Implementation and evaluation of PM2.5 source contribution analysis in a photochemical model, Atmos. Environ., 80, 398–407, 2013.
Leclerc, M. and Thurtell, G.: Footprint prediction of scalar fluxes using a Markovian analysis, Bound.-Lay. Meteorol., 52, 247–258, 1990.
Li, D., Liu, J., Zhang, J., Gui, H., Du, P., Yu, T., Wang, J., Lu, Y., Liu, W., and Cheng, Y.: Identification of long-range transport pathways and potential sources of PM2.5 and PM10 in Beijing from 2014 to 2015, J. Environ. Sci., 56, 214–229, 2017.
Li, H., Zhang, Q., Zhang, Q., Chen, C., Wang, L., Wei, Z., Zhou, S., Parworth, C., Zheng, B., Canonaco, F., Prévôt, A. S. H., Chen, P., Zhang, H., Wallington, T. J., and He, K.: Wintertime aerosol chemistry and haze evolution in an extremely polluted city of the North China Plain: significant contribution from coal and biomass combustion, Atmos. Chem. Phys., 17, 4751–4768, https://doi.org/10.5194/acp-17-4751-2017, 2017.
Li, J., Wang, Z., Akimoto, H., Gao, C., Pochanart, P., and Wang, X.: Modeling study of ozone seasonal cycle in lower troposphere over east Asia, J. Geophys. Res-Atoms., 112, 22–25, https://doi.org/10.1029/2006jd008209, 2007.
Li, J., Wang, Z., Akimoto, H., Yamaji, K., Takigawa, M., Pochanart, P., Liu, Y., Tanimoto, H., and Kanaya, Y.: Near-ground ozone source attributions and outflow in central eastern China during MTX2006, Atmos. Chem. Phys., 8, 7335–7351, https://doi.org/10.5194/acp-8-7335-2008, 2008.
Li, J., Yang, W., Wang, Z., Chen, H., Hu, B., Li, J., Sun, Y., and Huang, Y.: A modeling study of source-receptor relationships in atmospheric particulate matter over Northeast Asia, Atmos. Environ., 91, 40–51, 2014.
Li, J., Yang, W., Wang, Z., Chen, H., Hu, B., Li, J., Sun, Y., Fu, P., and Zhang, Y.: Modeling study of surface ozone source-receptor relationships in East Asia, Atmos. Res., 167, 77–88, 2016.
Li, J., Du, H., Wang, Z., Sun, Y., Yang, W., Li, J., Tang, X., and Fu, P.: Rapid formation of a severe regional winter haze episode over a mega-city cluster on the North China Plain, Environ. Pollut., 223, 605–615, 2017.
Li, M., Zhang, Q., Kurokawa, J.-I., Woo, J.-H., He, K., Lu, Z., Ohara, T., Song, Y., Streets, D. G., Carmichael, G. R., Cheng, Y., Hong, C., Huo, H., Jiang, X., Kang, S., Liu, F., Su, H., and Zheng, B.: MIX: a mosaic Asian anthropogenic emission inventory under the international collaboration framework of the MICS-Asia and HTAP, Atmos. Chem. Phys., 17, 935–963, https://doi.org/10.5194/acp-17-935-2017, 2017.
Li, Y., Chang, M., Ding, S., Wang, S., Ni, D., and Hu, H.: Monitoring and source apportionment of trace elements in PM2.5: Implications for local air quality management, J. Environ. Manage., 196, 16–25, 2017.
Lim, H. J. and Turpin, B. J.: Origins of primary and secondary organic aerosol in Atlanta: Results of time-resolved measurements during the Atlanta supersite experiment, Environ. Sci. Technol., 36, 4489–4496, 2002.
Liu, Y., Yan, C., and Zheng, M.: Source apportionment of black carbon during winter in Beijing, Sci. Total Environ., 618, 531–541, 2018.
Lv, B., Zhang, B., and Bai, Y.: A systematic analysis of PM2.5 in Beijing and its sources from 2000 to 2012, Atmos. Environ., 124, 98–108, 2016.
Ma, Q., Wu, Y., Zhang, D., Wang, X., Xia, Y., Liu, X., Tian, P., Han, Z., Xia, X., and Wang, Y.: Roles of regional transport and heterogeneous reactions in the PM2.5 increase during winter haze episodes in Beijing, Sci. Total Environ., 599, 246–253, 2017.
Norris, G., Duvall, R., Brown, S., and Bai, S.: EPA Positive Matrix Factorization (PMF) 5.0 Fundamentals and User Guide, U.S. Environmental Protection Agency, Washington, DC, EPA/600/R-14/108 (NTIS PB2015-105147), 2014.
Paatero, P.: Least squares formulation of robust non-negative factor analysis, Chemometr. Intell. Lab., 37, 23–35, 1997.
Paatero, P. and Tapper, U.: Positive matrix factorization: A non-negative factor model with optimal utilization of error estimates of data values, Environmetrics, 5, 111–126, 2010.
Paatero, P., Eberly, S., Brown, S. G., and Norris, G. A.: Methods for estimating uncertainty in factor analytic solutions, Atmos. Meas. Tech., 7, 781–797, https://doi.org/10.5194/amt-7-781-2014, 2014.
Pan, Y., Tian, S., Li, X., Sun, Y., Li, Y., Wentworth, G. R., and Wang, Y.: Trace elements in particulate matter from metropolitan regions of Northern China: Sources, concentrations and size distributions, Sci. Total Environ., 537, 9–22, 2015.
Pant, P. and Harrison, R. M.: Estimation of the contribution of road traffic emissions to particulate matter concentrations from field measurements: a review, Atmos. Environ., 77, 78–97, 2013.
Park, S. U. and Park, M.-S.: Aerosol size distributions observed at Naiman in the Asian dust source region of Inner Mongolia, Atmos. Environ., 82, 17–23, 2014.
Pasquill, F. and Michael, P.: Atmospheric diffusion, Phys. Today, 30, 55–57, https://doi.org/10.1063/1.3037599, 1977.
Paterson, K. G., Sagady, J. L., Hooper, D. L., Bertman, S. B., Carroll, M. A., and Shepson, P. B.: Analysis of air quality data using Positive Matrix Factorization, Environ. Sci. Technol., 33, 635–641, 1999.
Peng, X., Shi, G. L., Gao, J., Liu, J. Y., HuangFu, Y. Q., Ma, T., Wang, H. T., Zhang, Y. C., Wang, H., and Li, H.: Characteristics and sensitivity analysis of multiple-time-resolved source patterns of PM2.5 with real time data using Multilinear Engine 2, Atmos. Environ., 139, 113–121, 2016.
Shen, Z., Sun, J., Cao, J., Zhang, L., Zhang, Q., Lei, Y., Gao, J., Huang, R.J., Liu, S., and Huang, Y.: Chemical profiles of urban fugitive dust PM2.5 samples in Northern Chinese cities, Sci. Total Environ., 569, 619–626, 2016.
Shi, G., Xu, J., Peng, X., Xiao, Z., Chen, K., Tian, Y., Guan, X., Feng, Y., Yu, H., and Nenes, A.: pH of aerosols in a polluted atmosphere: source contributions to highly acidic aerosol, Environ. Sci. Technol., 51, 4289–4296, 2017.
Song, Y., Zhang, Y., Xie, S., Zeng, L., Zheng, M., Salmon, L. G., Shao, M., and Slanina, S.: Source apportionment of PM2.5 in Beijing by Positive Matrix Factorization, Atmos. Environ., 40, 1526–1537, 2006.
Sun, J., Peng, H., Chen, J., Wang, X., Wei, M., Li, W., Yang, L., Zhang, Q., Wang, W., and Mellouki, A.: An estimation of CO2 emission via agricultural crop residue open field burning in China from 1996 to 2013, J. Cleaner Prod., 112, 2625–2631, 2016.
Sun, Y., Wang, Z., Pingqing, F. U., Jiang, Q. I., Yang, T., Jie, L. I., and Xinlei, G. E.: The impact of relative humidity on aerosol composition and evolution processes during wintertime in Beijing, China, Atmos. Environ., 77, 927–934, 2013.
Sun, Y., Chen, C., Zhang, Y., Xu, W., Zhou, L., Cheng, X., Zheng, H., Ji, D., Li, J., and Tang, X.: Rapid formation and evolution of an extreme haze episode in Northern China during winter 2015, Sci. Rep., 6, 27151, https://doi.org/10.1038/srep27151, 2016.
Taghvaee, S., Sowlat, M. H., Mousavi, A., Hassanvand, M. S., Yunesian, M., Naddafi, K., and Sioutas, C.: Source apportionment of ambient PM2.5 in two locations in central Tehran using the Positive Matrix Factorization (PMF) model, Sci. Total Environ., 672, 628–629, 2018.
Tao, J., Gao, J., Zhang, L., Zhang, R., Che, H., Zhang, Z., Lin, Z., Jing, J., Cao, J., and Hsu, S.-C.: PM2.5 pollution in a megacity of southwest China: source apportionment and implication, Atmos. Chem. Phys., 14, 8679–8699, https://doi.org/10.5194/acp-14-8679-2014, 2014.
Turpin, B. J. and Lim, H. J.: Species contributions to PM2.5 mass concentrations: revisiting common assumptions for estimating organic mass, Aerosol Sci. Tech., 35, 602–610, 2001.
Vejahati, F., Xu, Z., and Gupta, R.: Trace elements in coal: Associations with coal and minerals and their behavior during coal utilization-A review, Fuel, 89, 904–911, 2010.
Watson, J. G.: Visibility: Science and regulation, J. Air Waste Manage., 52, 628–713, 2002.
Watson, J. G., Chow, J. C., and Houck, J. E.: PM2.5 chemical source profiles for vehicle exhaust, vegetative burning, geological material, and coal burning in Northwestern Colorado during 1995, Chemosphere, 43, 1141–1151, 2001.
Xie, Y., Dai, H., Dong, H., Hanaoka, T., and Masui, T.: Economic impacts from PM2.5 pollution-related health effects in China: a provincial-level analysis, Environ. Sci. Technol., 50, 4836–4843, 2016.
Yan, C., Zheng, M., Sullivan, A. P., Bosch, C., Desyaterik, Y., Andersson, A., Li, X., Guo, X., Zhou, T., and Gustafsson, Ö.: Chemical characteristics and light-absorbing property of water-soluble organic carbon in Beijing: Biomass burning contributions, Atmos. Environ., 121, 4–12, 2015.
Yang, H., Chen, J., Wen, J., Tian, H., and Liu, X.: Composition and sources of PM2.5 around the heating periods of 2013 and 2014 in Beijing: Implications for efficient mitigation measures, Atmos. Environ., 124, 378–386, 2016.
Yang, Y. R., Liu, X. G., Qu, Y., An, J. L., Jiang, R., Zhang, Y. H., Sun, Y. L., Wu, Z. J., Zhang, F., Xu, W. Q., and Ma, Q. X.: Characteristics and formation mechanism of continuous hazes in China: a case study during the autumn of 2014 in the North China Plain, Atmos. Chem. Phys., 15, 8165–8178, https://doi.org/10.5194/acp-15-8165-2015, 2015.
Yin, J., Harrison, R. M., Chen, Q., Rutter, A., and Schauer, J. J.: Source apportionment of fine particles at urban background and rural sites in the UK atmosphere, Atmos. Environ., 44, 841–851, 2010.
Young, L. H., Li, C. H., Lin, M. Y., Hwang, B. F., Hsu, H. T., Chen, Y. C., Jung, C. R., Chen, K. C., Cheng, D. H., and Wang, V. S.: Field performance of a semi-continuous monitor for ambient PM2.5 water-soluble inorganic ions and gases at a suburban site, Atmos. Environ., 144, 376–388, 2016.
Yu, L., Wang, G., Zhang, R., Zhang, L., Song, Y., Wu, B., Li, X., An, K., and Chu, J.: Characterization and source apportionment of PM2.5 in an urban environment in Beijing, Aerosol Air Qual. Res, 13, 574–583, 2013.
Zhang, R., Jing, J., Tao, J., Hsu, S.-C., Wang, G., Cao, J., Lee, C. S. L., Zhu, L., Chen, Z., Zhao, Y., and Shen, Z.: Chemical characterization and source apportionment of PM2.5 in Beijing: seasonal perspective, Atmos. Chem. Phys., 13, 7053–7074, https://doi.org/10.5194/acp-13-7053-2013, 2013.
Zhang, X., Gong, S., Shen, Z., Mei, F., Xi, X., Liu, L., Zhou, Z., Wang, D., Wang, Y., and Cheng, Y.: Characterization of soil dust aerosol in China and its transport and distribution during 2001 ACE-Asia: 1. Network observations, J. Geophys. Res-Atmos., 108, 4261, https://doi.org/10.1029/2002jd002632, 2003.
Zhang, Y., Dore, A., Ma, L., Liu, X., Ma, W., Cape, J., and Zhang, F.: Agricultural ammonia emissions inventory and spatial distribution in the North China Plain, Environ. Pollut., 158, 490–501, 2010.
Zhang, Y., Zheng, M., Cai, J., Yan, C., Hu, Y., Russell, A., Wang, X., Wang, S., and Zhang, Y.: Comparison and overview of PM2.5 source apportionment methods, Chin. Sci. Bull., 60, 109–121, 2015.
Zhao, B., Wang, P., Ma, J. Z., Zhu, S., Pozzer, A., and Li, W.: A high-resolution emission inventory of primary pollutants for the Huabei region, China, Atmos. Chem. Phys., 12, 481–501, https://doi.org/10.5194/acp-12-481-2012, 2012.
Zhao, X., Hu, Q., Wang, X., Xiang, D., He, Q., Zhou, Z., Shen, R., Lü, S., Liu, T., and Fu, X.: Composition profiles of organic aerosols from Chinese residential cooking: case study in urban Guangzhou, south China, J. Atmos. Chem., 72, 1–18, 2015.
Zhao, X. J., Zhao, P. S., Xu, J., Meng,, W., Pu, W. W., Dong, F., He, D., and Shi, Q. F.: Analysis of a winter regional haze event and its formation mechanism in the North China Plain, Atmos. Chem. Phys., 13, 5685–5696, https://doi.org/10.5194/acp-13-5685-2013, 2013.
Zheng, M., Salmon, L. G., Schauer, J. J., Zeng, L., Kiang, C., Zhang, Y., and Cass, G. R.: Seasonal trends in PM2.5 source contributions in Beijing, China, Atmos. Environ., 39, 3967–3976, 2005.
Zheng, M., Zhao, X., Cheng, Y., Yan, C., Shi, W., Zhang, X., Weber, R. J., Schauer, J. J., Wang, X., and Edgerton, E. S.: Sources of primary and secondary organic aerosol and their diurnal variations, J. Hazard. Mater., 264, 536–544, 2014.
Zong, Z., Wang, X., Tian, C., Chen, Y., Qu, L., Ji, L., Zhi, G., Li, J., and Zhang, G.: Source apportionment of PM2.5 at a regional background site in North China using PMF linked with radiocarbon analysis: insight into the contribution of biomass burning, Atmos. Chem. Phys., 16, 11249–11265, https://doi.org/10.5194/acp-16-11249-2016, 2016.