the Creative Commons Attribution 4.0 License.
the Creative Commons Attribution 4.0 License.
 | 16 May 2019
Assessment of dicarbonyl contributions to secondary organic aerosols over China using RAMS-CMAQ
Jialin Li
Guiqian Tang
Fangkun Wu
Yongfu Xu
The concentration of secondary organic aerosol (SOA) is underestimated in current model studies. Recent research suggests that the reactive uptake of dicarbonyls contributes to the production of SOA, although few models have included this pathway. Glyoxal, an important representative component of dicarbonyls in models, is significantly underestimated. We therefore incorporated the reactive uptake of dicarbonyls into the regional air quality modeling system RAMS-CMAQ (the Regional Atmospheric Modeling System-Community Multiscale Air Quality) to evaluate the contribution of dicarbonyls to SOA, and we then assess the impact of the underestimation of glyoxal on the production of SOA in China during two time periods: 3 June to 11 July 2014 (episode 1) and 14 October to 14 November 2014 (episode 2). When the reactive uptake process was added, the modeled mean concentration of SOA in episode 1 increased by 3.65 µg m−3, which explained 34.8 % of the unaccounted-for source of SOA. Meanwhile the increase in the concentration of SOA in episode 2 was 1.82 µg m−3 as a result of the lower liquid water content and the lower amount of dicarbonyls produced from biogenic precursors in the fall. On this basis, when the glyoxal simulation was improved, the modeled mean dicarbonyl-derived SOA (AAQ) increased by more than a factor of 2 in both episodes relative to case 1. AAQ in episode 1 contributed, on average, 60.6 % of the total concentration of SOA and the increase in this contribution represented 69.1 % of the unaccounted-for concentration of SOA, whereas the mean AAQ in episode 2 accounted for 64.5 % of total concentration of SOA. Based on the results, the mean AAQ over China was generally higher in the east than in the west during the two episodes. The highest value (10–15 µg m−3) of episode 1 appeared in the areas around the lower reaches of the Yellow River, whereas the highest value of 5–10 µg m−3 in episode 2 was concentrated over regions from south of the lower reaches of the Yellow River to the south of Guangzhou Province as well as the Sichuan Basin. The contribution of AAQ to the concentration of SOA in episode 1 varied from 10 % to 90 % throughout China, with the highest contributions (70 %–90 %) in the coastal regions and offshore along the East China Sea to the South China Sea and in the southwestern regions. The fraction of AAQ to SOA in episode 2 was in the range of 10 %–80 % over China, with the fraction up to 80 % in a small portion of northeastern China.
- Article
(5897 KB) - Full-text XML
-
Supplement
(5627 KB) - BibTeX
- EndNote


The fine particle fraction of aerosols (PM2.5, i.e., particulate matter with an aerodynamic diameter ≤2.5 µm) not only absorbs and scatters sunlight in the atmosphere, resulting in a reduction in visibility and effects on the global climate (IPCC, 2007), but also has adverse effects on human health (Harrison and Yin, 2000; Pöschl, 2005). Organic aerosol (OA) is a major component of fine particulate matter globally (Murphy et al., 2006; Zhang et al., 2007), typically making up 20 %–90 % of the fine particle fraction (Roberts et al., 2001; Kanakidou et al., 2005; Zhang et al., 2007), suggesting that it has a significant effect on the characteristics and properties of fine particulate matter. Organic aerosols are formed from both primary (direct emissions) and secondary sources. Secondary organic aerosols (SOAs) are formed from precursors of volatile organic compounds (VOCs), which can be either natural or anthropogenic. However, the underestimation of organic aerosol has become a major issue in almost all current atmospheric models due to the incomplete representation of SOA (Heald et al., 2005; Morris et al., 2005, 2006; Goldstein and Galbally, 2007; Yu et al., 2008; Fu et al., 2009; Farina et al., 2010; Jiang et al., 2012; Zhang and Ying, 2012; Jo et al., 2013; Lin et al., 2016).
It has been reported that the concentration of SOA in the models is underestimated by 1 to 2 orders of magnitude (de Gouw et al., 2005; Volkamer et al., 2006). These results have motivated researchers to investigate why these models are predicting SOA concentrations so poorly. Traditionally, improvements in models have mainly concentrated on the gas-phase and derived heterogeneous formation processes, such as the formation of SOA from aromatic compounds under low- and high-NOx conditions (Ng et al., 2007), the production of SOA from the oxidation of isoprene and its subsequent growth through acid catalysis (Kroll et al., 2005, 2006; Surratt et al., 2007), the use of the volatile bias set method to depict the formation of SOA instead of the two-product model (Lane et al., 2008; Murphy and Pandis, 2009; Han et al., 2016; Lin et al., 2016), and the formation of SOA through the uptake of isoprene epoxides on the surface of aerosols (Ying et al., 2015; Hu et al., 2017). The gap has been closed to some degree through the SOA modeling efforts, but there are still large uncertainties (Tsigaridis et al., 2014).
Many studies have suggested that glyoxal and methylglyoxal can form SOAs through chemical reactions in cloud or fog water (e.g., Warneck, 2003; Ervens et al., 2004; Lim and Ziemann, 2005; Carlton et al., 2006; Loeffler et al., 2006), or by reactive uptake on the surface of cloud droplets and aqueous aerosols (e.g., Liggio et al., 2005; Corrigan et al., 2008; Galloway et al., 2009; Ervens and Volkamer, 2010; Lim et al., 2010), which is probably a significant source of SOA (Ervens et al., 2014; Curry et al., 2018). A few studies (e.g., Carlton et al., 2008, 2010; Fu et al., 2009; Lin et al., 2012, 2014; Li et al., 2013; Woo and McNeill, 2015) have incorporated aqueous SOA formation pathways into atmospheric models. Several of these studies have shown that chemical reactions only in cloud or fog water make a negligible contribution to near-surface SOA relative to reactive uptake on the surface of cloud droplets and aqueous aerosols, and that the aqueous SOA formation cannot completely explain the gaps between the observations and simulations. There are still considerable uncertainties in our knowledge of the formation of SOA.
A series of studies (Fu et al., 2008; Myriokefalitakis et al., 2008; Liu et al., 2012; Li et al., 2018) has shown that there is a substantial underestimation in the modeled vertical column densities (VCDs) of glyoxal, but few studies have considered the impact of this underestimation on simulations of SOA concentrations. Xu et al. (2017) and Ervens et al. (2011) showed that the aqueous SOA formation depends on the liquid water content (LWC), which varies between seasons. Previous studies, such as those of Fu et al. (2009) and Li et al. (2013), have only considered the contribution from SOA derived from the reactive uptake of dicarbonyls (pathway M) in the summer period or over evergreen areas. In this study, we not only incorporated pathway M into the RAMS-CMAQ (the Regional Atmospheric Modeling System-Community Multiscale Air Quality) modeling system to evaluate the corresponding contribution of dicarbonyls to SOA, but also improved the simulation of glyoxal concentrations by investigating the reasons for its underestimation and assessing its impacts on the concentration of SOA during the two episodes in the summer and fall of China.
2.1 Base model description
J. Li et al. (2017) used the RAMS-CMAQ modeling system to investigate the effects of underestimated aromatic VOC emissions and yields of SOAs from different gas precursors on the concentration of SOAs. Similarly, we used Version 4.7.1 of the CMAQ, which is coupled with the gas-phase photochemical mechanism SAPRC99 (1999 Statewide Air Pollutant Research Center; Carter, 2000) and Version 5 of the aerosol module (AERO5; Byun and Schere, 2006; Foley et al., 2010). There are three major formation pathways for SOAs in this version. Based on the two-product approach, the first pathway is the equilibrium partition of semivolatile products formed from the oxidation of seven VOC precursors: long-chain alkanes, benzene (BNZ), high-yield aromatics (mainly toluene, ARO1), low-yield aromatics (mainly xylene, ARO2), isoprene (ISOP), monoterpene (TRP) and sesquiterpenes (SESQ). The second pathway is the oligomerization of semivolatile SOAs formed through the first pathway (Kalberer et al., 2004), namely the aging process. The third pathway is the formation of SOA via the in-cloud oxidation of glyoxal (GLY) and methylglyoxal (MGLY) (Carlton et al., 2008), both of which represent dicarbonyls in the model. The details of these formation pathways are given in Carlton et al. (2010).
The meteorological fields used to drive CMAQ are obtained from RAMS, which has been described in detail by Cotton et al. (2003). The National Centers for Environmental Prediction reanalysis datasets are served as the initial and lateral boundary meteorological conditions input into RAMS. The boundary conditions used for the RAMS computations include the weekly average sea surface temperature and the monthly measured snow cover. The final modeled results are output through the four-dimensional data assimilation mode using nudging analysis.
The emission sources are derived from several different inventories. Anthropogenic emissions (M. Li et al., 2017) – including SO2, NOx, CO, black carbon, non-methane VOCs, organic carbon, NH3 and other particulate matter – are obtained from the monthly emissions inventory of 2012. There are five emission sectors (the power, industrial, residential, transportation and agricultural sectors) in the inventory with a spatial resolution of (see http://www.meicmodel.org, last access: 16 April 2019). The Model of Emissions of Gases and Aerosols from Nature (MEGAN) (Guenther et al., 2012) provides the biogenic emissions. The emissions from open biomass burning are derived from the Global Fire Emissions Database, Version 4 (Randerson et al., 2015), whereas the information of monthly lightning NOx is obtained from the Global Emissions Inventory Activity with a spatial resolution of (Benkovitz et al., 1996). The emissions of NOx from the soil are derived from the Regional Emission inventory in ASia, Version 2.1, with a spatial resolution of (Kurokawa et al., 2013). The online dust and sea salt emissions are calculated using the empirical model developed by Han et al. (2004) and the scheme of Gong (2003), respectively. The calculation of the model boundary conditions is supported by the Model of Ozone and Related Tracers, Version 4 (MOZART-4) (Emmons et al., 2010).
The model domain is divided into 105×86 grid cells with the center located at 35∘ N, 110∘ E (Fig. 1). The map projection is rotated polar-stereographic with a horizontal resolution of 64 km. The vertical simulation region is unequally spaced from the ground surface to ∼23 km. There are 25 layers in the σz coordinate system in RAMS, with nine layers located in the lowest 2 km to resolve the planetary boundary layer. The vertical dimension of CMAQ is divided into 15 layers, with the lowest seven layers the same as those in RAMS. We focused on the area outlined by the blue box in Fig. 1.
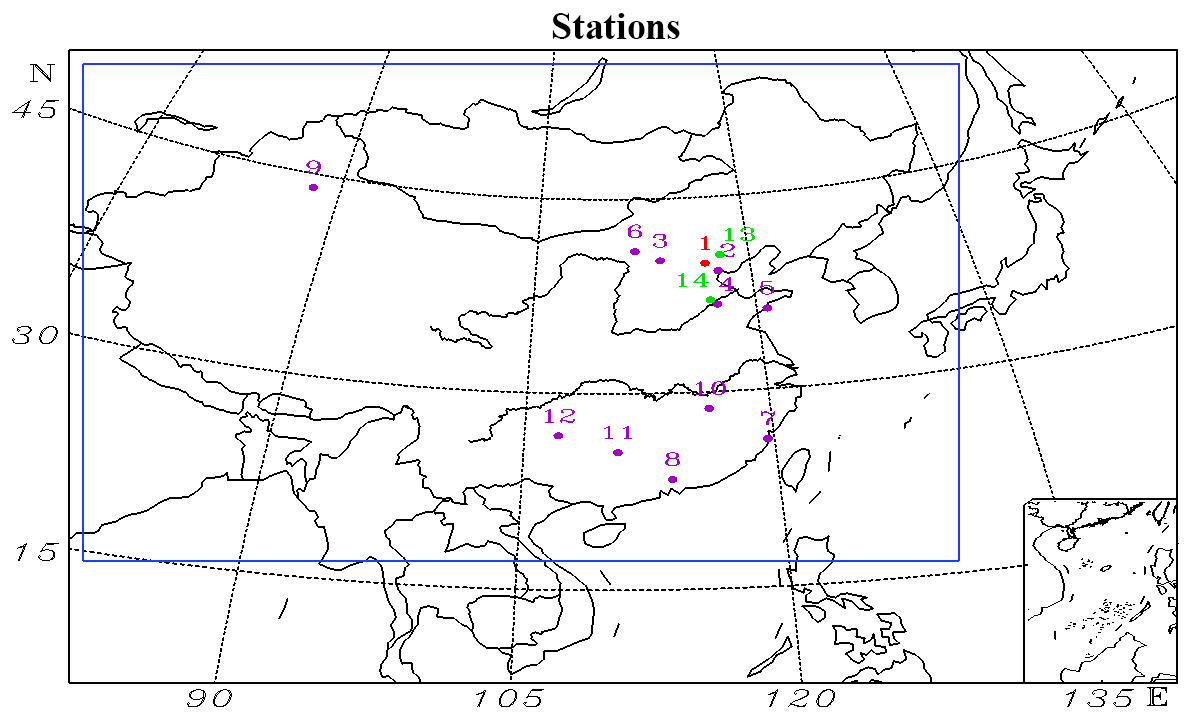
Figure 1Geographical locations of the measurement stations in the model domain. 1: Beijing; 2: Tianjin; 3: Datong; 4: Jinan; 5: Qingdao; 6: Hohhot; 7: Fuzhou; 8: Guangzhou; 9: Urumqi; 10: Nanchang; 11: Guilin; 12: Guiyang; 13: Xinglong; 14: Yucheng. The different colors denote which variables are compared at each station. Purple: meteorological parameters; green: concentrations of aromatics; red: both meteorological parameters and aromatic compound concentrations.
2.2 Adding the reactive uptake process
There is a standard reaction probability formulation for reactive uptake of gases by aerosols and clouds in Jacob (2000). In this formulation, the first-order rate constant k for the chemical loss of a gas-phase species to the aerosols or cloud droplets through molecular diffusion and free collision is given by
where Dg is the gas-phase molecular diffusion coefficient, a is the radius of the aerosol particle or cloud droplet, v is the mean molecular speed, γ is the reaction uptake coefficient when a collision occurs between a gas-phase molecule and the aqueous surface, and A is the aqueous particle surface area per unit volume of air.
We implement the reactive uptake of dicarbonyls by cloud droplets following the standard Eq. (1). In a similar manner to Fu et al. (2008) and Li et al. (2013), the cloud droplet surface area is calculated from the LWC in the cloudy fraction of the model grid by assuming an effective droplet radius of 6 µm for continental clouds and 10 µm for maritime clouds. Dg is calculated according to Perry and Green (1999) following Dentener and Crutzen (1993). Similar to previous studies (e.g., Lin et al., 2014; Ying et al., 2015; Hu et al., 2017), the uptake of gas-phase dicarbonyls on aqueous aerosols is simply parameterized using the collision limitation (vγA∕4) of Eq. (1). The value of for glyoxal from Liggio et al. (2005) is used in both cloud and aerosol processing. While the uptake coefficient adopted for methylglyoxal is from De Haan et al. (2018), the average value of measured on cloud-processed glycine aerosols is used to account for the uptake by cloud droplets; the average value of used in aerosol processing is derived from the uptake coefficients measured on deliquesced ammonium sulfate aerosols () and on deliquesced glycine aerosols (, median value).
2.3 Observational data
To assess the contribution of dicarbonyl species to the concentration of SOA, we used the observed hourly concentration of SOA in Beijing during the summer and fall of 2014 measured by Xu et al. (2017) with an Aerodyne high-resolution time-of-flight aerosol mass spectrometer. Samples were taken from 3 June to 11 July 2014 (episode 1) and 14 October to 14 November 2014 (episode 2) at the Institute of Atmospheric Physics in China. More detailed information about the data has been reported by Xu et al. (2017). The simulation periods are from 22 May to 11 July and from 1 October to 14 November, with the first 12 d as the spin-up time. To evaluate the reasonability in simulating the formation processes of aqueous SOAs and analyze the relative causes, the corresponding cloud water path (CWP) and cloud fraction data measured by the MODerate Resolution Imaging Spectroradiometer (MODIS) were obtained from the website https://ladsweb.modaps.eosdis.nasa.gov/search/order/4/MYDATML2–61 (last access: 16 April 2019), and the observed precipitation data were downloaded from the website http://chrsdata.eng.uci.edu/ (last access: 16 April 2019).
Both Liu et al. (2012) and Li et al. (2018) have suggested that the underestimation of glyoxal concentrations in simulations is related to the underpredicted emission of aromatic compounds. Therefore, the biases in the emission of aromatic compounds need to be evaluated through a comparison of the observed and simulated concentrations of aromatic compounds. The observed data were collected at 14:00 local standard time every Thursday by gas chromatography and mass spectrometry in Beijing, Xinglong and Yucheng (Fig. 1). Sun et al. (2016) and Wu et al. (2016) have presented the detailed information.
To evaluate the performance of our model, we also compared the simulated PM2.5 concentrations and several meteorological factors with the results measured over 12 stations (Fig. 1) during the two episodes. The observed meteorological data were derived from the Meteorological Information Comprehensive Analysis and Process System (MICAPS) dataset, whereas the Chinese National Environmental Monitoring Center provided the measured concentrations of PM2.5.
3.1 Base model evaluation
Table 1 shows statistical results of the meteorological parameters (i.e., temperature, relative humidity, wind speed and wind direction) and PM2.5 concentrations in the two analyzed episodes, where N is the total number of samples; IOA is the index of agreement, which can synthetically reflect the combination of the modeled value and variable tendency being good or bad (Willmott, 1981); Cmod and Cobs are the average values of modeled and observed results, respectively; MB and FB are the mean and fractional bias, respectively; RMSE and FE are the root-mean-square and fractional error, respectively; and R is the correlation coefficient between the observed and simulated results. The calculations of these statistical parameters can be found in Juda-Rezler et al. (2012). and represent the proportions of compared results that the absolute biases between the simulated and measured wind directions are within 22.5 and 45∘, respectively (J. Li et al., 2017).
Table 1Statistics for the meteorological variables and PM2.5 between the simulated and observed data during the two episodes.
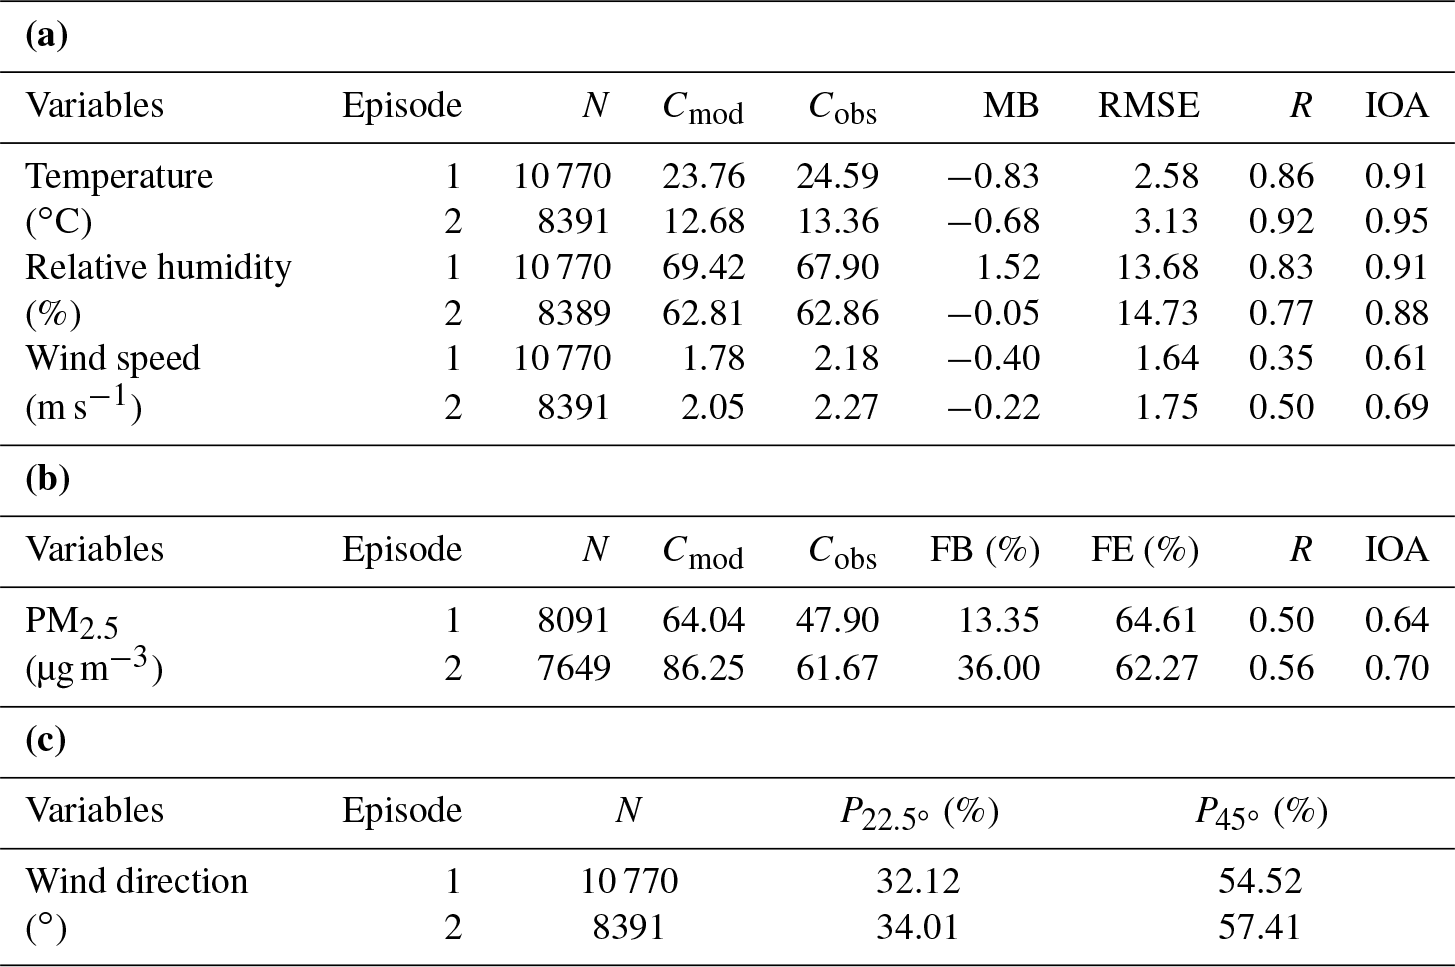
N is the total number of samples. Cmod and Cobs are the average value of modeled and observed results, respectively. MB and FB are the mean and fractional bias, respectively. RMSE and FE are the root-mean-square and fractional error, respectively. IOA is the index of agreement. R is the correlation coefficient between the observed and simulated results. and represent the proportions of compared results that the absolute biases between the simulated and measured wind directions are within 22.5 and 45∘, respectively.
There are inevitably some biases in the simulated meteorological parameters relative to the observations due to the limited model resolution and system errors. Nevertheless, the model reproduces the magnitude and variation trend of the temperature and relative humidity fairly well (Figs. S1 and S2 in the Supplement), with IOAs for temperature of 0.91 and 0.95 in the two episodes and IOAs of 0.91 and 0.88 for the relative humidity, comparable with the results of Li et al. (2012) and Wang et al. (2014). The mean biases of temperature (−0.83, −0.68 ∘C) and relative humidity (1.53 %, −0.05 %) are small in the two episodes. The RMSEs of temperature and relative humidity are comparable with the results of Gao et al. (2016) and Zhang et al. (2012), implying a reasonable performance of the simulation. Although the capture of the variable tendency of wind speed (Fig. S3) by the model is rather poor, the small values for the mean bias (−0.40, −0.22 m s−1) and the high IOAs (0.61, 0.69) indicate a better performance than that reported by Feng et al. (2016) and Wang et al. (2014) in simulating the wind speed. The RMSE of wind speed shows that the simulated results achieve the criteria for a good performance ( m s−1) given by Emery et al. (2001). For the wind direction (Fig. S4), and are 32.12 % and 54.52 % in episode 1 and 34.01 % and 57.41 % in episode 2, indicating the reasonable simulation of wind direction. Therefore the model provides a reasonable meteorological field for the subsequent simulations.
The modeled PM2.5 concentrations are generally higher than the observed values in the two episodes over the 12 stations (Fig. S5). Except for the limited resolution of the model, the uncertainties of the emission inventory and the effects of the background transport may also contribute to the overestimation. However, the correlation coefficients of PM2.5 are 0.50 and 0.56 in the two episodes, respectively, and the IOAs are 0.64 and 0.70 in the two episodes, respectively, indicating good capture of the variable tendency and magnitude by the model. Both the fractional error and the fractional bias for PM2.5 in the two episodes fulfill the performance criteria (FE ≤75 %, %) given by Boylan and Russell (2006), implying a good performance in simulating PM2.5. These results show that the model gives a reasonable simulation of the chemical species.
The modeled and satellite-observed mean CWPs were compared in Fig. 2 during the two analyzed episodes to evaluate the reasonability in simulating the aqueous SOA formations. Figure 2a and b show that in episode 1, during one summer period, the highest observed CWP (400–500 g m−2) mainly appears over the Yellow Sea and Bohai Sea and in parts of southeastern and southern China, whereas the observed second highest values (200–300 g m−2) are concentrated in from the Qinghai–Tibet Plateau to the North China Plain along the Yellow River Basin. The modeled high CWP (100–400 g m−2) appears in the same regions as in the observational dataset. In episode 2, during one fall period (Fig. 2c and d), the observed highest (300–500 g m−2) and second highest (200–300 g m−2) CWP values are mainly concentrated in the Hetao area and the regions including northeastern China and Inner Mongolia, respectively. The modeled values (50–150 g m−2) are also high over these regions.
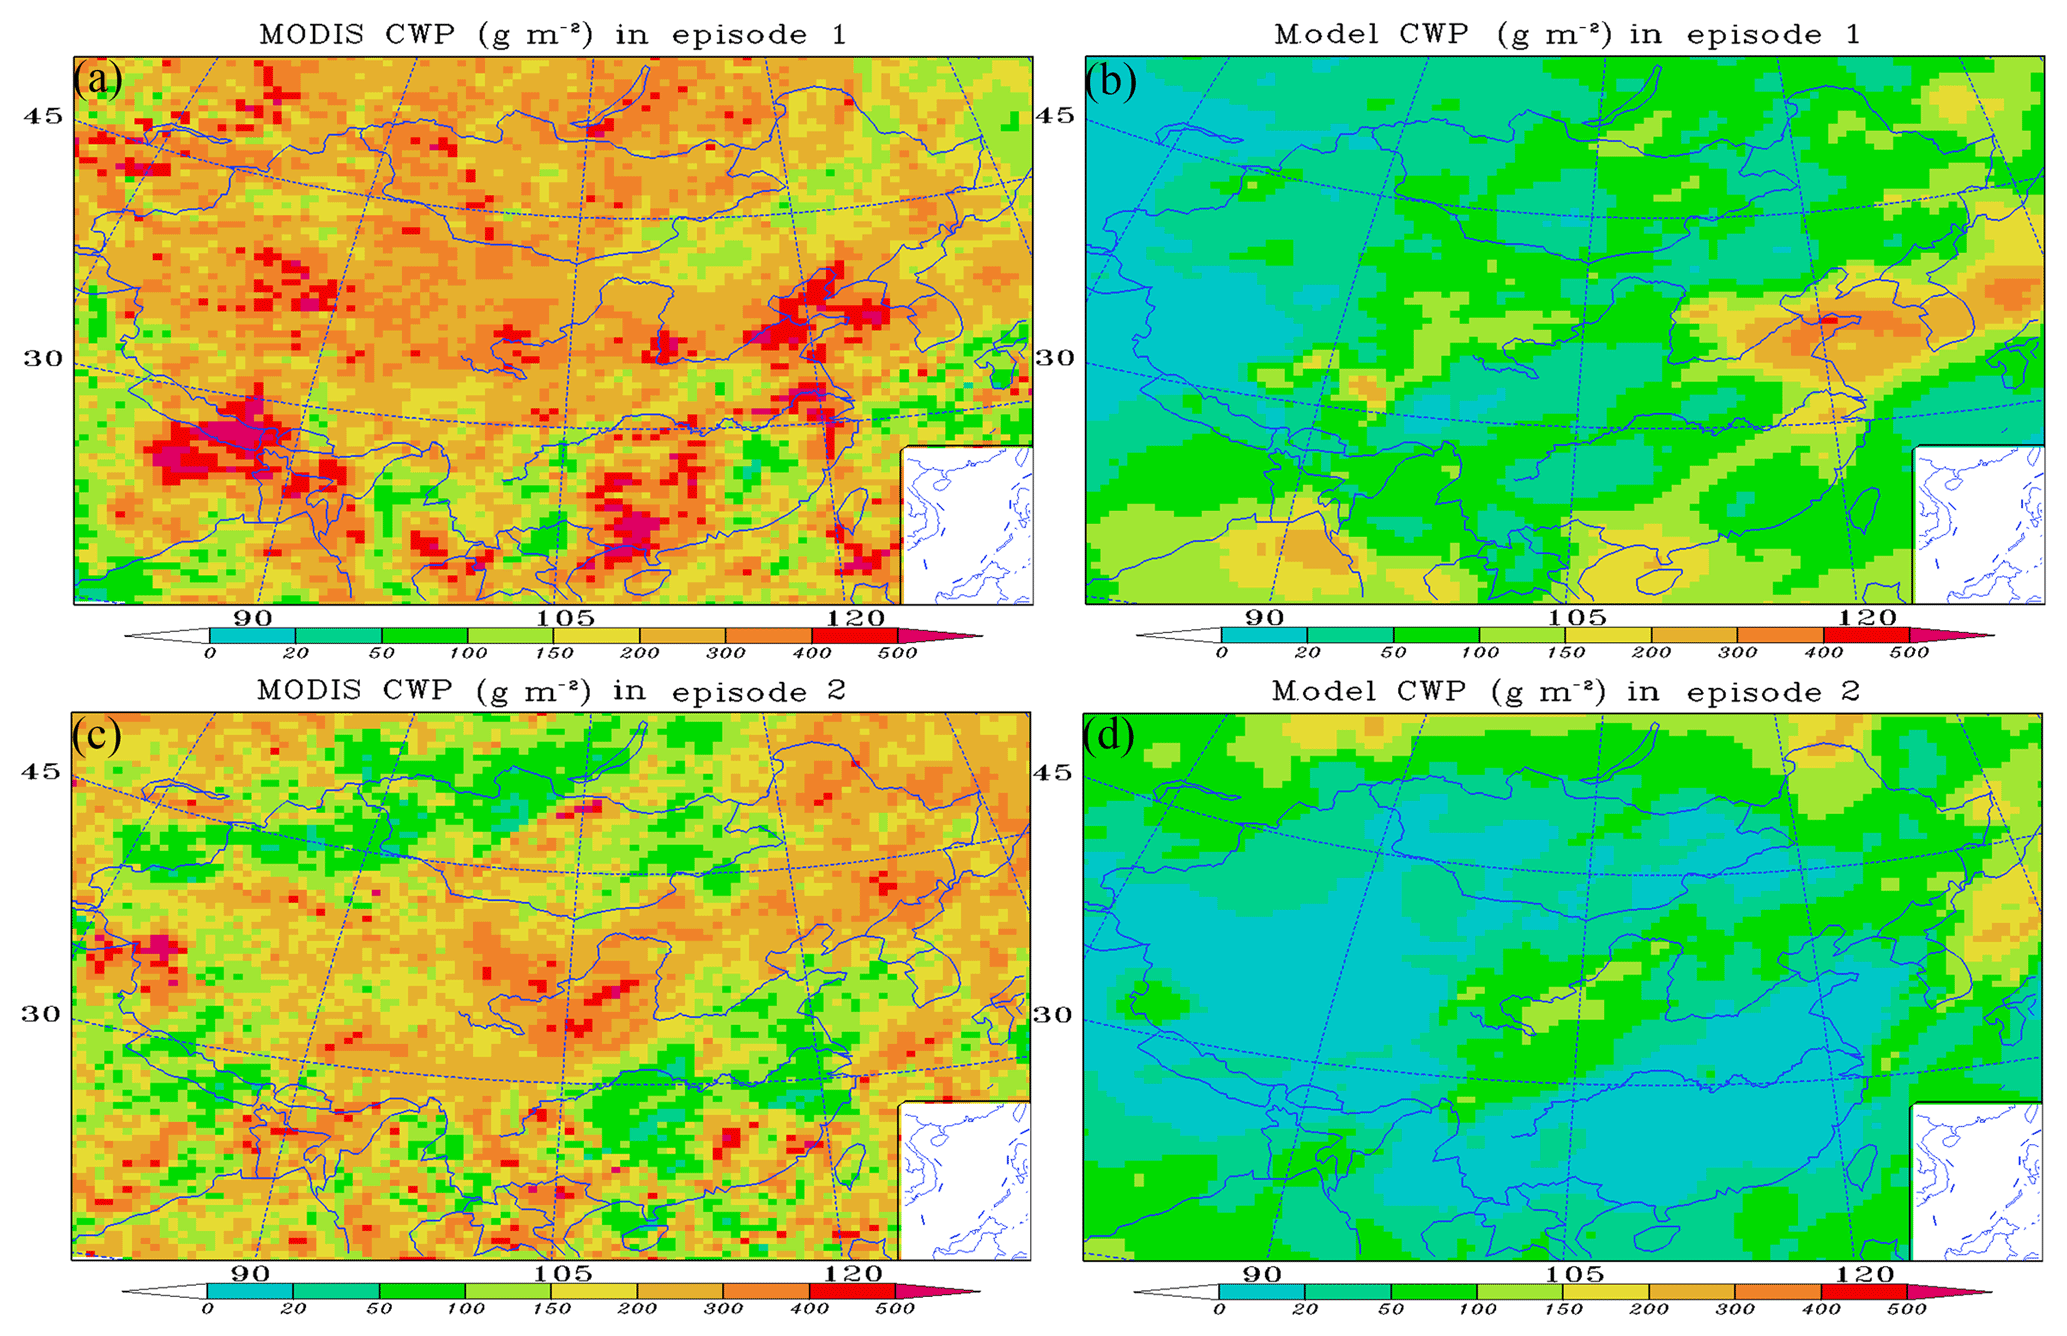
Figure 2Observed and simulated distributions of the mean cloud water path (CWP) during the two episodes (a, c: MODIS observation; b, d: results of simulations).
Overall, there are obvious biases in the numerical values between the observed and simulated CWPs. According to the comparisons between the observed and modeled cloud fraction and precipitation (shown in Figs. S6 and S7), this is a result that has a lot to do with the uncertainties in the cloud fraction estimations, which indirectly lead to uncertainties in the simulations of the concentrations of SOAs. However, the mean distribution patterns of the simulated CWP during the two episodes are similar to the observational results, indicating few impacts on the simulated distribution of SOA. Both the simulated and observed CWPs in episode 1 are higher than in episode 2, also implying differences in the simulation of SOA between the two episodes.
3.2 Model results and analyses
As described in Sect. 2.3 and with reference to previous research, the underestimation of glyoxal concentrations may partly result from the underprediction of the emissions of aromatic compounds. It is therefore necessary to evaluate the emissions of aromatic compounds during the analyzed episodes with the base model before designing and implementing the sensitivity case studies. For this purpose, comparisons were made between the simulated and observed concentrations of aromatic compounds in a similar manner to the work of Zhang and Ying (2011).
Figure 3 presents the ratio of the observed-to-predicted (O∕P ratio) concentrations of aromatic compounds for the original emissions (Fig. 3a and c) and a 3-fold increase in the emissions of aromatic compounds (Fig. 3b and d) during the two episodes. Figure 3a shows that there are biases between the observed and simulated concentrations of aromatic compounds in episode 1 at the original emission rates of the aromatic compounds. The O∕P ratios are less variable for ARO1 than for ARO2, with both the mean and median O∕P values being close to 2. The range of O∕P values is large for ARO2 and there is an order of magnitude difference between the lowest and highest ratios. Both the mean and median O∕P ratios of ARO2 are about 20. These results show that there are underestimations in the emissions of ARO1 and ARO2. In view of the limitations of the amount of observed data and the nonlinear relationship between emissions and the concentrations (Li et al., 2018), the underestimation in the emission rates has been conservatively estimated to be a factor of 3. As a result, when the emission rates of aromatic compounds are increased (Fig. 3b), the ratios of ARO1 and ARO2 in episode 1 are less variable, especially ARO2. The mean and median ratios of ARO1 are both around 1, whereas the two ratios for ARO2 decrease from 20 to 6. The results for episode 2 are similar to those in episode 1. Figure 3c shows that the original O∕P ratio of ARO1 varies between 1 and 3.5, with a mean value close to 2, whereas the ratio of ARO2 ranges from 1 to 5, with a mean ratio of about 4, both of which indicate unaccounted-for emissions of aromatic compounds. Figure 3d shows a clear decrease in the biases of the observed and simulated concentrations of aromatic compounds. The O∕P ratios of ARO1 and ARO2 are concentrated and vary between 1 and 2, with a mean ratio close to 1. However, it is difficult to determine whether the factor of 3 is the actual underestimation in the emission of aromatic compounds as a result of its dependence on space and time. For convenience, a factor of 3 is chosen here as a uniform scale with which to assess the unaccounted-for emissions of aromatic compounds.
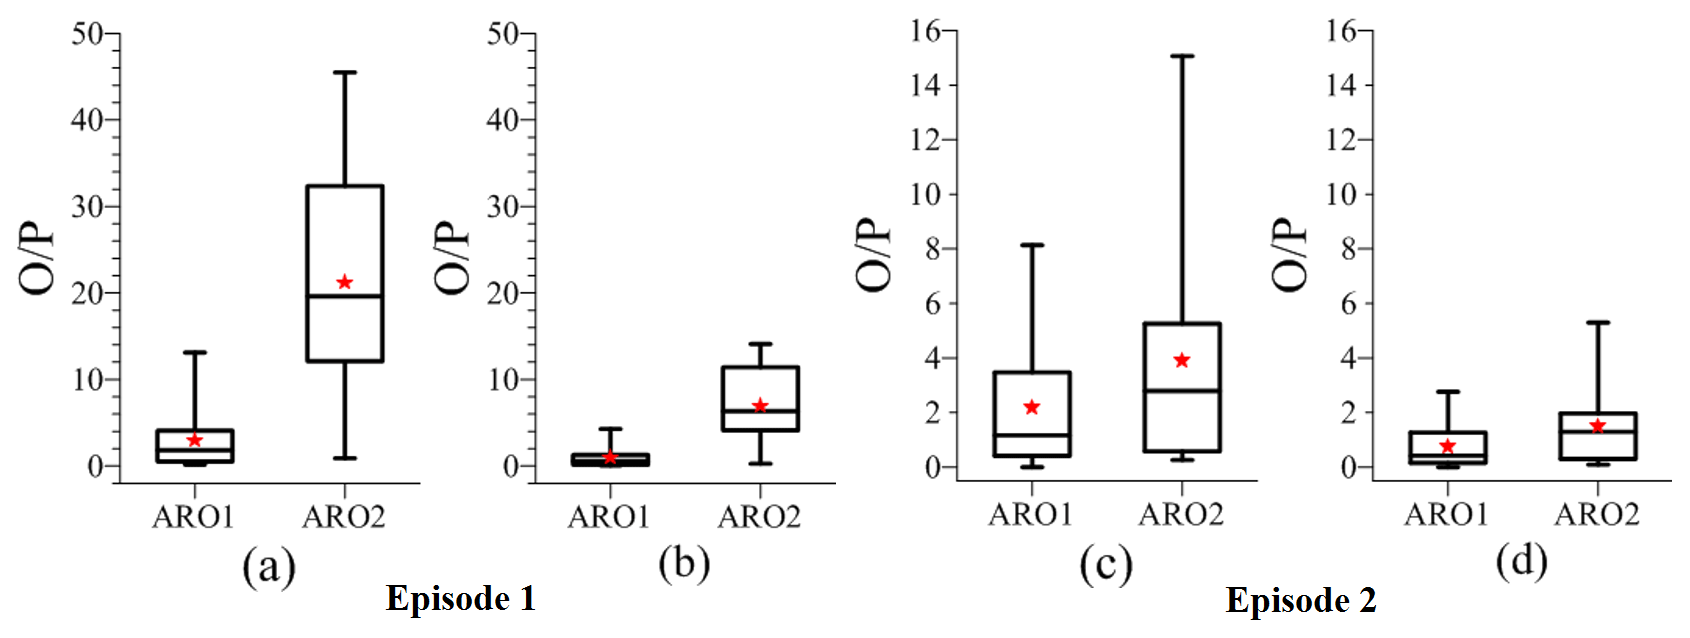
Figure 3Box–whisker plot of the observed-to-predicted (O∕P) ratios of aromatic compounds during the two analyzed episodes. The observed data were measured at 14:00 LST every Thursday by gas chromatography and mass spectrometry at three sites (Beijing, Xinglong and Yucheng). (a, c) Original emissions of aromatic compounds and (b, d) a 3-fold increase in the emissions of aromatic compounds. The red stars show the mean O∕P ratios.
Three sensitivity simulation case studies are designed based on these results. Case 0 is run with the three default SOA formation pathways included in the standard model. According to Fu et al. (2008), the default aqueous SOA formation pathway is included in the pathway M. To avoid double-counting the loss of dicarbonyls through the in-cloud oxidation and the following formed SOA, the default aqueous SOA formation pathway is turned off when case 1 is run with the pathway M incorporated. According to previous studies (e.g., Stavrakou et al., 2009, 2010; Li et al., 2016), the yields of glyoxal from isoprene are very likely to be underestimated. Li et al. (2018) has run a simple sensitivity case to evaluate the impacts of underestimated glyoxal yields from isoprene on glyoxal simulation. From their results, a better agreement was achieved between the observed and simulated glyoxal after a 5-fold increase of glyoxal yields from isoprene. More detailed analyses can be found in Li et al. (2018). Thus, to take the effects of the underestimations of glyoxal concentrations into consideration, case 2 is designed with a 3-fold increase in the emissions of aromatic compounds and a 5-fold increase in the molar yield of glyoxal from isoprene based on the results of case 1.
Figure 4 compares the hourly concentrations of the simulated and observed SOAs during the two analyzed episodes; the corresponding statistical parameters are listed in Table 2. The concentrations of SOAs are measured from PM1. The observed PM1 ∕ PM2.5 ratio of 0.77 (Xu et al., 2015) was used to convert the observed concentrations for comparison with the simulated results for PM2.5.
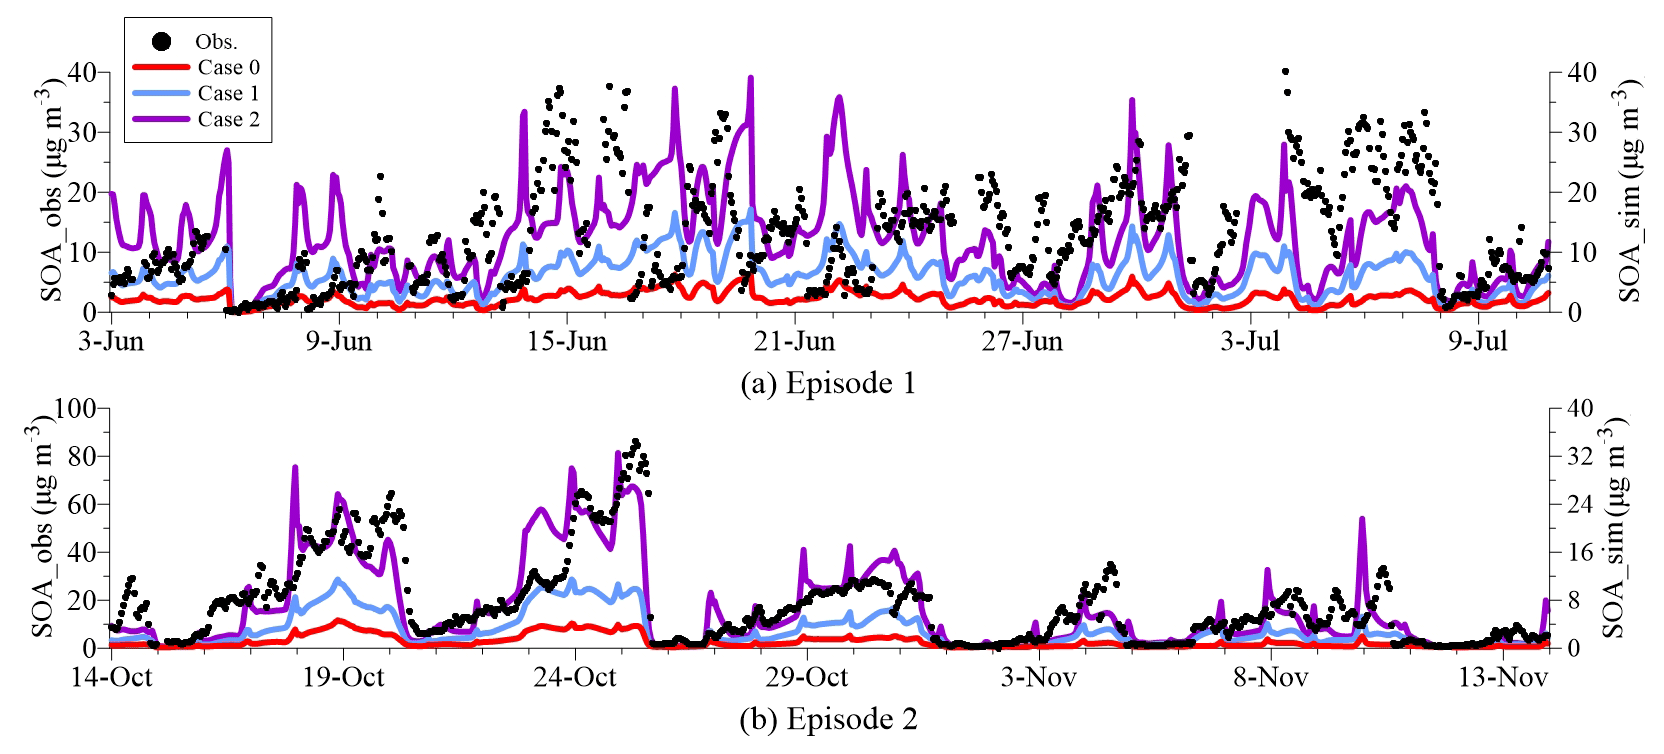
Figure 4Hourly concentrations of the observed and simulated near-surface SOA concentrations in episode 1 (a) and 2 (b). Case 0 is the base run, case 1 is run with the incorporation of the reactive uptake of dicarbonyls (excluding the default in-cloud dicarbonyl oxidations), and case 2 is run with the glyoxal underestimation taken into consideration based on case 1.
Table 2Performance statistics of the modeled and observed SOA concentrations (µg m−3).
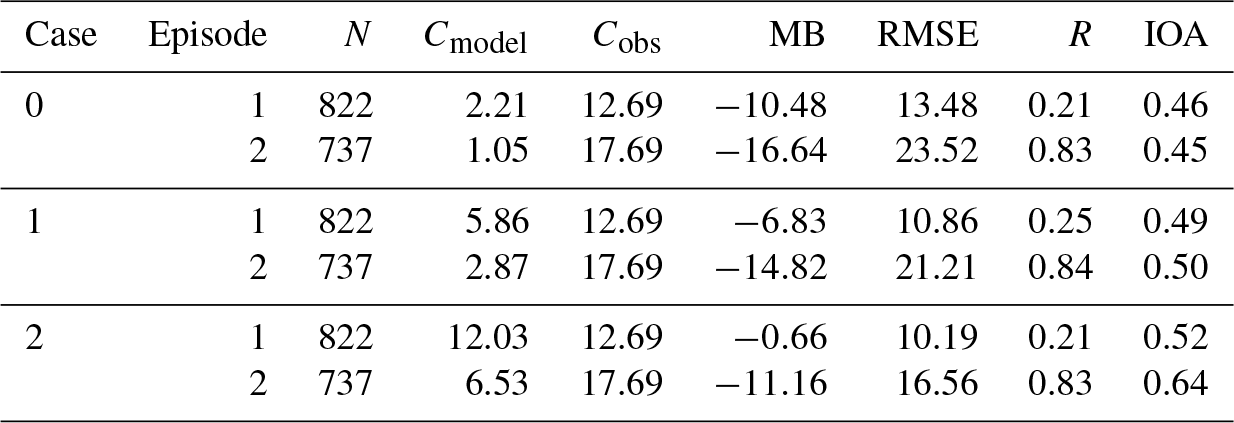
In case 0, the SOA concentrations in episode 1 (Fig. 4a) are significantly underestimated by an average factor of 5.7, with the differences being as high as a multiple of ≥60. As a result of the impacts of uncertainties in the meteorological fields and emissions, the variation trend of the concentration of SOA is not well captured by the model (R=0.21). Similarly, although the variation in SOA is reproduced well in episode 2 (R=0.83) (Fig. 4b), the concentration of SOA is still underpredicted by an order of magnitude. The biases between the observed and simulated concentrations of SOAs decrease in case 1 when pathway M is added to the model, especially in episode 1. It shows that the mean concentration of SOA in case 1 increases by 3.65 µg m−3 during episode 1, explaining 34.8 % of the unaccounted-for sources of SOAs. The decreased mean bias and RMSE and the slightly increased IOA also indicate the more reasonable descriptions of the formations of SOAs. In episode 2, the SOA formed through pathway M contributes less to the total concentration of SOA. The mean SOA concentration during episode 2 reaches 2.87 µg m−3, an increase of 1.82 µg m−3. However, the decreased bias statistical parameters (e.g., RMSE and MB) also indicate the more realistic description of contributions of dicarbonyls to SOA in this episode. The larger contribution of dicarbonyls from pathway M to the concentration of SOA in episode 1 is attributed to the higher LWC and the larger amount of dicarbonyls produced from biogenic precursors in the summer than in the fall. When the impact of the underestimation of glyoxal on the concentration of SOA is further taken into consideration, the concentration of SOA clearly increases in case 2. Compared to case 0, the mean concentration of SOA in episode 1 is significantly improved by a factor of 5.4 and comparable to the observations, whereas the increase in episode 2 is a factor of 6.2. The statistical parameters (e.g., IOA and RMSE) also show the better performance of case 2, indicating a more realistic and reasonable representation of the formation of SOA. Aromatic compounds are not only the precursors of glyoxal, but are also the precursors of SOA in the gas phase. A compositional analysis is therefore required to evaluate the individual contributions from dicarbonyls in case 2.
Figure 5 shows the mean contributions from different sources of SOAs in the three sensitivity case studies during the two analyzed episodes. AAQ, dicarbonyl-derived SOAs, contributes little in case 0 during the two episodes. The mean contribution of AAQ to the total concentration of SOAs in episode 1 is 2.39 %, larger than in episode 2 (0.89 %). As a result of the greater amount of emissions from biogenic sources in summer, SOAs formed from biogenic precursors (AISO+ATRP+ASQT) contribute more (26.3 %) in episode 1 than they do in episode 2 (13.5 %), whereas the contributions from anthropogenic precursors (AALK+ATOL+AXYL+ABNZ) are comparable between the two episodes. When pathway M is included in the model, the contribution from AAQ to SOA in case 1 clearly increases and reaches 57.1 % in episode 1 and 63.7 % in episode 2. The significant contributions from AAQ in the two episodes indicate the major contributions from dicarbonyls through pathway M to the formations of SOAs in summer and fall. When the impact of the underestimation of glyoxal is further taken into consideration in case 2, the mean concentration of AAQ in both episodes are higher than double that of case 1. In episode 1, AAQ (7.29 µg m−3) accounts for 60.6 % of the total SOA, exceeding the sum of the contributions from ARO1 (ATOL) and ARO2 (AXYL) (16.0 %) and indicating the dominant contribution of the aqueous SOA formation to the concentration of SOA in summer. The increase in AAQ relative to case 0 compensates for about 69.1 % of the unaccounted-for sources of SOAs. In episode 2, AAQ (4.21 µg m−3) contributes 64.5 % to the total concentration of SOA, which is also higher than the sum of ATOL and AXYL (15.3 %), implying the dominant contributions of dicarbonyls to the concentrations of SOAs. The different contribution of AAQ in case 2 during the two episodes can be attributed to the different LWC and different amount of dicarbonyls produced from biogenic precursors.
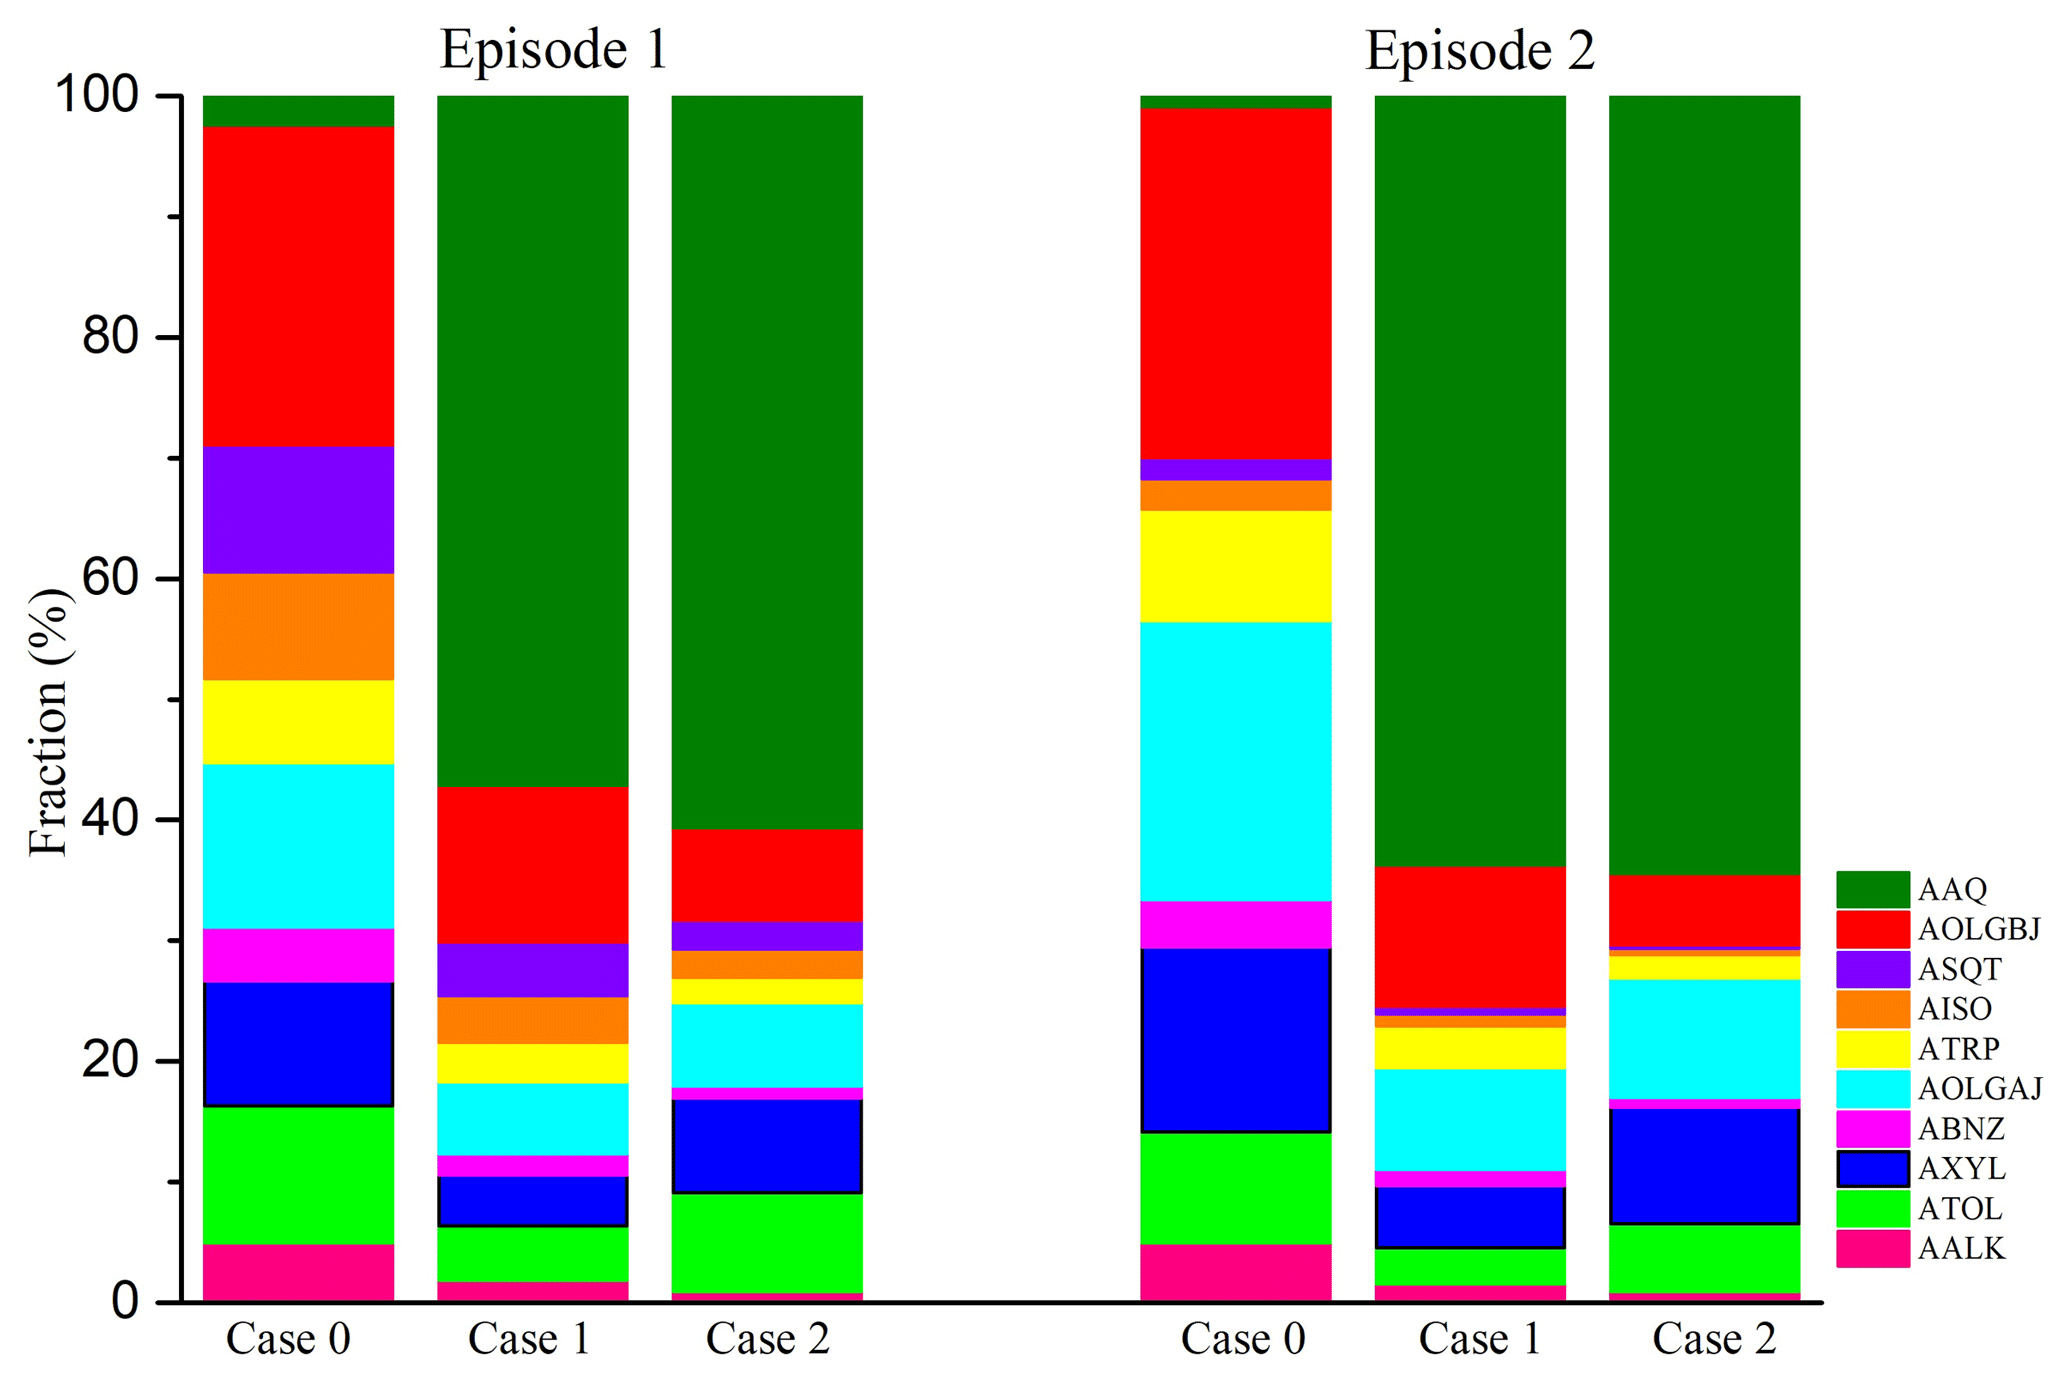
Figure 5Mean contributions from different sources of SOAs in the three sensitivity case studies during the two analyzed episodes. The compositions represent the SOA formed from long-chain alkanes (AALK), high-yield aromatic compounds (ATOL), low-yield aromatic compounds (AXYL), benzene (ABNZ), monoterpenes (ATRP), isoprene (AISO), sesquiterpenes (ASQT) and dicarbonyls (AAQ), as well as aged anthropogenic (AOLGAJ) and biogenic SOA (AOLGBJ). Case 0 is the base run; case 1 is run with the incorporation of the reactive uptake of dicarbonyls (excluding the default in-cloud dicarbonyl oxidations); and case 2 is based on case 1, but taking into consideration the underestimation of glyoxal.
It is clear that the biases between the observed and simulated concentrations of SOAs decrease when the contributions of unaccounted-for dicarbonyls to the concentrations of SOAs are considered, especially in summer. However, the sources of unaccounted-for SOAs cannot be explained completely. As a result of uncertainties in the description of known SOA formation processes and missing pathways that are not included in the model, for example, there are many uncertainties in glyoxal simulations (Li et al., 2018). There are also many uncertainties in incorporating pathway M into the model, such as the effective radius of cloud droplets (the empirical values used instead of the actual values), the reaction uptake coefficient (updated values over disparate surfaces are discussed in Curry et al., 2018) and the liquid water content in clouds (the most uncertain parameter). Other pathways for the formations of SOAs, such as the uptake of isoprene epoxides on the surface of aerosols (Lal et al., 2012; Lin et al., 2013), the aging mechanism of semivolatile primary organic aerosols (Shrivastava et al., 2008), and the oxidation of primary semi- and intermediate VOCs, are not considered in this model. Besides, recent studies (e.g., Galloway et al., 2009; De Haan et al., 2018) have presented that the reactive uptake of glyoxal and methylglyoxal can be reversible, especially methylglyoxal, but we do not consider that in this study.
To distinguish the contribution of dicarbonyls to the concentration of SOA over China in case 2 from that in case 0, the distributions of dicarbonyl-derived SOAs and their contributions to SOAs (AAQ∕SOA) over China in cases 0 and 2 are analyzed.
Figure 6a–b and c–d show the mean concentration of AAQ in cases 0 and 2, respectively, during the two episodes. For the base case, in episode 1 (Fig. 6a), the concentration of AAQ over China is ≤0.2 µg m−3. The higher concentration of AAQ (0.1–0.2 µg m−3) is in the areas between the lower reaches of the Yellow and Yangtze rivers and in the Sichuan Basin, probably due to the higher LWC and a greater number of sources of dicarbonyls over these areas, as discussed in Sect. 3.1 and by Li et al. (2018). In episode 2 (Fig. 6b) the concentration of AAQ is ≤0.1 µg m−3 over the regions due to the lower LWC and the fewer sources of dicarbonyls from biogenic precursors. It is clear that the concentration of AAQ is improved in case 2, when pathway M is added and the impact of the underestimation of glyoxal is considered. Overall, the concentration of AAQ is higher in eastern China than in the west during the two episodes. In episode 1 (Fig. 6c), the concentrations of AAQ mostly vary from 2 to 15 µg m−3 over central and eastern China, with the highest value (10–15 µg m−3) concentrated in the areas over the lower reaches of the Yangtze river. The concentration of AAQ in western China is ≤ 1 µg m−3, with the lowest value (≤0.1 µg m−3) in the Qinghai–Tibet Plateau, probably because there are few sources of dicarbonyls. In episode 2 (Fig. 6d), the concentrations of AAQ are mostly in a range of 2–10 µg m−3 over central and eastern China, with the highest value (5–10 µg m−3) concentrated over regions from south of the lower reaches of the Yellow River to the south of Guangzhou Province as well as the Sichuan Basin. The concentration of AAQ in western China is also ≤1 µg m−3, with the lowest value (≤0.1 µg m−3) in the Qinghai–Tibet Plateau. Outside China, the highest concentration of AAQ (15–20) appears in the northeastern India due to more primary sources of dicarbonyls from the large scale of postharvest paddy residue burnings (Chandra and Sinha, 2016) and the barrier of precursor gases diffusions from Himalayan orogen as well as the low wind speed.
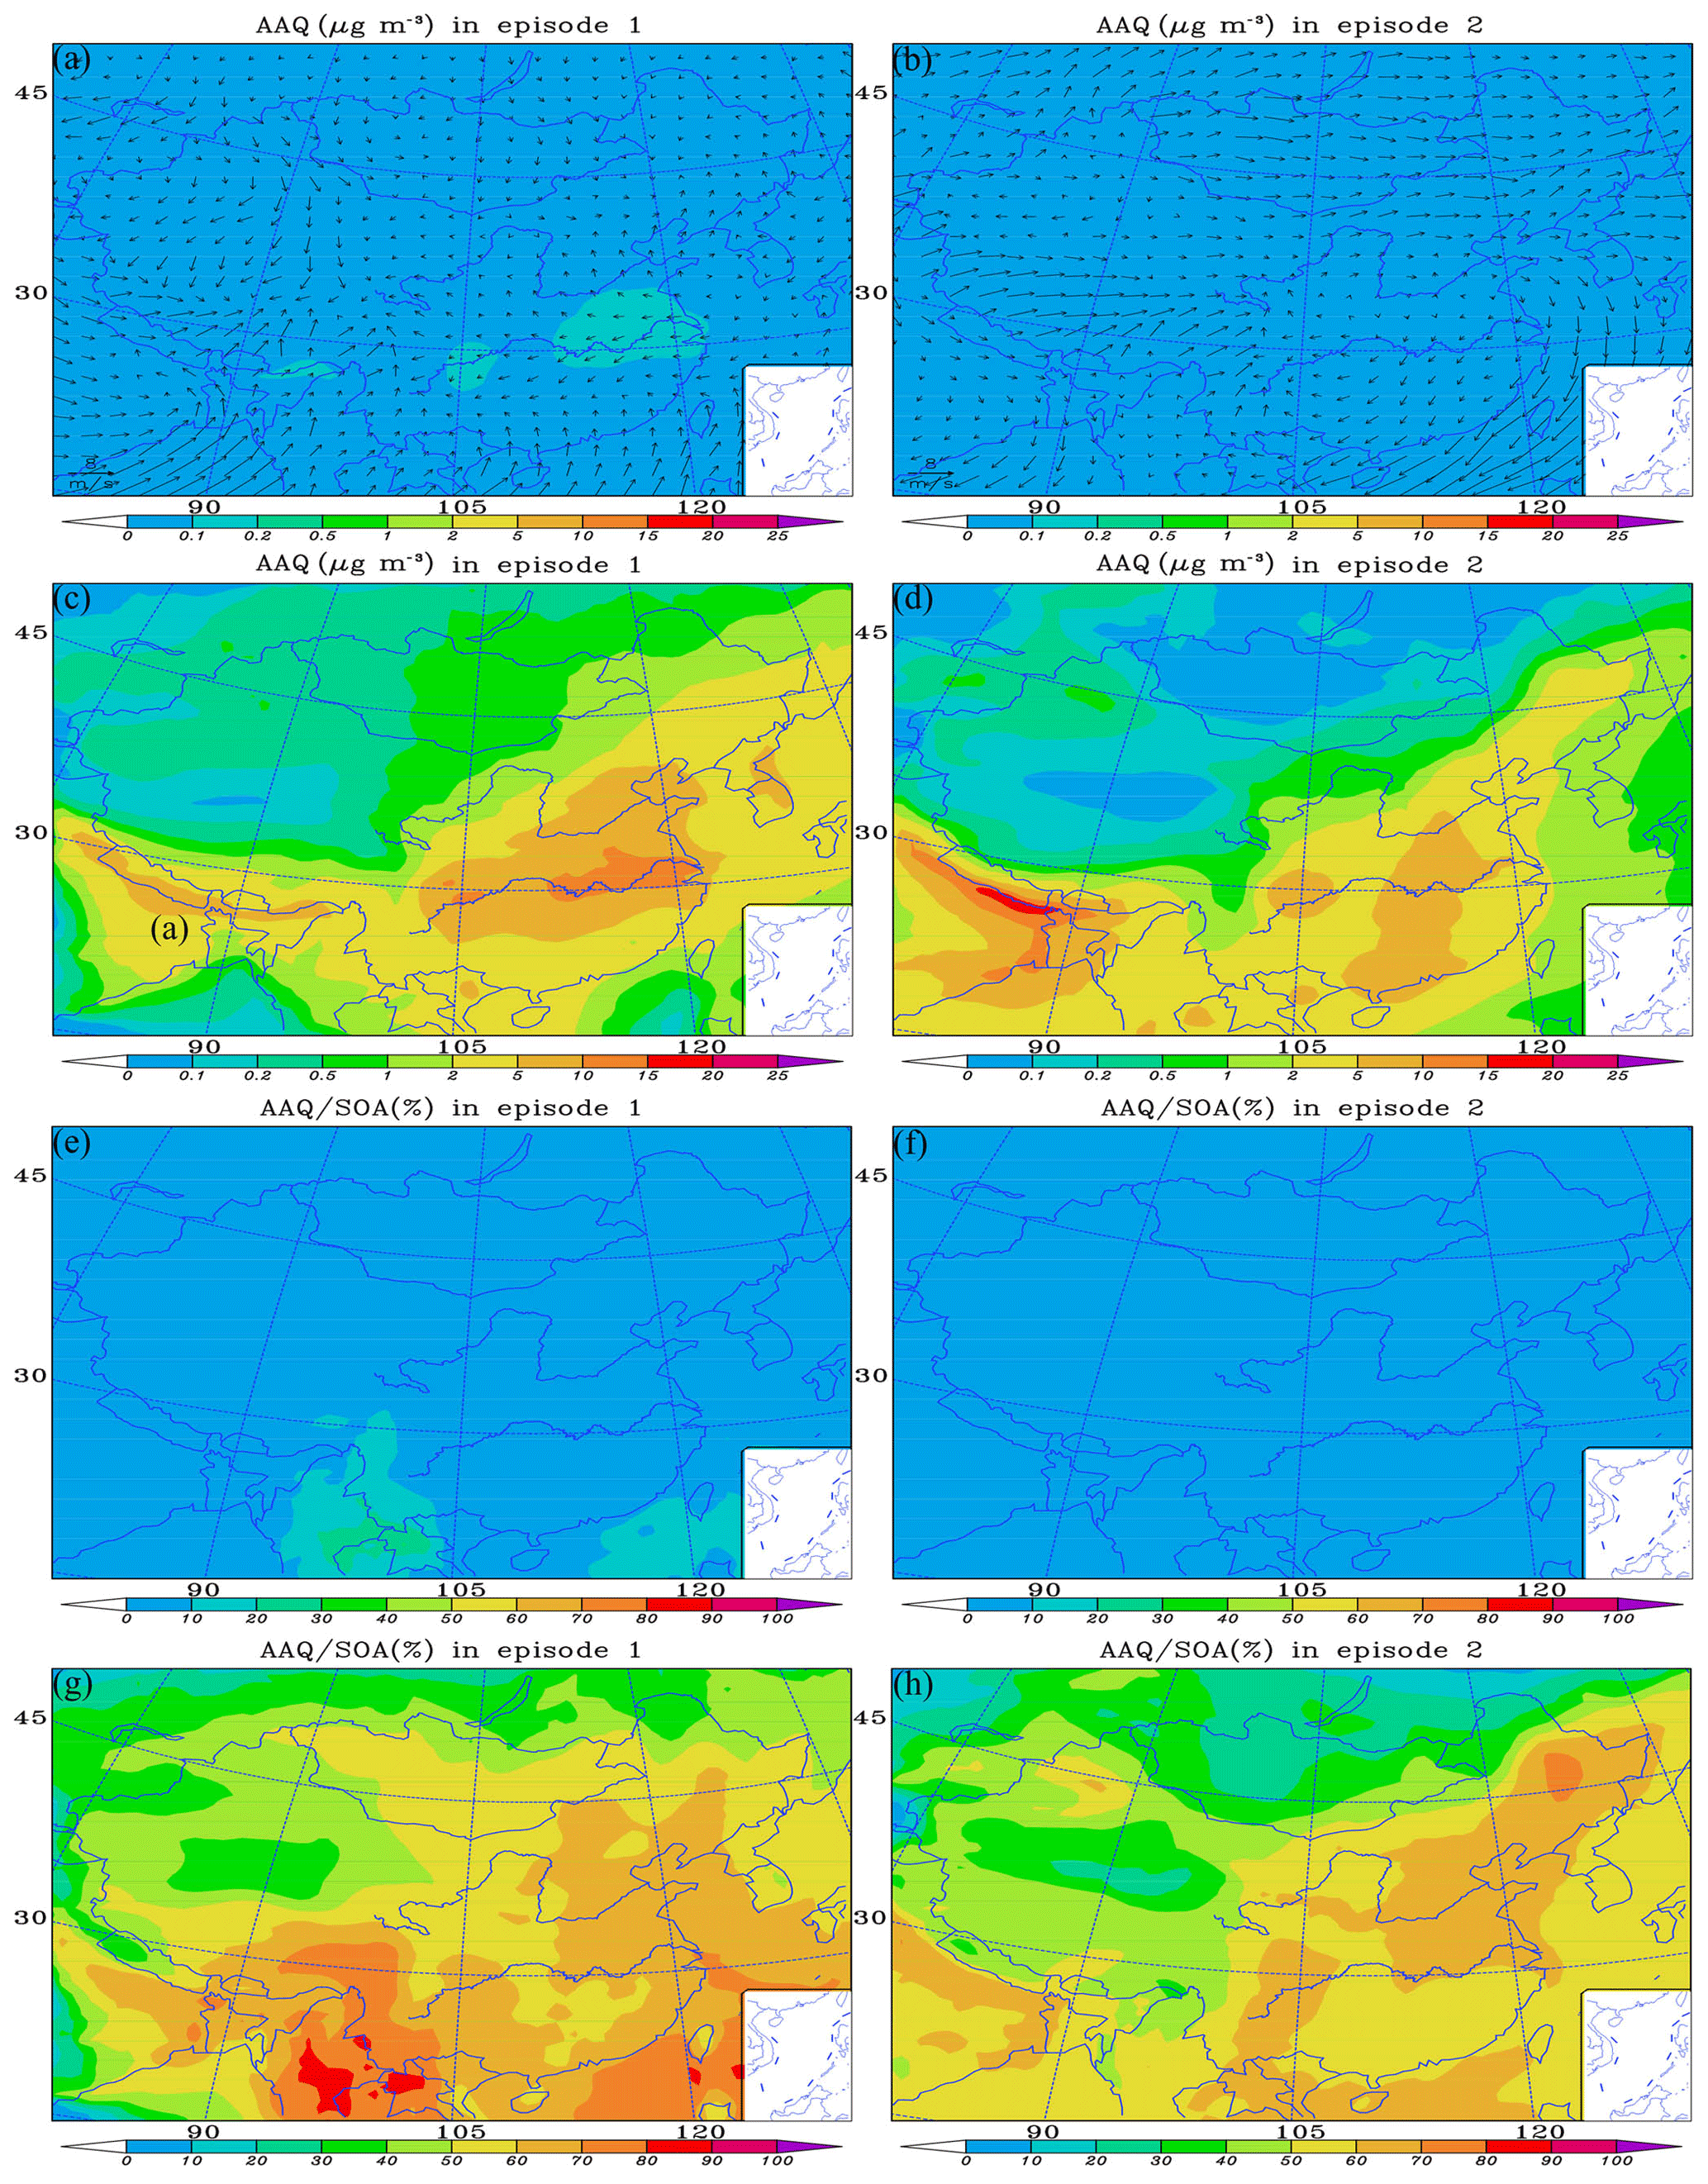
Figure 6Modeled distributions of the mean (a, b) wind field with SOA formed from dicarbonyls (AAQ) in case 0, (c, d) AAQ in case 2, (e, f) AAQ∕SOA in case 0 and (g, h) AAQ∕SOA in case 2, over the regions during two episodes. Case 0 is the base run; case 2 is run taking into consideration the incorporation of the reactive uptake of dicarbonyls (excluding the default in-cloud dicarbonyl oxidations) and the underestimation of glyoxal.
Figure 6e–f and g–h show the spatial distribution of the mean AAQ∕SOA in cases 0 and 2 during the two episodes, respectively. Figure 6e shows that the AAQ fraction over China in episode 1 is ≤10 %, except in Yunnan Province and some parts of the South China Sea, where AAQ∕SOA reaches 10 %–20 %. In episode 2 (Fig. 6f), the mean AAQ∕SOA is ≤10 % over all regions. When the contributions of dicarbonyls from pathway M and improved glyoxal to SOA are considered, there is a large increase in AAQ∕SOA over these regions in two episodes. As shown in Fig. 6g, in episode 1, the contribution of AAQ to SOA varies from 10 to 90 % throughout China. In central and eastern areas, the fraction of AAQ is generally in the range of 50 %–70 % and up to 70 %–90 % in the coastal regions and offshore from the East China Sea to the South China Sea. The fraction of AAQ in the west is relatively low and usually ≤50 %. However, the contribution of AAQ to SOA is up to 80 % in southwestern regions (e.g., Yunnan Province and parts of Sichuan Province). In episode 2 (Fig. 6h), the contribution of AAQ to SOA is in the range of 10 %–80 % throughout China. In central and eastern areas, the fraction of AAQ is generally in the range of 50 %–70 % and up to 80 % in a small portion of northeastern China. The fraction of AAQ in the west is also lower and usually ≤50 %. However, the contribution of AAQ to SOA is up to 60 %–70 % in a small part of Sinkiang Province.
The RAMS-CMAQ modeling system was used to assess the contributions of dicarbonyls from the reactive uptake process and unaccounted-for sources of glyoxal to the concentrations of SOAs during the two episodes from 3 June to 11 July 2014 and 14 October to 14 November 2014. Comparisons between the observed and simulated concentrations of SOAs from three sensitivity groups showed different improvements in the SOA simulations with the inclusion of pathway M and consideration of the underestimation of glyoxal in the two episodes. Due to the high LWC and large amount of dicarbonyls produced from biogenic precursors in summer, the contributions of dicarbonyls were greater in episode 1 than that in episode 2. When pathway M was added in case 1, the modeled mean concentration of SOA in episode 1 increased by 3.65 µg m−3, explaining about 34.8 % of the unaccounted-for SOA sources, while there was a 1.82 µg m−3 increase in the mean result during episode 2. When the impacts of glyoxal underestimation were further taken into consideration in case 2, the modeled mean AAQ in episode 1 was improved to 7.29 µg m−3 and contributed 60.6 % of the total concentration of SOA. The increase due to AAQ relative to case 0 is equivalent to 69.1 % of the unaccounted-for source of SOA, whereas the mean concentration of AAQ in episode 2 was 4.21 µg m−3 and accounted for 64.5 % of total concentration of SOA. Although the contributions of dicarbonyls to SOAs are different in the two episodes, the simulated SOA results are both improved and close to the observations, indicating a more realistic description of aqueous SOA formation.
The mean AAQ in case 2 during the two episodes was clearly improved over China relative to case 0 and was generally higher in the east than in the west. In episode 1, the highest value (10–15 µg m−3) was seen in the areas around the lower reaches of the Yellow River, while the highest value (5–10 µg m−3) in episode 2 was concentrated over regions from south of the lower reaches of the Yellow River to the south of Guangzhou Province as well as the Sichuan Basin. As a result, the contribution of AAQ to the concentration of SOA in two episodes was also improved in case 2. In episode 1, the fraction varied from 10 % to 90 % throughout China, with the highest contribution (70 %–90 %) in the coastal regions and offshore along the East China Sea to the South China Sea in addition to the southwestern regions (e.g., Yunnan Province and parts of Sichuan Province). Meanwhile, in episode 2, the contribution of AAQ to SOA was in the range of 10 %–80 % throughout China, with the highest fraction (up to 80 %) seen in a small portion of northeastern China.
It is clear that the contributions of dicarbonyls from pathway M and the unaccounted-for sources of glyoxal make a significant contribution to the concentration of SOA, especially in summer. However, there are still many uncertainties in the depictions of reactive uptake processes and sources of glyoxal. For example, the reactive uptake of dicarbonyls in this study has been processed as irreversible reactions. However, several recent studies (e.g., Galloway et al., 2009; De Haan et al., 2018) have presented that the uptake processes can be reversible, but we do not consider this. As another example, the uptake coefficient of dicarbonyls has been reported to vary between different surfaces by Curry et al. (2018), including the differences between the cloud droplet and aqueous aerosol and between each aerosol component. But we do not make the distinctions. Furthermore, the liquid water content which is not well reproduced in the model, the effective radius of cloud droplets which are the fixed empirical values used instead of the actual values and the evaluations of the underestimations in the aromatic compound emissions which are not well discussed due to the limited observed data can also bring the uncertainties into our results. Thus, more work on the dicarbonyl-derived SOA needs to be done in the future.
Besides, the aqueous SOA formation is not only relative to the distributions of dicarbonyl concentrations, but also depends on the liquid water content (LWC). Due to the large space and time dependence, one single station measurement of SOA concentration is not enough to evaluate the model performance over China, especially the impacts of glyoxal underestimations on dicarbonyl-derived SOA. Thus, more observed SOA data from different stations need to be collected and used for comparisons to reduce the uncertainties in the conclusions.
The datasets of measured SOA concentrations, observed aromatic compound concentrations and corresponding modeled results used in this study can be accessed by contacting sunyele@mail.iap.ac.cn, tgq@dq.cern.ac.cn and mgzhang@mail.iap.ac.cn, respectively.
The supplement related to this article is available online at: https://doi.org/10.5194/acp-19-6481-2019-supplement.
In this study, JL designed the sensitivity experiments, developed the model code and performed the corresponding simulations. MZ co-designed the experiments and provided valuable advice about the model operations. YS carried out the measurements of SOA and provided the corresponding data for evaluating the modeled results. GT and FW carried out the measurements of aromatic compound concentrations and provided the corresponding data for evaluating the simulated results. YX provided valuable advice on model result analysis.
The authors declare that they have no conflict of interest.
This study was supported by the National Key R&D Programs of China (no. 2017YFC0209803), the National Natural Science Foundation of China (91544221), and the Beijing Municipal Science and Technology Project (ZL171100000617002). We thank Qi Ying from Texas A&M University for helping to incorporate the reactive uptake of dicarbonyl pathways into the model.
This paper was edited by Xiaohong Liu and reviewed by three anonymous referees.
Benkovitz, C. M., Scholtz, M. T., Pacyna, J., Tarrason, L., Dignon, J., Voldner, E. C., Spiro, P. A., Logan, J. A., and Graedel, T. E.: Global gridded inventories of anthropogenic emissions of sulfur and nitrogen, J. Geophys. Res.-Atmos., 101, 29239–29253, https://doi.org/10.1029/96jd00126, 1996.
Boylan, J. W. and Russell, A. G.: PM and light extinction model performance metrics, goals, and criteria for three-dimensional air quality models, Atmos. Environ., 40, 4946–4959, https://doi.org/10.1016/j.atmonsenv.2005.09.087, 2006.
Byun, D. and Schere, K. L.: Review of the governing equations, computational algorithms, and other components of the models-3 Community Multiscale Air Quality (CMAQ) modeling system, Appl. Mech. Rev., 59, 51–77, https://doi.org/10.1115/1.2128636, 2006.
Carlton, A. G., Turpin, B. J., Lim, H. J., Altieri, K. E., and Seitzinger, S.: Link between isoprene and secondary organic aerosol (SOA): Pyruvic acid oxidation yields low volatility organic acids in clouds, Geophys. Res. Lett., 33, 272–288, 2006.
Carlton, A. G., Turpin, B. J., Altieri, K. E., Seitzinger, S. P., Mathur, R., Roselle, S. J., and Weber, R. J.: CMAQ Model Performance Enhanced When In-Cloud Secondary Organic Aerosol is Included: Comparisons of Organic Carbon Predictions with Measurements, Environ. Sci. Technol., 42, 8798–8802, https://doi.org/10.1021/es801192n, 2008.
Carlton, A. G., Bhave, P. V., Napelenok, S. L., Edney, E. D., Sarwar, G., Pinder, R. W., Pouliot, G. A., and Houyoux, M.: Model Representation of Secondary Organic Aerosol in CMAQv4.7, Environ. Sci. Technol., 44, 8553–8560, https://doi.org/10.1021/es100636q, 2010.
Carter, W. P. L.: Implementation of the SAPRC-99 Chemical Mechanism into the Models-3 Framework Report to the US Environmental Protection Agency, Research Triangle Park, NC, 2000.
Chandra, B. P. and Sinha, V.: Contribution of post-harvest agricultural paddy residue fires in the NW Indo-Gangetic Plain to ambient carcinogenic benzenoids, toxic isocyanic acid and carbon monoxide, Environ. Int., 88, 187–197, https://doi.org/10.1016/j.envint.2015.12.025, 2016.
Corrigan, A. L., Hanley, S. W., and De Haan, D. O.: Uptake of glyoxal by organic and inorganic aerosol, Environ. Sci. Technol., 42, 4428–4433, https://doi.org/10.1021/es7032394, 2008.
Cotton, W. R., Pielke, R. A., Walko, R. L., Liston, G. E., Tremback, C. J., Jiang, H., McAnelly, R. L., Harrington, J. Y., Nicholls, M. E., Carrio, G. G., and McFadden, J. P.: RAMS 2001: Current status and future directions, Meteorol. Atmos. Phys., 82, 5–29, https://doi.org/10.1007/s00703-001-0584-9, 2003.
Curry, L. A., Tsui, W. G., and McNeill, V. F.: Technical note: Updated parameterization of the reactive uptake of glyoxal and methylglyoxal by atmospheric aerosols and cloud droplets, Atmos. Chem. Phys., 18, 9823–9830, https://doi.org/10.5194/acp-18-9823-2018, 2018.
de Gouw, J. A., Middlebrook, A. M., Warneke, C., Goldan, P. D., Kuster, W. C., Roberts, J. M., Fehsenfeld, F. C., Worsnop, D. R., Canagaratna, M. R., Pszenny, A. A. P., Keene, W. C., Marchewka, M., Bertman, S. B., and Bates, T. S.: Budget of organic carbon in a polluted atmosphere: Results from the New England Air Quality Study in 2002, J. Geophys. Res.-Atmos., 110, D16305, https://doi.org/10.1029/2004jd005623, 2005.
De Haan, D. O., Jimenez, N. G., de Loera, A., Cazaunau, M., Gratien, A., Pangui, E., and Doussin, J.-F.: Methylglyoxal Uptake Coefficients on Aqueous Aerosol Surfaces, J. Phys. Chem. A, 122, 4854–4860, https://doi.org/10.1021/acs.jpca.8b00533, 2018.
Dentener, F. J. and Crutzen, P. J.: Reaction of N2O5 on tropospheric aerosols – impact on the global distributions of NOx, O3, and OH, J. Geophys. Res.-Atmos., 98, 7149–7163, https://doi.org/10.1029/92jd02979, 1993.
Emery, C., Tai, E., and Yarwood, G.: Enhanced meteorological modeling and performance evaluation for two Texas ozone episodes, In: Prepared for the Texas Natural Resource Conservation Commission, ENVIRON International Corporation, Novato, CA, USA, 2001.
Emmons, L. K., Walters, S., Hess, P. G., Lamarque, J.-F., Pfister, G. G., Fillmore, D., Granier, C., Guenther, A., Kinnison, D., Laepple, T., Orlando, J., Tie, X., Tyndall, G., Wiedinmyer, C., Baughcum, S. L., and Kloster, S.: Description and evaluation of the Model for Ozone and Related chemical Tracers, version 4 (MOZART-4), Geosci. Model Dev., 3, 43–67, https://doi.org/10.5194/gmd-3-43-2010, 2010.
Ervens, B. and Volkamer, R.: Glyoxal processing by aerosol multiphase chemistry: towards a kinetic modeling framework of secondary organic aerosol formation in aqueous particles, Atmos. Chem. Phys., 10, 8219–8244, https://doi.org/10.5194/acp-10-8219-2010, 2010.
Ervens, B., Feingold, G., Frost, G. J., and Kreidenweis, S. M.: A modeling study of aqueous production of dicarboxylic acids: 1. Chemical pathways and speciated organic mass production, J. Geophys. Res.-Atmos., 109, D15205, https://doi.org/10.1029/2003JD004387, 2004.
Ervens, B., Turpin, B. J., and Weber, R. J.: Secondary organic aerosol formation in cloud droplets and aqueous particles (aqSOA): a review of laboratory, field and model studies, Atmos. Chem. Phys., 11, 11069–11102, https://doi.org/10.5194/acp-11-11069-2011, 2011.
Ervens, B., Sorooshian, A., Lim, Y. B., and Turpin, B. J.: Key parameters controlling OH-initiated formation of secondary organic aerosol in the aqueous phase (aqSOA), J. Geophys. Res.-Atmos., 119, 3997–4016, https://doi.org/10.1002/2013jd021021, 2014.
Farina, S. C., Adams, P. J., and Pandis, S. N.: Modeling global secondary organic aerosol formation and processing with the volatility basis set: Implications for anthropogenic secondary organic aerosol, J. Geophys. Res.-Atmos., 115, D09202, https://doi.org/10.1029/2009jd013046, 2010.
Feng, T., Bei, N., Huang, R.-J., Cao, J., Zhang, Q., Zhou, W., Tie, X., Liu, S., Zhang, T., Su, X., Lei, W., Molina, L. T., and Li, G.: Summertime ozone formation in Xi'an and surrounding areas, China, Atmos. Chem. Phys., 16, 4323–4342, https://doi.org/10.5194/acp-16-4323-2016, 2016.
Foley, K. M., Roselle, S. J., Appel, K. W., Bhave, P. V., Pleim, J. E., Otte, T. L., Mathur, R., Sarwar, G., Young, J. O., Gilliam, R. C., Nolte, C. G., Kelly, J. T., Gilliland, A. B., and Bash, J. O.: Incremental testing of the Community Multiscale Air Quality (CMAQ) modeling system version 4.7, Geosci. Model Dev., 3, 205–226, https://doi.org/10.5194/gmd-3-205-2010, 2010.
Fu, T.-M., Jacob, D. J., Wittrock, F., Burrows, J. P., Vrekoussis, M., and Henze, D. K.: Global budgets of atmospheric glyoxal and methylglyoxal, and implications for formation of secondary organic aerosols, J. Geophys. Res.-Atmos., 113, D15303, https://doi.org/10.1029/2007jd009505, 2008.
Fu, T. M., Jacob, D. J., and Heald, C. L.: Aqueous-phase reactive uptake of dicarbonyls as a source of organic aerosol over eastern North America, Atmos. Environ., 43, 1814–1822, 2009.
Galloway, M. M., Chhabra, P. S., Chan, A. W. H., Surratt, J. D., Flagan, R. C., Seinfeld, J. H., and Keutsch, F. N.: Glyoxal uptake on ammonium sulphate seed aerosol: reaction products and reversibility of uptake under dark and irradiated conditions, Atmos. Chem. Phys., 9, 3331–3345, https://doi.org/10.5194/acp-9-3331-2009, 2009.
Gao, M., Carmichael, G. R., Wang, Y., Saide, P. E., Yu, M., Xin, J., Liu, Z., and Wang, Z.: Modeling study of the 2010 regional haze event in the North China Plain, Atmos. Chem. Phys., 16, 1673–1691, https://doi.org/10.5194/acp-16-1673-2016, 2016.
Goldstein, A. H. and Galbally, I. E.: Known and unexplored organic constituents in the earth's atmosphere, Environ. Sci. Technol., 41, 1514–1521, https://doi.org/10.1021/es072476p, 2007.
Gong, S. L.: A parameterization of sea-salt aerosol source function for sub- and super-micron particles, Global Biogeochem. Cy., 17, 1097, https://doi.org/10.1029/2003gb002079, 2003.
Guenther, A. B., Jiang, X., Heald, C. L., Sakulyanontvittaya, T., Duhl, T., Emmons, L. K., and Wang, X.: The Model of Emissions of Gases and Aerosols from Nature version 2.1 (MEGAN2.1): an extended and updated framework for modeling biogenic emissions, Geosci. Model Dev., 5, 1471–1492, https://doi.org/10.5194/gmd-5-1471-2012, 2012.
Han, Z., Xie, Z., Wang, G., Zhang, R., and Tao, J.: Modeling organic aerosols over east China using a volatility basis-set approach with aging mechanism in a regional air quality model, Atmos. Environ., 124, 186–198, https://doi.org/10.1016/j.atmosenv.2015.05.045, 2016.
Han, Z. W., Ueda, H., Matsuda, K., Zhang, R. J., Arao, K., Kanai, Y., and Hasome, H.: Model study on particle size segregation and deposition during Asian dust events in March 2002, J. Geophys. Res.-Atmos., 109, D19205, https://doi.org/10.1029/2004jd004920, 2004.
Harrison, R. M. and Yin, J. X.: Particulate matter in the atmosphere: which particle properties are important for its effects on health?, Sci. Total Environ., 249, 85–101, https://doi.org/10.1016/s0048-9697(99)00513-6, 2000.
Heald, C. L., Jacob, D. J., Park, R. J., Russell, L. M., Huebert, B. J., Seinfeld, J. H., Liao, H., and Weber, R. J.: A large organic aerosol source in the free troposphere missing from current models, Geophys. Res. Lett., 32, L18809, https://doi.org/10.1029/2005gl023831, 2005.
Hu, J., Wang, P., Ying, Q., Zhang, H., Chen, J., Ge, X., Li, X., Jiang, J., Wang, S., Zhang, J., Zhao, Y., and Zhang, Y.: Modeling biogenic and anthropogenic secondary organic aerosol in China, Atmos. Chem. Phys., 17, 77–92, https://doi.org/10.5194/acp-17-77-2017, 2017.
Intergovernmental Panel on Climate Change (IPCC): The Physical Science Basis of Climate Change: Changes in Atmospheric Constituents and in Radiative Forcing, Cambridge University Press, New York, 26–27, 2007.
Jacob, D. J.: Heterogeneous chemistry and tropospheric ozone, Atmos. Environ., 34, 2131–2159, https://doi.org/10.1016/s1352-2310(99)00462-8, 2000.
Jiang, F., Liu, Q., Huang, X., Wang, T., Zhuang, B., and Xie, M.: Regional modeling of secondary organic aerosol over China using WRF/Chem, J. Aerosol Sci., 43, 57–73, https://doi.org/10.1016/j.jaerosci.2011.09.003, 2012.
Jo, D. S., Park, R. J., Kim, M. J., and Spracklen, D. V.: Effects of chemical aging on global secondary organic aerosol using the volatility basis set approach, Atmos. Environ., 81, 230–244, https://doi.org/10.1016/j.atmosenv.2013.08.055, 2013.
Juda-Rezler, K., Reizer, M., Huszar, P., Krueger, B. C., Zanis, P., Syrakov, D., Katragkou, E., Trapp, W., Melas, D., Chervenkov, H., Tegoulias, I., and Halenka, T.: Modelling the effects of climate change on air quality over Central and Eastern Europe: concept, evaluation and projections, Clim. Res., 53, 179–203, https://doi.org/10.3354/cr01072, 2012.
Kalberer, M., Paulsen, D., Sax, M., Steinbacher, M., Dommen, J., Prevot, A. S. H., Fisseha, R., Weingartner, E., Frankevich, V., Zenobi, R., and Baltensperger, U.: Identification of polymers as major components of atmospheric organic aerosols, Science, 303, 1659–1662, https://doi.org/10.1126/science.1092185, 2004.
Kanakidou, M., Seinfeld, J. H., Pandis, S. N., Barnes, I., Dentener, F. J., Facchini, M. C., Van Dingenen, R., Ervens, B., Nenes, A., Nielsen, C. J., Swietlicki, E., Putaud, J. P., Balkanski, Y., Fuzzi, S., Horth, J., Moortgat, G. K., Winterhalter, R., Myhre, C. E. L., Tsigaridis, K., Vignati, E., Stephanou, E. G., and Wilson, J.: Organic aerosol and global climate modelling: a review, Atmos. Chem. Phys., 5, 1053–1123, https://doi.org/10.5194/acp-5-1053-2005, 2005.
Kroll, J. H., Ng, N. L., Murphy, S. M., Flagan, R. C., and Seinfeld, J. H.: Secondary organic aerosol formation from isoprene photooxidation under high-NOx conditions, Geophys. Res. Lett., 32, L18808, https://doi.org/10.1029/2005gl023637, 2005.
Kroll, J. H., Ng, N. L., Murphy, S. M., Flagan, R. C., and Seinfeld, J. H.: Secondary organic aerosol formation from isoprene photooxidation, Environ. Sci. Technol., 40, 1869–1877, https://doi.org/10.1021/es0524301, 2006.
Kurokawa, J., Ohara, T., Morikawa, T., Hanayama, S., Janssens-Maenhout, G., Fukui, T., Kawashima, K., and Akimoto, H.: Emissions of air pollutants and greenhouse gases over Asian regions during 2000–2008: Regional Emission inventory in ASia (REAS) version 2, Atmos. Chem. Phys., 13, 11019–11058, https://doi.org/10.5194/acp-13-11019-2013, 2013.
Lal, V., Khalizov, A. F., Lin, Y., Galvan, M. D., Connell, B. T., and Zhang, R.: Heterogeneous reactions of epoxides in acidic media, J. Phys. Chem. A, 116, 6078–6090, https://doi.org/10.1021/jp2112704, 2012.
Lane, T. E., Donahue, N. M., and Pandis, S. N.: Simulating secondary organic aerosol formation using the volatility basis-set approach in a chemical transport model, Atmos. Environ., 42, 7439–7451, https://doi.org/10.1016/j.atmosenv.2008.06.026, 2008.
Li, J., Mao, J., Min, K.-E., Washenfelder, R. A., Brown, S. S., Kaiser, J., Keutsch, F. N., Volkamer, R., Wolfe, G. M., Hanisco, T. F., Pollack, I. B., Ryerson, T. B., Graus, M., Gilman, J. B., Lerner, B. M., Warneke, C., de Gouw, J. A., Middlebrook, A. M., Liao, J., Welti, A., Henderson, B. H., McNeill, V. F., Hall, S. R., Ullmann, K., Donner, L. J., Paulot, F., and Horowitz, L. W.: Observational constraints on glyoxal production from isoprene oxidation and its contribution to organic aerosol over the Southeast United States, J. Geophys. Res.-Atmos., 121, 9849–9861, https://doi.org/10.1002/2016jd025331, 2016.
Li, J., Zhang, M., Wu, F., Sun, Y., and Tang, G.: Assessment of the impacts of aromatic VOC emissions and yields of SOA on SOA concentrations with the air quality model RAMS-CMAQ, Atmos. Environ., 158, 105–115, https://doi.org/10.1016/j.atmosenv.2017.03.035, 2017.
Li, J., Zhang, M., Tang, G., Wu, F., Alvarado, L. M. A., Vrekoussis, M., Richter, A., and Burrows, J. P.: Investigating missing sources of glyoxal over China using a regional air quality model (RAMS-CMAQ), J. Environ. Sci., 71, 108–118, https://doi.org/10.1016/j.jes.2018.04.021, 2018.
Li, L., Chen, C. H., Huang, C., Huang, H. Y., Zhang, G. F., Wang, Y. J., Wang, H. L., Lou, S. R., Qiao, L. P., Zhou, M., Chen, M. H., Chen, Y. R., Streets, D. G., Fu, J. S., and Jang, C. J.: Process analysis of regional ozone formation over the Yangtze River Delta, China using the Community Multi-scale Air Quality modeling system, Atmos. Chem. Phys., 12, 10971–10987, https://doi.org/10.5194/acp-12-10971-2012, 2012.
Li, M., Zhang, Q., Kurokawa, J.-I., Woo, J.-H., He, K., Lu, Z., Ohara, T., Song, Y., Streets, D. G., Carmichael, G. R., Cheng, Y., Hong, C., Huo, H., Jiang, X., Kang, S., Liu, F., Su, H., and Zheng, B.: MIX: a mosaic Asian anthropogenic emission inventory under the international collaboration framework of the MICS-Asia and HTAP, Atmos. Chem. Phys., 17, 935–963, https://doi.org/10.5194/acp-17-935-2017, 2017.
Li, N., Fu, T.-M., Cao, J., Lee, S., Huang, X.-F., He, L.-Y., Ho, K.-F., Fu, J. S., and Lam, Y.-F.: Sources of secondary organic aerosols in the Pearl River Delta region in fall: Contributions from the aqueous reactive uptake of dicarbonyls, Atmos. Environ., 76, 200–207, https://doi.org/10.1016/j.atmosenv.2012.12.005, 2013.
Liggio, J., Li, S. M., and Mclaren, R.: Reactive uptake of glyoxal by particulate matter, J. Geophys. Res., 110, 257–266, 2005.
Lim, Y. B. and Ziemann, P. J.: Products and mechanism of secondary organic aerosol formation from reactions of n-alkanes with OH radicals in the presence of NOx, Environ. Sci. Technol., 39, 9229–9236, https://doi.org/10.1021/es051447g, 2005.
Lim, Y. B., Tan, Y., Perri, M. J., Seitzinger, S. P., and Turpin, B. J.: Aqueous chemistry and its role in secondary organic aerosol (SOA) formation, Atmos. Chem. Phys., 10, 10521–10539, https://doi.org/10.5194/acp-10-10521-2010, 2010.
Lin, G., Penner, J. E., Sillman, S., Taraborrelli, D., and Lelieveld, J.: Global modeling of SOA formation from dicarbonyls, epoxides, organic nitrates and peroxides, Atmos. Chem. Phys., 12, 4743–4774, https://doi.org/10.5194/acp-12-4743-2012, 2012.
Lin, G., Sillman, S., Penner, J. E., and Ito, A.: Global modeling of SOA: the use of different mechanisms for aqueous-phase formation, Atmos. Chem. Phys., 14, 5451–5475, https://doi.org/10.5194/acp-14-5451-2014, 2014.
Lin, J., An, J., Qu, Y., Chen, Y., Li, Y., Tang, Y., Wang, F., and Xiang, W.: Local and distant source contributions to secondary organic aerosol in the Beijing urban area in summer, Atmos. Environ., 124, 176–185, https://doi.org/10.1016/j.atmosenv.2015.08.098, 2016.
Lin, Y.-H., Zhang, H., Pye, H. O. T., Zhang, Z., Marth, W. J., Park, S., Arashiro, M., Cui, T., Budisulistiorini, H., Sexton, K. G., Vizuete, W., Xie, Y., Luecken, D. J., Piletic, I. R., Edney, E. O., Bartolotti, L. J., Gold, A., and Surratt, J. D.: Epoxide as a precursor to secondary organic aerosol formation from isoprene photooxidation in the presence of nitrogen oxides, P. Natl. Acad. Sci. USA, 110, 6718–6723, https://doi.org/10.1073/pnas.1221150110, 2013.
Liu, Z., Wang, Y., Vrekoussis, M., Richter, A., Wittrock, F., Burrows, J. P., Shao, M., Chang, C.-C., Liu, S.-C., Wang, H., and Chen, C.: Exploring the missing source of glyoxal (CHOCHO) over China, Geophys. Res. Lett., 39, L10812, https://doi.org/10.1029/2012gl051645, 2012.
Loeffler, K. W., Koehler, C. A., Paul, N. M., and De Haan, D. O.: Oligomer formation in evaporating aqueous glyoxal and methyl glyoxal solutions, Environ. Sci. Technol., 40, 6318–6323, https://doi.org/10.1021/es060810w, 2006.
Morris, R. E., McNally, D. E., Tesche, T. W., Tonnesen, G., Boylan, J. W., and Brewer, P.: Preliminary evaluation of the community multiscale air, quality model for 2002 over the southeastern United States, J. Air Waste Manage., 55, 1694–1708, https://doi.org/10.1080/10473289.2005.10464765, 2005.
Morris, R. E., Koo, B., Guenther, A., Yarwood, G., McNally, D., Tesche, T. W., Tonnesen, G., Boylan, J., and Brewer, P.: Model sensitivity evaluation for organic carbon using two multi-pollutant air quality models that simulate regional haze in the southeastern United States, Atmos. Environ., 40, 4960–4972, https://doi.org/10.1016/j.atmonsenv.2005.09.088, 2006.
Murphy, B. N. and Pandis, S. N.: Simulating the Formation of Semivolatile Primary and Secondary Organic Aerosol in a Regional Chemical Transport Model, Environ. Sci. Technol., 43, 4722–4728, https://doi.org/10.1021/es803168a, 2009.
Murphy, D. M., Cziczo, D. J., Froyd, K. D., Hudson, P. K., Matthew, B. M., Middlebrook, A. M., Peltier, R. E., Sullivan, A., Thomson, D. S., and Weber, R. J.: Single-particle mass spectrometry of tropospheric aerosol particles, J. Geophys. Res.-Atmos., 111, D23S32, https://doi.org/10.1029/2006jd007340, 2006.
Myriokefalitakis, S., Vrekoussis, M., Tsigaridis, K., Wittrock, F., Richter, A., Brühl, C., Volkamer, R., Burrows, J. P., and Kanakidou, M.: The influence of natural and anthropogenic secondary sources on the glyoxal global distribution, Atmos. Chem. Phys., 8, 4965–4981, https://doi.org/10.5194/acp-8-4965-2008, 2008.
Ng, N. L., Kroll, J. H., Chan, A. W. H., Chhabra, P. S., Flagan, R. C., and Seinfeld, J. H.: Secondary organic aerosol formation from m-xylene, toluene, and benzene, Atmos. Chem. Phys., 7, 3909–3922, https://doi.org/10.5194/acp-7-3909-2007, 2007.
Perry, R. H. and Green, D.: Perry's Chemical Engineers Handbook, McGraw-Hill, New York, 2–370, 1999.
Pöschl, U.: Atmospheric aerosols: Composition, transformation, climate and health effects, Angew. Chem. Int. Edit., 44, 7520–7540, https://doi.org/10.1002/anie.200501122, 2005.
Randerson, J. T., van der Werf, G. R., Giglio, L., Collatz, G. J., and Kasibhatla, P. S.: Global fire emissions database, version 4 (GFEDv4), Data set available at: http://daac.ornl.gov/ (last access: 16 April 2019), from Oak Ridge National Laboratory Distributed Active Archive Center, Oak Ridge, Tennessee, USA, https://doi.org/10.3334/ORNLDAAC/1293, 2015.
Roberts, M. C., Andreae, M. O., Zhou, J. C., and Artaxo, P.: Cloud condensation nuclei in the Amazon Basin: “Marine” conditions over a continent?, Geophys. Res. Lett., 28, 2807–2810, 2001.
Shrivastava, M. K., Lane, T. E., Donahue, N. M., Pandis, S. N., and Robinson, A. L.: Effects of gas particle partitioning and aging of primary emissions on urban and regional organic aerosol concentrations, J. Geophys. Res.-Atmos., 113, D18301, https://doi.org/10.1029/2007jd009735, 2008.
Stavrakou, T., Mueller, J. F., De Smedt, I., Van Roozendael, M., Kanakidou, M., Vrekoussis, M., Wittrock, F., Richter, A., and Burrows, J. P.: The continental source of glyoxal estimated by the synergistic use of spaceborne measurements and inverse modelling, Atmos. Chem. Phys., 9, 8431–8446, https://doi.org/10.5194/acp-9-8431-2009, 2009.
Stavrakou, T., Peeters, J., and Müller, J.-F.: Improved global modelling of HOx recycling in isoprene oxidation: evaluation against the GABRIEL and INTEX-A aircraft campaign measurements, Atmos. Chem. Phys., 10, 9863–9878, https://doi.org/10.5194/acp-10-9863-2010, 2010.
Sun, J., Wu, F., Hu, B., Tang, G., Zhang, J., and Wang, Y.: VOC characteristics, emissions and contributions to SOA formation during hazy episodes, Atmos. Environ., 141, 560–570, https://doi.org/10.1016/j.atmosenv.2016.06.060, 2016.
Surratt, J. D., Lewandowski, M., Offenberg, J. H., Jaoui, M., Kleindienst, T. E., Edney, E. O., and Seinfeld, J. H.: Effect of acidity on secondary organic aerosol formation from isoprene, Environ. Sci. Technol., 41, 5363–5369, https://doi.org/10.1021/es0704176, 2007.
Tsigaridis, K., Daskalakis, N., Kanakidou, M., Adams, P. J., Artaxo, P., Bahadur, R., Balkanski, Y., Bauer, S. E., Bellouin, N., Benedetti, A., Bergman, T., Berntsen, T. K., Beukes, J. P., Bian, H., Carslaw, K. S., Chin, M., Curci, G., Diehl, T., Easter, R. C., Ghan, S. J., Gong, S. L., Hodzic, A., Hoyle, C. R., Iversen, T., Jathar, S., Jimenez, J. L., Kaiser, J. W., Kirkevåg, A., Koch, D., Kokkola, H., Lee, Y. H., Lin, G., Liu, X., Luo, G., Ma, X., Mann, G. W., Mihalopoulos, N., Morcrette, J.-J., Müller, J.-F., Myhre, G., Myriokefalitakis, S., Ng, N. L., O'Donnell, D., Penner, J. E., Pozzoli, L., Pringle, K. J., Russell, L. M., Schulz, M., Sciare, J., Seland, Ø., Shindell, D. T., Sillman, S., Skeie, R. B., Spracklen, D., Stavrakou, T., Steenrod, S. D., Takemura, T., Tiitta, P., Tilmes, S., Tost, H., van Noije, T., van Zyl, P. G., von Salzen, K., Yu, F., Wang, Z., Wang, Z., Zaveri, R. A., Zhang, H., Zhang, K., Zhang, Q., and Zhang, X.: The AeroCom evaluation and intercomparison of organic aerosol in global models, Atmos. Chem. Phys., 14, 10845–10895, https://doi.org/10.5194/acp-14-10845-2014, 2014.
Volkamer, R., Jimenez, J. L., San Martini, F., Dzepina, K., Zhang, Q., Salcedo, D., Molina, L. T., Worsnop, D. R., and Molina, M. J.: Secondary organic aerosol formation from anthropogenic air pollution: Rapid and higher than expected, Geophys. Res. Lett., 33, L17811, https://doi.org/10.1029/2006gl026899, 2006.
Wang, F., An, J., Li, Y., Tang, Y., Lin, J., Qu, Y., Chen, Y., Zhang, B., and Zhai, J.: Impacts of uncertainty in AVOC emissions on the summer ROx budget and ozone production rate in the three most rapidly-developing economic growth regions of China, Adv. Atmos. Sci., 31, 1331–1342, https://doi.org/10.1007/s00376-014-3251-z, 2014.
Warneck, P.: In-cloud chemistry opens pathway to the formation of oxalic acid in the marine atmosphere, Atmos. Environ., 37, 2423–2427, https://doi.org/10.1016/s1352-2310(03)00136-5, 2003.
Willmott, C. J.: On the validation of models, Phys. Geogr., 2, 184–194, https://doi.org/10.1080/02723646.1981.10642213, 1981.
Woo, J. L. and McNeill, V. F.: simpleGAMMA v1.0 – a reduced model of secondary organic aerosol formation in the aqueous aerosol phase (aaSOA), Geosci. Model Dev., 8, 1821–1829, https://doi.org/10.5194/gmd-8-1821-2015, 2015.
Wu, F., Yu, Y., Sun, J., Zhang, J., Wang, J., Tang, G., and Wang, Y.: Characteristics, source apportionment and reactivity of ambient volatile organic compounds at Dinghu Mountain in Guangdong Province, China, Sci. Total Environ., 548, 347–359, https://doi.org/10.1016/j.scitotenv.2015.11.069, 2016.
Xu, W., Han, T., Du, W., Wang, Q., Chen, C., Zhao, J., Zhang, Y., Li, J., Fu, P., Wang, Z., Worsnop, D. R., and Sun, Y.: Effects of Aqueous-Phase and Photochemical Processing on Secondary Organic Aerosol Formation and Evolution in Beijing, China, Environ. Sci. Technol., 51, 762–770, https://doi.org/10.1021/acs.est.6b04498, 2017.
Xu, W. Q., Sun, Y. L., Chen, C., Du, W., Han, T. T., Wang, Q. Q., Fu, P. Q., Wang, Z. F., Zhao, X. J., Zhou, L. B., Ji, D. S., Wang, P. C., and Worsnop, D. R.: Aerosol composition, oxidation properties, and sources in Beijing: results from the 2014 Asia-Pacific Economic Cooperation summit study, Atmos. Chem. Phys., 15, 13681–13698, https://doi.org/10.5194/acp-15-13681-2015, 2015.
Ying, Q., Li, J., and Kota, S. H.: Significant Contributions of Isoprene to Summertime Secondary Organic Aerosol in Eastern United States, Environ. Sci. Technol., 49, 7834–7842, https://doi.org/10.1021/acs.est.5b02514, 2015.
Yu, S., Mathur, R., Schere, K., Kang, D., Pleim, J., Young, J., Tong, D., Pouliot, G., McKeen, S. A., and Rao, S. T.: Evaluation of real-time PM2.5 forecasts and process analysis for PM2.5 formation over the eastern United States using the Eta-CMAQ forecast model during the 2004 ICARTT study, J. Geophys. Res.-Atmos., 113, D06204, https://doi.org/10.1029/2007jd009226, 2008.
Zhang, H. and Ying, Q.: Secondary organic aerosol from polycyclic aromatic hydrocarbons in Southeast Texas, Atmos. Environ., 55, 279–287, https://doi.org/10.1016/j.atmosenv.2012.03.043, 2012.
Zhang, H. and Ying, Q.: Secondary organic aerosol formation and source apportionment in Southeast Texas, Atmos. Environ., 45, 3217–3227, https://doi.org/10.1016/j.atmosenv.2011.03.046, 2011.
Zhang, H., Li, J., Ying, Q., Yu, J. Z., Wu, D., Cheng, Y., He, K., and Jiang, J.: Source apportionment of PM2.5 nitrate and sulfate in China using a source-oriented chemical transport model, Atmos. Environ., 62, 228–242, https://doi.org/10.1016/j.atmosenv.2012.08.014, 2012.
Zhang, Q., Jimenez, J. L., Canagaratna, M. R., Allan, J. D., Coe, H., Ulbrich, I., Alfarra, M. R., Takami, A., Middlebrook, A. M., Sun, Y. L., Dzepina, K., Dunlea, E., Docherty, K., DeCarlo, P. F., Salcedo, D., Onasch, T., Jayne, J. T., Miyoshi, T., Shimono, A., Hatakeyama, S., Takegawa, N., Kondo, Y., Schneider, J., Drewnick, F., Borrmann, S., Weimer, S., Demerjian, K., Williams, P., Bower, K., Bahreini, R., Cottrell, L., Griffin, R. J., Rautiainen, J., Sun, J. Y., Zhang, Y. M., and Worsnop, D. R.: Ubiquity and dominance of oxygenated species in organic aerosols in anthropogenically-influenced Northern Hemisphere midlatitudes, Geophys. Res. Lett., 34, L13801, https://doi.org/10.1029/2007gl029979, 2007.