the Creative Commons Attribution 4.0 License.
the Creative Commons Attribution 4.0 License.
 | 15 May 2019
Inversely modeling homogeneous H2SO4 − H2O nucleation rate in exhaust-related conditions
Jenni Alanen
Marja R. T. Palmroth
Topi Rönkkö
Miikka Dal Maso
The homogeneous sulfuric acid–water nucleation rate in conditions related to vehicle exhaust was measured and modeled. The measurements were performed by evaporating sulfuric acid and water liquids and by diluting and cooling the sample vapor with a sampling system mimicking the dilution process occurring in a real-world driving situation. The nucleation rate inside the measurement system was modeled inversely using CFD (computational fluid dynamics) and the aerosol dynamics code, CFD-TUTMAM (Tampere University of Technology Modal Aerosol Model for CFD). The nucleation exponents for the concentrations of sulfuric acid and water and for the saturation vapor pressure of sulfuric acid were found to be 1.9±0.1, 0.50±0.05, and 0.75±0.05, respectively. These exponents can be used to examine the nucleation mechanisms occurring in exhaust from different combustion sources (internal combustion engines, power plant boilers, etc.) or in the atmosphere. Additionally, the nucleation rate can be expressed with the exponents as a function of the concentrations of sulfuric acid and water and of temperature. The obtained function can be used as a starting point for inverse modeling studies of more complex nucleation mechanisms involving extra compounds in addition to sulfuric acid and water. More complex nucleation mechanisms, such as those involving hydrocarbons, are observed with real vehicle exhaust and are also supported by the results obtained in this study. Furthermore, the function can be used to improve air quality models by using it to model the effect of sulfuric acid-emitting traffic and power generation on the particle concentration in urban air.
- Article
(5428 KB) - Full-text XML
-
Supplement
(735 KB) - BibTeX
- EndNote


Airborne particles are related to adverse health effects (Dockery et al., 1993; Pope et al., 2002; Beelen et al., 2014; Lelieveld et al., 2015) and various effects on climate (Arneth et al., 2009; Boucher et al., 2013). In particular, adverse health effects are caused by the exposure to vehicle emissions which increase ultrafine particle concentration in urban air (Virtanen et al., 2006; Johansson et al., 2007; Pey et al., 2009) in the size range with high probability of lung deposition (Alföldy et al., 2009; Rissler et al., 2012).
Vehicles equipped with internal combustion engines generate nonvolatile particles (Rönkkö et al., 2007, 2014; Sgro et al., 2008; Maricq et al., 2012; Chen et al., 2017); however, volatile particles are also formed after the combustion process during exhaust cooling (Kittelson, 1998; Lähde et al., 2009), i.e., when the exhaust is released from the tailpipe. Thus, volatile particles are formed through the nucleation process; hence, they are called nucleation mode particles here.
An important characteristic of fine particles is the particle size distribution, as it determines the behavior of particles in the atmosphere and particle deposition to the respiratory system. Modeling studies provide information on the formation and evolution of exhaust-originated particles in the atmosphere (Jacobson et al., 2005; Stevens et al., 2012). To model the number concentration and the particle size of the nucleation mode, the governing nucleation rate needs to be known.
The detailed nucleation mechanism controlling particle formation in cooling and diluting vehicle exhaust is currently unknown (Keskinen and Rönkkö, 2010). The nucleation mode particles contain at least water, sulfuric acid (H2SO4), and hydrocarbons (Kittelson, 1998; Tobias et al., 2001; Sakurai et al., 2003; Schneider et al., 2005). Therefore, it is likely that these compounds are involved in the nucleation process, but, on the other hand, some of them can end up in the nucleation mode through the initial growth of the newly formed clusters. The most promising candidate for the main nucleating component in the particle formation process occurring in diesel exhaust is H2SO4, as it has been shown that the H2SO4 vapor concentration in vehicle exhaust (Rönkkö et al., 2013; Karjalainen et al., 2014), fuel sulfur content (Maricq et al., 2002; Vogt et al., 2003; Vaaraslahti et al., 2005; Kittelson et al., 2008), lubricating oil sulfur content (Vaaraslahti et al., 2005; Kittelson et al., 2008), and the exhaust after-treatment system (Maricq et al., 2002; Vogt et al., 2003) correlate with nucleation mode number concentration, at least in the cases when the test vehicle has been equipped with an oxidative exhaust after-treatment system. The sulfur contents of fuel and lubricating oil are connected to the H2SO4 vapor concentration in the exhaust because the combustion of sulfur-containing compounds produces sulfur dioxide (SO2) that is further oxidized to sulfur trioxide (SO3) in an oxidative exhaust after-treatment system (Kittelson et al., 2008), and SO3 finally produces H2SO4 when coming into contact with water (H2O) vapor (Boulaud et al., 1977).
Particle formation due to H2SO4 in real vehicle exhaust plumes and in laboratory sampling systems has been previously simulated by several authors (Uhrner et al., 2007; Lemmetty et al., 2008; Albriet et al., 2010; Liu et al., 2011; Arnold et al., 2012; Li and Huang, 2012; Wang and Zhang, 2012; Huang et al., 2014), but all of them have modeled nucleation as binary homogeneous nucleation (BHN) of H2SO4 and water. Other possible nucleation mechanisms include activation-type (Kulmala et al., 2006), barrierless kinetic (McMurry and Friedlander, 1979), hydrocarbon-involving (Vaaraslahti et al., 2004; Paasonen et al., 2010), ternary H2SO4–H2O–ammonia (Meyer and Ristovski, 2007), and ion-induced nucleation (Raes et al., 1986) mechanisms. The choice of binary homogeneous H2SO4–H2O nucleation in studies involving vehicle exhaust is mainly made because it has been the only nucleation mechanism for which an explicitly defined formula for the nucleation rate (J) can be presented (Keskinen and Rönkkö, 2010). An explicit definition is required when the nucleation rate in cooling exhaust is modeled, as the nucleation rate has a steep temperature dependency, according to theory (Hale, 2005) and experiments (Wölk and Strey, 2001). The nucleation rate of BHN is derived from classical thermodynamics; thus, the theory is called the classical nucleation theory (CNT). The nucleation rate according to the CNT is explicitly defined as a function of H2SO4 and H2O vapor concentrations ([H2SO4] and [H2O]) and temperature (T). The derivation of the CNT contains, however, a lot of assumptions, and it is thus quite uncertain (Vehkamäki and Riipinen, 2012). The largest uncertainty rises from the capillarity approximation; i.e., the physical properties of small newly formed critical clusters can be expressed as the properties of bulk liquid (Wyslouzil and Wölk, 2016). Comparing experimental and theoretical nucleation rates, the CNT underestimates the temperature dependency (Hung et al., 1989) and overestimates the sensitivity of J to [H2SO4] (Weber et al., 1996; Olin et al., 2014). These discrepancies entail that theoretically derived nucleation rates need to be corrected with a factor, ranging in several orders of magnitude, to agree with experimental nucleation rates.
Conversely, the nucleation rates of the other nucleation mechanisms are typically modeled as (Zhang et al., 2012)
where k is an experimentally derived coefficient and n is the nucleation exponent presenting the sensitivity of J to [H2SO4]. According to the first nucleation theorem (Kashchiev, 1982), n is also connected to the number of molecules in a critical cluster; however, due to assumptions included in the theorem, n is not exactly the number of molecules in a critical cluster in realistic conditions (Kupiainen-Määttä et al., 2014). The value for k is typically a constant that includes the effect of T and [H2O], i.e., relative humidity (RH; Sihto et al., 2009; Stevens and Pierce, 2014). A constant coefficient can be a satisfactory approximation in atmospheric nucleation experiments, where T and RH nearly remain constants. However, T and RH in cooling and diluting exhaust are highly variable; thus, a constant coefficient cannot be used. The nucleation exponents, n, for H2SO4 obtained from the atmospheric nucleation measurements (Sihto et al., 2006; Riipinen et al., 2007) and from the atmospherically relevant laboratory experiments (Brus et al., 2011; Riccobono et al., 2014) usually lie between 1 and 2; these are much lower than the theoretical exponents (n≳5, Vehkamäki et al., 2003).
The first step in examining nucleation mechanisms, other than the CNT, in vehicle exhaust using experimental data was performed by Vouitsis et al. (2005). They concluded that nucleation mechanisms with n=2, including the barrierless kinetic nucleation mechanism, can predict nucleation rates in vehicle exhaust. Later, Olin et al. (2015) and Pirjola et al. (2015) focused on obtaining nucleation rates inversely; i.e., an initial function for J acts as an input to the model and is altered until the simulated particle concentration and distribution correspond with the measured ones. These modeling studies are based on the experiments (Vouitsis et al., 2005; Arnold et al., 2012; Rönkkö et al., 2013) where the exhaust of a diesel engine was sampled using a laboratory setup containing an engine dynamometer and a diluting sampling system (Ntziachristos et al., 2004).
Inverse modeling is a preferable method in obtaining nucleation rates in a diluting domain over the method based on calculating J by dividing the measured number concentration with an estimated volume of a nucleation region because the volume of a nucleation region also depends on n. In the case of inverse modeling, there is no need to estimate the nucleation region because the model simulates J at every time step, in a model using temporal coordinates, or in every computational cell, in a model using spatial coordinates. Pirjola et al. (2015) modeled the dilution system with an aerosol dynamics model using temporal coordinates and concluded that hydrocarbons could be involved in the nucleation mechanism, and n lies between 1 and 2. However, because particle formation in diluting vehicle exhaust involves strong gradients in temperature and the concentrations of the compounds involved, information in spatial dimensions is also required to fully understand the particle formation process. For this reason, Olin et al. (2015) simulated aerosol dynamics using computational fluid dynamics (CFD) and concluded that n is 0.25 or 1, depending on whether solid particles acting as an condensation sink for sulfuric acid are emitted or not, respectively. These values are very low compared to other studies and to the first nucleation theorem that restricts n to at least 1. Values below unity imply that there can be other compounds involved in the nucleation mechanism in addition to H2SO4.
Ammonia (NH3) involved in H2SO4–H2O nucleation (ternary H2SO4–H2O–NH3 nucleation) has a notable effect if the H2SO4 concentration is low and the NH3 concentration is high (Lemmetty et al., 2007; Kirkby et al., 2011). The H2SO4 concentration in the atmosphere is low enough for the effect of NH3 to be relevant (Kirkby et al., 2011), but in vehicle exhaust, higher H2SO4 concentrations make the effect of NH3 probably negligible. However, more recent vehicles are equipped with the selective catalytic reduction (SCR) system which decreases nitrogen oxide emissions but, on the other hand, increases NH3 emissions. Therefore, NH3 can be involved in the nucleation process occurring in vehicle exhaust of vehicles equipped with the SCR system (Lemmetty et al., 2007). The SCR system was not included in the experiments of Arnold et al. (2012) and Rönkkö et al. (2013) mentioned earlier; thus, other compounds involved in the nucleation process in those experiments are more likely to be hydrocarbons than NH3.
In this paper, an improved aerosol dynamics model, CFD-TUTMAM (Tampere University of Technology Modal Aerosol Model for CFD), based on our previous model, CFD-TUTEAM (Tampere University of Technology Exhaust Aerosol Model for CFD), which is described in Olin et al. (2015), is presented. The main improvement in the model is its capability to model the initial growth of the newly formed clusters modally using our novel representation of the particle size distribution, the PL+LN (combined power law and log-normal distribution) model described in Olin et al. (2016).
Laboratory experiments designed for nucleation rate modeling purposes are presented in which the examination of the nucleation rate was aimed towards pure H2SO4–H2O nucleation instead of nucleation associated with some unknown compounds existing in real vehicle exhaust. Although the pure binary nucleation seems not to be the principal nucleation mechanism in real exhaust (Saito et al., 2002; Vaaraslahti et al., 2004; Meyer and Ristovski, 2007; Pirjola et al., 2015), neglecting the unknown compounds is reasonable at this stage of nucleation studies because the knowledge of the nucleation mechanism of the pure binary nucleation is still at a very low level, and it should be examined more to better understand the nucleation process in real exhaust. Adding only one additional compound to nucleation experiments would cause one additional dimension to the measurement matrix of all changeable parameters considered and would thus increase the complexity of the experiments. Similarly, adding the concentration of an additional compound to inverse modeling, the complexity and the computational cost of the simulations would increase significantly. Therefore, it is reasonable to begin the inverse modeling studies using only the pure binary nucleation mechanism. Additionally, although there are studies suggesting that other compounds are involved in the nucleation process in real vehicle exhaust, it has not yet been directly shown that the nucleation rate would be lower or higher with the absence of those compounds. Comparing the experiments with pure H2SO4–H2O nucleation to the experiments with real exhaust can provide information on that.
The pure H2SO4–H2O nucleation was generated by evaporating H2SO4 and H2O liquids and using the dilution system that mimics a real-world dilution process of a driving vehicle (Ntziachristos et al., 2004). A similar principle of generating H2SO4 by evaporating it from a saturator has been used in the study of Neitola et al. (2015), where the concentrations of H2SO4 and H2O and temperatures were kept in an atmospherically relevant range. In this study, they were kept in a vehicle exhaust-relevant range; thus, the output is an explicitly defined formula for the H2SO4–H2O nucleation rate in exhaust-related conditions. The formula is in the form of
which is based on the formula hypothesized by Olin et al. (2015), but with an additional exponent msa for the saturation vapor pressure of sulfuric acid (psa∘) to also take temperature into account. In Eq. (2), nsa and nw represent the nucleation exponents for [H2SO4] and [H2O], respectively. The exponents may also depend on the concentration levels, but due to the unknown dependency, only constant values are considered in this study.
The formulation obtained from this study helps in finding the nucleation mechanisms occurring in real vehicle exhaust or in the atmosphere. Similarly, it can be used to examine particle formation in coal-fired power plant exhaust, which is also known to contain H2SO4 (Stevens et al., 2012). For example, the values of the nucleation exponents obtained in this study can provide information on the nucleation mechanisms because the values differ with respect to different nucleation mechanisms. Another use of the formulation is in improving air quality models by using it to model the effect of sulfuric acid-emitting traffic and power generation on the particle concentration in urban air.
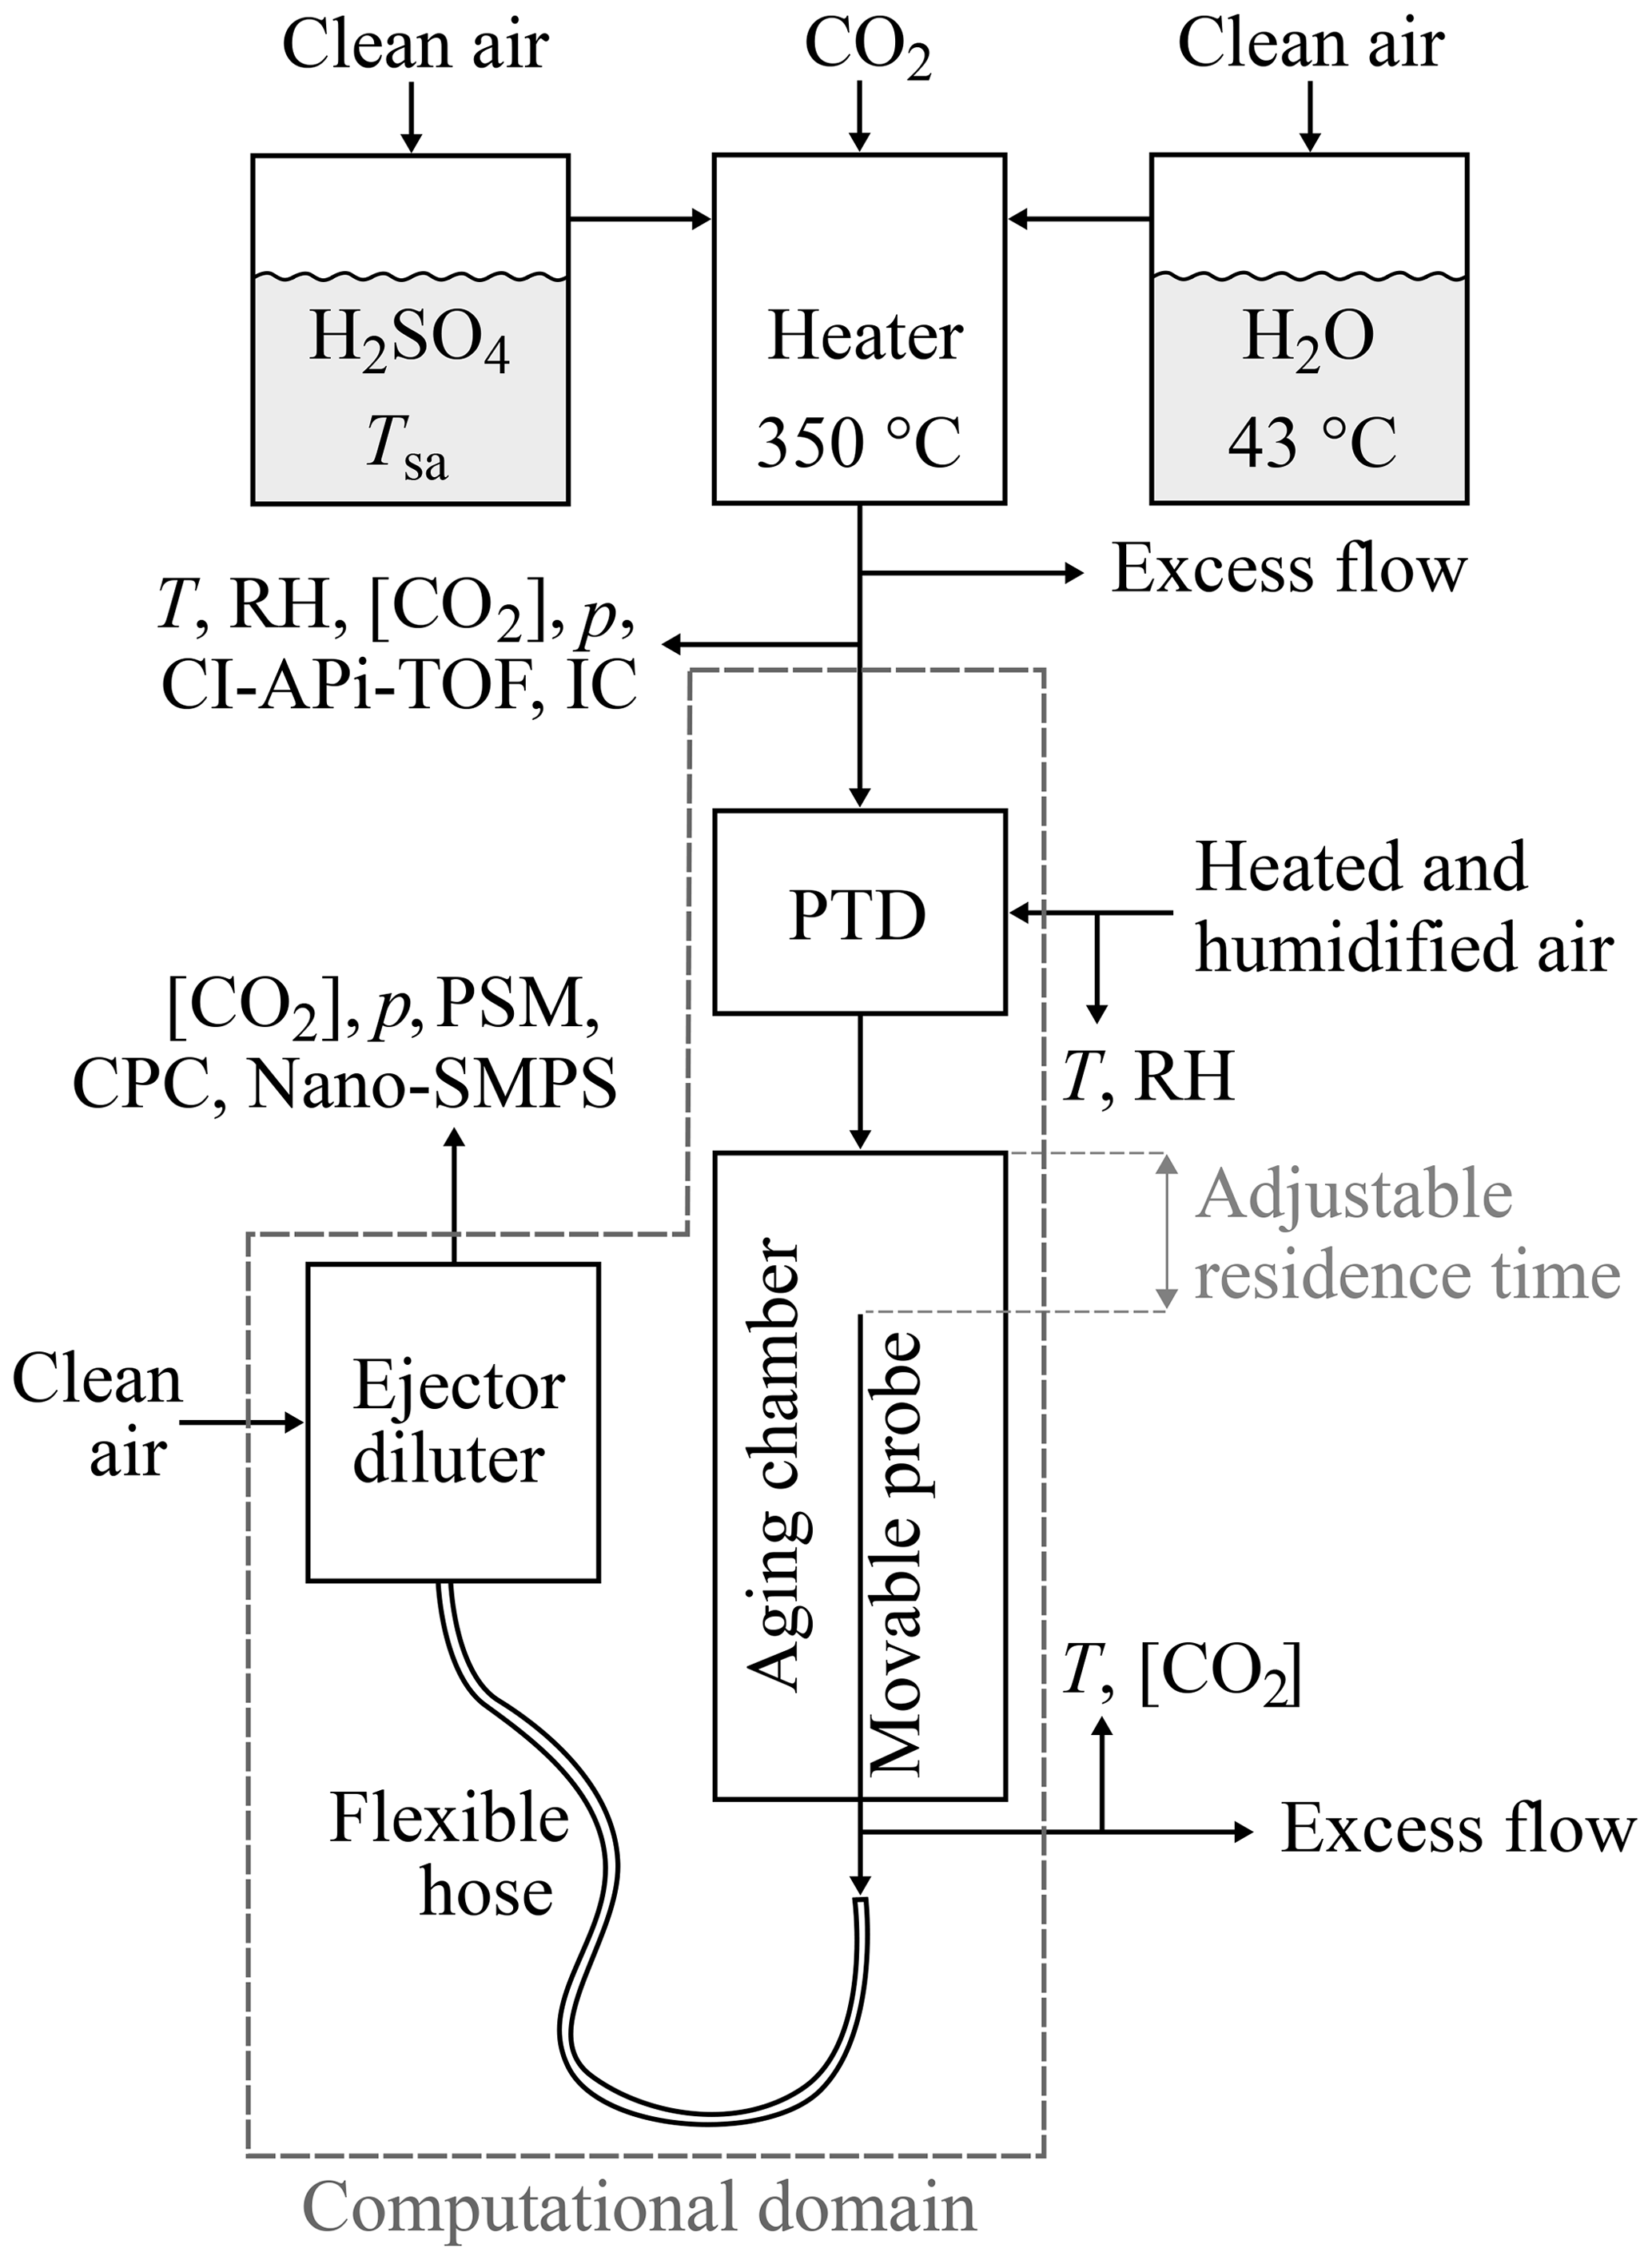
Figure 1The experimental setup used to generate artificial exhaust and sample it with a diluting sampling system. The top part of the figure represents the artificial raw exhaust generation, which contains mixing and heating H2SO4 and H2O vapors evaporated from liquids. The bottom part of the figure represents the raw exhaust sampling system, which consists of a porous tube diluter (PTD), an aging chamber, and an ejector diluter. The computational domain of the CFD simulation is also shown in the figure.
Laboratory experiments were designed to enable the examination of the effects of three parameters ([H2SO4], [H2O], and T) on the H2SO4–H2O nucleation rate. The experimental setup is presented in Fig. 1.
2.1 Artificial raw exhaust generation
The artificial raw exhaust sample was generated (the top part of Fig. 1) by evaporating 98 % H2SO4 liquid and deionized Milli-Q water. H2SO4 was held in a PTFE container, and water was held in a glass bottle. The liquids were heated to temperatures Tsa and 43 ∘C, respectively, which determine the concentrations in the gas phase theoretically through the saturation vapor pressure. Dry and filtered compressed air was flown through the evaporators and mixed before heating to 350 ∘C; 2.7 % of carbon dioxide (CO2) was also mixed with a sample to act as a tracer to determine the dilution ratio of the diluters. CO2 was selected because it has no effect on the particle formation process and because it exists in real exhaust as well.
The computational domain in the CFD simulation shown in the bottom part of Fig. 1 begins before the sample enters the porous tube diluter (PTD); thus, the concentrations of H2SO4 and H2O, temperature, pressure (p), and flow rate need to be known at that point due to the requirement of the boundary conditions in the CFD simulation. T and p were measured at that point, [H2O] was calculated from the measured RH, and the flow rate was calculated from the dilution ratio of the PTD with the aid of measured CO2 concentrations.
The temperature of the raw sample was 243 ∘C and the mole fraction of H2O (xw) was 0.036, on average. The temperature before the PTD was lower than the heater temperature, 350 ∘C, because the sample cooled in the sampling lines, but the temperature of 243 ∘C corresponds well with the temperature of real exhaust when released from the tailpipe. In NTP (normal temperature and pressure) conditions, xw=0.036 corresponds with . The mole fractions in real diesel or gasoline exhaust range between 0.06 and 0.14, but the values higher than 0.036 with this experimental setup were not used because a more humid sample caused the water vapor to condense as liquid water in the sampling lines.
The temperature of the H2SO4 evaporator, Tsa, was varied between 85 and 164.5 ∘C which correspond with the mole fractions (xsa) between and in the raw sample. In NTP conditions, this range corresponds with the [H2SO4] values between and . These concentrations are higher than concentrations in real vehicle exhaust (typically between 108 and 1014 cm−3) because particle formation was not observed with the concentrations below . However, with real vehicle exhaust, in the same sampling system used here, particle formation has been observed even with the concentration of (Arnold et al., 2012), indicating that other compounds are involved in the nucleation process.
The determination of [H2SO4] in the raw sample in our experiment was not straightforward due to the uncertainties involved in the measurement of [H2SO4]. The detailed information on measuring it, using a nitrate-ion-based (-based) chemical ionization atmospheric pressure interface time-of-flight mass spectrometer (CI-APi-TOF; Jokinen et al., 2012) and ion chromatography (IC; Sulonen et al., 2015), is described in the Supplement. Estimating [H2SO4] theoretically through the saturation vapor pressure in the temperature of Tsa provides some information on the dependency of [H2SO4] on Tsa in the raw sample. However, the absolute concentrations cannot be satisfactorily estimated, firstly because diffusional losses of H2SO4 onto the sampling lines between the H2SO4 evaporator and the PTD are high and uncertain and secondly because measuring H2SO4 is generally a challenging task due to high diffusional losses onto the walls of the sampling lines between the measurement point and the measurement device. High diffusional losses are caused by a high diffusion coefficient of H2SO4. Additionally, a low flow rate from the H2SO4 evaporator (0.5 slpm) increases the diffusional losses before the measurement point. The diffusional losses before the measurement point, according to the equations reported by Gormley and Kennedy (1948) and to the humidity-dependent diffusion coefficient of H2SO4 reported by Hanson and Eisele (2000), are 98 % if the walls of the sampling lines are assumed to be fully condensing. However, some parts in the sampling lines have high concentrations of H2SO4 with high temperatures, especially with high Tsa values. Therefore, these lines are probably partially saturated with H2SO4, which can act to prevent H2SO4 condensation onto the walls. Thus, the actual diffusional losses are estimated to be between 0 % and 98 %, and they can also depend on Tsa and on the saturation status of the sampling lines during a previous measurement point. In conclusion, the determination of [H2SO4] in the raw sample was done through inverse modeling using measured particle diameter information (see Sect. 4.5). The output of the concentrations from inverse modeling denotes the diffusional losses of 43 %–95 % depending on Tsa.
2.2 Raw exhaust sampling system
The sampling system used to dilute and cool the raw exhaust, presented in the bottom part of Fig. 1, was a modified partial flow sampling system (Ntziachristos et al., 2004) mimicking the dilution process occurring in a real-world driving situation. It consists of a PTD, an aging chamber, and an ejector diluter. The PTD dilutes and cools the sample rapidly, which leads to new particle formation. The aging chamber is used to grow the newly formed particles to detectable sizes and to continue the nucleation process. The ejector diluter is used to stop the particle formation and growth processes and to obtain the conditions of the sample required for measurement devices.
Dilution air used with the PTD and the ejector diluter was filtered compressed air. The ejector diluter used only dry (RH≈3.6 %) and unheated (T≈20 ∘C) dilution air, but the dilution air for the PTD was humidified (RHPTD=2 %–100 %) and heated (TPTD=27.5–70 ∘C). Humidifying the dilution air of the PTD was done by directing the compressed air flow through a container filled with deionized Milli-Q water. RHPTD and TPTD are the variable parameters used in examining the effect of [H2O] and T on J, which represent the conditions of the outdoor air acting in a dilution process in a real-world driving situation. The range of TPTD represents higher temperatures compared to the temperature of the outdoor air, but lower temperatures were not used because 27.5 ∘C was the coldest temperature available with the laboratory setup with no cooling device.
In this experiment, the residence time in the aging chamber was made adjustable by a movable sampling probe inside the aging chamber. The sampling probe was connected to the ejector diluter with a flexible Tygon hose. The residence time from before the PTD to after the ejector diluter was altered within a range of 1.4–2.8 s. Using a movable probe to alter the residence time has only a minor effect on the flow and temperature fields compared to altering the residence time with changing the flow rate in the aging chamber. Maintaining constant flow and temperature fields when studying the effect of the residence time is important because variable fields would alter the turbulence level and temperatures in the aging chamber, both having effects on the measured particle concentration and thus causing difficulties in separating the effect of the residence time from the effect of turbulence or temperature on measured particle concentrations.
The dilution ratio of the PTD was controlled by the excess flow rate after the aging chamber and calculated by the measured [CO2] before the PTD and after the aging chamber. The dilution ratio was kept at around 20 in all measurements. The dilution ratio of the ejector diluter was controlled by the pressure of the dilution air used with the diluter and calculated also using CO2 measurements. The calculated dilution ratio was around 10. Because the dilution ratios varied between different measurement points, all the aerosol results are multiplied by the total dilution ratio, thus making the results comparable.
2.3 Particle measurement
Particle number concentration and size distribution were measured after the ejector diluter using Airmodus PSM A11 (Airmodus Particle Size Magnifier A10 using Airmodus Condensation Particle Counter A20 as the particle counter), TSI CPC 3775 (Ultrafine Condensation Particle Counter), and TSI Nano-SMPS (Nano Scanning Mobility Particle Sizer using TSI CPC 3776 as the particle counter). The PSM and the CPC 3775 measure the particle number concentration (NPSM and NCPC) by counting particles with diameters larger than ∼1.15 nm (PSM) or ∼2.15 nm (CPC 3775). The D50-cut size (the particle diameter having the detection efficiency of 50 %) of the PSM can be altered by adjusting its saturator flow rate within the diameter range of 1.3–3.1 nm. Additionally, the CPC 3775 has the D50-cut size of 4.0 nm, and the CPC 3776 has the D50-cut size of 3.4 nm. The detection efficiency curves of the particle counters used are presented in Fig. 2. The Nano-SMPS measured, with the settings used in this experiment, the particle size distribution within the diameter range of 2–65 nm; however, particles with diameters smaller than ∼6 nm are weakly detectable due to very low charging efficiency of the radioactive charger, low detection efficiency of the particle counter, and high diffusional losses inside the device for very small particles. Nevertheless, using the data from the different saturator flow rates of the PSM together with the data from the CPC 3775, information on the particle size distribution around the range of 1.15–6 nm is also obtained.
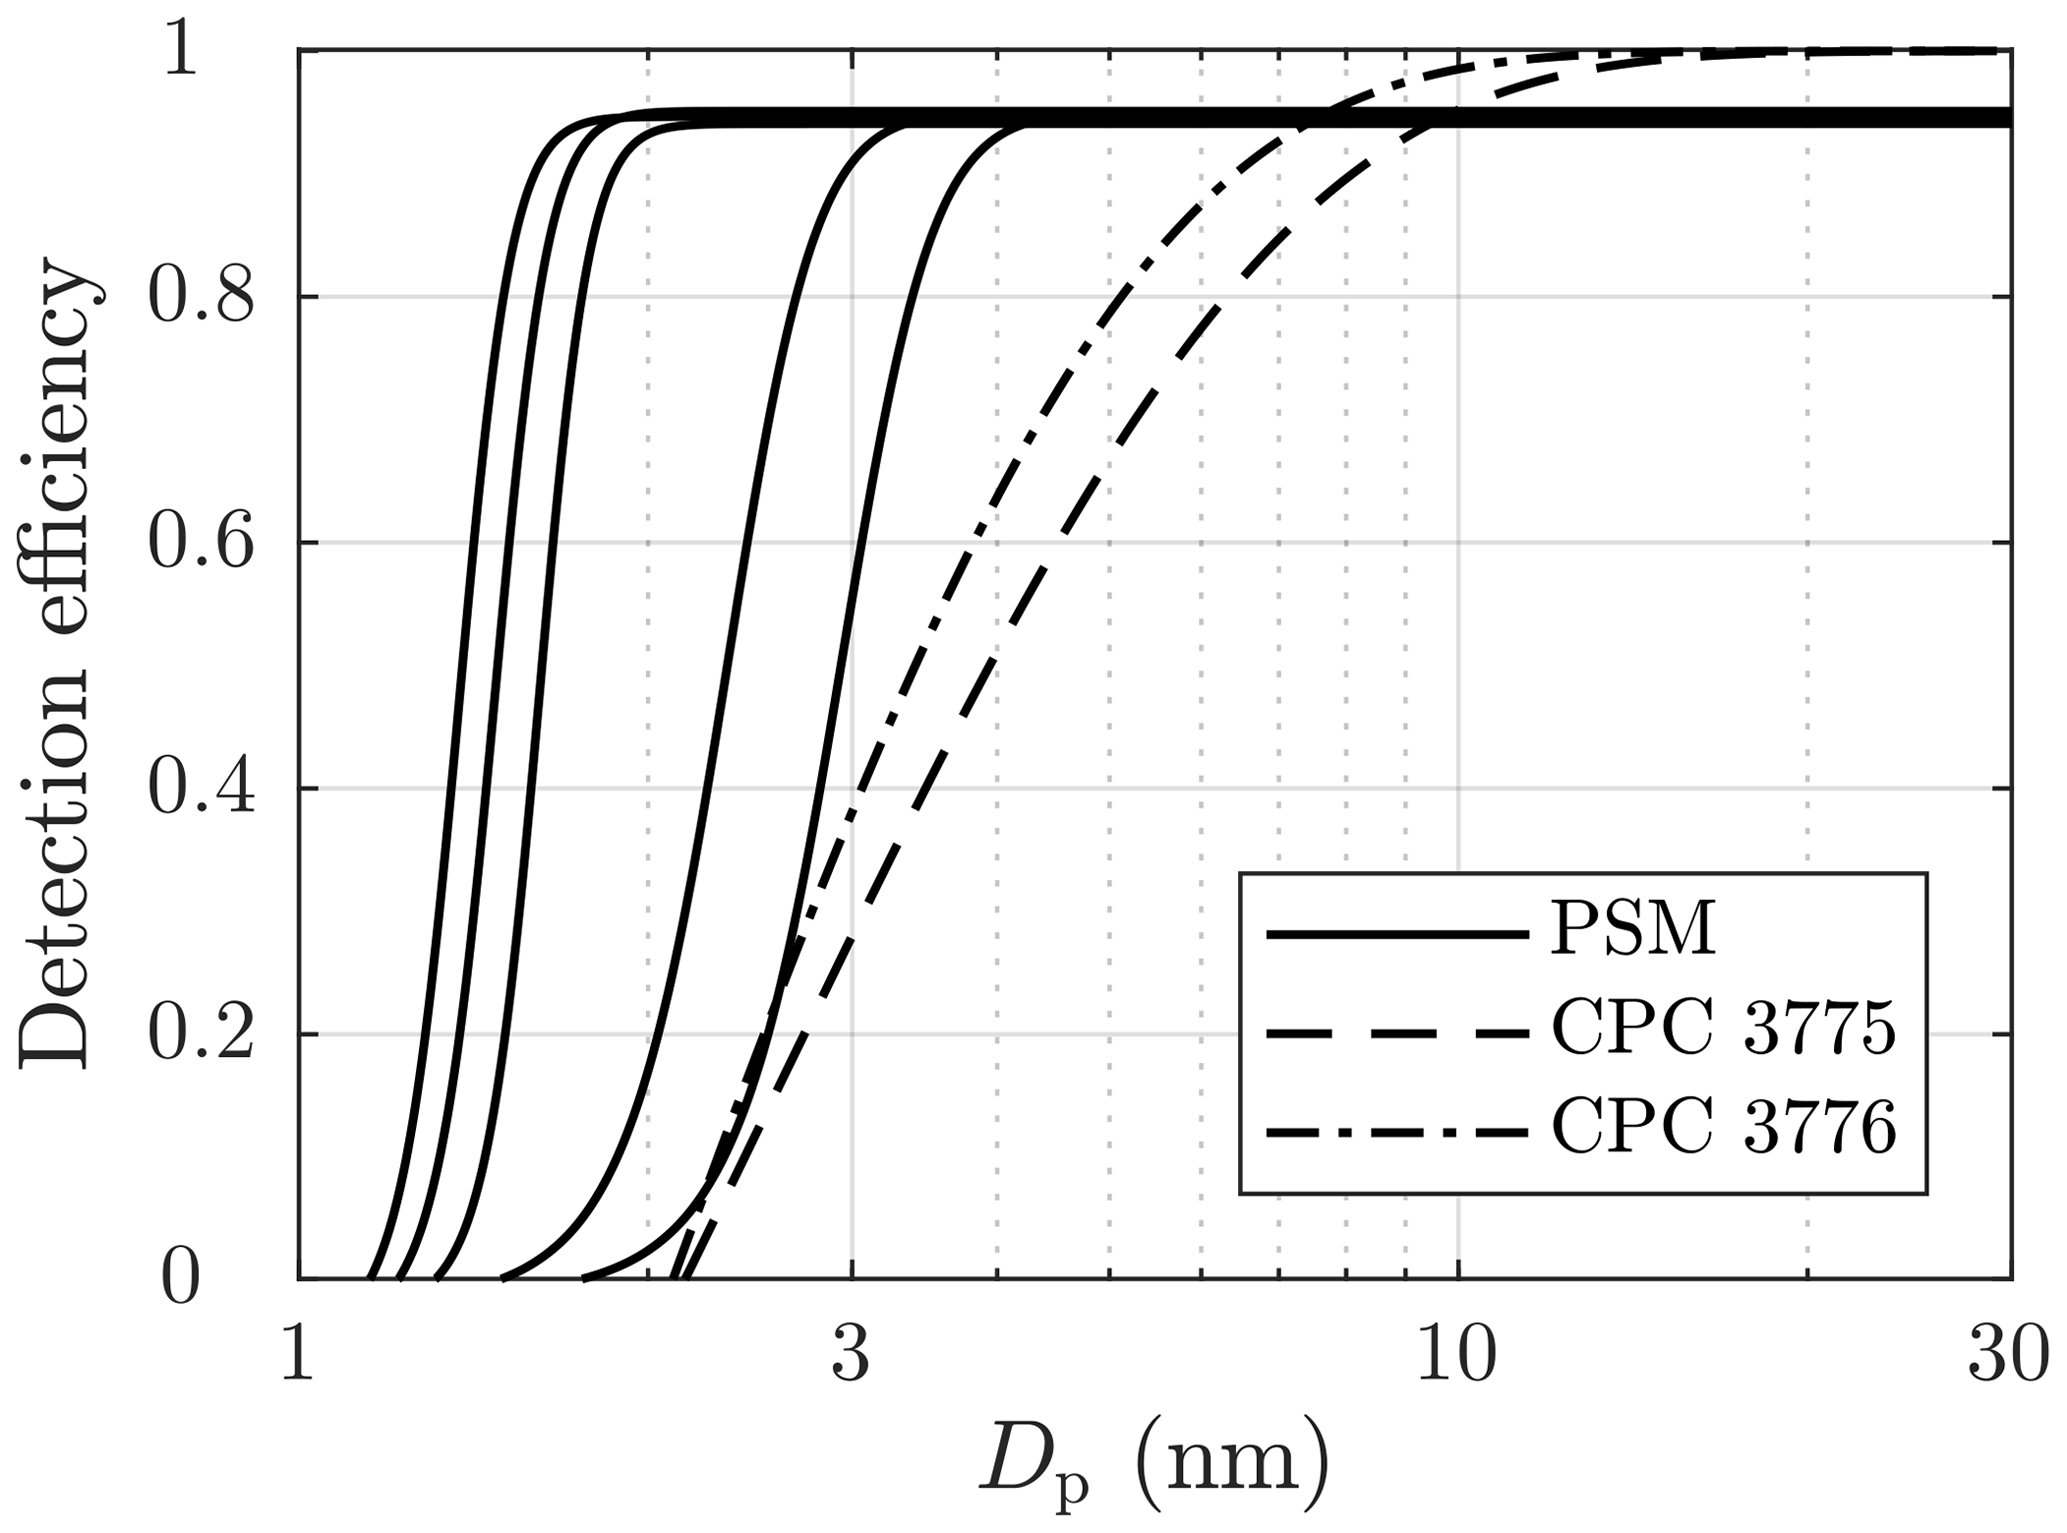
Figure 2The detection efficiencies of the PSM, with five different saturator flow rates used in this experiment, and of the condensation particle counters (CPCs). The curves are exponential fittings based on the detection efficiencies reported by the manufacturers of the devices, excluding the CPC 3776 curve, which is based on the efficiency measured by Mordas et al. (2008).
Due to particle number concentrations that are too high for the PSM, aerosol measured with the PSM and the CPC 3775 was diluted with a bridge diluter. It dilutes the concentration of larger particles (Dp>10 nm) with the ratio of 250, but the dilution ratio increases with decreasing particle size due to diffusional losses to the ratio of 1200 (Dp=1.15 nm) finally. The dilution ratio was measured with aerosol samples with the count median diameters (CMDs) of 2–25 nm. The ratio of the sampling line length and the flow rate of the bridge diluter, a partially unknown variable, used in the diffusional losses function reported by Gormley and Kennedy (1948), was fitted to correspond with the dilution ratio measurement results; the obtained dilution ratios are presented in Fig. 3.

2.4 Measurement sets
By varying [H2SO4] of the artificial raw exhaust sample and [H2O] and T of the dilution air separately and measuring the aerosol formed in the sampling system, the effects of the parameters on J can be examined. The effects of the parameters are included in Eq. (2) simply, with the exponents nsa, nw, and msa. To obtain these three yet unknown values, at least three parameters were required to be varied in the experiments. Nevertheless, a fourth parameter, the residence time, was also varied to provide some validation for the obtained exponents. [H2O] and T of the dilution air were varied simply by humidifying and heating the dilution air flowing to the PTD and measuring RH and T from the dilution air. Varying [H2SO4] of the raw sample was done by varying Tsa, and the values for [H2SO4] in the raw sample were obtained through inverse modeling.
The varied conditions of the measurements are presented in Table 1, where all the measurement points are divided according to the main outputs (nsa, nw, msa, and ) that measurement sets were designed to provide. Examining the effect of temperature (msa) was performed with the measurements of two types: varying TPTD while keeping RHPTD as a constant (set 3a) and varying TPTD while keeping the mole fraction of H2O in the dilution air of the PTD (xw,PTD) as a constant (set 3b). The time dependence of the nucleation rate () or, in the other words, the diminishment rate of J in a diluting sampling system, is mainly the product of the exponents nsa and msa in the following way: [H2SO4] decreases steeply due to dilution, losses to walls, and condensation to particles, resulting in diminishing J with the power of nsa; simultaneously, T decreases due to dilution and cooling of the sampling lines, resulting in strengthening J with the power of msa. Examining the diminishment rate provides validation for the relation of nsa and msa obtained from the simulations. We waited 2–40 min for the particle size distributions to stabilize after the conditions were changed between the measurement points. When the particle formation process was satisfactorily stabilized, measurement data for each measurement point were recorded for 5–40 min, depending on the stability of the particle generation.
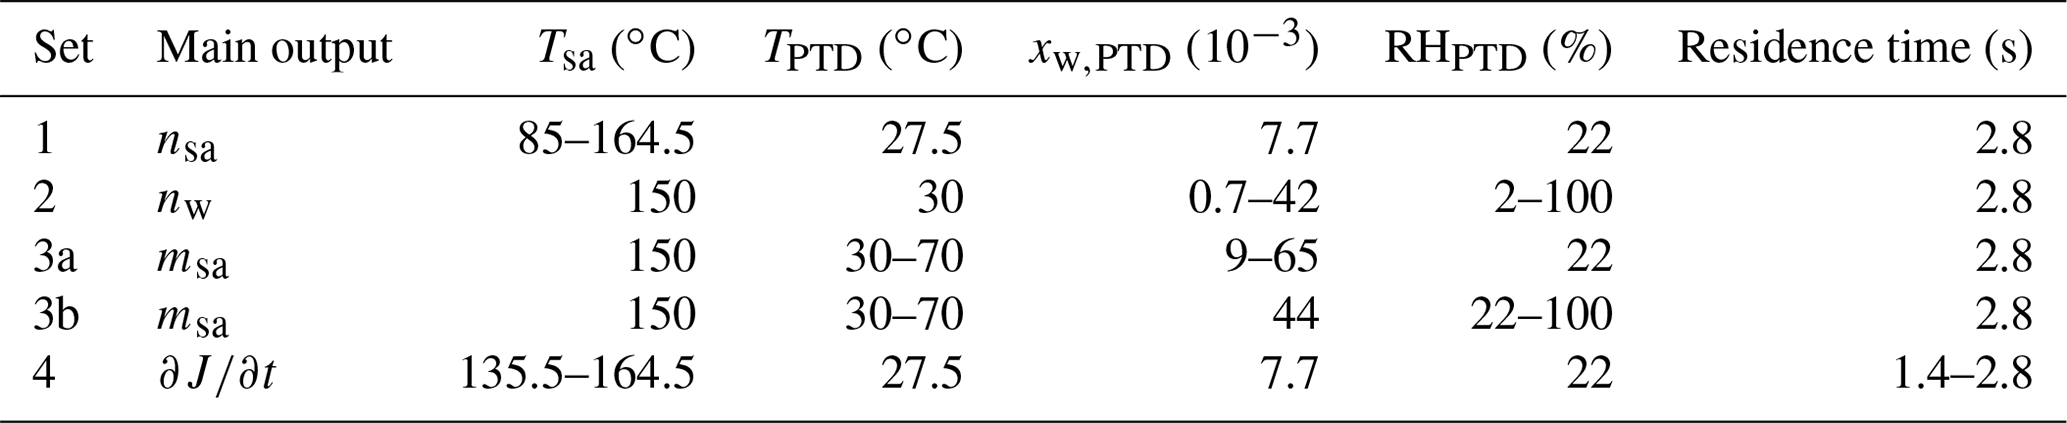
Figure 4 represents examples of particle size distributions measured with different H2SO4 evaporator temperatures, Tsa. The PSM+CPC data are calculated using the number concentrations measured with different saturator flow rates of the PSM and with the CPC 3775, i.e., with different D50-cut sizes. To properly compare the data measured with different dilution ratios and sampling line lengths, the comparison requires backwards-corrected data; i.e., all data in the figure are corrected with the dilution ratio of the bridge diluter and with the diffusional losses caused by the sampling lines between the ejector diluter and the measurement devices. However, correcting the distributions backwards from the measured data to the distributions after the ejector diluter is not simple because it requires the shapes of the distributions within the whole diameter range to be known. The data of the PSM and the CPC 3775 cannot always provide real size distributions because the cumulative nature of the method using particle counters as the size distribution measurement can suffer from noise in the measured concentration. For example, the PSM+CPC data with Tsa=157.2 ∘C shown in Fig. 4 imply that the concentration could increase with decreasing particle size, but the placing of the data points can be caused by the noise in the measured concentrations. On the other hand, the data imply that there are no particles smaller than ∼2.5 nm in diameter, but the data of the smaller particles can be invisible due to the noise in the measured concentrations (see the Supplement for the detailed uncertainty estimation of the size distributions). Hence, the unknown concentration of the particles smaller than ∼2.5 nm in diameter can have a significant effect on the total number concentration after the ejector diluter calculated from the measured data because these particles play the major role in the effect of the diffusional losses in the sampling lines and in the bridge diluter. Due to these uncertainties, the backwards-corrected data (denoting the distributions right after the ejector diluter) are not used when comparing the measured results with the simulated results later in this paper. Nevertheless, the backwards-corrected data are used when presenting the distributions from all the aerosol devices together because the distributions cannot be presented without correcting them backwards due to different particle losses in the sampling lines of the different devices.
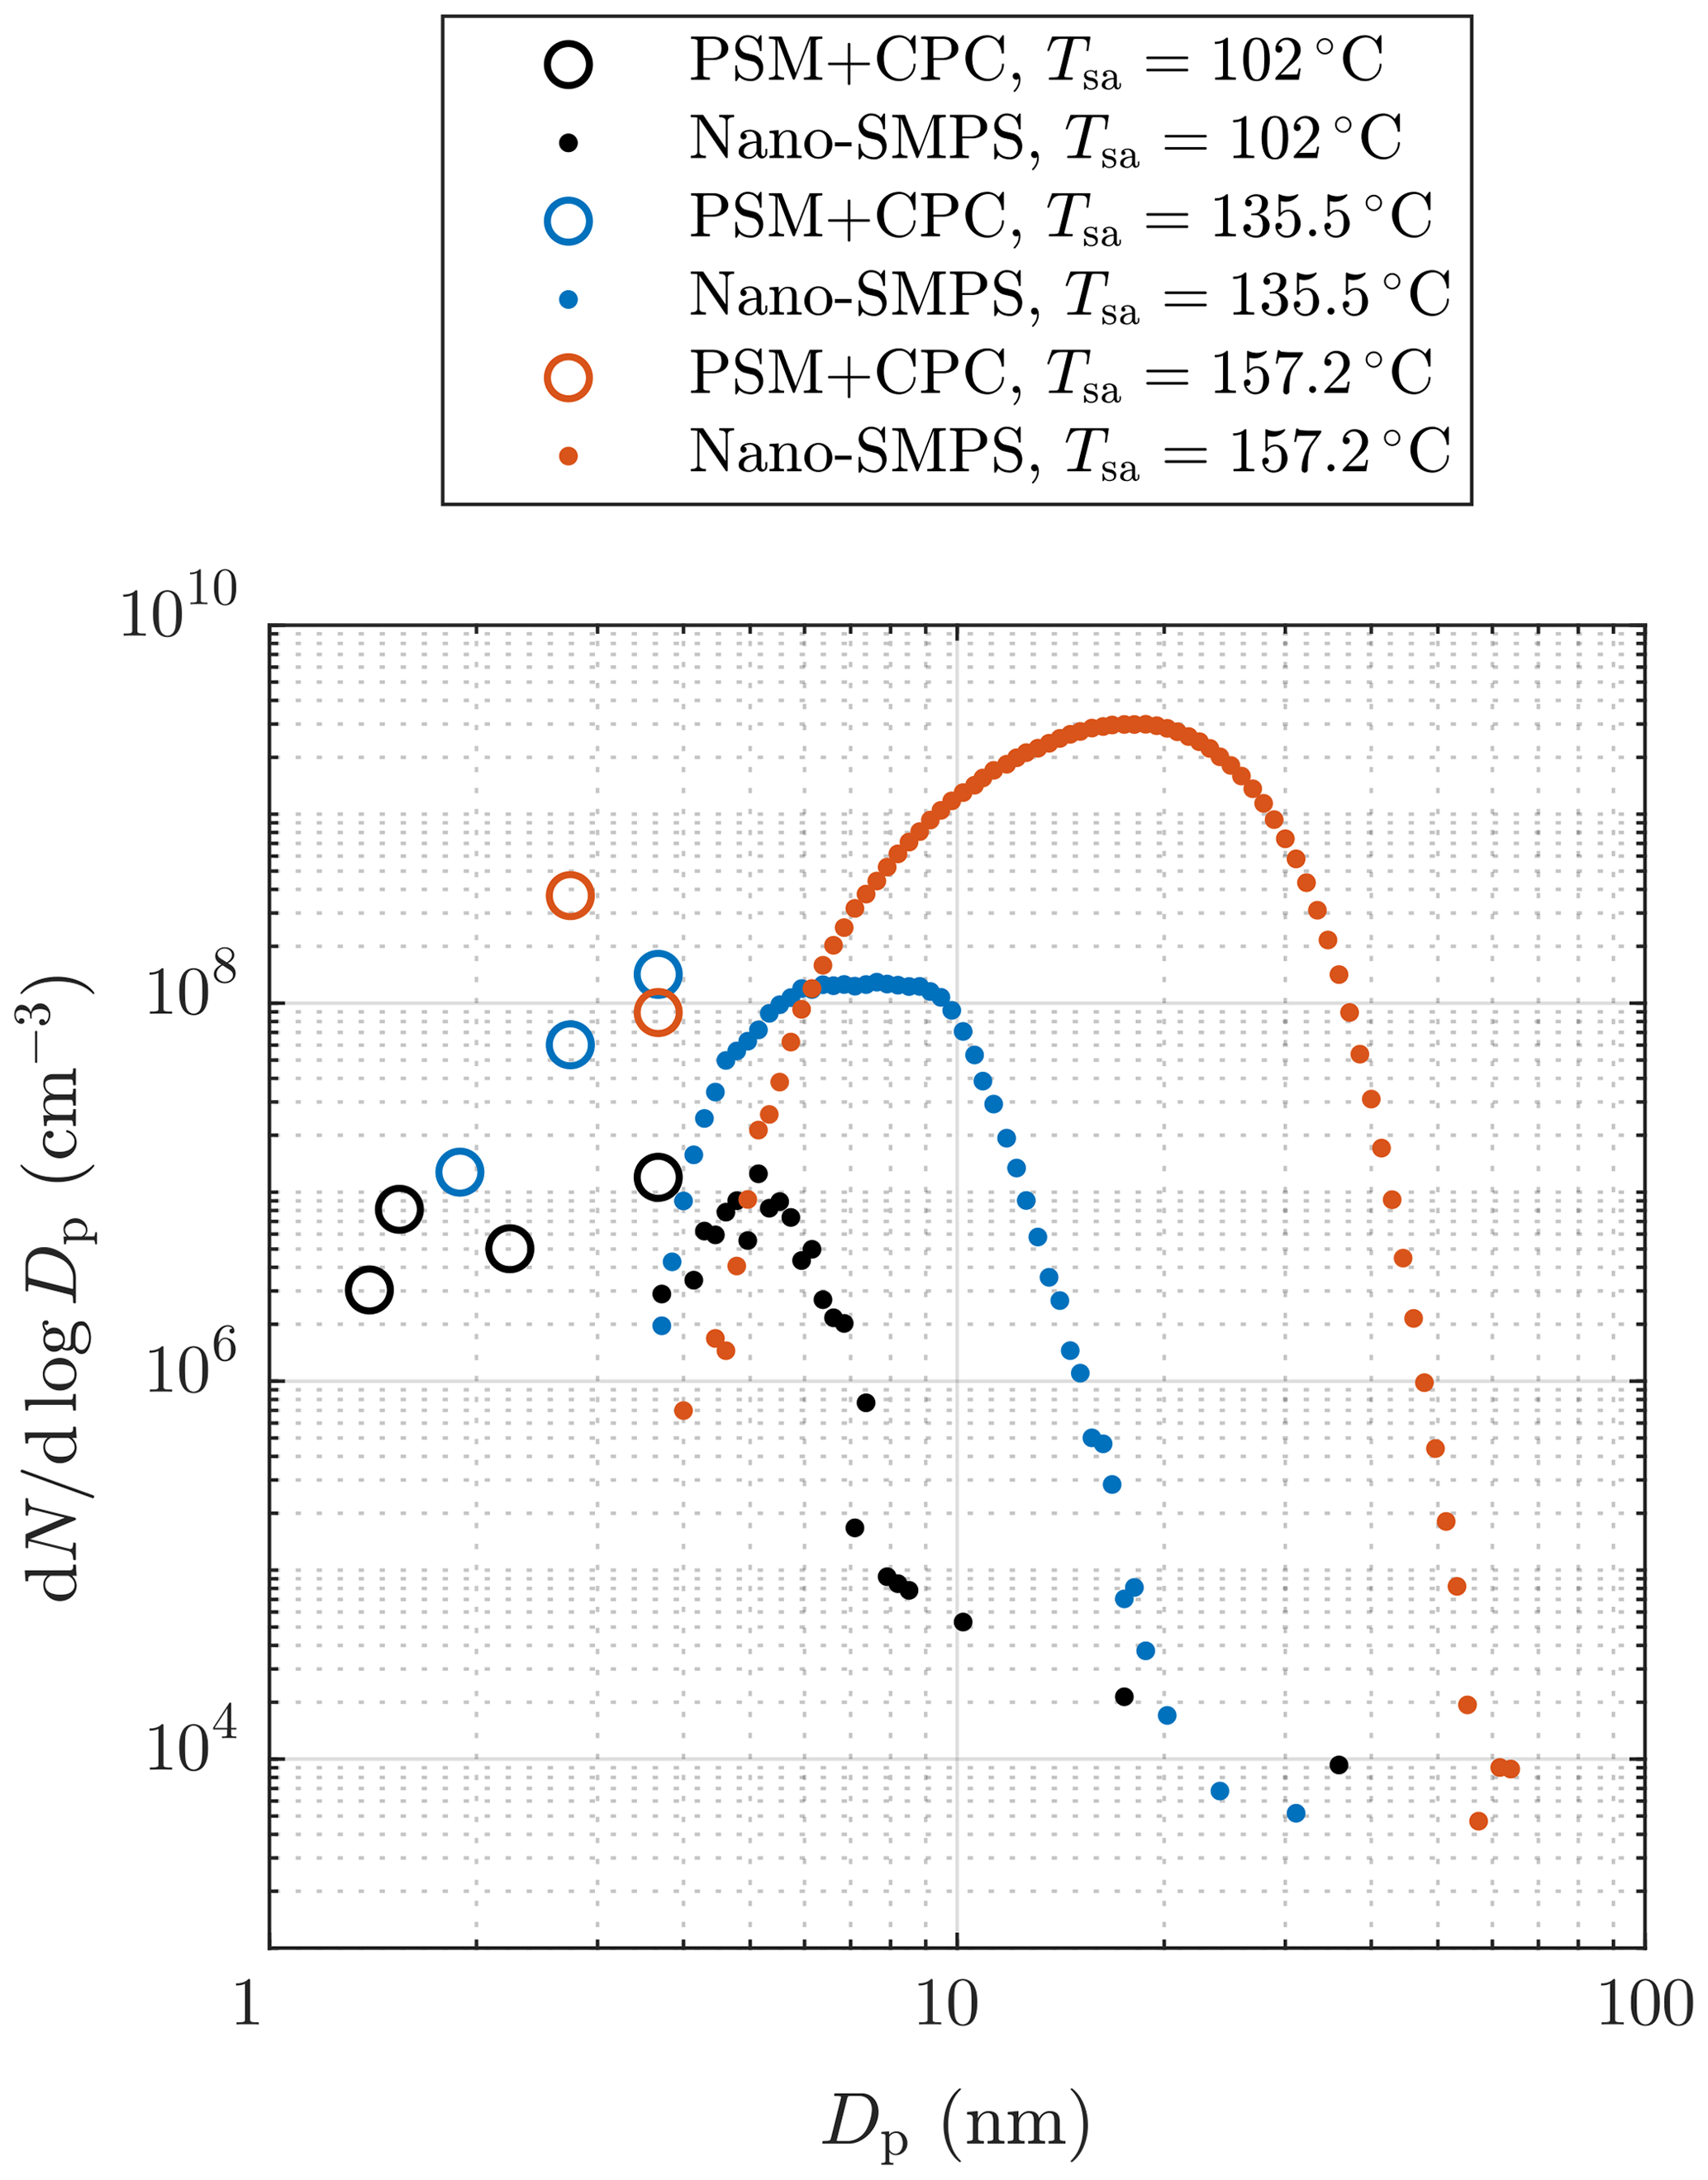
Figure 4Examples of particle size distributions after the ejector diluter, measured with different H2SO4 evaporator temperatures in measurement set 1. The data are corrected with the dilution ratio of the bridge diluter and with the diffusional losses in the sampling lines after the ejector diluter. The concentrations are multiplied by the total dilution ratio of the sampling system. See the Supplement for error bars.
It can be observed that, though the Nano-SMPS data are in a nearly log-normal form, there are also size distributions in the PSM+CPC diameter range. Particles generated with lower Tsa are lower in concentration and smaller than ones with higher Tsa; also a higher fraction of particles are in the PSM+CPC diameter range with lower Tsa. The smaller diameter edges of the log-normal size distributions measured by the Nano-SMPS do not connect with the distributions measured by the PSM and the CPC 3775 due to the weak detection efficiency of very small particles by the Nano-SMPS. Thus, the smaller diameter edges of the measured log-normal size distributions are not accurate. Similar disagreements of the data from these devices have also been observed elsewhere, both in exhaust-related (Alanen et al., 2015; Rönkkö et al., 2017) and in atmospherically related studies (Kulmala et al., 2013). By examining the combination of the size distributions measured by the PSM and the CPC 3775 and the size distributions measured by the Nano-SMPS, the real size distributions are not in a log-normal form. The detailed uncertainty estimation of the measured distributions and discussion on this disagreement can be found in the Supplement.
The particle number concentrations measured with the highest saturator flow rate of the PSM (NPSM), i.e., the particles with diameters larger than ∼1.3 nm, and the diameters with the average mass () of measurement set 1 are presented in Fig. 5. values are calculated using the size distributions measured with the combination of the PSM, the CPC 3775, and the Nano-SMPS, which are corrected with the diffusional losses in the sampling lines. Fig. 5 consists of data measured on two different days. It can be observed that NPSM increases steeply with increasing [H2SO4]raw with lower [H2SO4]raw values, but the steepness decreases with an increasing [H2SO4]raw due to an increasing self-coagulation rate. With lower [H2SO4]raw values, the slope of NPSM versus [H2SO4]raw in a log–log scale,
is approximately 10 but decreases to approximately 0.4 with decreasing [H2SO4]raw. The slope of J versus [H2SO4] is, by the definition of J (Eq. 2),
which is also the nucleation exponent for [H2SO4]. The slope can provide a rough estimate of the slope nsa, but due to the other aerosol processes, especially coagulation, having effects on the particle concentrations, the estimated slope can differ a lot from the real nsa in the nucleation rate function. The slope at higher [H2SO4]raw values is usually decreased due to coagulation, and the slope at lower [H2SO4]raw values can be increased due to decreased particle detection efficiency of smaller particles. Therefore, nsa is expected to be within the range of 0.4–10. Additionally, the estimated slope can also differ from nsa because is based on [H2SO4] in the raw sample rather than the value of [H2SO4] in a specific location: [H2SO4] decreases from the concentration in the raw sample by several orders of magnitude during the dilution process.
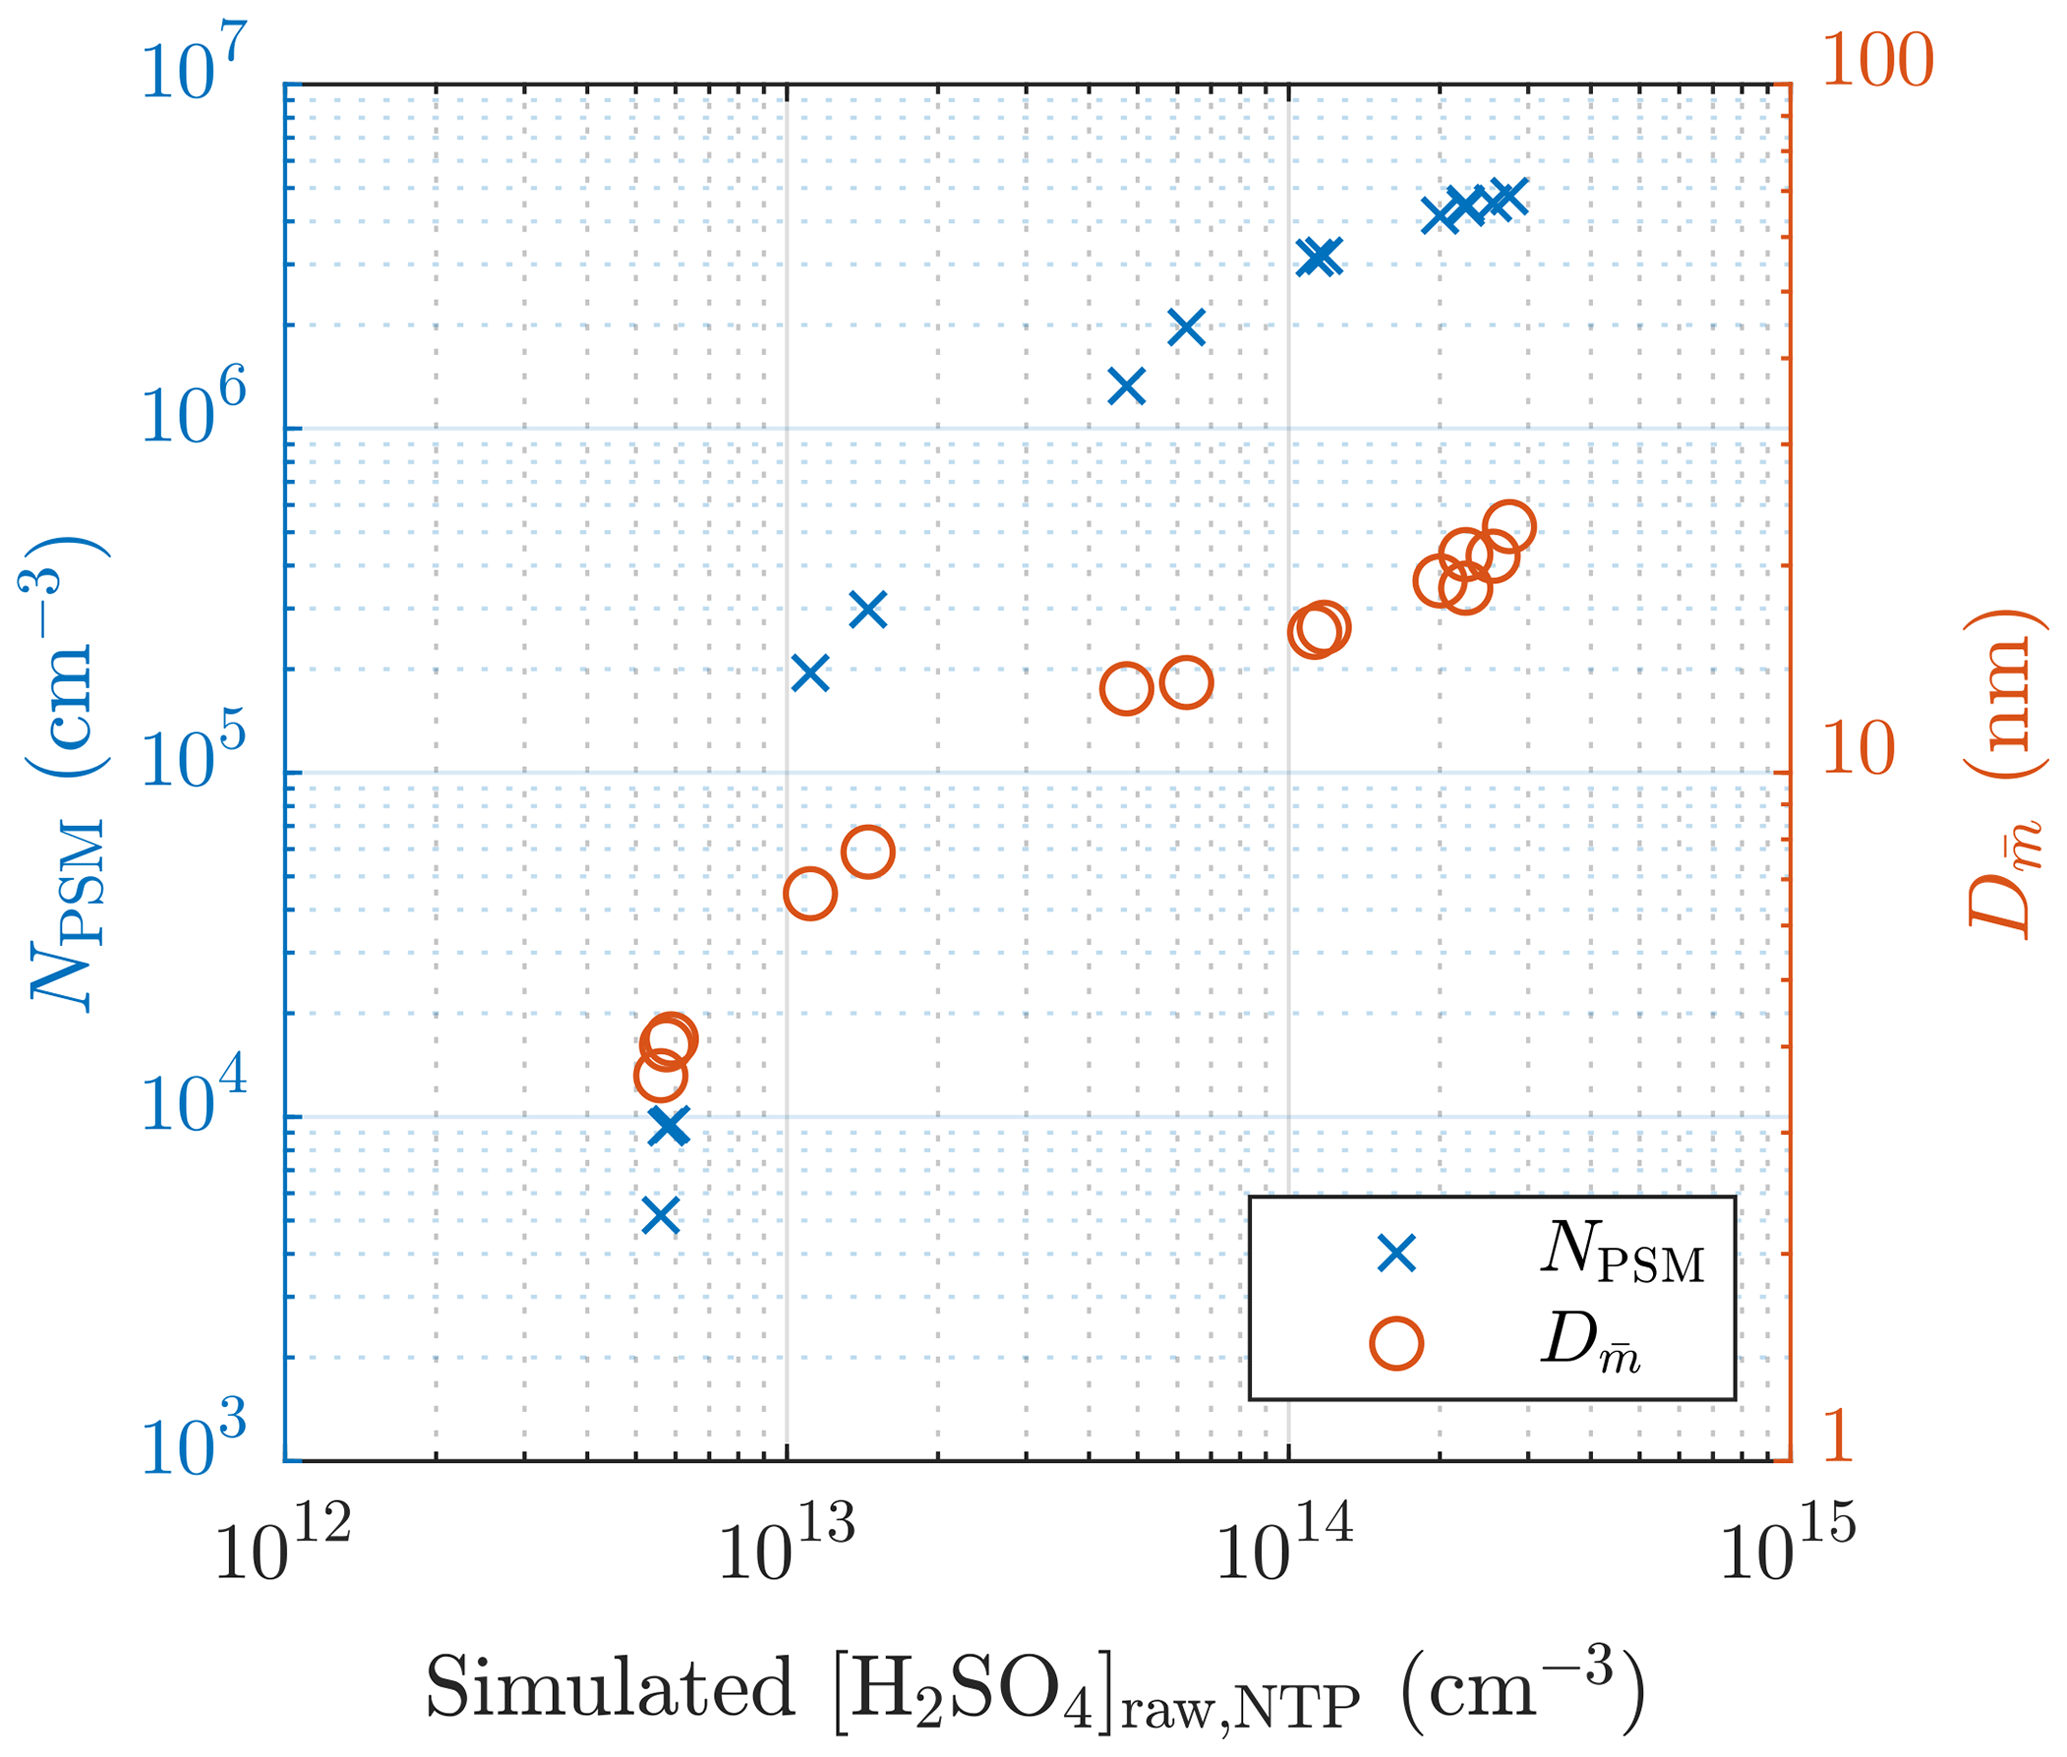
Figure 5The measured number concentrations of the particles larger than ∼1.3 nm and the diameters with the average mass of measurement set 1 as a function of the simulated H2SO4 concentration in the raw sample. The particle number concentrations are multiplied by the total dilution ratio of the sampling system. The error bars for these values are shown later, in Fig. 13. The H2SO4 concentrations are presented as the concentrations in NTP (normal temperature and pressure) conditions rather than in a hot raw sample.
The effect of humidity on the particle concentration (set 2) is shown in Fig. 6. The slope of NPSM versus RHPTD in a log–log scale,
is roughly between 0.1 and 0.2. The slope nearly equals the slope of NPSM versus [H2O]PTD () because TPTD is nearly a constant. The slope corresponds with the slope nw, with the same uncertainties as those involved with the slopes and nsa. Nevertheless, the effect of decreased particle detection is not involved because, in this case, particle size has only a weak dependency on RHPTD. Additional uncertainty in estimating nw arises from the origin of H2O vapor in the system, which is both the dilution air and the raw sample. Because [H2O] in the raw sample was kept constant, it has a higher effect on the total [H2O] with lower values of RHPTD; thus, the estimated nw is lower than the real nw in the nucleation rate function.
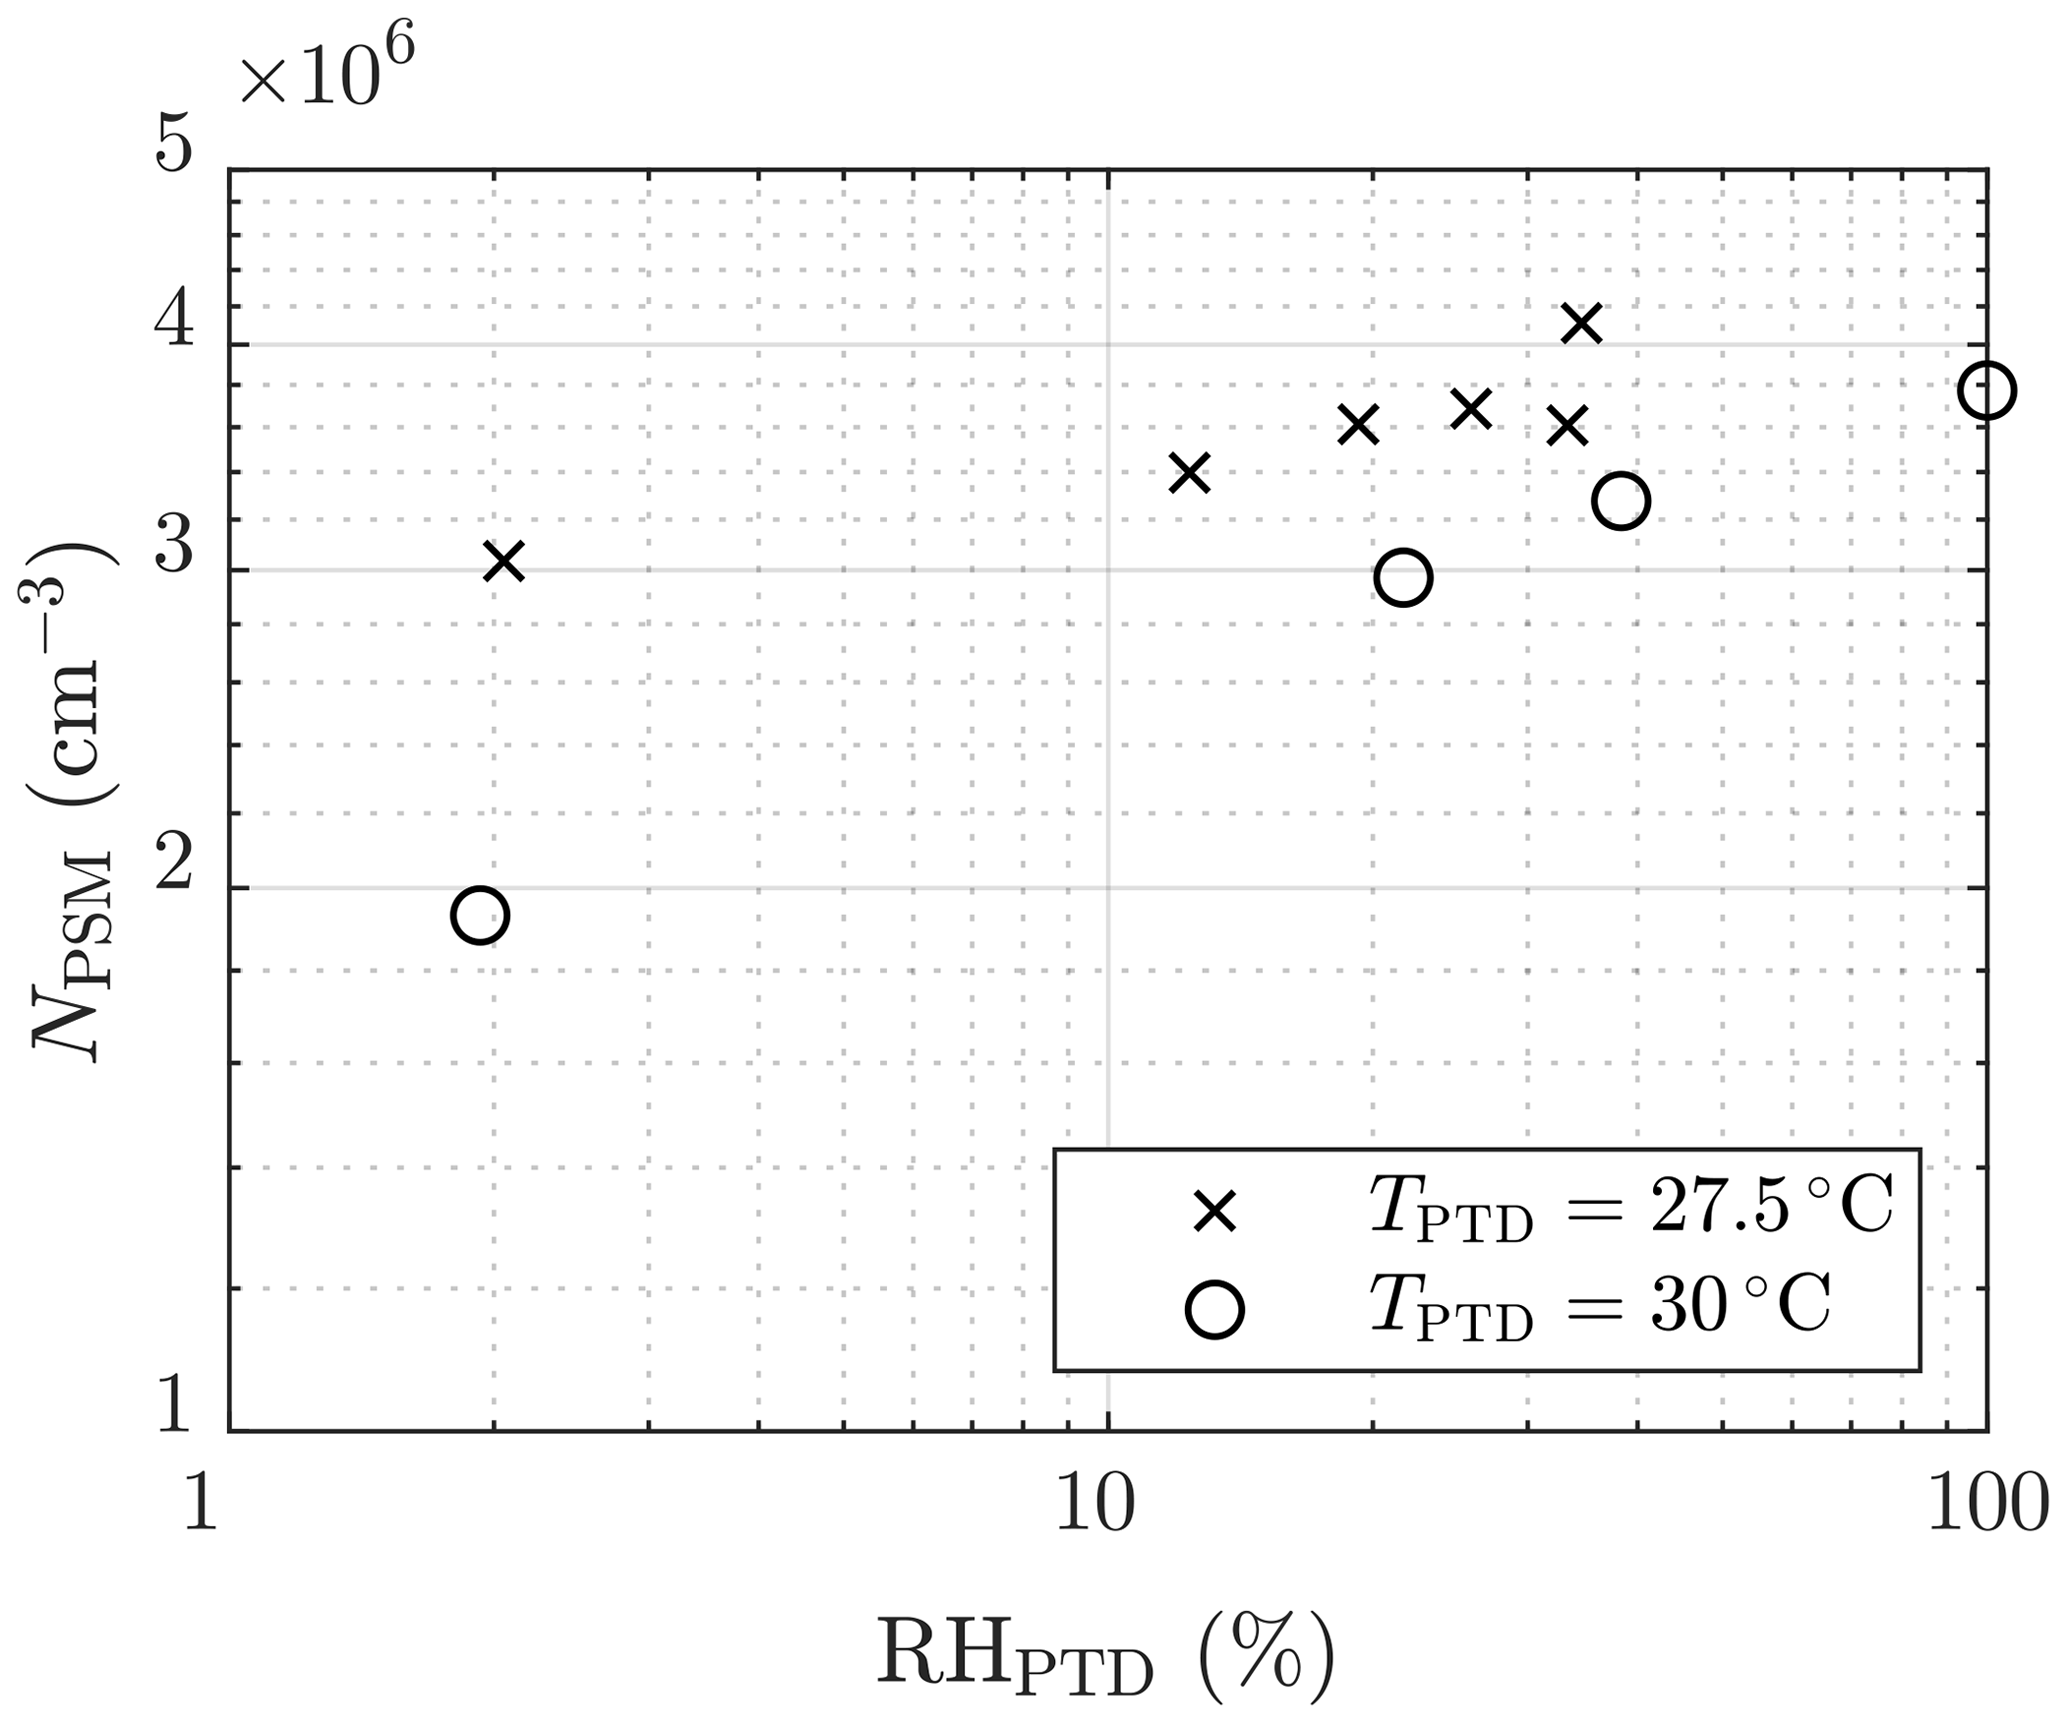
Figure 6The measured number concentrations of the particles larger than ∼1.3 nm of measurement set 2 as a function of the RH of the PTD dilution air. The concentrations are multiplied by the total dilution ratio of the sampling system. The error bars representing the standard uncertainties of the measured concentrations are within the marker sizes.
The effect of TPTD can be observed in Figs. 6 and 7. Lower temperatures result in higher concentrations of NPSM. However, the examination is problematic because keeping RHPTD as a constant while increasing TPTD (set 3a) increases [H2O], which results in lower NPSM with lower temperatures. Therefore, keeping xw,PTD as a constant (set 3b) is better for examining msa. One of the measurements with TPTD=50 ∘C is, however, a significant outlier in set 3b. Estimating the exponent msa from the slope in Fig. 7 is not straightforward because temperature is also included in the concentrations with exponents that are still unknown.
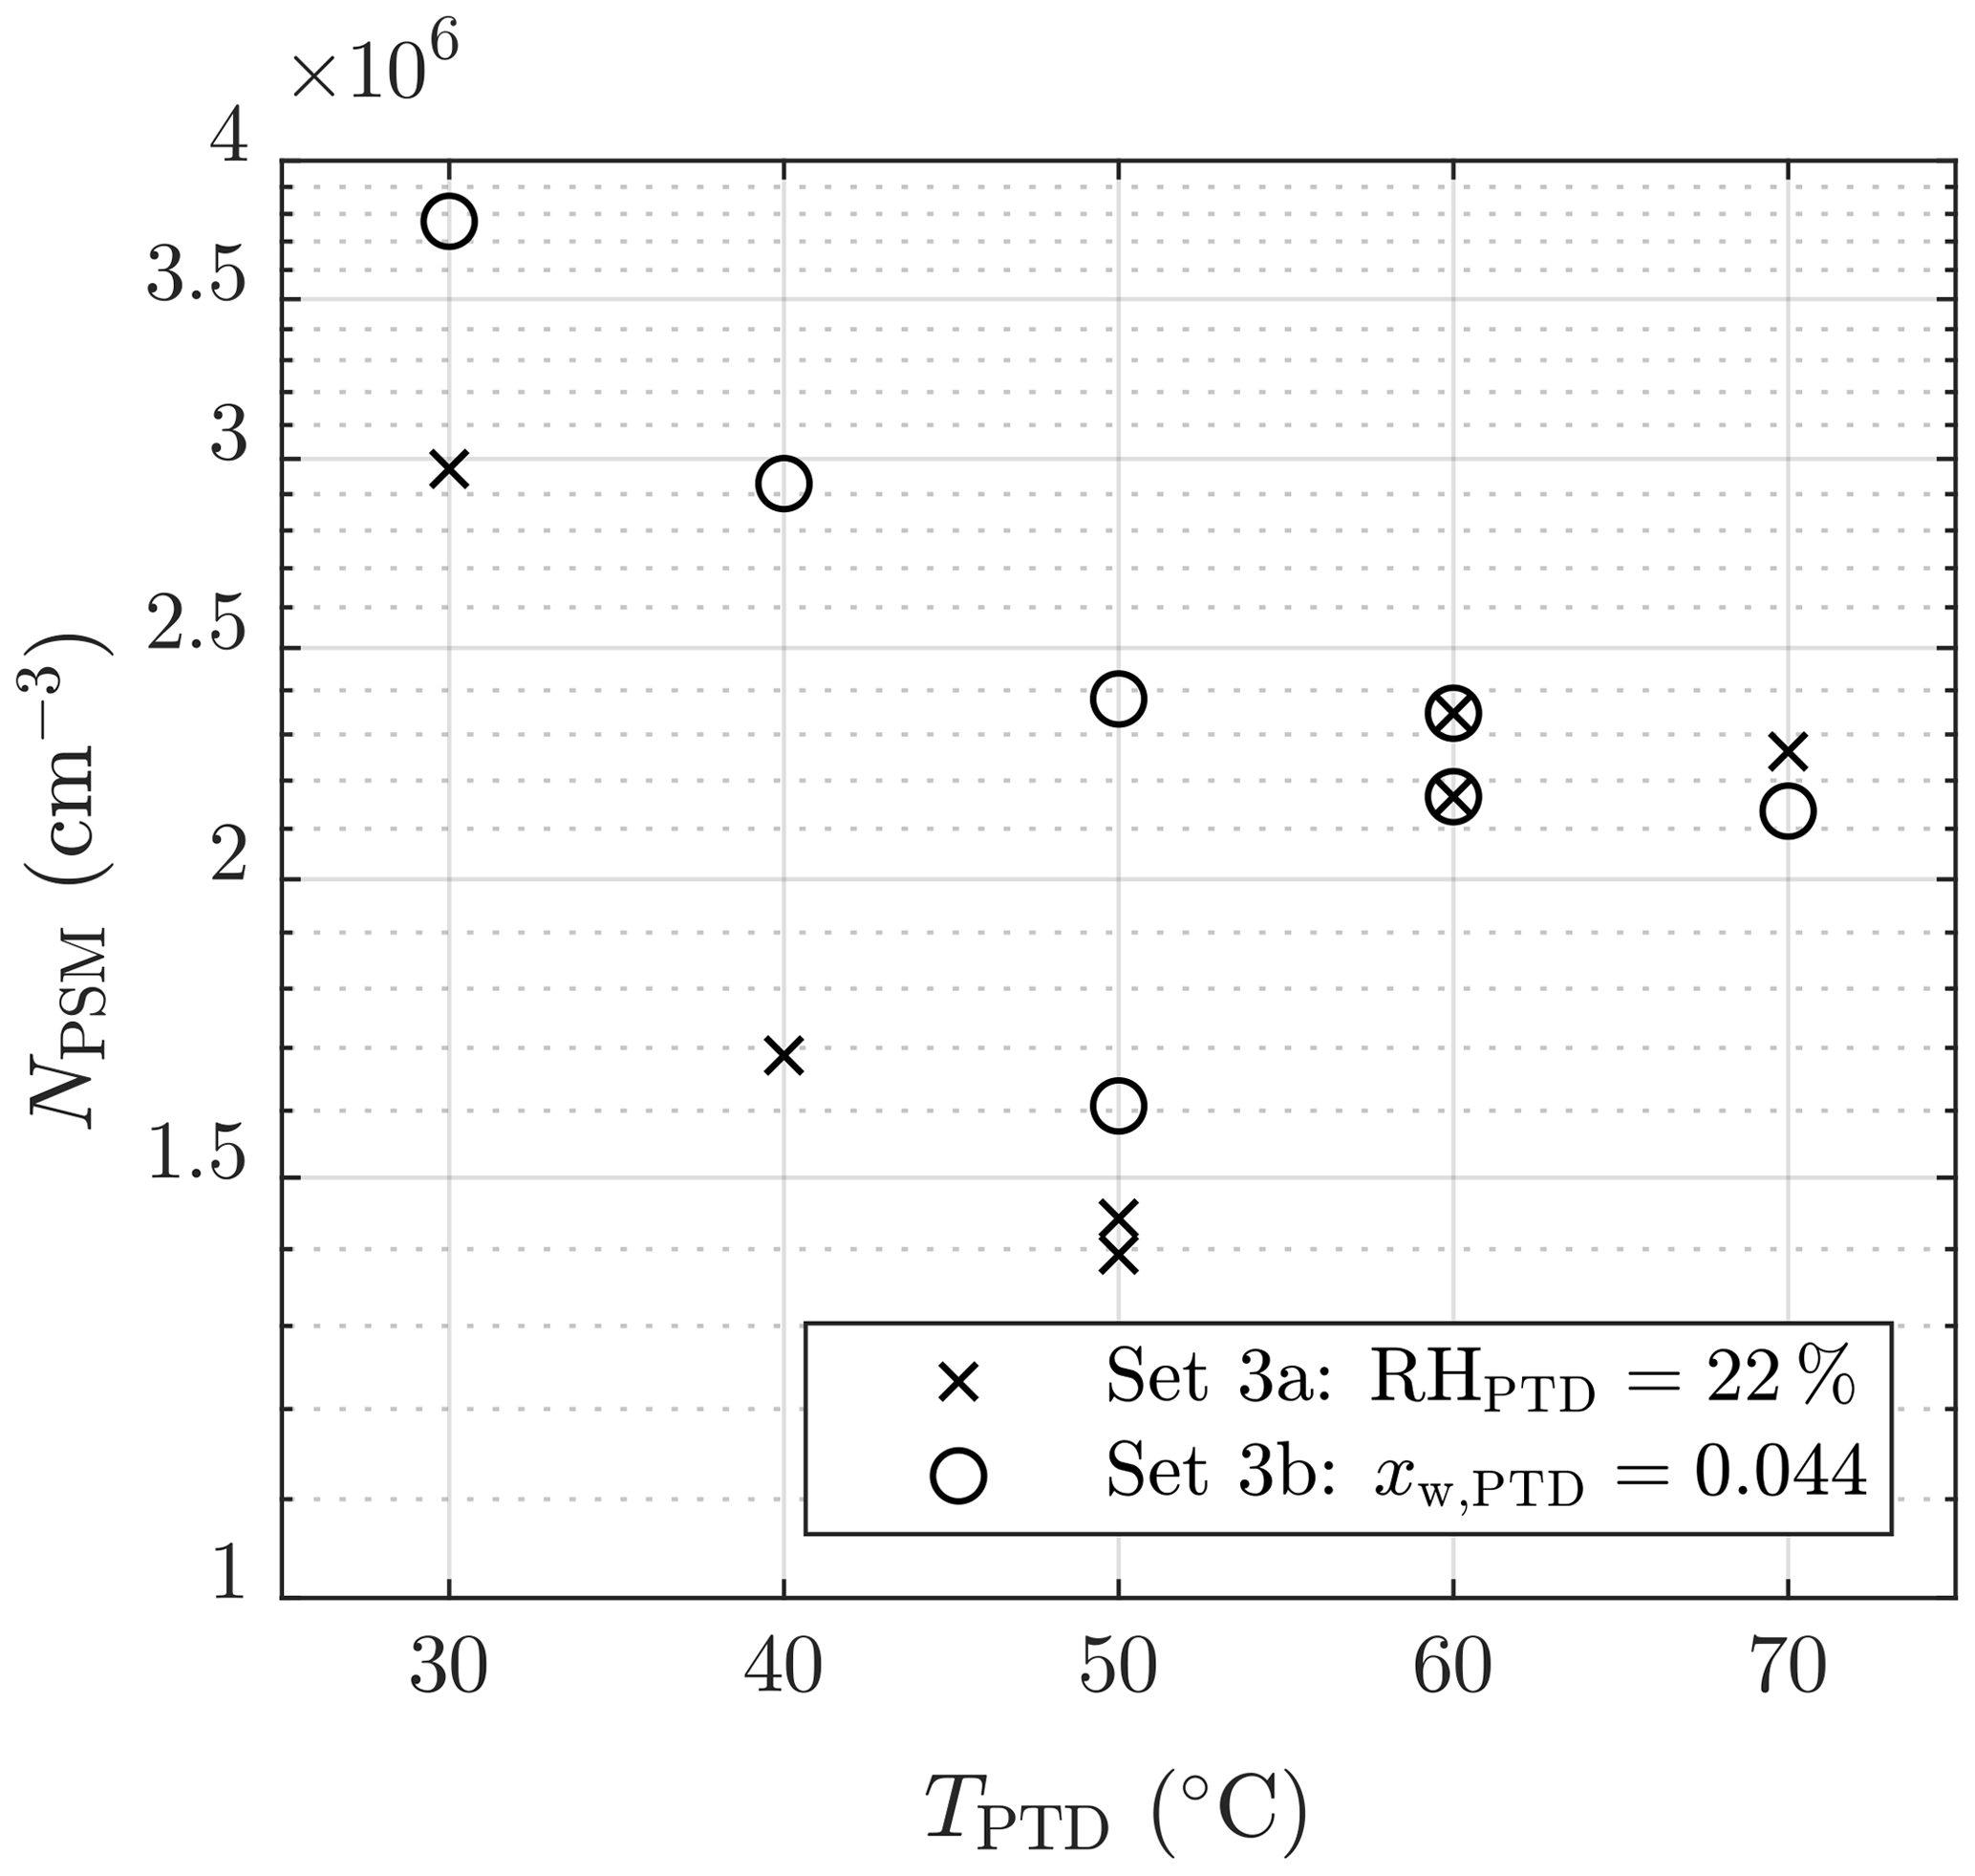
Figure 7The measured number concentrations of the particles larger than ∼1.3 nm of measurement set 3 as a function of the T of the PTD dilution air. The concentrations are multiplied by the total dilution ratio of the sampling system. The error bars representing the standard uncertainties of the measured concentrations are within the marker sizes.
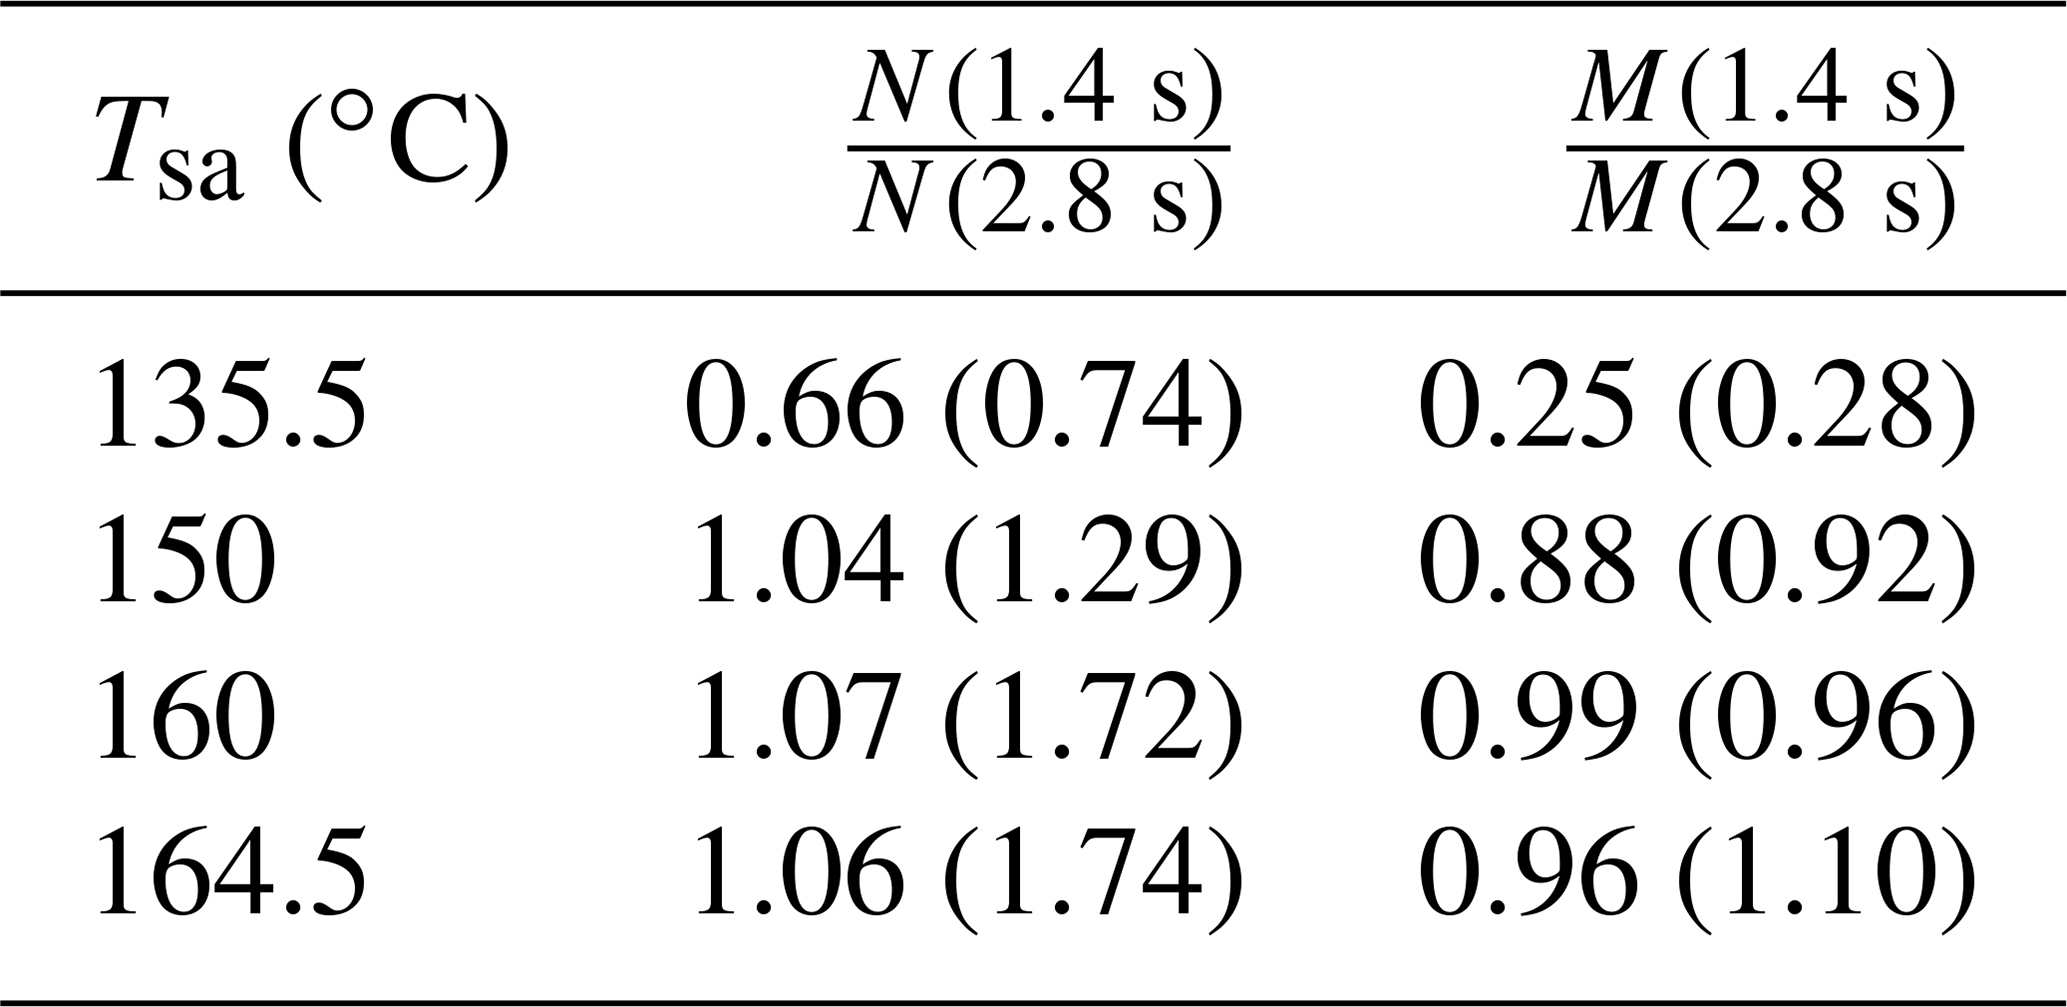
The effect of the residence time on the particle concentrations is presented in Table 2. With Tsa=135.5 ∘C, the ratio of N with the residence times of 1.4 s and with the residence time of 2.8 s is below unity, but it is above unity with higher temperatures. The ratio below unity signifies that the nucleation process is still not diminished at the time of 1.4 s; e.g., the ratio of 0.74 denoting 74 % of particles is formed within the time range of 0–1.4 s, and the remaining 26 % is formed within the time range of 1.4–2.8 s. With higher temperatures, the ratio is above unity because self-coagulation begins to decrease the number concentration, especially at the later times where the number concentration is the highest. The nucleation process may continue after 1.4 s, but it cannot be easily seen with higher temperatures. Because coagulation has no effect on the mass concentrations (M), the ratios of M measured with the combination of the PSM, the CPC 3775, and the Nano-SMPS with the residence time of 1.4 s and with the residence time of 2.8 s are near unity with higher temperatures. The effects of particle growth and wall losses, however, have effects on the ratios, too. The temperature with which the coagulation process would eliminate the effect of the nucleation process, resulting in the number concentration ratio of unity, is near 142 ∘C.
Table 2The ratios of the measured number concentrations and mass concentrations with the residence times of 1.4 and 2.8 s, in measurement set 4. The values are corrected with the dilution ratio of the bridge diluter and with the diffusional losses in the sampling lines after the ejector diluter; thus, the values correspond with the distributions existing after the ejector diluter.

Every measurement point presented in Table 1 was simulated with the model consisting of four phases: (1) the CFD simulations for solving the flow and the temperature field of the sampling system, (2) the CFD-TUTMAM simulations for solving the aerosol processes in the sampling system, (3) correcting the particle sizes decreasing rapidly in the dry ejector diluter, and (4) calculating the penetration of the particles due to diffusional losses in the sampling lines after the sampling system and the detection efficiencies of the particle counting devices.
4.1 CFD model
The CFD simulations to solve the flow and the temperature fields for every simulation case were performed with a commercially available software, ANSYS Fluent 17.2. It is based on a finite volume method in which the computational domain is divided into a finite amount of cells. Governing equations of the flow are solved in every computational cell iteratively until sufficient convergence is reached. In this study, the governing equations in the first phase are continuity, momentum, energy, radiation, and turbulence transport equations.
The computational domain in the CFD simulations is an axial symmetric geometry consisting of the PTD, the aging chamber, and the ejector diluter (Fig. 1). An axial symmetric geometry was selected over a three-dimensional geometry due to high computational demand of the model and a nearly axial symmetric profile of the real measurement setup. The domain was divided into computational cells, of which the major part was located inside the PTD, where the smallest cells are needed due to the highest gradients. The smallest cells were 20 µm in side lengths and were located in the beginning of the porous section, where the hot exhaust and the cold dilution air meet.
In contrast to our previous study (Olin et al., 2015), the ejector diluter was also included in the computational domain, though it has only a minor effect on nucleation (Lyyränen et al., 2004; Giechaskiel et al., 2009). Because the ejector diluter has a high speed nozzle that cools the flow locally to near −30 ∘C, including it in the domain provides partial validation for msa in the following way: if too high a value for msa were used, nucleation would be observed in the ejector diluter, in contrast to the former studies. The internal fluid inside the sampling lines is modeled as a mixture of air, H2O vapor, and H2SO4 vapor. The sampling lines are modeled as solid zones of steel or Tygon, and 10 cm of the external fluid, modeled as air, is also included in the domain to simulate natural cooling of the sampling lines.
Flow rate and temperature boundary conditions for the simulated sampling system were set for the each simulation case to the measured values. Due to steady-state conditions and high computational demand, all governing equations were time averaged; thus, the simulations were performed with a steady-state type. Turbulence was modeled using the SST-k-ω model, which is one of the turbulence models used with a steady-state simulation. It produced the most reliable results of the available steady-state turbulence models based on the pressure drop in the porous section. Turbulence, however, can play a significant role in the wall losses of the vapors and the particles in the regions where the turbulence level is high. In this sampling system, the turbulence level is high in the upstream part of the aging chamber where the diameter of the sampling line increases steeply. Validating the suitability of the turbulence model for this geometry would require a measurement of, for example, solid seed particle concentrations after and before the sampling system without any aerosol processes, such as nucleation, condensation, and coagulation. However, that kind of measurement has not been performed yet.
4.2 CFD-TUTMAM
The main functionality of the CFD-TUTMAM based on the previous aerosol model, CFD-TUTEAM, is described by Olin et al. (2015). However, because the measured distributions are not in a log-normal form, the inclusion of the PL+LN model (Olin et al., 2016) was beneficial. The PL+LN model simulates the initial growth of newly formed very small particles by modeling the particle size distribution with the combination of a power law (PL) and a log-normal (LN) distribution. Newly formed particles are first put to the PL distribution, after which they are transferred to the LN distribution by particle growth.
The CFD-TUTMAM adds three governing equations per distribution (denoted by j) to the CFD model using a modal representation of the particle size distribution; i.e., the distributions are modeled by three variables: number (), surface-area-related (), and mass (Mj,1) moment concentrations. Mj,1 values are further divided into different components in a multi-component system. Due to small particle size and low particle loading, the aerosol phase has only a minor effect on the gas phase properties. Therefore, continuity, momentum, energy, radiation, and turbulence transport equations can be excluded from the computation after the flow and temperature fields are solved, and only gas species equations and the aerosol model equations are solved. The governing equation of the aerosol model for the concentration of a kth moment of a distribution j is
where u, ρf, and are the fluid velocity vector, the fluid density, and the kth-moment-weighted average of the particle effective diffusion coefficient, respectively. The last terms in Eq. (6) represent source terms for nucleation, condensation, coagulation, and intermodal particle transfer. In this study, aerosol is modeled with two distributions: a PL distribution (j=PL) and an LN distribution (j=LN). In this study, two gas species equations, which model the internal fluid mixture as the mass fractions of H2O and H2SO4, are built in the CFD model, but the opposite numbers of the source terms of nucleation and condensation are added to them to maintain the mass closure of the species.
After each iteration step of the CFD-TUTMAM simulation, the parameters of the distributions are calculated for every computational cell by using three moment concentrations. The parameters for the PL distribution are the number concentration (NPL), the slope parameter (α), and the largest diameter (D2). The smallest diameter (D1) has a fixed value of 1.15 nm, which is the smallest detectable particle diameter with the devices used. The density function for the PL distribution is
where β0 is a function
The parameters for the LN distribution are the number concentration (NLN), the geometric standard deviation (σ), and the geometric mean diameter (Dg). An analytical solution exists for the reconstruction of the parameters from the moment concentrations for the LN distribution but not for the PL distribution; thus, it is solved numerically. A numerical solution is obtained by using the Levenberg–Marquardt iteration algorithm, in contrast to a slower method using a pre-calculated interpolation table described by Olin et al. (2016).
The nucleation source terms in Eq. (6) for different moments are
where J is the nucleation rate as in Eq. (2) and and are the masses of H2SO4 and H2O in a newly formed particle. The value of D1=1.15 nm was chosen for the diameter of the newly formed particles. A particle of this diameter is in equilibrium with water uptake in the temperature of 300 K and in the relative humidity of 22 % if the mass fraction of H2SO4 in the particle is 0.71. This constant value is used with nucleation, though the mass fraction would vary between 0.5 and 1 if the whole temperature and humidity range were considered, but the major part of nucleation occurs in the conditions with the equilibrium mass fraction of near 0.71. This mass fraction and particle diameter correspond with a cluster containing 5.7 H2SO4 molecules and 12.4 H2O molecules.
Diffusion, condensation, and coagulation are modeled as described in Olin et al. (2015), and intermodal particle transfer is modeled as described in Olin et al. (2016). Condensation is modeled with the growth by H2SO4, which immediately follows the water uptake until the water equilibrium is achieved. The water equilibrium procedure is also described in Olin et al. (2015). The coagulation modeling includes intramodal coagulation within both distributions and intermodal coagulation between the distributions.
Intermodal particle transfer includes condensational transfer and coagulational transfer from the PL distribution to the LN distribution. In contrast to a constant condensational transfer factor γ of the PL+LN model described in Olin et al. (2016), a function of α, D1∕D2, and k is used in the CFD-TUTMAM due to more complex particle growth modeling. The function used here is
The functional form of γ is derived so that the condensational transfer eliminates the effect of increasing α by the condensation process and also tries to keep α positive because a PL distribution with a negative α in combination with an LN distribution represents a distribution with a nonphysical local minimum between the distributions. The form of γ also restricts α from increasing too much, which would cause numerical difficulties. Particles are not lost or altered during the intermodal particle transfer; it only controls the ratio of particles represented in the PL distribution and in the LN distribution. Higher values of γ result in a lower NPL∕N ratio.
Deposition of particles and condensation of vapors onto the inner walls of the sampling lines have a direct effect on the aerosol concentrations at the measurement devices. The particle deposition was modeled by setting the boundary conditions for the aerosol concentrations at the walls to zero, which represents deposition driven by diffusion and turbulence. Condensation of H2O and H2SO4 vapors onto the walls was modeled by setting the boundary conditions for the mass fractions of H2O and H2SO4 at the walls to saturation mass fractions in an aqueous solution of H2SO4, in contrast to the simpler method in the previous study (Olin et al., 2015). The simpler method caused H2SO4 to be completely non-condensing onto the walls because the saturation ratio of the pure vapor never exceeded unity. Instead, the method using the saturation mass fractions in the solution induces some condensation because the vapor pressure of a hygroscopic liquid over an aqueous solution is lower than over a pure liquid. This method also provides smoother behavior of the boundary conditions on the walls. The method is, however, strongly dependent on the chosen activity coefficient functions of the vapors, which have large differences between each other due to their exponential nature. Activity coefficients used here are based on the values reported by Zeleznik (1991). However, due to the exponential and non-monotonic nature of activity coefficients, they cause numerical difficulties in CFD modeling; thus, a monotonic van Laar-type equation fitted by Taleb et al. (1996) from the data of Zeleznik (1991) was used.
4.3 Dry particle model
The main trend of the RH inside the sampling system is an increasing trend due to decreasing temperature. This results in an increasing water uptake rate during the particle growth process, which can be modeled by the condensation rate of H2O that is simply the condensation rate of H2SO4 multiplied by a suitable factor (the water equilibrium procedure described by Olin et al., 2015). However, when the sample enters the ejector diluter, the RH decreases rapidly due to dry dilution air, but the growth process by the condensation of H2SO4 still continues. This results in an increasing H2SO4 amount in the particles but a rapidly decreasing H2O amount, which cannot be modeled with the water uptake model. Hence, the particles after the ejector diluter simulated by the CFD-TUTMAM contain incorrectly too much water.
All the simulated particle size distributions outputted by the CFD-TUTMAM were corrected to correspond with the water amount that would be in the conditions after the ejector diluter ( and RH≈3.6 %). These conditions are mainly caused by the conditions of compressed air directed to the ejector diluter. Additionally, the particle size measurement device (Nano-SMPS) used room air, having nearly equal conditions as compressed air, as the sheath flow air. Dry sheath flow air also dries particles rapidly inside the device. The theory behind the dry particle model is the same as the theory behind the water uptake model in the CFD-TUTMAM, but the drying process is significantly faster and in the opposite direction, in contrast to the water uptake connected to the condensation rate of H2SO4 in the CFD-TUTMAM. Figure 8 represents examples of particle diameters in different humidities; e.g., a particle with the diameter of 40 nm in the RH of 60 % shrinks to the diameter of 30 nm when sampled with the ejector diluter.
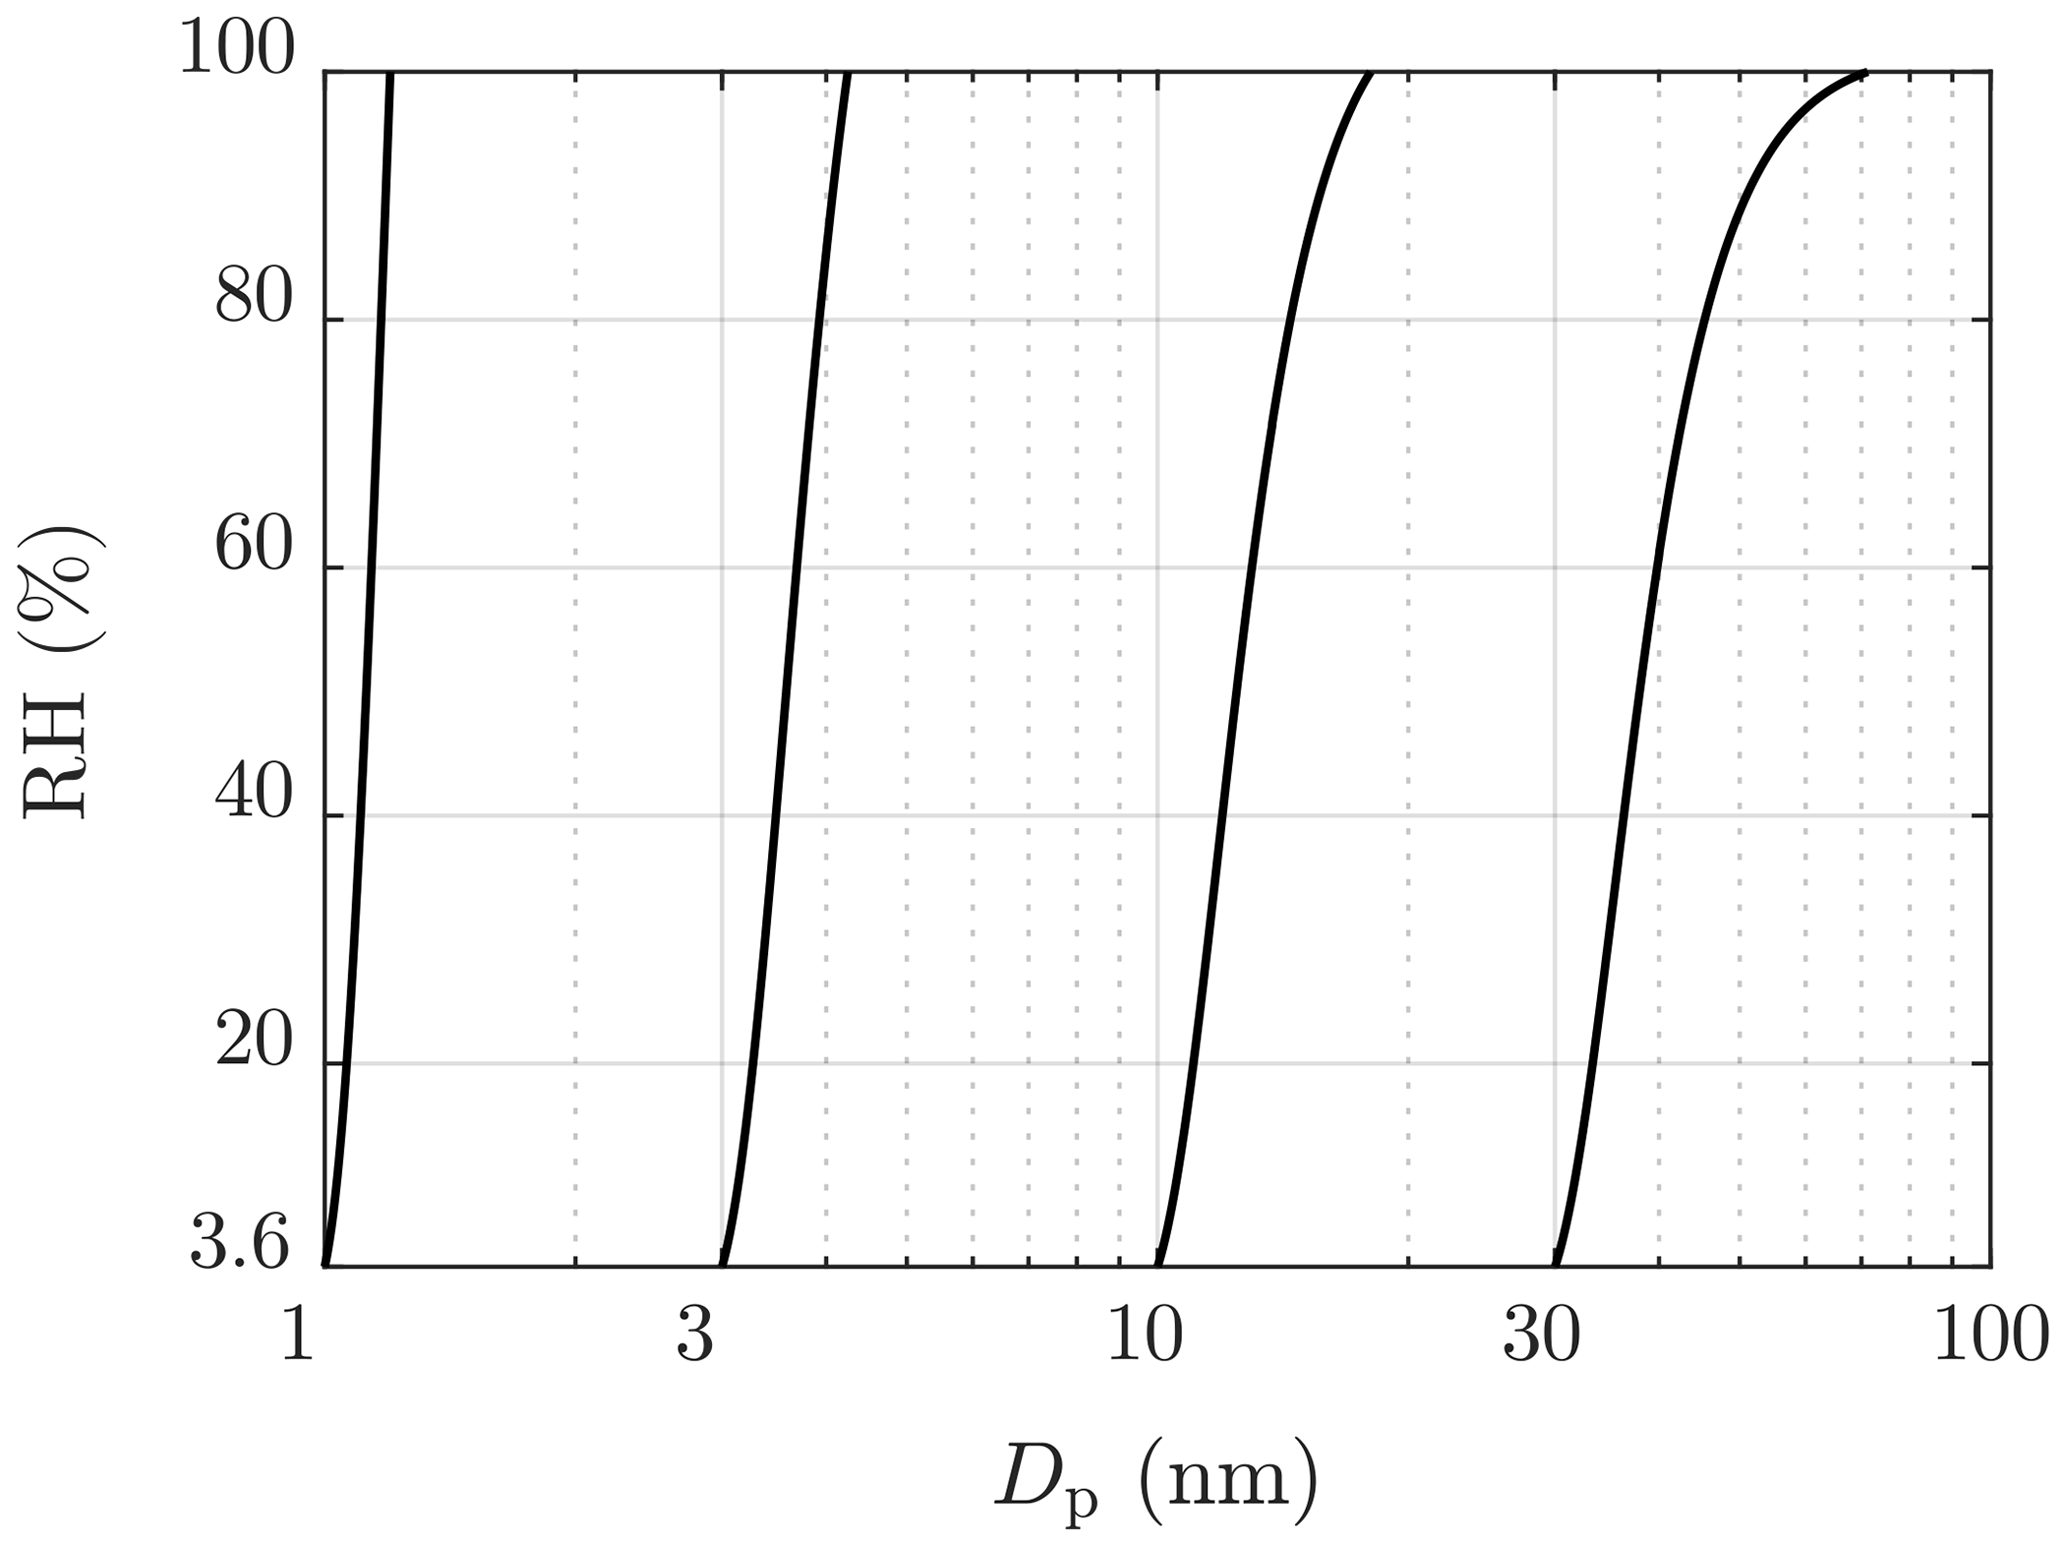
Figure 8Examples of particle diameters in different humidities in the temperature of 23 ∘C. The lowest RH value represents the RH of the dilution air of the ejector diluter.
4.4 Penetration and detection efficiency model
The particle size distributions outputted by the CFD-TUTMAM and corrected with the dry particle model were also corrected according to the penetration and detection efficiency model. Particle penetration in the sampling lines between the ejector diluter and the measurement devices was calculated with the equations of Gormley and Kennedy (1948). All the internal diameters of the used sampling lines were large enough to keep the flows laminar to minimize the diffusional losses. The penetration-corrected size distributions were multiplied by the detection efficiency curves presented in Fig. 2 to simulate the measured number concentrations by the PSM and the CPC 3775 and the measured size distribution by the Nano-SMPS.
4.5 Inverse modeling
The simulated number concentrations measurable by the PSM with different saturator flow rates and by the CPC 3775 and the simulated size distributions measurable by the Nano-SMPS were compared with the measured ones during inverse modeling. The exponents nsa, nw, and msa were altered until the simulated and the measured variables corresponded satisfactorily in all simulated cases. The proportionality coefficient k in Eq. (2) is unknown and depends on the exponents. Because the value of k affects the nucleation rate magnitude directly, it was obtained by fitting until the simulated and the measured number concentrations corresponded.
Due to the uncertainties involved in the measurement of [H2SO4]raw (see the Supplement), the boundary conditions for [H2SO4] in the CFD-TUTMAM simulations could not be set initially. Hence, [H2SO4]raw was also considered to be a fitting parameter. It was estimated by comparing the aerosol mass concentrations because it has a direct effect on the particle sizes but also affects J. Inverse modeling of the vapor concentrations is possible due to the condensational growth of particles. In conclusion, the inverse modeling requires fitting all the five parameters (nsa, nw, msa, k, and [H2SO4]raw) to obtain the function for J. The first four parameters were fitted in a way in which they have the same value for every simulation case, but the last parameter, [H2SO4]raw, was fitted in every simulation case separately. In the simulations related to the measurement sets 2–4, Tsa was not altered between the measurement points; therefore, the value of [H2SO4]raw in the simulations was constant. Because only one parameter was fitted separately, only one of the outputs, the aerosol number or mass concentration, could correspond with the measured value exactly. In this study, the number concentration was chosen as the main output, where the correspondence of the number concentration is preferred over the correspondence of the mass concentration because the nucleation process is connected more directly to the number concentration.
The uncertainties involved in modeling turbulence and the condensation of the vapors onto the walls affect the number and mass concentrations in the measurement devices. Nevertheless, these uncertainties become partially insignificant because k and [H2SO4]raw are considered to be fitting parameters, which partially neglect uncertainly modeled losses of particles and vapors.
In this section, the outputs of the simulations performed using the nucleation rate function with the best correspondence between the measured and the simulated data are described firstly. Finally, the used nucleation rate function is presented.
5.1 Sulfuric acid concentrations
Figure 9 represents the comparison of the inversely modeled [H2SO4]raw with the theoretical concentrations. The simulated concentrations vary between 0.05 and 0.57 times the theoretical concentrations, where the lowest values are observed with lower Tsa values, probably due to the effect of increasingly saturating H2SO4 liquid onto the sampling lines with higher temperatures that can decrease the diffusional losses onto the sampling lines. All values lie between the theoretical level assuming full diffusional losses and the lossless theoretical level. A weak agreement of the simulated concentrations with 0.15 times the theoretical curve can be seen, which implies the diffusional losses of 85 % onto the sampling lines between the H2SO4 evaporator and the PTD. Results and involved challenges of the additional [H2SO4]raw measurements are presented in the Supplement.

Figure 9Simulated sulfuric acid concentrations in the raw sample compared to the theoretical concentrations with different sulfuric acid evaporator temperatures. The concentrations are presented as the concentrations in NTP (normal temperature and pressure) conditions rather than in a hot raw sample.
5.2 Particle size distributions
Examples of measured and simulated particle concentrations and size distributions of measurement set 1 are presented in Fig. 10. Figure 10a and c represent the concentrations measured or measurable with the PSM and the CPC 3775. Because the concentrations decrease with an increasing cut diameter in the case with C (Fig. 10a), particle size distribution exists within this diameter range, which is also seen in the simulated data. However, the concentration measured with the cut diameter of 3.1 nm is twofold compared to the simulated one, implying that the real distribution is not a pure PL+LN distribution or that the shape of the distribution is modeled incorrectly near the diameter of 3.1 nm. Conversely, in the case with C (Fig. 10c), the concentrations are in the same level, which implies no size distribution within that diameter range.
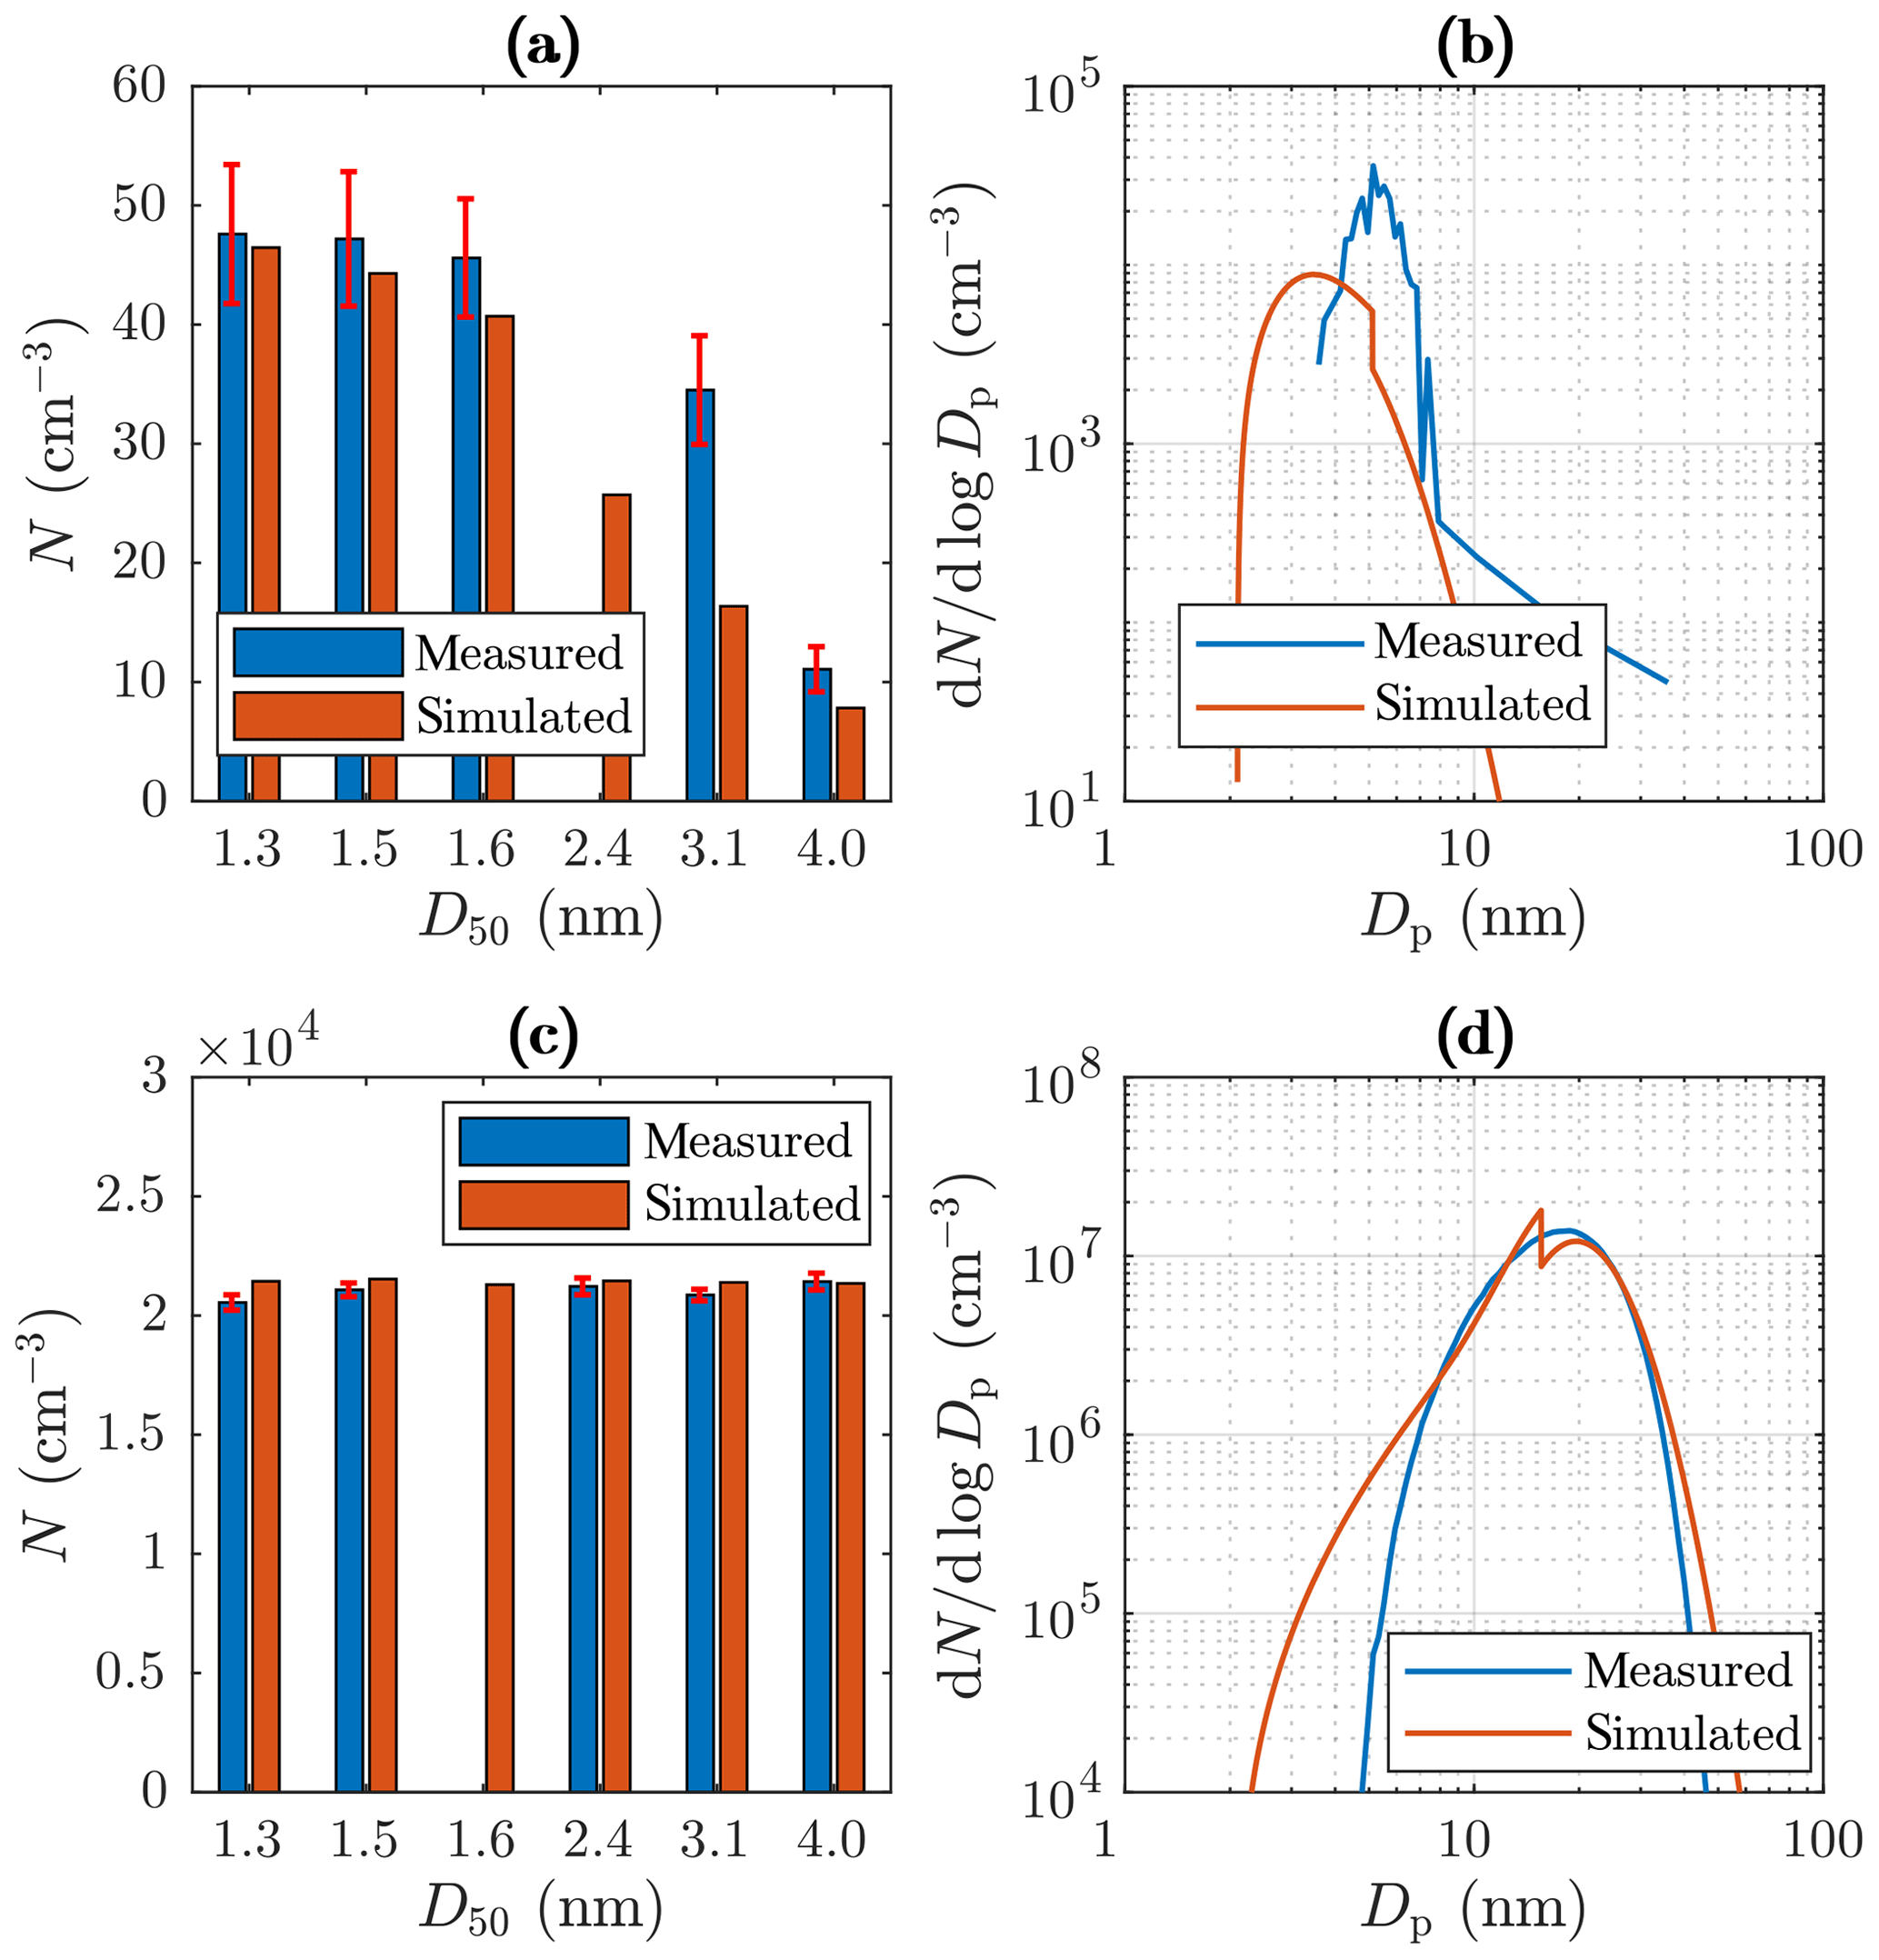
Figure 10Examples of measured and simulated (a) number concentrations from the PSM and the CPC 3775 with C, (b) size distributions from the Nano-SMPS with Tsa=102 ∘C, (c) number concentrations from the PSM and the CPC 3775 with Tsa=157.2 ∘C, and (d) size distributions from the Nano-SMPS with Tsa=157.2 ∘C. The D50 values in the range of 1.3–3.1 nm represent the cut sizes of the PSM with different saturator flow rates, and the D50 value of 4.0 nm represents the cut size of the CPC 3775. The error bars in the measured concentrations represent the standard uncertainties caused by instability in the particle generation.
Figure 10b and d represent examples of measured and simulated Nano-SMPS data. The case with Tsa=102 ∘C (Fig. 10b) represents an example of one of the worst agreements of measured and simulated size distributions. While the simulated total number concentration agrees with the measured one in that case, the particle diameter is underestimated with the factor of ∼1.6. The disagreement is discussed later in this section. Conversely, in the case with Tsa=157.2 ∘C (Fig. 10d), the distributions agree well, except that the model predicts higher particle concentration in the diameter range of 2.5–7 nm. This disagreement can be due to lower particle detection efficiency of the Nano-SMPS than that included in the inversion algorithm of the device (see the Supplement). This is not included in the penetration and detection efficiency model and is thus not seen in the simulated distributions. Because the detection efficiency curve of the CPC 3776 is included in the model, the simulated size distributions measurable with the Nano-SMPS decrease steeply with a decreasing particle diameter near the particle diameter of D50=3.4 nm. The sharp peak at the diameter of ∼ 20 nm in the simulated distribution in Fig. 10d is caused by the nature of the PL+LN model where the PL distribution ends at the diameter of D2≈20 nm. While Fig. 10 represents the data at the measurement devices, Fig. 11 represents the example distributions after the ejector diluter. From the latter figure, the PL distribution is seen as a whole, starting from the diameter of D1=1.15 nm.
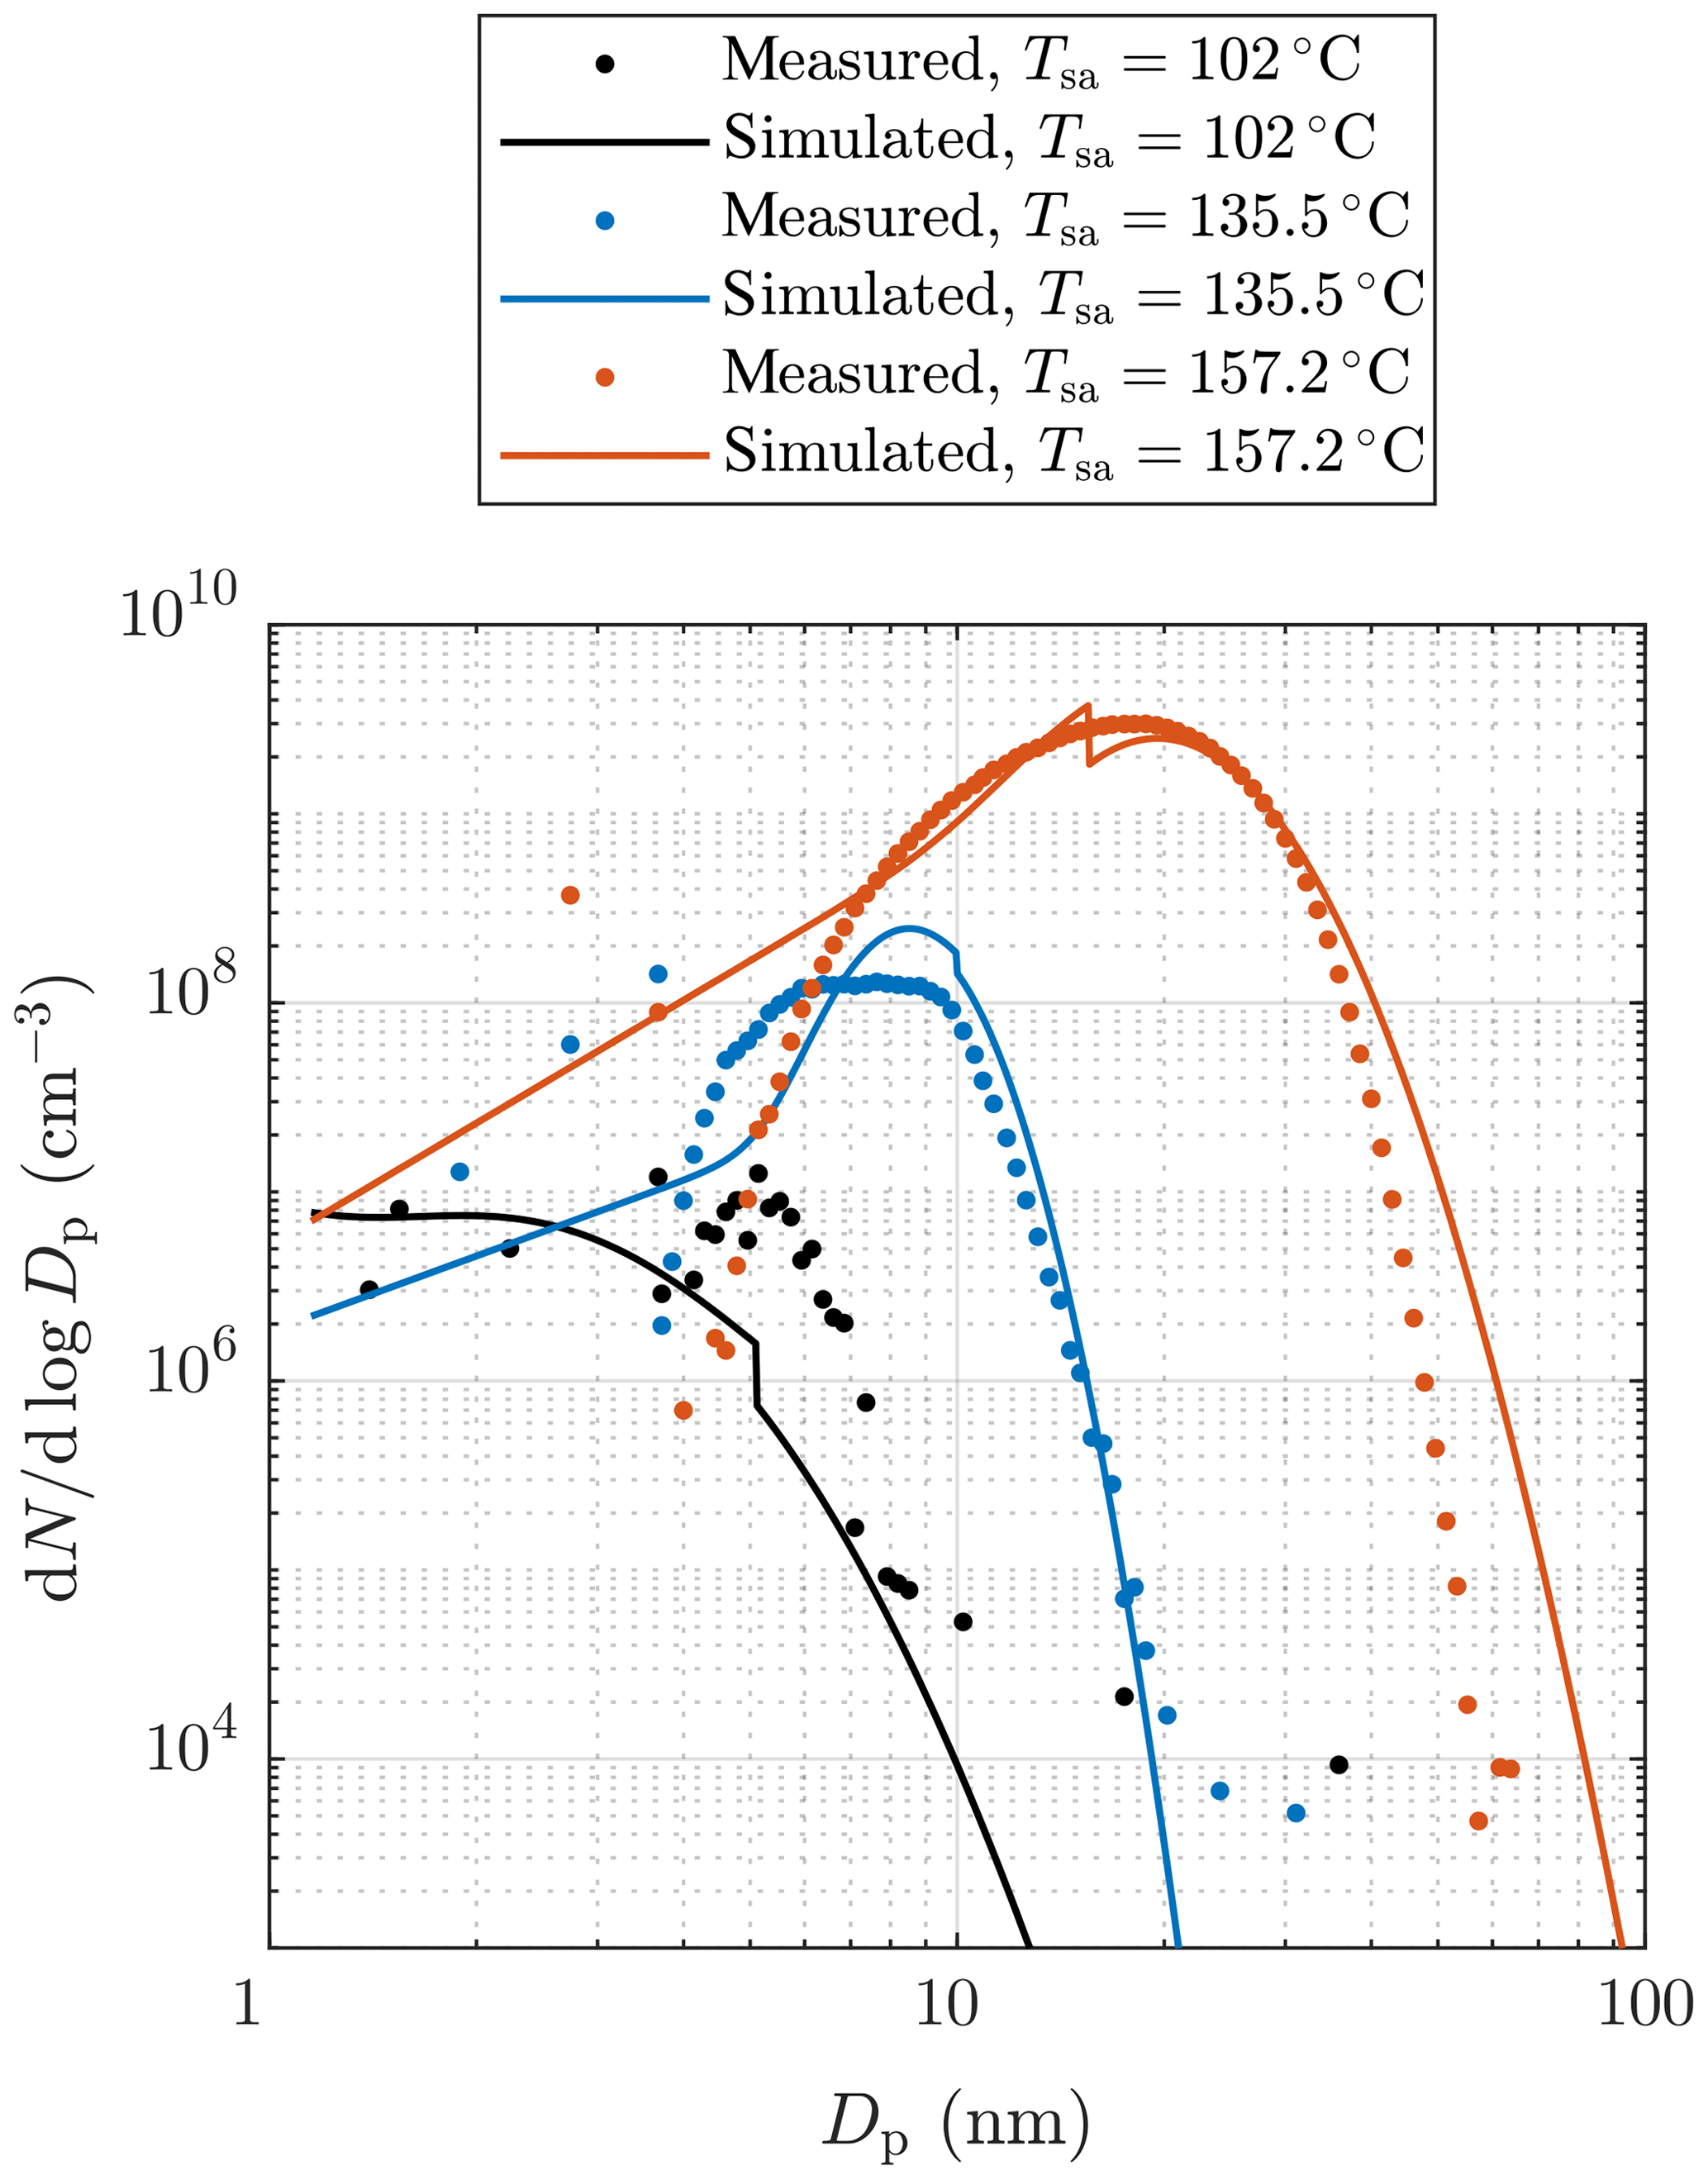
Figure 11Examples of measured and simulated particle size distributions after the ejector diluter. The measured data are corrected with the dilution ratio of the bridge diluter and with the diffusional losses in the sampling lines after the ejector diluter. Additionally, all concentrations are multiplied by the total dilution ratio of the diluting sampling system. See the Supplement for error bars.
The requirement of the PL+LN model can be observed from Fig. 12, in which the particle number concentrations and sizes of a single simulation case with different values of [H2SO4]raw are presented. With low values of [H2SO4]raw, both N and behave discontinuously if only the LN distribution is simulated: particles are first small and in a low concentration when [H2SO4]raw increases and then suddenly rise to higher levels. This is, however, not seen with the PL+LN model, which has smoother behavior. Therefore, by simulating with the LN distribution only, it is impossible to produce, for example, a size distribution with or with this simulation setup, whereas with the PL+LN model, it is possible.
5.3 Particle concentrations and sizes
Figure 13 represents the comparison of the simulated and the measured NPSM and values after the ejector diluter. The black dots in Fig. 13a correspond well with the measured concentrations because they represent the cases for which NPSM was obtained by fitting the value of [H2SO4]raw. The red dots deviate more from the 1:1 line because they represent all the other cases, the NPSM values of which originate from the simulations, for example, those simulated with different RHPTD, TPTD, or residence times. Nevertheless, all the simulated NPSM values correspond with the measured values relatively well. The optimal scenario would be that all the NPSM values would correspond exactly with the measured values, but that would imply that the exponents nw and msa in the nucleation rate function can be modeled exactly with constant values within the concentration and temperature ranges of this study. However, it is not expected that the constant exponents would represent the nucleation rate function in all concentration and temperature ranges exactly.
The black dots in Fig. 13b correspond moderately with the measured values. It can be observed that the points do not lie on a straight 1:1 line perfectly; instead they form a slightly curved line on which simulated particle sizes are overestimated near 10 nm but underestimated in small particle sizes. There are several issues which can cause this discrepancy: (1) the exponent nsa varies with [H2SO4], (2) there is a problem in calculating from the measurement data, (3) there is a problem in estimating a proper NPL∕N ratio in the PL+LN model, and (4) there is uncertainty in simulating the condensation process. The most possible explanation is the first because according to the CNT, nsa decreases with increasing [H2SO4]. This can be seen as overestimated particle sizes in mid-ranged particle sizes because smaller particle sizes would require lower [H2SO4]raw, but that would cause underestimated NPSM. To overcome the underestimated NPSM in mid-ranged [H2SO4] values, k should be increased in mid-ranged [H2SO4] values, which indicates decreasing nsa with increasing [H2SO4]. The second point can explain at least the discrepancy of the lower values of because calculating from the measured PSM, CPC 3775, and Nano-SMPS data is not straightforward, especially with the lower values of in which the distributions measured by the Nano-SMPS are cut from the smaller diameter edge due to very low detection efficiency. Therefore, calculated from the measurement data may be overestimated with the lower values of . This is also seen as long error bars towards left, especially for values smaller than 10 nm (see the Supplement for details). However, by comparing the measured and the simulated size distributions with Tsa=102 ∘C in Fig. 11 (measured , simulated ), it can be seen that the larger diameter edges of the distribution do not correspond satisfactorily either, which implies that the first point is the most possible explanation. Conversely, the discrepancy of the higher values of can be partially explained by the third point because simulating those cases with the LN distribution only, even higher values of are outputted. That implies that the PL+LN model underestimates the NPL∕N ratio. The NPL∕N ratio is controlled by the value of γ; the proper functional form of which is still under development in the PL+LN model. The last point can also explain the discrepancies, but the direction of a discrepancy could be in one way or another. The red dots follow mainly the same curve as the black dots, with the exception of four cases in which the values of are clearly overestimated. These cases belong to measurement set 3 and have high TPTD. This discrepancy raises the last point because there are clearly some uncertainties involved in the condensation process modeling when TPTD is high. It can be related, for example, to the activity coefficient function of H2SO4 because too low an activity coefficient would cause too low a vapor pressure of H2SO4 at the surface of a particle, which would cause particles that are too large.
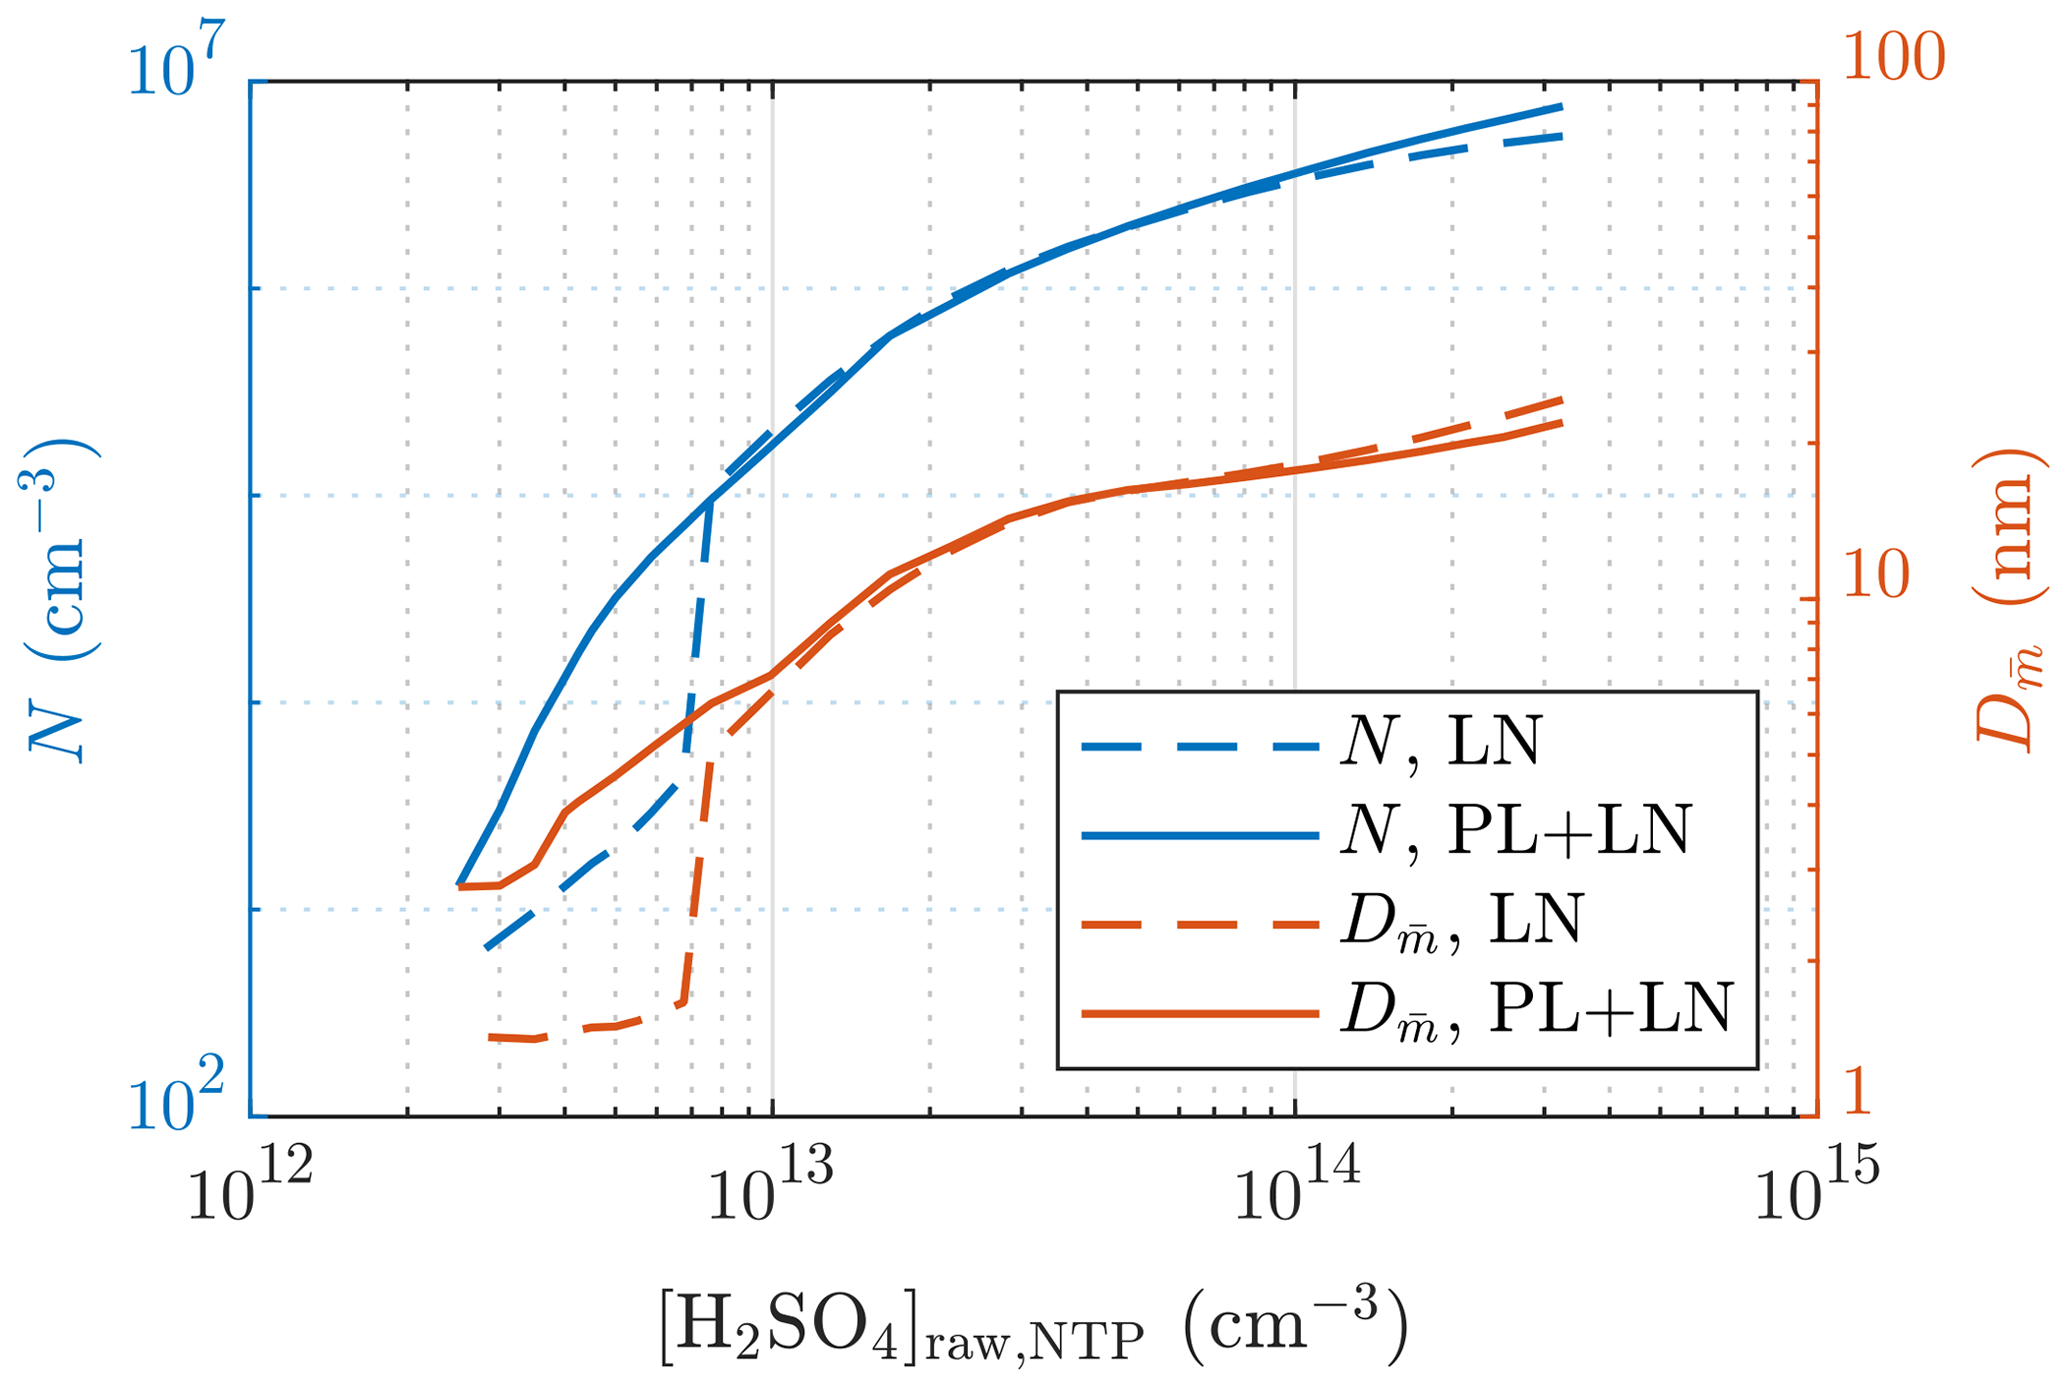
Figure 12Comparison of the particle number concentrations and the diameters with the average mass after the ejector diluter simulated using the LN distribution only and using both the PL and the LN distributions.
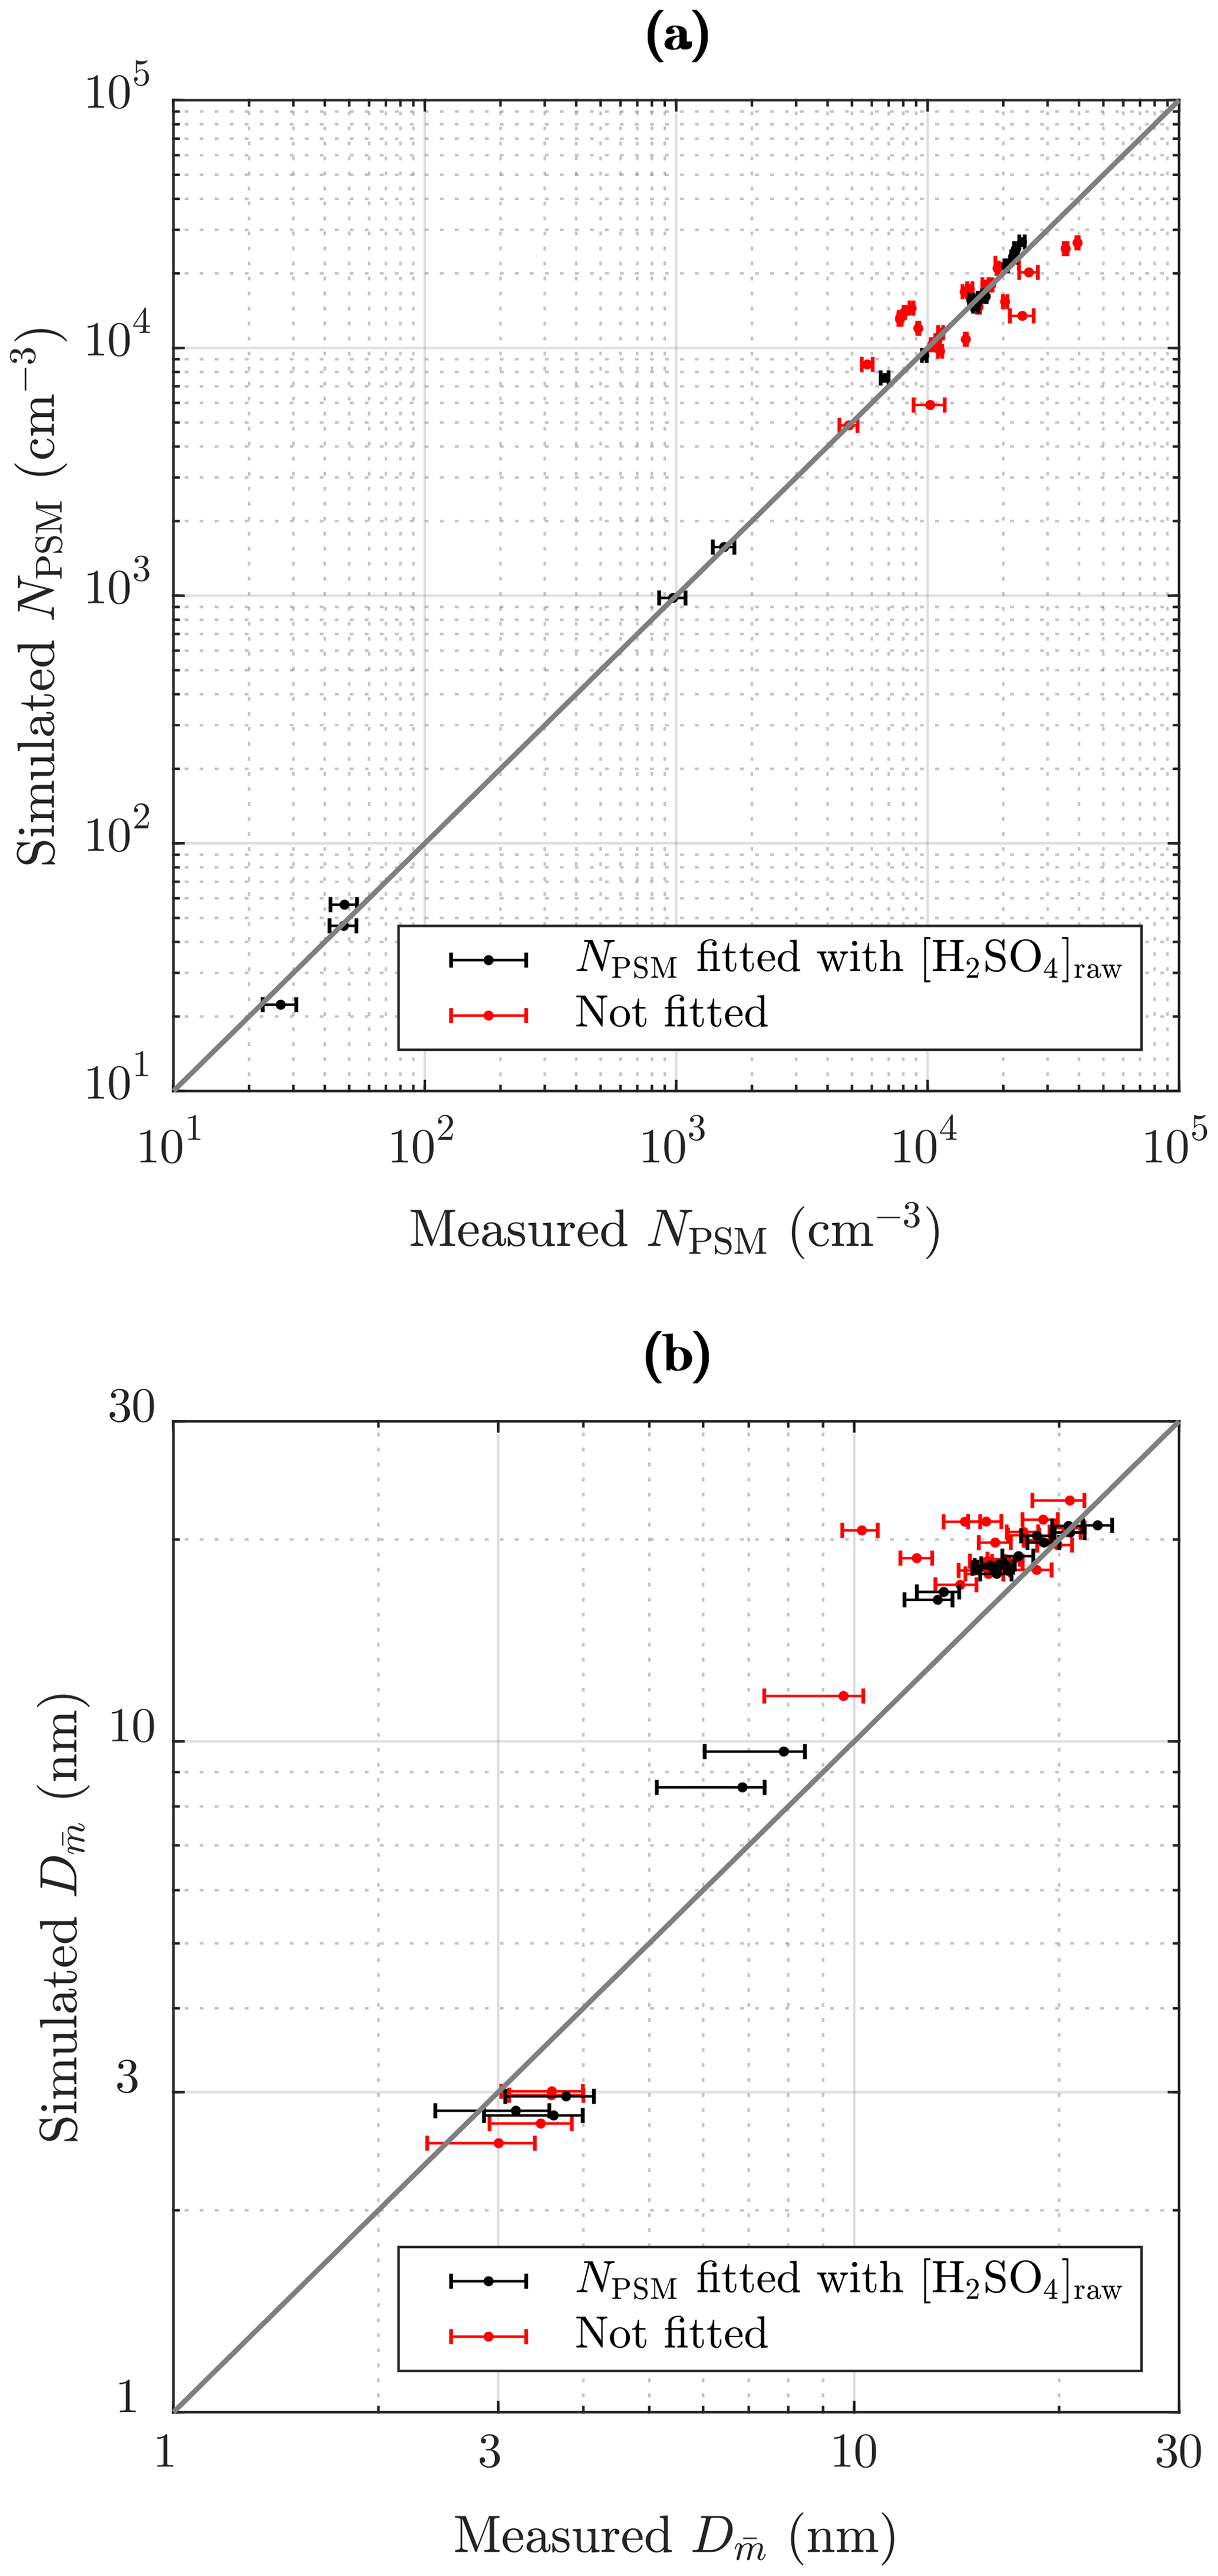
Figure 13Comparison of the simulated and the measured (a) number concentrations of the particles larger than ∼ 1.3 nm and (b) the diameters with the average mass after the ejector diluter. The black dots represent the cases for which NPSM and were obtained by fitting the value of [H2SO4]raw. The red dots represent the cases of the measurement sets 2–4 in which the values of [H2SO4]raw originated from an another case of the measurement set having the same Tsa value. The error bars in (a) represent the standard uncertainties of the measured concentrations, and the error bars in (b) represent the uncertainties associated with both the systematic and random effects in the measurements (see the Supplement).
Table 3 represents the ratios of the simulated N and M with the residence times of 1.4 and 2.8 s. The simulated ratios follow the same behavior as the measured ratios: with a low Tsa value, the ratios are below unity, and with higher Tsa values, the ratio of N increases but the ratio of M stays near unity. The ratios with a low Tsa value correspond with the measured values, but according to the simulations, the ratio of N does not increase with increasing Tsa equally with the measured ratios. This implies that the coagulation rate is underestimated in the model, but the reason for that is unknown. The temperature with which the coagulation process would eliminate the effect of the nucleation process, resulting in the number concentration ratio of unity, is near 148 ∘C (near 142 ∘C according to the measurements).
Table 3The ratios of the simulated number concentrations and mass concentrations after the ejector diluter with the residence times of 1.4 and 2.8 s, in measurement set 4. The values in parentheses denote the measured values as presented in Table 2.
5.4 Nucleation rate function
The nucleation rate function with the best correspondence between the measured and the simulated data having a type of Eq. (2) used in the simulations has the parameters presented in Table 4 and is thus
where the concentrations are given in the inverse of cubic centimeters, the saturation vapor pressure in pascals, and the nucleation rate is outputted in the inverse of cubic centimeters times the inverse of seconds (cm−3 s−1). This function was applied within the environmental parameter ranges presented in Table 5. The ranges can be considered to be the ranges within which Eq. (11) is defined. However, because the major part of the nucleation occurs when [H2SO4] is high (nearer to the upper boundary than to the lower boundary), a wrong formulation of J in the [H2SO4] values lower than 2×1011 cm−3 would have only a minor effect on the model outputs. Therefore, an alternative range with 2×1011 cm−3 as a minimum boundary for [H2SO4] is a more credible range within which the obtained function for J produces reliable results.
Table 4The parameters of the nucleation rate function with the best correspondence between the measured and the simulated data. The ranges of variation represent the resolution with which the exponents were altered during inverse modeling.
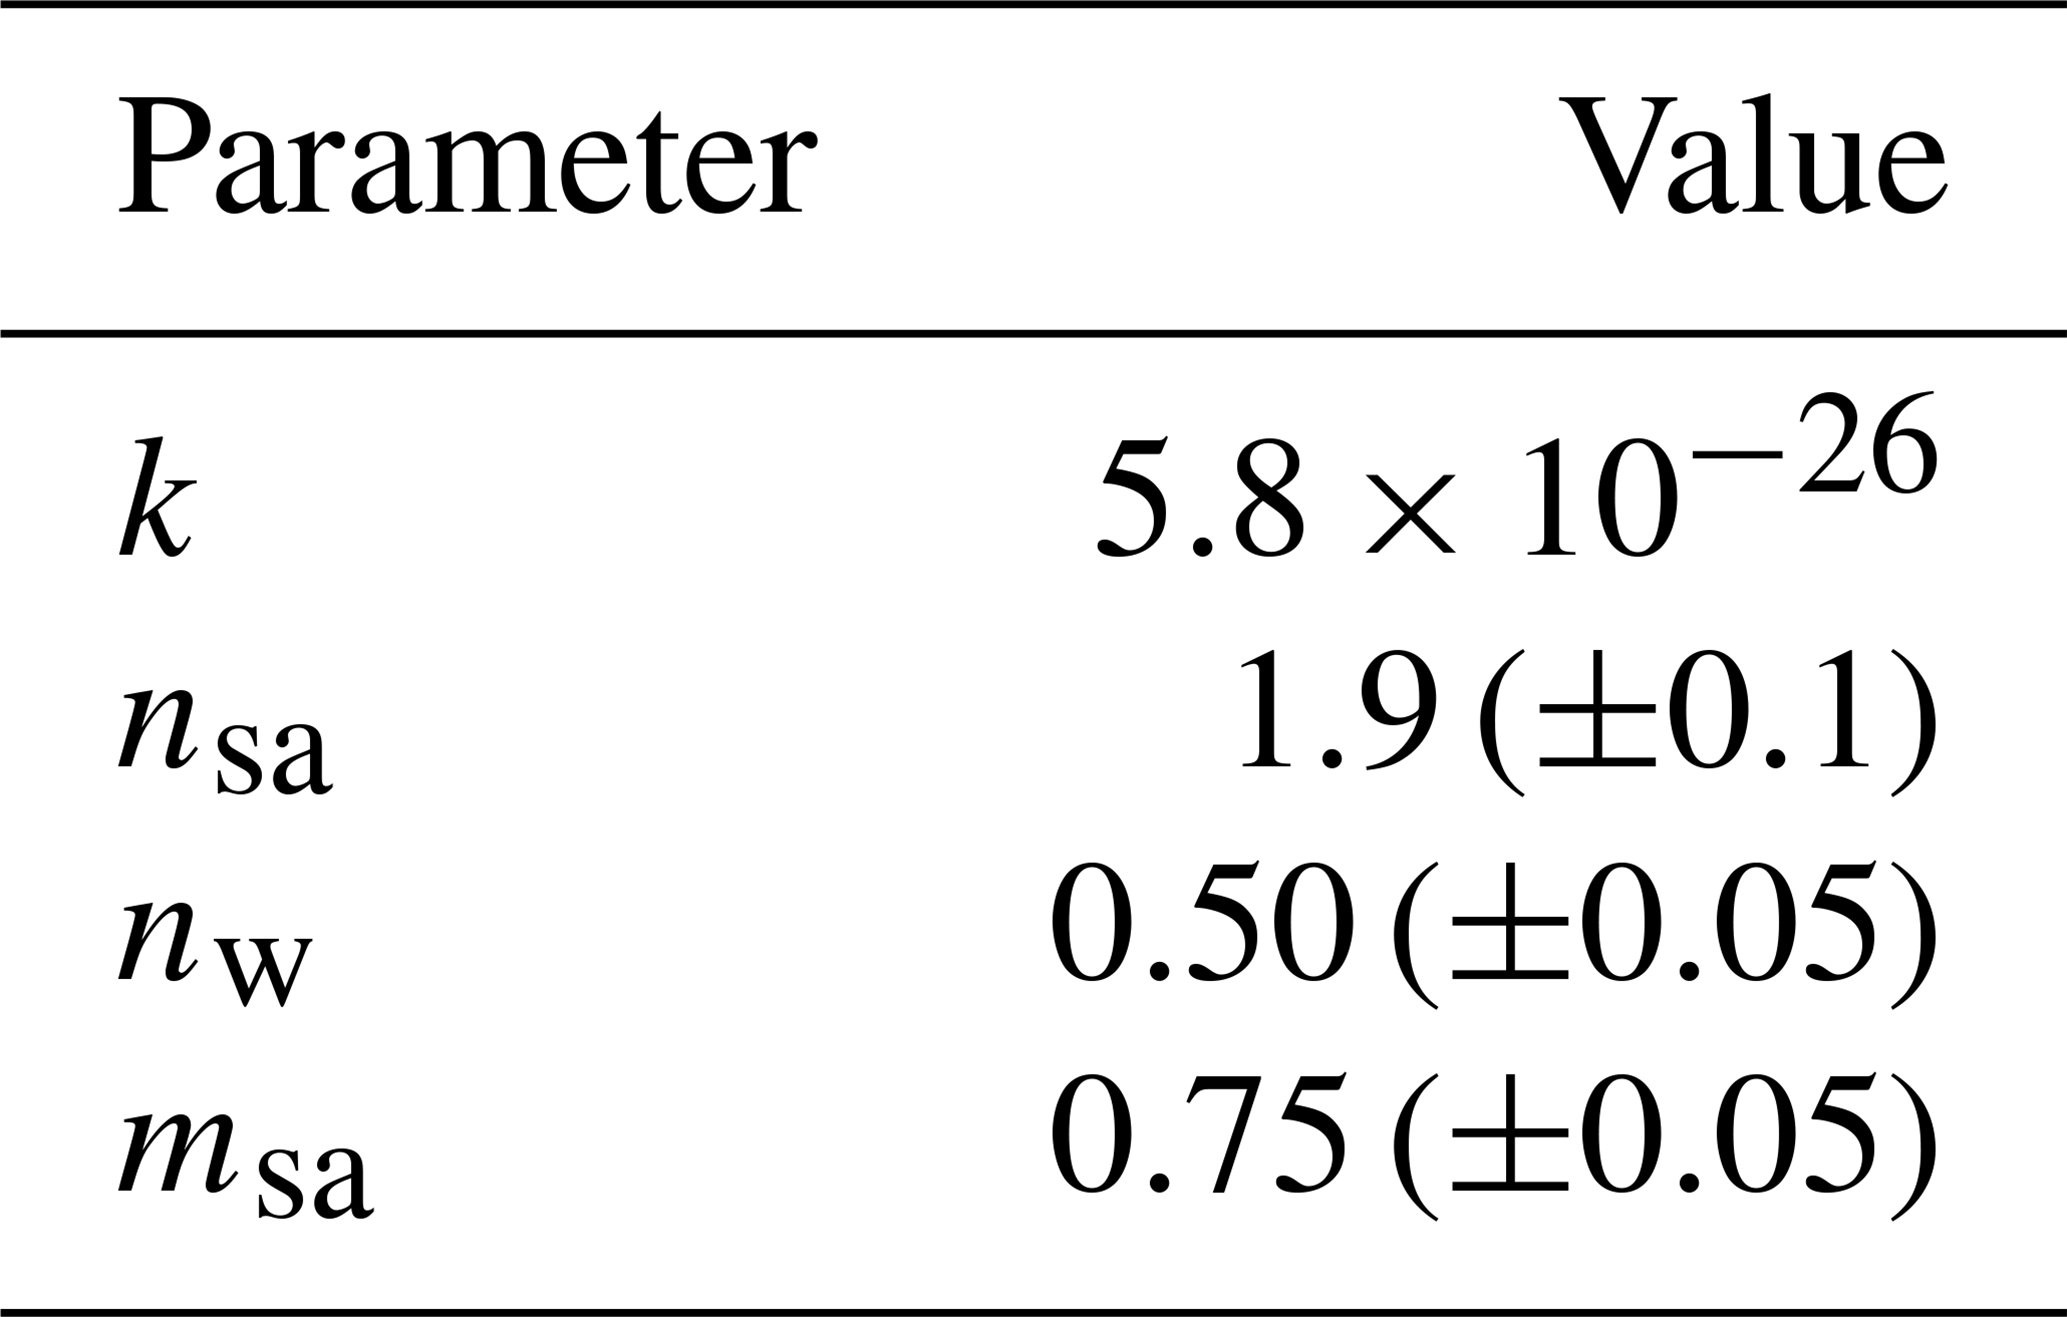
Table 5The environmental parameter ranges within which the nucleation rate function was applied.
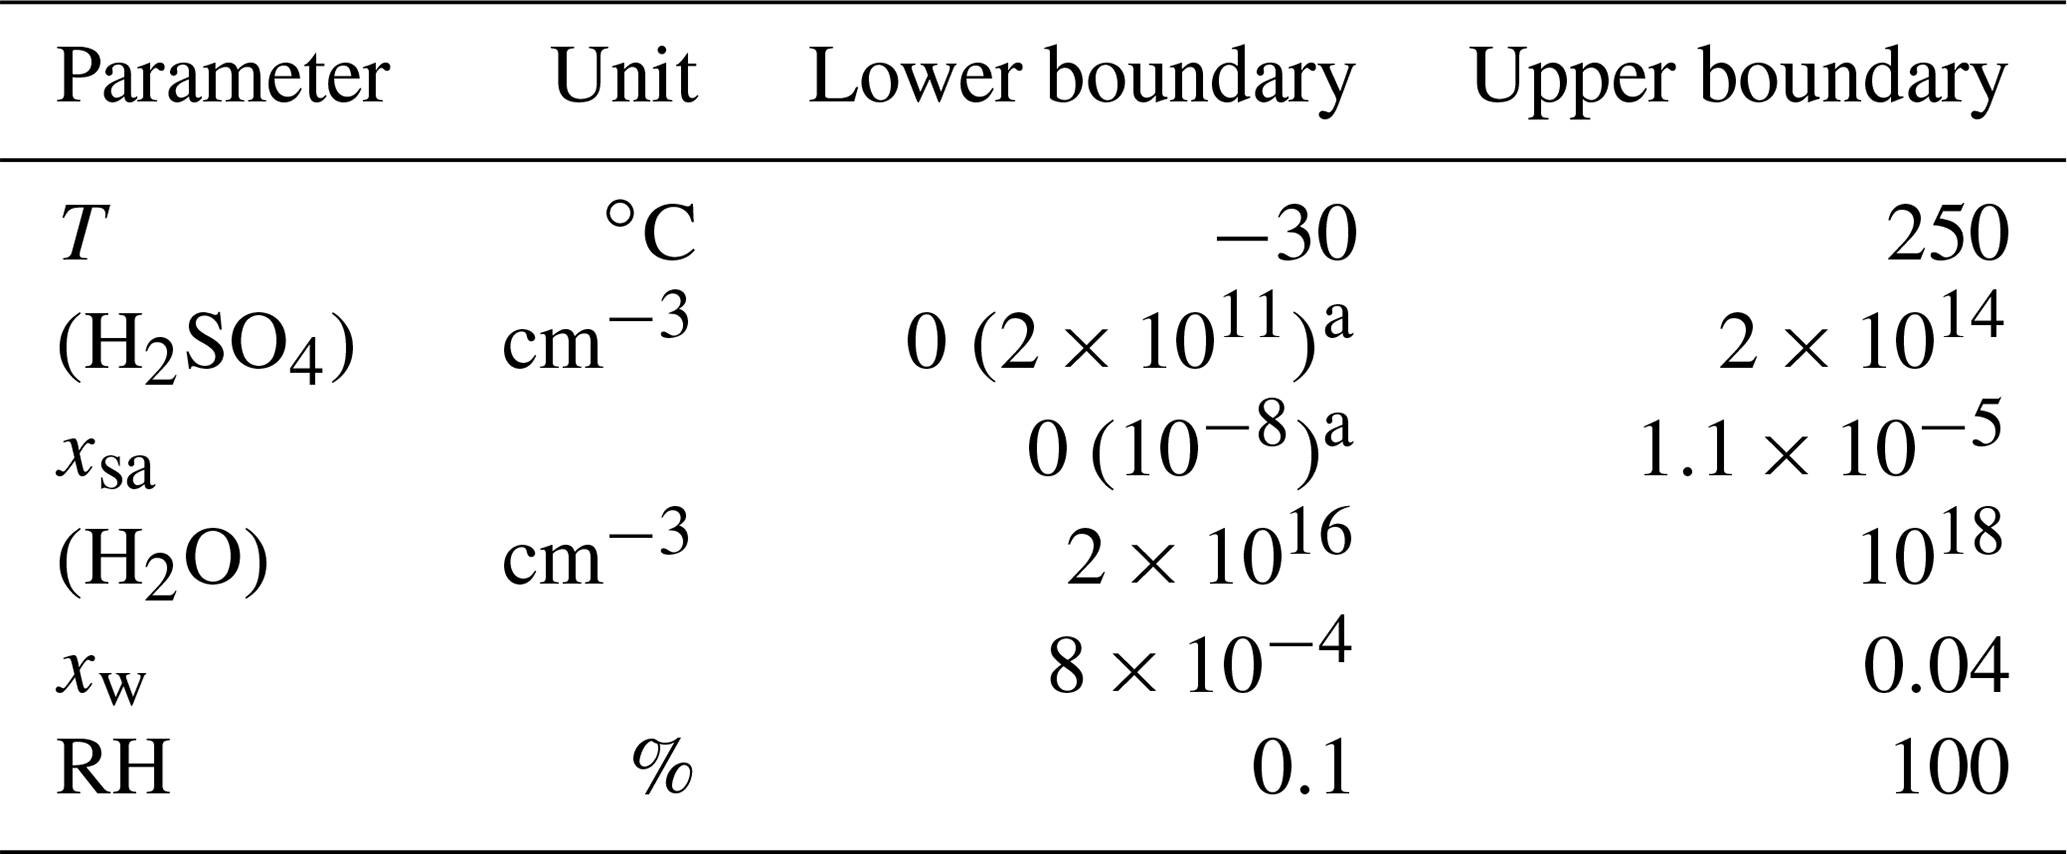
a Alternative range.
Because psa∘(T) has a nearly equal exponential form with the saturation vapor pressure of H2O (pw∘(T)), psa∘(T) can be expressed approximately using pw∘(T), with
Hence, the magnitude of J remains as in Eq. (11) if it is expressed with pw∘(T) using the form
or with both psa∘(T) and pw∘(T) using, for example, the form
or a different form,
The exponent nsa=1.9 is in agreement with the former nucleation studies related to vehicle exhaust (Vouitsis et al., 2005) or to the atmosphere (Sihto et al., 2006; Riipinen et al., 2007; Brus et al., 2011; Riccobono et al., 2014), where nsa lies usually between 1 and 2. The exponent nsa=1.9 corresponds best to the kinetic nucleation theory (McMurry and Friedlander, 1979) where nsa=2. Estimating nsa from the measured particle number concentration provided the slope –10. The exponent nw estimated from the measurement data is –0.2, which is remarkably lower than the inversely modeled exponent nw=0.5. The slope of NPSM versus TPTD of measurement set 3b in Fig. 7 is
but the inversely modeled exponent msa=0.75 corresponds with the slope of −27, which is remarkably more negative than due to the same uncertainties as involved with the slopes and . In conclusion, inverse modeling provides, significantly more accurately, the exponents over the method based on the measurement data only.
The nucleation rate was the highest in the PTD, where the hot sample and the cold dilution air met. The major part of nucleation occurred in the beginning part of the aging chamber. No noticeable nucleation occurred in the ejector diluter, though the temperature reaches −30 ∘C locally, which is in agreement with the former studies. It provides partial validation for the obtained msa value.
Homogeneous H2SO4–H2O nucleation rate measurements using the modified partial flow sampling system mimicking the dilution process occurring in a real-world driving situation were performed. The aerosol formed in the diluting and cooling sampling system was measured using the PSM, the CPC 3775, and the Nano-SMPS. The particle size distribution near the detection limit of the Nano-SMPS showed clear disagreement with the PSM and the CPC3775 data, with major underestimation of the smaller particles and distortion of the size distribution shape due to the limitations involved in detecting small particles with simultaneous nucleation and particle growth using the Nano-SMPS. Thus, the data without the PSM and the CPC 3775 would unrealistically suggest the log-normal shape for the size distributions.
The measurements were simulated with the aerosol dynamics code CFD-TUTMAM using the nucleation rate, which is explicitly defined as a function of temperature and the concentrations of H2SO4 and H2O. Equation (2) was used as the functional form of nucleation rate. The parameters for Eq. (2) which resulted in the best prediction for particle number concentrations and size distributions were nsa=1.9, nw=0.5, and msa=0.75, thus providing the nucleation rate function Eq. (11) (or any of Eqs. 13–15). As discussed in Sect. 5.3, the obtained exponent nsa=1.9 may be slightly overestimated in high concentrations and slightly underestimated in low concentrations. Estimating these exponents using only the measured particle concentrations resulted in markedly higher uncertainties when compared to modeling them inversely using the CFD-TUTMAM code.
The raw sample was generated by evaporating H2SO4 and H2O liquids. The concentration of H2SO4 was controlled by adjusting the temperature of the liquid, Tsa. The boundary condition for H2SO4 concentration, [H2SO4]raw, was handled as a fitting parameter for correspondence between the simulated size distributions and the measured ones. Particle sizes were small with low Tsa, and the size distributions were not in a log-normal form. Therefore, using the PL+LN model to represent the size distributions in the CFD-TUTMAM was necessary.
In these measurements, particle formation was not observed with the H2SO4 concentrations below at exhaust condition temperatures. However, with real vehicle exhaust, in the same sampling system used here, particle formation has been observed even with the concentration of (Arnold et al., 2012). This indicates that the nucleation rate of the binary H2SO4–H2O nucleation mechanism is lower than the nucleation rate in real exhaust. Therefore, the binary H2SO4–H2O nucleation cannot be fully controlling the particle formation process; instead, other compounds, such as hydrocarbons, existing in real exhaust are likely to be involved in the process as well, which is in agreement with the former exhaust-related nucleation studies (Saito et al., 2002; Vaaraslahti et al., 2004; Meyer and Ristovski, 2007; Pirjola et al., 2015; Olin et al., 2015).
The obtained exponent nsa=1.9 is in agreement with the former nucleation studies related to the atmosphere or vehicle exhaust (nsa=1–2) and corresponds best with the kinetic nucleation theory. However, the effects of [H2O] and T obtained here may differ from the former studies because the effects are not extensively studied in them. The functional form, and especially the values of the nucleation exponents for the homogeneous H2SO4–H2O nucleation rate obtained in this study, helps in finding the currently unknown nucleation mechanism occurring in real vehicle or power plant boiler exhaust or in the atmosphere. It also provides the starting point for inverse modeling studies used to examine the hydrocarbon-involved H2SO4–H2O nucleation mechanism, which is likely occurring in real vehicle exhaust. It can also be used to improve air quality models by using it to model the effect of H2SO4-emitting traffic and power generation on the particle concentration in urban air.
Data are available upon request from the corresponding author (miska.olin@tuni.fi).
The supplement related to this article is available online at: https://doi.org/10.5194/acp-19-6367-2019-supplement.
MO, JA, TR, and MDM designed the experiments, and MO and JA carried them out. MO analyzed the measurement data, developed the model code, and performed the simulations. MRTP designed the IC analysis. MO prepared the paper, with contributions from all co-authors.
The authors declare that they have no conflict of interest.
The authors thank CSC and TCSC for the computational time. We also thank Prof. Mikko Sipilä from the University of Helsinki for lending the chemical ionization inlet for the atmospheric pressure interface time-of-flight mass spectrometer, the tofTools team for providing tools for mass spectrometry analysis, and M. Sc. Kalle Koivuniemi for ion chromatography measurements.
This research has been supported by the graduate school of Tampere University of Technology and the Maj and Tor Nessling Foundation (grant no. 2014452).
This paper was edited by Neil M. Donahue and reviewed by two anonymous referees.
Alanen, J., Saukko, E., Lehtoranta, K., Murtonen, T., Timonen, H., Hillamo, R., Karjalainen, P., Kuuluvainen, H., Harra, J., Keskinen, J., and Rönkkö, T.: The formation and physical properties of the particle emissions from a natural gas engine, Fuel, 162, 155–161, https://doi.org/10.1016/j.fuel.2015.09.003, 2015. a
Albriet, B., Sartelet, K., Lacour, S., Carissimo, B., and Seigneur, C.: Modelling aerosol number distributions from a vehicle exhaust with an aerosol CFD model, Atmos. Environ., 44, 1126–1137, https://doi.org/10.1016/j.atmosenv.2009.11.025, 2010. a
Alföldy, B., Giechaskiel, B., Hofmann, W., and Drossinos, Y.: Size-distribution dependent lung deposition of diesel exhaust particles, J. Aerosol Sci., 40, 652–663, https://doi.org/10.1016/j.jaerosci.2009.04.009, 2009. a
Arneth, A., Unger, N., Kulmala, M., and Andreae, M.: Clean the air, heat the planet?, Science, 326, 672–673, https://doi.org/10.1126/science.1181568, 2009. a
Arnold, F., Pirjola, L., Rönkkö, T., Reichl, U., Schlager, H., Lähde, T., Heikkilä, J., and Keskinen, J.: First online measurements of sulfuric acid gas in modern heavy-duty diesel engine exhaust: Implications for nanoparticle formation, Environ. Sci. Technol., 46, 11227–11234, https://doi.org/10.1021/es302432s, 2012. a, b, c, d, e
Beelen, R., Raaschou-Nielsen, O., Stafoggia, M., Andersen, Z., Weinmayr, G., Hoffmann, B., Wolf, K., Samoli, E., Fischer, P., Nieuwenhuijsen, M., Vineis, P., Xun, W., Katsouyanni, K., Dimakopoulou, K., Oudin, A., Forsberg, B., Modig, L., Havulinna, A., Lanki, T., Turunen, A., Oftedal, B., Nystad, W., Nafstad, P., De Faire, U., Pedersen, N., Östenson, C.-G., Fratiglioni, L., Penell, J., Korek, M., Pershagen, G., Eriksen, K., Overvad, K., Ellermann, T., Eeftens, M., Peeters, P., Meliefste, K., Wang, M., Bueno-De-Mesquita, B., Sugiri, D., Krämer, U., Heinrich, J., De Hoogh, K., Key, T., Peters, A., Hampel, R., Concin, H., Nagel, G., Ineichen, A., Schaffner, E., Probst-Hensch, N., Künzli, N., Schindler, C., Schikowski, T., Adam, M., Phuleria, H., Vilier, A., Clavel-Chapelon, F., Declercq, C., Grioni, S., Krogh, V., Tsai, M.-Y., Ricceri, F., Sacerdote, C., Galassi, C., Migliore, E., Ranzi, A., Cesaroni, G., Badaloni, C., Forastiere, F., Tamayo, I., Amiano, P., Dorronsoro, M., Katsoulis, M., Trichopoulou, A., Brunekreef, B., and Hoek, G.: Effects of long-term exposure to air pollution on natural-cause mortality: An analysis of 22 European cohorts within the multicentre ESCAPE project, Lancet, 383, 785–795, https://doi.org/10.1016/S0140-6736(13)62158-3, 2014. a
Boucher, O., Randall, D., Artaxo, P., Bretherton, C., Feingold, G., Forster, P., Kerminen, V.-M., Kondo, Y., Liao, H., Lohmann, U., Rasch, P., Satheesh, S., Sherwood, S., Stevens, B., and Zhang, X.: Clouds and Aerosols, book section 7, Cambridge University Press, Cambridge, United Kingdom and New York, NY, USA, 571–658, https://doi.org/10.1017/CBO9781107415324.016, 2013. a
Boulaud, D., Madelaine, G., Vigla, D., and Bricard, J.: Experimental study on the nucleation of water vapor sulfuric acid binary system, J. Chem. Phys., 66, 4854–4860, https://doi.org/10.1063/1.433823, 1977. a
Brus, D., Neitola, K., Hyvärinen, A.-P., Petäjä, T., Vanhanen, J., Sipilä, M., Paasonen, P., Kulmala, M., and Lihavainen, H.: Homogenous nucleation of sulfuric acid and water at close to atmospherically relevant conditions, Atmos. Chem. Phys., 11, 5277–5287, https://doi.org/10.5194/acp-11-5277-2011, 2011. a, b
Chen, L., Liang, Z., Zhang, X., and Shuai, S.: Characterizing particulate matter emissions from GDI and PFI vehicles under transient and cold start conditions, Fuel, 189, 131–140, https://doi.org/10.1016/j.fuel.2016.10.055, 2017. a
Dockery, D., Pope III, C., Xu, X., Spengler, J., Ware, J., Fay, M., Ferris Jr., B., and Speizer, F.: An association between air pollution and mortality in six U.S. cities, New Engl. J. Med., 329, 1753–1759, https://doi.org/10.1056/NEJM199312093292401, 1993. a
Giechaskiel, B., Ntziachristos, L., and Samaras, Z.: Effect of ejector dilutors on measurements of automotive exhaust gas aerosol size distributions, Meas. Sci. Technol., 20, 045703, https://doi.org/10.1088/0957-0233/20/4/045703, 2009. a
Gormley, P. G. and Kennedy, M.: Diffusion from a Stream Flowing through a Cylindrical Tube, P. Roy. Irish Acad. A, 52, 163–169, https://doi.org/10.2307/20488498, 1948. a, b, c
Hale, B. N.: Temperature dependence of homogeneous nucleation rates for water: Near equivalence of the empirical fit of Wölk and Strey, and the scaled nucleation model, J. Chem. Phys., 122, 204509, https://doi.org/10.1063/1.1906213, 2005. a
Hanson, D. R. and Eisele, F.: Diffusion of H2SO4 in Humidified Nitrogen: Hydrated H2SO4, J. Phys. Chem. A, 104, 1715–1719, https://doi.org/10.1021/jp993622j, 2000. a
Huang, L., Gong, S. L., Gordon, M., Liggio, J., Staebler, R. M., Stroud, C. A., Lu, G., Mihele, C., Brook, J. R., and Jia, C. Q.: Aerosol-computational fluid dynamics modeling of ultrafine and black carbon particle emission, dilution, and growth near roadways, Atmos. Chem. Phys., 14, 12631–12648, https://doi.org/10.5194/acp-14-12631-2014, 2014. a
Hung, C., Krasnopoler, M. J., and Katz, J. L.: Condensation of a supersaturated vapor. VIII. The homogeneous nucleation of n-nonane, J. Chem. Phys., 90, 1856–1865, https://doi.org/10.1063/1.456027, 1989. a
Jacobson, M. Z., Kittelson, D. B., and Watts, W. F.: Enhanced Coagulation Due to Evaporation and Its Effect on Nanoparticle Evolution, Environ. Sci. Technol., 39, 9486–9492, https://doi.org/10.1021/es0500299, 2005. a
Johansson, C., Norman, M., and Gidhagen, L.: Spatial & temporal variations of PM10 and particle number concentrations in urban air, Environ. Monit. Assess., 127, 477–487, https://doi.org/10.1007/s10661-006-9296-4, 2007. a
Jokinen, T., Sipilä, M., Junninen, H., Ehn, M., Lönn, G., Hakala, J., Petäjä, T., Mauldin III, R. L., Kulmala, M., and Worsnop, D. R.: Atmospheric sulphuric acid and neutral cluster measurements using CI-APi-TOF, Atmos. Chem. Phys., 12, 4117–4125, https://doi.org/10.5194/acp-12-4117-2012, 2012. a
Karjalainen, P., Rönkkö, T., Pirjola, L., Heikkilä, J., Happonen, M., Arnold, F., Rothe, D., Bielaczyc, P., and Keskinen, J.: Sulfur driven nucleation mode formation in diesel exhaust under transient driving conditions, Environ. Sci. Technol., 48, 2336–2343, https://doi.org/10.1021/es405009g, 2014. a
Kashchiev, D.: On the relation between nucleation work, nucleus size, and nucleation rate, J. Chem. Phys., 76, 5098–5102, https://doi.org/10.1063/1.442808, 1982. a
Keskinen, J. and Rönkkö, T.: Can real-world diesel exhaust particle size distribution be reproduced in the laboratory? A critical review, J. Air Waste Manage., 60, 1245–1255, https://doi.org/10.3155/1047-3289.60.10.1245, 2010. a, b
Kirkby, J., Curtius, J., Almeida, J. a., Dunne, E., Duplissy, J., Ehrhart, S., Franchin, A., Gagné, S., Ickes, L., Kürten, A., Kupc, A., Metzger, A., Riccobono, F., Rondo, L., Schobesberger, S., Tsagkogeorgas, G., Wimmer, D., Amorim, A., Bianchi, F., Breitenlechner, M., David, A., Dommen, J., Downard, A., Ehn, M., Flagan, R. C., Haider, S., Hansel, A., Hauser, D., Jud, W., Junninen, H., Kreissl, F., Kvashin, A., Laaksonen, A., Lehtipalo, K., Lima, J., Lovejoy, E. R., Makhmutov, V., Mathot, S., Mikkilä, J., Minginette, P., Mogo, S., Nieminen, T., Onnela, A., Pereira, P., Petäjä, T., Schnitzhofer, R., Seinfeld, J. H., Sipilä, M., Stozhkov, Y., Stratmann, F., Tomé, A., Vanhanen, J., Viisanen, Y., Vrtala, A., Wagner, P. E., Walther, H., Weingartner, E., Wex, H., Winkler, P. M., Carslaw, K. S., Worsnop, D. R., Baltensperger, U., and Kulmala, M.: Role of sulphuric acid, ammonia and galactic cosmic rays in atmospheric aerosol nucleation, Nature, 476, 429–433, https://doi.org/10.1038/nature10343, 2011. a, b
Kittelson, D.: Engines and nanoparticles: A review, J. Aerosol Sci., 29, 575–588, https://doi.org/10.1016/S0021-8502(97)10037-4, 1998. a, b
Kittelson, D., Watts, W., Johnson, J., Thorne, C., Higham, C., Payne, M., Goodier, S., Warrens, C., Preston, H., Zink, U., Pickles, D., Goersmann, C., Twigg, M., Walker, A., and Boddy, R.: Effect of fuel and lube oil sulfur on the performance of a diesel exhaust gas continuously regenerating trap, Environ. Sci. Technol., 42, 9276–9282, https://doi.org/10.1021/es703270j, 2008. a, b, c
Kulmala, M., Lehtinen, K., and Laaksonen, A.: Cluster activation theory as an explanation of the linear dependence between formation rate of 3 nm particles and sulphuric acid concentration, Atmos. Chem. Phys., 6, 787–793, https://doi.org/10.5194/acp-6-787-2006, 2006. a
Kulmala, M., Kontkanen, J., Junninen, H., Lehtipalo, K., Manninen, H., Nieminen, T., Petäjä, T., Sipilä, M., Schobesberger, S., Rantala, P., Franchin, A., Jokinen, T., Järvinen, E., Äijälä, M., Kangasluoma, J., Hakala, J., Aalto, P., Paasonen, P., Mikkilä, J., Vanhanen, J., Aalto, J., Hakola, H., Makkonen, U., Ruuskanen, T., Mauldin III, R., Duplissy, J., Vehkamäki, H., Bäck, J., Kortelainen, A., Riipinen, I., Kurtén, T., Johnston, M., Smith, J., Ehn, M., Mentel, T., Lehtinen, K., Laaksonen, A., Kerminen, V.-M., and Worsnop, D.: Direct observations of atmospheric aerosol nucleation, Science, 339, 943–946, https://doi.org/10.1126/science.1227385, 2013. a
Kupiainen-Määttä, O., Olenius, T., Korhonen, H., Malila, J., Dal Maso, M., Lehtinen, K., and Vehkamäki, H.: Critical cluster size cannot in practice be determined by slope analysis in atmospherically relevant applications, J. Aerosol Sci., 77, 127–144, https://doi.org/10.1016/j.jaerosci.2014.07.005, 2014. a
Lähde, T., Rönkkö, T., Virtanen, A., Schuck, T. J., Pirjola, L., Hämeri, K., Kulmala, M., Arnold, F., Rothe, D., and Keskinen, J.: Heavy Duty Diesel Engine Exhaust Aerosol Particle and Ion Measurements, Environ. Sci. Technol., 43, 163–168, https://doi.org/10.1021/es801690h, 2009. a
Lelieveld, J., Evans, J. S., Fnais, M., Giannadaki, D., and Pozzer, A.: The contribution of outdoor air pollution sources to premature mortality on a global scale, Nature, 525, 367–371, https://doi.org/10.1038/nature15371, 2015. a
Lemmetty, M., Vehkamäki, H., Virtanen, A., Kulmala, M., and Keskinen, J.: Homogeneous Ternary Nucleation and Diesel Exhaust: a Classical Approach, Aerosol Air Qual. Res., 7, 489–499, https://doi.org/10.4209/aaqr.2007.02.0008, 2007. a, b
Lemmetty, M., Rönkkö, T., Virtanen, A., Keskinen, J., and Pirjola, L.: The effect of sulphur in diesel exhaust aerosol: Models compared with measurements, Aerosol Sci. Tech., 42, 916–929, https://doi.org/10.1080/02786820802360682, 2008. a
Li, X. and Huang, Z.: Formation and transformation of volatile nanoparticles from a diesel engine during exhaust dilution, Chinese Sci. Bull., 57, 948–954, https://doi.org/10.1007/s11434-011-4927-8, 2012. a
Liu, Y. H., He, Z., and Chan, T. L.: Three-dimensional simulation of exhaust particle dispersion and concentration fields in the near-wake region of the studied ground vehicle, Aerosol Sci. Tech., 45, 1019–1030, https://doi.org/10.1080/02786826.2011.580021, 2011. a
Lyyränen, J., Jokiniemi, J., Kauppinen, E. I., Backman, U., and Vesala, H.: Comparison of Different Dilution Methods for Measuring Diesel Particle Emissions, Aerosol Sci. Tech., 38, 12–23, https://doi.org/10.1080/02786820490247579, 2004. a
Maricq, M., Chase, R., Xu, N., and Laing, P.: The effects of the catalytic converter and fuel sulfur level on motor vehicle particulate matter emissions: Light duty diesel vehicles, Environ. Sci. Technol., 36, 283–289, https://doi.org/10.1021/es010962l, 2002. a, b
Maricq, M. M., Szente, J. J., and Jahr, K.: The Impact of Ethanol Fuel Blends on PM Emissions from a Light-Duty GDI Vehicle, Aerosol Sci. Tech., 46, 576–583, https://doi.org/10.1080/02786826.2011.648780, 2012. a
McMurry, P. and Friedlander, S.: New particle formation in the presence of an aerosol, Atmos. Environ., 13, 1635–1651, https://doi.org/10.1016/0004-6981(79)90322-6, 1979. a, b
Meyer, N. and Ristovski, Z.: Ternary Nucleation as a Mechanism for the Production of Diesel Nanoparticles: Experimental Analysis of the Volatile and Hygroscopic Properties of Diesel Exhaust Using the Volatilization and Humidification Tandem Differential Mobility Analyzer, Environ. Sci. Technol., 41, 7309–7314, https://doi.org/10.1021/es062574v, 2007. a, b, c
Mordas, G., Manninen, H., Petäjä, T., Aalto, P., Hämeri, K., and Kulmala, M.: On operation of the ultra-fine water-based CPC TSI 3786 and comparison with other TSI models (TSI 3776, TSI 3772, TSI 3025, TSI 3010, TSI 3007), Aerosol Sci. Tech., 42, 152–158, https://doi.org/10.1080/02786820701846252, 2008. a
Neitola, K., Brus, D., Makkonen, U., Sipilä, M., Mauldin III, R. L., Sarnela, N., Jokinen, T., Lihavainen, H., and Kulmala, M.: Total sulfate vs. sulfuric acid monomer concenterations in nucleation studies, Atmos. Chem. Phys., 15, 3429–3443, https://doi.org/10.5194/acp-15-3429-2015, 2015. a
Ntziachristos, L., Giechaskiel, B., Pistikopoulos, P., Samaras, Z., Mathis, U., Mohr, M., Ristimäki, J., Keskinen, J., Mikkanen, P., Casati, R., Scheer, V., and Vogt, R.: Performance evaluation of a novel sampling and measurement system for exhaust particle characterization, SAE J.-Automot. Eng., 2004–01–1439, https://doi.org/10.4271/2004-01-1439, 2004. a, b, c
Olin, M., Dal Maso, M., and Rönkkö, T.: Sulfur driven nucleation in diesel exhaust: Simulations of a laboratory sampling system, in: Proceedings of the 18th ETH-Conference on Combustion Generated Nanoparticles, Zürich, Switzerland, 22–25 June 2014, 2014. a
Olin, M., Rönkkö, T., and Dal Maso, M.: CFD modeling of a vehicle exhaust laboratory sampling system: sulfur-driven nucleation and growth in diluting diesel exhaust, Atmos. Chem. Phys., 15, 5305–5323, https://doi.org/10.5194/acp-15-5305-2015, 2015. a, b, c, d, e, f, g, h, i, j, k
Olin, M., Anttila, T., and Dal Maso, M.: Using a combined power law and log-normal distribution model to simulate particle formation and growth in a mobile aerosol chamber, Atmos. Chem. Phys., 16, 7067–7090, https://doi.org/10.5194/acp-16-7067-2016, 2016. a, b, c, d, e
Paasonen, P., Nieminen, T., Asmi, E., Manninen, H., Petäjä, T., Plass-Dülmer, C., Flentje, H., Birmili, W., Wiedensohler, A., Horrak, U., Metzger, A., Hamed, A., Laaksonen, A., Facchini, M., Kerminen, V.-M., and Kulmala, M.: On the roles of sulphuric acid and low-volatility organic vapours in the initial steps of atmospheric new particle formation, Atmos. Chem. Phys., 10, 11223–11242, https://doi.org/10.5194/acp-10-11223-2010, 2010. a
Pey, J., Querol, X., Alastuey, A., Rodriguez, S., Putaud, J., and Van Dingenen, R.: Source apportionment of urban fine and ultra-fine particle number concentration in a Western Mediterranean city, Atmos. Environ., 43, 4407–4415, https://doi.org/10.1016/j.atmosenv.2009.05.024, 2009. a
Pirjola, L., Karl, M., Rönkkö, T., and Arnold, F.: Model studies of volatile diesel exhaust particle formation: are organic vapours involved in nucleation and growth?, Atmos. Chem. Phys., 15, 10435–10452, https://doi.org/10.5194/acp-15-10435-2015, 2015. a, b, c, d
Pope, C., Burnett, R., Thun, M., Calle, E., Krewski, D., Ito, K., and Thurston, G.: Lung cancer, cardiopulmonary mortality, and long-term exposure to fine particulate air pollution, J. Amer. Med. Assoc., 287, 1132–1141, https://doi.org/10.1001/jama.287.9.1132, 2002. a
Raes, F., Janssens, A., and Dingenen, R. V.: The role of ion-induced aerosol formation in the lower atmosphere, J. Aerosol Sci., 17, 466–470, https://doi.org/10.1016/0021-8502(86)90135-7, 1986. a
Riccobono, F., Schobesberger, S., Scott, C. E., Dommen, J., Ortega, I. K., Rondo, L., Almeida, J., Amorim, A., Bianchi, F., Breitenlechner, M., David, A., Downard, A., Dunne, E. M., Duplissy, J., Ehrhart, S., Flagan, R. C., Franchin, A., Hansel, A., Junninen, H., Kajos, M., Keskinen, H., Kupc, A., Kürten, A., Kvashin, A. N., Laaksonen, A., Lehtipalo, K., Makhmutov, V., Mathot, S., Nieminen, T., Onnela, A., Petäjä, T., Praplan, A. P., Santos, F. D., Schallhart, S., Seinfeld, J. H., Sipilä, M., Spracklen, D. V., Stozhkov, Y., Stratmann, F., Tomé, A., Tsagkogeorgas, G., Vaattovaara, P., Viisanen, Y., Vrtala, A., Wagner, P. E., Weingartner, E., Wex, H., Wimmer, D., Carslaw, K. S., Curtius, J., Donahue, N. M., Kirkby, J., Kulmala, M., Worsnop, D. R., and Baltensperger, U.: Oxidation Products of Biogenic Emissions Contribute to Nucleation of Atmospheric Particles, Science, 344, 717–721, https://doi.org/10.1126/science.1243527, 2014. a, b
Riipinen, I., Sihto, S.-L., Kulmala, M., Arnold, F., Dal Maso, M., Birmili, W., Saarnio, K., Teinilä, K., Kerminen, V.-M., Laaksonen, A., and Lehtinen, K. E. J.: Connections between atmospheric sulphuric acid and new particle formation during QUEST III–IV campaigns in Heidelberg and Hyytiälä, Atmos. Chem. Phys., 7, 1899–1914, https://doi.org/10.5194/acp-7-1899-2007, 2007. a, b
Rissler, J., Swietlicki, E., Bengtsson, A., Boman, C., Pagels, J., Sandström, T., Blomberg, A., , and Löndahl, J.: Experimental determination of deposition of diesel exhaust particles in the human respiratory tract, J. Aerosol Sci., 48, 18–33, https://doi.org/10.1016/j.jaerosci.2012.01.005, 2012. a
Rönkkö, T., Virtanen, A., Kannosto, J., Keskinen, J., Lappi, M., and Pirjola, L.: Nucleation mode particles with a nonvolatile core in the exhaust of a heavy duty diesel vehicle, Environ. Sci. Technol., 41, 6384–6389, https://doi.org/10.1021/es0705339, 2007. a
Rönkkö, T., Lähde, T., Heikkilä, J., Pirjola, L., Bauschke, U., Arnold, F., Schlager, H., Rothe, D., Yli-Ojanperä, J., and Keskinen, J.: Effects of gaseous sulphuric acid on diesel exhaust nanoparticle formation and characteristics, Environ. Sci. Technol., 47, 11882–11889, https://doi.org/10.1021/es402354y, 2013. a, b, c
Rönkkö, T., Pirjola, L., Ntziachristos, L., Heikkilä, J., Karjalainen, P., Hillamo, R., and Keskinen, J.: Vehicle Engines Produce Exhaust Nanoparticles Even When Not Fueled, Environ. Sci. Technol., 48, 2043–2050, https://doi.org/10.1021/es405687m, 2014. a
Rönkkö, T., Kuuluvainen, H., Karjalainen, P., Keskinen, J., Hillamo, R., Niemi, J. V., Pirjola, L., Timonen, H. J., Saarikoski, S., Saukko, E., Järvinen, A., Silvennoinen, H., Rostedt, A., Olin, M., Yli-Ojanperä, J., Nousiainen, P., Kousa, A., and Dal Maso, M.: Traffic is a major source of atmospheric nanocluster aerosol, P. Natl. Acad. Sci. USA, 114, 7549–7554, https://doi.org/10.1073/pnas.1700830114, 2017. a
Saito, K., Shinozaki, O., Seto, T., Kim, C.-S., Okuyama, K., Kwon, S.-B., and Lee, K. W.: The Origins of Nanoparticle Modes in the Number Distribution of Diesel Particulate Matter, in: SAE Technical Paper, SAE International, 2002-01-1008, https://doi.org/10.4271/2002-01-1008, 2002. a, b
Sakurai, H., Tobias, H., Park, K., Zarling, D., Docherty, K., Kittelson, D., McMurry, P., and Ziemann, P.: On-line measurements of diesel nanoparticle composition and volatility, Atmos. Environ., 37, 1199–1210, https://doi.org/10.1016/S1352-2310(02)01017-8, 2003. a
Schneider, J., Hock, N., Weimer, S., Borrmann, S., Kirchner, U., Vogt, R., and Scheer, V.: Nucleation particles in diesel exhaust: Composition inferred from in situ mass spectrometric analysis, Environ. Sci. Technol., 39, 6153–6161, https://doi.org/10.1021/es049427m, 2005. a
Sgro, L., Borghese, A., Speranza, L., Barone, A., Minutolo, P., Bruno, A., D'Anna, A., and D'Alessio, A.: Measurements of nanoparticles of organic carbon and soot in flames and vehicle exhausts, Environ. Sci. Technol., 42, 859–863, https://doi.org/10.1021/es070485s, 2008. a
Sihto, S.-L., Kulmala, M., Kerminen, V.-M., Dal Maso, M., Petäjä, T., Riipinen, I., Korhonen, H., Arnold, F., Janson, R., Boy, M., Laaksonen, A., and Lehtinen, K. E. J.: Atmospheric sulphuric acid and aerosol formation: implications from atmospheric measurements for nucleation and early growth mechanisms, Atmos. Chem. Phys., 6, 4079–4091, https://doi.org/10.5194/acp-6-4079-2006, 2006. a, b
Sihto, S.-L., Vuollekoski, H., Leppä, J., Riipinen, I., Kerminen, V.-M., Korhonen, H., Lehtinen, K., Boy, M., and Kulmala, M.: Aerosol dynamics simulations on the connection of sulphuric acid and new particle formation, Atmos. Chem. Phys., 9, 2933–2947, https://doi.org/10.5194/acp-9-2933-2009, 2009. a
Stevens, R. G. and Pierce, J. R.: The contribution of plume-scale nucleation to global and regional aerosol and CCN concentrations: evaluation and sensitivity to emissions changes, Atmos. Chem. Phys., 14, 13661–13679, https://doi.org/10.5194/acp-14-13661-2014, 2014. a
Stevens, R. G., Pierce, J. R., Brock, C. A., Reed, M. K., Crawford, J. H., Holloway, J. S., Ryerson, T. B., Huey, L. G., and Nowak, J. B.: Nucleation and growth of sulfate aerosol in coal-fired power plant plumes: sensitivity to background aerosol and meteorology, Atmos. Chem. Phys., 12, 189–206, https://doi.org/10.5194/acp-12-189-2012, 2012. a, b
Sulonen, M. L., Kokko, M. E., Lakaniemi, A.-M., and Puhakka, J. A.: Electricity generation from tetrathionate in microbial fuel cells by acidophiles, J. Hazard. Mater., 284, 182–189, https://doi.org/10.1016/j.jhazmat.2014.10.045, 2015. a
Taleb, D.-E., Ponche, J.-L., and Mirabel, P.: Vapor pressures in the ternary system water-nitric acid-sulfuric acid at low temperature: A reexamination, J. Geophys. Res.-Atmos., 101, 25967–25977, https://doi.org/10.1029/96JD02330, 1996. a
Tobias, H., Beving, D., Ziemann, P., Sakurai, H., Zuk, M., McMurry, P., Zarling, D., Waytulonis, R., and Kittelson, D.: Chemical analysis of diesel engine nanoparticles using a nano-DMA/thermal desorption particle beam mass spectrometer, Environ. Sci. Technol., 35, 2233–2243, https://doi.org/10.1021/es0016654, 2001. a
Uhrner, U., von Löwis, S., Vehkamäki, H., Wehner, B., Bräsel, S., Hermann, M., Stratmann, F., Kulmala, M., and Wiedensohler, A.: Dilution and aerosol dynamics within a diesel car exhaust plume-CFD simulations of on-road measurement conditions, Atmos. Environ., 41, 7440–7461, https://doi.org/10.1016/j.atmosenv.2007.05.057, 2007. a
Vaaraslahti, K., Virtanen, A., Ristimäki, J., and Keskinen, J.: Nucleation Mode Formation in Heavy-Duty Diesel Exhaust with and without a Particulate Filter, Environ. Sci. Technol., 38, 4884–4890, https://doi.org/10.1021/es0353255, 2004. a, b, c
Vaaraslahti, K., Keskinen, J., Giechaskiel, B., Solla, A., Murtonen, T., and Vesala, H.: Effect of lubricant on the formation of heavy-duty diesel exhaust nanoparticles, Environ. Sci. Technol., 39, 8497–8504, https://doi.org/10.1021/es0505503, 2005. a, b
Vehkamäki, H. and Riipinen, I.: Thermodynamics and kinetics of atmospheric aerosol particle formation and growth, Chem. Soc. Rev., 41, 5160–5173, https://doi.org/10.1039/C2CS00002D, 2012. a
Vehkamäki, H., Kulmala, M., Lehtinen, K., and Noppel, M.: Modelling binary homogeneous nucleation of water-sulfuric acid vapours: Parameterisation for high temperature emissions, Environ. Sci. Technol., 37, 3392–3398, https://doi.org/10.1021/es0263442, 2003. a
Virtanen, A., Rönkkö, T., Kannosto, J., Ristimäki, J., Mäkelä, J., Keskinen, J., Pakkanen, T., Hillamo, R., Pirjola, L., and Hämeri, K.: Winter and summer time size distributions and densities of traffic-related aerosol particles at a busy highway in Helsinki, Atmos. Chem. Phys., 6, 2411–2421, https://doi.org/10.5194/acp-6-2411-2006, 2006. a
Vogt, R., Scheer, V., Casati, R., and Benter, T.: On-road measurement of particle emission in the exhaust plume of a diesel passenger car, Environ. Sci. Technol., 37, 4070–4076, https://doi.org/10.1021/es0300315, 2003. a, b
Vouitsis, E., Ntziachristos, L., and Samaras, Z.: Modelling of diesel exhaust aerosol during laboratory sampling, Atmos. Environ., 39, 1335 – 1345, https://doi.org/10.1016/j.atmosenv.2004.11.011, 2005. a, b, c
Wang, Y. and Zhang, K.: Coupled turbulence and aerosol dynamics modeling of vehicle exhaust plumes using the CTAG model, Atmos. Environ., 59, 284–293, https://doi.org/10.1016/j.atmosenv.2012.04.062, 2012. a
Weber, R. J., Marti, J. J., McMurry, P. H., Eisele, F. L., Tanner, D. J., and Jefferson, A.: Measured Atmospheric New Particle Formation Rates: Implications for Nucleation Mechanisms, Chem. Eng. Commun., 151, 53–64, https://doi.org/10.1080/00986449608936541, 1996. a
Wölk, J. and Strey, R.: Homogeneous Nucleation of H2O and D2O in Comparison: The Isotope Effect, J. Phys. Chem. B, 105, 11683–11701, https://doi.org/10.1021/jp0115805, 2001. a
Wyslouzil, B. E. and Wölk, J.: Overview: Homogeneous nucleation from the vapor phase – The experimental science, J. Chem. Phys., 145, 211702, https://doi.org/10.1063/1.4962283, 2016. a
Zeleznik, F. J.: Thermodynamic Properties of the Aqueous Sulfuric Acid System to 350 K, J. Phys. Chem. Ref. Data, 20, 1157–1200, https://doi.org/10.1063/1.555899, 1991. a, b
Zhang, R., Khalizov, A., Wang, L., Hu, M., and Xu, W.: Nucleation and Growth of Nanoparticles in the Atmosphere, Chem. Rev., 112, 1957–2011, https://doi.org/10.1021/cr2001756, 2012. a