the Creative Commons Attribution 4.0 License.
the Creative Commons Attribution 4.0 License.
 | 14 May 2019
Atmospheric pollution from ships and its impact on local air quality at a port site in Shanghai
Xinning Wang
Yin Shen
Yanfen Lin
Jun Pan
Yan Zhang
Peter K. K. Louie
Mei Li
Growing shipping activities in port areas have generated negative impacts on climate, air quality and human health. To better evaluate the environmental impact of ship emissions, an experimental characterization of air pollution from ships was conducted in Shanghai Port in the summer of 2016. The ambient concentrations of gaseous NO, NO2, SO2 and O3 in addition to fine particulate matter concentrations (PM2.5), particle size distributions and the chemical composition of individual particles from ship emission were continuously monitored for 3 months. Ship emission plumes were visible at the port site in terms of clear peaks in the gaseous species and particulate matter concentrations. The SO2 and vanadium particle numbers were found to correlate best with ship emissions in Shanghai Port. Single-particle data showed that ship emission particles at the port site mainly concentrated in a smaller size range (<0.4 µm), where their number contributions were more important than their mass contributions to ambient particulate matter. The composition of ship emission particles at the port site suggested that they were mostly freshly emitted particles: their mass spectra were dominated by peaks of sulfate, elemental carbon (EC), and trace metals such as V, Ni, Fe and Ca, in addition to displaying very low nitrate signals. The gaseous NOx composition in some cases of plumes showed evidence of atmospheric transformation by ambient O3, which subsequently resulted in O3 depletion in the area. Quantitative estimations in this study showed that ship emissions contributed 36.4 % to SO2, 0.7 % to NO, 5.1 % to NO2, −0.9 % to O3, 5.9 % to PM2.5 and 49.5 % to vanadium particles in the port region if land-based emissions were included, and 57.2 % to SO2, 71.9 % to NO, 30.4 % to NO2, −16.6 % to O3, 27.6 % to PM2.5 and 77.0 % to vanadium particles if land-based emissions were excluded.
- Article
(4179 KB) - Full-text XML
-
Supplement
(641 KB) - BibTeX
- EndNote


Ship emissions constitute an important gaseous and particulate pollution source on the global scale, which has become progressively more important in recent years due to increasing shipping activities. The annual ship-based emissions of NOx, SO2 and PM2.5 have been estimated to be 2×10⁷, 9.7×10⁶ and 1.5×10⁶ t, respectively (Johansson et al., 2017). The large emission intensities from ships have generated great burdens on both the regional and global environment (Fuglestvedt et al., 2009) in addition to negative impacts on human health (Corbett et al., 2007). In the marine environment, ships have been found to be the dominant contributor to surface NO2 and SO2 concentrations (Dalsøren et al., 2009). Altered clouds properties have also been identified in marine areas along ship cruising routes, by satellites (Petzold et al., 2008; Coggon et al., 2012), which could impact Earth's radiation budget and climate. In coastal or port regions, ship emissions have made significant local contributions to atmospheric NOx, SO2 and PM (Donateo et al., 2014; Merico et al., 2017).
The typical fuel that ships burn is residual fuel oil (RFO), which has a high sulfur content. Combustion of RFO in ship engines produces high concentrations of gaseous and particulate pollutants including NOx, SO2, elemental carbon (EC), organic carbon (OC), sulfate and trace metals. Emission factors of these pollutants from various ship types have been determined in order to develop emission inventories (Moldanová et al., 2013; Buffaloe et al., 2014; Cappa et al., 2014). During ambient measurement, however, the chemical and physical attributes of ship emissions are critical to identify ship emissions and assess their impacts (Murphy et al., 2009). Owing to more stringent regulation of ship emissions, such as restricting the sulfur content in fuel, the detection of ship emissions based solely on individual tracers is unreliable due to the changing composition of RFOs in different areas. To better identify ship emissions in this context, multi-component characterizations, including both gaseous and particulate components, are necessary in studies of field measurements (Xiao et al., 2018; Viana et al., 2009).
In the Yangtze River Delta (YRD) region in China shipping activities have increased significantly due to intensified international trade in recent years. The accompanying potential environmental and health problems due to shipping emissions in the area are well recognized (Chen et al., 2018; Zhang et al., 2017; Fu et al., 2017). Global distributions of ship emissions indicate that the South China Sea and the East China Sea regions have the highest pollutant emission densities (Johansson et al., 2017). As shown in an emission inventory in China, shipping traffic emitted about 1.3 Tg of SO2, 1.9 Tg of NOx and 0.16 Tg of particulate matter (PM) in 2013, with NOx and PM being equivalent to ∼ 34 % and 29 % of the total mobile vehicle emissions in China (Fu et al., 2017). To cope with the severe air pollution caused by ship emissions, the Shanghai government has initiated the implementation of Domestic Emission Control Areas (DECAs) in the YRD. At the present stage, according to YRD DECA regulations, the sulfur content of any fuel used on board while berthing at Shanghai Port should not exceed 0.5 % (m∕m), except for during the first hour after arrival and the last hour before departure; these regulations took effect on April 1, 2016. This regulated sulfur limit is still higher than the implemented legislation in many harbors/ports in Europe and the US (0.1 %; IMO, 2017). The DECA measure has currently been implemented in three major shipping areas including the YRD, the Pearl River Delta (PRD) and the Bohai Rim region in China. The efficiency of emission control area (ECA) measures has also been tested in other places (Contini et al., 2015; Merico et al., 2017). It was shown that control strategies, with respect to sulfur levels in fuel, could generate a synergetic reduction in both SO2 and primary PM release from ships. The benefits of the DECA measure in the YRD have also been evidenced by the reduction of SO2 concentrations at several monitoring sites in port areas. A published study, which dealt with the effectiveness of DECAs in the PRD region, has estimated that the DECA measure could result in an average reduction of 9.54 % for SO2 and 2.7 % for PM2.5 in land areas (Liu et al., 2018).
A quantitative estimation of the ship emission contribution to air quality is needed for better a understanding of its environmental impact and to develop effective control policies. In East Asia, an earlier emission inventory in the Shanghai area estimated that ship emissions were 58160, 51180 and 6960 t yr−1 for NOx, SO2 and PM, respectively, in 2003 (Yang et al., 2007). Over the last decade, the Shanghai Port throughput of goods has dramatically increased. In 2010, the total ship emissions of NOx, SO2 and PM2.5 in the YRD had grown to 7.1×10⁵, 3.8×10⁵ and 5.1×10⁴ t yr−1, respectively (Fan et al., 2016). A more recent study estimated that the primary PM2.5 from ships ranged from 0.63 to 3.58 µg m−3, and accounted for 4.23 % of the total PM2.5 in Shanghai Port (Zhao et al., 2013), based on a marine port measurement off the coast of Shanghai. This kind of information is needed for ports in coastal areas due to their close proximity to the urban area of Shanghai city.
In the summer of 2016, an on-site sampling campaign focusing on ship emissions was performed at Shanghai Port. Gaseous and particulate matter concentrations were monitored for 3 months to identify and characterize the ship emissions in the Shanghai Port area. Based on the measurement data, a quantitative assessment of the contribution of ship emissions to air quality at the port site was performed. Ship-emitted aerosol particles were characterized using a single-particle aerosol mass spectrometer (SPAMS); the SPAMS instrument and the measurement of gaseous species were colocated at the same site. The SPAMS was utilized to identify the aerosol composition and size in ship emissions with a high temporal resolution; this is useful for detecting fast transient ship plumes, as has been previously demonstrated (Ault et al., 2010; Healy et al., 2009). In addition, the ship emission particle signatures obtained here are valuable with respect to SPAMS source apportionment in future studies. The present study represents a comprehensive characterization of gaseous and particulate ship emissions in the YRD and serves to provide essential scientific information for the development of future evidence-based ship emission control policies.
2.1 Sampling site
Waigaoqiao Port (31.337∘ N, 121.665∘ E) is located in northeast of Shanghai city (Fig. 1) and is the largest port in China. The port has about 7 km of docks (a 3 km north section and a 4 km south section). In 2016 the port had yearly traffic of 367 Mt of goods and a container volume of 37.13 million TEU (twenty-foot equivalent unit). Ship categories at the port comprise container vessels (62.4 %), tugs (18.6 %), oil tankers (9.0 %), bulk carriers (1.8 %), Ro-Ro vessels (1.7 %) and other ships (6.5 %) (private data from the port authority). A power plant and a shipbuilding factory reside between the north and south sections of the port, and have their own docks. The air monitoring station at the study site is located on the south bank of Yangtze River, 400 m from the nearest dock.
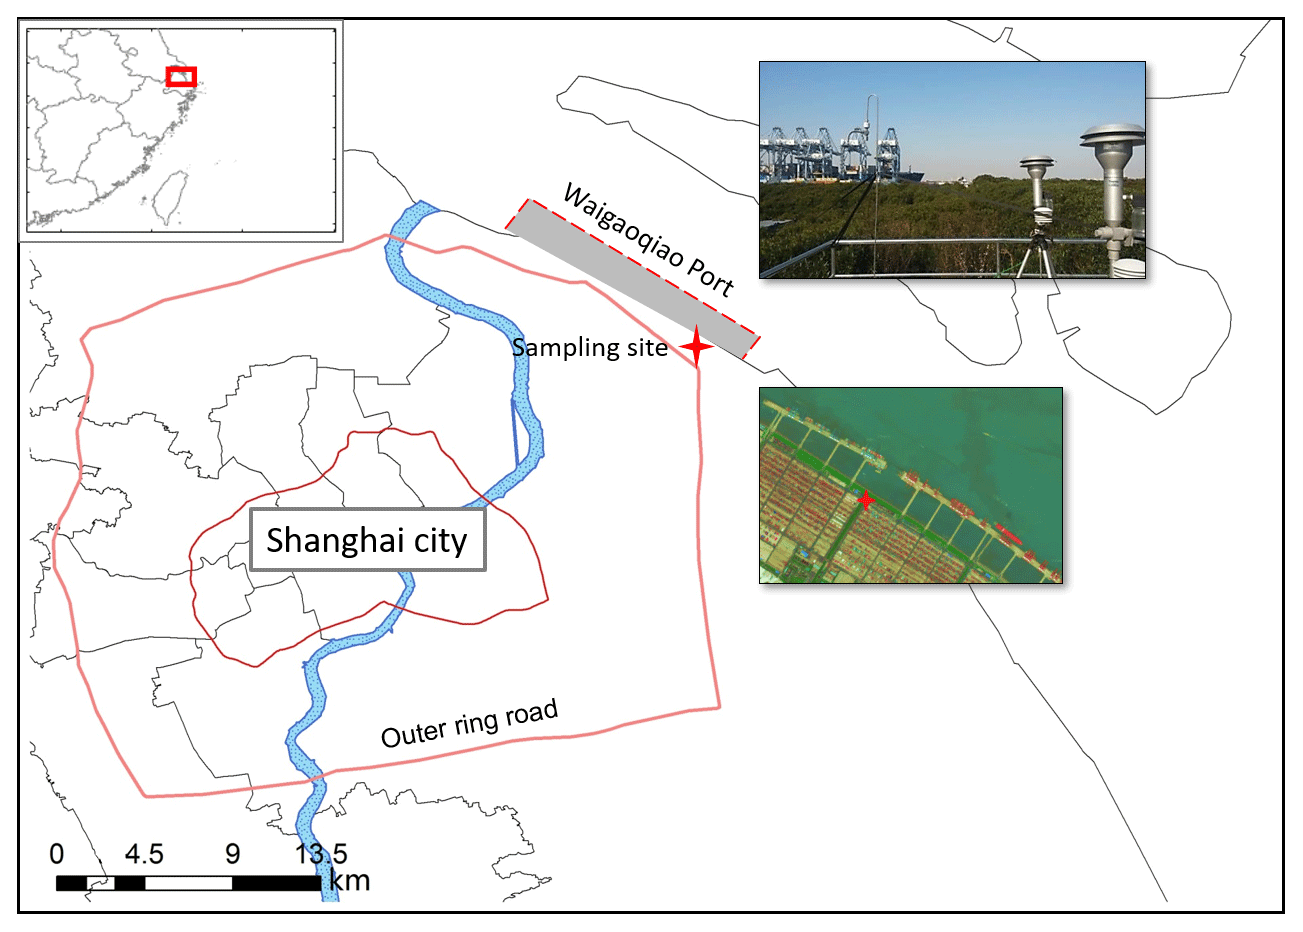
Figure 1Map of the sampling site at Shanghai Port and the surrounding areas. The port region is indicated by the gray shaded area. The insets are a photo taken from the roof of monitoring station looking toward the port, and a satellite image of the port study site.
Monitoring instruments for gaseous species and particulate matter were installed in the station room. The station was equipped with a main sampling tube that extended through the roof. The inlets of the main sampling tube were 1 m above the station roof and 3.5 m above the ground. Ship emission plumes could influence the site when wind directions were from the 300–0–120∘ sector (Fig. 1). During the summer season, the prevailing wind at the site is from the southeast. In the Supplement, a wind rose displaying wind directions during the sampling period is provided (Fig. S1). Approximately 55 % of time, the site was under the influence of port emissions. To the south and west of site there was intense road traffic which comprised of container trucks and the Shanghai outer ring road. In addition to the emissions from ships from the port, the site could also receive important emission influences from traffic when inland winds prevailed.
2.2 Gaseous pollutants, PM2.5 and peripheral measurements
From 21 June to 21 September 2016, gaseous pollutants – NO–NO2–NOx, SO2 and O3 – were continuously monitored at the port study site using a suit of Thermo Scientific analyzers (NO–NO2–NOx, model 42i; SO2, model 43i; O3, model 49i). Verification and calibration of the instruments were performed regularly using zero checks (by a zero air generator) and span checks (utilizing standard NO2 and SO2 gas of known concentrations; the O3 standard was generated by a calibration photometer system). The PM2.5 concentrations were monitored using the tapered element oscillating microbalance (TEOM) method (Thermo TEOM 1405-F). Calibration of the TEOM did not rely on a standard; the aerosol mass on a filter was monitored by the oscillation frequency change of the tapered element over a specified time. The regular maintenance of the TEOM included the replacement of filters before their mass loadings approached 100 %. The flow rate of the TEOM was checked using a flowmeter. The lower detection limits of the abovementioned instruments are 0.4 µg m−3 for NO and NO2, 0.5 µg m−3 for SO2, 0.5 µg m−3 for O3 and 1 µg m−3 for PM2.5. Weather conditions (temperature, humidity, pressure, wind speed and direction) were monitored by a mini-weather station installed on the rooftop of the station. The weather station sensor was installed about 1 m above the station roof and 3.5 m above the ground. Data from all of the instruments and the weather monitor were managed in a customized database and were set to a 5 min resolution. Atmospheric pollutant concentrations in the Shanghai city area, including gaseous pollutants and PM2.5 concentrations, were monitored concurrently at nine national air quality monitoring stations at a 1 h resolution. The averaged pollutant concentrations at these stations during the same period were included for comparison.
2.3 Single-particle aerosol mass spectrometer (SPAMS)
From 21 June to 21 September in 2016, a single-particle aerosol mass spectrometer (SPAMS; Hexin Analytical Instrument Co., Ltd., China) was applied to characterize the single-particle composition and particle size of ambient aerosol at the port study site (Li et al., 2011). The operation principle of SPAMS is briefly described. Ambient aerosol was drawn into the SPAMS vacuum system through a critical orifice with a limited aerosol flow. The particles then entered an aerodynamic focusing lens (AFL) where they were focused into thin beam with transiting velocities in the vacuum as a function of their aerodynamic size. In the SPAMS sizing region, the particles consecutively encountered two continuous laser beams (532 nm wavelength), which reflected light and generated signals in two photomultiplier tubes (PMTs). The time lag between the two PMT signals was used to calculate the particle velocity and to trigger an ionizing laser pulse (266 nm wavelength) at the appropriate time to ionize the same particle. The chemical composition of particles was determined by a dual polar time-of-flight mass spectrometer to record signals for both negative and positive ions. The time lags between the two PMTs of PSL (polystyrene latex) particles of known sizes were used to calibrate the aerodynamic size of ambient particles. Particle size, dual polar mass spectra and particle reflecting signals from the two PMTs were saved for each particle. A PM2.5 cyclone was placed at the inlet of the sampling tube on the roof of the station to remove particles >2.5 µm before they were analyzed by the SPAMS instrument.
Specific components in particles, such as vanadium, are identified by their characteristic mass peaks in the particle spectra. Particles producing vanadium peaks were labeled as vanadium particles. The SPAMS instrument quantified their concentrations in a semi-quantitative manner via the number of detected particles over a specific duration of time. Considering that the aerosol flow was introduced into the SPAMS instrument at fixed flow rate (0.1 L min−1), the detected particle numbers (or the particle detecting velocity) could be utilized as an indication of the ambient particle concentrations. Using ambient sampling, it was shown that particle numbers in the SPAMS instrument were positively correlated with ambient PM2.5 concentrations (R2=0.69 in this study). In the present study, we used the particle detecting velocity of particles containing vanadium as a measure of their concentration. To derive the ambient particle number concentrations from SPAMS particle numbers, we had to consider the efficiency issues of the SPAMS instrument with respect to AFL transmission, laser detection and laser ionization (Wenzel et al., 2003).
2.4 SPAMS data analysis
The temporal resolution of SPAMS (seconds or minutes) makes it suitable to couple with online gaseous data in order to identify ship emissions. The fluctuations of gaseous concentrations, the shifting of wind directions and the arrival of emission plumes were well captured by SPAMS data. Additionally, this study took advantage of the ability of SPAMS to identify individual ship emission particles by their characteristic composition. Composition patterns of ship emission particles were identified and were then applied to extract the desired particles from all of the analyzed particles. Hence, the temporal trends, the size distribution, the chemical composition and the wind roses of the extracted particles could be examined in further detail.
During the 3-month sampling period, SPAMS generated a large particle dataset (>2.3 million particles were chemically analyzed). To identify ship emission particles from the analyzed particles, we applied a combined method involving peak searching and a clustering algorithm. Specifically, the individual particle mass spectra were visually inspected to get a general mass spectral pattern during ship plumes. It was not feasible to inspect the large number of spectra exhaustively. Instead, we used the concurrent SO2 concentrations to locate ship emission plumes when sharp SO2 peaks occurred, which is typical for RFO combustion (Murphy et al., 2009; Merico et al., 2016). Compared with non-plume periods, the most indicative peaks during plumes occurred at V+(51), VO+(67), Fe+(56), Ni+(58) and serial peaks of elemental carbon at () in the positive mass spectrum (Ault et al., 2010, 2009; Healy et al., 2009). In this study the vanadium mass peaks (peak V+(51) and VO+(67)) were determined to be a prerequisite to indicate ship particles during plumes. Further notes regarding this particle identification method for ship emission particles are provided in the Supplement. We applied a rough search with peak criteria of and 67 (i.e., just the existence of mass peaks at 51 and 67 with no peak area limitation) to search all possible candidates from the entire dataset. This particle criteria is not stringent because particles producing organic peaks at the same nominal mass (e.g., (51), C4H3O+(67)) could interfere and may enter into searched clusters. The ART-2a algorithm (Song et al., 1999) was then applied to the searched particles to generate subclusters of similar mass spectral patterns (vigilance = 0.85; learning = 0.05; iteration = 20). By inspecting the composition, size and wind rose patterns of subclusters, a small fraction of outlier particles from non-shipping emission sources were subsequently picked out and discarded.
2.5 Evaluation of ship emission contributions
The calculation method for ship emission contributions used in this study, which was originally developed by Contini et al. (2011), is based on the extraction of ship emission plumes from background pollutant concentrations:
where εA represents ship emission contributions of pollutant A, ΔCA is the difference between the average concentrations during plumes and non-plumes, Fplm is the fraction of plume cases and CA is the average concentration of pollutant A during the reference period. The uncertainties of εA determined in this method could arise from several factors, such as the definition of the port direction sector, the definition of plumes (the threshold level that determines plumes and background conditions), and pollutant and wind field measurements. This study estimated the uncertainties by subjecting εA to a slight adjustments of the port directions (by ±10∘) and pollutant threshold levels (by 20 %) to inspect its variations. To conform to the original work (Contini et al., 2011), calm wind periods (wind speed <0.5 m s−1) were considered in the evaluation of uncertainties (by either excluding or including calm wind periods).
3.1 Identification and description of ship emission plumes
In the vicinity of the port, the ship emission pollutant concentrations often produced obvious peaks over a relatively short period of time (Fig. 2). These peaks were caused by ship emission plumes relating to shipping activities such as arrival, hoteling (operations while docked) and departure, which typically persist for a few (generally 3–6) hours. The ambient SO2, NO, NO2, O3 and PM2.5 concentrations during a typical period (27–29 August) are shown in Fig. 2 to illustrate several plumes. For comparison, the averaged SO2 concentration in Shanghai city and the vanadium particle number concentrations for the same period are provided. During plume periods, the ambient SO2 concentration peaks correlated well with vanadium particle numbers detected by the SPAMS instrument. The PM2.5 peaks during plumes were not always as unclear as in Fig. 2. In the Supplement we present another period of PM2.5, SO2 and vanadium particle concentrations to demonstrate stronger PM2.5 peaks (Fig. S3). The synchronized gaseous and particulate pollutant peaks in the ship emission plumes were typically observed in port regions (Healy et al., 2009; Ault et al., 2010; Merico et al., 2016). These ship emission plumes were also consistent with the prevailing wind directions of plumes, as shown in Fig. 2.
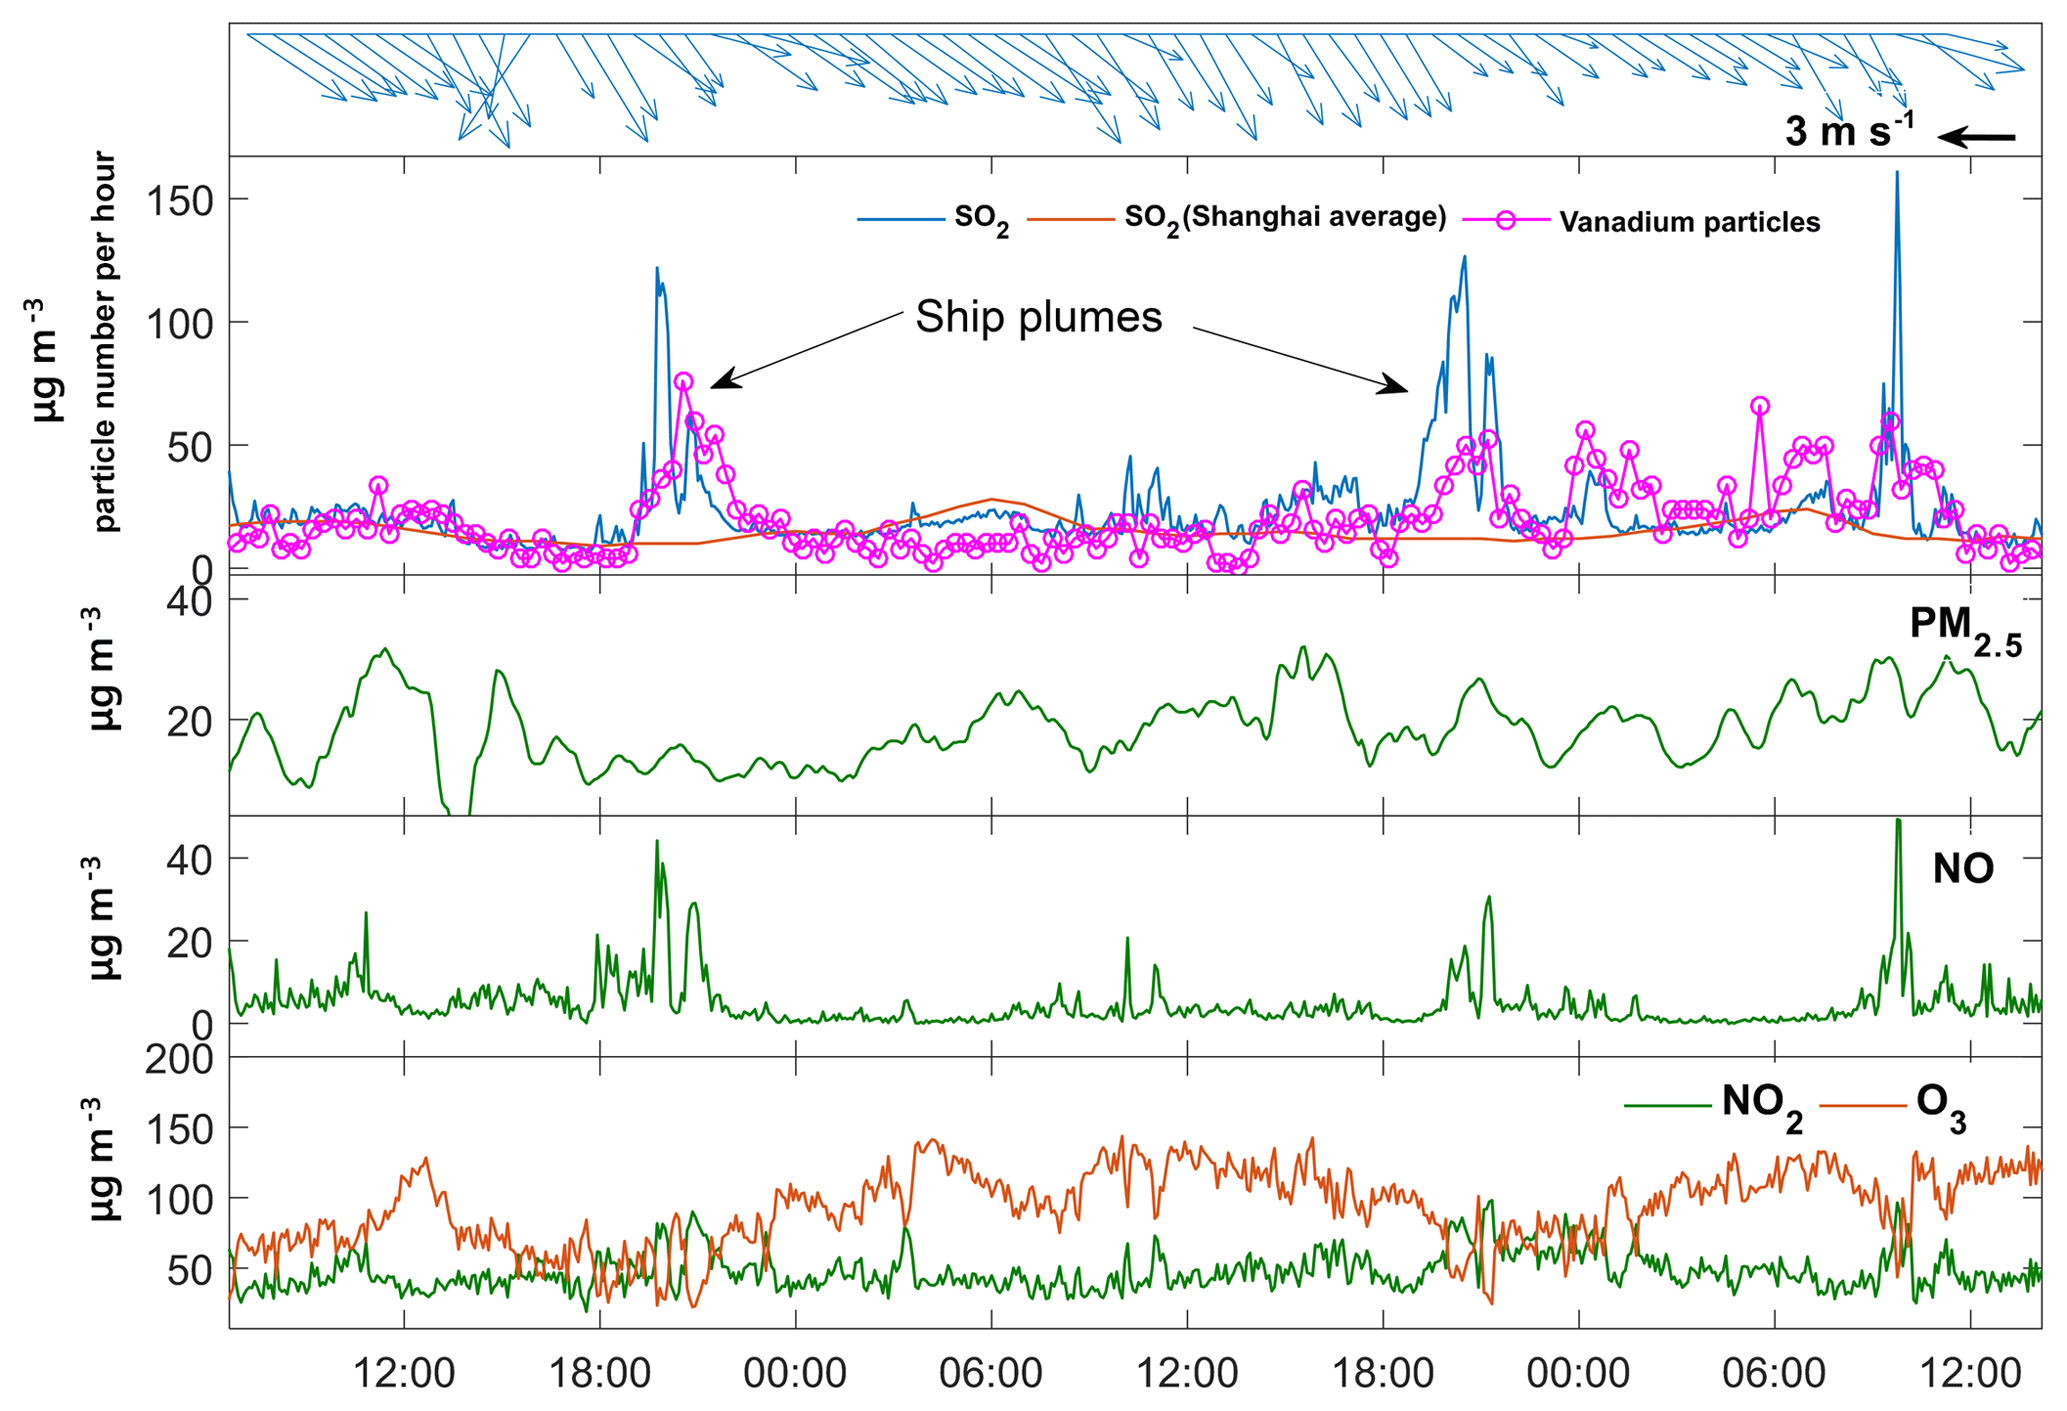
Figure 2Temporal concentration of pollutants – SO2, NO, NO2, O3 and PM2.5 – from 27 to 29 August 2016. The contemporary wind direction and speed and the SO2 concentration in Shanghai city are provided. The vanadium particle numbers detected by the SPAMS instrument are plotted in the upper panel using the same y axis scale as for SO2.
Considering these facts, the present study defines ship plume periods using SO2 concentrations and vanadium particle number concentrations. For SO2, a minimum threshold of µg m−3 was applied to indicate the arrival of ship plumes. Additionally, the number concentrations of vanadium particles (PNCv) were considered because in some cases the SO2 peaks were absent or obscure while the number concentrations of typical fresh vanadium particles were high. The probability of the occurrence of this kind of events was low (3 % of cases). These kinds of events were possibly caused by anchored ships burning low sulfur content oil (<0.5 % m∕m) to comply with regulations in the port region, which came into force on 1 April 2016; furthermore, the possibility that vanadium particles may have been emitted from industrial sources, such as petroleum refinery companies, in this region cannot be excluded. The wind directions during these events support both of the proposed causes. To identify plumes, we excluded the possible industry influences by limiting the prevailing winds to the port direction only. The present study set the threshold of vanadium particles in ship plumes to PNCv>25 particles h−1. Therefore, ship plumes were identified as either µg m−3 or PNCv>25 particles h−1.
Table 1Results of the statistical analyses of the pollutant concentration levels during the whole sampling period. Numbers are the average concentrations followed by the 25th and 75th quantiles in parentheses. The average pollution levels in Shanghai city during the same period are included for comparison.
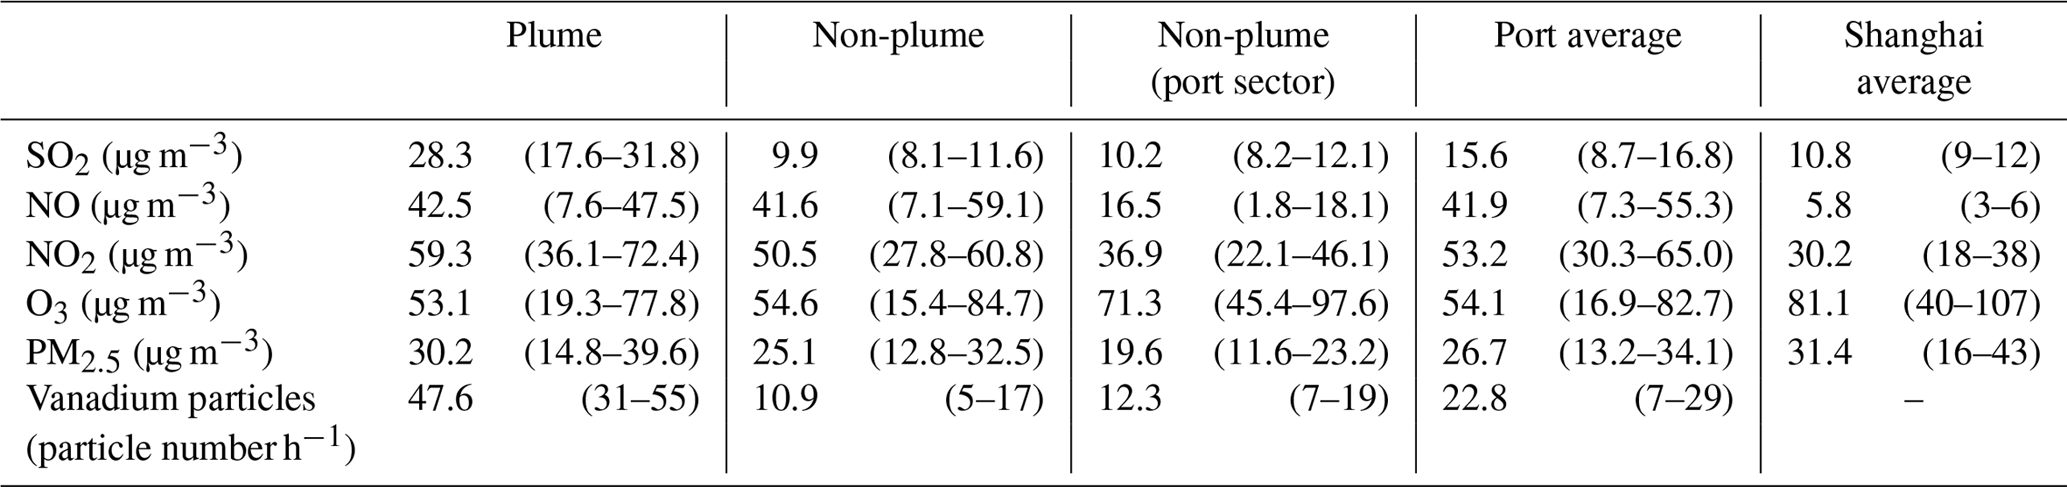
There were about 210 ship emission plumes captured during the entire study period. Table 1 summarizes the statistical analyses of the SO2, NO, NO2, O3 and PM2.5 concentrations at the port site and in an urban area in Shanghai during the study. Vanadium particle number concentrations were represented by the particle detecting velocity measured using the SPAMS instrument. The SPAMS particle detecting velocity values were positively correlated with particle concentrations in the ambient atmosphere, but should not be interpreted as absolute number concentrations without correction for SPAMS efficiency (Wenzel et al., 2003). Statistical analyses were performed on pollution concentrations during both plume and non-plumes periods. To separate the influences from land-based sources, non-plume periods during winds from the direction of the port are calculated in Table 1.
Generally the concentrations of SO2 and NOx at the port site were 40 %–70 % higher than in Shanghai city (Table 1). The SO2 concentrations in non-plume periods were comparable with those in Shanghai city, irrespective of the wind direction; therefore, the non-plume SO2 concentration can be recognized as background SO2 in this area. Conversely, the NOx concentrations showed an obvious dependence on wind direction during non-plume periods, with concentrations being higher when inland winds prevailed; this suggests the importance of land-based emissions at ports in coastal areas. In a similar ambient observation at Yangshan Port, Zhao et al. (2013) obtained average concentrations of 29.4 and 63.7 µg m−3 for SO2 and NO2, respectively, which were higher than the present levels of 15.6 µg m−3 for SO2 and 53.2 µg m−3 for NO2. Noting that SO2 and NO2 were only intermittently measured for about 20 d in the abovementioned study (May and August, 10 d each month), it is not feasible to make a direct comparison. During plume periods, the SO2 maximum hourly concentration in Yangshan (119.0 µg m−3) was close to that found in this study (124 µg m−3); due to land-based emissions, the NO2 maximum hourly concentration at Waigaoqiao Port (260 µg m−3) was higher than that reported at Yangshan Port (199.8 µg m−3).
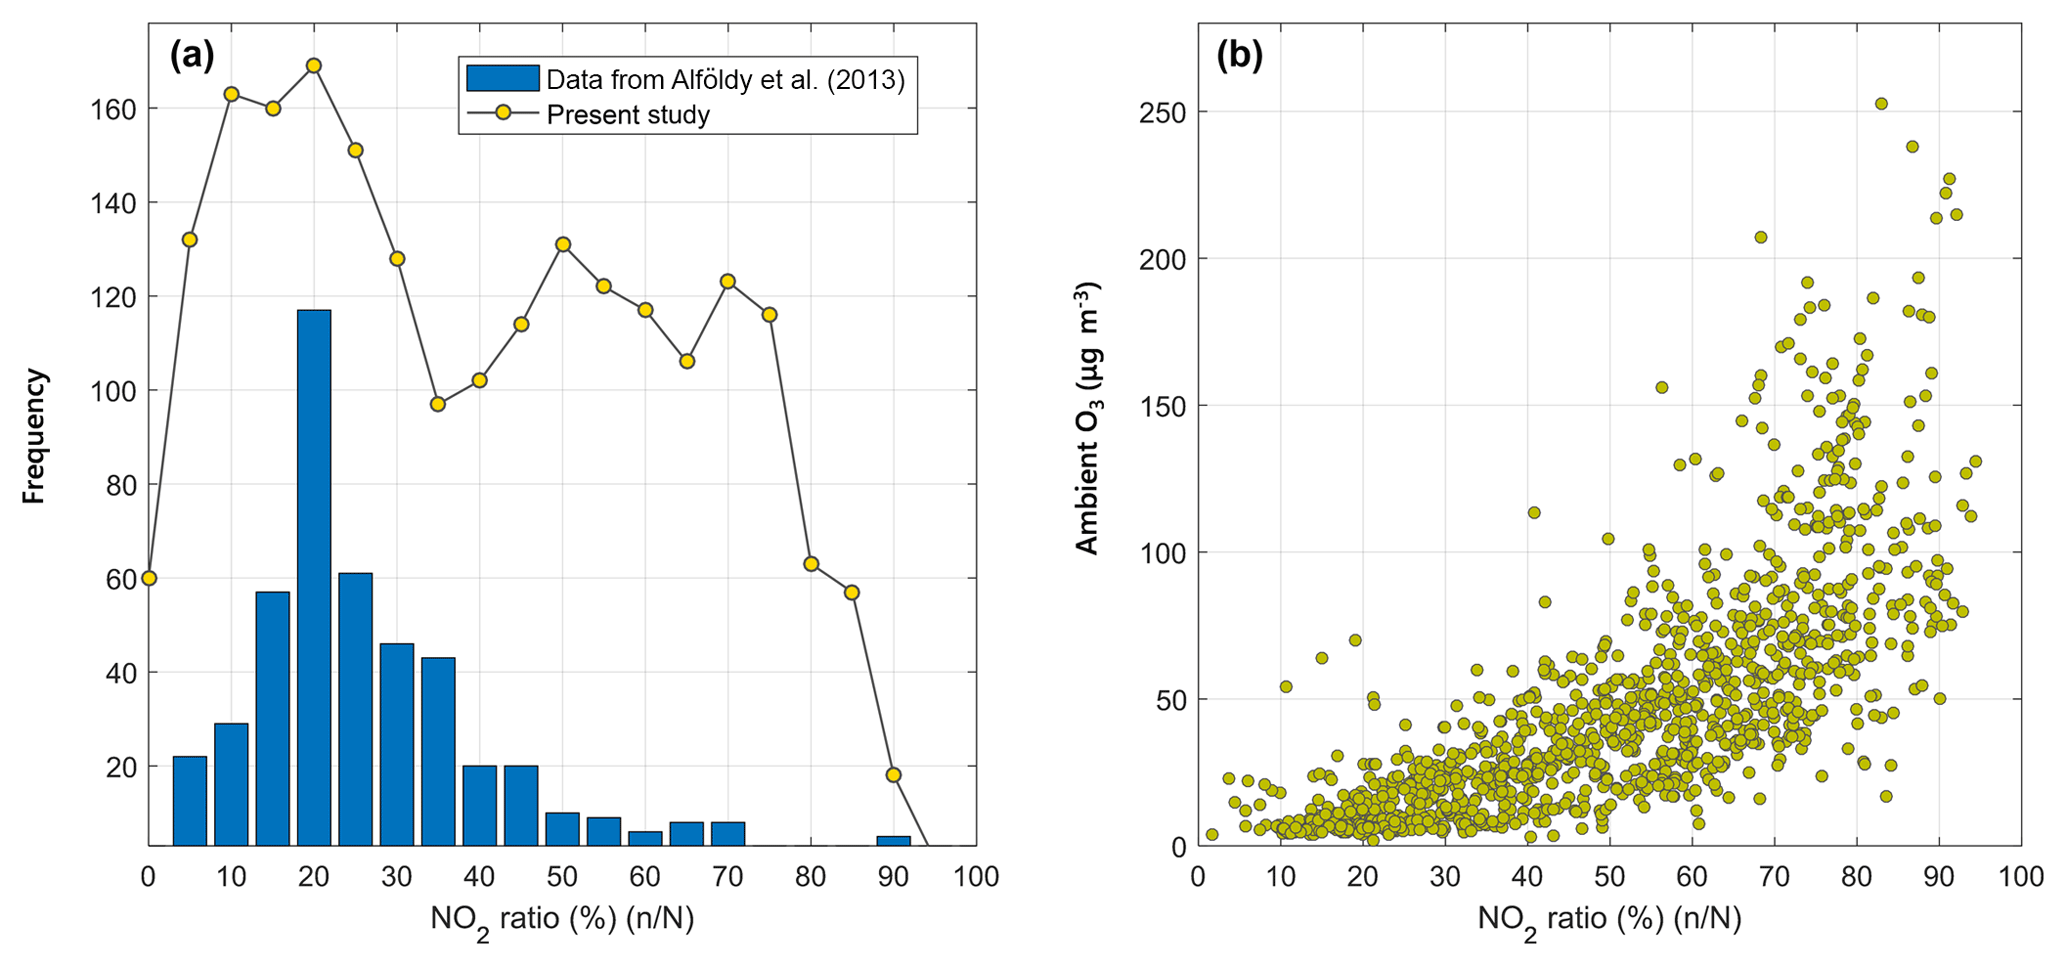
Figure 3The NO2 ratio distribution during plumes in this study and during a similar study (a), and a plot of the NO2 ratio against ambient O3 concentrations during plume periods (b).
In general the O3 concentrations at the port site were lower than Shanghai urban region by 13 %–33 %. To inspect whether the O3 depletion was related to the oxidation of primary NO emissions at the port site, we calculated the NO2 ratios to analyze the NOx composition in plumes. The NO2 ratio is defined as the ratio between NO2 and NOx (NO+NO2), and has been used in several relevant characterizations of ship emissions (Alföldy et al., 2013; Kurtenbach et al., 2016). Before the calculation of the NO2 ratio we firstly converted NO and NO2 mass concentrations to molar concentrations. The background NO and NO2 levels were then subtracted to make sure that peaks were due to plumes. The distribution of the NO2 ratio in this study is shown in Fig. 3, where it is compared to the NO2 ratio distribution from ship plumes in another similar study.
The distribution of the NO2 ratios in this study showed several modes. The largest mode occurred at a ratio of about 0.2 (20 %). Obviously this mode was also present in the comparison study (Alföldy et al., 2013), and was recognized as fresh engine emissions from ships. A major difference between the two studies is that a significant fraction of the NO2 ratios occurred in the larger range (>0.4) in the present study, which was not observed in Alföldy et al. (2013). The larger NO2 ratios were initially thought to be emitted from unidentified types of ships. When we correlated the NO2 ratio with ambient O3 concentrations, however, we found that there was an obvious positive correlation between them, as shown in Fig. 3a. This result suggests that the higher NO2 ratios of some plumes were not due to the emission characteristics of ships, but rather due to the transformation of NO to NO2 in the ambient air; hence, if the NO2 ratios in the plumes were high when the plume was discharged and no ambient transformation occurred, there would be no reason to expect the observed dependence of the NO2 ratios on the ambient condition of O3. This is evidence that primary NO emission (from ships or on-road traffic) contributed to the O3 depletion in this area.
With respect to particulate matter, the PM2.5 concentrations in the port area were slightly lower than in Shanghai city, although the PNCv in plumes were approximately 4 times higher than during non-plume periods (Table 1). A longer period of PM2.5 data suggested that the lower PM2.5 concentration is a general trend at this port site. However, this trend is not unique to port regions, and we also observed it in other coastal areas, such as in the PM2.5 spatial distribution for Shanghai (Fig. S4 in the Supplement): there was a general trend of decreasing PM2.5 concentrations from the inner to coastal areas in Shanghai. This fact is assumed to be caused by the dispersion or advection of clean air from the sea. The primary PM from ship emissions at the port site are mostly ultrafine particles with mass emission factors much smaller than NOx and SO2 (Zhang et al., 2017). Therefore, the primary PM from ships or other traffic could not contribute significantly to the ambient PM mass concentrations. The vanadium particle number fractions of the total particles in the SPAMS data were obviously larger (6.7 % on average) at the port site than in urban areas in Shanghai (1 %–2 %) (Liu et al., 2017).
3.2 Properties of particles from ship emissions
3.2.1 The discrimination of fresh and background ship emission particles at the port site
Using single-particle characterization, it is possible to separate fresh or `pure' ship emission particles from aged emission particles using particle signatures. The mass spectra, wind rose diagrams and size distributions of fresh and aged ship emission particles are displayed in Figs. 4, 5. The dominant peaks in the mass spectra of fresh ship emission particles include sulfate (), EC (, n are integers) and vanadium (51V+, 67VO+) peaks. These peaks reflected the major composition of fresh ship emission particles found using other techniques (Moldanová et al., 2013; Becagli et al., 2012; Murphy et al., 2009). Fresh ship emission particles produced a very low nitrate signal or no nitrate signal (−62NO3 in negative spectra) in the mass spectra, as commonly observed in combustion-source characterizations (Spencer et al., 2006; Toner et al., 2006). In aged particles the nitrate signals were stronger than for fresh particles. Except for the nitrate-related peaks (, ), other mass spectral patterns of fresh and aged ship emission particles were similar.
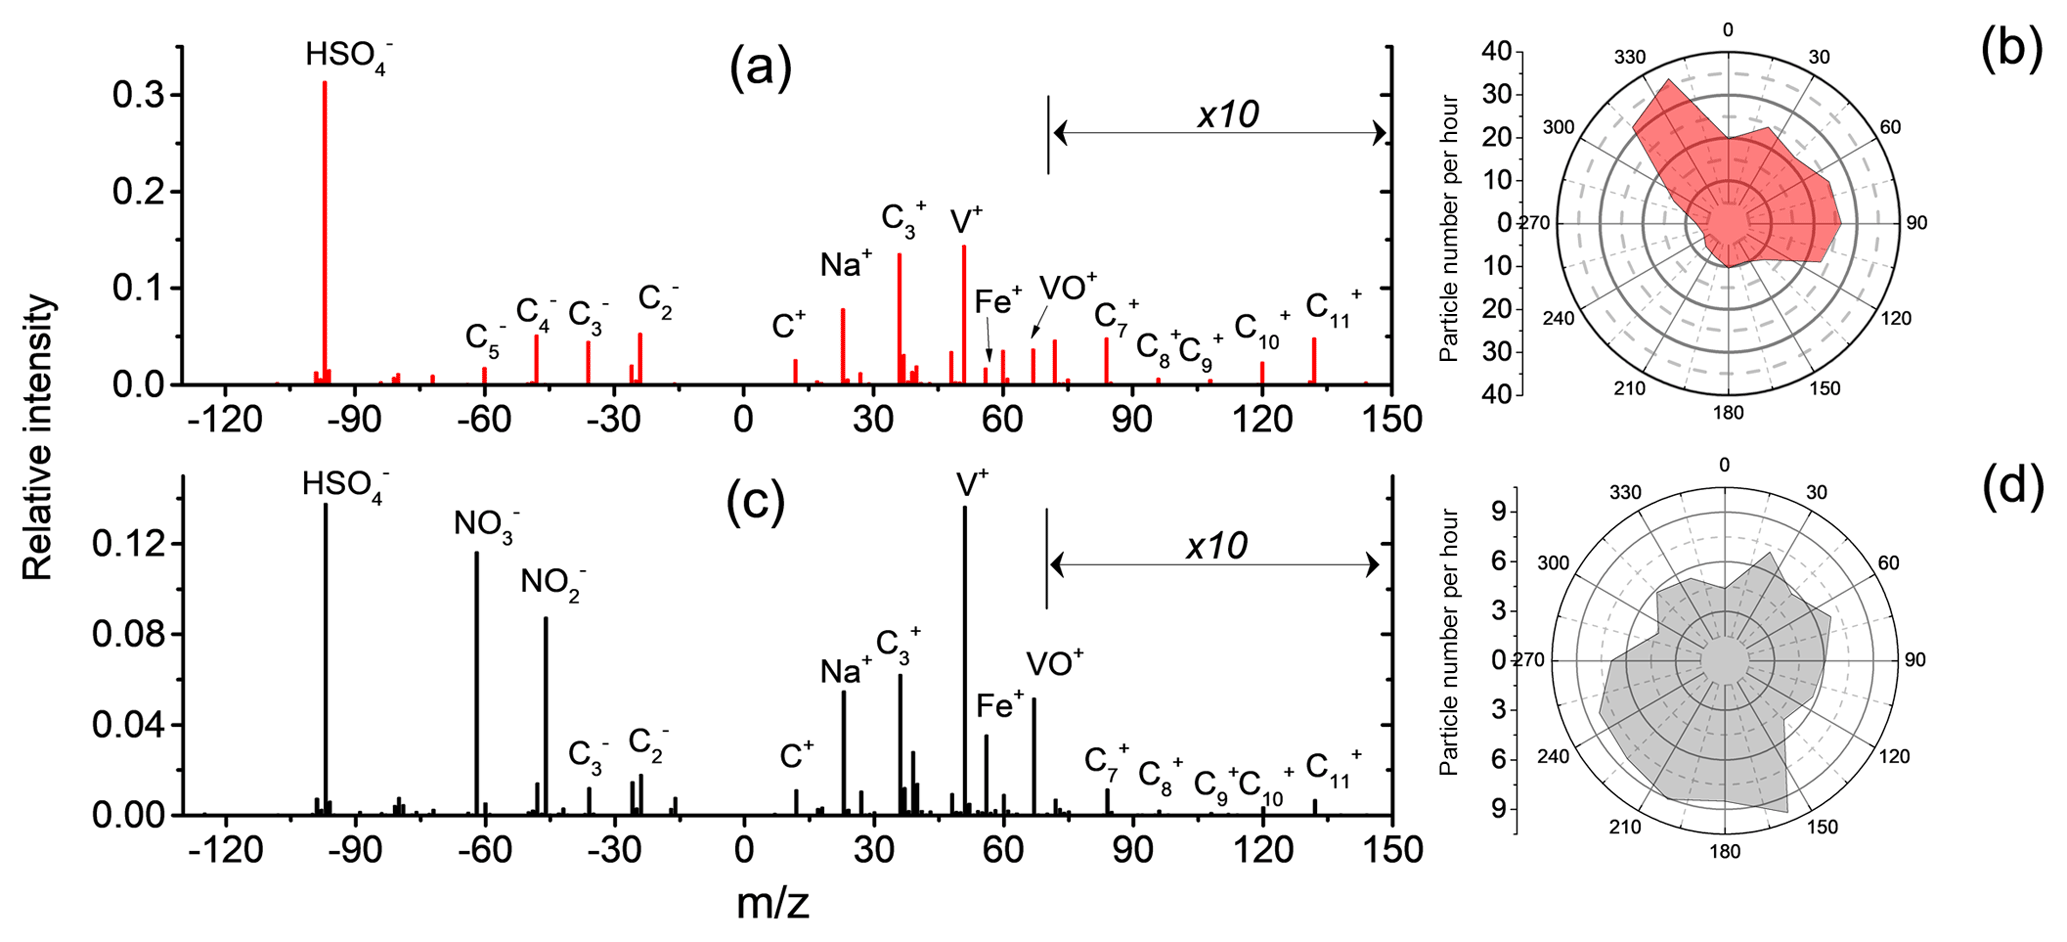
Figure 4Mean mass spectra of fresh and background ship emission particles in port (a, c); wind rose diagrams of the particle number concentration (in particle number per hour) of these two particle types (b, d). Peaks in the mass range of 70–150 u in panels (a) and (c) are magnified 10 times.
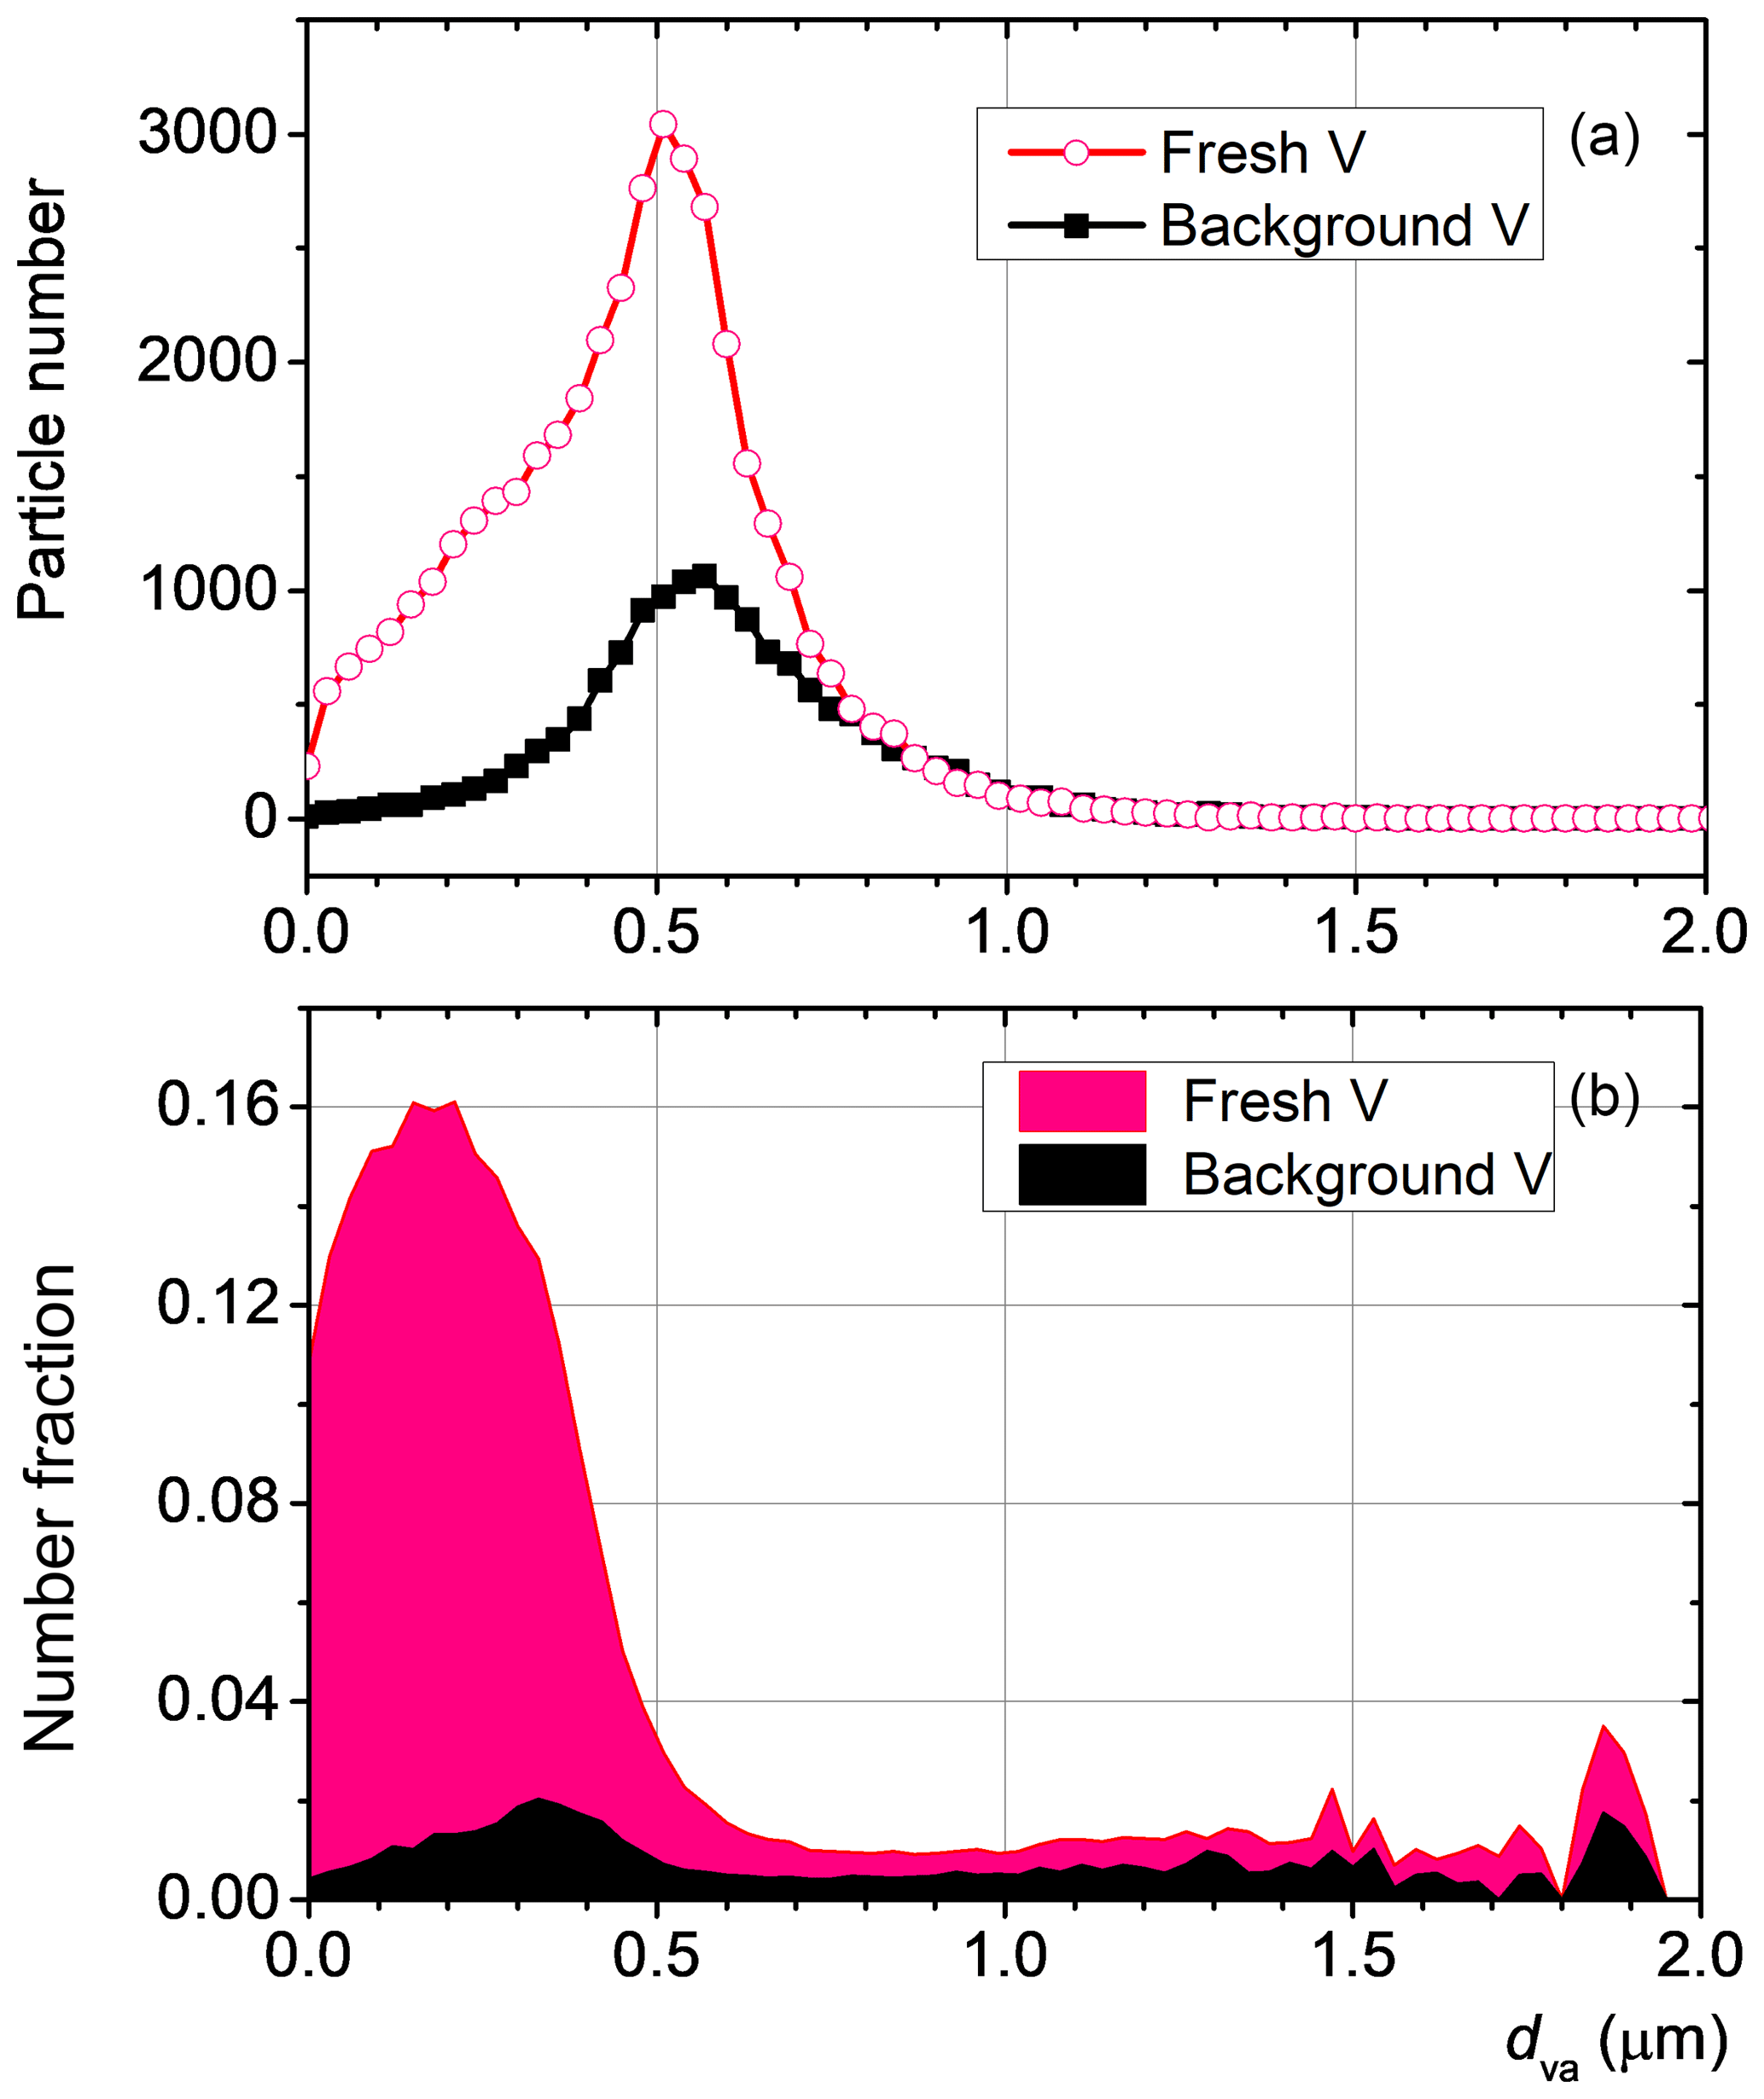
Figure 5Particle number size distribution of fresh and background ship emission particles from SPAMS, with the y axis representing the particle numbers detected at each size bin at constant sample flow during the entire study (a). The size distribution of the fresh and background ship emission particles normalized by total particles at each size (b).
Via the discrimination of ship emission particles into the two abovementioned types, we identified the different temporal patterns, wind rose diagrams and size distributions of ship emission particles at the port site (Fig. 4). The temporal variation of fresh ship emission particles showed many peak-shaped fluctuations, which were similar to and synchronized well with SO2 peaks (Healy et al., 2009; Ault et al., 2010). However, the number concentrations of aged particles were generally much lower than for fresh particles (20 % of the latter) and showed more stable temporal concentrations than fresh vanadium particles. We also analyzed the particle number concentrations of ship emission particles under different wind direction conditions. The results are displayed as wind rose diagrams for each particle type in Fig. 4. The differences between the wind roses of the two particle types were obvious. It is clear that fresh vanadium particles originated almost entirely from the direction of the port, and the wind rose results run nearly parallel with the riverbanks (300–0–120∘ sector). This is strong evidence that ships were the most predominant source of fresh vanadium particles at the port site. Aged vanadium particles, however, did not shown obvious favored wind directions and were uniformly distributed in all wind directions. Based on the described characteristics of vanadium particles, the present study assumed that the aged vanadium particles were background particles that had undergone atmospheric processing at the local or regional scale. The background vanadium particles may have been emitted from other places, with their source origins not being restricted to the current port. The size distributions of fresh and background vanadium particles are shown in Fig. 5. Fresh vanadium particles dominated the particle numbers in the smaller size range (<0.4 µm), where aged or background particles contributed only minor fractions. Although the detection efficiency of the SPAMS instrument declines in this size range, a significant number of ship emission particles were still detected. The explanation for this is that this fraction of particles was made up of non-spherical fractal agglomerates, which have cross sections that are larger and reflect laser light; thus, they can be detected by the SPAMS instrument. The non-spherical fractal shape of fresh vanadium particles was observed as soot particles from fresh combustion sources. Similar observations have been reported from other studies that have used the SPAMS instrument in the ultrafine size range (Ault et al., 2010).
3.2.2 Particle types in fresh ship emission plumes
After the separation of background particles, we analyzed the mass spectral signatures of fresh ship emission particles using the ART-2a algorithm. These particles were grouped into four major types based on the similarity of their composition. Temporal variations, composition and size distributions were analyzed to obtain further information regarding these particle groups; this information will be helpful in particle source identification at other sites. The four particle types were labeled V–OC, V–EC, V–EC–Fe and V–Ash according to their characteristic composition, and their averaged mass spectra are shown in Fig. 6. The negative mass spectra of the four types were similar in that the peak was dominant in addition to other negative EC peaks, which is consistent with the elevated SO2 concentrations in plumes. The major differences in the four particle types were found in the positive mass spectra, as depicted in Fig. 6. Generally the V–OC group were characterized by dominant organic peaks including , and C2H3O+, with insignificant EC peaks. Generally the organics are ionized with low efficiency in the SPAMS (Ulbrich et al., 2009). The rich organic signals of V–OC particles indicate that they were mainly composed of organics in engine exhaust plumes (Lack et al., 2009; Moldanová et al., 2013). Due to the low ionization efficiency of organics, the particle numbers of V–OC in plumes were generally low compared with other groups, which inappropriately reflected the dominance of organic compositions in ship emission particles (Lack et al., 2009). V–EC particles produce dominant EC peaks from to and metal peaks for V and Na, but without iron peaks (Fe+). This group is also the most abundant type of all vanadium particles. The V–EC–Fe group is similar to the V–EC group except for the addition of Fe+ and Ca+; Ni+ peaks also occur in this group, but have lower occurrence frequencies. The V–Ash particles produced minor or no EC peaks except for some metal peaks for V, Fe and Ni in the positive spectra. These metals are used as lubricant additives or are inherently present in RFO; therefore, their presence in ship emission particles is expected and is commonly found (Becagli et al., 2012; Moldanová et al., 2013).
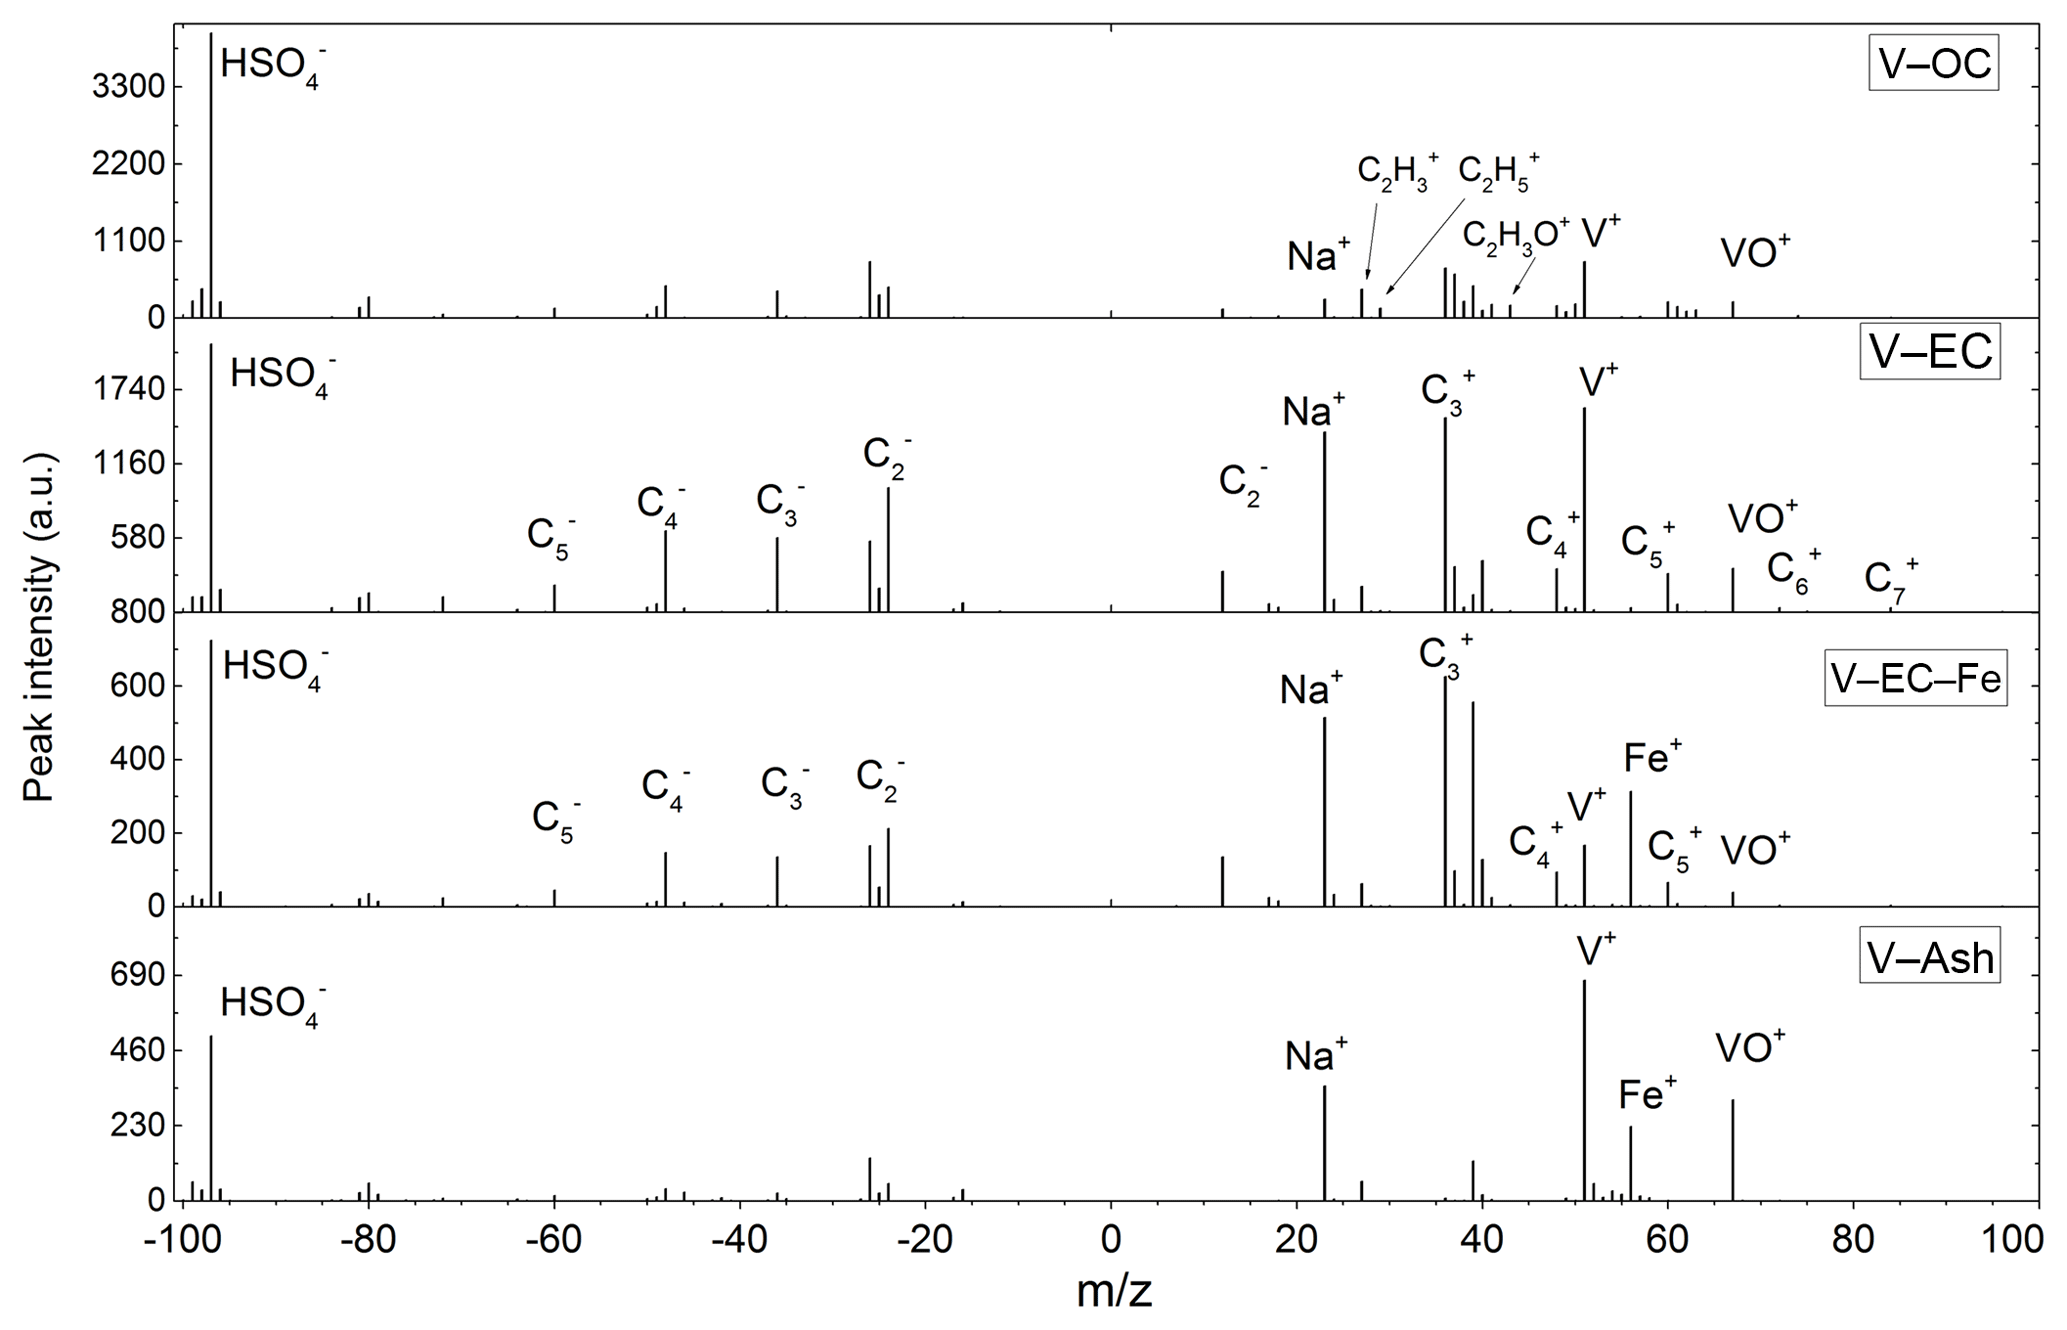
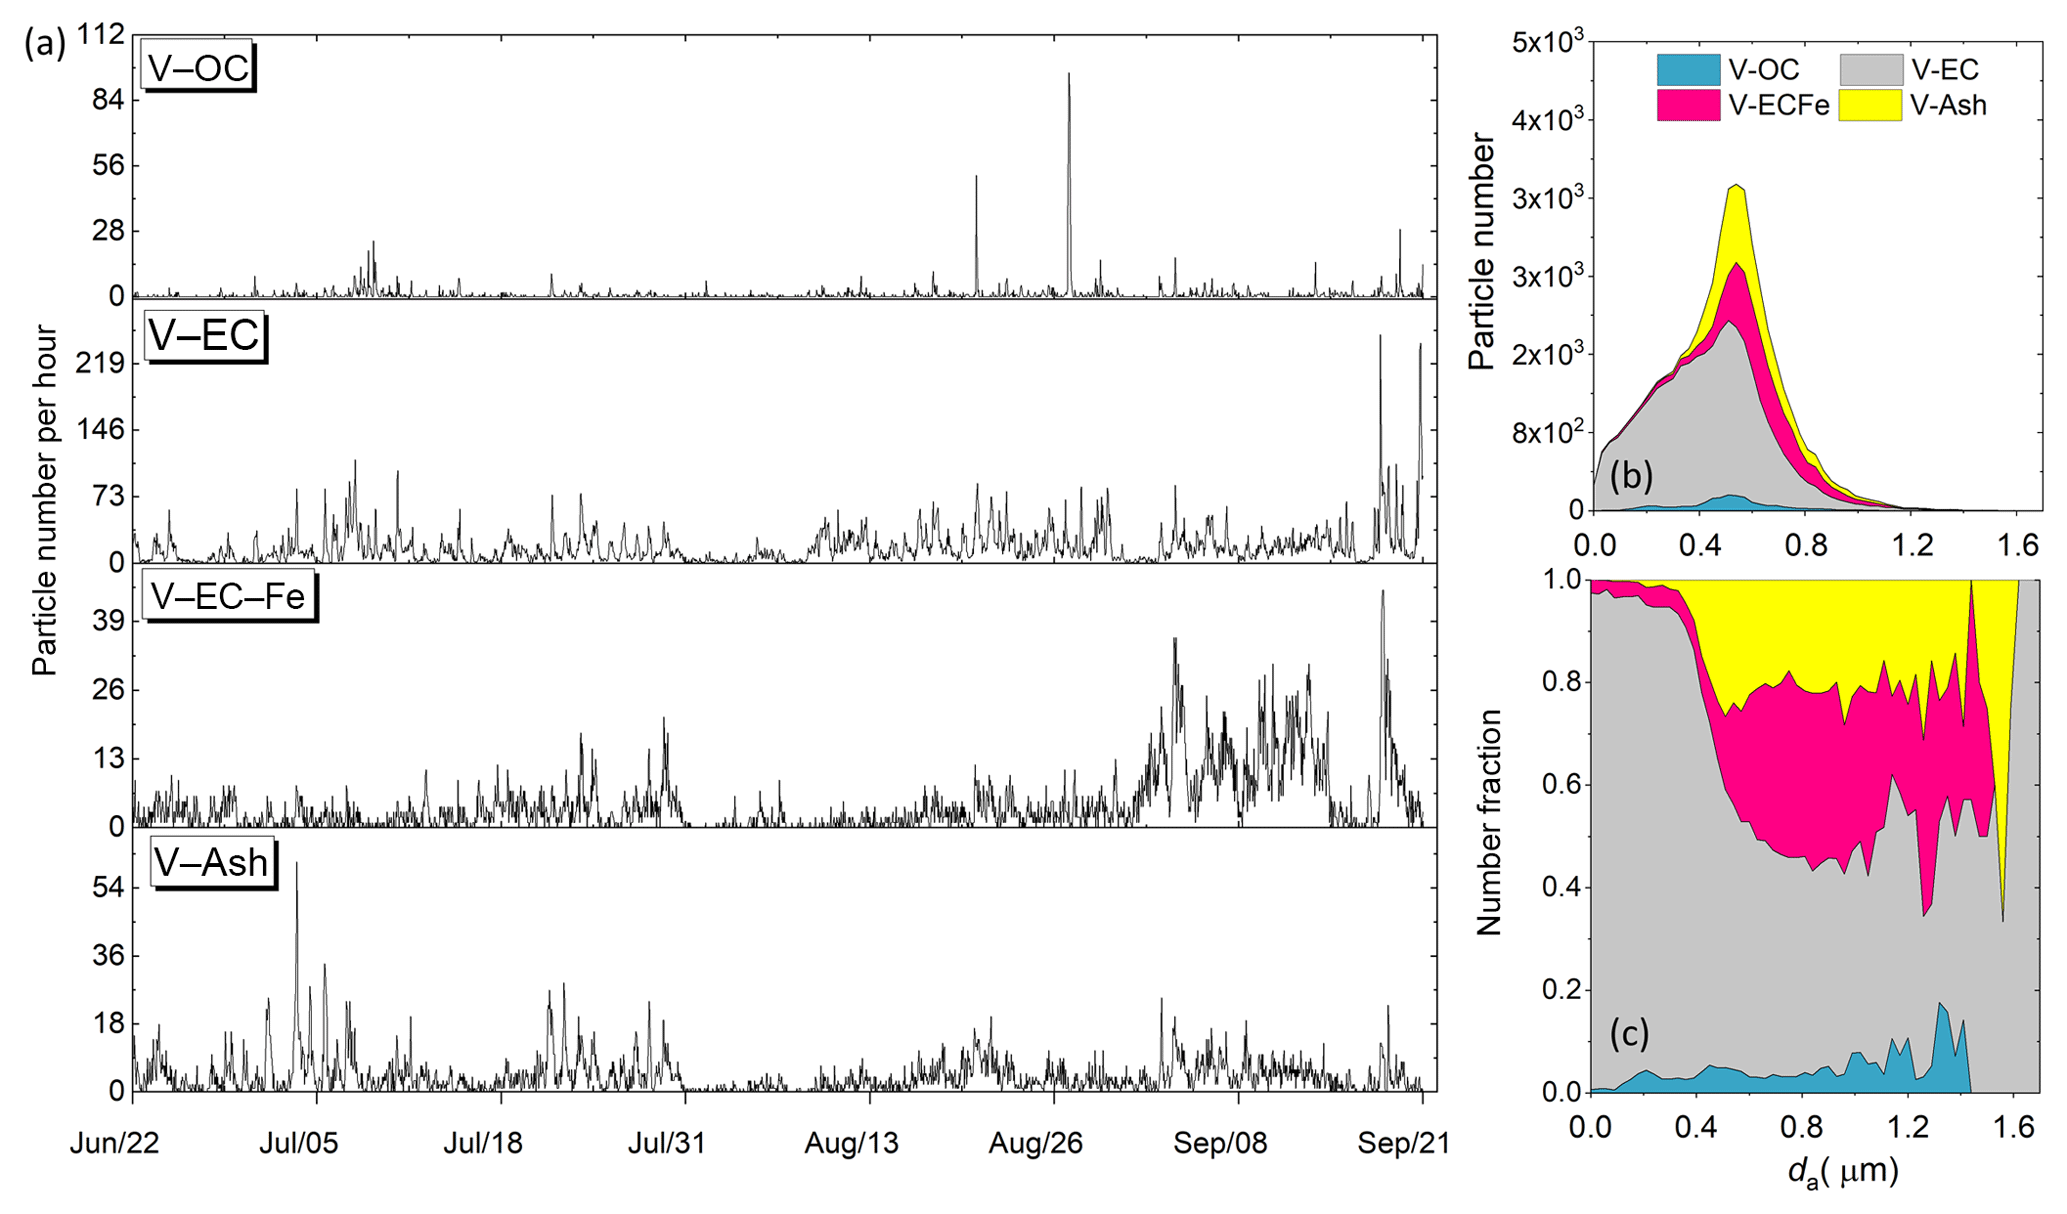
Figure 7Temporal trends of particle numbers detected per hour by SPAMS for the four fresh vanadium particle types (a). The number–size distribution of the four particle types, with the y axis representing the particle numbers detected at each size bin at constant flow during the entire study (b). Panel (c) is obtained by normalizing the particle numbers of the four types to give their relative contributions at each size.
Temporal concentrations and size distributions of the abovementioned particle types are shown in Fig. 7. The temporal concentrations of these particle types displayed daily variations, with higher concentrations at daytime than at night, and were poorly correlated (R2<0.4), suggesting that they were emitted differently. As these particles were detected in the port environment, they were assumed to have been emitted by ships with different engine types or modes of operation. The V–OC particles, although they had low ionization probabilities, were found to concentrate in certain plumes. As information on individual ships is not yet available, it is not possible to link V–OC particle plumes to specific ship types. The V–OC particles concentrated in specific ship emission plumes (Fig. 7) and their number concentration peaks were usually narrower (∼1 h) than for the other particle types (3–5 h). The sizes of the V–OC particles were more uniformly distributed compared with the other three types (Fig. 7). Similar organic-rich particles have also been identified from ship exhaust using another technique (Moldanová et al., 2013).
V–EC particles dominated the particle numbers in ship plumes in this study. Compared with the other particle types, their sizes enriched in the smaller size ranges (<0.4 µm), which is a typical characteristic of soot particles from the combustion of RFO (Moldanová et al., 2013). V–Ash particles, which were most probably ash spheres from the combustion process of inorganic constituents in RFO and lubricants, were mainly detected in the larger size range (>0.4 µm; Fig. 7). The SPAMS instrument measures the particle aerodynamic size, which is determined by both particle size and density. The larger densities of metal oxides or salts in V–Ash particles, compared with soot agglomerates, also contribute to their size distribution. The origin of V–EC–Fe particle types was probably the result of internal mixing between V–EC and V–Ash particles. Their size distribution was more similar to V–Ash particles.
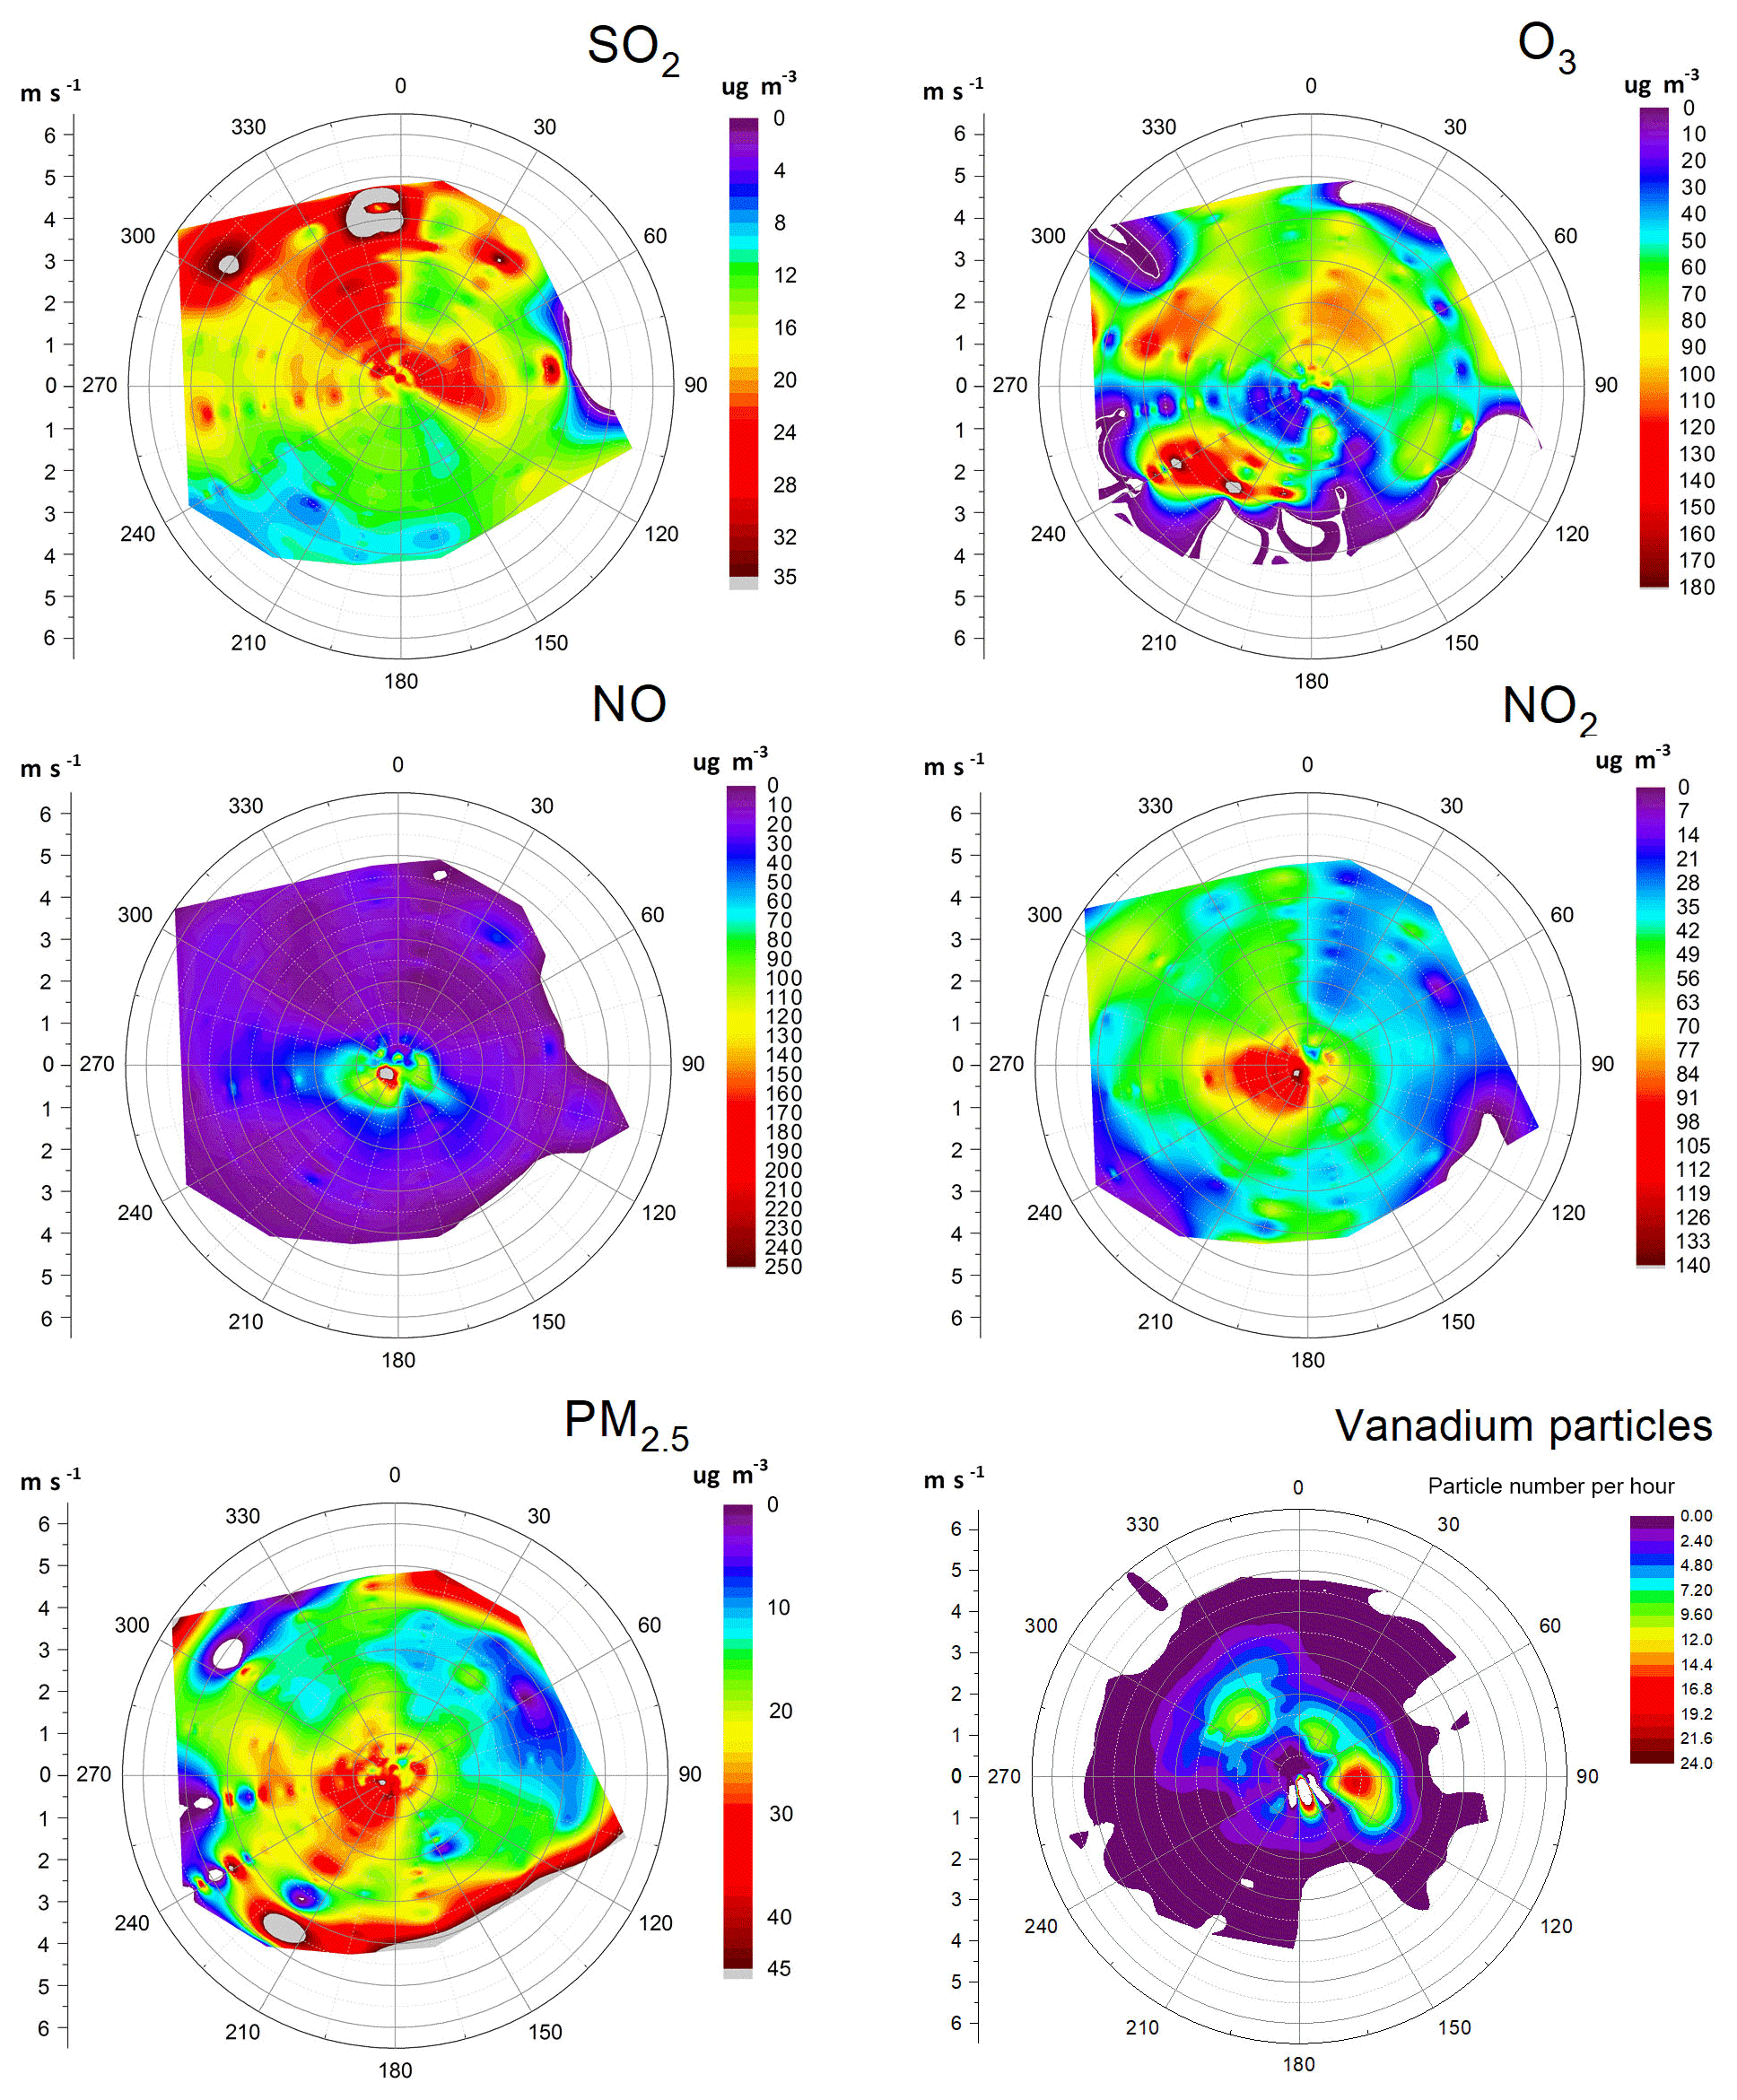
Figure 8Pollution wind roses of SO2, NO, NO2, O3, PM2.5 and vanadium particles during the whole study period. The vanadium particle wind rose is based on the number concentration as measured by the SPAMS instrument.
Table 2Contributions of ship emissions to ambient pollutants SO2, NO, NO2, O3, PM2.5 and vanadium particles in the port area. Calculations are based on two situations: the entire sampling period (all wind directions included) and periods when the site is downwind of port emissions. The total lengths (in hours) of respective periods are given in the footnote.
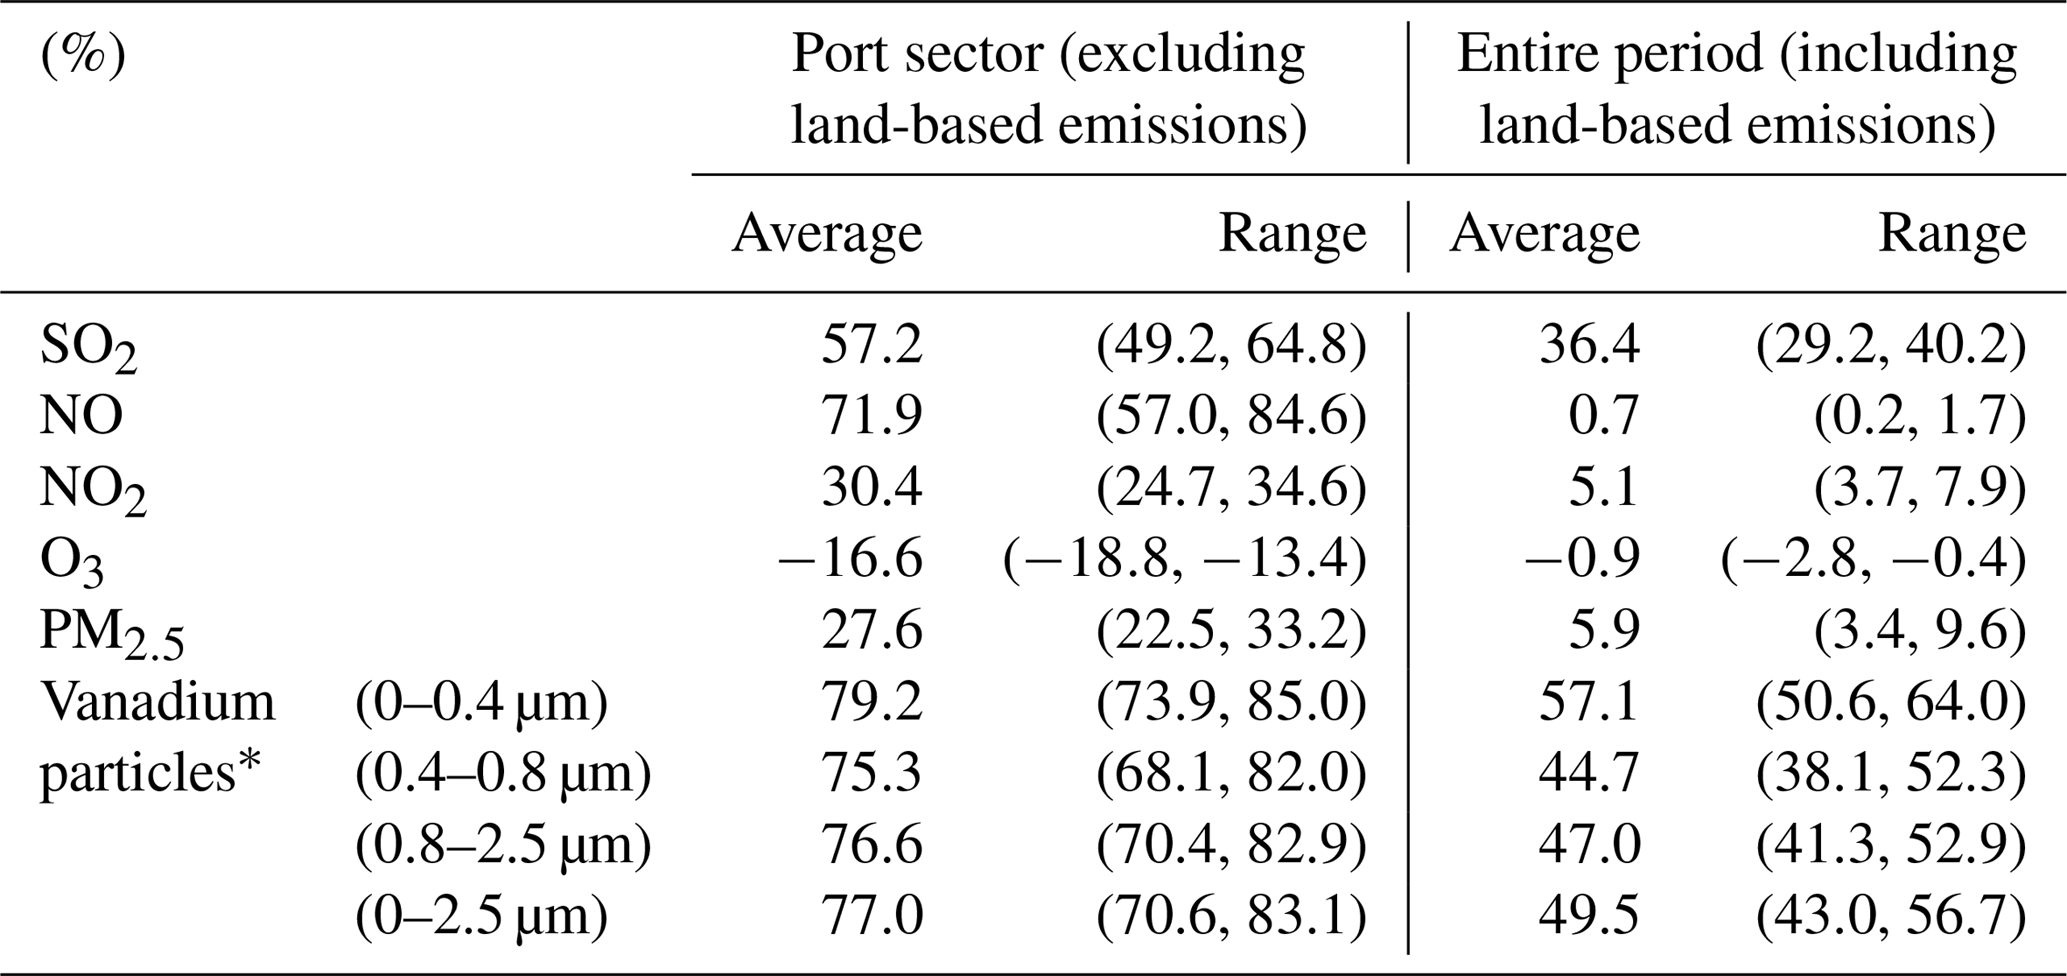
Length of sampling periods (in hours): entire period – 2256 h; port sector – 1136 h; plume conditions – 694 h; non-plume conditions – 1563 h; non-plume conditions (port sector) – 625 h. ∗ Particle number contribution.
3.3 The contribution of ship emissions to ambient pollutants in the port area
For a coastal port, the evaluation of ship emission impacts on air quality needs to identify the affects of land-based emissions. Obviously these land-based emissions have greater influences on the air quality at the port site than a marine location far from coast (Zhao et al., 2013). To provide an intuitive illustration, the averaged concentrations of SO2, O3, NO, NO2, PM2.5 and vanadium particle numbers under different wind direction conditions are summarized in Fig. 8. The concentrations of pollutants have demonstrated a varied dependency on the local wind conditions. It is evident that, for the coastal port site in this study, the NOx and PM2.5 concentrations were highest when wind from inland directions prevailed. Conversely, the SO2 concentrations and vanadium particle numbers were only dominant when winds originated from port sectors. The hotspots in the wind rose for vanadium particles were most probably produced by individual docks along the riverside. The wind dependence of O3 concentrations was less apparent, except for its depletion in regions with high NOx and SO2 levels in the wind roses, as previously explained. Obviously the port site received very different pollution impacts from land-based emissions and ship-based emissions in port. This study tries to separate land-based emission influences by limiting the wind directions solely to port directions. In the calculation of ship emission contributions, two reference periods were considered: the entire study period (irrespective of wind) and periods when the site was downwind of the port.
Ship emission contributions of air pollutants in the two reference periods are summarized in Table 2. Results show that, if land-based emissions are considered, ship emissions contributed 36.4 % of the SO2 concentration in local air in the port area, which is a much higher value than for NO (0.7 %), NO2 (5.1 %) and PM2.5 (5.9 %). The low contributions of NOx were due to the inclusion of traffic emissions with stronger intensities from inland directions. The main sources of NOx from the inland directions were considered to be not far from the site because the average NOx levels in Shanghai city are lower than those at the port site, as evidenced in Table 1. For the vanadium particle number concentrations (PNCv), ship emissions were the predominant source at the study site (49.5 %). The PNCv contribution is a lower estimation considering that the SPAMS instrument detects smaller particles less efficiently, which is the size range in which vanadium particles tend to concentrate. Contributions of PNCv in different particle size ranges are also shown in Table 2. In both of the reference periods (excluding or including land-based emissions), ship emission contributions to PNCv in the smaller size range (0–0.4 µm) are larger than contributions to PNCv in the larger size ranges (0.4–0.8 and 0.8–2.5 µm).
The relative contribution of PNCv from ship emissions is apparently higher than that of PM2.5 regarding the mass concentration. Previous studies have shown that the direct PM2.5 contribution from ship traffic lies within the range of 1 %–8 % (Contini et al., 2011, 2015). Recent studies carried out in the Mediterranean region found that ship emissions contributed 0.3 %–7.4 % to PM2.5 concentrations in port areas (Merico et al., 2016). Ship emission studies in Europe and other regions were reviewed, and it was concluded that shipping traffic contributions to PM2.5 were in the range of 1 %–14 %, with higher contributions with decreasing particle size (Viana et al., 2014). The calculated value of PM2.5 at the present study site is within the reported ranges. Recently, Merico et al. (2017) compared ship traffic atmospheric impacts using inventories, experimental data and modeling approaches in the Adriatic–Ionian port areas and found that ships contributed 0.5 %–7.4 % of PM2.5 in these areas. The same study also found that the ship traffic contribution to the particle number concentrations (PNC) is 2–4 time larger than the mass concentrations of PM2.5. The PNC is not measured in this study, instead the size distributions and PNC contributions of vanadium particles of different sizes are utilized (as measured by SPAMS), and apparently agree with the abovementioned previous research.
In a study carried out at the Yangshan marine port in Shanghai, the calculated PM2.5 contribution (∼4 %) was found to be smaller than in the present study (5.9 %) (Zhao et al., 2013). In this study a different method was used to evaluate ship emissions, with vanadium concentrations being relied upon to indicate ship emissions. Considering the differences in methodology, it is deemed that the results from the two studies are similar within the uncertainty range (Table 2). A previous estimation in the Shanghai area using an inventory method showed that ship emissions contributed 9 % of NOx and 5.3 % of PM2.5 in the Shanghai area (Zhang et al., 2017), which generally agrees with this study when land-based emissions are included (Table 2). However, for SO2 the estimated contribution of 12 % is significantly smaller than the 36.4 % found in this study. The high SO2 levels in this study are a local character of the port site, which is close to emission sources. After being transported to the urban region, the high SO2 concentrations dissipate and weaken. It is noted that the synchronized SO2 and vanadium particle plumes, as observed at the port site, are observed at a much lower frequency at an urban site in Shanghai city, where another SPAMS instrument is located. An estimation of ship emission impacts on the urban area will be the subject of future studies.
By limiting the analysis to periods when the winds originated from port directions, the influences of land-based emissions could be largely eliminated. As shown in Table 2, the ship emission contributions for all pollutants were magnified considerably in amplitude. The most significant variation occurred for gaseous NOx, as the contributions of this species from ship emission increased to levels larger or comparable with SO2. Contributions obtained here can be compared with a similar study carried out in a European port (Merico et al., 2016). Gaseous emissions of NO, NO2 and SO2 were similar between these two studies, which is impressive considering the larger throughput of goods in Shanghai Port. However, in an absolute sense, this study estimated that ship emissions contributed 5.68 µg m−3 of SO2, 3.00 µg m−3 of NOx and 1.57 µg m−3 of PM2.5 during the sampling period. These values are comparable or higher than the reported results for ports in other regions (Viana et al., 2014). For example, a previous study found that the ship-emitted particles contributed 0.8 µg m−3 of primary particles and 1.7 µg m−3 of secondary particles in Algeciras Bay (Viana et al., 2009). Due to the fact that the study site is adjacent to the port, the calculated PM2.5 contribution could be largely deemed as primary contributions in this study. The relative contributions of pollutants are partly compensated for by the higher background pollution levels in this region.
In the summer of 2016, we conducted an experimental study to characterize and quantify ship emissions at the Shanghai Port. Obvious ship emission plumes were detected at the port site using the online measurement of gaseous and particulate matter pollution. During plumes the SO2 and vanadium particle concentrations demonstrated well synchronized peaks, which could be reliably used to indicate the arrival of ship emission plumes. Statistical analysis of pollutants during plumes showed that the concentrations of SO2 in plumes were about 3 times higher than the background concentrations. Except for during plume periods, the SO2 concentrations at the port site varied with the background SO2 level at the regional scale. NOx emissions from ships were also obvious during plumes, however, NOx concentrations at the port site were under much stronger influences from land emissions. With respect to particulate matter, primary ship emissions produced dominant vanadium particle number concentrations (PNCv) at the port site, whereas the ship emission contribution to the mass concentrations (PM2.5) was less significant. Regarding other pollutants, O3 was depleted by elevated levels of primary NOx and SO2 from emissions in port regions, resulting in 11 %–33 % O3 consumption compared with an urban region of Shanghai.
Particle size distributions and the chemical composition of individual ship emission particles were characterized using a SPAMS instrument at the same study site. Similar to SO2, the ship emission particles at the port site could also be grouped into freshly emitted and background particle types. The mass spectra of fresh ship emission particles contained dominant peaks of EC, sulfate and trace metals (V, Ni, Fe and Ca). The size distribution of ship emission particles showed that they tended to concentrate in the smaller size range (<0.4 µm), which was most probably composed of fractal black carbon agglomerates. Based on the different chemical compositions of ship emission particles, the ship emission particles during plumes could be grouped into four major types: V–OC, V–EC, V–EC–Fe and V–Ash. These particle types were shown to have different temporal and size distribution trends, which was a manifestation of the complexity of ship emissions in a large, busy port.
The emission contributions from ships to local air quality in the Shanghai Port area were quantified by extracting pollutants during plume periods from background levels. Ship emission contributions were evaluated using two scenarios: land-based emission sources were either included or excluded. Results showed that ship emissions were a major contributor to the ambient SO2 (5.68 µg m−3, 36.4 %) and vanadium particle concentrations (49.5 %) at the port site. The NOx contribution (3.00 µg m−3, 5.8 %) from shipping emissions was insignificant compared with emissions from land-based sources, which were mainly from the transportation sector. If land-based sources were excluded, the relative shipping contributions of NOx became comparable to those of SO2. Due to the high NOx and SO2 levels in this area, a fraction of the local O3 concentration was found to be depleted. Primary particles from ship emissions were estimated to contribute 5.9 % (1.57 µg m−3) to the PM2.5 concentration during the sampling period. With respect to the particle number concentration (PNC), over 44 % of the vanadium particle numbers (PNCv) at the port site were found to be contributed by ship emissions. The PNCv contributions from ship emissions were found to increase with decreasing particle size, with 57 % of vanadium particles smaller than 0.4 µm found to be emitted from ship emissions. As the size and mass of fresh exhaust particles are small, the primary mass concentrations from ships would be inappropriate to represent their real mass contribution after atmospheric aging. This study supports the fact that particle number concentrations be included in the characterization of primary emissions from ships.
Data are available upon request from the corresponding author: qingyanf@sheemc.cn.
The supplement related to this article is available online at: https://doi.org/10.5194/acp-19-6315-2019-supplement.
QF, XW and YS designed the experiment; XW, YS and JP conducted the experiment. The SPAMS data were analyzed by XW and ML; other data were analyzed by XW, YZ and YL. The paper was prepared by XW, QF and PKKL.
The authors declare that they have no conflict of interest.
The content of this paper does not necessarily reflect the views and policies of the HKSAR Government, nor does mention of trade names or commercial products constitute an endorsement or recommendation of their use.
This article is part of the special issue “Shipping and the Environment – From Regional to Global Perspectives (ACP/OS inter-journal SI)”. It is a result of the Shipping and the Environment – From Regional to Global Perspectives, Gothenburg, Sweden, 23–24 October 2017.
We thank the Shanghai East Container Terminal Co., Ltd. (SECT) for their valuable aid during observations, and Shanghai Environmental Monitoring Technology and Appliance Ltd. for instrument maintenance services during the campaign.
This work was supported by the National Key R&D Program of China (grant no. 2018YFC0213800), the Shanghai Science and Technology Committee (STCSM) projects (grant nos. 15DZ1205402, 17DZ1203100 and 16DZ1204600), and the National Natural Science Foundation of China (grant nos. 21677038 and 21607056).
This paper was edited by Andreas Petzold and reviewed by two anonymous referees.
Alföldy, B., Lööv, J. B., Lagler, F., Mellqvist, J., Berg, N., Beecken, J., Weststrate, H., Duyzer, J., Bencs, L., Horemans, B., Cavalli, F., Putaud, J.-P., Janssens-Maenhout, G., Csordás, A. P., Van Grieken, R., Borowiak, A., and Hjorth, J.: Measurements of air pollution emission factors for marine transportation in SECA, Atmos. Meas. Tech., 6, 1777–1791, https://doi.org/10.5194/amt-6-1777-2013, 2013.
Ault, A. P., Moore, M. J., Furutani, H., and Prather, K. A.: Impact of Emissions from the Los Angeles Port Region on San Diego Air Quality during Regional Transport Events, Environ. Sci. Technol., 43, 3500–3506, https://doi.org/10.1021/es8018918, 2009.
Ault, A. P., Gaston, C. J., Wang, Y., Dominguez, G., Thiemens, M. H., and Prather, K. A.: Characterization of the Single Particle Mixing State of Individual Ship Plume Events Measured at the Port of Los Angeles, Environ. Sci. Technol., 44, 1954–1961, https://doi.org/10.1021/es902985h, 2010.
Becagli, S., Sferlazzo, D. M., Pace, G., di Sarra, A., Bommarito, C., Calzolai, G., Ghedini, C., Lucarelli, F., Meloni, D., Monteleone, F., Severi, M., Traversi, R., and Udisti, R.: Evidence for heavy fuel oil combustion aerosols from chemical analyses at the island of Lampedusa: a possible large role of ships emissions in the Mediterranean, Atmos. Chem. Phys., 12, 3479–3492, https://doi.org/10.5194/acp-12-3479-2012, 2012.
Buffaloe, G. M., Lack, D. A., Williams, E. J., Coffman, D., Hayden, K. L., Lerner, B. M., Li, S.-M., Nuaaman, I., Massoli, P., Onasch, T. B., Quinn, P. K., and Cappa, C. D.: Black carbon emissions from in-use ships: a California regional assessment, Atmos. Chem. Phys., 14, 1881–1896, https://doi.org/10.5194/acp-14-1881-2014, 2014.
Cappa, C. D., Williams, E. J., Lack, D. A., Buffaloe, G. M., Coffman, D., Hayden, K. L., Herndon, S. C., Lerner, B. M., Li, S.-M., Massoli, P., McLaren, R., Nuaaman, I., Onasch, T. B., and Quinn, P. K.: A case study into the measurement of ship emissions from plume intercepts of the NOAA ship Miller Freeman, Atmos. Chem. Phys., 14, 1337–1352, https://doi.org/10.5194/acp-14-1337-2014, 2014.
Chen, D., Zhao, N., Lang, J., Zhou, Y., Wang, X., Li, Y., Zhao, Y., and Guo, X.: Contribution of ship emissions to the concentration of PM2.5: A comprehensive study using AIS data andWRF/Chemmodel in Bohai Rim Region, China, Sci. Total Environ., 610, 1476–1486, https://doi.org/10.1016/j.scitotenv.2017.07.255, 2018.
Coggon, M. M., Sorooshian, A., Wang, Z., Metcalf, A. R., Frossard, A. A., Lin, J. J., Craven, J. S., Nenes, A., Jonsson, H. H., Russell, L. M., Flagan, R. C., and Seinfeld, J. H.: Ship impacts on the marine atmosphere: insights into the contribution of shipping emissions to the properties of marine aerosol and clouds, Atmos. Chem. Phys., 12, 8439–8458, https://doi.org/10.5194/acp-12-8439-2012, 2012.
Contini, D., Gambaro, A., Belosi, F., De Pieri, S., Cairns, W. R. L., Donateo, A., Zanotto, E., and Citron, M.: The direct influence of ship traffic on atmospheric PM2.5, PM10 and PAH in Venice, J. Environ. Manage., 92, 2119–2129, https://doi.org/10.1016/j.jenvman.2011.01.016, 2011.
Contini, D., Gambaro, A., Donateo, A., Cescon, P., Cesari, D., Merico, E., Belosi, F., and Citron, M.: Inter-annual trend of the primary contribution of ship emissions to PM2.5 concentrations in Venice (Italy): Efficiency of emissions mitigation strategies, Atmos. Environ., 102, 183–190, https://doi.org/10.1016/j.atmosenv.2014.11.065, 2015.
Corbett, J. J., Winebrake, J. J., Green, E. H., Kasibhatla, P., Eyring, V., and Lauer, A.: Mortality from ship emissions: A global assessment, Environ. Sci. Technol., 41, 8512–8518, https://doi.org/10.1021/es071686z, 2007.
Dalsøren, S. B., Eide, M. S., Endresen, Ø., Mjelde, A., Gravir, G., and Isaksen, I. S. A.: Update on emissions and environmental impacts from the international fleet of ships: the contribution from major ship types and ports, Atmos. Chem. Phys., 9, 2171–2194, https://doi.org/10.5194/acp-9-2171-2009, 2009.
Donateo, A., Gregoris, E., Gambaro, A., Merico, E., Giua, R., Nocioni, A., and Contini, D.: Contribution of harbour activities and ship traffic to PM2.5, particle number concentrations and PAHs in a port city of the Mediterranean Sea (Italy), Environ. Sci. Pollut. R., 21, 9415–9429, https://doi.org/10.1007/s11356-014-2849-0, 2014.
Fan, Q., Zhang, Y., Ma, W., Ma, H., Feng, J., Yu, Q., Yang, X., Ng, S. K. W., Fu, Q., and Chen, L.: Spatial and Seasonal Dynamics of Ship Emissions over the Yangtze River Delta and East China Sea and Their Potential Environmental Influence, Environ. Sci. Technol., 50, 1322–1329, https://doi.org/10.1021/acs.est.5b03965, 2016.
Fu, M., Liu, H., Jin, X., and He, K.: National- to port-level inventories of shipping emissions in China, Environ. Res. Lett., 12, 114024, https://doi.org/10.1088/1748-9326/aa897a, 2017.
Fuglestvedt, J., Berntsen, T., Eyring, V., Isaksen, I., Lee, D. S., and Sausen, R.: Shipping Emissions: From Cooling to Warming of Climate-and Reducing Impacts on Health, Environ. Sci. Technol., 43, 9057–9062, https://doi.org/10.1021/es901944r, 2009.
Healy, R. M., O'Connor, I. P., Hellebust, S., Allanic, A., Sodeau, J. R., and Wenger, J. C.: Characterisation of single particles from in-port ship emissions, Atmos. Environ., 43, 6408–6414, https://doi.org/10.1016/j.atmosenv.2009.07.039, 2009.
IMO: Emission Control Areas (ECAs) designated under MARPOL Annex VI, available at: http://www.imo.org/ (last access: 29 April 2019), 2017.
Johansson, L., Jalkanen, J.-P., and Kukkonen, J.: Global assessment of shipping emissions in 2015 on a high spatial and temporal resolution, Atmos. Environ., 167, 403–415, https://doi.org/10.1016/j.atmosenv.2017.08.042, 2017.
Kurtenbach, R., Vaupel, K., Kleffmann, J., Klenk, U., Schmidt, E., and Wiesen, P.: Emissions of NO, NO2 and PM from inland shipping, Atmos. Chem. Phys., 16, 14285–14295, https://doi.org/10.5194/acp-16-14285-2016, 2016.
Lack, D. A., Corbett, J. J., Onasch, T., Lerner, B., Massoli, P., Quinn, P. K., Bates, T. S., Covert, D. S., Coffman, D., Sierau, B., Herndon, S., Allan, J., Baynard, T., Lovejoy, E., Ravishankara, A. R., and Williams, E.: Particulate emissions from commercial shipping: Chemical, physical, and optical properties, J. Geophys. Res.-Atmos., 114, D00f04, https://doi.org/10.1029/2008jd011300, 2009.
Li, L., Huang, Z., Dong, J., Li, M., Gao, W., Nian, H., Fu, Z., Zhang, G., Bi, X., Cheng, P., and Zhou, Z.: Real time bipolar time-of-flight mass spectrometer for analyzing single aerosol particles, Int. J. Mass Spectrom., 303, 118–124, https://doi.org/10.1016/j.ijms.2011.01.017, 2011.
Liu, H., Jin, X., Wu, L., Wang, X., Fu, M., Lv, Z., Morawska, L., Huang, F., and He, K.: The impact of marine shipping and its DECA control on air quality in the Pearl River Delta, China, Sci. Total Environ., 625, 1476–1485, https://doi.org/10.1016/j.scitotenv.2018.01.033, 2018.
Liu, Z., Lu, X., Feng, J., Fan, Q., Zhang, Y., and Yang, X.: Influence of Ship Emissions on Urban Air Quality: A Comprehensive Study Using Highly Time-Resolved Online Measurements and Numerical Simulation in Shanghai, Environ. Sci. Technol., 51, 202–211, https://doi.org/10.1021/acs.est.6b03834, 2017.
Merico, E., Donateo, A., Gambaro, A., Cesari, D., Gregoris, E., Barbaro, E., Dinoi, A., Giovanelli, G., Masieri, S., and Contini, D.: Influence of in-port ships emissions to gaseous atmospheric pollutants and to particulate matter of different sizes in a Mediterranean harbour in Italy, Atmos. Environ., 139, 1–10, https://doi.org/10.1016/j.atmosenv.2016.05.024, 2016.
Merico, E., Gambaro, A., Argiriou, A., Alebic-Juretic, A., Barbaro, E., Cesari, D., Chasapidis, L., Dimopoulos, S., Dinoi, A., Donateo, A., Giannaros, C., Gregoris, E., Karagiannidis, A., Konstandopoulos, A. G., Ivosevic, T., Liora, N., Melas, D., Mifka, B., Orlic, I., Poupkou, A., Sarovic, K., Tsakis, A., Giua, R., Pastore, T., Nocioni, A., and Contini, D.: Atmospheric impact of ship traffic in four Adriatic-Ionian port-cities: Comparison and harmonization of different approaches, Transport. Res. D-Tr. E., 50, 431–445, https://doi.org/10.1016/j.trd.2016.11.016, 2017.
Moldanová, J., Fridell, E., Winnes, H., Holmin-Fridell, S., Boman, J., Jedynska, A., Tishkova, V., Demirdjian, B., Joulie, S., Bladt, H., Ivleva, N. P., and Niessner, R.: Physical and chemical characterisation of PM emissions from two ships operating in European Emission Control Areas, Atmos. Meas. Tech., 6, 3577–3596, https://doi.org/10.5194/amt-6-3577-2013, 2013.
Murphy, S. M., Agrawal, H., Sorooshian, A., Padró, L. T., Gates, H., Hersey, S., Welch, W. A., Lung, H., and Miller, J. W.: Comprehensive simultaneous shipboard and airborne characterization of exhaust from a modern container ship at sea, Environ. Sci. Technol., 43, 4626–4640, 2009.
Petzold, A., Hasselbach, J., Lauer, P., Baumann, R., Franke, K., Gurk, C., Schlager, H., and Weingartner, E.: Experimental studies on particle emissions from cruising ship, their characteristic properties, transformation and atmospheric lifetime in the marine boundary layer, Atmos. Chem. Phys., 8, 2387–2403, https://doi.org/10.5194/acp-8-2387-2008, 2008.
Song, X. H., Hopke, P. K., Fergenson, D. P., and Prather, K. A.: Classification of single particles analyzed by ATOFMS using an artificial neural network, ART-2A, Anal. Chem., 71, 860–865, https://doi.org/10.1021/ac9809682, 1999.
Spencer, M. T., Shields, L. G., Sodeman, D. A., Toner, S. M., and Prather, K. A.: Comparison of oil and fuel particle chemical signatures with particle emissions from heavy and light duty vehicles, Atmos. Environ., 40, 5224–5235, https://doi.org/10.1016/j.atmosenv.2006.04.011, 2006.
Toner, S. M., Sodeman, D. A., and Prather, K. A.: Single particle characterization of ultrafine and accumulation mode particles from heavy duty diesel vehicles using aerosol time-of-flight mass spectrometry, Environ. Sci. Technol., 40, 3912–3921, https://doi.org/10.1021/es051455x, 2006.
Ulbrich, I. M., Canagaratna, M. R., Zhang, Q., Worsnop, D. R., and Jimenez, J. L.: Interpretation of organic components from Positive Matrix Factorization of aerosol mass spectrometric data, Atmos. Chem. Phys., 9, 2891–2918, https://doi.org/10.5194/acp-9-2891-2009, 2009.
Viana, M., Amato, F., Alastuey, A., Querol, X., Moreno, T., Garcia Dos Santos, S., Dolores Herce, M., and Fernandez-Patier, R.: Chemical Tracers of Particulate Emissions from Commercial Shipping, Environ. Sci. Technol., 43, 7472–7477, https://doi.org/10.1021/es901558t, 2009.
Viana, M., Hammingh, P., Colette, A., Querol, X., Degraeuwe, B., de Vlieger, I., and van Aardenne, J.: Impact of maritime transport emissions on coastal air quality in Europe, Atmos. Environ., 90, 96–105, https://doi.org/10.1016/j.atmosenv.2014.03.046, 2014.
Wenzel, R. J., Liu, D. Y., Edgerton, E. S., and Prather, K. A.: Aerosol time-of-flight mass spectrometry during the Atlanta Supersite Experiment: 2. Scaling procedures, J. Geophys. Res.-Atmos., 108, 8427, https://doi.org/10.1029/2001jd001563, 2003.
Xiao, Q., Li, M., Liu, H., Fu, M., Deng, F., Lv, Z., Man, H., Jin, X., Liu, S., and He, K.: Characteristics of marine shipping emissions at berth: profiles for particulate matter and volatile organic compounds, Atmos. Chem. Phys., 18, 9527–9545, https://doi.org/10.5194/acp-18-9527-2018, 2018.
Yang, D.-Q., Kwan, S. H., Lu, T., Fu, Q.-Y., Cheng, J.-M., Streets, D. G., Wu, Y.-M., and Li, J.-J.: An Emission Inventory of Marine Vessels in Shanghai in 2003, Environ. Sci. Technol., 41, 5183–5190, https://doi.org/10.1021/es061979c, 2007.
Zhang, Y., Yang, X., Brown, R., Yang, L., Morawska, L., Ristovski, Z., Fu, Q., and Huang, C.: Shipping emissions and their impacts on air quality in China, Sci. Total Environ., 581, 186–198, https://doi.org/10.1016/j.scitotenv.2016.12.098, 2017.
Zhao, M., Zhang, Y., Ma, W., Fu, Q., Yang, X., Li, C., Zhou, B., Yu, Q., and Chen, L.: Characteristics and ship traffic source identification of air pollutants in China's largest port, Atmos. Environ., 64, 277–286, https://doi.org/10.1016/j.atmosenv.2012.10.007, 2013.