the Creative Commons Attribution 4.0 License.
the Creative Commons Attribution 4.0 License.
 | 06 May 2019
Diurnal variation and size dependence of the hygroscopicity of organic aerosol at a forest site in Wakayama, Japan: their relationship to CCN concentrations
Yange Deng
Hikari Yai
Hiroaki Fujinari
Kaori Kawana
Tomoki Nakayama
Michihiro Mochida
Formation of biogenic secondary organic aerosol (BSOA) and its subsequent evolution can modify the hygroscopicity of the organic aerosol component (OA) in the forest atmosphere, and affect the concentrations of cloud condensation nuclei (CCN) there. In this study, size-resolved aerosol hygroscopic growth at 85 % relative humidity and size-resolved aerosol composition were measured using a hygroscopic tandem differential mobility analyzer and an aerosol mass spectrometer, respectively, at a forest site in Wakayama, Japan, in August and September 2015. The hygroscopicity parameter of OA (κorg) presented daily minima in the afternoon hours, and it also showed an increase with the increase in particle dry diameter. The magnitudes of the diurnal variations in κorg for particles with dry diameters of 100 and 300 nm were on average 0.091 and 0.096, respectively, and the difference in κorg between particles with dry diameters of 100 and 300 nm was on average 0.056. The relative contributions of the estimated fresh BSOA and regional OA to total OA could explain 40 % of the observed diurnal variations and size dependence of κorg. The hygroscopicity parameter of fresh BSOA was estimated to range from 0.089 to 0.12 for particles with dry diameters from 100 to 300 nm. Compared with the use of time- and size-resolved κorg, the use of time- and size-averaged κorg leads to under- and over-estimation of the fractional contribution of OA to CCN number concentrations in the range from −5.0 % to 26 %. This indicates that the diurnal variations and size dependence of κorg strongly affect the overall contribution of OA to CCN concentrations. The fractional contribution of fresh BSOA to CCN number concentrations could reach 0.28 during the period of intensive BSOA formation. The aging of the fresh BSOA, if it occurs, increases the estimated contribution of BSOA to CCN number concentrations by 52 %–84 %.
- Article
(4102 KB) - Full-text XML
-
Supplement
(1428 KB) - BibTeX
- EndNote


The hygroscopicity (ability to absorb water) of organic aerosol (OA) components is governed by their chemical composition, and has two important roles in the atmosphere. It influences light scattering by aerosols (Titos et al., 2016) and affects the ability of aerosols to work as cloud condensation nuclei (CCN; McFiggans et al., 2006). The hygroscopicity of OA may also influence the aqueous chemistry in aerosols and cloud droplets, which provide a potentially important pathway for the formation of secondary organic aerosols (SOA; McNeill, 2015). Nevertheless, the hygroscopicity of OA is not well characterized in terms of its temporal and spatial variations, size dependence, and its relationship with the chemical composition of OA, given that OA is a complex mixture of a number of compounds.
Studies on the hygroscopicity parameter κ of OA (κorg; Petters and Kreidenweis, 2007) in different locations have presented different characteristics of temporal variation and size dependence. Based on a year-long observation under supersaturated water vapor conditions (SUPS) at a downwind site of Manaus in central Amazonia, Thalman et al. (2017) reported that κorg presented the lowest value of ∼0.1 in September and the highest value of ∼0.15 in December, and that the ranges of the diurnal variations in κorg were 0.10 to 0.16 (night to day) and 0.08 to 0.14 (night to day) under the influence of local biomass-burning air masses during the dry season and urban-pollution air masses during the wet season, respectively. Bougiatioti et al. (2016) reported diurnal variation in κorg in the range 0.09–0.18 (day to night) under SUPS for particles influenced by biomass burning in the eastern Mediterranean. Deng et al. (2018) reported diurnal variation ranges of κorg of 0.09 to 0.30 (day to night) and 0.16 to 0.24 (day to night) on days with and without evident new particle formation (NPF), respectively, under a SUPS (0.23 % water vapor supersaturation (SS) condition) in a forest in Wakayama, Japan. Different from the above studies, at a rural site in the southeastern United States, a small diurnal variation in κorg (∼0.13 to ∼0.17, night to day) under SUPS was observed (Cerully et al., 2015). With respect to the size dependence of κorg, airborne studies over United States, Canada, Pacific Ocean, and the Gulf of Mexico for a variety of air mass types presented a decrease in κorg (from 0.13 to 0.06) with an increase in the particle modal diameter (from 130 to ∼210 nm) under subsaturated water vapor conditions (SUBS) (Shingler et al., 2016). By contrast, ground-based observations in the city of Nagoya in Japan under SUBS presented relatively low κorg in small particles (0.12–0.15; 60 and 100 nm) and high κorg in large particles (0.17–0.22; 200 and 359 nm) (Kawana et al., 2016). For aerosols found in forest areas, Deng et al. (2018) reported a difference of 0.03 in mean κorg between sub-100 nm particles (κorg was 0.19) and ∼150 nm particles (κorg was 0.22), whereas Thalman et al. (2017) did not identify any size dependence of κorg for 94–171 nm particles. The hygroscopicity of laboratory-generated model SOA was also reported to be size-dependent. Frosch et al. (2011) reported that the κ of α-pinene SOA at SUPS at 100 nm (∼0.12) was ∼0.06 higher than at 200 nm. Zhao et al. (2015) reported that the κ values of model SOA at SUPS produced by different precursors at 50, 100, and 200 nm were ∼0.17, ∼0.11, and ∼0.07, respectively. Tritscher et al. (2011) also found that small (50 nm) α-pinene SOA particles had a higher κ than large ones (150 nm) at SUBS, although the difference was small (0.03). Frosch et al. (2013) reported that the κ of β-caryophyllene SOA decreased with the increase in SS, which can be interpreted as the increase in κ with the increase in particle diameter, and that the maximum of the difference was about 0.1.
The variations in κorg observed in the aforementioned studies may have great influence on the prediction of CCN. Based on global climate modeling simulations, Liu and Wang (2010) reported that CCN concentration would change within 40 % by changing the κ of SOA by ±50 % (from 0.14 to 0.07 or 0.21). Rastak et al. (2017) reported that the difference in the aerosol radiative effects between κorg of 0.05 and 0.15 was −1.02 W m−2, the order of which is the same as that of the overall climate forcing effect of anthropogenic aerosol during the industrial period. Based on CCN closure studies, Wang et al. (2008) reported that, for above-cloud aerosols with high volume fractions of OA, while the CCN number concentration closure could be achieved using κorg of 0.12, the use of κorg of 0.25 led to overestimation of the CCN number concentration by 50 %. Mei et al. (2013b) reported that the increase in κorg from 0.08 to 0.13 led to a 30 % increase in the calculated CCN number concentration and that the increase from 0.03 to 0.18 doubled the concentration. It is therefore important to study the temporal variation and size dependence of κorg in more locations where OA dominates the aerosol chemical composition, to characterize the κorg values and to represent κorg appropriately in model predictions of CCN number concentrations.
The temporal variation and size dependence of κorg of ambient aerosol is reported to relate to variations in the chemical composition of OA, which can result from the mixing of aerosols of different origins, formation of SOA, and aging processes (Cerully et al., 2015; Bougiatioti et al., 2016; Shingler et al., 2016; Thalman et al., 2017; Deng et al., 2018). The size-dependent chemical composition of model SOA has been explained by the size-dependent contributions of different organic vapors to particle growth (e.g., Winkler et al., 2012; Ehn et al., 2014; Zhao et al., 2015, 2016). The size-dependent κ of model SOA has also been explained from the viewpoint of size-dependent chemical composition (Zhao et al., 2015; Frosch et al., 2013) and other factors: the dependence of water activity on particle size, the dependence of the surface tension on the solution concentration, and the evaporation of semivolatile SOA under high-SS conditions (Frosch et al., 2011, 2013; Zhao et al., 2015). In recent studies, the variation in κorg was explained by the variation in OA subcomponents derived from positive matrix factorization (PMF) analysis of OA mass spectra (Cerully et al., 2015; Bougiatioti et al., 2016). From these studies it is reported that the daily variation in κorg could be well explained by the daily variation in the contributions of the retrieved PMF factors to κorg.
In the forest atmosphere, the oxidation of biogenic volatile organic compounds (BVOC) emitted by vegetation can produce substantial amounts of biogenic secondary organic aerosols (BSOA; Tunved et al., 2006; Pöschl et al., 2010; Han et al., 2014). BSOA is reported to contribute to the growth of newly formed particles in forests (e.g., Han et al., 2013; Yu et al., 2014; Zhou et al., 2015). BSOA may also condense on preexisting background particles or particles transported with inflowing air masses (e.g., Cerully et al., 2015; Thalman et al., 2017). Moreover, BSOA is subject to aging processes that include photochemical oxidation and aqueous-phase reactions that must depend on ambient meteorological conditions (e.g., Han et al., 2014; Thalman et al., 2017). Such processes could result in time- and size-dependent variation in the chemical composition of OA and thus time- and size-dependent κorg in the forest atmosphere. However, the characteristics of the temporal variations and size dependence of κorg, and their relationships to the atmospheric processes of BSOA in forest environments, are not well understood.
We performed field observation at a forest site in Wakayama, Japan, in August and September 2015 and characterized the diurnal variations and size dependence of κorg. The variations and dependence were interpreted based upon the size-resolved chemical composition of OA from the viewpoint of BSOA formation. Furthermore, the influence of these variations on the fractional contribution of OA and BSOA to the CCN concentration was assessed. Previous observational studies at the site indicated that BSOA formation was intensive and that aging occurred after formation (Han et al., 2014; Deng et al., 2018). It was also observed that κorg was time- and size-dependent and that the contribution of OA and BSOA to CCN number concentrations could be substantial (Deng et al., 2018). This work is an extension of previous studies on the hygroscopicity and CCN activity of aerosols, and the contributions of OA and BSOA to the CCN concentration, in the same forest (Kawana et al., 2017; Deng et al., 2018). It is intended to clarify the diurnal variation and size dependence of the hygroscopicity of OA and their influence on the contributions of OA and BSOA to CCN.
The field observation was performed at Wakayama Forest Research Station, Kyoto University (34.06∘ N, 135.52∘ E, about 500 m above sea level), located in the central part of the Kii Peninsula. The observation site is about 70 km south of Osaka (2.7 million inhabitants) and 60 km northwest of the North Pacific. Both coniferous trees (such as Cryptomeria japonica, Chamaecyparis obtuse, and Pinus densiflora) and broad-leaf trees (such as Quercus serrata and Quercus crispula) are distributed on the Kii Peninsula (Okumura, 2009). The study period was from 14:30 Japan Standard Time (JST) on 31 August to 06:00 JST on 22 September 2015.
The hygroscopic growth at 85 % relative humidity (RH), number–size distributions, and size-resolved chemical composition of ambient aerosols were measured using a hygroscopicity tandem differential mobility analyzer (HTDMA), a scanning mobility particle sizer (SMPS), and a high-resolution time-of-flight aerosol mass spectrometer (AMS), respectively. Ambient air was aspirated from an inlet about 7.5 m above the ground. The air was transferred through a PM2.5 cyclone (URG) installed at the lower end of the 10.4 m stainless-steel inlet tubing (1/2 in. OD) and introduced to the instrument room at a flow rate of 16.7 L min−1. A manifold combined with an assistant pump (ULVAC, DA30S) was used to split the air flow, and the sample flow for the instrument system composed of the HTDMA, SMPS, and AMS was 0.9 L min−1. The sample flow upstream of the AMS was dried with two diffusion driers containing silica gel. The sample flow to the HTDMA and SMPS was dried with three diffusion driers, in series, two with silica gel and one with molecular sieves.
In the HTDMA, the dried aerosol (RH < 1.8 %) was passed through the first differential mobility analyzer (DMA1; 3081, TSI), where the aerosol was classified, and quasi-monodisperse particles of 30, 50, 70, 100, 200, 300, and 360 nm in diameter (ddry) were obtained. The setting for the classification was fixed for 5 min at each diameter. In each hour, the sequential diameter setting of DMA1 was 30, 50, 70, 100, 200, 360, 30, 50, 100, 200, 300, and 360 nm. During 05:50–05:54 and 17:50–17:54 JST, the setting of DMA1 was for system performance check. The classified aerosol was passed through a Nafion humidifier (MD-110-24S-4, Perma Pure) where it was humidified to ∼85 % RH. The aerosol was then introduced to a second DMA (DMA2; 3081, TSI) coupled to a condensation particle counter (CPC, 3775, TSI), which was operated by scanning the voltage of DMA2. For both DMA1 and DMA2, the aerosol flow rate was 0.3 L min−1 and the sheath-to-sample flow ratio was 10:1. The residence time of the monodisperse particles from the outlet of the humidifier to the inlet of DMA2, where the RH was considered to be ∼85 %, was approximately 11 s. The sheath air flow of DMA2 was also humidified using another Nafion humidifier (PD-100T-12MSS, Perma Pure). The RH (temperature) measured (HMP237, Vaisala) at the inlets of aerosol flow and sheath flow to DMA2 were 85.0±0.2 % (20.3±0.5∘ C) and 85.0±0.2 % (20.4±0.5∘ C), respectively, and that at the outlet of the sheath flow of DMA2 was 86.0±0.3 % (20.3±0.6∘ C). For analysis of the particle hygroscopic growth, RH of 85 % was applied. The SMPS for the measurement of aerosol number–size distributions was composed of a third DMA (DMA3; 3080, 3081, TSI) and a CPC 3772 (TSI). The aerosol flow (RH < 1.6 %) was 0.3 L min−1 and the sheath to aerosol flow ratio was 10:1. At the inlet of CPC 3772, the sample flow was diluted to 1 L min−1 with purified dry air, which was generated using a compressor (RD-45-N, IAC) and an air dryer (QD 30-50, IAC). The aerosol number–size distributions were measured for a dry diameter range of 13.8–749.9 nm every 5 min. The performances of the three DMAs were assessed using standard size PSL particles before and after the observation (Sect. S1 in the Supplement). Furthermore, an aqueous solution of ammonium sulfate (AS) (99.999 % purity, Sigma-Aldrich) was nebulized and the generated aerosols were dried and introduced to the HTDMA, to assess the consistency of the sizing of the two DMAs under dry condition, and to validate the RH setting before the observation (Sect. S2). The setup and calibration procedures of the AMS were the same as those for the observations in 2014 (Deng et al., 2018). The V-mode (MS and PToF modes) data were analyzed using the Igor high-resolution data analysis package (PIKA1.20Q, Igor 6.37) to obtain the bulk and size-resolved mass concentrations of the chemical components (sulfate (SO4), ammonium (NH4), nitrate (NO3), chloride (Chl), and OA), and the atomic ratios of O to C (O:C ratio) and H to C (H:C ratio) for organics. In addition, high-resolution bulk OA mass spectra observed in V-mode were subjected to PMF analysis (Paatero and Tapper, 1994; Ulbrich et al., 2009) (Sects. 3.3, S3). The RH of the sample flow was lower than 0.5 %.
A single-wavelength particle soot absorption photometer (1λ-PSAP, 567 nm, Radiance Research Inc.), with a thermodenuder maintained at 300 ∘C, was deployed to obtain the mass concentration of sub-micrometer black carbon (BC; Kondo et al., 2009; Deng et al., 2018). The mixing ratios of target gaseous species, NO–NO2–NOx, CO, CO2, and O3, were monitored using commercial instruments (APNA-370, Horiba, for NO–NO2–NOx; model 48ij, Thermo Fisher Scientific, for CO; LI-820, LI-COR, for CO2; model 49ij, Thermo Fisher Scientific, for O3). Meteorological data were collected (Kyoto University, 2017). Air temperature, RH (HMP-155, Vaisala), precipitation (RH-5E, IKEDA-KEIKI), and solar radiation (CMP3-L, Campbell) were used in this study.
All the observation data except meteorological data were screened to eliminate data that might have been under the strong influence of local anthropogenic emissions, for example those from vehicles. This was performed by omitting data with spikes in the number concentrations of aerosols from their size distribution data, and in the mass concentration of BC (Sect. S4).
3.1 Hygroscopicity of ambient aerosols
The hygroscopic growth factor of aerosol particles, gf, was defined as the ratio of the particle wet diameter (dwet, 85 % RH) to the corresponding dry diameter (ddry). The distributions of gf for specific ddry (n(gf), i.e., the number distribution of particles as a function of gf) were retrieved using the Twomey algorithm as presented by Mochida et al. (2010) with consideration of the shape of the transfer functions of the two DMAs. The difference in the processing is that the transfer function and the n(gf) in this study were analyzed and presented in the fine mode of 1024 diameter bins per decade while 64 bins per decade were used in Mochida et al. (2010). The gf probability distribution function, gf-PDF, is the normalized n(gf). The gf-PDF in this study is presented in linear scale, which was converted from the original logarithmic scale distribution. The time-resolved mean value of gf for respective ddry, gf,m, was calculated as follows.
For ambient particles, the time-resolved mean-water-volume equivalent gf (gf,mw, i.e., the average of gf that corresponds to the mean water volume retained by particles of certain ddry) was also calculated using Eq. (2) (Kawana et al., 2016).
The hygroscopicity parameter of ambient particles at 85 % RH (κt) was calculated following the κ-Köhler theory (Petters and Kreidenweis, 2007).
where σ is the surface tension at the solution–air interface; Mw and ρw are the molecular mass and density of pure water, respectively; dwet is the product of gf,mw and ddry; R is the universal gas constant; and T is the temperature in kelvin. In this study, the mean temperature at the inlets of aerosol flow and sheath flow of DMA2, weighted by their flow rates, was applied as T (294 K) and the surface tension of pure water at this temperature (Vargaftik et al., 1983) was used as σ in Eq. (3). Because κt was calculated from gf,mw, the aerosol mixing state was not considered in the analysis of κ in this study.
3.2 Hygroscopicity of OA
The hygroscopicity parameter of organics, κorg, was calculated using Eq. (4) assuming the volume additivity of water retained by different aerosol components (Petters and Kreidenweis, 2007).
Here, κt is the hygroscopicity parameter of ambient aerosol at 85 % RH calculated using Eq. (3), while κorg, κinorgsalt, and κBC are the hygroscopicity parameters of OA, inorganic salts, and BC, respectively. The volume fractions of OA, inorganic salts, and BC are εorg, εinorgsalt, and εBC, respectively, and εi and κi are the volume fraction and hygroscopicity parameter of the inorganic salts: ammonium nitrate (AN), sulfuric acid (SA), ammonium hydrogen sulfate (AHS), letovicite (LET), and ammonium sulfate (AS). The εorg, εi, and εBC were calculated based on the size-resolved mass concentrations of organics, sulfate, nitrate, and ammonium from the AMS, and the sub-micrometer BC mass concentrations from the PSAP. BC was assumed to have the same mass–size distribution as OA. The aerosol particles were assumed to be spherical and without voids. PToF mode data in vacuum aerodynamic diameter (dva) ranges that were ∼1.0 (0.98–0.99) to 2.0 times that of ddry, corresponding to the particle density of ∼1.0 (0.98–0.99) to 2.0 g cm−3, were adopted. More details about the calculations of the size-resolved εorg, εi, and εBC are presented in Sect. S5. The derivation of κi was based on the online Extended AIM Aerosol Thermodynamics Model II (E-AIM II, http://www.aim.env.uea.ac.uk/aim/kohler/input_kohler.html, last access: 1 August 2018; Clegg et al., 1998; Wexler and Clegg, 2002) as presented in Sect. S6 and Table S3 in the Supplement. The κ of BC was assumed to be zero. Because of the low signal intensity of the PToF data in the sub-100 nm dva range (Sect. S7), the κorg was only derived for particles with ddry of 100, 200, 300, and 360 nm. Furthermore, to assess the influence of the choice of the dva range on the derivation of κorg, the derived κorg for particles with ddry of 100 nm using the chemical composition in the dva range 98–197 nm was compared with that using the chemical composition in the dva range 69–138 nm (Fig. S4 in the Supplement). The result indicates that κorg was not sensitive to change in the selected dva range when εorg was greater than 40 %. Note that, although the volume additivity assumption between organics and inorganics may not necessarily hold (Vaishya et al., 2013; the κorg derived in the manner in this study represents the perturbation of κt as a result of the presence of organics), the inverse linear correlation between κt and εorg (correlation coefficients: −0.45 to −0.83; Fig. S5) suggests that the additivity holds well for the aerosols studied.
3.3 PMF analysis of OA mass spectra
To characterize the diurnal variations and size dependence of κorg, the high-resolution OA bulk mass spectra derived from the V-mode AMS data were subjected to PMF analysis (Sect. S3), followed by derivation of the size-resolved contributions of the PMF factors to the OA mass concentration (Sect. S8). A two-factor PMF solution was adopted, which resolved two oxygenated OA factors: one with a lower atomic O:C ratio (0.47) named less-oxygenated organic aerosol (LOOA), and the other with a higher O:C ratio (0.95) named more-oxygenated organic aerosol (MOOA). The low relative residual (2.6 %) for the bulk mass spectra supports the use of the two PMF factors to illustrate the observed OA. Note that the two OA factors resolved here represent two different groups of OA chemical structures, not necessarily two different OA sources (Zhang et al., 2011). The use of a PMF result with more factors could make illustration of the variation in κorg complex and was not adopted. The PToF mode OA mass spectra in 2 h time resolution were attributed to the two PMF factors through multivariable linear regression (Sect. S8). For particles with ddry equal to or larger than 100 nm, the variation in κorg was discussed with regard to the variations in the two PMF factors. Furthermore, the hygroscopicity parameters for the two OA fractions were derived and then used to estimate the hygroscopicity of freshly formed BSOA (Sect. 4.2).
4.1 Overview of the observations
4.1.1 Meteorological conditions, gaseous species, and aerosol chemical composition
During the measurement period with effective data, the mean ± standard deviation (SD) of the temperature and RH of the ambient air were 18.2±2.4∘ C and 94.2±7.6 %, respectively. Precipitation events occurred intermittently during 1–3, 6–10, and 16–17 September (Fig. S7). Backward air mass trajectories (Fig. S9) generated using NOAA's HYSPLIT atmospheric transport and dispersion modeling system (Draxler and Hess, 1998) indicate that, apart from on 1 and 17 September, most of the air masses that arrived at the observation site had traveled from the Japan archipelago (and even from the Asian continent) within 5 days, and may have transported aged anthropogenic pollutants to the observation site. The mean ± SD of the BC concentration during the entire study period was 0.07±0.06 µg m−3 (Fig. S7). The mean ± SD of the mixing ratios of CO, NO, NO2, NOx, and O3 during the entire study period were 164±42, 0.33±0.12, 0.56±0.35, 0.63±0.38, and 11.5±8.4 ppb, respectively (Fig. S7). The concentration of BC was low, and the mixing ratios of CO and NOx were modest. A daily maximum of BC appeared in the afternoon hours (Fig. 2), which, however, might have been caused by the charring of OA at the heating temperature of 300∘ C. The mixing ratios of CO and NOx tended to be relatively high during 10:00–22:00 JST (Fig. S8), which might have been caused by the transport of anthropogenic pollution to the surface site by enhanced vertical convection in the daytime. The concentration of O3 was substantial and presented obvious diurnal variation (Fig. S7). On average, O3 peaked during noon with the solar radiation (Fig. S8), indicating the occurrence of photochemical reactions during the daytime.
The time series of the mass concentrations of aerosol chemical components and aerosol number–size distributions are presented in Fig. 1. Among non-refractory aerosol chemical components derived from the AMS and BC derived from the PSAP (total concentration: 6.2±4.4 µg m−3), organics on average accounted for the largest fraction (45.0 %, of which LOOA and MOOA accounted for 24.9 % and 19.1 %, respectively), followed by sulfate (39.6 %) and ammonium (11.6 %). The contributions of nitrate, BC, and chloride were minor: their mass fractions were on average 2.5 %, 1.1 %, and 0.2 %, respectively. The contribution of OA to the sub-micrometer aerosol mass increased and that of sulfate decreased in the afternoon hours (12:00–20:00 JST). The mean aerosol number concentration (NCN) was 1241±1012 cm−3. The geometric mean diameter of the aerosols ranged from 45 to 154 nm with a mean ± SD of 88±17 nm. No strong burst of small particles (i.e., ddry < 30 nm) was identified during the observation, which is different from the two former observations in 2010 and 2014 (Han et al., 2013; Deng et al., 2018).
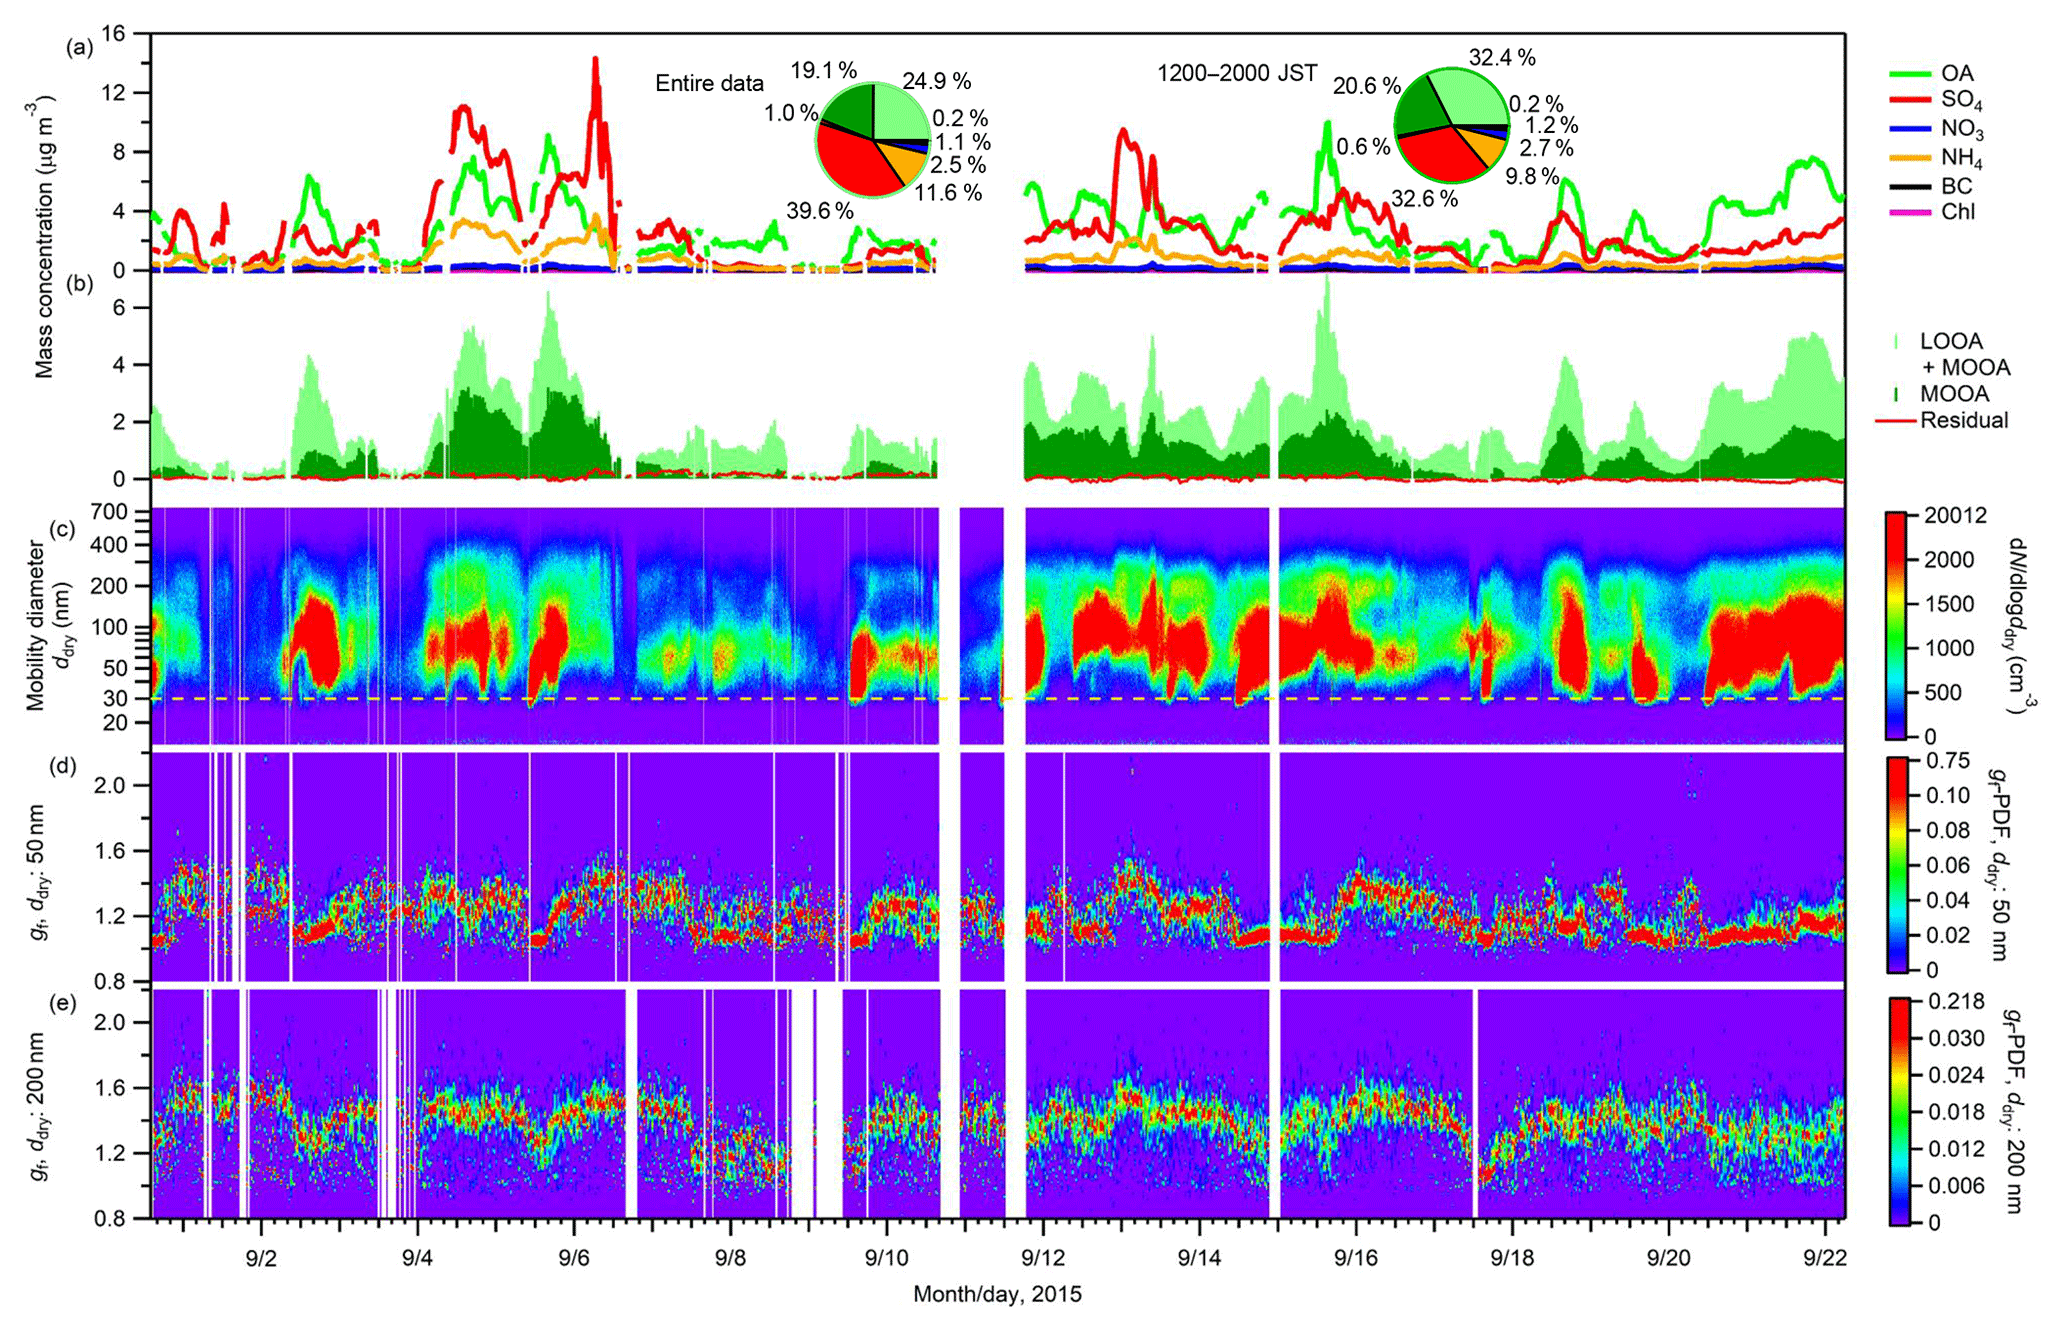
Figure 1Time series of (a) sub-micrometer mass concentrations of non-refractory aerosol chemical components (OA, SO4, NO3, NH4, and Chl) from the AMS measurement and BC from the PSAP measurement; (b) mass concentrations of LOOA and MOOA, and the residuals from the PMF analysis; (c) aerosol number–size distributions; and gf-PDF of aerosol particles with ddry of (d) 50 and (e) 200 nm. The two pie charts in panel (a) present the mass fractions of chemical components for the entire study period and for the afternoon hours (12:00–20:00 JST) during the study period. The dashed line in panel (c) represents a diameter of 30 nm.
The diurnal variation in the number–size distributions and the mass concentrations of the chemical components of aerosols are presented in Fig. 2. The NCN, OA, and LOOA presented similar diurnal variation patterns. Their daily minima were observed between 06:00 and 08:30 JST. After 08:30 JST, they increased monotonically and reached their maxima during 15:00–18:00 JST. Then they gradually decreased until approximately 06:00 JST of the next day. MOOA also increased slowly (following the trend of LOOA) in the daytime and reached its maximum around 18:00 JST. The pattern of the enhancement of OA in the daytime followed that of the solar radiation (Fig. 2b), indicating that the enhancement of OA was caused by the formation of BSOA through photochemical reactions of BVOC (Han et al., 2014; Deng et al., 2018). This is supported by an analysis indicating that anthropogenic pollution was not the main contributor to the enhancement of OA, at least during the period 12:00–16:00 JST (Sect. S9), and by the report that primary biogenic OA is mainly in the supermicrometer aerosol diameter range in a forest environment, for the Amazon at least (Pöschl et al., 2010). Furthermore, the stronger enhancement of LOOA than of MOOA indicates that the freshly formed BSOA was mainly composed of LOOA and had a low oxygenation state. The O:C ratio of OA increased slowly from around noon to midnight (Fig. 2c), together with the appearance of MOOA, indicating the aging of freshly formed BSOA (Han et al., 2014). Because of high-RH conditions (Fig. S7), aqueous-phase reactions including in-cloud processes could have played an important role in the aging of fresh BSOA (Han et al., 2014), which could have modified the hygroscopicity of ambient aerosols (Jimenez et al., 2009; Farmer et al., 2015). Although no abrupt increase in sub-30 nm particles was observed, the increase in the number concentration of 30–50 nm particles around noon indicates the formation of new particles near the observation site. These particles had probably grown by the condensation of BSOA formed from BVOC at the time they were transported to the observation site. The concentrations of nitrate and chloride stayed low, although they also presented maxima in the afternoon. Sulfate, which may have been strongly influenced by transported anthropogenic aerosol, did not present an obvious diurnal variation. This result supports the view that the contribution of anthropogenic OA to the observed enhancement of OA was small.
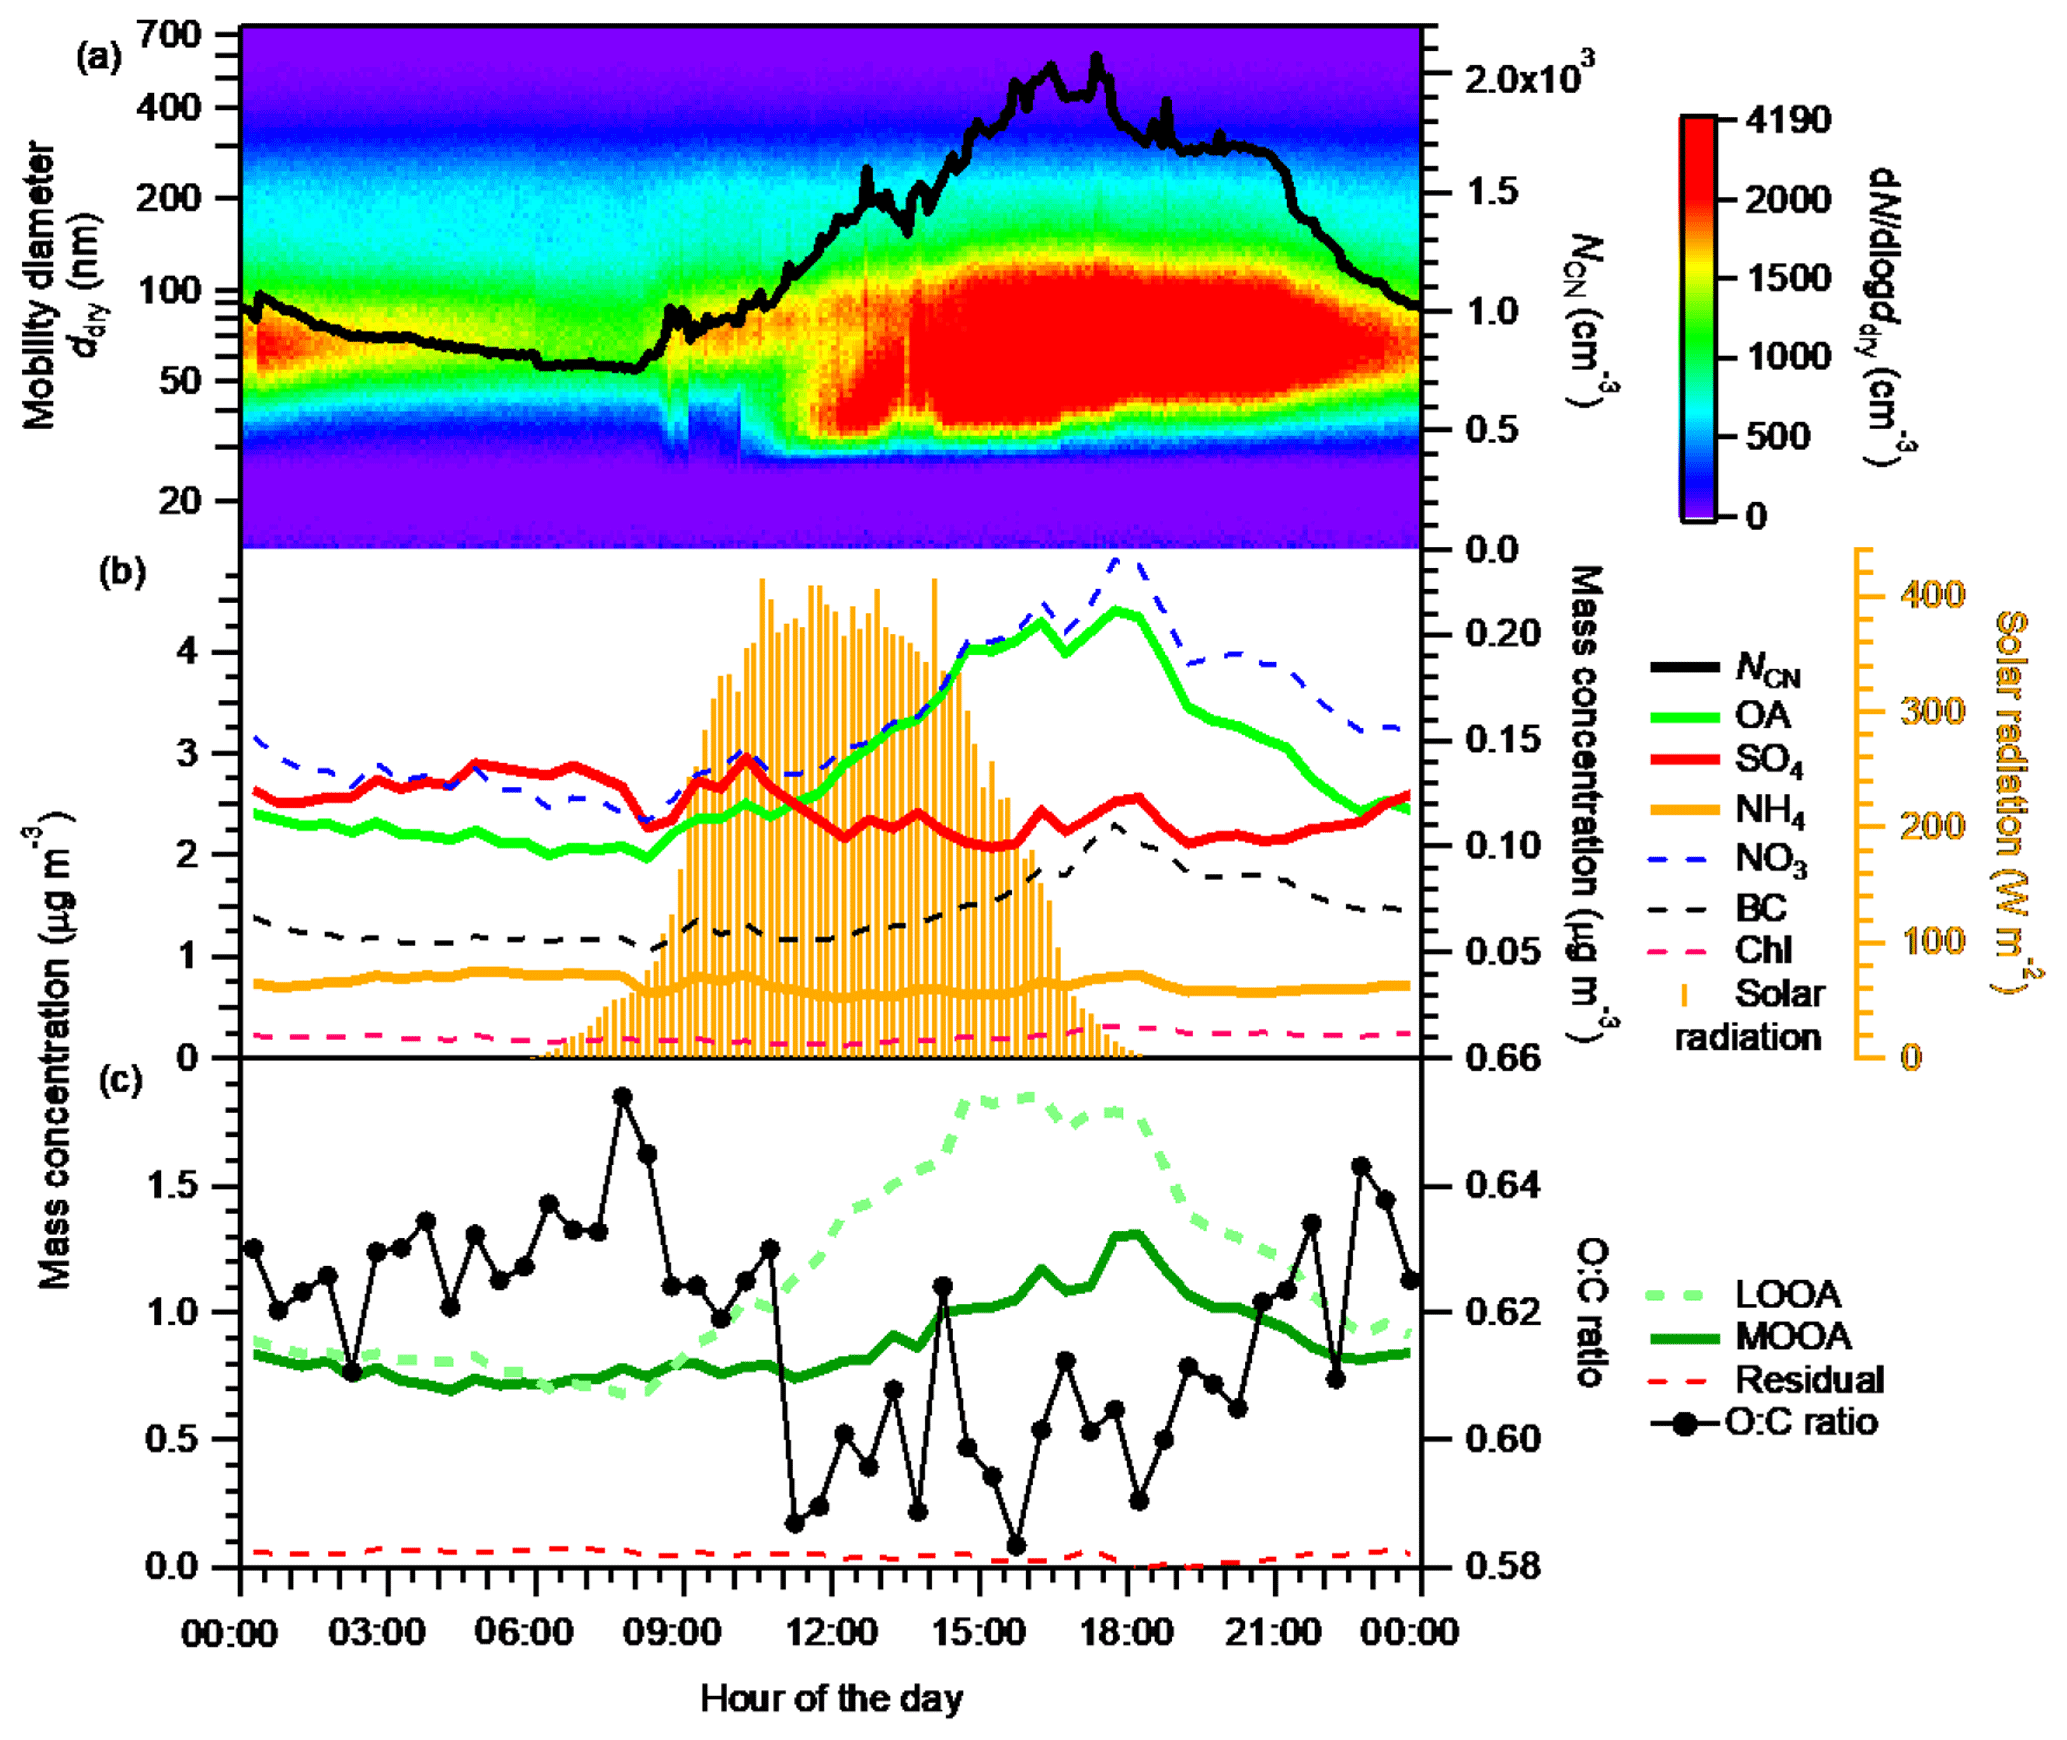
Figure 2Diurnal variations in (a) number-size distribution (image plot) and number concentration (NCN, right axis) of ambient aerosols; (b) the mass concentrations of OA, SO4, and NH4 (left axis), and NO3, BC, and Chl (right axis in black); and (c) the mass concentrations of LOOA, MOOA, and the residual, and the O:C ratio of bulk OA (only data with morg>0.3 mg m−3 are included). (A box-and-whisker plot of the diurnal variation in O:C ratio is presented in Fig. S19.) The diurnal variation in solar radiation is superimposed in panel (b). All data presented are averages for the entire study period.
4.1.2 Hygroscopicity of atmospheric aerosols
Similar to a prior observation at the same site in 2010 (Kawana et al., 2017), the hygroscopic growth factor gf presented unimodal distributions at respective particle diameters (Figs. 1d, e, and S11), and the mean hygroscopic growth factor gf,m of the aerosols increased with an increase in the particle diameters (Fig. S12). The mean ± SD of gf,m at 30, 50, 70, 100, 200, 300, and 360 nm were 1.13±0.08, 1.21±0.09, 1.22±0.09, 1.26±0.10, 1.36±0.10, 1.40±0.08, and 1.42±0.08, respectively. The unimodal pattern of the gf-PDF indicated the internal mixing state of the observed aerosol at the respective particle diameters. Decreases in gf,m (Fig. S12) were observed for all particles during periods of intensive BSOA formation (i.e., episodes when the mass concentration of OA especially LOOA greatly increased; such episodes were observed on 31 August, and on 2, 5, 7, 9, 14, 15, 17, 18, 19, 20, and 21 September; Fig. 1b).
The hygroscopicity parameter of ambient aerosol particles that corresponds to gf,mw (κt) also increased with the increase in aerosol particle diameters (Fig. 3a). Similar diurnal variation patterns were observed for all the diameters studied. The κt started to decrease around 08:00 JST, then reached daily minima between 13:00 and 19:00 JST. Then it increased continually until around 02:00 JST of the next day, and remained high until 08:00 JST the next morning. For particles with ddry≥100 nm, the diurnal variation pattern and size dependence of κt were opposite to those of the volume fraction of OA (Fig. 3b) and were similar to those of the volume fraction of total inorganic salts (Fig. S13). The results suggest that, at least for ambient aerosol particles with ddry≥100 nm, OA and inorganic salts had low and high hygroscopicity, respectively, and this resulted in the variations in κt. Although κinorgsalt is much greater than κorg (Petters and Kreidenweis, 2007), the high εorg makes the influence of OA on κt significant. Thus, the variation in κorg (Sect. 4.2) may also contribute to the variation in κt. For particles with ddry≤70 nm, the decrease in the particle hygroscopicity with the decrease in the particle diameter is also explained by the accompanying increase in εorg and the decrease in εinorgsalt (Levin et al., 2014). This is indicated by the substantially lower mean mass fraction of inorganic salts than of organics in the corresponding dva range of less than 150 nm (Fig. S2). In particular, for particles with ddry of 30 nm, κt remained constant in a low range (0.079–0.089) from 13:00 to 17:00 JST with a mean value of 0.082. BSOA formed during this period probably dominated the particle mass (Kawana et al., 2017; Han et al., 2014).

Figure 3Diurnal variations in (a) size-resolved hygroscopicity of aerosols (κt) and (b) size-resolved volume fractions of OA (εorg) for the entire study period. Note that for particles with ddry of 30 nm, κt is presented in 2 h time resolution because of the low data coverage (Fig. S12).
4.2 Hygroscopicity of organic aerosol components
4.2.1 Variation in κorg and its relation to the chemical structure of OA
The diurnal variation in κorg and the volume fraction of LOOA in OA, vLOOA∕(vLOOA+vMOOA), where vLOOA and vMOOA refer to the volume concentrations of LOOA and MOOA, respectively, for the entire study period are presented in Fig. 4. Data with εorg < 0.40 were excluded from the κorg values presented because the uncertainty that originated from subtraction of the contribution of inorganic components was considered large in the low εorg range (Mei et al., 2013a). The κorg decreased rapidly from approximately 08:00 JST in the morning when the mass concentrations of OA and LOOA started to increase (Fig. 2). The κorg reached daily minima during 10:00–18:00 JST and increased after the minima (Fig. 4a). The vLOOA∕(vLOOA+vMOOA) in Fig. 4b presents the opposite diurnal variation pattern. The characteristics of the size dependence of κorg and vLOOA∕(vLOOA+vMOOA) were dependent on time periods. To characterize the size dependence of κorg and vLOOA∕(vLOOA+vMOOA), the mean values of κorg and vLOOA∕(vLOOA+vMOOA) during 12:00–20:00 and 20:00–12:00 JST were plotted separately in the κorg – vLOOA∕(vLOOA+vMOOA) space for different ddry (Fig. 5), and the difference in the diurnal variation data between particles with different diameters were evaluated using a 10 % two-sided t test (Table S7). During 12:00–20:00 JST, opposite size dependences were observed between the mean κorg and vLOOA∕(vLOOA+vMOOA). Although the differences in κorg between 200 and 300 nm particles (p value: 0.71) and 300 and 360 nm particles (p value: 0.15) were not significant, the differences in κorg between 100 and 200 nm particles (p value: 0.01) and 200 and 360 nm particles (p value: 0.07), and the differences in vLOOA∕(vLOOA+vMOOA) between particles with all different diameters (p value: < 0.02), were significant during that period. During 20:00–12:00 JST, the size dependences of κorg and vLOOA∕(vLOOA+vMOOA) were not clear. The clearer size dependence of both κorg and vLOOA∕(vLOOA+vMOOA) during 12:00–20:00 JST than during 20:00–12:00 JST was explained by the formation of BSOA during the afternoon hours. The patterns of diurnal variation and of size dependence between κorg and vLOOA∕(vLOOA+vMOOA) during 12:00–20:00 JST indicate that the variation in κorg could be explained at least in part by the relative contributions of LOOA and MOOA to OA. That is, the presence of LOOA with low oxygenation state (O:C ratio of 0.47) lowered the observed κorg, while the presence of MOOA with high oxygenation state (O:C ratio of 0.95) increased the observed κorg. A similar relationship was observed in a former study at the observation site: κorg was positively correlated with the O:C ratio of the organics (Deng et al., 2018).
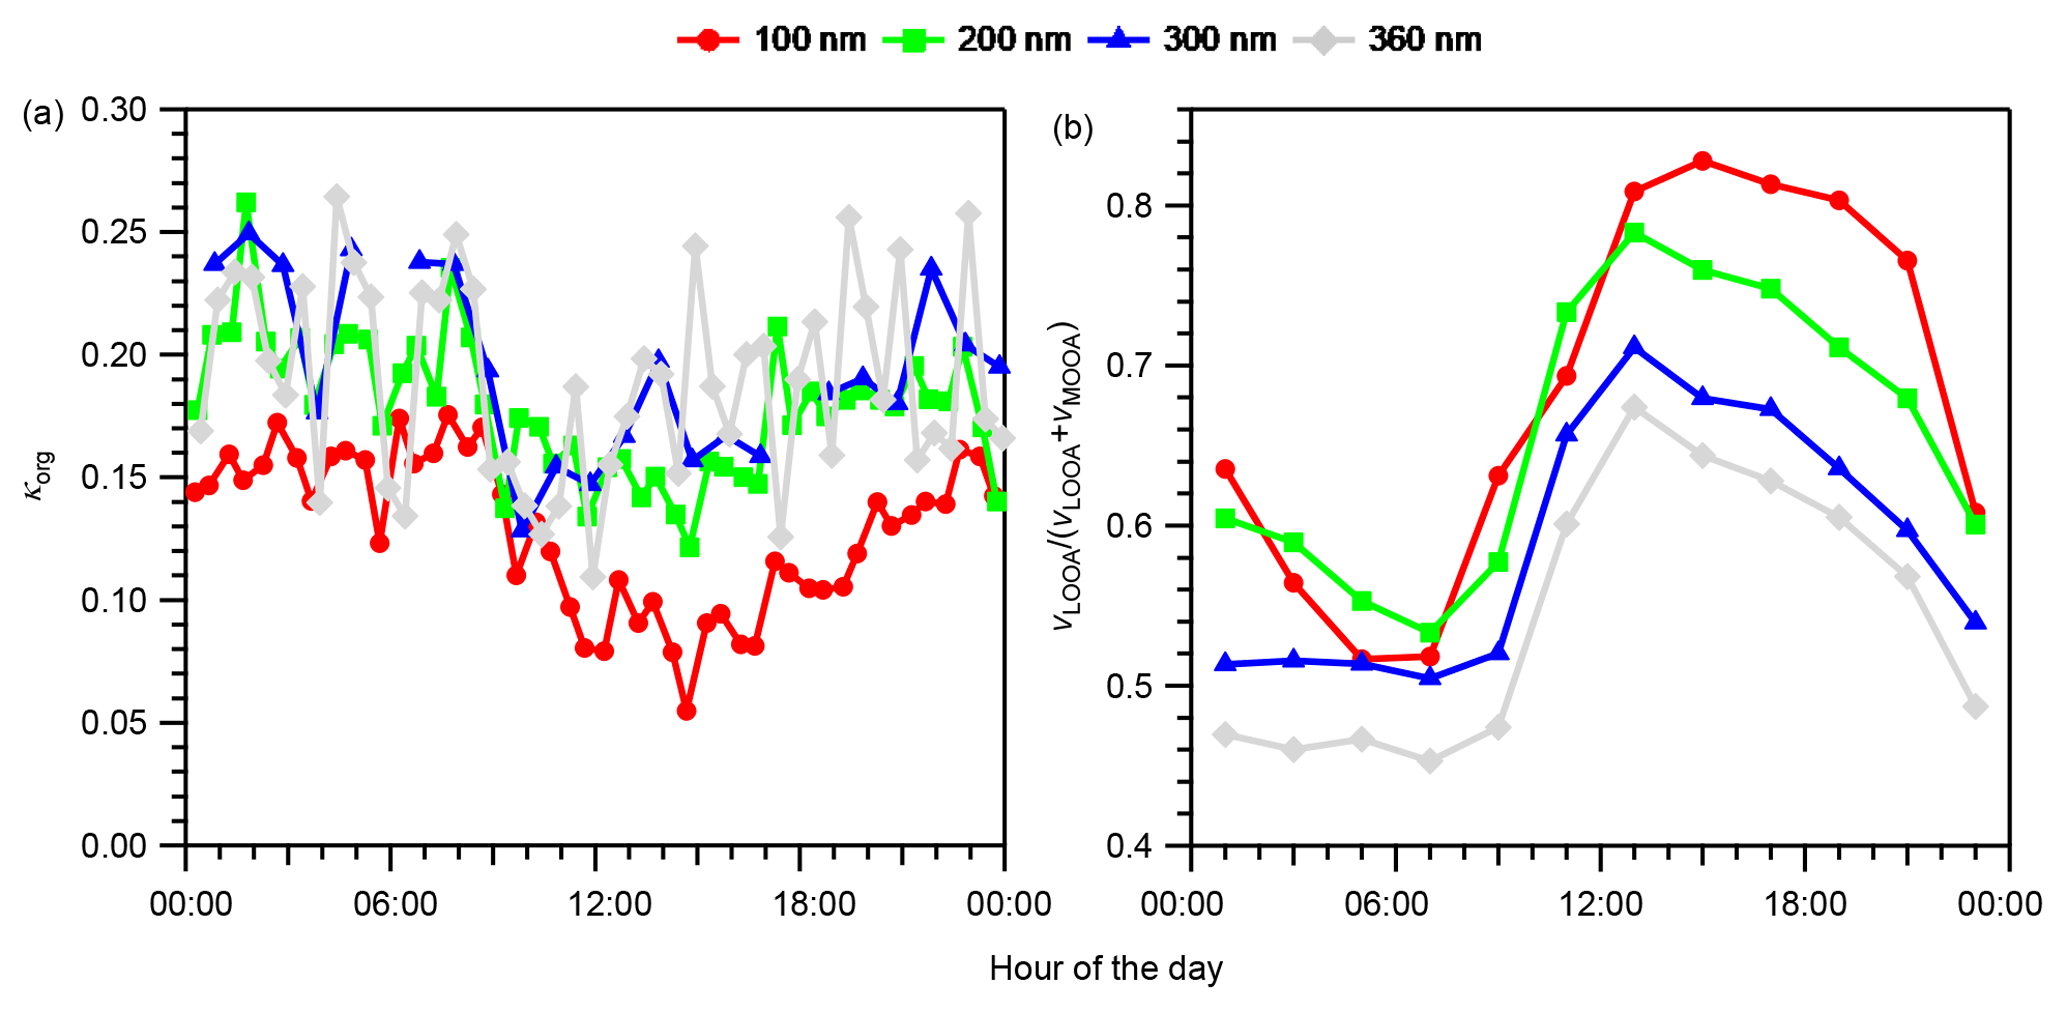
Figure 4Diurnal variations in (a) size-resolved hygroscopicity of OA (κorg) and (b) size-resolved volume fractions of LOOA in OA (vLOOA∕(vLOOA+vMOOA)) for the entire study period. For κorg in panel (a), only data with εorg > 0.40 were considered. The values in panel (b) were calculated from the diurnal variations in the average volume concentrations of LOOA and MOOA (Fig. S16), not from the averages of vLOOA∕(vLOOA+vMOOA).
The hygroscopicity parameters of LOOA (κLOOA) and MOOA (κMOOA) were determined to evaluate the variations in κorg that can be explained by the relative contributions of LOOA and MOOA to OA. For the determination of κLOOA and κMOOA, κorg was plotted against vLOOA∕(vLOOA+vMOOA) and their correlation was analyzed based on linear regression analysis (Figs. 5 and S14). For particles with ddry of 100, 200, 300, and 360 nm, the correlation coefficients between κorg and vLOOA∕(vLOOA+vMOOA) were −0.50, −0.58, −0.27, and −0.099, respectively. Relatively high correlations were observed for particles with ddry of 100 and 200 nm, probably because higher particle number concentrations (Fig. 1c) and higher OA volume fractions (Fig. 3) led to smaller uncertainties in the derived κorg in those diameter ranges than in those of 300 and 360 nm. The regression line for particles with ddry of both 100 and 200 nm (Fig. 5) were used to derive κLOOA and κMOOA by applying vLOOA∕(vLOOA+vMOOA) of zero and unity to the obtained regression equation, respectively. The derived κLOOA and κMOOA were 0.083 and 0.28, respectively. This result is in between the results if particles with ddry of only 100 nm (derived κLOOA and κMOOA were 0.060 and 0.25, respectively) and only 200 nm (derived κLOOA and κMOOA were 0.095 and 0.34, respectively) were used. Compared with the κ of PMF factors reported by Jimenez et al. (2009), the derived κLOOA and κMOOA are within the ranges of κ for semivolatile oxygenated OA (0.04–0.18) and low-volatility oxygenated OA (0.18–0.35), respectively (Fig. 5). The size-resolved vLOOA∕(vLOOA+vMOOA) and the above derived κLOOA and κMOOA were used to reconstruct the diurnal variation data and mean values of size-resolved κorg during 12:00–20:00 JST based on the volume additivity assumption. The reconstructed κorg and the κorg described above (measured κorg) were compared and their correlations were evaluated through linear regression analysis (Fig. S15). The slope and r2 of the regression line are used to assess the ability of LOOA and MOOA to explain the variations in κorg. For 100 and 200 nm particles, the relative contribution of LOOA and MOOA to OA can explain the majority of the variations in κorg (the slope and r2 for 100 nm particles were 0.72 and 0.79, respectively, and those for 200 nm particles were 0.63 and 0.68, respectively). The variations in κorg of 300 and 360 nm particles are explained less by the relative contributions of LOOA and MOOA to OA (the slope and r2 for 300 nm particles were 0.31 and 0.48, respectively; for 360 nm particles were 0.16 and 0.07, respectively). The slope and r2 of the regression line between reconstructed and measured κorg for particles with all four ddry were 0.39 and 0.44, respectively. This result indicates that the relative contribution of LOOA and MOOA can explain around 40 % of the observed diurnal variations in κorg. The slope and r2 of the regression line over the mean reconstructed and observed κorg of the four different sizes during afternoon hours (12:00–20:00 JST) were 0.39 and 0.84, respectively, which indicates that the size dependence of κorg is explained by the relative contribution of LOOA and MOOA to OA by at least ∼40 % during the time period.
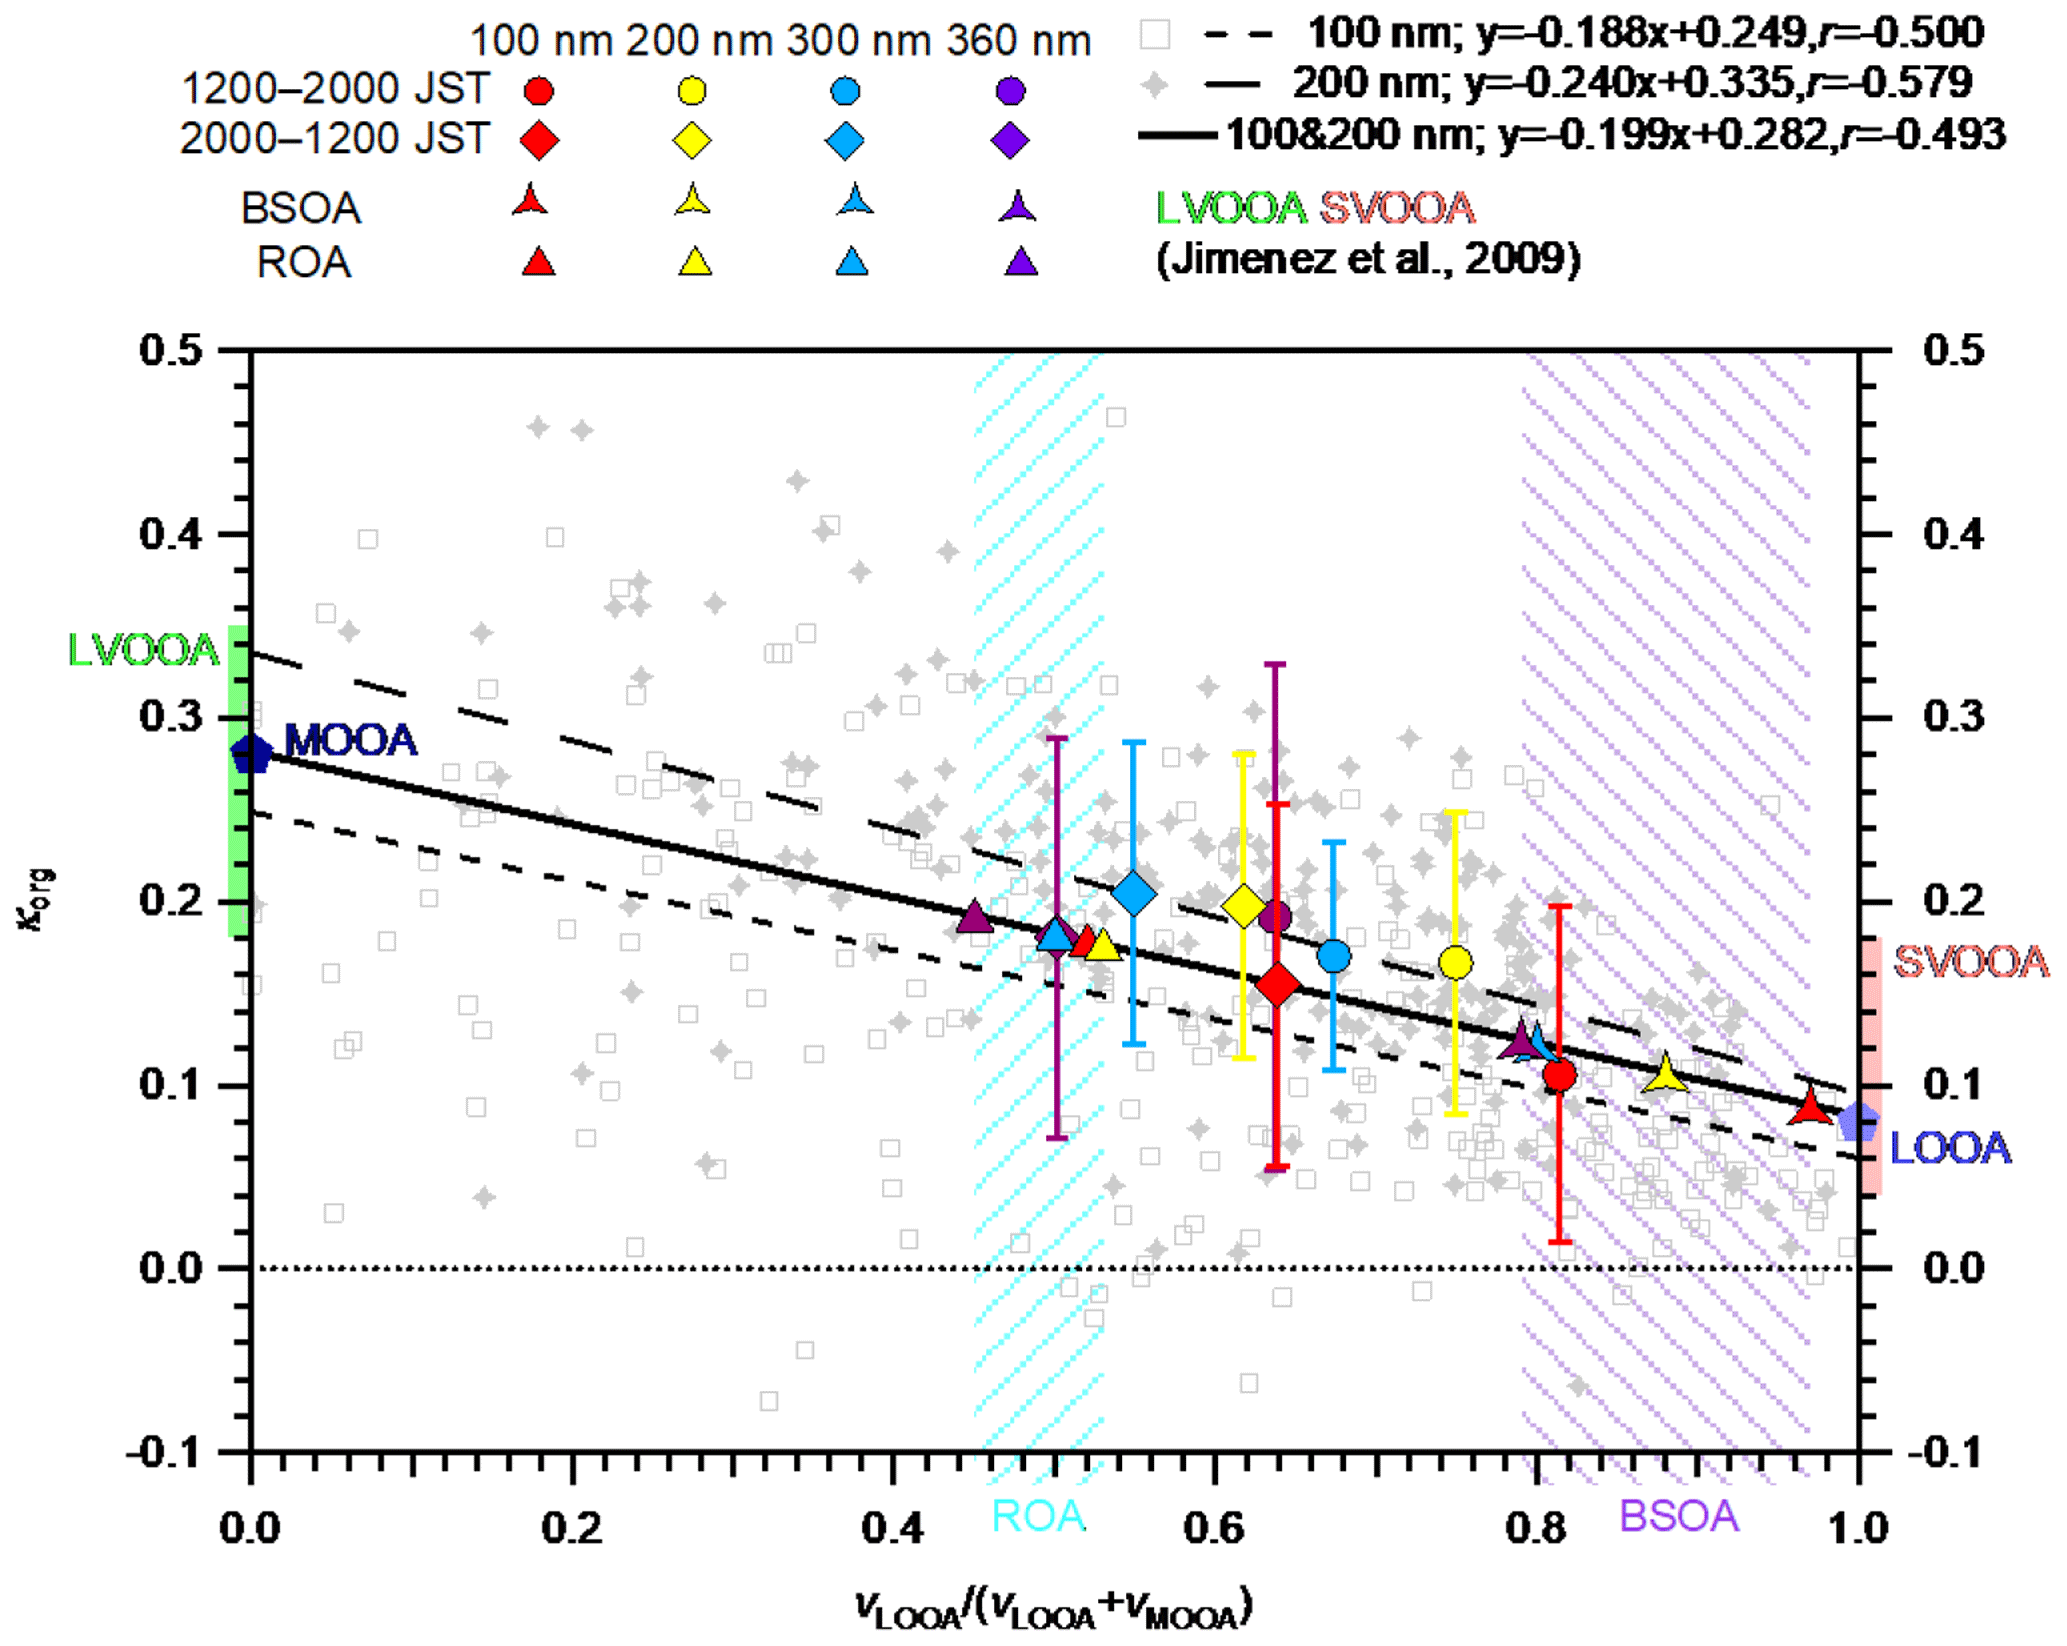
Figure 5κorg versus vLOOA∕(vLOOA+vMOOA) for particles with ddry of 100 nm (gray open squares) and 200 nm (gray cross markers) over the entire study period. The time resolution of individual data is 2 h. Only data with εorg > 0.40 are considered. The short-dashed, long-dashed, and solid lines are the regression lines for particles with ddry of 100, 200 nm, and the sum of the particles with the two sizes, respectively. The κ values of LOOA and MOOA derived from the regression lines (Sect. 4.2.1) are indicated by the light and dark blue pentagons, respectively. The size-resolved mean κorg values during 12:00–20:00 and 20:00–12:00 JST are indicated as filled circles and diamond markers, respectively. The standard deviations of the mean κorg are indicated by the whiskers. The standard deviations of the mean vLOOA∕(vLOOA+vMOOA) are presented in Table S6. The size-resolved κ values of BSOA and ROA are indicated by the three-pointed stars and triangles, respectively. The diameters of κorg, κBSOA, and κROA are differentiated by colors. The ranges of κ for low-volatility oxygenated OA (LVOOA) and semivolatile oxygenated OA (SVOOA) from Jimenez et al. (2009) are superimposed on the left and right axes, respectively. The shaded areas represent the estimated ranges of vLOOA∕(vLOOA+vMOOA) for ROA (left slash pattern) and BSOA (right slash pattern) of 100–360 nm particles.
4.2.2 Hygroscopicity of biogenic secondary organic aerosols
The hygroscopicity parameter of freshly formed BSOA (κBSOA) was calculated as the volume-weighted mean of κLOOA and κMOOA. As discussed in Sect. 4.1.1, the enhanced OA mass in the daytime can be regarded as fresh BSOA. To simplify the analysis, the remaining part of the observed OA can be regarded as regionally transported OA (ROA), which may contain some aged, locally formed BSOA (Deng et al., 2018). To estimate the size-resolved contributions of LOOA and MOOA to BSOA and ROA, the size-resolved diurnal variations in sulfate were assumed to be a tracer of regionally transported aerosol and were scaled to represent the diurnal variations in LOOA and MOOA that constitute ROA (LOOA-ROA and MOOA-ROA; Fig. S16). For the scaling, the period of 06:00–08:00 JST, when OA and its subcomponents reached their daily minima (Figs. 2 and S16), was regarded as the background period, and all the LOOA and MOOA during the period were considered constituents of ROA. The remaining fractions of LOOA and MOOA were regarded as constituents of BSOA, referred to as LOOA-BSOA and MOOA-BSOA, respectively. The vLOOA∕(vLOOA+vMOOA) of ROA was estimated to be 0.52, 0.53, 0.50, and 0.45 for particles with ddry of 100, 200, 300, and 360 nm, respectively (the range is presented by the area filled with a left-slash pattern in Fig. 5). The period when the diurnal variations in the size-resolved concentration of LOOA reached their maxima (i.e., 14:00–16:00 JST; Fig. S16) was chosen to estimate the size-resolved vLOOA∕(vLOOA+vMOOA) of BSOA. The estimated vLOOA∕(vLOOA+vMOOA) values of the BSOA were 0.97, 0.88, 0.80, and 0.79 for particles with ddry of 100, 200, 300, and 360 nm, respectively (the range is presented by the area filled with a right-slash pattern in Fig. 5). Although the estimated BSOA could have aged to some extent, it was defined as fresh BSOA. The κBSOA (and κROA) values were calculated using the derived vLOOA∕(vLOOA+vMOOA) of BSOA (ROA) for particles with different ddry and κLOOA and κMOOA, and found to be 0.089 (0.18), 0.11 (0.18), 0.12 (0.18), and 0.12 (0.19) for particles with ddry of 100, 200, 300, and 360 nm, respectively. The result indicates that κBSOA may increase with an increase in the particle diameter as a result of the size-dependent contribution of LOOA and MOOA to BSOA (Fig. 5; colored three-pointed stars), which, however, needs to be confirmed by further studies. The size dependence of the estimated κROA (Fig. 5; colored triangles) was less obvious than that of κBSOA. The κBSOA derived at 85 % RH for particles with ddry of 100 nm in this study (0.089) was slightly smaller than that in a previous study for particles with similar diameters under SUPS (0.10 at 94±11 nm) at the same site (Deng et al., 2018). The derived κROA is similar to the average κorg during the nighttime (Fig. 4). The size-resolved volume concentrations of BSOA (vBSOA) and ROA (vROA) were also estimated using those size-resolved vLOOA∕(vLOOA+vMOOA) values of BSOA and ROA (Sect. S10). The obtained volume fraction of BSOA in aerosol particles (εBSOA; Fig. S18) presented diurnal variation patterns that were similar to those of vLOOA∕(vLOOA+vMOOA). Furthermore, the size dependence of εBSOA during afternoon hours was also similar to that of vLOOA∕(vLOOA+vMOOA). Because both the volume concentrations and hygroscopicity of BSOA and ROA were derived from that of LOOA and MOOA, the variation in the relative contributions of the estimated BSOA and ROA to OA can explain 40 % of the diurnal variation and size dependence of the measured κorg.
4.3 Ranges of the variations in κt, κorg, and κBSOA
The ranges of the diurnal variations in κt and κorg, the difference between their maxima and minima, were obtained from their diurnal variation data with 2 h resolution (Table S8). The variation ranges of κt were 0.14, 0.091, 0.084, 0.10, 0.11, 0.11, and 0.070 for particles with ddry of 30, 50, 70, 100, 200, 300, and 360 nm, respectively. The variation ranges of κorg for particles with ddry of 100, 200, 300, and 360 nm were 0.091, 0.079, 0.096, and 0.11, respectively. The size dependence of κt and κorg were quantified by the mean κt and κorg values for the entire study period (Table S8). The difference in κt between particles with ddry of 100 and 300 nm was 0.13, and that of κorg was 0.056.
The ranges of both the diurnal variations and the size dependence of κt are similar to those reported from a previous study at the same site in 2010 (the mean of the differences between 09:00–21:00 and 21:00–09:00 JST on NPF event days and on nonevent days for the ddry range of 28.9–359 nm was in the range of 0.09–0.13, and the difference between Aitken mode and accumulation mode particles was 0.12) (Kawana et al., 2017), which pointed out the importance of the variation in particle hygroscopicity with time and size to the CCN number concentration. The ranges of both the diurnal variations and the size dependence of κorg are comparable to the range of 0.05 (from 0.08 to 0.13) that could lead to 30 % or more bias in the predicted CCN number concentration if not considered (Mei et al., 2013b). Here, only the ranges of the variation in κt and κorg are discussed; other factors such as the absolute values of κt or κorg should also be important to the prediction of CCN number concentrations. If SS is 0.1 %–1 %, typical maximum values in cloud systems (Farmer et al., 2015), the ddry of 100 nm is close to the mode diameters of the CCN number–size distributions in previous studies at the same site (Kawana et al., 2017; Deng et al., 2018), whereas the ddry of 300 nm is close to the mode mobility diameters of the mass–size distributions of OA and other aerosol components in this study (Fig. S2). The difference in the two types of mode diameters indicates that significant bias could be introduced if the bulk aerosol composition and/or OA composition is used for the prediction of CCN number concentrations.
The difference in the estimated κBSOA between particles with ddry of 100 and 300 nm was estimated to be 0.031. The difference implies the importance of the size dependence of κBSOA in the prediction of the contribution of BSOA to the CCN number concentration.
4.4 Contributions of OA and BSOA to CCN concentrations
The contributions of OA and BSOA to CCN number concentrations were assessed from the viewpoint of their contributions to the aerosol water uptake, which are size-dependent. For the estimate, the observed aerosols were assumed to be internally mixed. This is supported by a result from a previous study at the observation site: there was almost no difference in the prediction of the number fractions of CCN between the use of time- and size-resolved gf distributions and time- and size-resolved gf,m (Kawana et al., 2017). The CCN activation diameters (dact) for respective 2 h time-of-day bins at 0.4 % SS were calculated from reconstructed hygroscopicity parameter values of aerosol particles based on κ-Köhler theory (Sect. S11). The estimated total CCN number concentration is referred to as NCCN,t. For each size range, the contribution of OA (BSOA) to the aerosol water uptake was represented as the product of the volume fraction of OA (BSOA) and κorg (κBSOA) divided by κt (i.e., εorgκorg/κt (εBSOAκBSOA/κt)) and was used to represent the fractional contribution of OA (and BSOA) to dNCN/dlogddry in the size range. The fractional contribution of OA (and BSOA) to NCCN,t, hereafter referred to as FCCN,OA (FCCN,BSOA), was derived by integrating the product of dNCN/dlogddry and εorgκorg/κt (εBSOAκBSOA/κt) above the dact and by dividing the obtained value by NCCN,t. Details for the estimation of FCCN,OA and FCCN,BSOA are presented in Sect. S11.
The diurnal variation in FCCN,OA estimated using time- and size-resolved κorg and that of FCCN,BSOA using size-resolved kBSOA are presented in Fig. 6. Both FCCN,OA and FCCN,BSOA reached their maxima during 12:00–16:00 JST, when intensive BSOA formation was observed. The magnitude of the variation in FCCN,BSOA (from 0.00 to 0.28) was larger than that of FCCN,OA (from 0.40 to 0.52). This is explained by the larger magnitude of the diurnal variation range of εBSOA (Fig. S18), compared to that of εorg (Fig. 3). The FCCN,BSOA of 0.28 during 14:00–16:00 JST indicates a significant contribution of BSOA to the CCN number concentration.
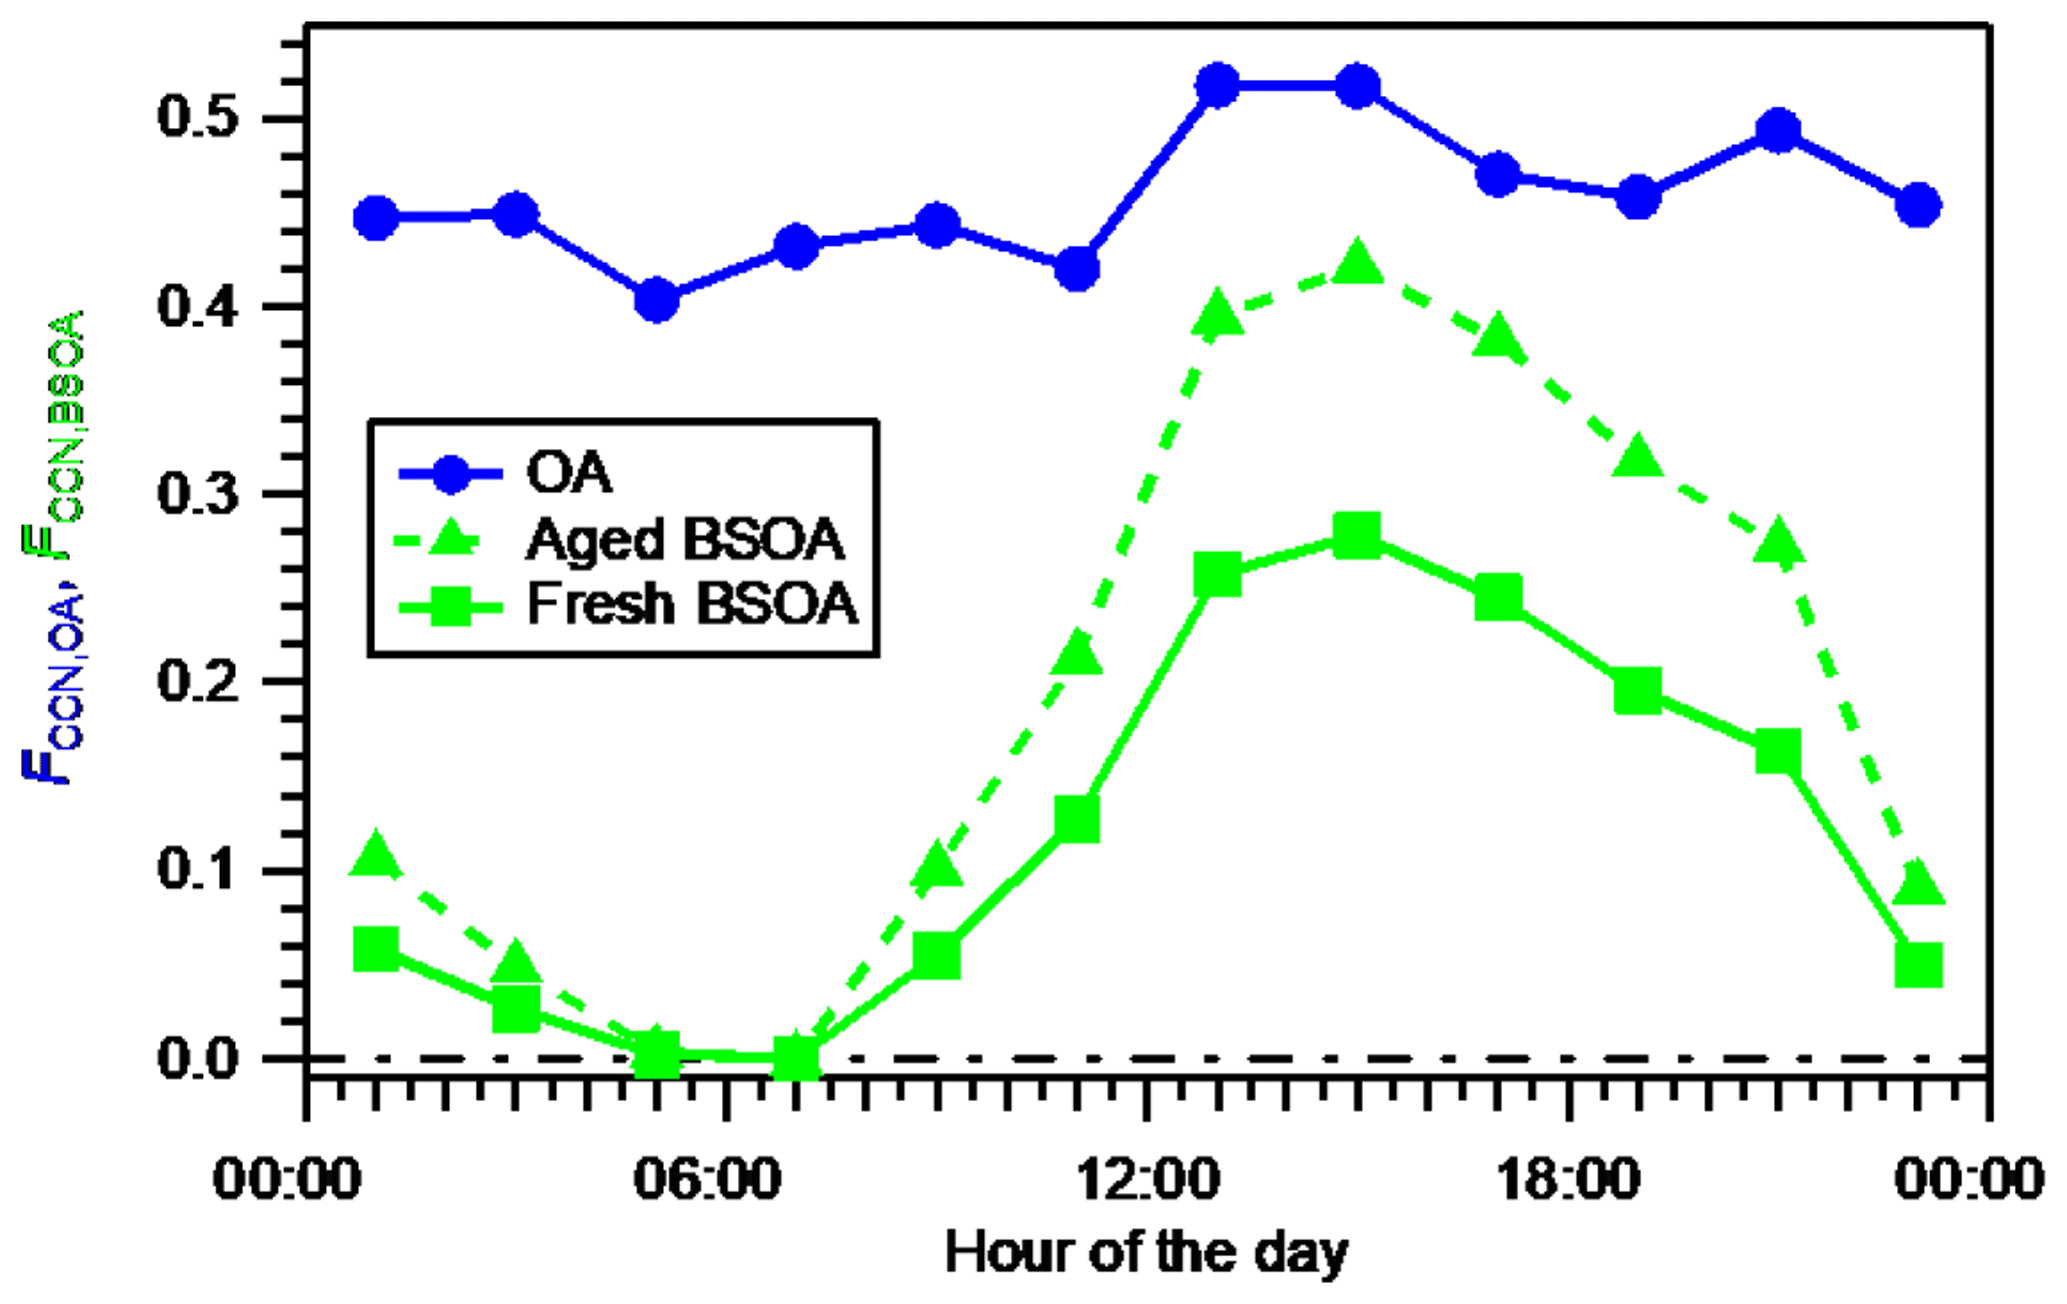
Figure 6Diurnal variation in the fractional contribution of OA to the total CCN number concentration (FCCN,OA) estimated using time- and size-resolved κorg, and diurnal variation in the fractional contribution of BSOA to the total CCN number concentration (FCCN,BSOA) estimated assuming fresh BSOA (using size-resolved κBSOA) and aged BSOA (using size-resolved κROA).
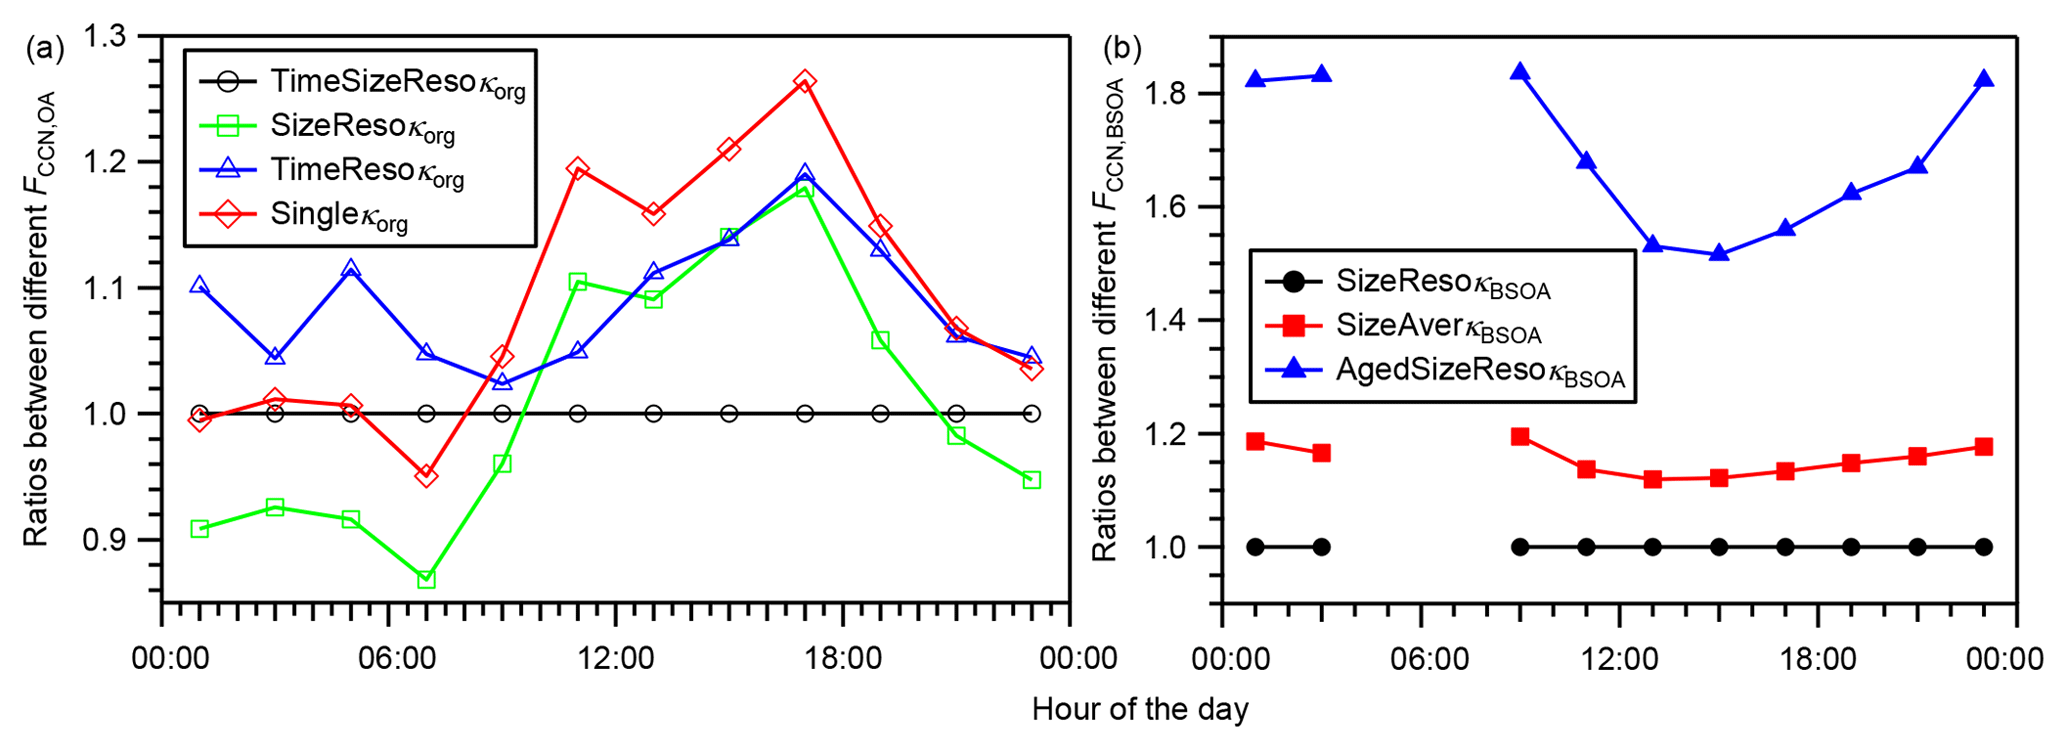
Figure 7(a) Diurnal variation in the ratios of the FCCN,OA derived using time- and size-resolved κorg (TimeSizeResoκorg), time-averaged and size-resolved κorg (SizeResoκorg), size-averaged and time-resolved κorg (TimeResoκorg), and time- and size-averaged κorg (Singleκorg) to that derived using the time- and size- resolved κorg (TimeSizeResoκorg). (b) Diurnal variation in the ratios of the FCCN,BSOA derived using size-resolved κBSOA (SizeResoκBSOA), size-averaged κBSOA (SizeAverκBSOA), and aged size-resolved κBSOA (AgedSizeResoκBSOA) to that derived using the size-resolved κBSOA (SizeResoκBSOA). In panel (b), the condition of aged size-resolved κBSOA assumes that the value of κBSOA equals that of κROA, and the data during 04:00–08:00 JST, when the concentration of BSOA was low (volume concentration less than cm3 m−3), are not presented (data are presented in Table S12).
Because obvious diurnal variations and size dependence of κorg were found and because κBSOA was also estimated to be size-dependent (Sect. 4.2), the sensitivities of the estimated FCCN,OA and FCCN,BSOA on the variations in κorg and κBSOA were assessed. To assess the influence of the variation in κorg on FCCN,OA, the diurnal variations in FCCN,OA were estimated using (0a, base case) time- and size-resolved κorg; (1a) size-resolved, time-averaged (note that the average here refers to the arithmetic mean, and it is the same in other places of this paragraph) κorg; (2a) time-resolved, size-averaged κorg; and (3a) time- and size-averaged κorg (Table S10). Cases (1a)–(3a) were compared with the base case (0a), as presented in Fig. 7a. Using time-averaged κorg (case 1a), the FCCN,OA was overestimated by 18 % during 16:00–18:00 JST and underestimated by 13 % during 06:00–08:00 JST. Using size-averaged κorg (case 2a), the FCCN,OA was overestimated by 2 %–19 % on a diurnal basis. Using time- and size-averaged κorg (i.e., a single mean κorg, case 3a), FCCN,OA was overestimated by 26 % during 16:00–18:00 JST and underestimated by 5.0 % during 06:00–08:00 JST. The deviation of case (3a) from the base case (0a) resulted from the factors leading to the deviations of cases (1a) and (2a). The magnitudes of the deviations, defined here as the difference between the lowest and highest values of the ratios in Fig. 7a, for (1a), (2a), and (3a) are 31 %, 17 %, and 31 %, respectively. The substantial differences suggest that the diurnal variations and size dependence of κorg are important for accurate prediction of the contribution of OA to the CCN number concentration in modeling studies. To assess the influence of the size dependence of κBSOA on FCCN,BSOA, the diurnal variations in FCCN,BSOA was estimated using (0b, base case) size-resolved κBSOA and (1b) size-averaged κBSOA (Table S11). Case (1b) was compared with case (0b), as presented in Fig. 7b. Using size-averaged κBSOA caused overestimation of FCCN,BSOA by 12 %–19 %, which relates to the decrease in the estimated κBSOA and the increase in dNCN/dlogddry (Fig. S17) with decrease in the dry particle diameter.
Furthermore, because fresh BSOA probably become aged after atmospheric transport, the influence of the aging of the estimated fresh BSOA (assuming κBSOA for the calculation of dact and FCCN,BSOA was as large as that of κROA, Table S11) on FCCN,BSOA was also evaluated. Here, the estimation of FCCN,BSOA in the aged condition ignored the possible change in the aerosol size distribution accompanying the aging process. Aged BSOA can contribute more to the aerosol water uptake and thus to the CCN number concentration. Assuming that the BSOA was as aged as ROA, the estimated FCCN,BSOA was 52 %–84 % larger than that estimated assuming fresh BSOA (Fig. 7b), and it could have been 0.42 if the aerosol observed during 14:00–16:00 JST aged (Fig. 6). The result suggests that, whereas the contribution of BSOA to CCN was substantial at the study site, the magnitude of the contribution might be increased substantially by aging of the BSOA during transport after its formation in the forest.
The size-resolved hygroscopicity at 85 % RH, chemical composition, and number–size distributions of atmospheric aerosols were observed at a forest site in Wakayama, Japan, in August and September 2015. The diurnal variation and size dependence in the hygroscopicity of the observed aerosol and organic aerosol (OA) components were discussed in view of the formation of BSOA. The fractional contributions of OA and BSOA to the total CCN number concentration were discussed in view of the variations in the hygroscopicity parameter of OA and BSOA.
Similar to two previous observations at the same site (Han et al., 2013, 2014; Kawana et al., 2017; Deng et al., 2018), OA was the dominant sub-micrometer aerosol component, followed by sulfate. While the mass concentration of sulfate, on average, did not vary much in a day, the mass concentration of OA increased substantially in the afternoon hours, which was presumably explained by the condensation of BSOA. The hygroscopicity of ambient aerosol (κt) and of OA (κorg) increased with an increase in the dry particle diameter and presented daily minima in the afternoon hours. In this study, the ranges of the diurnal variations in κorg of 100–360 nm particles were 0.079–0.11 and the κorg of 300 nm particles was 0.056 larger than that of the 100 nm particles. The diurnal variations and size dependence of κt can be explained by the relative contributions of OA and inorganic salts in the observed aerosol. The relative contributions of the estimated fresh BSOA and regional OA can explain 40 % of the diurnal variation and size dependence of κorg. The hygroscopicity of fresh BSOA (κBSOA) was estimated to increase (0.089–0.12) with an increase in the dry particle diameter (100–300 nm).
The fractional contributions of OA and fresh BSOA to CCN number concentrations, estimated from the viewpoint of their contributions to the water uptake by the aerosol, were in the ranges 0.40–0.52 and 0.00–0.28, respectively. Compared with the use of time- and size-resolved κorg, the use of time- and size-averaged κorg overestimated the contribution of OA to the CCN number concentration by up to 26 % (16:00–18:00 JST) and underestimated the contribution by up to 5.0 % (06:00–08:00 JST). These results indicate the importance of the diurnal variations and size dependence of κorg in the prediction of the contribution of OA to the CCN number concentration. The use of size-averaged κBSOA overestimated the contribution of fresh BSOA to the CCN number concentration by 12 %–19 % compared with the use of size-resolved κBSOA. If aging of BSOA after atmospheric transport occurs, the contribution of fresh BSOA to the CCN number concentration could be increased by 52 %–84 %, and could have reached a high value of 0.42 if the aerosol observed during 14:00–16:00 JST aged.
This study revealed the large magnitude of the diurnal variation and size dependence of κorg at the observation site under the influence of the formation of BSOA. Also revealed was the importance of the variation in κorg to the estimation of the contribution of OA to the CCN number concentration from the viewpoint of the size-resolved contribution of OA to the water uptake of aerosols. Because both the diurnal variation and size dependence of κorg in the studied forest are different from those in some other forest environments (Cerully et al., 2015; Thalman et al., 2017), further studies on the variation in the hygroscopicity of organics and on the contributions of OA and BSOA to the CCN concentrations should be performed in other forest environments. Furthermore, the size dependence of the hygroscopicity of fresh BSOA estimated here should be confirmed by additional studies.
Raw data used to derive the data presented are available on request to the corresponding author. All of the final derived data supporting the findings of this study are available in the article or in the Supplement.
The supplement related to this article is available online at: https://doi.org/10.5194/acp-19-5889-2019-supplement.
MM and YD designed the experiments, and YD, HY, MM, HF, and TN performed them. YD analyzed the data with contributions from MM, TN, and KK. YD prepared the manuscript with contributions from MM, KK, and TN.
The authors declare that they have no conflict of interest.
We thank the faculty and staff of the Wakayama Forest Research Station, Field Science Education and Research Center of Kyoto University, Japan, for the provision of the study site and the meteorological data. We thank Qingcai Chen, Kouji Adachi, Yuuki Kuruma, Ryuji Fujimori, and Takayuki Yamasaki for their help in the field observation. We acknowledge Kazuma Aoki for the use of the 1λ-PSAP instrument. We acknowledge the NOAA Air Resources Laboratory (ARL) for providing the HYSPLIT transport and dispersion model. This study was supported in part by JSPS KAKENHI grant numbers JP26281007 and JP18K19852.
This paper was edited by Veli-Matti Kerminen and reviewed by three anonymous referees.
Bougiatioti, A., Bezantakos, S., Stavroulas, I., Kalivitis, N., Kokkalis, P., Biskos, G., Mihalopoulos, N., Papayannis, A., and Nenes, A.: Biomass-burning impact on CCN number, hygroscopicity and cloud formation during summertime in the eastern Mediterranean, Atmos. Chem. Phys., 16, 7389–7409, https://doi.org/10.5194/acp-16-7389-2016, 2016.
Cerully, K. M., Bougiatioti, A., Hite Jr., J. R., Guo, H., Xu, L., Ng, N. L., Weber, R., and Nenes, A.: On the link between hygroscopicity, volatility, and oxidation state of ambient and water-soluble aerosols in the southeastern United States, Atmos. Chem. Phys., 15, 8679–8694, https://doi.org/10.5194/acp-15-8679-2015, 2015.
Clegg, S. L., Brimblecombe, P., and Wexler, A. S.: Thermodynamic model of the system H+----H2O at tropospheric temperatures, J. Phys. Chem. A, 102, 2137–2154, https://doi.org/10.1021/jp973042r, 1998.
Deng, Y. G., Kagami, S., Ogawa, S., Kawana, K., Nakayama, T., Kubodera, R., Adachi, K., Hussein, T., Miyazaki, Y., and Mochida, M.: Hygroscopicity of Organic Aerosols and Their Contributions to CCN Concentrations Over a Midlatitude Forest in Japan, J. Geophys. Res.-Atmos., 123, 9703–9723, https://doi.org/10.1029/2017jd027292, 2018.
Draxler, R. R. and Hess, G. D.: An overview of the HYSPLIT_4 modelling system for trajectories, dispersion and deposition, Aust. Meteorol. Mag., 47, 295–308, 1998.
Ehn, M., Thornton, J. A., Kleist, E., Sipila, M., Junninen, H., Pullinen, I., Springer, M., Rubach, F., Tillmann, R., Lee, B., Lopez-Hilfiker, F., Andres, S., Acir, I. H., Rissanen, M., Jokinen, T., Schobesberger, S., Kangasluoma, J., Kontkanen, J., Nieminen, T., Kurten, T., Nielsen, L. B., Jorgensen, S., Kjaergaard, H. G., Canagaratna, M., Dal Maso, M., Berndt, T., Petaja, T., Wahner, A., Kerminen, V. M., Kulmala, M., Worsnop, D. R., Wildt, J., and Mentel, T. F.: A large source of low-volatility secondary organic aerosol, Nature, 506, 476–479, https://doi.org/10.1038/nature13032, 2014.
Farmer, D. K., Cappa, C. D., and Kreidenweis, S. M.: Atmospheric processes and their controlling influence on cloud condensation nuclei activity, Chem. Rev., 115, 4199–4217, https://doi.org/10.1021/cr5006292, 2015.
Frosch, M., Bilde, M., DeCarlo, P. F., Juranyi, Z., Tritscher, T., Dommen, J., Donahue, N. M., Gysel, M., Weingartner, E., and Baltensperger, U.: Relating cloud condensation nuclei activity and oxidation level of alpha-pinene secondary organic aerosols, J. Geophys. Res.-Atmos., 116, D22212, https://doi.org/10.1029/2011jd016401, 2011.
Frosch, M., Bilde, M., Nenes, A., Praplan, A. P., Jurányi, Z., Dommen, J., Gysel, M., Weingartner, E., and Baltensperger, U.: CCN activity and volatility of β-caryophyllene secondary organic aerosol, Atmos. Chem. Phys., 13, 2283–2297, https://doi.org/10.5194/acp-13-2283-2013, 2013.
Han, Y. M., Iwamoto, Y., Nakayama, T., Kawamura, K., Hussein, T., and Mochida, M.: Observation of new particle formation over a mid-latitude forest facing the North Pacific, Atmos. Environ., 64, 77–84, https://doi.org/10.1016/j.atmosenv.2012.09.036, 2013.
Han, Y. M., Iwamoto, Y., Nakayama, T., Kawamura, K., and Mochida, M.: Formation and evolution of biogenic secondary organic aerosol over a forest site in Japan, J. Geophys. Res.-Atmos., 119, 259–273, https://doi.org/10.1002/2013jd020390, 2014.
Jimenez, J. L., Canagaratna, M. R., Donahue, N. M., Prevot, A. S. H., Zhang, Q., Kroll, J. H., DeCarlo, P. F., Allan, J. D., Coe, H., Ng, N. L., Aiken, A. C., Docherty, K. S., Ulbrich, I. M., Grieshop, A. P., Robinson, A. L., Duplissy, J., Smith, J. D., Wilson, K. R., Lanz, V. A., Hueglin, C., Sun, Y. L., Tian, J., Laaksonen, A., Raatikainen, T., Rautiainen, J., Vaattovaara, P., Ehn, M., Kulmala, M., Tomlinson, J. M., Collins, D. R., Cubison, M. J., Dunlea, E. J., Huffman, J. A., Onasch, T. B., Alfarra, M. R., Williams, P. I., Bower, K., Kondo, Y., Schneider, J., Drewnick, F., Borrmann, S., Weimer, S., Demerjian, K., Salcedo, D., Cottrell, L., Griffin, R., Takami, A., Miyoshi, T., Hatakeyama, S., Shimono, A., Sun, J. Y., Zhang, Y. M., Dzepina, K., Kimmel, J. R., Sueper, D., Jayne, J. T., Herndon, S. C., Trimborn, A. M., Williams, L. R., Wood, E. C., Middlebrook, A. M., Kolb, C. E., Baltensperger, U., and Worsnop, D. R.: Evolution of Organic Aerosols in the Atmosphere, Science, 326, 1525–1529, https://doi.org/10.1126/science.1180353, 2009.
Kawana, K., Nakayama, T., and Mochida, M.: Hygroscopicity and CCN activity of atmospheric aerosol particles and their relation to organics: Characteristics of urban aerosols in Nagoya, Japan, J. Geophys. Res.-Atmos., 121, 4100–4121, https://doi.org/10.1002/2015jd023213, 2016.
Kawana, K., Nakayama, T., Kuba, N., and Mochida, M.: Hygroscopicity and cloud condensation nucleus activity of forest aerosol particles during summer in Wakayama, Japan, J. Geophys. Res.-Atmos., 122, 3042–3064, https://doi.org/10.1002/2016jd025660, 2017.
Kondo, Y., Sahu, L., Kuwata, M., Miyazaki, Y., Takegawa, N., Moteki, N., Imaru, J., Han, S., Nakayama, T., Oanh, N. T. K., Hu, M., Kim, Y. J., and Kita, K.: Stabilization of the Mass Absorption Cross Section of Black Carbon for Filter-Based Absorption Photometry by the use of a Heated Inlet, Aerosol Sci. Tech., 43, 741–756, https://doi.org/10.1080/02786820902889879, 2009.
Kyoto University: Kenkyurin Shikenchi Joho 2010, in: Sections of Forest Station Management and Field Station Management, Field Science Education and Research Center, Kyoto University, Japan, 2017 (in Japanese).
Levin, E. J. T., Prenni, A. J., Palm, B. B., Day, D. A., Campuzano-Jost, P., Winkler, P. M., Kreidenweis, S. M., DeMott, P. J., Jimenez, J. L., and Smith, J. N.: Size-resolved aerosol composition and its link to hygroscopicity at a forested site in Colorado, Atmos. Chem. Phys., 14, 2657–2667, https://doi.org/10.5194/acp-14-2657-2014, 2014.
Liu, X. H. and Wang, J. A.: How important is organic aerosol hygroscopicity to aerosol indirect forcing?, Environ. Res. Lett., 5, 044010, https://doi.org/10.1088/1748-9326/5/4/044010, 2010.
McFiggans, G., Artaxo, P., Baltensperger, U., Coe, H., Facchini, M. C., Feingold, G., Fuzzi, S., Gysel, M., Laaksonen, A., Lohmann, U., Mentel, T. F., Murphy, D. M., O'Dowd, C. D., Snider, J. R., and Weingartner, E.: The effect of physical and chemical aerosol properties on warm cloud droplet activation, Atmos. Chem. Phys., 6, 2593–2649, https://doi.org/10.5194/acp-6-2593-2006, 2006.
McNeill, V. F.: Aqueous Organic Chemistry in the Atmosphere: Sources and Chemical Processing of Organic Aerosols, Environ. Sci. Technol., 49, 1237–1244, https://doi.org/10.1021/es5043707, 2015.
Mei, F., Hayes, P. L., Ortega, A., Taylor, J. W., Allan, J. D., Gilman, J., Kuster, W., de Gouw, J., Jimenez, J. L., and Wang, J.: Droplet activation properties of organic aerosols observed at an urban site during CalNex-LA, J. Geophys. Res.-Atmos., 118, 2903–2917, https://doi.org/10.1002/jgrd.50285, 2013a.
Mei, F., Setyan, A., Zhang, Q., and Wang, J.: CCN activity of organic aerosols observed downwind of urban emissions during CARES, Atmos. Chem. Phys., 13, 12155–12169, https://doi.org/10.5194/acp-13-12155-2013, 2013b.
Mochida, M., Nishita-Hara, C., Kitamori, Y., Aggarwal, S. G., Kawamura, K., Miura, K., and Takami, A.: Size-segregated measurements of cloud condensation nucleus activity and hygroscopic growth for aerosols at Cape Hedo, Japan, in spring 2008, J. Geophys. Res.-Atmos., 115, D21207, https://doi.org/10.1029/2009jd013216, 2010.
Okumura, M.: Estimation of volatile organic compound emissions from forest vegetation, PhD thesis, Graduate School of Energy Science, Kyoto University, Kyoto, Japan, 2009.
Paatero, P. and Tapper, U.: Positive matrix factorization - a nonnegative factor model with optimal utilization of error-estimates of data values, Environmetrics, 5, 111–126, https://doi.org/10.1002/env.3170050203, 1994.
Petters, M. D. and Kreidenweis, S. M.: A single parameter representation of hygroscopic growth and cloud condensation nucleus activity, Atmos. Chem. Phys., 7, 1961–1971, https://doi.org/10.5194/acp-7-1961-2007, 2007.
Pöschl, U., Martin, S. T., Sinha, B., Chen, Q., Gunthe, S. S., Huffman, J. A., Borrmann, S., Farmer, D. K., Garland, R. M., Helas, G., Jimenez, J. L., King, S. M., Manzi, A., Mikhailov, E., Pauliquevis, T., Petters, M. D., Prenni, A. J., Roldin, P., Rose, D., Schneider, J., Su, H., Zorn, S. R., Artaxo, P., and Andreae, M. O.: Rainforest Aerosols as Biogenic Nuclei of Clouds and Precipitation in the Amazon, Science, 329, 1513–1516, https://doi.org/10.1126/science.1191056, 2010.
Rastak, N., Pajunoja, A., Navarro, J. C. A., Ma, J., Song, M., Partridge, D. G., Kirkevag, A., Leong, Y., Hu, W. W., Taylor, N. F., Lambe, A., Cerully, K., Bougiatioti, A., Liu, P., Krejci, R., Petaja, T., Percival, C., Davidovits, P., Worsnop, D. R., Ekman, A. M. L., Nenes, A., Martin, S., Jimenez, J. L., Collins, D. R., Topping, D. O., Bertram, A. K., Zuend, A., Virtanen, A., and Riipinen, I.: Microphysical explanation of the RH-dependent water affinity of biogenic organic aerosol and its importance for climate, Geophys. Res. Lett., 44, 5167–5177, https://doi.org/10.1002/2017gl073056, 2017.
Shingler, T., Crosbie, E., Ortega, A., Shiraiwa, M., Zuend, A., Beyersdorf, A., Ziemba, L., Anderson, B., Thornhill, L., Perring, A. E., Schwarz, J. P., Campazano-Jost, P., Day, D. A., Jimenez, J. L., Hair, J. W., Mikoviny, T., Wisthaler, A., and Sorooshian, A.: Airborne characterization of subsaturated aerosol hygroscopicity and dry refractive index from the surface to 6.5km during the SEAC(4)RS campaign, J. Geophys. Res.-Atmos., 121, 4188–4210, https://doi.org/10.1002/2015jd024498, 2016.
Thalman, R., de Sá, S. S., Palm, B. B., Barbosa, H. M. J., Pöhlker, M. L., Alexander, M. L., Brito, J., Carbone, S., Castillo, P., Day, D. A., Kuang, C., Manzi, A., Ng, N. L., Sedlacek III, A. J., Souza, R., Springston, S., Watson, T., Pöhlker, C., Pöschl, U., Andreae, M. O., Artaxo, P., Jimenez, J. L., Martin, S. T., and Wang, J.: CCN activity and organic hygroscopicity of aerosols downwind of an urban region in central Amazonia: seasonal and diel variations and impact of anthropogenic emissions, Atmos. Chem. Phys., 17, 11779–11801, https://doi.org/10.5194/acp-17-11779-2017, 2017.
Titos, G., Cazorla, A., Zieger, P., Andrews, E., Lyamani, H., Granados-Munoz, M. J., Olmo, F. J., and Alados-Arboledas, L.: Effect of hygroscopic growth on the aerosol light-scattering coefficient: A review of measurements, techniques and error sources, Atmos. Environ., 141, 494–507, https://doi.org/10.1016/j.atmosenv.2016.07.021, 2016.
Tritscher, T., Dommen, J., DeCarlo, P. F., Gysel, M., Barmet, P. B., Praplan, A. P., Weingartner, E., Prévôt, A. S. H., Riipinen, I., Donahue, N. M., and Baltensperger, U.: Volatility and hygroscopicity of aging secondary organic aerosol in a smog chamber, Atmos. Chem. Phys., 11, 11477–11496, https://doi.org/10.5194/acp-11-11477-2011, 2011.
Tunved, P., Hansson, H. C., Kerminen, V. M., Strom, J., Dal Maso, M., Lihavainen, H., Viisanen, Y., Aalto, P. P., Komppula, M., and Kulmala, M.: High natural aerosol loading over boreal forests, Science, 312, 261–263, https://doi.org/10.1126/science.1123052, 2006.
Ulbrich, I. M., Canagaratna, M. R., Zhang, Q., Worsnop, D. R., and Jimenez, J. L.: Interpretation of organic components from Positive Matrix Factorization of aerosol mass spectrometric data, Atmos. Chem. Phys., 9, 2891–2918, https://doi.org/10.5194/acp-9-2891-2009, 2009.
Vaishya, A., Ovadnevaite, J., Bialek, J., Jennings, S. G., Ceburnis, D., and O'Dowd, C. D.: Bistable effect of organic enrichment on sea spray radiative properties, Geophys. Res. Lett., 40, 6395–6398, https://doi.org/10.1002/2013gl058452, 2013.
Vargaftik, N. B., Volkov, B. N., and Voljak, L. D.: International tables of the surface-tension of water, J. Phys. Chem. Ref. Data, 12, 817–820, https://doi.org/10.1063/1.555688, 1983.
Wang, J., Lee, Y.-N., Daum, P. H., Jayne, J., and Alexander, M. L.: Effects of aerosol organics on cloud condensation nucleus (CCN) concentration and first indirect aerosol effect, Atmos. Chem. Phys., 8, 6325–6339, https://doi.org/10.5194/acp-8-6325-2008, 2008.
Wexler, A. S. and Clegg, S. L.: Atmospheric aerosol models for systems including the ions H+, , Na+, , , Cl−, Br−, and H2O, J. Geophys. Res.-Atmos., 107, D14, https://doi.org/10.1029/2001jd000451, 2002.
Winkler, P. M., Ortega, J., Karl, T., Cappellin, L., Friedli, H. R., Barsanti, K., McMurry, P. H., and Smith, J. N.: Identification of the biogenic compounds responsible for size-dependent nanoparticle growth, Geophys. Res. Lett., 39, L20815, https://doi.org/10.1029/2012gl053253, 2012.
Yu, H., Ortega, J., Smith, J. N., Guenther, A. B., Kanawade, V. P., You, Y., Liu, Y. Y., Hosman, K., Karl, T., Seco, R., Geron, C., Pallardy, S. G., Gu, L. H., Mikkila, J., and Lee, S. H.: New Particle Formation and Growth in an Isoprene-Dominated Ozark Forest: From Sub-5 nm to CCN-Active Sizes, Aerosol Sci. Tech., 48, 1285–1298, https://doi.org/10.1080/02786826.2014.984801, 2014.
Zhang, Q., Jimenez, J. L., Canagaratna, M. R., Ulbrich, I. M., Ng, N. L., Worsnop, D. R., and Sun, Y. L.: Understanding atmospheric organic aerosols via factor analysis of aerosol mass spectrometry: a review, Anal. Bioanal. Chem., 401, 3045–3067, https://doi.org/10.1007/s00216-011-5355-y, 2011.
Zhao, D. F., Buchholz, A., Kortner, B., Schlag, P., Rubach, F., Kiendler-Scharr, A., Tillmann, R., Wahner, A., Flores, J. M., Rudich, Y., Watne, A. K., Hallquist, M., Wildt, J., and Mentel, T. F.: Size-dependent hygroscopicity parameter (κ) and chemical composition of secondary organic cloud condensation nuclei, Geophys. Res. Lett., 42, 10920–10928, https://doi.org/10.1002/2015gl066497, 2015.
Zhao, Y., Wingen, L. M., Perraud, V., and Finlayson-Pitts, B. J.: Phase, composition, and growth mechanism for secondary organic aerosol from the ozonolysis of a-cedrene, Atmos. Chem. Phys., 16, 3245–3264, https://doi.org/10.5194/acp-16-3245-2016, 2016.
Zhou, L., Gierens, R., Sogachev, A., Mogensen, D., Ortega, J., Smith, J. N., Harley, P. C., Prenni, A. J., Levin, E. J. T., Turnipseed, A., Rusanen, A., Smolander, S., Guenther, A. B., Kulmala, M., Karl, T., and Boy, M.: Contribution from biogenic organic compounds to particle growth during the 2010 BEACHON-ROCS campaign in a Colorado temperate needleleaf forest, Atmos. Chem. Phys., 15, 8643–8656, https://doi.org/10.5194/acp-15-8643-2015, 2015.