the Creative Commons Attribution 4.0 License.
the Creative Commons Attribution 4.0 License.
 | 15 Jan 2019
Seesaw haze pollution in North China modulated by the sub-seasonal variability of atmospheric circulation
Ge Zhang
Wenju Cai
L. Ruby Leung
Shuxiao Wang
Minghuai Wang
Huayao Shan
Xiaohong Yao
Huiwang Gao
Utilizing a recent observational dataset of particulate matter with diameters less than 2.5 µm (PM2.5) in North China, this study reveals a distinct seesaw feature of abnormally high and low PM2.5 concentrations in the adjacent two months of December 2015 and January 2016, accompanied by distinct meteorological modulations. The seesaw pattern is postulated to be linked to a super El Niño and the Arctic Oscillation (AO). During the mature phase of El Niño in December 2015, the weakened East Asian winter monsoon (EAWM) and the associated low-level southerly wind anomaly reduced planetary boundary layer (PBL) height, favoring strong haze formation. This circulation pattern was completely reversed in the following month, in part due to a sudden phase change of the AO from positive to negative and the beginning of a decay of the El Niño, which enhanced the southward shift of the upper tropospheric jet from December to January relative to climatology, leading to an enhanced EAWM and substantially lower haze formation. This sub-seasonal change in circulation is also robustly found in 1982–1983 and 1997–1998, implicative of a general physical mechanism dynamically linked to El Niño and the AO. Numerical experiments using the Weather Research and Forecasting (WRF) Community Multiscale Air Quality (CMAQ) model were used to test the modulation of the meteorological conditions on haze formation. With the same emission, simulations for three super El Niño periods (1983, 1997 and 2015) robustly show higher PM2.5 concentrations under the mature phase of the super El Niño, but substantially lower PM2.5 concentrations during the decay phase of El Niño (and the sudden AO phase change), further verifying the modulation effect of the sub-seasonal circulation anomaly on PM2.5 concentrations in North China.
- Article
(6144 KB) - Full-text XML
-
Supplement
(2493 KB) - BibTeX
- EndNote


China has experienced severe haze pollution in recent years (Ding et al., 2016; Song et al., 2017; Tie et al., 2017; Zhang et al., 2015), with potentially detrimental effects on human health (Chen et al., 2017), as suggested by a substantial increase in hospital visits during the haze season (Liang et al., 2017; Q. Xu et al., 2017). Understanding the mechanism of haze formation is vital for developing effective measures to mitigate the haze pollution. Despite the continued reduction in anthropogenic emissions such as NOx, SO2 and CO in China in the past few years (Li et al., 2017; Liu et al., 2016; Wang et al., 2017), severe haze pollution motivates a need to understand the mechanism of haze distribution from a meteorological perspective (Ding et al., 2016; He et al., 2017). A few studies investigated the relationship between haze and climate variability at decadal timescales or longer (Jeong and Park, 2017; Liu et al., 2017; Wu et al., 2015; J. Xu et al., 2017; Yin et al., 2017; Zhang et al., 2016), while others examined the meteorological factors associated with specific severe haze events (Cai et al., 2017; Li et al., 2018; Yin et al., 2017).
By using a long-term observational dataset from 1972 to 2014, Li et al. (2016) found that the number of fog–haze days in winter across central and eastern China has a strong relationship with the East Asian winter monsoon (EAWM), with a weak EAWM favoring the accumulation of haze by weakening the near-surface wind speed. This effect was further illustrated by Yang et al. (2016) using a 20-year-long simulation from 1985 to 2005 with the Goddard Earth Observing System chemical transport model (GEOS-Chem). Focusing on the severe haze event in 2013, Cai et al. (2017) identified the conducive weather conditions for severe haze including weakened surface northerlies and northward shift of mid-troposphere northwesterlies extending to the north of Beijing, reducing the cold and dry flow to Beijing.
The recent severe haze event in December 2015 has been linked to the conditions of the strong El Niño (Chang et al., 2016; Yuan et al., 2017; Zhang et al., 2017). For example, Yuan et al. (2017) investigated the impact of El Niño on severe haze during November to December 2015 and found unfavorable meteorological conditions during this period, including a weak East Asian winter monsoon, reduced cold air intrusion, decreased low-level wind speed and enhanced stability unfavorable for the ventilation of pollutants. Similar to El Niño–Southern Oscillation (ENSO) but from a decadal simulation, Zhao et al. (2016) found that the decadal variations of haze days in central-eastern China during 1959–2012 are tightly associated with the Pacific Decadal Oscillation (PDO), with more haze days occurring during the positive PDO phase, primarily resulting from the enhancement of the Mongolian high and a stable atmosphere, whereas an opposite effect was observed during the negative phase of PDO. The modulating effect of El Niño on other air pollutants such as ozone has also been investigated. For example, L. Xu et al. (2017) found different effects of ENSO modulation on ozone between the developing and decaying phase of ENSO. During the developing phase in fall, El Niño tends to reduce ozone in the southeastern United States compared to La Niña, possibly due to the increased water vapor as an ozone sink and cooler surface air temperature and stagnation. In contrast, during the decaying phase in spring, ozone in the western United States shows some decreases, likely linked to the decreased temperature and enhanced water vapor in that region.
While it is highly possible that the severe haze pollution in November to December of 2015 is a result of the strong El Niño, the sudden drop in PM2.5 concentrations in January 2016 compared to December 2015 has heretofore largely been ignored. Puzzled by the seesaw pattern of severe haze pollution in December 2015 and the low PM2.5 concentrations in January 2016, this study aims to explore the possible mechanism behind this temporal seesaw phenomenon. The paper is organized as follows. In Sect. 2, we introduce the data and methodology used in the study, followed by the monthly variations of PM2.5 concentration in Sect. 3. In Sect. 4, mechanisms regarding the haze variations are investigated.
Meteorological data, including zonal and meridional wind at 500 and 850 hPa, geopotential height at 500 hPa, 2 m air temperature and planetary boundary layer (PBL) height, are from the European Centre for Medium-Range Weather Forecasts (ECMWF) Interim reanalysis data (ERA-Interim) (Dee et al., 2011), with a spatial resolution of 1.125∘ by l.125∘. Six-hourly data were downloaded to calculate monthly and daily means. A 30-year period of 1987–2016 is selected as the reference period when the anomaly is calculated. The Arctic Oscillation (AO) index and Niño 3.4 index are available on the Climate Prediction Center (CPC) website (http://www.cpc.ncep.noaa.gov/, last access: 21 December 2018).
The PM2.5 hourly concentrations during 2014–2017, the only period with available data, were downloaded from http://www.pm25.in (last access: 15 December 2018) for more than 1000 stations, and the data were interpolated to the same spatial resolution as the ERA-Interim, i.e., 1.125∘ by 1.125∘. A longer term dataset of PM2.5 concentrations from 2009 to 2017 at the U.S. Embassy Beijing (117∘ E, 40∘ N) was downloaded from http://www.stateair.net/web/historical/1/1.html (last access: 20 August 2018).
A regional meteorological model, Weather Research and Forecasting (WRF; Skamarock et al., 2008), coupled to a chemistry model, Community Multiscale Air Quality (CMAQ), was used to investigate possible factors modulating haze formation. WRF version 3.8.1 was used in this study, with physics options the same as those discussed in Gao et al. (2017); i.e., for the PBL, the Mellor–Yamada–Janjic scheme was used (Janjić, 1990; Mellor and Yamada, 1982). The domain covers the majority of East Asia (shown later; i.e., Fig. 5b), with a spatial resolution of 36 km by 36 km. The pressure of the model top is 50 hPa, with the Lambert conformal conic projection centered at 34∘ N, 110∘ E. A total of 34 layers were used, with the top of the first layer at about 40 m. The initial and boundary conditions for WRF were provided by the NCEP Climate Forecast System Reanalysis (CFSR) version 2 (Saha et al., 2013), with a spatial resolution of 0.5∘ × 0.5∘. For regional chemistry, the widely used CMAQ model (Byun and Ching, 1999; Byun and Schere, 2006), with the latest version 5.2, was used in this study, with the carbon-bond version 6 (CB06) for the major gas-phase chemistry and AERO6 for the aerosol module. The removal of particulate matter includes dry and wet deposition. Dry deposition is in general expressed by the product of dry deposition velocity and the concentration of pollutants. The dry deposition velocity is the inverse of resistance including aerodynamic resistance, molecular motion and surface resistance, and more details were discussed in Pleim and Ran (2011). The wet deposition of pollutants depends on their concentrations in cloud water and the precipitation rate, and the algorithms were based on the regional acid deposition model (RADM; Chang et al., 1987). The latest version of the Meteorology-Chemistry Interface Processor (MCIP 4.3) was used to post-process WRF results and prepare input data for CMAQ (Otte and Pleim, 2010). The initial and boundary chemical conditions were derived from the Model for Ozone and Related chemical Tracers, version 4 (MOZART-4). Downscaling from MOZART to CMAQ has been developed and will be discussed in detail in an upcoming paper (Ma et al., 2019). The emissions of air pollutants in China were estimated by Tsinghua University (Wang et al., 2014; Zhao et al., 2013, 2017, 2018) using an emission factor method. The provincial emissions from area and mobile sources were calculated from the activity data (energy consumption, industrial product yields, solvent use, etc.), technology-based uncontrolled emission factors and penetration of control technologies, and subsequently distributed to the model grids according to the spatial distribution of population, GDP and road networks. A unit-based method is applied to estimate and locate the emissions from large point sources including power plants, iron and steel plants and cement plants. The emissions from open burning of agricultural residue have been included in the anthropogenic emission inventory developed by Tsinghua University. They were calculated based on crop yields, the ratio of residue to crop, the fraction of biomass burned in the open field and emission factors (Wang and Zhang, 2008; Zhao et al., 2013, 2018). The emissions from natural forest and grassland fires were ignored in this study, primarily due to the relatively small contribution in particular over North China (Qin and Xie, 2011). Biogenic emissions were calculated using the Model of Emissions of Gases and Aerosols from Nature (MEGAN; Guenther et al., 2006). For each month of the CMAQ simulations, a week of model spin-up was used to reduce the influence of the initial conditions.
3.1 Difference of PM2.5 in December 2015 and January 2016
Figure 1 shows the spatial distribution of PM2.5 concentration in December 2015 (Fig. 1a) and the monthly mean difference between the anomaly of January 2016 (relative to January from 2015 to 2017) and December 2015 (relative to December from 2014 to 2016). The 3-year average PM2.5 concentration in December (2014–2016) and January (2015–2017) is shown in Fig. S1 in the Supplement. Consistent with previous studies (Chang et al., 2016; Yuan et al., 2017; Zhang et al., 2017), severe haze pollution occurred in December 2015, particularly over the North China Plain (NCP) (black box in Fig. 1a, excluding the Bohai area), with monthly mean PM2.5 as high as 148 µg m−3, much higher than that in December 2014 (97 µg m−3) and slightly higher than that in December 2016 (135 µg m−3). In January 2016, the anomaly (relative to January from 2015 to 2017) of PM2.5 showed a large decrease compared to the anomaly of December 2015 (relative to December from 2014 to 2016) over the NCP, with a mean decrease of 35 µg m−3, whereas the PM2.5 anomalies increase in January 2015 (33 µg m−3) and 2017 (3 µg m−3) relative to the adjacent December anomaly (Fig. S2 in the Supplement).
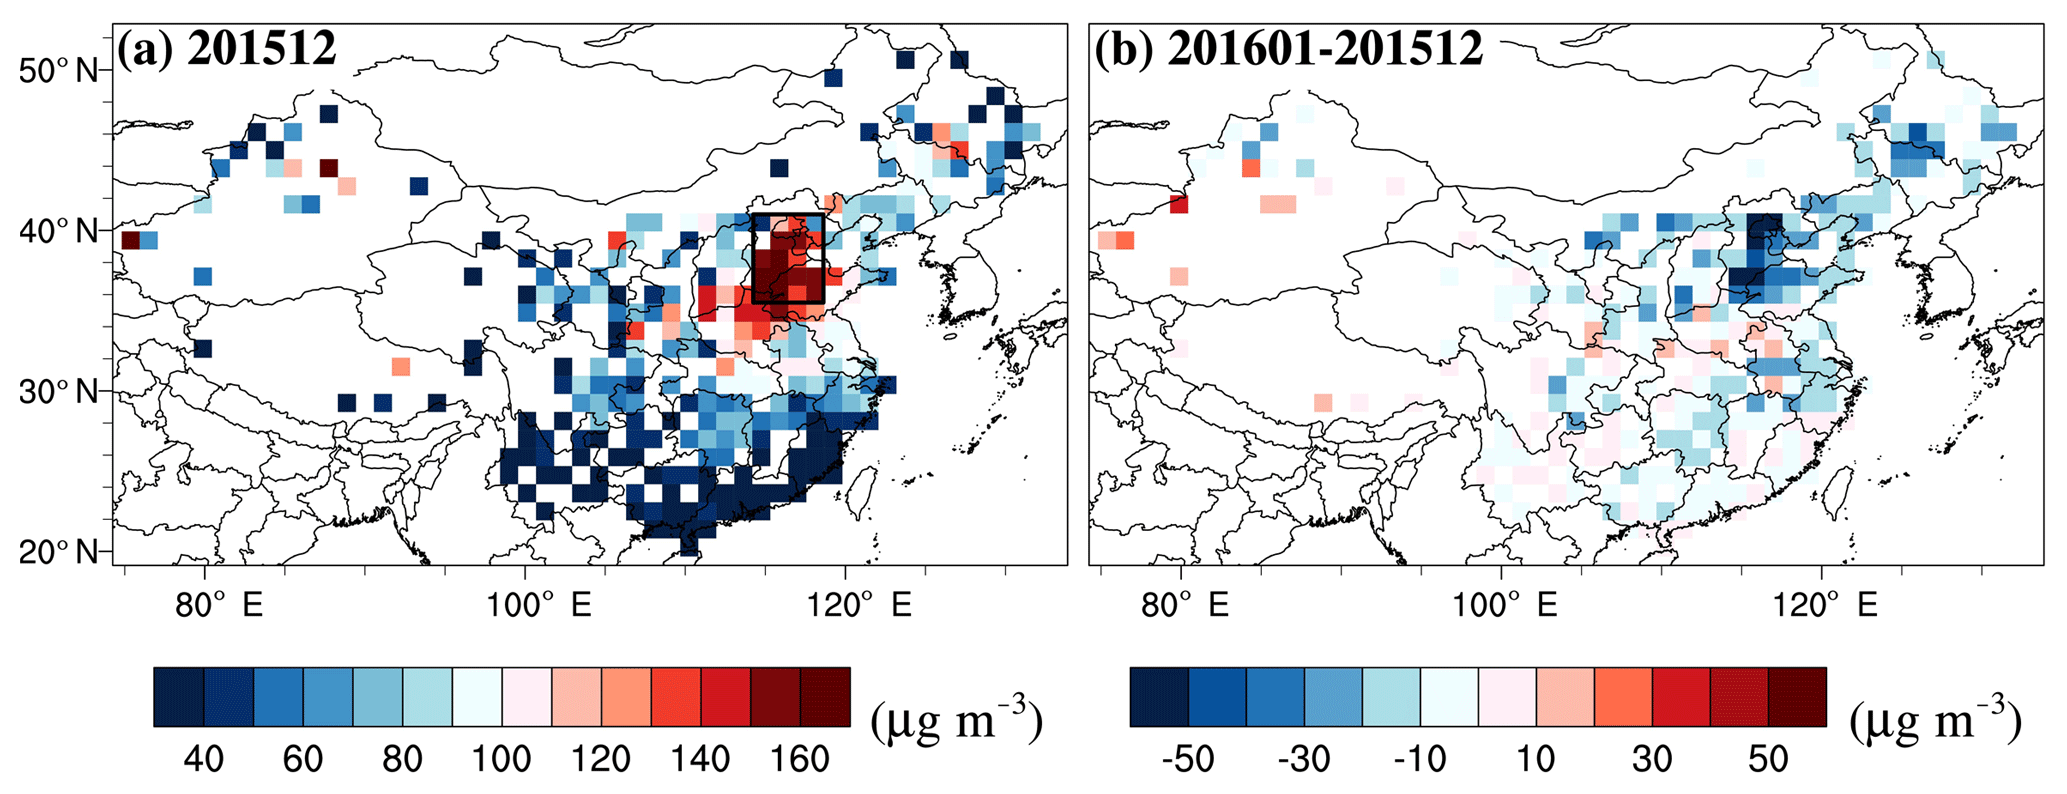
Figure 1Monthly mean PM2.5 concentration in December 2015 (a), and the difference (b) between the anomaly of January 2016 (relative to January from 2015 to 2017) and December 2015 (relative to December from 2014 to 2016). The black box in (a) indicates the area of the NCP.
3.2 PM2.5 anomaly from long time series
To further test the robustness of the large drop of PM2.5 from December 2015 to January 2016, the monthly mean anomaly of PM2.5 relative to 2009–2017 over the U.S. Embassy Beijing is shown in Fig. 2. The PM2.5 anomaly in December is generally negative (i.e., low PM2.5 concentration) from 2009 to 2014, and this changes to a substantial positive value of 48 µg m−3 in 2015. For the January PM2.5 anomaly, the large positive value in 2013 has been widely studied to investigate the mechanisms modulating severe haze events (Han et al., 2016; Kajino et al., 2017; Shi et al., 2017; Ye et al., 2016). Looking at the difference between the January and December anomalies, the exceptional difference between January 2016 and December 2015 stands out, with the PM2.5 concentration anomaly (−38 µg m−3) in January 2016 showing a decrease of −86 µg m−3 relative to the anomaly in December 2015 (48 µg m−3), which is much more negative than the difference in any other years and far more negative than the 99 % confidence interval value of −66 µg m−3.
In addition to the single site of the U.S. Embassy Beijing, two other datasets of the air pollution index (API; http://datacenter.mep.gov.cn/, last access: 21 December 2018) and the air quality index (AQI; http://www.pm25.in, last access: 10 January 2019) were combined to illustrate the robustness of the abnormal difference between January and December PM2.5 over a larger spatial area in the NCP (black box in Fig. 1). Combining the API and AQI data allows the anomaly to be calculated relative to a longer period despite the short record of the AQI data. Similar to Fig. 2, an abnormally high concentration in December 2015 and a low concentration in January 2016 are also found in the API–AQI record (Fig. S3 in the Supplement). As anthropogenic emissions such as NOx, SO2 and primary PM2.5 have been steadily decreasing since 2011 (Liu et al., 2016; Wang et al., 2017), the abnormally high PM2.5 concentration in December 2015 requires an explanation. Moreover, the anthropogenic emissions in January could be comparable to or higher than that in December; i.e., in January 2016, higher SO2 concentration, implicative of SO2 emissions, was found than December 2015, based on observed data (http://www.pm25.in; last access: 10 January 2019; not shown). Thus, what mechanism triggered the sharp decrease of haze in January 2016 compared to December 2015 needs to be investigated.
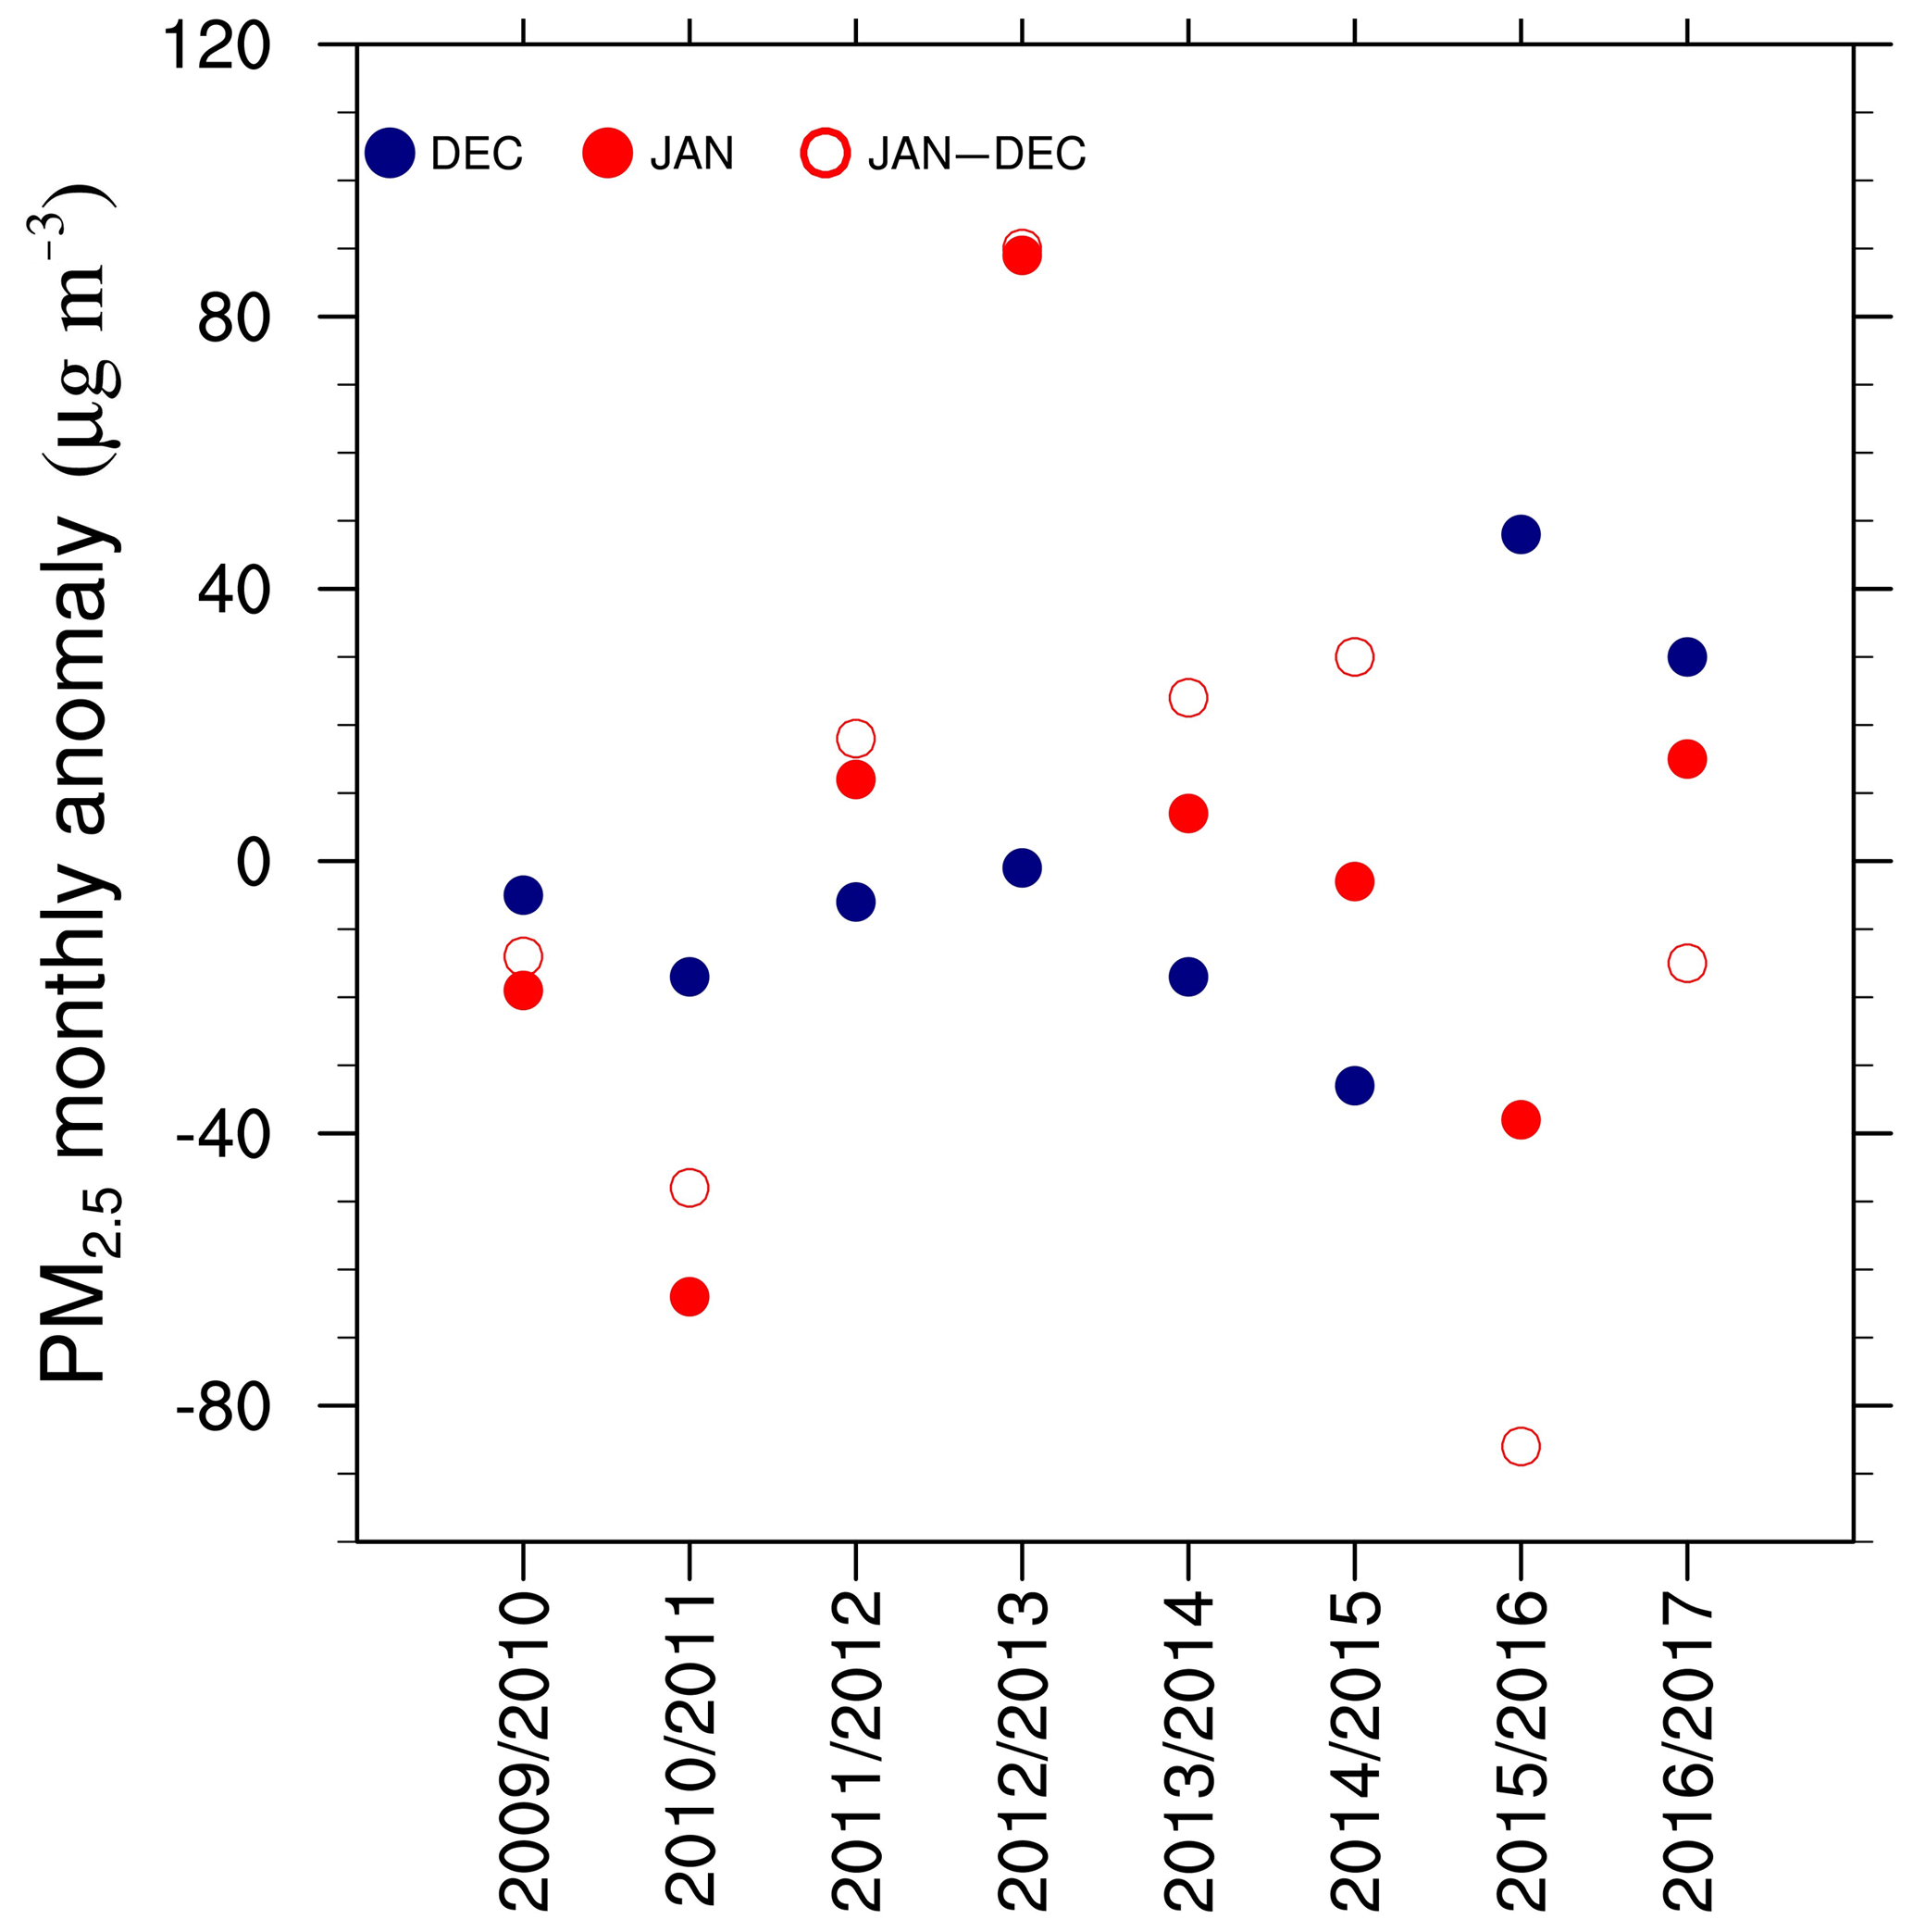
Figure 2Monthly mean anomaly of PM2.5 in the adjacent months of December (solid blue) and January (solid red) as well as the change (hollow red circle) from December to January during 2009–2017 over the U.S. Embassy Beijing. For December (January), the anomaly is relative to the 2009–2016 (2010–2017) 8-year respective monthly mean value.
4.1 The effect of meteorological modulation
To determine if meteorological factors play a role in the anomalous December to January change in PM2.5, we first examined the mid-tropospheric circulation system during December 2015 and January 2016. As shown in Fig. 3a for December 2015, the northeastward shift of Siberian High and anticyclonic high pressure system in the NCP reduced the northerly wind transporting cold air from Siberia to the NCP, favoring the haze formation (Cai et al., 2017; Chang et al., 2016). In January 2016 (Fig. 3b), a low pressure system dominates over the NCP area, enhancing the northerly wind blowing from Siberia and relieving haze formation. An important question here is whether the transition of the meteorological conditions from December 2015 to January 2016 was influenced by climate variations on seasonal-to-decadal timescales with some level of predictability.
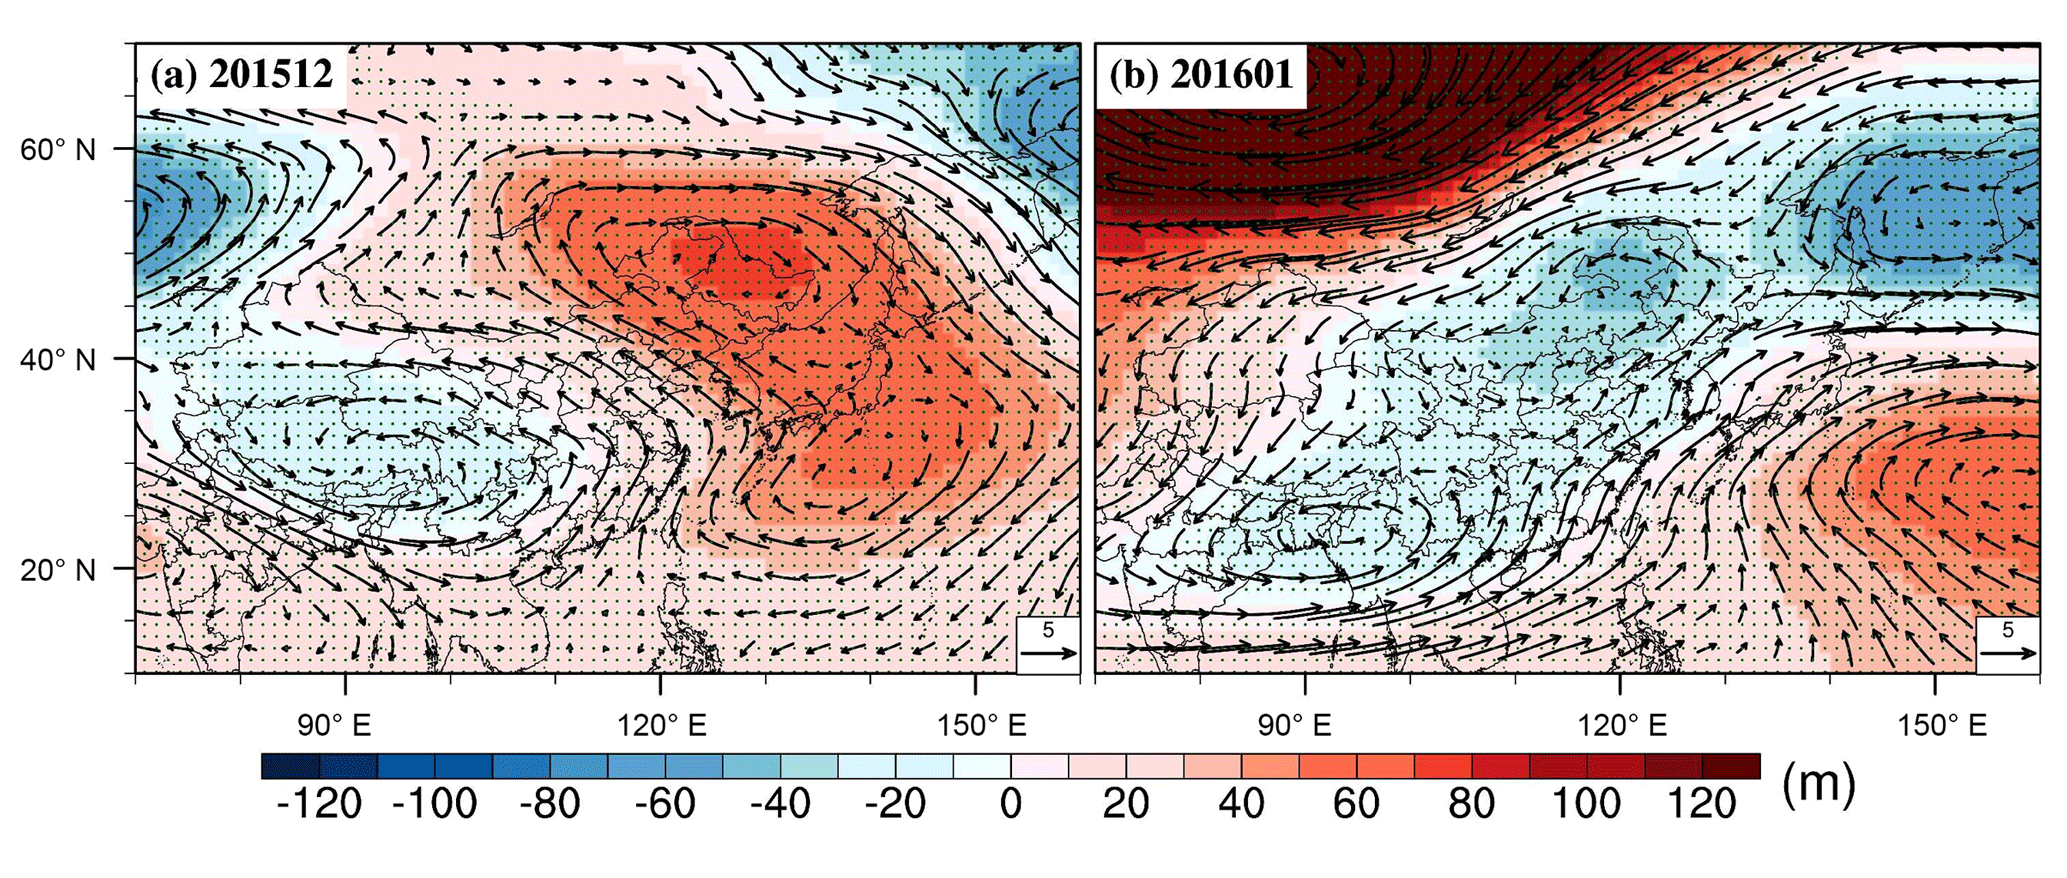
Figure 3Anomaly of geopotential height and wind vector at 500 hPa (unit: m s−1) for December 2015 (a) and January 2016 (b), with the anomaly relative to the respective month in 1987–2016. Stippled areas indicate geopotential height exceeding the 90th confidence interval. The 90th confidence interval was calculated for each grid based on a two-tailed t distribution method using the respective months' data over the 30-year (1987–2016) period (i.e., geopotential height or wind vector at 500 hPa).
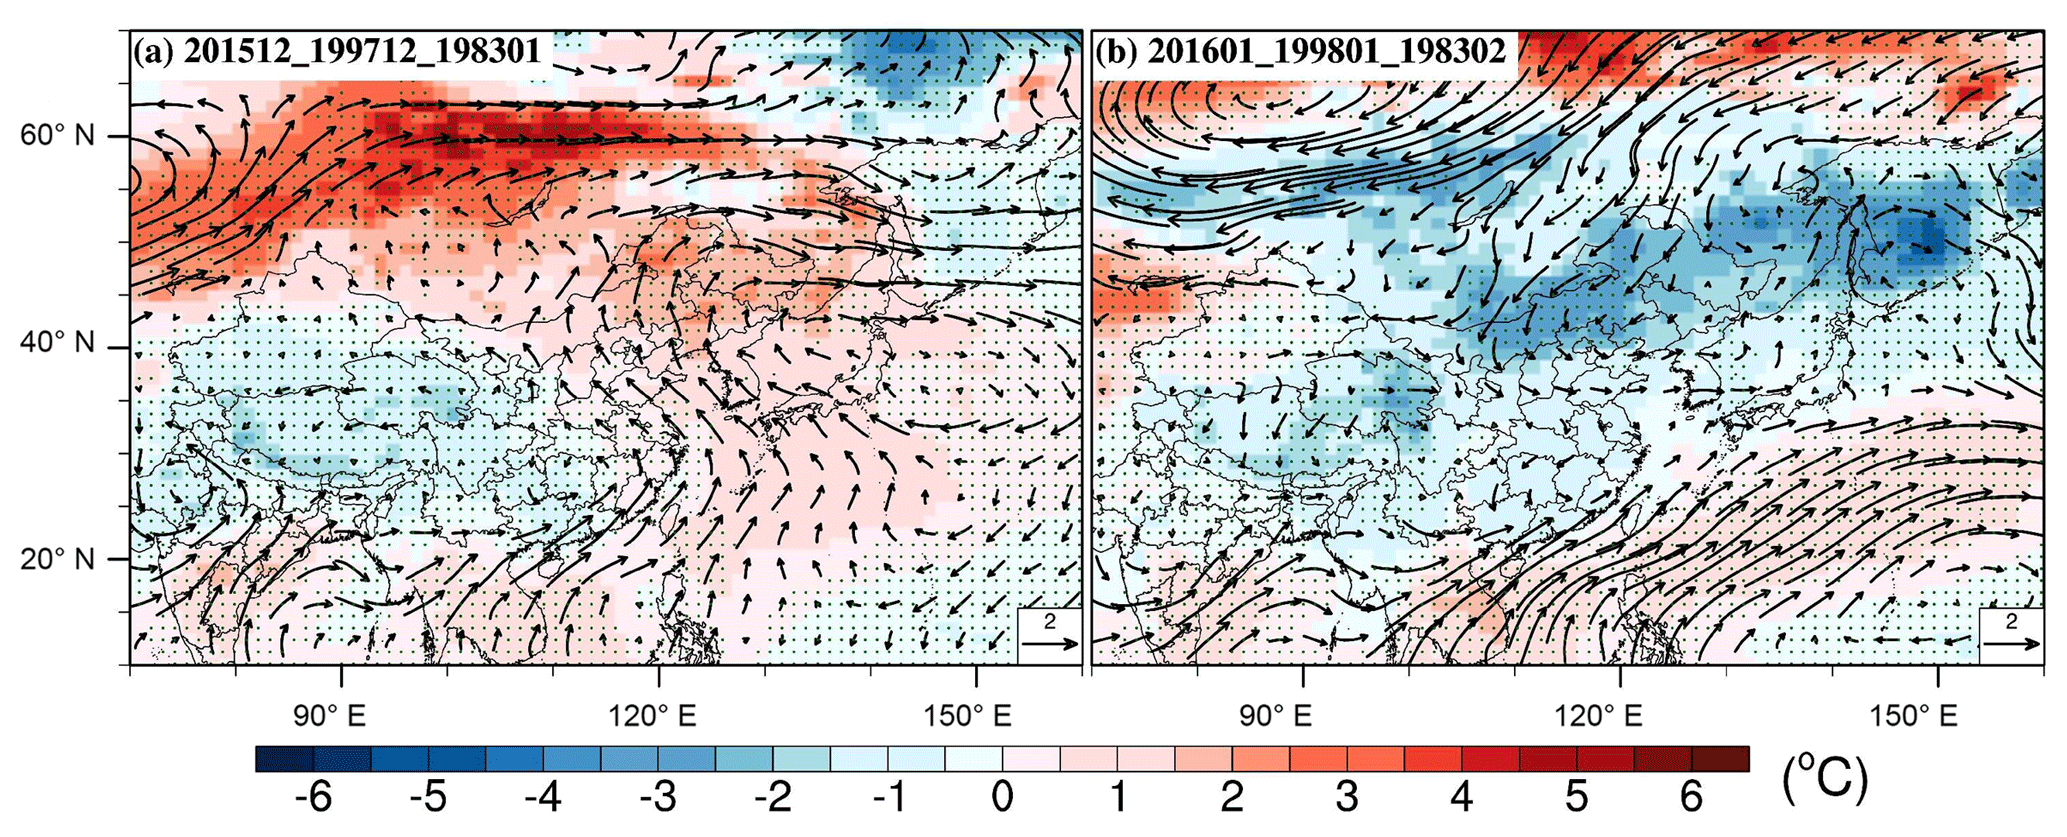
Figure 4850 hPa wind anomaly (unit: m s−1) and 2 m air temperature anomaly (relative to 1987–2016). The anomaly was conducted over the respective month from 1987 to 2016, i.e., the mean value of the anomaly over December 2015, December 1997 and January 1983 (a) and over January 2016, January 1998 and February 1983 (b). Stippled areas indicate 2 m air temperature exceeding the 90th confidence interval (the same method as Fig. 3).
4.2 Possible linkage with climate variability
From the Niño 3.4 index, defined as the 3-month running regional mean sea surface temperature (SST) anomaly over the tropical region (5∘ S–5∘ N, 170–120∘ W) relative to 1951–2000 (Rayner et al., 2003), the El Niño signal reached a peak in December 2015, and started to decay in January 2016. The development and decay of this El Niño event and the associated change in circulation pattern have been well documented by Xue and Kumar (2017). The 2015–2016 El Niño event is known as a superstrong event comparable to the other two super events during 1982–1983 and 1997–1998 (Ren et al., 2017). Thus, it is appropriate to ask whether the circulation pattern in the NCP was modulated by the development of a super El Niño. Motivated by this question, we examined the super El Niño events in 1982–1983 and 1997–1998 based on Niño 3.4. In 1997–1998, the El Niño peaked in December 1997 and started to decay in January 1998, but in 1982–1983, the El Niño peaked in January 1983 and started to decay in February 1983. The 500 hPa geopotential height anomalies during these four months are shown in Fig. S4. Consistent with the anomalous circulation features in Fig. 3, an anticyclonic circulation anomaly dominates over the NCP during the peak of the El Niño (December 1997 and January 1983), while a cyclonic circulation anomaly prevails over the same region when the El Niño started to decay (January 1998 and February 1983). To exclude these opposite anomaly patterns as climatological features, we checked the 500 hPa anomalies in December, January and February during the past 30 years (1987–2016) but we could not find similar opposite patterns in adjacent winter months during any other years. Moreover, the ensemble mean circulation anomaly during the peak and decay of the El Niño events from 1948 to 2016 is shown in Fig. S5 in the Supplement, and only the composite of three super El Niño events (1982–1983, 1997–1998 and 2015–2016; Fig. S5a, b) shows the seesaw pattern, whereas the other ensemble results did not show such a unique feature (Fig. S5c–f). This further hints at the possible linkage between the anomalous circulation patterns and the super El Niño.
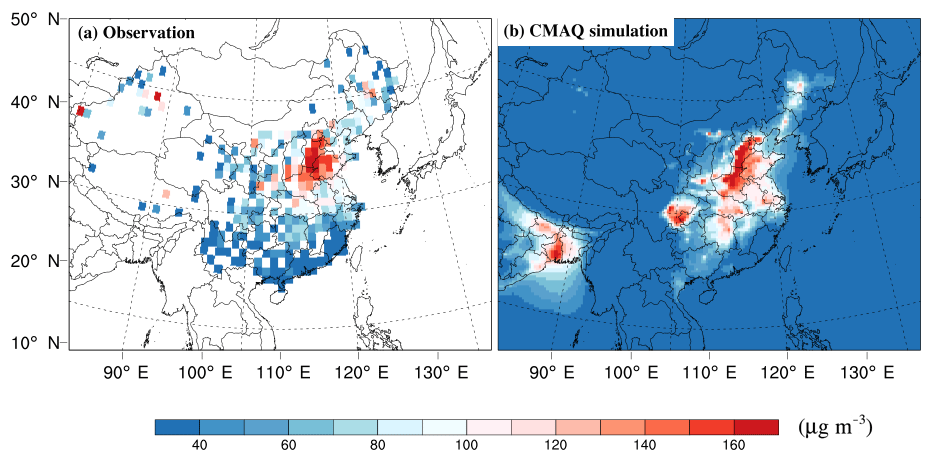
Figure 5Spatial distributions of monthly mean PM2.5 concentration in December 2015 for observations (a) and CMAQ simulation (b). Please note that the label bar starts from 40 µg m−3 instead of 0 in order to aid easy viewing of the comparison.
Table 1Evaluation of WRF performance over North China (nine stations)∗.
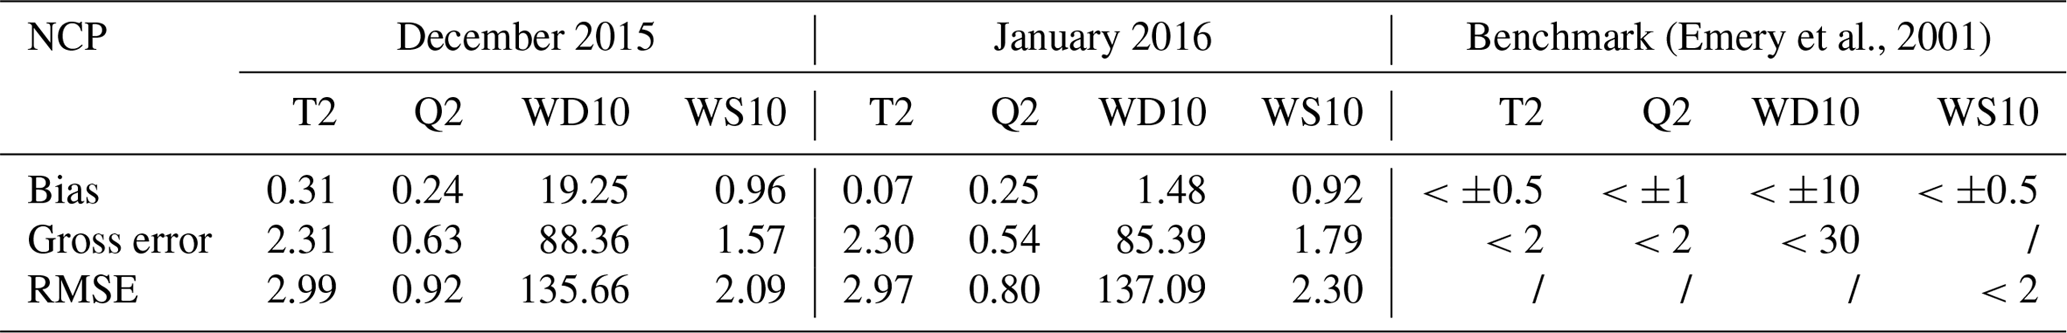
* T2: temperature at 2 m in units of ∘C. Q2: specific humidity in units of g kg−1. WD10: wind direction at 10 m in units of degrees. WS10: wind speed at 10 m in units of m s−1. RMSE denotes the root mean square error.
Since low-level wind has a larger influence on the formation of haze than mid-tropospheric wind, the composited anomaly of the 850 hPa wind vector and near-surface air temperature during the adjacent months of the super El Niño events (January 1983, December 1997 and December 2015 versus February 1983, January 1998 and January 2016) are shown in Fig. 4, while the anomaly of the near-surface wind at 10 m is shown in Fig. S6 in the Supplement. These figures clearly depict opposite anomaly patterns in the NCP, showing a southerly anomaly (Figs. 4a, S6a) during the peak of the El Niño, and a northerly anomaly (Figs. 4b, S6b) during the start of the decay phase. The southerly wind anomaly, abnormally warm near-surface air temperature and stagnant weather conditions over the NCP are indicative of a weakened EAWM (Hui and Xiang, 2015), partly related to the warmer air temperature over the northern plain and Siberia and reduced pressure contrast between the Asian continent and the western Pacific Ocean, favoring haze formation (Cai et al., 2017; Li et al., 2018). In contrast, there is enhanced northerly flow and more cold air advection (Figs. 4b, S6b) when El Niño starts to decay. The low-level circulation patterns and near-surface air temperature are consistent with the seesaw changes of 500 hPa geopotential height from the peak of the El Niño development to the beginning of its decay for all three super El Niño events, highly implicative of a strong relationship between El Niño and haze formation.
4.3 Sensitivities of PM2.5 to meteorological conditions
As shown in the above analyses, the meteorological conditions in December 2015, December 1997 and January 1983 exhibit a clear contrast with those of the following month. To demonstrate a connection between the meteorological conditions and haze formation, we used the WRF-CMAQ regional model to simulate haze for the three time periods under the same emissions, with a spatial resolution of 36 km by 36 km. The simulated meteorological conditions including near-surface (2 m) air temperature (T2) and specific humidity (Q2) and 10 m wind speed (WS10) and direction (WD10) were evaluated using the NCEP Meteorological Assimilation Data Ingest System (MADIS; https://madis.noaa.gov, last access: 21 December 2018) data on an hourly timescale. Using the benchmark based on Emery et al. (2001), the meteorological parameters compared reasonably well with observations and mostly fall within or quite close to the benchmark, shown in Table 1 below. Please note that the slightly larger bias (19.25∘) of wind direction at 10 m (WD10) in December 2015 is partly attributable to the model comparison with observed values close to 0∘ or 360∘, which may yield a large bias despite the small differences in reality (i.e., 10∘ in model versus 350∘ in observations).
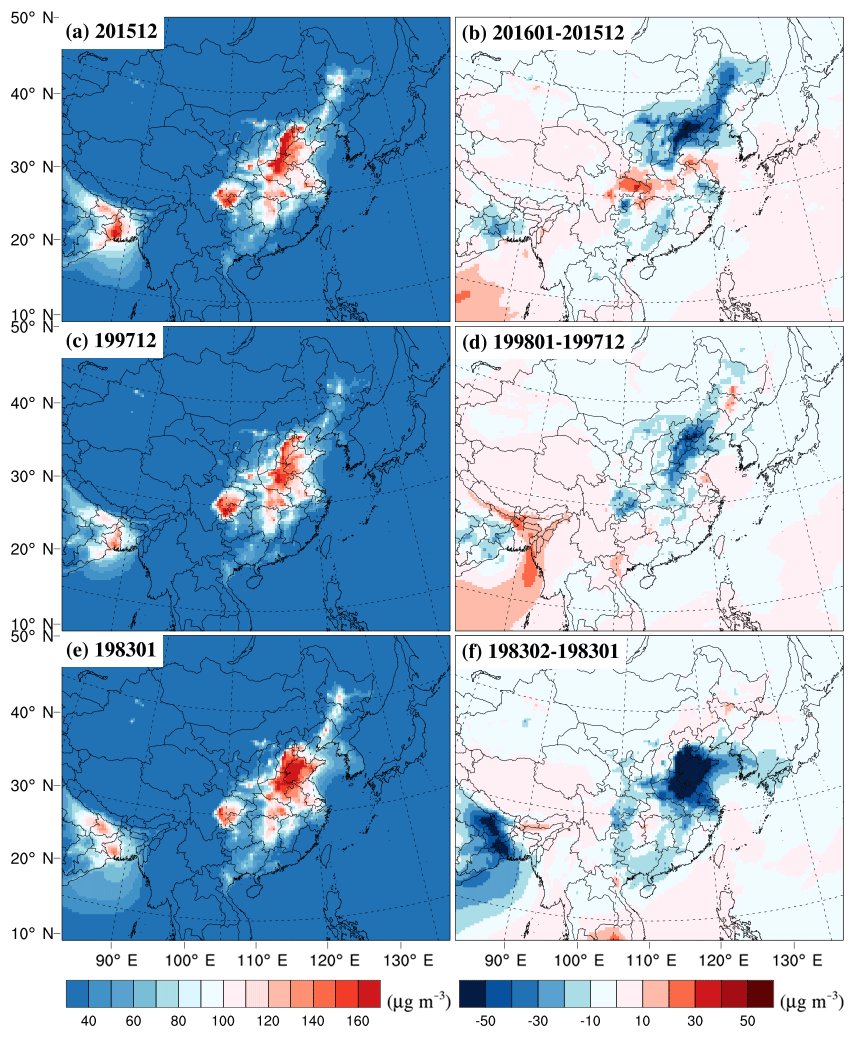
Figure 6Monthly mean PM2.5 during the three super El Niño events, i.e., December 2015 (a), December 1997 (c) and January 1983 (e) and the differences of PM2.5 compared to the following month (b, d, f).
MCIP was used to prepare input for CMAQ. A code bug in MCIP 4.3 for processing land use information was found that affected the percentage of urban area (PURB), leading to low PM2.5 concentration in the simulations over urban areas (see Sect. S2 of the Supplement for more details). With the bug fix, the concentration of PM2.5 matches the observations well (Fig. 5). Statistical metrics such as mean fractional bias/error (MFB/MFE) were used to evaluate the simulation of PM2.5, as recommended by the US EPA (US EPA, 2007). Based on almost 200 observational sites in North China, the MFB/MFE of PM2.5 from CMAQ is 1 %/55 % and 1 %/56 %, respectively, for December 2015 and January 2016, satisfying the benchmark of 50 %/75 % (US EPA, 2007). More evaluation of PM2.5 is discussed in Sect. S3 of the Supplement.
Figure 6 shows the spatial distribution of monthly mean PM2.5 in December 2015 (Fig. 6a), December 1997 (Fig. 6c) and January 1983 (Fig. 6e) and the differences compared to the PM2.5 in the following month. Although the same emissions at the level of December 2015 were used across the simulations, the results clearly show much higher monthly mean PM2.5 in December 2015 (Fig. 6a), December 1997 (Fig. 6c) and January 1983 (Fig. 6e), particularly over the NCP compared to the following month (Fig. 6b, d, f), with a mean reduction in the NCP of 30–50 µg m−3 or more. In addition, we applied process analysis (Kwok et al., 2013), including horizontal and vertical transport, gas-phase chemistry, aerosol processes, cloud processes, dry deposition and emissions, to investigate the effect of different processes on PM2.5. The dominant PM2.5 enhancement processes in both December 2015 and January 2016 are emissions and aerosol processes. Regarding the removal process, the dominant process is vertical transport, followed by dry and wet deposition (inferred from cloud processes). Both dry and wet deposition contributed a total of 12 % to the total removal processes over the NCP in December 2015, comparable to that (13 %) in January 2016, indicating that the seesaw pattern was not modulated by deposition. Hence the modeling results further verified the effect of the meteorological conditions on the seesaw PM2.5 pattern.
4.4 Synthesis of the mechanism modulating the PM2.5 variations
The different modulation effects of the development and decay phase of El Niño on East Asian summer monsoon circulation have been noted in previous studies (Xue et al., 2018; Yuan and Yang, 2012). For example, Xue et al. (2018) discussed a mechanism for how the developing El Niño in the summer modulates the intraseasonal variation of the western Pacific subtropical high (WPSH). They found that compared to June and July, enhanced convection in August over the warm pool significantly reduces the 500 hPa geopotential height and pushes the WPSH to retreat substantially eastward. For intraseasonal variation in winter, Nie et al. (2016) found that the change from a warm anomaly in December 2015 to cold anomaly in January 2016 in the NCP is possibly associated with the sudden shift of the Arctic Oscillation (AO) from a positive phase to a negative phase in January 2016, which is dynamically linked to a super El Niño (Geng et al., 2017). The impact of the AO on the EAWM was also demonstrated in December 2012 when the Siberian high and cold advection were strong during the negative phase of the AO, but a transition of the AO to a positive phase in January 2013 caused a sudden weakening of cold advection and increased stagnation. The resulting severe haze in January 2013 has previously been widely discussed (Cheng et al., 2017; Kajino et al., 2017).

Figure 7Sub-seasonal changes of the anomaly of 200 hPa zonal wind (relative to the respective month in 1987–2016) during the start of the decay for three super El Niño events, including the differences between the anomaly of February 1983 and January 1983 (a), January 1998 and December 1997 (b) and January 2016 and December 2015 (c).
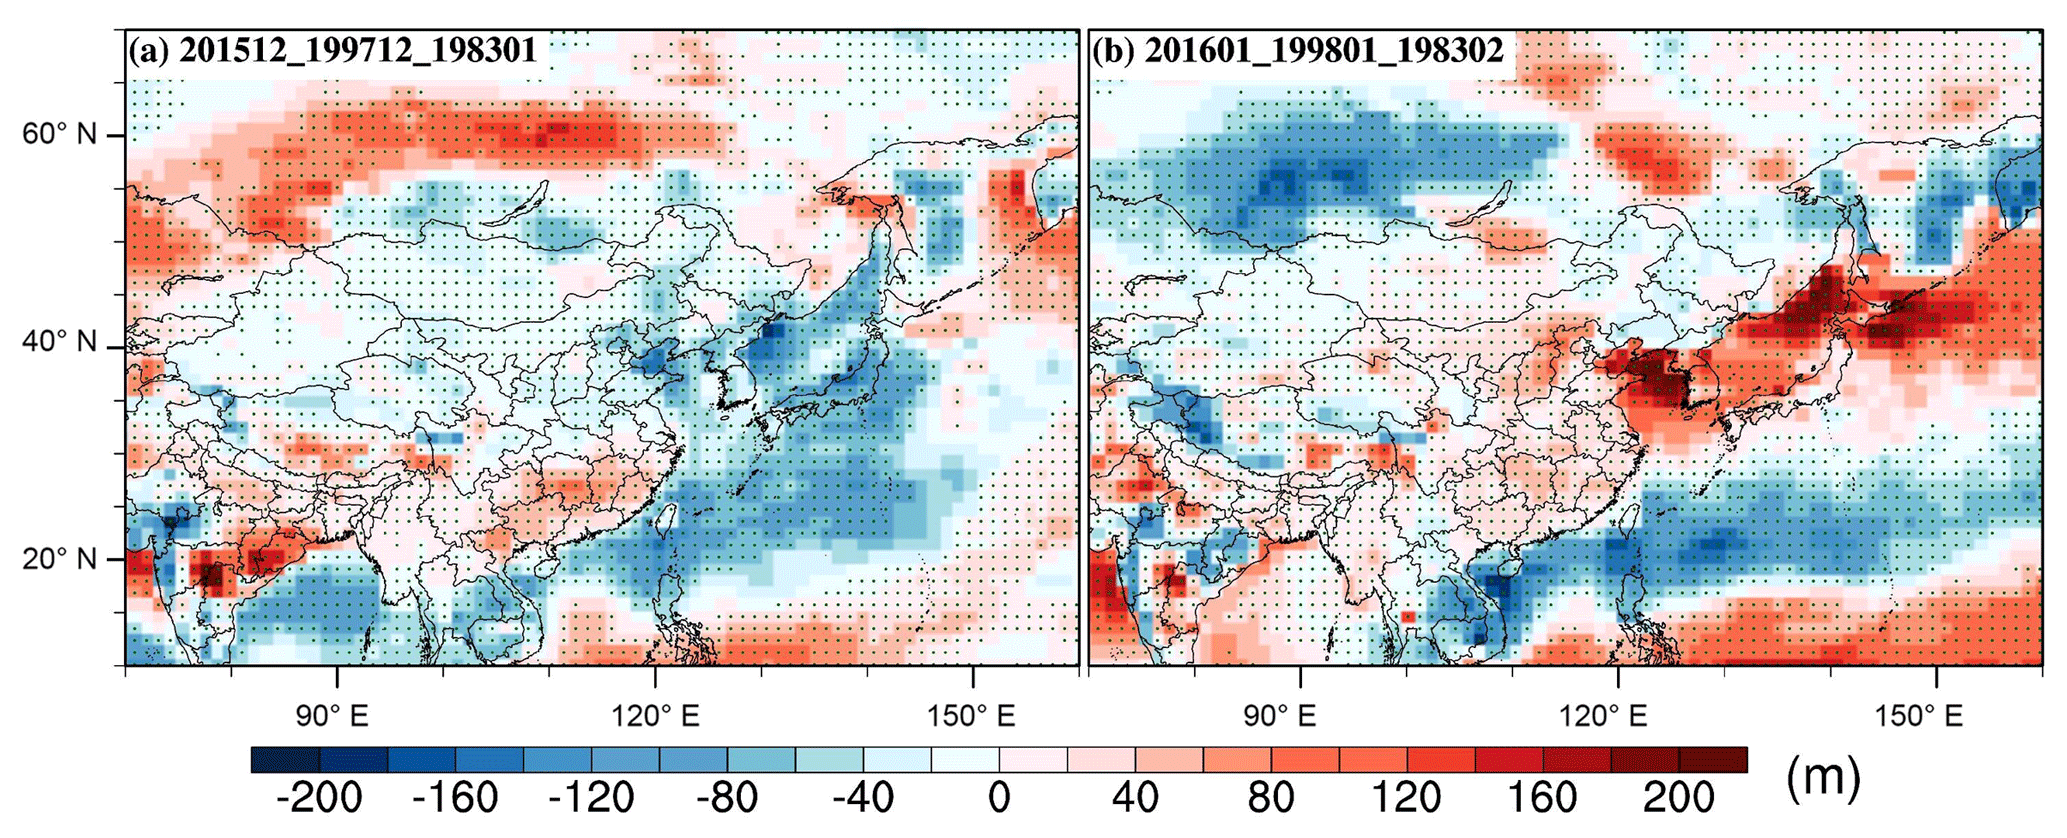
Figure 8Sub-seasonal changes of the PBL height anomaly (relative to 1987–2016). The anomaly was conducted over the respective month from 1987 to 2016, i.e., the mean value of the anomaly over December 2015, December 1997 and January 1983 (a) and over January 2016, January 1998 and February 1983 (b). Stippled areas indicate exceedance of the 90th confidence interval, using the same method as in Fig. 3.
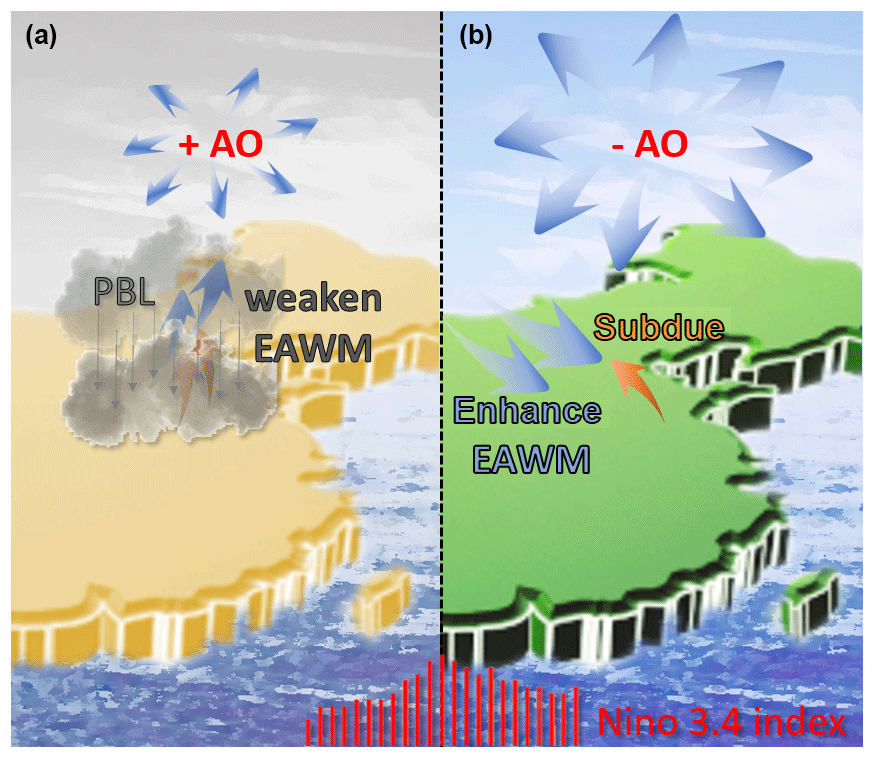
Figure 9Schematic of the modulation of El Niño and Arctic Oscillation on atmospheric circulation and haze in northern China.
The EAWM is closely related to winter haze conditions in the NCP. Cheung et al. (2012) found that in general, the EAWM is weakened (enhanced) when the AO and ENSO are in phase (out of phase). They also noted that a similar relationship at a sub-seasonal timescale may be further investigated considering the possibility of a sharp reversal of the AO resulting from tropospheric–stratospheric interaction (Baldwin and Dunkerton, 1999). To delve into the mechanism modulating the sudden reversal of the AO from a positive to a negative phase during the decay of the mature phase of El Niño, anomaly zonal wind changes at 200 hPa are shown in Fig. 7. Climatologically (i.e., 1987–2016), the subtropical jet is centered around 35–40∘ N in December and shifts southward in January based on ERA-Interim (not shown). A clear dipole feature of the sub-seasonal changes of anomaly zonal wind with a negative change north of 40∘ N indicates an obvious anomalous sub-seasonal southward shift of the subtropical jet during the three El Niño events from its climatological sub-seasonal shift. The subtropical jet shift has been confirmed by Geng et al. (2017) using climate model simulations, showing a phase transition of the AO from positive to negative in early January during a super El Niño winter. The southward shift of the upper tropospheric jet in January 2016 is likely associated with the weakened stratospheric polar vortex and the subsequent negative phase of the AO (Bell et al., 2009; Fletcher and Kushner, 2010), leading to more cold advection, enhanced EAWM and higher PBL height compared to the conditions during the peak of the El Niño with lower PBL height (Fig. 8a). These changes in the meteorological conditions associated with the changes in the El Niño development and AO phase shift and the consequent changes in PM2.5 concentration are summarized schematically in Fig. 9. In short, during the mature phase of El Niño (Fig. 9a; indicated by the red Niño 3.4 index in the bottom of Fig. 9), the El Niño and the positive AO (+AO) are in phase and weaken the EAWM (with orange and blue arrows indicating effects from the El Niño and the AO, respectively, in Fig. 9a), leading to a lower PBL and subsequent severe haze pollution. After the mature phase of El Niño (Fig. 9b), the AO suddenly turns to the negative phase (−AO), enhancing the EAWM (blue arrows in Fig. 9b) and subduing the weakening effect from El Niño (the southerly orange arrow) on EAWM, resulting in low PM2.5 concentration.
This study identifies a distinct seesaw feature of abnormally high and low monthly mean PM2.5 concentration in the two consecutive months of December 2015 and January 2016, respectively, in the North China Plain. Accompanying the seesaw features of PM2.5 are opposite large-scale circulation patterns with a positive (negative) anomaly of 500 hPa geopotential height and southerly (northerly) wind anomalies at the low level (850 hPa) over the North China Plain during December 2015 (January 2016). The contrast in PM2.5 between December 2015 and January 2016 is significantly larger than the change from December to January between 2009 and 2017 recorded at the U.S. Embassy Beijing.
As the modulation of meteorological conditions on PM2.5 occurred during a strong El Niño period, we explored the relationship between the strong El Niño and PM2.5. First, using a regional climate–chemistry model, WRF-CMAQ, we identified that all three super El Niño events in recent record (1982–1983, 1997–1998 and 2015–2016) show similar seesaw modulation features of PM2.5. Further analysis showed that the seesaw PM2.5 variations are modulated by the combined effect of El Niños and the Arctic Oscillation (AO). In December 2015, the mature phase of an extreme El Niño, accompanied by a positive AO, weakened the EAWM, as indicated by a positive anomaly of geopotential height at the mid-troposphere (i.e., 500 hPa) and southerly wind anomalies at the low level (i.e., 850 hPa) over the North China Plain (NCP), resulting in reduced PBL height, abnormally warm temperature and substantial haze accumulation during this period. In the following month (January 2016) when the El Niño began to decay, a sharp reversal of the AO from a positive phase (in December 2015) to a negative phase triggered enhanced EAWM, inducing cold advection and anomalous low-level northerly winds over the NCP that fostered atmospheric dispersion and substantially reduced haze formation. This abrupt change of the AO from a positive to a negative phase was robustly found for the other two extreme El Niño events during the corresponding decay period (February 1983 and January 1998) after the mature phase (January 1983 and December 1997). These changes in circulation are likely associated with a southward shift of the upper troposphere jet at 200 hPa and weakened stratospheric vortex during the decay phase compared to the mature phase of El Niño. As the frequency of super El Niños like the 2015–2016 event is projected to increase in the future (Cai et al., 2014, 2015), the seesaw modulation of super El Niños and the AO may become more frequent, revealing vital information useful for policymakers dealing with air quality issues in China.
Although we performed WRF-CMAQ simulations to demonstrate the impacts of atmospheric circulation during three super El Niño events on haze, this study did not isolate the general effect of El Niño and the AO on haze formation. To address this limitation, future studies will design Atmospheric Model Intercomparison Project (AMIP)-type scenarios, e.g., by running multi-ensemble members of scenarios with global models such as the Community Earth System Model (CESM) using different SSTs over the Niño 3.4 area combined with dynamical downscaling using regional climate–chemistry models such as WRF-CMAQ to elucidate the impact of El Niño and the AO on haze formation.
The observational and reanalysis data are available from the websites provided in the paper, and the WRF-CMAQ model output can be accessed by contacting Yang Gao (yanggao@ouc.edu.cn).
The supplement related to this article is available online at: https://doi.org/10.5194/acp-19-565-2019-supplement.
YG came up with the original idea of PM2.5 seesaw phenomenon and designed the experiment to investigate the mechanism, GZ conducted all the analysis, WC and LRL helped in the discussion of the PM2.5 seesaw feature and the modulation mechanism, SW and BZ prepared the emission inventory, and MW, HW, XY and HG helped in the discussion and interpretation of the WRF-CMAQ results. All the authors contributed to the writing of the paper.
The authors declare that they have no conflict of interest.
This article is part of the special issue “Regional transport and transformation of air pollution in eastern China”. It is not associated with a conference.
This research was supported by grants from the National Natural Science
Foundation of China (91744208, 41705124), Shandong Provincial Natural Science
Foundation, China (ZR2017MD026), and the Fundamental Research Funds for the
Central Universities (201712006; 201762010). PNNL is operated for DOE by
the Battelle Memorial Institute under contract DE-AC05-76RL01830.
Edited by: Yuan Wang
Reviewed by: three
anonymous referees
Baldwin, M. P. and Dunkerton, T. J.: Propagation of the Arctic Oscillation from the stratosphere to the troposphere, J. Geophys. Res., 104, 30937–30946, https://doi.org/10.1029/1999JD900445, 1999.
Bell, C. J., Gray, L. J., Charlton-Perez, A. J., Joshi, M. M., and Scaife, A. A.: Stratospheric Communication of El Niño Teleconnections to European Winter, J. Climate, 22, 4083–4096, 10.1175/2009JCLI2717.1, 2009.
Byun, D. and Ching, J. K. S.: Science Algorithms of the EPA Models-3 Community Multiscale Air Quality (CMAQ) Modeling System, U. S. Environmental Protection Agency, Research Triangle Park, NC, 1999.
Byun, D. and Schere, K. L.: Review of the governing equations, computational algorithms, and other components of the models-3 Community Multiscale Air Quality (CMAQ) modeling system, Appl. Mech. Rev., 59, 51–77, https://doi.org/10.1115/1.2128636, 2006.
Cai, W., Li, K., Liao, H., Wang, H., and Wu, L.: Weather conditions conducive to Beijing severe haze more frequent under climate change, Nat. Clim. Change, 7, 257–262, https://doi.org/10.1038/nclimate3249, 2017.
Cai, W. J., Borlace, S., Lengaigne, M., van Rensch, P., Collins, M., Vecchi, G., Timmermann, A., Santoso, A., McPhaden, M. J., Wu, L. X., England, M. H., Wang, G. J., Guilyardi, E., and Jin, F. F.: Increasing frequency of extreme El Nino events due to greenhouse warming, Nat. Clim. Change, 4, 111–116, https://doi.org/10.1038/nclimate2100, 2014.
Cai, W. J., Santoso, A., Wang, G. J., Yeh, S. W., An, S. I., Cobb, K. M., Collins, M., Guilyardi, E., Jin, F. F., Kug, J. S., Lengaigne, M., McPhaden, M. J., Takahashi, K., Timmermann, A., Vecchi, G., Watanabe, M., and Wu, L. X.: ENSO and greenhouse warming, Nat. Clim. Change, 5, 849–859, https://doi.org/10.1038/nclimate2743, 2015.
Chang, J. S., Brost, R. A., Isaksen, I. S. A., Madronich, S., Middleton, P., Stockwell, W. R., and Walcek, C. J.: A three-dimensional Eulerian acid deposition model: Physical concepts and formulation, J. Geophys. Res., 92, 14681–14700, https://doi.org/10.1029/JD092iD12p14681, 1987.
Chang, L., Xu, J., Tie, X., and Wu, J.: Impact of the 2015 El Nino event on winter air quality in China, Sci. Rep., 6, 34275, https://doi.org/10.1038/srep34275, 2016.
Chen, H., Lin, Y., Su, Q., and Cheng, L.: Spatial variation of multiple air pollutants and their potential contributions to all-cause, respiratory, and cardiovascular mortality across China in 2015–2016, Atmos. Environ., 168, 23–35, https://doi.org/10.1016/j.atmosenv.2017.09.006, 2017.
Cheng, X. H., Sun, Z. A., Li, D. P., Xu, X. D., Jia, M. W., and Cheng, S. Y.: Short-term aerosol radiative effects and their regional difference during heavy haze episodes in January 2013 in China, Atmos. Environ., 165, 248–263, https://doi.org/10.1016/j.atmosenv.2017.06.040, 2017.
Cheung, H. N., Zhou, W., Mok, H. Y., and Wu, M. C.: Relationship between Ural–Siberian Blocking and the East Asian Winter Monsoon in Relation to the Arctic Oscillation and the El Niño–Southern Oscillation, J. Climate, 25, 4242–4257, https://doi.org/10.1175/JCLI-D-11-00225.1, 2012.
Dee, D. P., Uppala, S. M., Simmons, A. J., Berrisford, P., Poli, P., Kobayashi, S., Andrae, U., Balmaseda, M. A., Balsamo, G., Bauer, P., Bechtold, P., Beljaars, A. C. M., van de Berg, L., Bidlot, J., Bormann, N., Delsol, C., Dragani, R., Fuentes, M., Geer, A. J., Haimberger, L., Healy, S. B., Hersbach, H., Hólm, E. V., Isaksen, L., Kållberg, P., Köhler, M., Matricardi, M., McNally, A. P., Monge-Sanz, B. M., Morcrette, J. J., Park, B. K., Peubey, C., de Rosnay, P., Tavolato, C., Thépaut, J. N., and Vitart, F.: The ERA-Interim reanalysis: configuration and performance of the data assimilation system, Q. J. Roy. Meteor. Soc., 137, 553–597, https://doi.org/10.1002/qj.828, 2011.
Ding, A. J., Huang, X., Nie, W., Sun, J. N., Kerminen, V. M., Petäjä, T., Su, H., Cheng, Y. F., Yang, X. Q., Wang, M. H., Chi, X. G., Wang, J. P., Virkkula, A., Guo, W. D., Yuan, J., Wang, S. Y., Zhang, R. J., Wu, Y. F., Song, Y., Zhu, T., Zilitinkevich, S., Kulmala, M., and Fu, C. B.: Enhanced haze pollution by black carbon in megacities in China, Geophys. Res. Lett., 43, 2873–2879, https://doi.org/10.1002/2016GL067745, 2016.
Emery, C., Tai, E., and Yarwood, G.: Enhanced meteorological modeling and performance evaluation for two Texas episodes, prepared for the Texas Natural Resource Conservation Commission, ENVIRON International Corp, Novato, CA, 2001.
Fletcher, C. G. and Kushner, P. J.: The Role of Linear Interference in the Annular Mode Response to Tropical SST Forcing, J. Climate, 24, 778–794, https://doi.org/10.1175/2010JCLI3735.1, 2010.
Gao, Y., Leung, L. R., Zhao, C., and Hagos, S.: Sensitivity of U.S. Summer Precipitation to Model Resolution and Convective Parameterizations Across Gray Zone Resolutions, J. Geophys. Res., 122, 2714–2733, https://doi.org/10.1002/2016jd025896, 2017.
Geng, X., Zhang, W., Stuecker, M. F., and Jin, F.-F.: Strong sub-seasonal wintertime cooling over East Asia and Northern Europe associated with super El Niño events, Sci. Rep., 7, 3770, https://doi.org/10.1038/s41598-017-03977-2, 2017.
Guenther, A., Karl, T., Harley, P., Wiedinmyer, C., Palmer, P. I., and Geron, C.: Estimates of global terrestrial isoprene emissions using MEGAN (Model of Emissions of Gases and Aerosols from Nature), Atmos. Chem. Phys., 6, 3181–3210, https://doi.org/10.5194/acp-6-3181-2006, 2006.
Han, F., Xu, J., He, Y., Dang, H., Yang, X., and Meng, F.: Vertical structure of foggy haze over the Beijing-Tianjin-Hebei area in January 2013, Atmos. Environ., 139, 192–204, https://doi.org/10.1016/j.atmosenv.2016.05.030, 2016.
He, J., Gong, S., Yu, Y., Yu, L., Wu, L., Mao, H., Song, C., Zhao, S., Liu, H., Li, X., and Li, R.: Air pollution characteristics and their relation to meteorological conditions during 2014–2015 in major Chinese cities, Environ. Pollut., 223, 484–496, https://doi.org/10.1016/j.envpol.2017.01.050, 2017.
Hui, G. and Xiang, L.: Influences of El Nino Southern Oscillation events on haze frequency in eastern China during boreal winters, Int. J. Climatol., 35, 2682–2688, https://doi.org/10.1002/joc.4133, 2015.
Janjić, Z. I.: The Step-Mountain Coordinate: Physical Package, Mon. Weather. Rev., 118, 1429–1443, https://doi.org/10.1175/1520-0493(1990)118<1429:tsmcpp>2.0.co;2, 1990.
Jeong, J. I. and Park, R. J.: Winter monsoon variability and its impact on aerosol concentrations in East Asia, Environ. Pollut., 221, 285–292, https://doi.org/10.1016/j.envpol.2016.11.075, 2017.
Kajino, M., Ueda, H., Han, Z., Rei, K., Inomata, Y., and Kaku, H.: Synergy between air pollution and urban meteorological changes through aerosol-radiation-diffusion feedback A case study of Beijing in January 2013, Atmos. Environ., 171, 98–110, https://doi.org/10.1016/j.atmosenv.2017.10.018, 2017.
Kwok, R. H. F., Napelenok, S. L., and Baker, K. R.: Implementation and evaluation of PM2.5 source contribution analysis in a photochemical model, Atmos. Environ., 80, 398–407, https://doi.org/10.1016/j.atmosenv.2013.08.017, 2013.
Li, K., Liao, H., Cai, W., and Yang, Y.: Attribution of Anthropogenic Influence on Atmospheric Patterns Conducive to Recent Most Severe Haze Over Eastern China, Geophys. Res. Lett., 45, 2072–2081, https://doi.org/10.1002/2017GL076570, 2018.
Li, M., Liu, H., Geng, G., Hong, C., Liu, F., Song, Y., Tong, D., Zheng, B., Cui, H., Man, H., Zhang, Q., and He, K.: Anthropogenic emission inventories in China: a review, Natl. Sci. Rev., 4, 834–866, https://doi.org/10.1093/nsr/nwx150, 2017.
Li, Q., Zhang, R., and Wang, Y.: Interannual variation of the wintertime fog–haze days across central and eastern China and its relation with East Asian winter monsoon, Int. J. Climatol., 36, 346–354, https://doi.org/10.1002/joc.4350, 2016.
Liang, F., Tian, L., Guo, Q., Westerdahl, D., Liu, Y., Jin, X., Li, G., and Pan, X.: Associations of PM2.5 and Black Carbon with Hospital Emergency Room Visits during Heavy Haze Events: A Case Study in Beijing, China, Int. J. Env. Res. Pub. He., 14, 725, https://doi.org/10.3390/ijerph14070725, 2017.
Liu, F., Zhang, Q., van der A, R. J., Zheng, B., Tong, D., Yan, L., Zheng, Y., and He, K.: Recent reduction in NOx emissions over China: synthesis of satellite observations and emission inventories, Environ. Res. Lett., 11, 114002, https://doi.org/10.1088/1748-9326/11/11/114002, 2016.
Liu, Q., Sheng, L., Cao, Z., Diao, Y., Wang, W., and Zhou, Y.: Dual effects of the winter monsoon on haze-fog variations in eastern China, J. Geophys. Res., 122, 5857–5869, https://doi.org/10.1002/2016JD026296, 2017.
Ma, M., Gao, Y., Wang, Y., Zhang, S., Leung, L. R., Liu, C., Wang, S., Zhao, B., Chang, X., Su, H., Zhang, T., Yao, X., and Gao, H.: Substantial ozone enhancement over North China Plain from excessive biogenic emissions during heat waves in summer 2017, in preparation, 2019.
Mellor, G. L. and Yamada, T.: Development of a turbulence closure-model for geophysical fluid problems, Rev. Geophys., 20, 851–875, 1982.
Nie, Y., Sun, L., Wang, D., and Li, D.: Possible Causes for the Sudden Drop of Air Temperature in the Northern Hemisphere from Early- to Mid-Winter, Meteorological Monthly, 42, 1223–1229, 2016.
Otte, T. L. and Pleim, J. E.: The Meteorology-Chemistry Interface Processor (MCIP) for the CMAQ modeling system: updates through MCIPv3.4.1, Geosci. Model Dev., 3, 243–256, https://doi.org/10.5194/gmd-3-243-2010, 2010.
Pleim, J. and Ran, L.: Surface Flux Modeling for Air Quality Applications, Atmosphere, 2, 271–302, https://doi.org/10.3390/atmos2030271, 2011.
Qin, Y. and Xie, S. D.: Historical estimation of carbonaceous aerosol emissions from biomass open burning in China for the period 1990–2005, Environ. Pollut., 159, 3316–3323, https://doi.org/10.1016/j.envpol.2011.08.042, 2011.
Rayner, N. A., Parker, D. E., Horton, E. B., Folland, C. K., Alexander, L. V., Rowell, D. P., Kent, E. C., and Kaplan, A.: Global analyses of sea surface temperature, sea ice, and night marine air temperature since the late nineteenth century, J. Geophys. Res., 108, 4407, https://doi.org/10.1029/2002JD002670, 2003.
Ren, H. L., Wang, R., Zhai, P., Ding, Y., and Bo, L. U.: Upper-Ocean Dynamical Features and Prediction of the Super El Nino in 2015/16: A Comparison with the Cases in 1982/83 and 1997/98, J. Meteorol. Res., 31, 278–294, 2017.
Saha, S., Moorthi, S., Wu, X., Wang, J., Nadiga, S., Tripp, P., Behringer, D., Hou, Y.-T., Chuang, H.-y., Iredell, M., Ek, M., Meng, J., Yang, R., Mendez, M. P., van den Dool, H., Zhang, Q., Wang, W., Chen, M., and Becker, E.: The NCEP Climate Forecast System Version 2, J. Climate, 27, 2185–2208, https://doi.org/10.1175/JCLI-D-12-00823.1, 2013.
Shi, Z., Li, J., Huang, L., Wang, P., Wu, L., Ying, Q., Zhang, H., Lu, L., Liu, X., Liao, H., and Hu, J.: Source apportionment of fine particulate matter in China in 2013 using a source-oriented chemical transport model, Sci. Total Environ., 601, 1476–1487, https://doi.org/10.1016/j.scitotenv.2017.06.019, 2017.
Skamarock, W. C., Klemp, J. B., Dudhia, J., Gill, D. O., Barker, D. M., Duda, M. G., Huang, X., Wang, W., and Powers, J. G.: A description of the advanced research WRF version 3, NCAR Tech. Note, NCAR/TN-475+STR, Natl. Cent. for Atmos. Res., Boulder, CO, USA, available at: http://www2.mmm.ucar.edu/wrf/users/docs/arw_v3.pdf (last access: 11 January 2019), 2008.
Song, C., Wu, L., Xie, Y., He, J., Chen, X., Wang, T., Lin, Y., Jin, T., Wang, A., Liu, Y., Dai, Q., Liu, B., Wang, Y.-N., and Mao, H.: Air pollution in China: Status and spatiotemporal variations, Environ. Pollut., 227, 334–347, https://doi.org/10.1016/j.envpol.2017.04.075, 2017.
Tie, X., Huang, R.-J., Cao, J., Zhang, Q., Cheng, Y., Su, H., Chang, D., Pöschl, U., Hoffmann, T., Dusek, U., Li, G., Worsnop, D. R., and O'Dowd, C. D.: Severe Pollution in China Amplified by Atmospheric Moisture, Sci. Rep., 7, 15760, https://doi.org/10.1038/s41598-017-15909-1, 2017.
US EPA: Guidance on the Use of Models and Other Analyses for Demonstrating Attainment of Air Quality Goals for Ozone, PM2.5, and Regional Haze, EPA-454/B-07e002, U.S. Environmental Protection Agency, Research Triangle Park, NC, 2007.
Wang, J., Zhao, B., Wang, S., Yang, F., Xing, J., Morawska, L., Ding, A., Kulmala, M., Kerminen, V.-M., Kujansuu, J., Wang, Z., Ding, D., Zhang, X., Wang, H., Tian, M., Petäjä, T., Jiang, J., and Hao, J.: Particulate matter pollution over China and the effects of control policies, Sci. Total Environ., 584–585, 426–447, https://doi.org/10.1016/j.scitotenv.2017.01.027, 2017.
Wang, S. X. and Zhang, C. Y.: Spatial and temporal distribution of air pollutant emissions from open burning of crop residues in China, Sciencepaper Online, 3, 1–6, 2008.
Wang, S. X., Zhao, B., Cai, S. Y., Klimont, Z., Nielsen, C. P., Morikawa, T., Woo, J. H., Kim, Y., Fu, X., Xu, J. Y., Hao, J. M., and He, K. B.: Emission trends and mitigation options for air pollutants in East Asia, Atmos. Chem. Phys., 14, 6571–6603, https://doi.org/10.5194/acp-14-6571-2014, 2014.
Wu, G. X., Li, Z. Q., Fu, C. B., Zhang, X. Y., Zhang, R. Y., Zhang, R. H., Zhou, T. J., Li, J. P., Li, J. D., Zhou, D. G., Wu, L., Zhou, L. T., He, B., and Huang, R. H.: Advances in studying interactions between aerosols and monsoon in China, Sci. China Earth Sci., 45, 1609–1627, https://doi.org/10.1007/s11430-015-5198-z, 2015.
Xu, J., Chang, L., Yan, F., and He, J.: Role of climate anomalies on decadal variation in the occurrence of wintertime haze in the Yangtze River Delta, China, Sci. Total Environ., 599–600, 918–925, https://doi.org/10.1016/j.scitotenv.2017.05.015, 2017.
Xu, L., Yu, J.-Y., Schnell, J. L., and Prather, M. J.: The seasonality and geographic dependence of ENSO impacts on U.S. surface ozone variability, Geophys. Res. Lett., 44, 3420–3428, https://doi.org/10.1002/2017GL073044, 2017.
Xu, Q., Wang, S., Guo, Y., Wang, C., Huang, F., Li, X., Gao, Q., Wu, L., Tao, L., Guo, J., Wang, W., and Guo, X.: Acute exposure to fine particulate matter and cardiovascular hospital emergency room visits in Beijing, China, Environ. Pollut., 220, 317–327, https://doi.org/10.1016/j.envpol.2016.09.065, 2017.
Xue, F., Dong, X., and Fan, F. X.: Anomalous Western Pacific Subtropical High during El Nio Developing Summer in Comparison with Decaying Summer, Adv. Atmos. Sci., 35, 360–367, https://doi.org/10.1007/s00376-017-7046-x, 2018.
Xue, Y. and Kumar, A.: Evolution of the 2015/16 El Niño and historical perspective since 1979, Sci. China Earth Sci., 60, 1572, https://doi.org/10.1007/s11430-016-0106-9, 2017.
Yang, Y., Liao, H., and Lou, S.: Increase in winter haze over eastern China in recent decades: Roles of variations in meteorological parameters and anthropogenic emissions, J. Geophys. Res., 121, 13050–13065, https://doi.org/10.1002/2016JD025136, 2016.
Ye, X., Song, Y., Cai, X., and Zhang, H.: Study on the synoptic flow patterns and boundary layer process of the severe haze events over the North China Plain in January 2013, Atmos. Environ., 124, 129–145, https://doi.org/10.1016/j.atmosenv.2015.06.011, 2016.
Yin, Z., Wang, H., and Chen, H.: Understanding severe winter haze events in the North China Plain in 2014: roles of climate anomalies, Atmos. Chem. Phys., 17, 1641–1651, https://doi.org/10.5194/acp-17-1641-2017, 2017.
Yuan, Y. and Yang, S.: Impacts of Different Types of El Nino on the East Asian Climate: Focus on ENSO Cycles, J. Climate, 25, 7702–7722, https://doi.org/10.1175/jcli-d-11-00576.1, 2012.
Yuan, Y., Zhou, N., and Li, C.: Correlation between haze in North China and super El Niño events, Chinese J. Geophys.-Ch., 60, 11–20, https://doi.org/10.6038/cjg20170102, 2017.
Zhang, Q., Quan, J., Tie, X., Li, X., Liu, Q., Gao, Y., and Zhao, D.: Effects of meteorology and secondary particle formation on visibility during heavy haze events in Beijing, China, Sci. Total Environ., 502, 578–584, https://doi.org/10.1016/j.scitotenv.2014.09.079, 2015.
Zhang, Y., Ding, A., Mao, H., Nie, W., Zhou, D., Liu, L., Huang, X., and Fu, C.: Impact of synoptic weather patterns and inter-decadal climate variability on air quality in the North China Plain during 1980–2013, Atmos. Environ., 124, 119–128, https://doi.org/10.1016/j.atmosenv.2015.05.063, 2016.
Zhang, Z., Gong, D., Mao, R., Kim, S.-J., Xu, J., Zhao, X., and Ma, Z.: Cause and predictability for the severe haze pollution in downtown Beijing in November–December 2015, Sci. Total Environ., 592, 627–638, https://doi.org/10.1016/j.scitotenv.2017.03.009, 2017.
Zhao, B., Wang, S. X., Liu, H., Xu, J. Y., Fu, K., Klimont, Z., Hao, J. M., He, K. B., Cofala, J., and Amann, M.: NOx emissions in China: historical trends and future perspectives, Atmos. Chem. Phys., 13, 9869–9897, https://doi.org/10.5194/acp-13-9869-2013, 2013.
Zhao, B., Wu, W., Wang, S., Xing, J., Chang, X., Liou, K.-N., Jiang, J. H., Gu, Y., Jang, C., Fu, J. S., Zhu, Y., Wang, J., Lin, Y., and Hao, J.: A modeling study of the nonlinear response of fine particles to air pollutant emissions in the Beijing–Tianjin–Hebei region, Atmos. Chem. Phys., 17, 12031–12050, https://doi.org/10.5194/acp-17-12031-2017, 2017.
Zhao, B., Zheng, H., Wang, S., Smith, K. R., Lu, X., Aunan, K., Gu, Y., Wang, Y., Ding, D., Xing, J., Fu, X., Yang, X., Liou, K.-N., and Hao, J.: Change in household fuels dominates the decrease in PM2.5 exposure and premature mortality in China in 2005–2015, P. Natl. Acad. Sci. USA, 115, 12401–12406, https://doi.org/10.1073/pnas.1812955115, 2018.
Zhao, S., Li, J., and Sun, C.: Decadal variability in the occurrence of wintertime haze in central eastern China tied to the Pacific Decadal Oscillation, Sci. Rep., 6, 27424, https://doi.org/10.1038/srep27424, 2016.