the Creative Commons Attribution 4.0 License.
the Creative Commons Attribution 4.0 License.
 | 30 Apr 2019
Vertical and horizontal distribution of submicron aerosol chemical composition and physical characteristics across northern India during pre-monsoon and monsoon seasons
James Brooks
James D. Allan
Paul I. Williams
Dantong Liu
Cathryn Fox
Jim Haywood
Justin M. Langridge
Ellie J. Highwood
Sobhan K. Kompalli
Debbie O'Sullivan
Suresh S. Babu
Sreedharan K. Satheesh
Andrew G. Turner
The vertical distribution in the physical and chemical properties of submicron aerosol has been characterised across northern India for the first time using airborne in situ measurements. This study focusses primarily on the Indo-Gangetic Plain, a low-lying area in the north of India which commonly experiences high aerosol mass concentrations prior to the monsoon season. Data presented are from the UK Facility for Airborne Atmospheric Measurements BAe-146 research aircraft that performed flights in the region during the 2016 pre-monsoon (11 and 12 June) and monsoon (30 June to 11 July) seasons.
Inside the Indo-Gangetic Plain boundary layer, organic matter dominated the submicron aerosol mass (43 %) followed by sulfate (29 %), ammonium (14 %), nitrate (7 %) and black carbon (7 %). However, outside the Indo-Gangetic Plain, sulfate was the dominant species, contributing 44 % to the total submicron aerosol mass in the boundary layer, followed by organic matter (30 %), ammonium (14 %), nitrate (6 %) and black carbon (6 %). Chlorine mass concentrations were negligible throughout the campaign. Black carbon mass concentrations were higher inside the Indo-Gangetic Plain (2 µg m−3) compared to outside (1 µg m−3). Nitrate appeared to be controlled by thermodynamic processes, with increased mass concentration in conditions of lower temperature and higher relative humidity. Increased mass and number concentrations were observed inside the Indo-Gangetic Plain and the aerosol was more absorbing in this region, whereas outside the Indo-Gangetic Plain the aerosol was larger in size and more scattered in nature, suggesting greater dust presence, especially in north-western India. The aerosol composition remained largely similar as the monsoon season progressed, but the total aerosol mass concentrations decreased by ∼50 % as the rainfall arrived; the pre-monsoon average total mass concentration was 30 µg m−3 compared to a monsoon average total mass concentration of 10–20 µg m−3. However, this mass concentration decrease was less noteworthy (∼20 %–30 %) over the Indo-Gangetic Plain, likely due to the strength of emission sources in this region. Decreases occurred in coarse mode aerosol, with the fine mode fraction increasing with monsoon arrival. In the aerosol vertical profile, inside the Indo-Gangetic Plain during the pre-monsoon, organic aerosol and absorbing aerosol species dominated in the lower atmosphere (<1.5 km), with sulfate, dust and other scattering aerosol species enhanced in an elevated aerosol layer above 1.5 km with maximum aerosol height ∼6 km. The elevated concentration of dust at altitudes >1.5 km is a clear indication of dust transport from the Great Indian Desert, also called the Thar Desert, in north-western India. As the monsoon progressed into this region, the elevated aerosol layer diminished, the aerosol maximum height reduced to ∼2 km. The dust and sulfate-dominated aerosol layer aloft was removed upon monsoon arrival, highlighted by an increase in fine mode fraction throughout the profile.
- Article
(11113 KB) - Full-text XML
- BibTeX
- EndNote


South Asia is one of the world's most populous and fastest growing regions, with 24 % of the world's population. The diverse living habits, fuel and land use make understanding the complexity of emissions and atmospheric dynamics challenging. The Indo-Gangetic Plain (IGP) in the Indian sub-continent is one such polluted region in South Asia; its unique geomorphology, meteorology and characteristic variations in aerosol particles have drawn the attention of aerosol researchers for many years (Pawar et al., 2015; Singh et al., 2017). Aerosol mass sources within the IGP are mostly dominated by natural sources such as dust, but also anthropogenic emissions associated with traffic, biomass burning, waste incineration, and crop and wood burning (Banerjee et al., 2015; Singh et al., 2017), with Delhi being one of the most polluted locations (Sharma et al., 2014).
Aerosol modelling studies have shown that aerosol present over India can significantly influence the monsoon through its role in the redistribution of heat (Satheesh and Ramanathan, 2000; Ramanathan et al., 2001, 2005; Nair et al., 2012, 2013). Modelling comparisons have shown considerable uncertainty in model predictions of regional heating from aerosols, and hence their impact and characteristics with regards to the Indian monsoon (Myhre et al., 2013). In order to improve current scientific knowledge and challenge global chemical transport and climate models, in situ measurements of sufficient accuracy and sensitivity are required to assess the key parameters such as mass, optical and chemical properties of the ambient aerosol. In India, systematic investigations into the physiochemical properties of aerosol, their temporal heterogeneities, spectral characteristics and size distributions throughout the atmospheric column have been subject to analysis for several decades (Satheesh and Ramanathan, 2000; Ramanathan et al., 2001, 2005; Moorthy et al., 2004, 2009, 2013, 2016, Jethva et al., 2005; Singh et al., 2006; Babu et al., 2011; Gautam et al., 2011; Samset et al., 2012). However, a lack of in situ analysis has hampered progress in reducing uncertainty behind the current scientific understanding.
Much uncertainty surrounds the vertical structure, spatial and seasonal extent, and heterogeneous chemistry of aerosol over India (Pan et al., 2015) that determine the resultant climatic impact of aerosols as well as the regional air quality. There are only a few studies that address the physical properties of the aerosol by analysing the single scattering albedo (SSA) (Ganguly et al., 2005; Sreekanth et al., 2011; Babu et al., 2016; Vaishya et al., 2018). One reason is in part due to uncertainties in characterising aerosol absorption accurately. For northern India in spring it appears that the SSA within the boundary layer is relatively low, although it is increasing with altitude in the atmospheric column (Babu et al., 2016). This is possibly indicative of dust transport at high altitudes from regions such as the Rajasthan Desert in the north-west of the country. Sarangi et al. (2016) was to an extent able to elaborate on these findings and found that the elevated aerosol layer was a mix of coarse-sized natural and fine-sized anthropogenic aerosol, both influenced by local emissions and long-range transport, yet they highlight the requirement for more in situ chemical composition analysis in the atmospheric column.
A handful of efforts have been made to explore the sources, variability and chemical composition of the ambient aerosol across northern India by using an aerosol mass spectrometer (AMS) at a number of surface sites (Bhattu and Tripathi, 2015; Chakraborty et al., 2015, 2016; Kumar and Yadav, 2016; Kumar et al., 2016). These studies have covered both winter and summer seasons in northern India, finding that aerosols are dominated by organic matter, followed by inorganic components and black carbon. These previous AMS studies have provided a detailed insight into aerosol chemical composition for the built-up region of Kanpur in the Indo-Gangetic Plain. However, regional variations in the aerosol chemical composition using such detailed methods have not been carried out across this region to date.
This paper presents the first airborne measurements of aerosol chemical characteristics over northern India. The vertical distribution of aerosol chemical composition and physical properties is a major focus of this study, along with understanding how the monsoon progression across the region influences the aerosol characteristics.
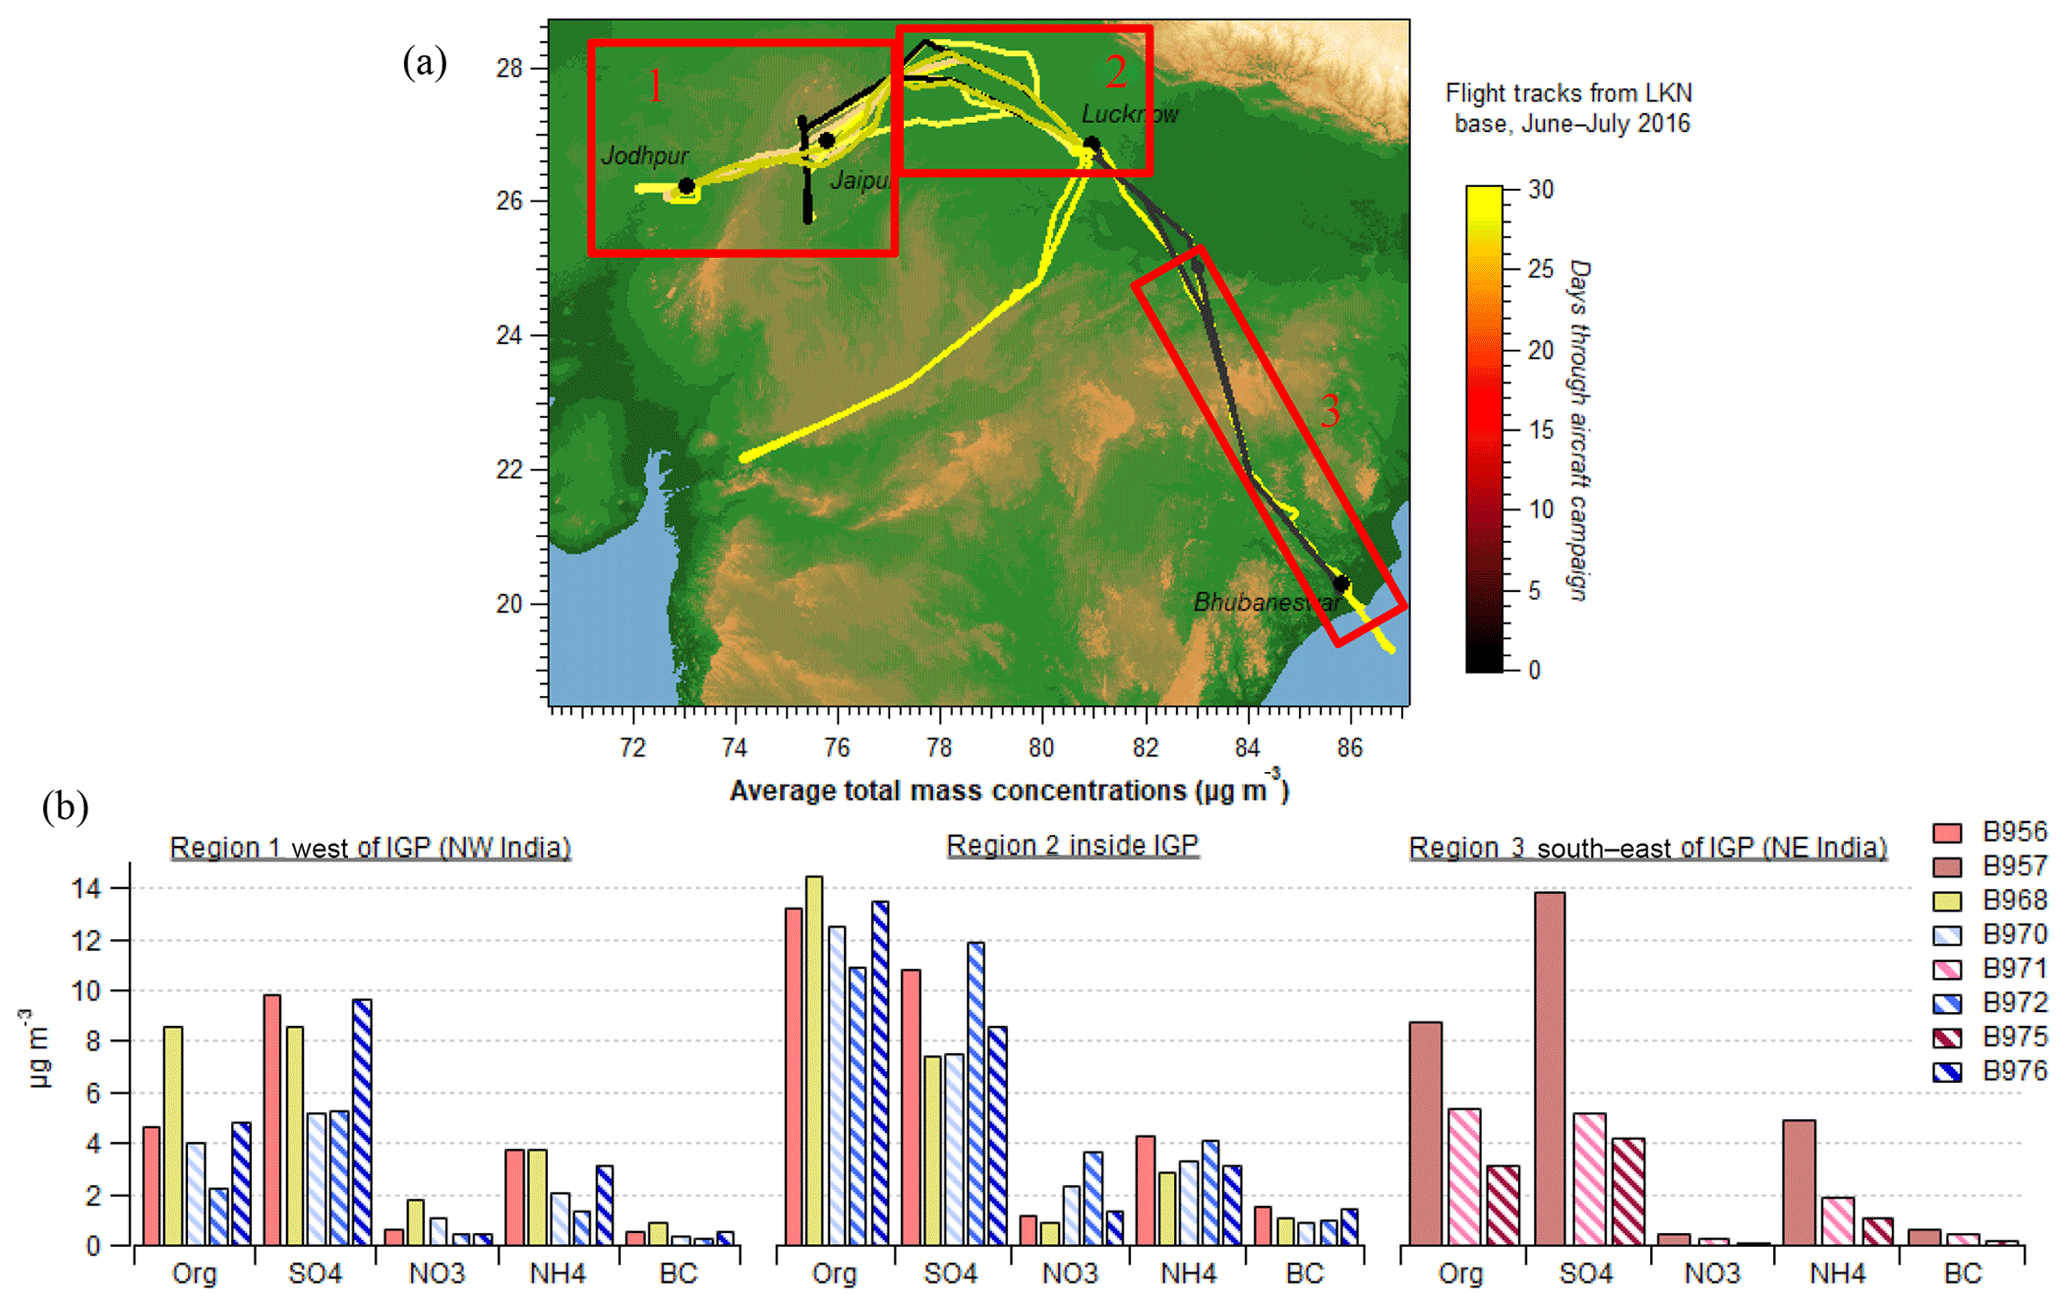
Figure 1Flight tracks of the BAe-146 aircraft for the campaign across India during the pre-monsoon and monsoon seasons of 2016. Panel (a) presents the flight paths considered by this analysis and are described in the main text and Table 1. Straight level run (SLR) boundary layer sections are split by region: (1) west of IGP, (2) IGP and (3) south-east of IGP. Panel (b) highlights a boundary layer data summary of the AMS and SP2 median mass concentrations (µg m−3) for each zone (1, 2 and 3) identified across northern India.
Table 1Flight summary for operations included in this study. All flights were conducted in northern India in the pre-monsoon (PM) and monsoon (M) season (PM/M season refers to transition period of when the monsoon was arriving in northern India). The dates of the flights are shown, with their respective region of study. Z refers to Zulu Time.
A total of 10 science flights were conducted by the UK Facility for Airborne Atmospheric Measurement (FAAM) BAe-146 research aircraft with the flight tracks highlighted in Fig. 1 and flight summaries in Table 1. The flights took place during two periods: the pre-monsoon (11 and 12 June 2016) and the monsoon onset period (30 June to 11 July 2016), based at Lucknow (LKN; 26.85∘ N, 80.95∘ E). The aircraft flew with a comprehensive instrument suite, capable of measuring aerosols, cloud physics, chemical tracers, radiative fluxes and meteorological fields, but only instruments used in this analysis are discussed further. The FAAM BAe-146 has a typical range of ∼3000 km and an altitude ceiling of over 10 km, with an aircraft science speed of ∼100 ms−1. From the operating base, the aircraft typically covered radial distances of ∼200–300 km in 4.5–5 h of flight time, resulting in over 120 h of flying completed throughout the campaign (89 h science). Based on the likely synoptic and local conditions on the day, different types of science flights were conducted: radiation flights and survey flights. Both flight types consisted of long-leg duration flights covering the NE Bay of Bengal and IGP regions, delivering the main part of the aerosol characterisation. In addition, profiles to high altitudes when taking off from Lucknow and in selected other locations were carried out in order to build up a statistical picture of the vertical structure. Low-altitude straight-level runs (SLRs) were also carried out at heights of around 0.5–1.0 km.
2.1 Instrumentation
The compact time-of-flight aerosol mass spectrometer (cToF-AMS) provided the capability to quantitatively measure the size-resolved chemical composition of non-refractory submicron particle matter (NR-PM1) organic aerosol (OA), sulfate (SO4), ammonium (NH4), nitrate (NO3) and chloride (Cl) (Morgan, 2010). A major advantage of using the cToF-AMS is the ability to provide high-temporal-resolution measurements with enhanced precision and sensitivity, therefore making it suitable for aircraft operation. In the rest of the paper we refer to the cToF-AMS as “AMS” for brevity. The AMS data were acquired in mass spectrometer (MS) mode, which produces species concentrations and a complete mass spectrum of the non-refractory submicron mass with no size information, but with higher sensitivity than the particle time-of-flight (PToF) mode. Previous studies (Crosier et al., 2007; Morgan et al., 2010) have detailed the AMS sampling strategy on board the aircraft. The sampling losses for the AMS inlet system were estimated to be approximately 10 % by number across the size-range measuring capability of the AMS. The system ammonium nitrate residence time is sufficiently short compared to timescales for mass transfer that repartitioning of ammonium nitrate towards the gas phase is small. The AMS was connected to a Rosemount inlet (Foltescu et al., 1995) via stainless steel tubing with a total residence time of several seconds for the entire inlet system. Samples were introduced at ambient pressure and submicron particle losses are considered negligible for the operating altitudes considered by this study (Trembath et al., 2012). Furthermore, wing-tip-to-wing-tip comparisons between different AMS instruments using different inlet set-ups have shown less than 15 % difference (Crosier et al., 2007). The aerosol introduced to the AMS is considered dry, due to the coupled effect of the aircraft cabin temperature (∼300 K) and additional heating due to the decelerating sample air flow (Morgan et al., 2010). Power was unavailable between flights due to operational constraints but through the use of plug valves to isolate the AMS chamber, a vacuum of typically less than 0.5 Torr was maintained whilst the turbo-pumps were powered down.
A Single Particle Soot Photometer (SP2) manufactured by Droplet Measurement Technologies Inc. (Boulder, CO, USA) was used to provide measurements of refractory black carbon (BC) (Stephens et al., 2003; Baumgardner et al., 2004; Liu et al., 2010). The instrument operation and data interpretation procedures are described elsewhere (Liu et al., 2010; McMeeking et al., 2010). The SP2 incandescence signal was calibrated for rBC mass using Aquadag® black carbon particle standards (aqueous deflocculated Acheson graphite, manufactured by Acheson Inc., USA) and corrected for ambient rBC with a factor of 0.75 (Laborde et al., 2012). Reported mass loadings have a measurement uncertainty of approximately 30 % (Schwarz et al., 2008; Shiraiwa et al., 2008; Liu et al., 2014).
Aerosol number concentrations were measured using a passive cavity aerosol spectrometer probe (PCASP) and a cloud droplet probe (CDP). The PCASP measured both aerosol number and size in the range of 0.3–3 µm. It is an optical particle counter (OPC) and was fitted to the underside of the aircraft wings. The CDP collected droplet size measurements between 3 and 50 µm (cloud cleared). Data provided by these two instruments allow calculation of the aerosol fine mode fraction, which indicates whether large (super-micron) or small (submicron) aerosol dominates the number concentrations (Crosier et al., 2011; Cai et al., 2013). The aerosol size distributions have been calibrated to the refractive index of the ambient aerosol, based on the fractional composition during each flight.
Aerosol SSA values at 550 nm at standard temperature and pressure (STP) were calculated using nephelometer (TSI Model 3563) and Particle Soot Absorption Photometer (PSAP) (designed by Radiance Research) data. Scattering measurements were provided from the nephelometer, with continuous particulate absorption measurements made by the PSAP. The nephelometer was corrected using the Muller correction scheme (Muller et al., 2011) and the PSAP via the Bond et al. (1999) corrections. More information on these instruments and calculations can be found in Haywood and Osborne (2000).
Carbon monoxide mixing ratios were measured by an Aero-Laser A15002 vacuum ultraviolet resonance fluorescence gas analyser (Gerbig et al., 1999), where total uncertainty of the FAAM instrument is estimated to be 2 % (O'Shea et al., 2013). In-flight calibrations were performed using World Meteorological Organization traceable gas standards.
A General Eastern 1011B (GE Measurement & Control) chilled hygrometer provided measurements of ambient dew point temperature, accurate to 0.2 ∘C. A Rosemount/Goodrich type-102 true air temperature sensor was mounted outside the aircraft, providing ambient temperature measurements using a Rosemount 102AL platinum resistance immersion thermometer.
A Leosphere ALS450 elastic backscatter lidar (wavelength 355 nm) was deployed on the FAAM aircraft in a nadir-viewing geometry. Marenco et al. (2011) and Marenco (2013) describe the methodology for converting lidar beam returns at 355 nm wavelength into profiles of aerosol extinction coefficient. The system specifications are summarised in Marenco et al. (2014) and references therein, and a further description of the data processing methodology can be found in Marenco et al. (2016). During processing, the lidar data were integrated to 1 min temporal resolution, which corresponds to a 9±2 km footprint at aircraft speeds. Smoothing to a 45 m vertical resolution was also applied to reduce the effect of shot noise. The vertical profiles were processed using a double iteration. First, we determined the lidar ratio (extinction-to-backscatter ratio) and subsequently processed the full dataset to determine the extinction coefficient (see Marenco et al., 2016, and references therein for details). As in the above-mentioned papers, the first iteration was conducted on a subset of the vertical profiles, where the signature of Rayleigh scattering above the aerosol layer could clearly be identified to enable the lidar ratio to be determined. A mean campaign lidar ratio of 46±10 sr was obtained, which is in good agreement with other measurements of the lidar ratio for smoke and mixed aerosol at 355 nm (Muller et al., 2007). This value of the lidar ratio was then used to process the whole dataset in the second iteration. For dust during this campaign, it is estimated that the uncertainty in the derived extinction was 11 %. The uncertainty is smaller than this near the top of the profile (closer to the aircraft) and larger nearer the ground.
2.2 AMS data quantification
The AMS data analysis was performed using the standard SQUIRREL (SeQUential Igor data RetRiEvaL) ToF-AMS software package, with mass spectrum deconvolution accomplished using the fragmentation table approach described by Allan et al. (2004). Error estimates were generated according to the model documented by Allan et al. (2003) and mass concentrations derived from the AMS are reported as micrograms per standard cubic metre (µg m−3), i.e. at a temperature of 273.15 K and pressure of 1013.25 hPa. Ionisation efficiency (IE) calibrations were performed regularly before and after each flight during the flying period, with values determined from both pre-flight and post-flight calibrations (i.e. taking place on the same day) usually exhibiting little variability. Post-flight values were used as these were considered to be more reliable compared to pre-flight values due to reduced instrument background post-flight. During B969 (see flights included in this analysis in Table 1) a failure with the filament supplying ions to the reagent gas means the data from that flight are erroneous and are not included in this analysis. Procedures for AMS calibration can be found in previous publications (Allan et al., 2003, 2004; Jiminez et al., 2003). The amplification factor of the microchannel plate detector (MCP) was measured during every pre-flight and most post-flight calibrations, when the AMS was in use (“single ion calibration”). Due to varying flight conditions, single ion values were taken for each flight rather than using one value for the entire campaign. The particle collection efficiency (CE) for the AMS was determined using the approach of Middlebrook et al. (2012).
2.3 Indian summer monsoon
The Indian monsoon is one of the world's most dramatic seasonal variations in climate, characterised by the reversal of prevailing winds between winter and summer. The summer monsoon typically lasts from June to September and supplies India with 80 % of its rainfall (Lau and Yang, 1997), and at each location the monsoon arrival brings cooler and moister conditions to replace the pre-monsoon heat (Parker et al., 2016). The monsoon onset typically occurs around 1 June, in Kerala on the southwest coast, and then progresses north arriving in Delhi before the end of July. Dates of the 2016 summer monsoon progression can be found in Fig. A1 in the Appendix, with the 2016 summer monsoon arriving in Lucknow, for example, on 1 July around 2 weeks later than the climatological average.

Figure 2Mean meteorological conditions in the boundary layer (950 hPa pressure altitude) (a and c) and aloft (650 hPa pressure altitude) (b and d) for the pre-monsoon and monsoon flights. The wind direction is displayed using white arrows on each of the plots, with temperature (Kelvin) and relative humidity (%) indicated with the colour scale. The data used in the maps are from ERA-Interim (Dee et al., 2011). Panels (e) and (f) present 1∘ gridded precipitation (mm) data based on 2140 weather stations over India, again for the pre-monsoon and monsoon flights, from the Indian Meteorological Department (IMD).
Mean synoptic meteorological conditions for our flying period (see Fig. 2) at the surface level and aloft over the IGP in the vicinity of Lucknow can play a significant role in the modulating aerosol properties over northern India (Li et al., 2016; Parker et al., 2016; Sen et al., 2017). Figure 2 highlights the meteorological averages from the days that flying occurred, with pre-monsoon (11–12 June) and monsoon (30 June–11 July) flights. The IGP typically experiences sub-tropical climatic conditions, with very high near-surface temperatures of ∼305–315 K during the pre-monsoon. In the pre-monsoon, the wind pattern in the boundary layer is south-westerly to westerly, bringing warm, dry air from arid regions such as the Rajasthan Desert, Pakistan and beyond. This dry, hot air brings with it high aerosol loadings, and coupled with the strong emissions sources within the IGP, causes high aerosol concentrations to build up in the Himalayan foothills and across the IGP and northern India region. This is also similar above the boundary layer, at pressure altitudes ∼650 hPa, with dry arid aerosol-laden air being transported from NW India and beyond into the IGP. In the pre-monsoon the near-surface air temperatures are at their peak of ∼310 K, near-surface RH is low ∼60 %, and soil moisture and precipitation are low. As the monsoon progresses from the south, however, the wind patterns change; in the boundary layer, the wind direction shifts to a south-easterly, advecting cooler, moister air masses to replace the hot, dry desert air that dominated during the pre-monsoon. The increasing dominance of south-easterly winds in the boundary layer increases the supply of moisture from the Bay of Bengal for the central IGP region, with moisture influx from the Arabian Sea to the NW region over Jaipur and Jodhpur.
During the 2016 monsoon, in early July, synoptic conditions were perturbed by the passage of a monsoon depression (a strong low-pressure system) passing from the Bay of Bengal across the IGP. Its cyclonic signature can clearly be seen in Fig. 2c and d. The wind direction in the mid-troposphere also changes as the monsoon develops, with a gradual shift in wind direction from westerlies to south-easterlies. The dry air aloft is gradually moistened from below, becoming progressively cooler and more humid. Parker et al. (2016) explain that at this time the equivalent potential temperature increases, favouring the formation of clouds with monsoon progression. As the first monsoon rainfall arrives, the soil is dry, so boundary layer moisture is advected from the ocean. For subsequent rainfall, moisture can also be advected from the land surface, moistening the boundary layer and leading to the development of deep cumulus cloud. The boundary layer RH increases to upwards of 100 % (and supersaturated air can be found, >100 % RH) and the temperatures decrease to ∼295–300 K. Just as in the case of the boundary layer air, flow during the mature monsoon into July 2016 is modulated at 650 hPa (Fig. 2d) by the presence of a monsoon depression.
The pre-monsoon (11–12 June, flights of B956 and B957) and monsoon (30 June–11 July, flights of B968-B976) are considered separately. Of this second category, the first few flights can be regarded as occurring during the monsoon transition phase, since the monsoon has arrived at some locations but not others. For example, during B968 (30 June) the monsoon was seen to be influencing the IGP but not Jaipur in NW India. More information on the monsoon development can be seen in Figs. 2 and A1 (in this example for 30 June, the monsoon progression isochrone for 2016 still lies to the south and east of Jaipur). The analysis presented below first outlines the pre-monsoon measurements of the aerosol chemical composition and then physical characteristics, followed by the changes seen as the monsoon progressed, for the boundary layer (Sect. 3.1) and vertical profile (Sect. 3.2).
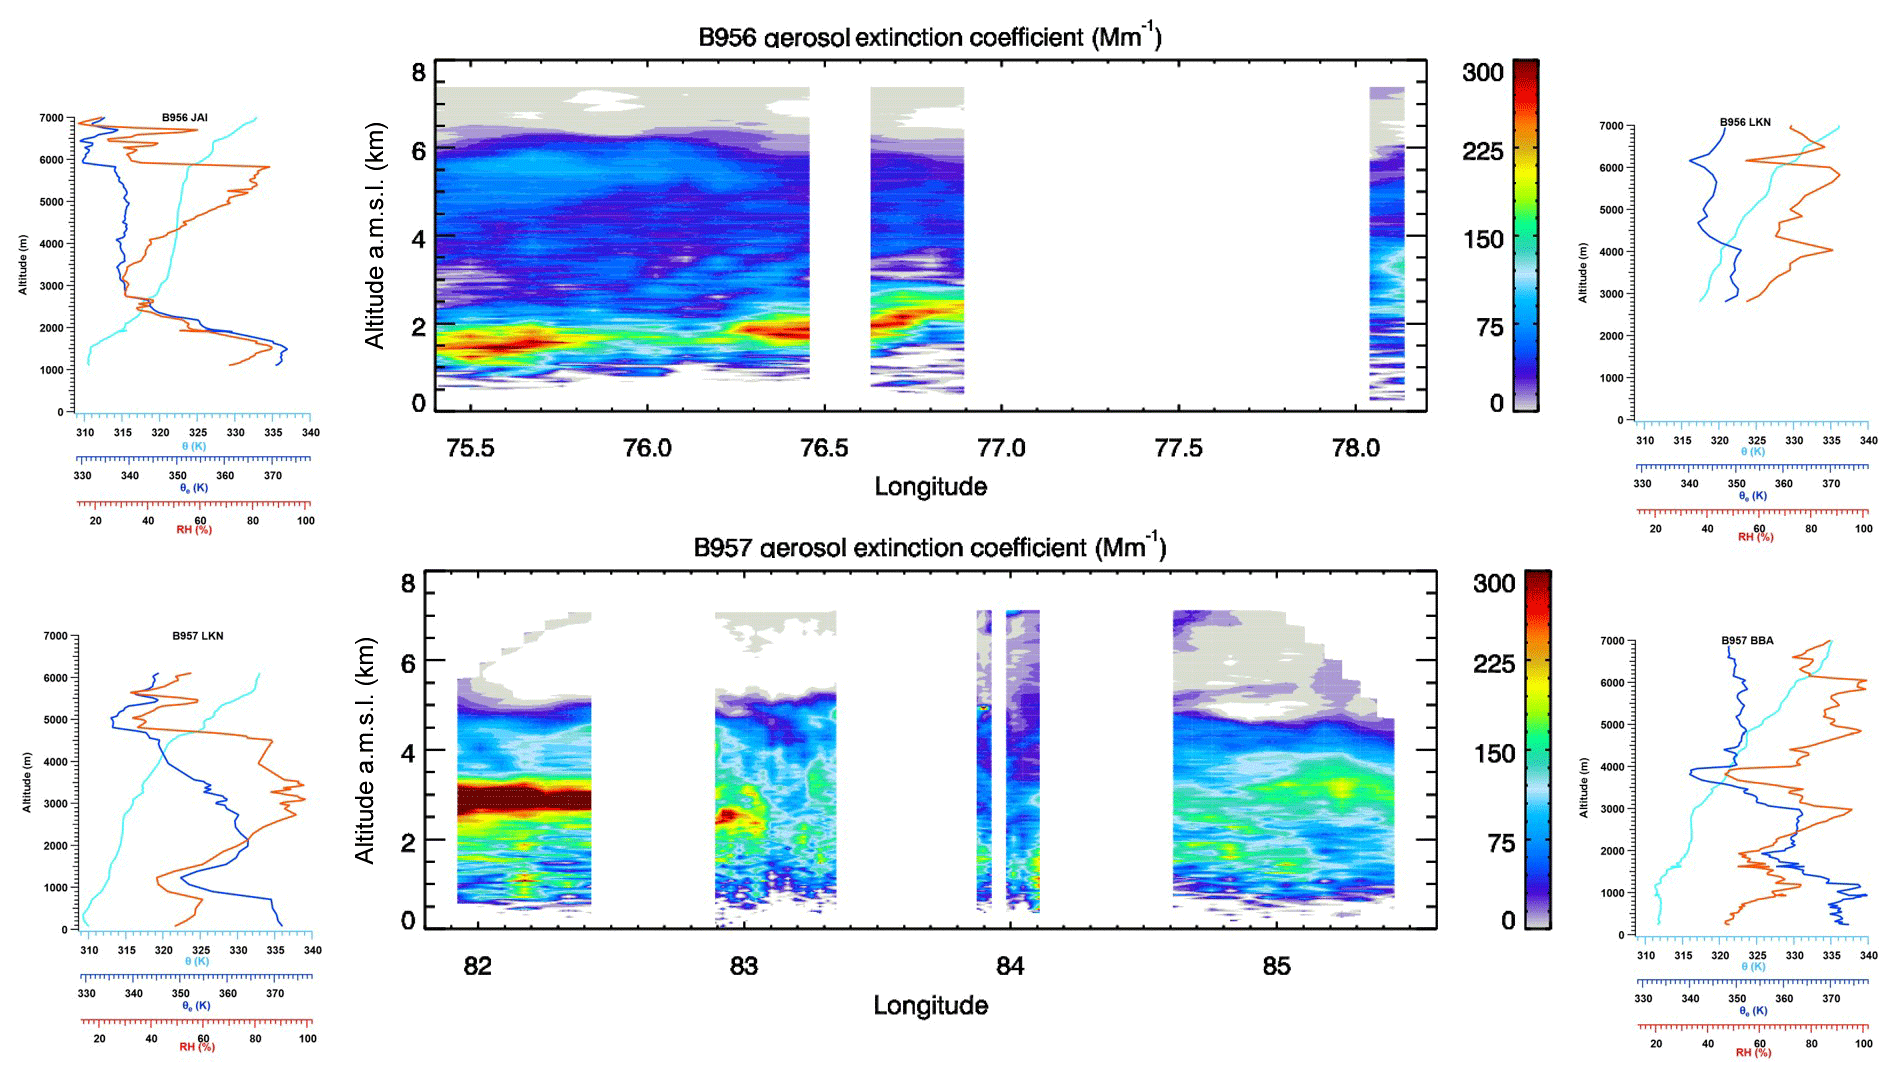
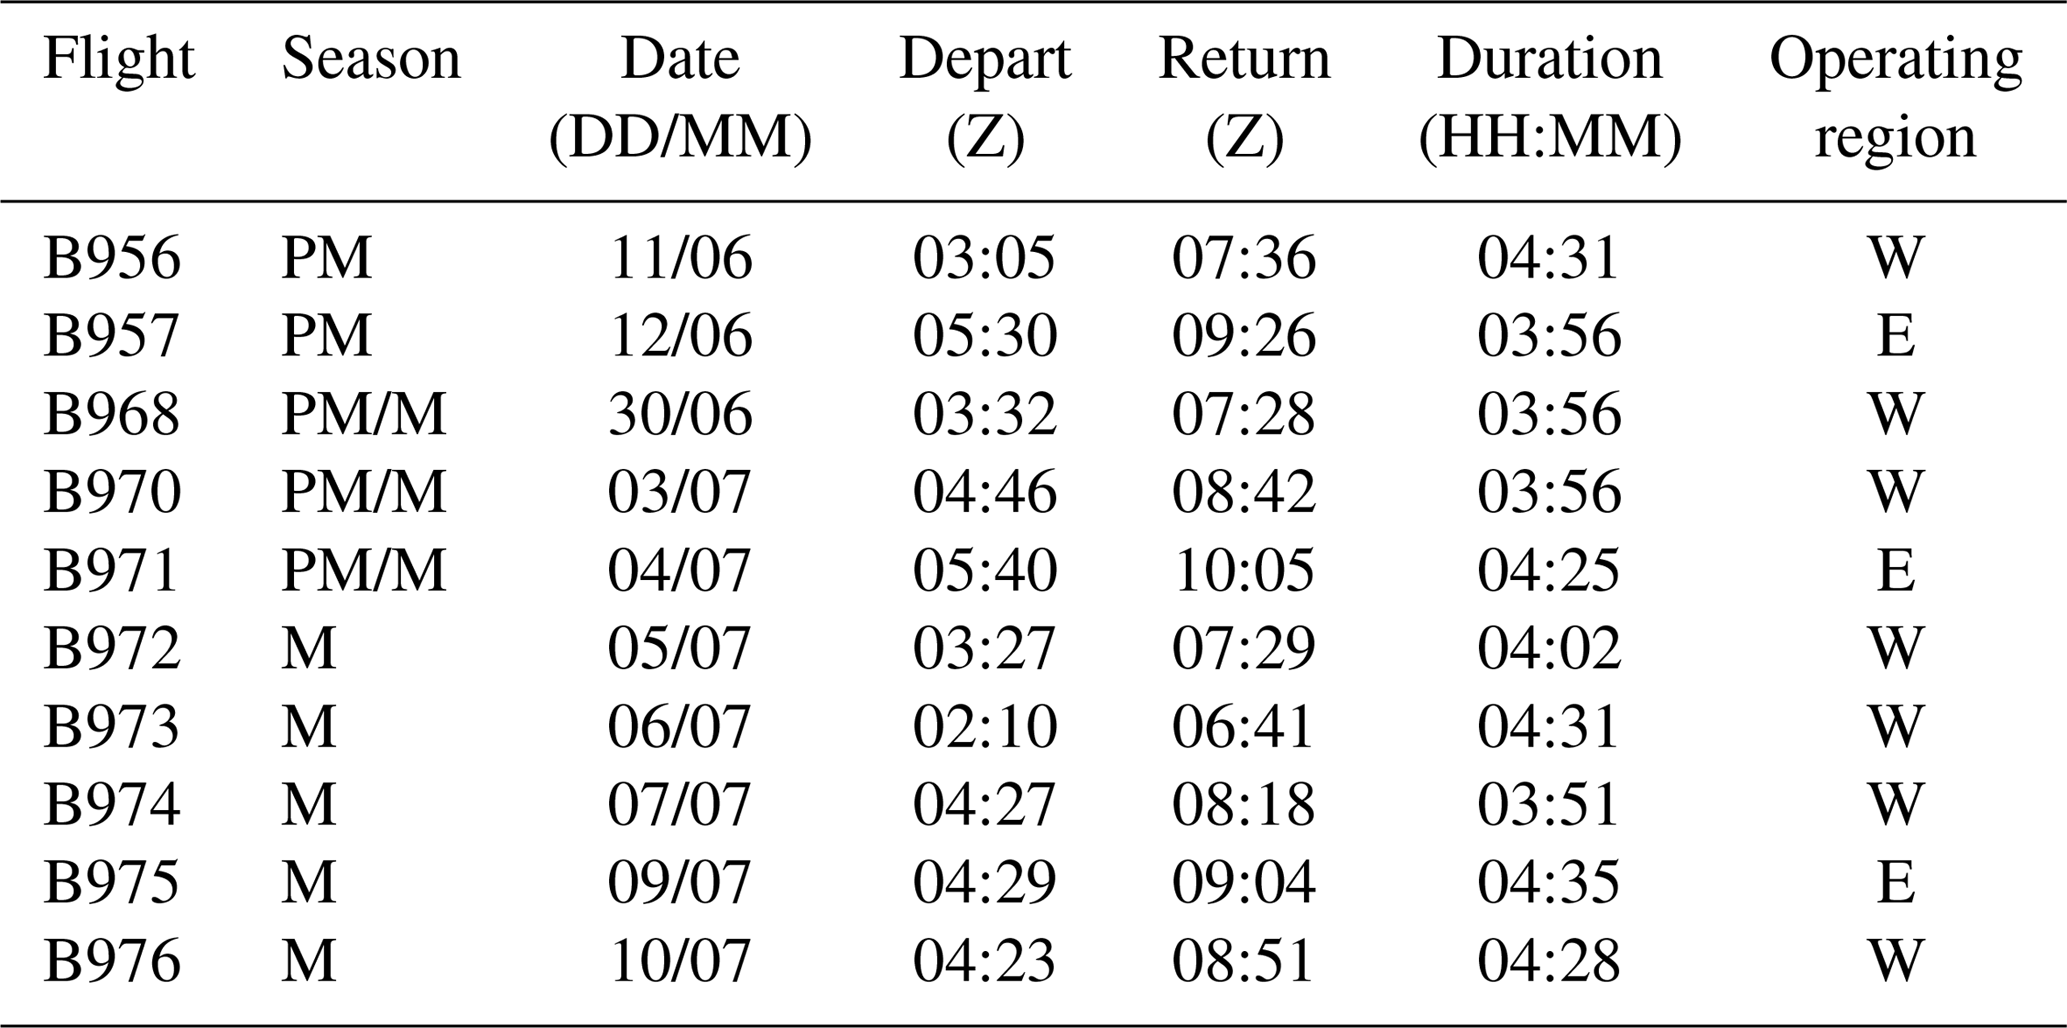
Figure 3Aerosol extinction coefficient estimated from backscatter lidar observations, for the indicated flights of B956 (11 June) and B957 (12 June) in the pre-monsoon season along the longitudinal scale 75 to 90∘ E. Gaps indicate missing data, due to either rejection of whole profiles or rejection of the portion of profiles affected by clouds. The thermodynamic plots of potential temperature (θ), equivalent potential temperature (θe) and relative humidity on the right and left of the lidar profiles are for the location indicated by title of the plot (JAI = Jaipur (26.91∘ N, 75.79∘ E), LKN = Lucknow (26.85∘ N, 80.95∘ E), BBA = Bhubaneswar (20.30∘ N, 25.83∘ E)).
The aerosol burden over northern India has a distinct structure in the pre-monsoon, both in terms of aerosol species and thermodynamic nature, with large changes as the monsoon progresses. Figure 3 highlights the pre-monsoon structure of aerosol extinction coefficient obtained from lidar data on board the aircraft. The extinction profile derived from lidar measurements show peak concentration between 1.5 and 2 km for 11 June flight B956, whereas B957 on 12 June shows the centroid of the aerosol layer at 3 km with the presence of aerosols with reduced extinction from 6 km to near the surface. The thermodynamic profiles in Fig. 3 for the various locations show differences between the boundary layer and aloft across northern India; heights that coincide with elevated aerosol have consistent high RH values across locations, with large variations in RH in the boundary layer. It is clear from the lidar data that there is a distinct structure in aerosol vertical profiles. The previous features are also complemented in Fig. 4, which is a CALIPSO aerosol backscatter profile from a daytime overpass from 11 June (B956). The aerosol structure is comparable between both lidar plots, with the CALIPSO successfully capturing the maximum aerosol height during the pre-monsoon in northern India (∼6–7 km) along with the values shown representing dust aerosol dominance, consistent with the literature for the pre-monsoon season. The CALIPSO profile does not, however, successfully highlight the distinct structure in the aerosol chemical and physical properties.
Considering the above, an aerosol composition summary in Fig. 5 highlights the pre-monsoon and monsoon structure of the aerosol vertical profile over northern India. The key measurements needed over this region of relevance to the testing of general circulation models include aerosol size information as a function of height, composition, scattering and absorption characteristics. In order for models to correctly test for accurate aerosol representation, these criteria need to be met. The aerosol vertical summary plot highlights large aerosol loadings upwards of ∼50 µg m−3 present in the pre-monsoon for all locations across northern India, with the distinct elevated aerosol layer present over the IGP and NE India dominated by larger particles between 3 and 7 km. As the monsoon progresses the aerosol concentrations decrease in both total mass and maximum height, alongside decreases in aerosol scattering coefficient and aerosol size. Black carbon is only seen in significant mass concentrations inside the boundary layer in both the pre-monsoon and monsoon seasons.
Figure 4CALIPSO total attenuated backscatter for 11 June (B956) daytime overpass on the Indian subcontinent. Highlighted in the black dashed box is the northern India region of interest, to provide contrast to the on-board lidar retrieval.
3.1 Boundary layer aerosol during the progression of the monsoon
Summary statistics of boundary layer aerosol chemical composition for the various regions in northern India are presented in Fig. 1, and more detailed analysis of the aerosol chemical composition for straight level runs (SLRs) below 1000 m is shown in Figs. 6 and 7. The boundary layer height was predominantly above 1500 m, such that the SLR data presented here are within the boundary layer for all locations.
During the pre-monsoon flights (B956 + B957), aerosol average total mass concentrations (AMS and BC total mass concentration), were at their highest inside the IGP compared to outside, and there were also differences in the particle composition. In the pre-monsoon, boundary layer total mass concentrations were ∼50 µg m−3 (±10 µg m−3) inside the IGP, with total boundary layer mass concentrations of ∼15 µg m−3 (±5 µg m−3) outside the IGP. Figures 6 and 7 highlight the regional variations in the dominant aerosol species present over the various locations in northern India. Organic aerosol dominated inside the IGP, with the average mass concentration present being ∼12 µg m−3, comprising 43 % of the typical mass fraction, and SO4 at ∼10 µg m−3, comprising 29 %. However, outside the IGP, the dominant species in the boundary layer was SO4, with average mass concentrations of ∼10 µg m−3, comprising 44 % of total aerosol loading, whereas the organics were ∼6 µg m−3, comprising 30 %. Organic aerosol underwent large changes in mass concentration dependent upon location, with mass concentrations inside the IGP twice those measured outside, whereas SO4 displayed relatively consistent values across northern India. NH4 mass concentrations displayed similar patterns to the SO4 regional burden, indicating the predominance of ammonium sulfate aerosol across northern India. Nitrate, on the other hand, was not present in significant concentrations during the pre-monsoon regardless of location (0–1 µg m−3).
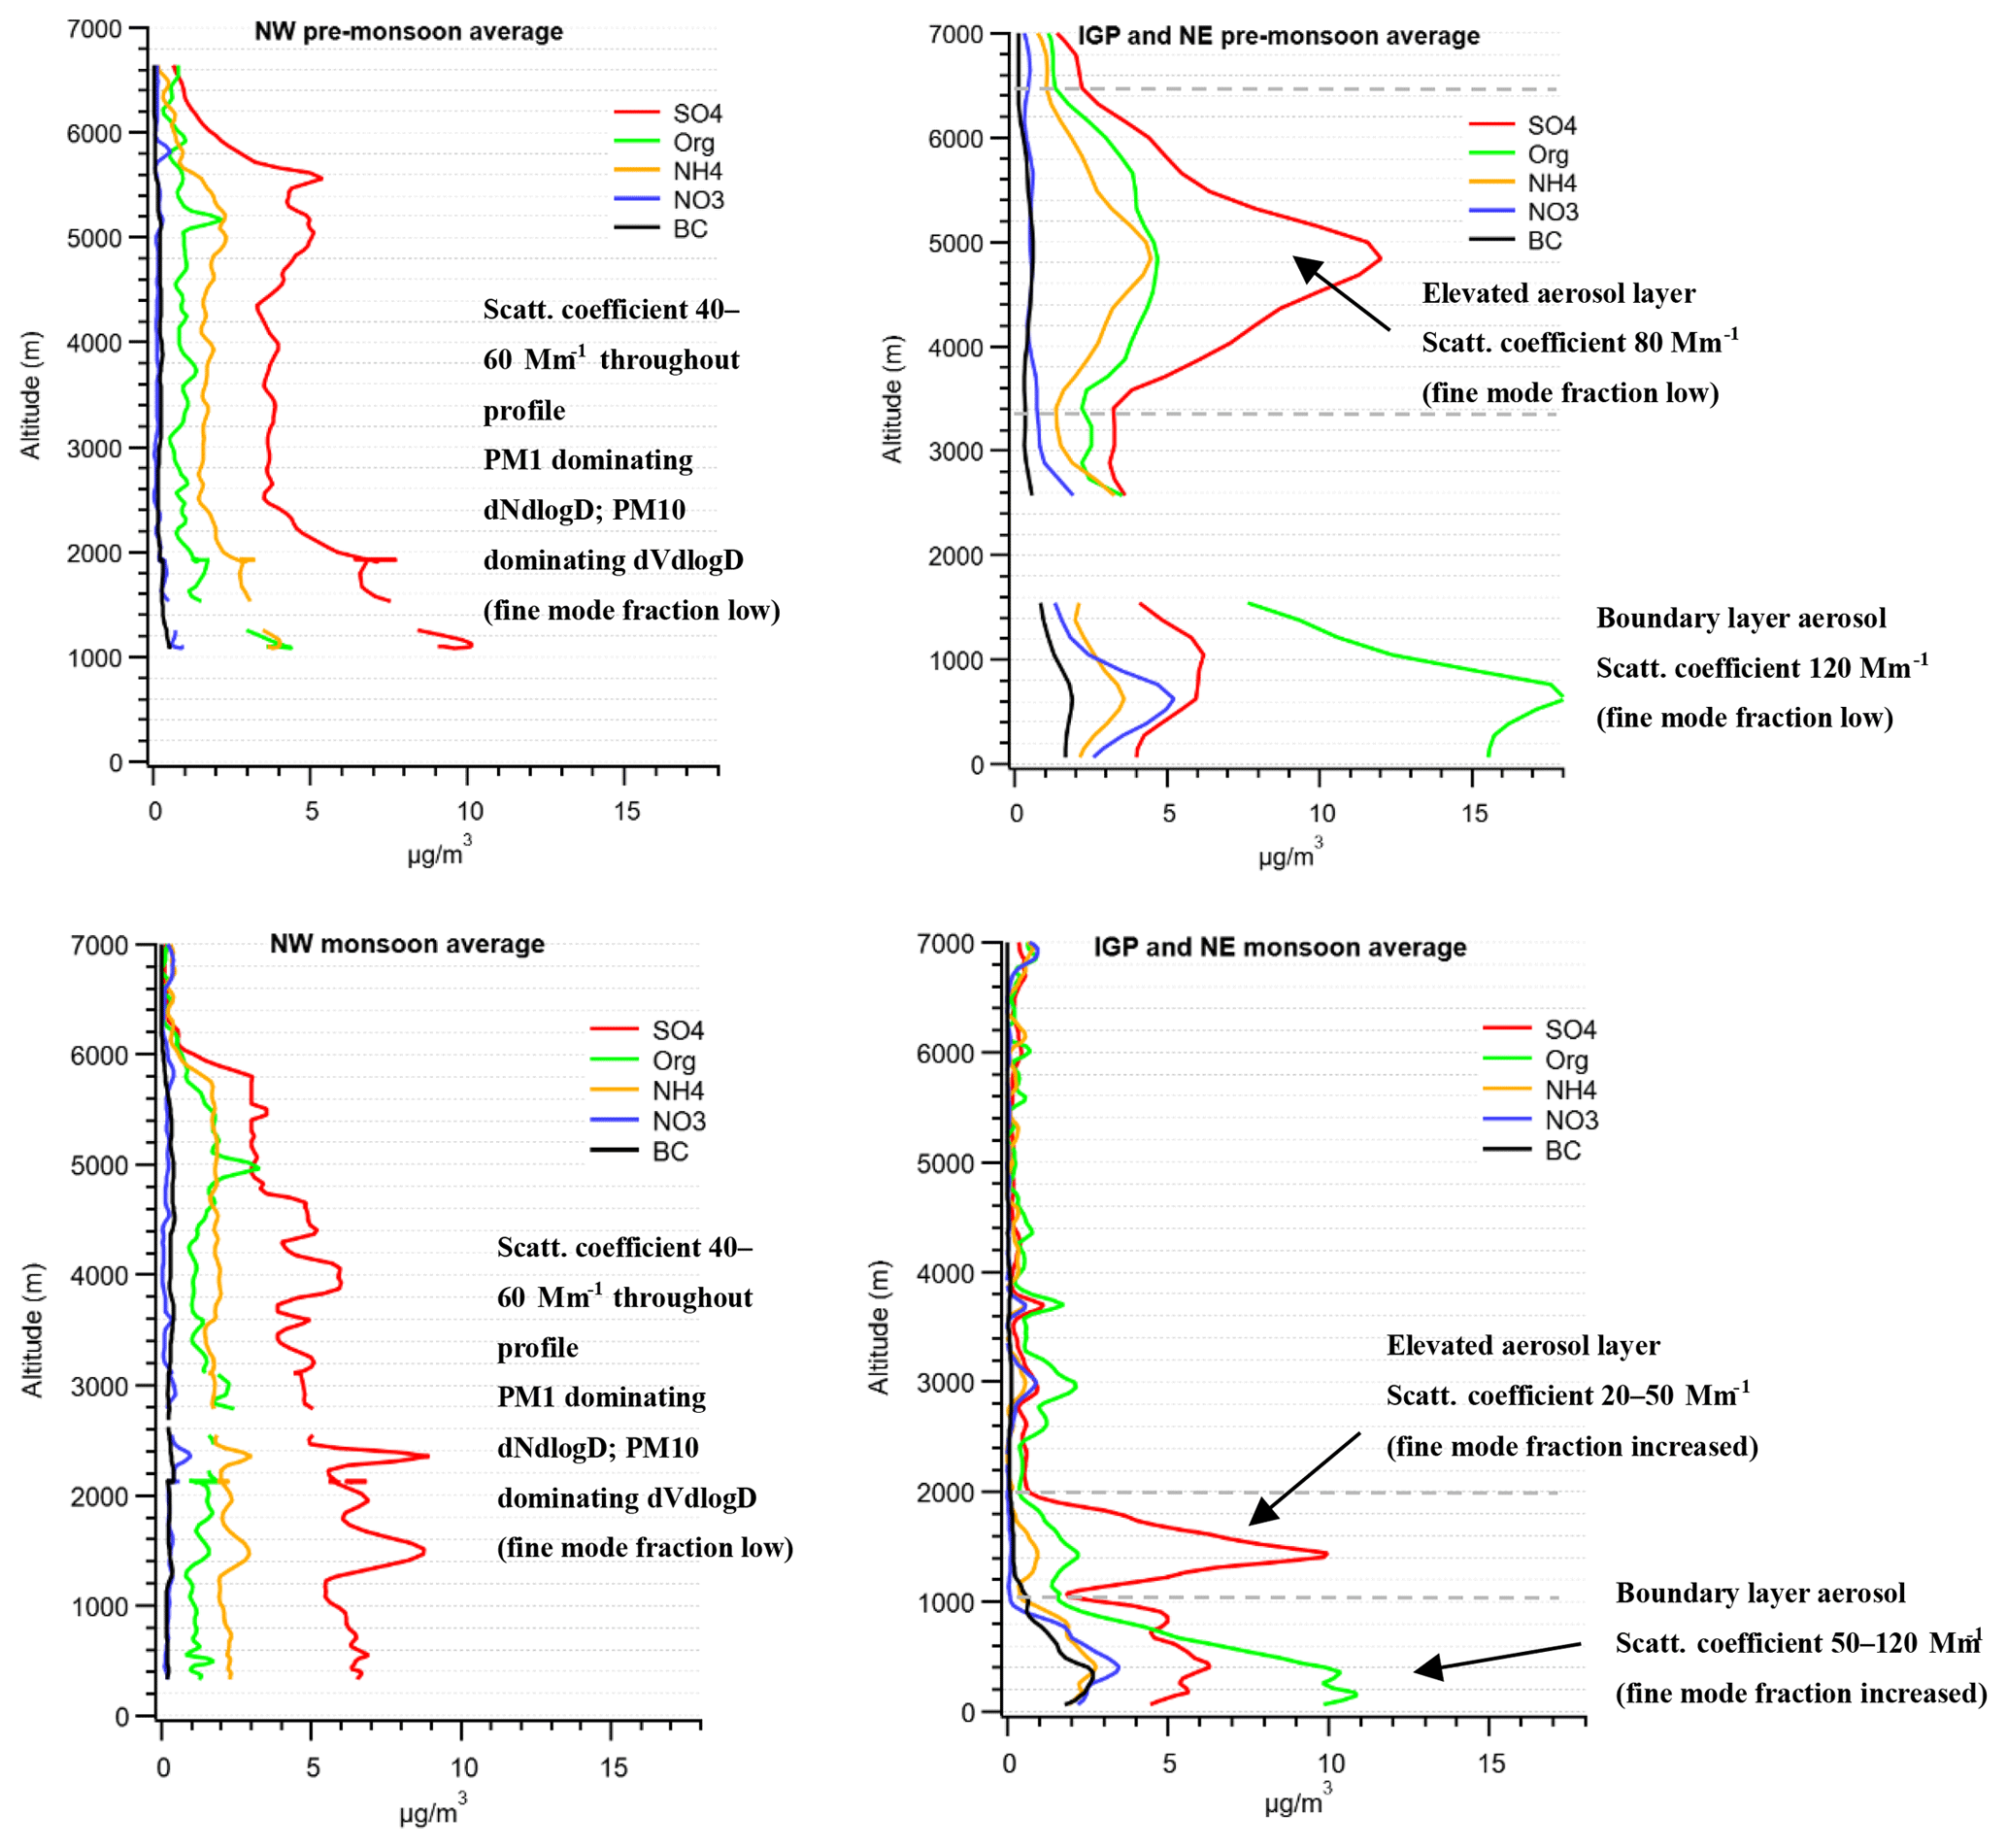
Figure 5Aerosol vertical profile summary for pre-monsoon and monsoon seasons during the campaign, for NW India and the IGP/NE India.
As the monsoon progressed over northern India, it developed from the south-east towards the north-west, as shown in Figs. 2 and A1. Inside the IGP, the average total mass concentration decreased from 25–35 to 15–25 µg m−3. Outside the IGP, however, the average total mass concentration was similar to the pre-monsoon value of ∼15 µg m−3. During the eastern flights between Lucknow and Bhubaneswar, as the monsoon arrived and developed during mid-June (B971 and B975) a decrease in aerosol mass concentration occurred from 10–30 to 1–10 µg m−3. Organic aerosol decreased in mass concentration as the monsoon progressed, especially over NW and NE India, but not inside the IGP. Similar changes in sulfate and ammonium aerosol mass concentrations were also observed. Compared to pre-monsoon concentrations, the nitrate aerosol mass concentration increased in contrast to the decrease in the concentration of other species. When rainfall arrived in northern India, nitrate concentrations increased from 0–1 to 5–10 µg m−3 in the IGP. Increased concentrations were also observed outside the IGP. This finding indicates not only that nitrate aerosol is strongly driven by thermodynamic variables (increased relative humidity and soil moisture, and decreased air temperatures), but also that as the humid and cooler air arrived there was sufficient ammonium to neutralise the nitric acid present and partition a significant fraction of this to the particle phase within the boundary layer under these conditions.
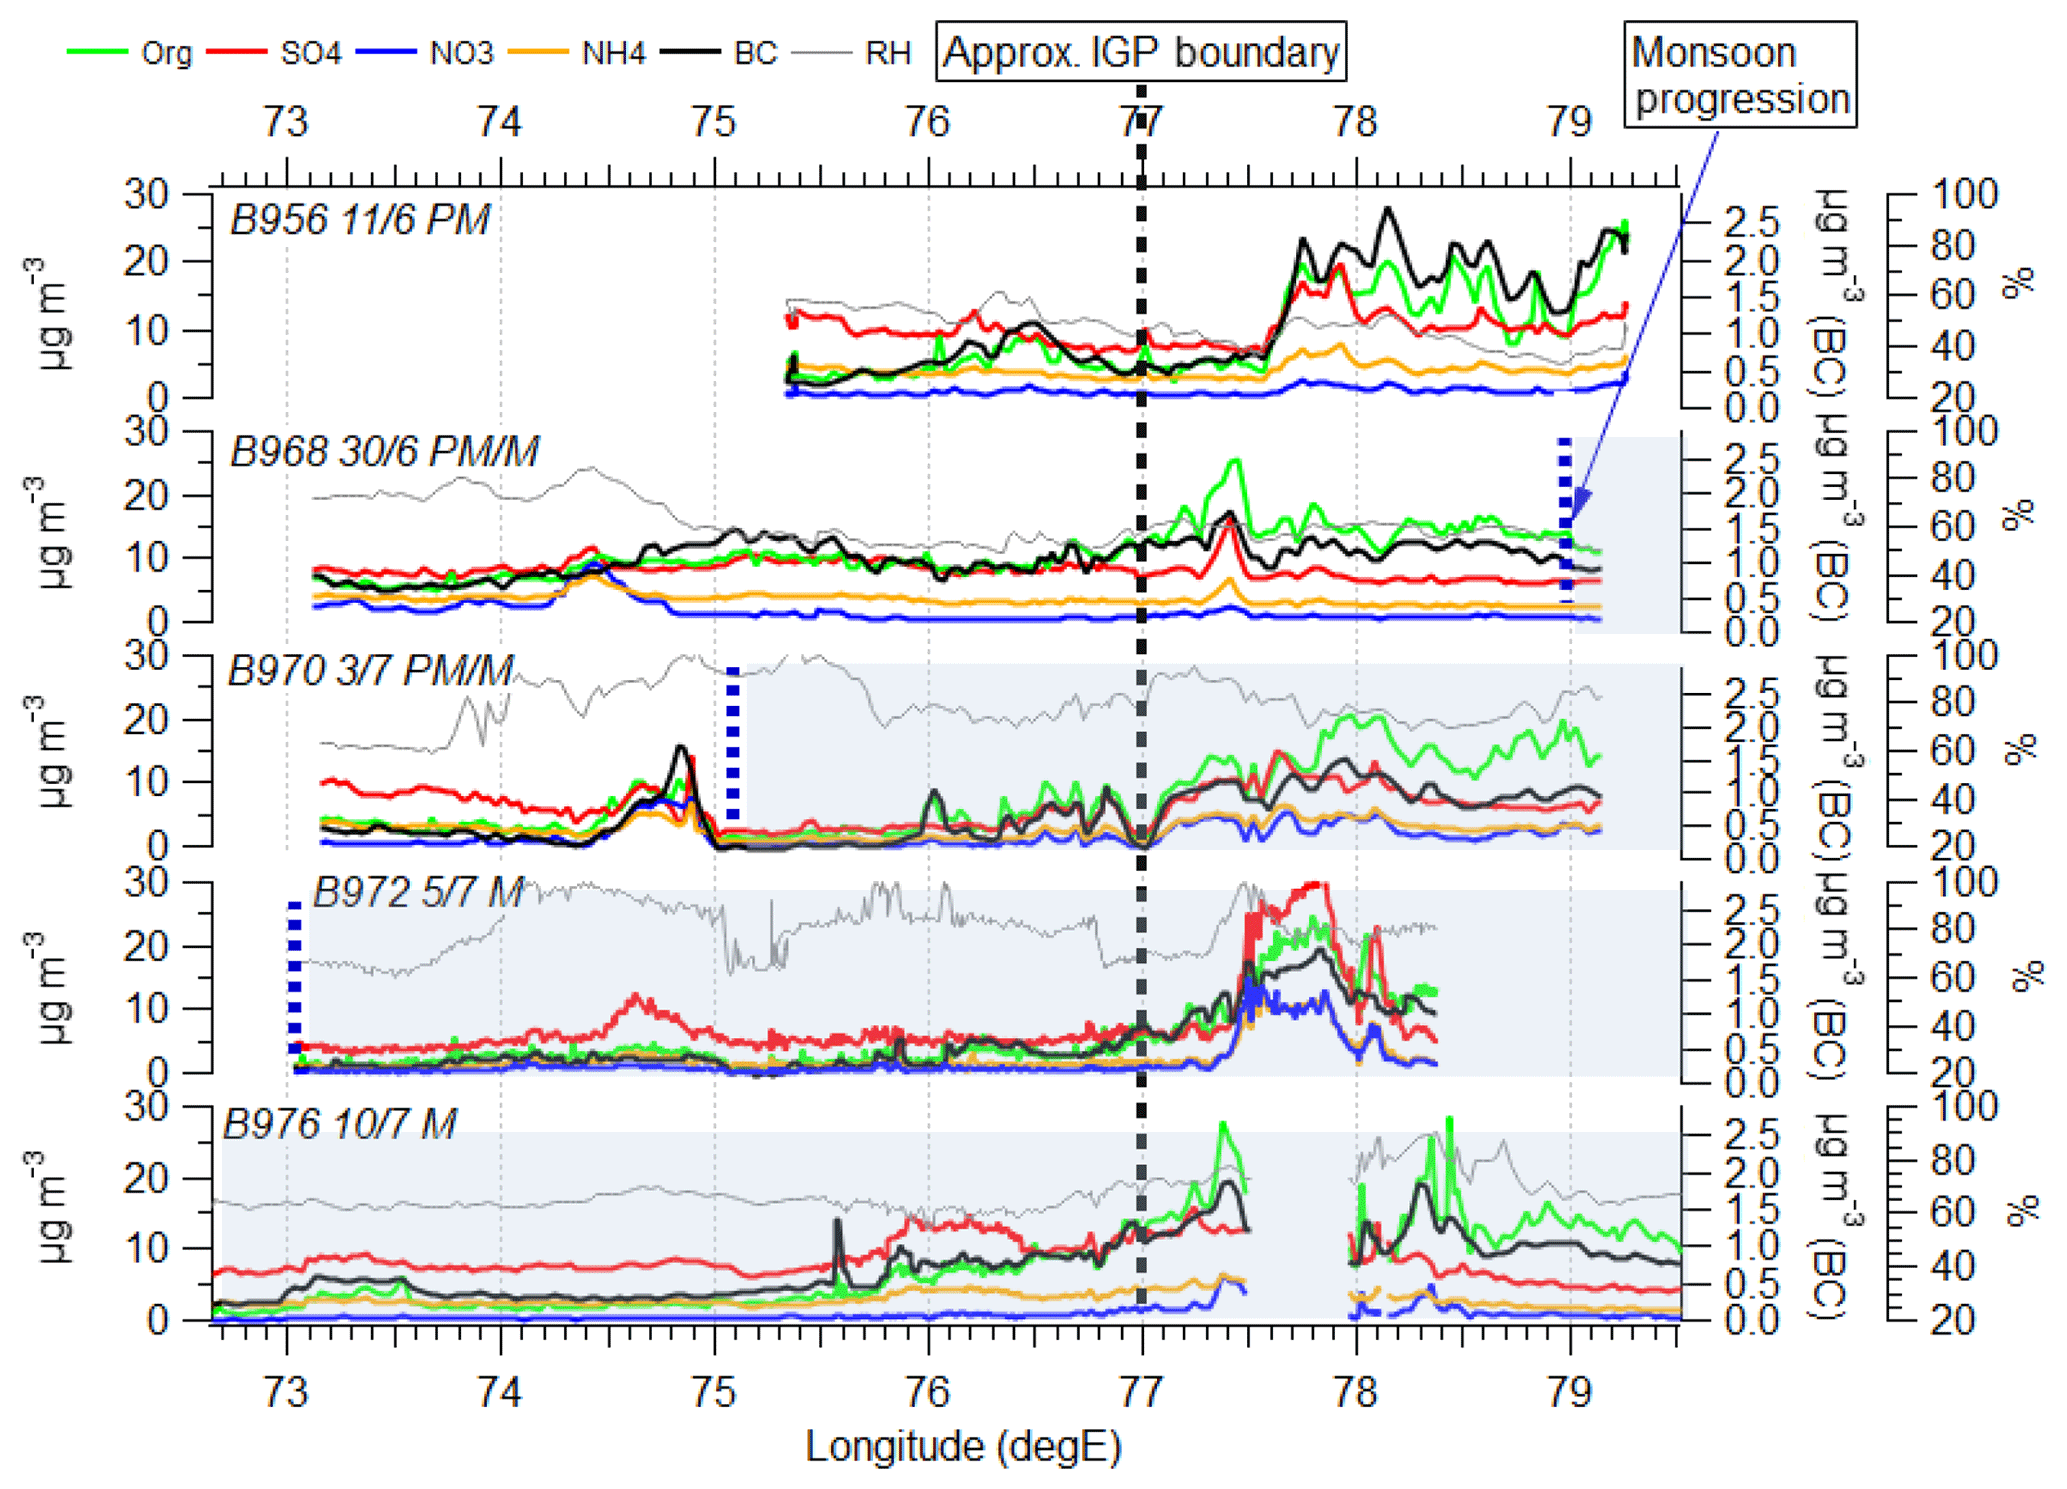
Figure 6Horizontal spatial aerosol chemical composition (below 1000 m) plots for pre-monsoon (PM) and monsoon (M) seasons in northern India, from Lucknow to Jaipur/Jodhpur. The plots highlight the IGP region (77∘ E eastwards) and the outside of the IGP (73–77∘ E) separated by the vertical black dashed line. The monsoon progression is indicated by the blue shaded region.
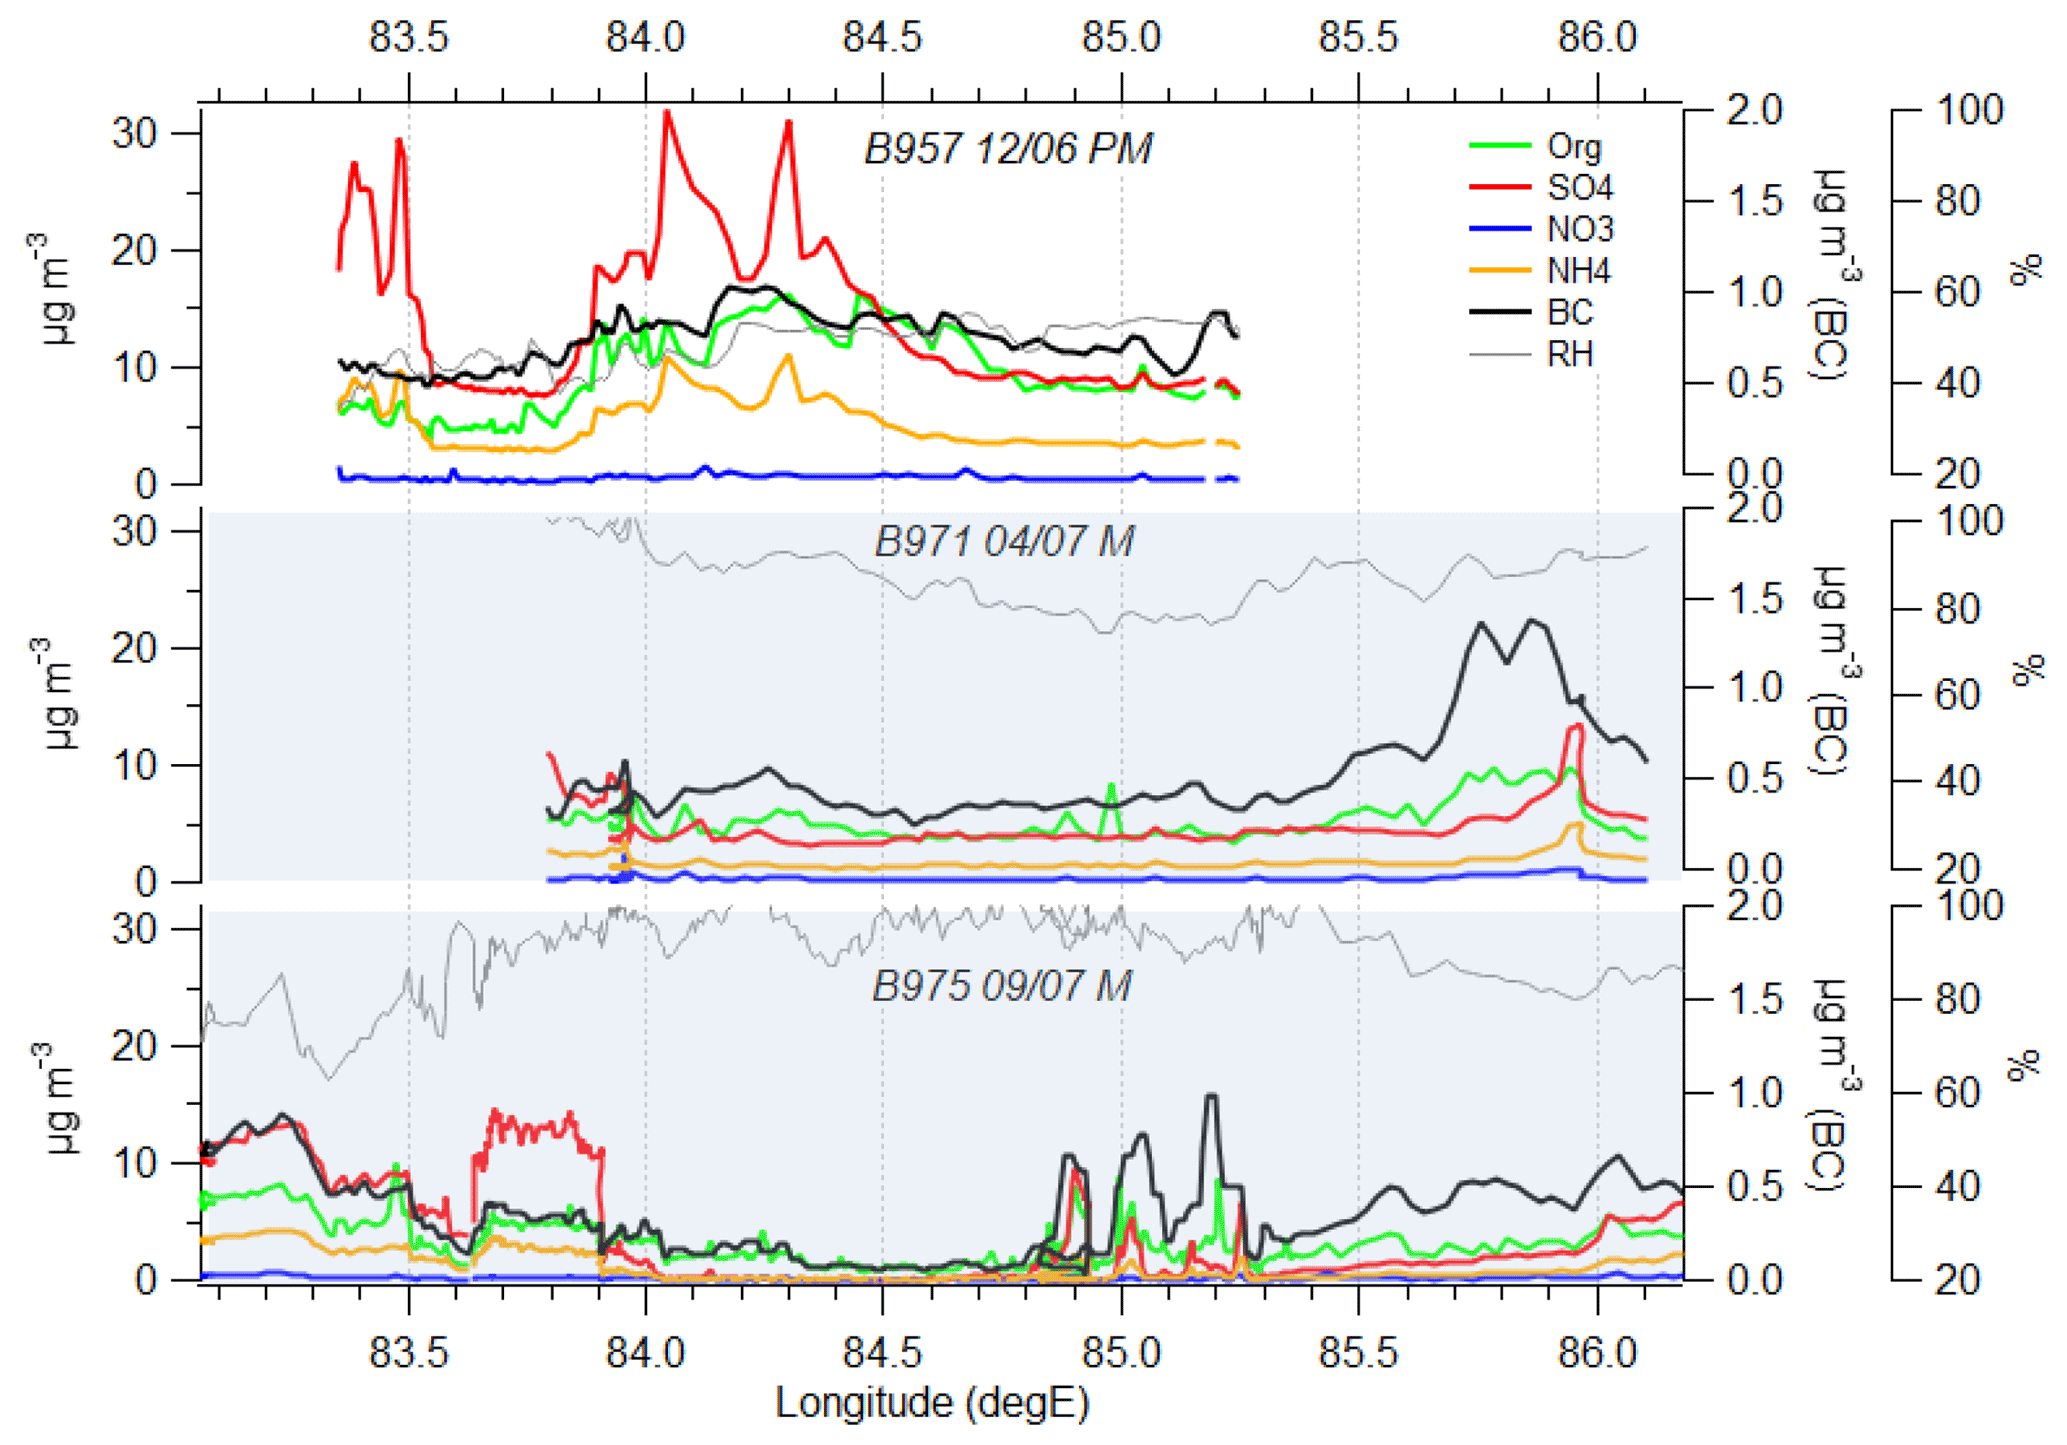
Figure 7Horizontal spatial aerosol chemical composition (below 1000 m) plots for pre-monsoon (PM) and monsoon (M) seasons in northern India, from Lucknow to Bhubaneswar. The monsoon progression is indicated by the blue shaded region.
The aerosol physical properties, shown in Figs. 8 and 9, also vary between the IGP and other regions in northern India. During the pre-monsoon, aerosol number concentrations for both coarse and accumulation mode particles were high. The accumulation mode number concentration was greatest within the IGP boundary layer, coinciding with high organic aerosol loading in the IGP region and consistent with the significantly elevated rBC observations. To the west of the IGP, however, the boundary layer had a higher proportion of coarse mode aerosol. This suggests the dominance of dust and other scattering aerosol species in these regions, consistent with the land surface type (dry, arid deserts) and the dominance of sulfate aerosol outside the IGP. These findings are consistent with the size distributions presented in Fig. 9, for both the on-board instruments and AERONET Kanpur size distributions. During the pre-monsoon, larger particles dominate the aerosol volume size distribution both inside and outside the IGP, as both regions are influenced by the prevailing wind direction from the arid, dusty regions in the NW of India. As the monsoon progresses, Fig. 9c and f indicate the removal of in particular larger particles inside the IGP, consistent with the change in prevailing wind pattern in Fig. 2.
As with the aerosol chemical composition, the aerosol physical properties underwent changes during the monsoon progression. After the monsoon rains had arrived, the fine mode fraction within the IGP increased, indicating that larger aerosol particles (such as suspended dust) are being washed out by the monsoon and that increased surface wetness suppresses the suspension of dust (as shown in Figs. 8 and 9). Outside the IGP towards NW India, the aerosol physical properties remained similar to the pre-monsoon conditions, with larger aerosol particles dominating. This is partly due to the arrival of the monsoon in this region, the last region to receive the rains. Thus, during B976 (final science flight of the campaign) the monsoon had not fully developed in the far NW, resulting in little monsoon rain washout. The size distribution information in Fig. 9 agrees with this, with a decrease in the amount of larger aerosol inside the IGP with monsoon arrival there, whereas outside the IGP the larger particle concentrations remain similar to the pre-monsoon values. Spatial changes in the aerosol scattering properties were also witnessed with monsoon progression. When the surface wetness is increased with monsoon arrival, dust suspension can be prevented but anthropogenic emissions can continue, so once the rain has removed the particulates in the atmosphere and sources of aerosol change, then the atmospheric burden will be altered. Also, with monsoon arrival the origins of air masses change, which may have played a role in the decreasing presence of large aerosol (indicated by the wind field analysis in Fig. 2).
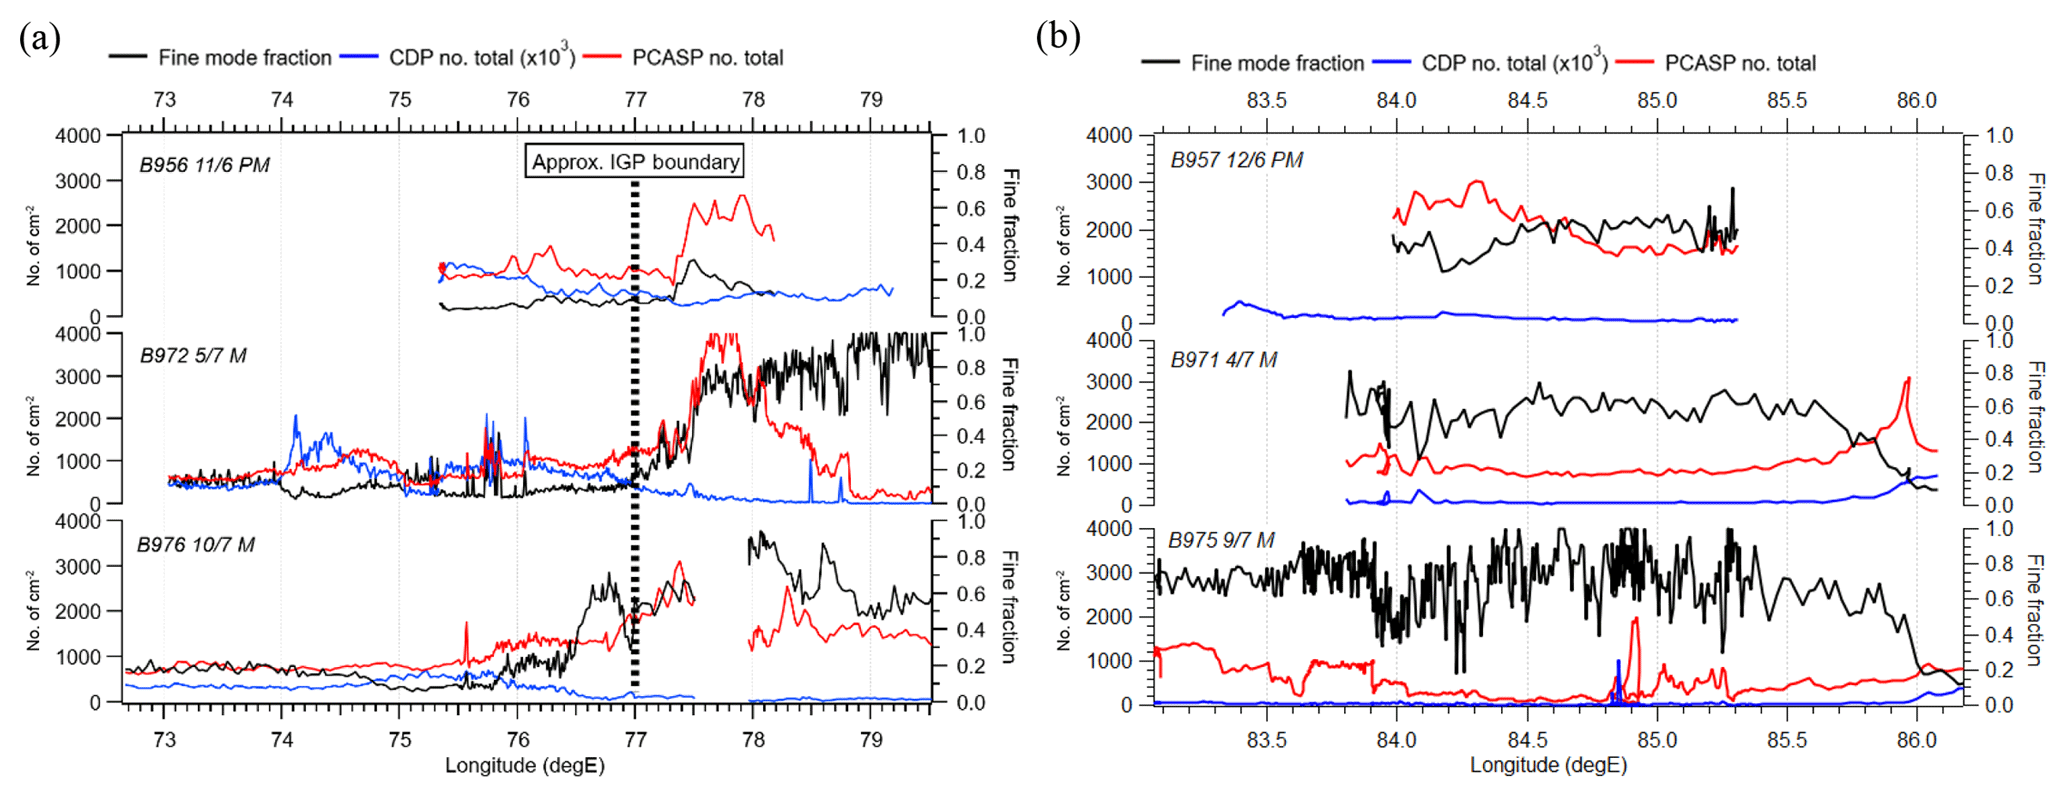
Figure 8Horizontal variability in aerosol physical properties (CDP no. total, PCASP no. total and fine mode fraction) for pre-monsoon (PM) and monsoon (M) seasons in northern India, from (a) Lucknow to Jaipur/Jodhpur and (b) Lucknow to Bhubaneswar.
The monsoon progression influence on aerosol chemical and physical properties can also be probed through analysis of ratios of various aerosol and gaseous species. In Fig. 10 the BC : CO (µgm−3 ppbv−1) and OA : BC increment ratios are presented. The ratio of BC : CO provides information on aerosol washout occurring as the monsoon progresses and provides details surrounding the primary aerosol present. As the monsoon progressed over northern India, the BC : CO ratio decreases, especially in the IGP, indicative of wet removal. High ratios of OA : BC indicate that larger amounts of secondary organic aerosol are being formed, whereas low OA : BC ratios are more often associated with a greater contribution from anthropogenic sources. The OA : BC ratio over northern India increased with the progression of the monsoon, which is likely due to an increase in biogenic emissions.
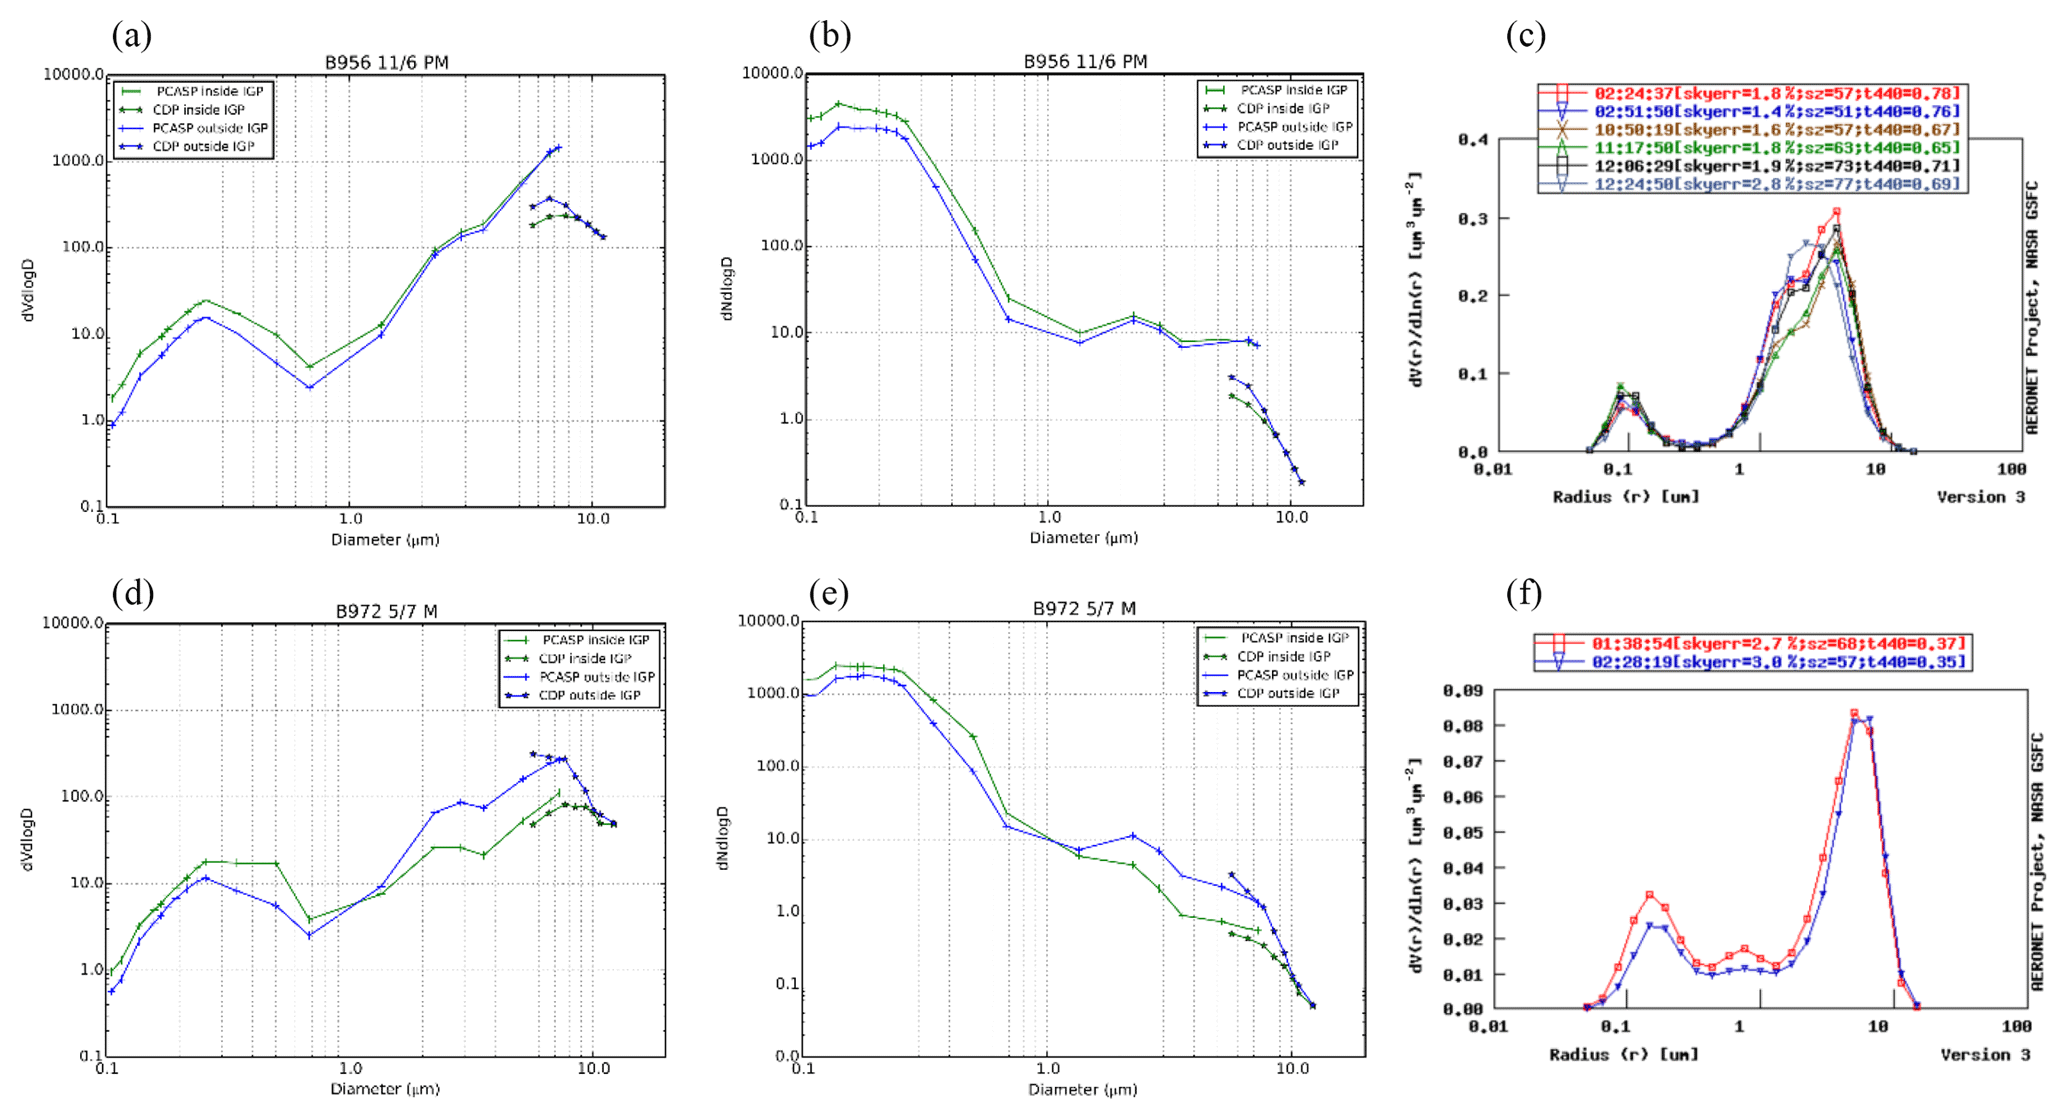
Figure 9Volume size (dVdlogD) and number size (dNdlogD) distribution plots from the CDP and PCASP data, for (a, b) B956 (pre-monsoon) and (c, d) B972 (monsoon) flights. The blue (green) data points are for outside the IGP (inside the IGP). (e) AERONET volume size distribution from Kanpur site in the IGP (26.5∘ N, 80.2∘ E) for 11 June (B956) pre-monsoon and (f) for 30 June (B968) monsoon transition.
3.2 Vertical distribution of aerosol during the monsoon progression
Vertical profiles were also carried out using the aircraft in NW India (Jaipur/Jodhpur: 26.91∘ N, 75.79∘ E/26.24∘ N, 73.02∘ E), the IGP (Lucknow: 26.85∘ N, 80.95∘ E) and NE India (Bhubaneswar: 20.30∘ N, 85.83∘ E) during both the pre-monsoon (Sect. 3.2.1) and monsoon (Sect. 3.2.2) seasons.
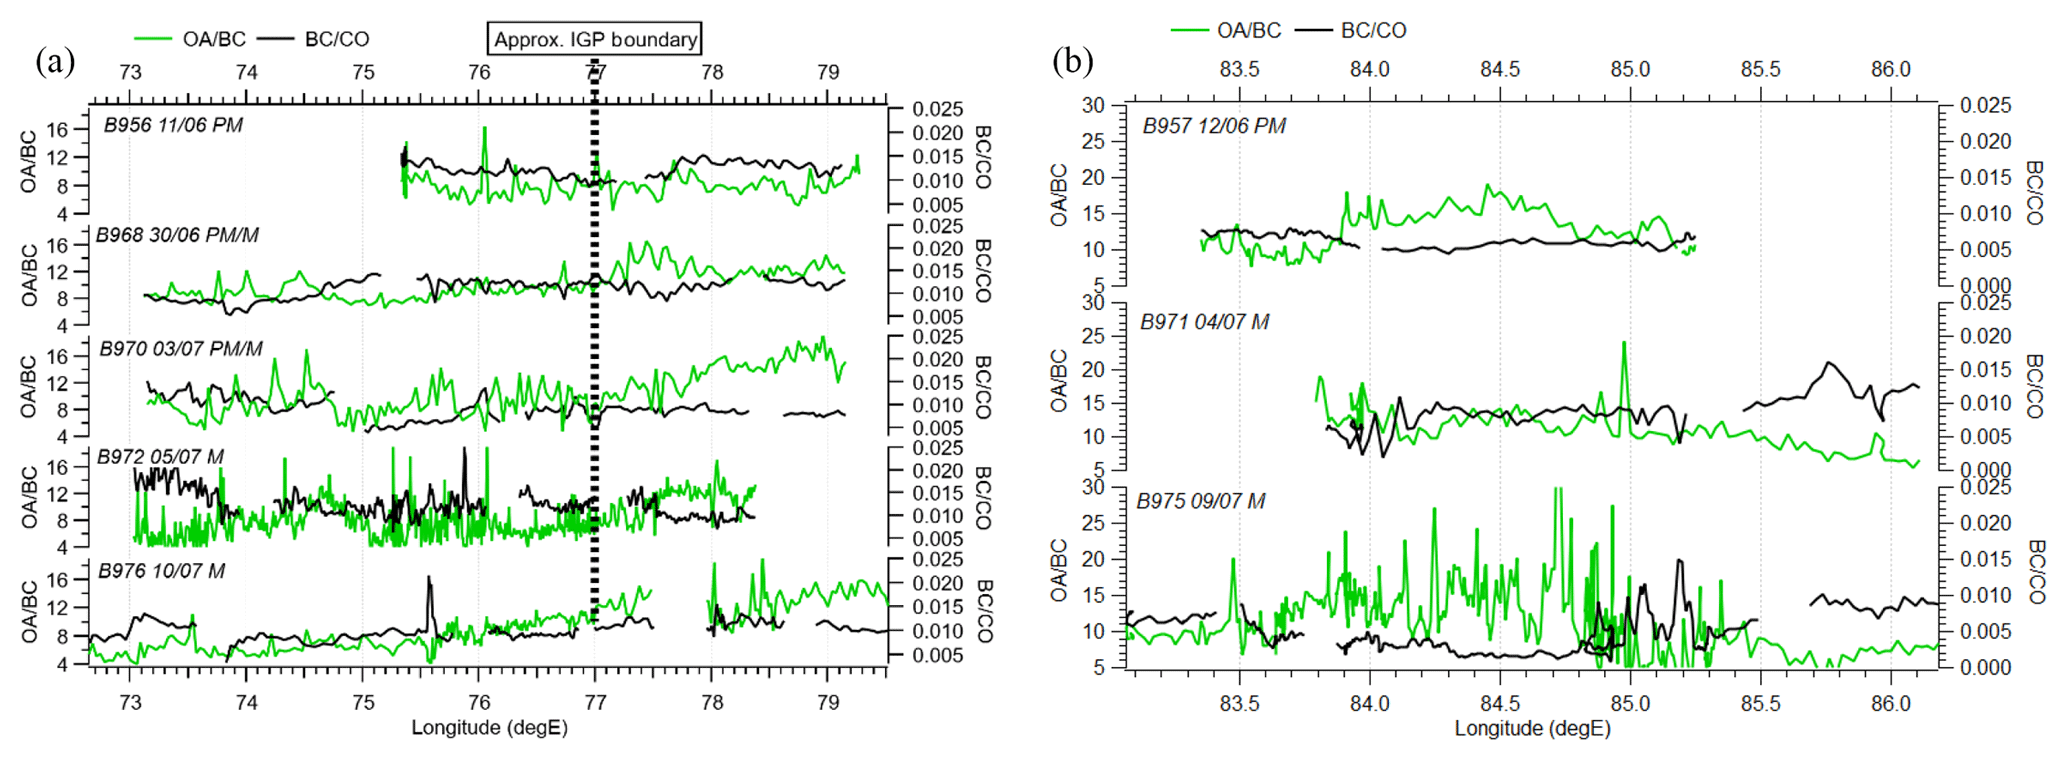
Figure 10Horizontal spatial aerosol chemical composition (ratios of organics to black carbon, OA : BC, and black carbon to carbon monoxide, BC : CO) for pre-monsoon (PM) and monsoon (M) seasons in northern India, from (a) Lucknow to Jaipur/Jodhpur and (b) from Lucknow to Bhubaneswar.
3.2.1 Pre-monsoon
Inside the IGP, it has been shown that organic aerosol dominated in the boundary layer (as seen in Fig. 10), but there was a significant structure in the vertical. During the pre-monsoon, there was a clear thermodynamic separation in the column between the boundary layer and an elevated aerosol layer (EAL) aloft, as shown by the potential temperature (⊖) structure in Fig. 3. The boundary layer is associated with a constant potential temperature with height, at the top of which increasing values of ⊖ characterise the top of the convective mixing layer and marks the planetary boundary layer height; above this is the EAL. These thermodynamic criteria were chosen due to use in previous literature (Seibert et al., 2000; Eresmaa et al., 2006; Haeffelin et al., 2012).
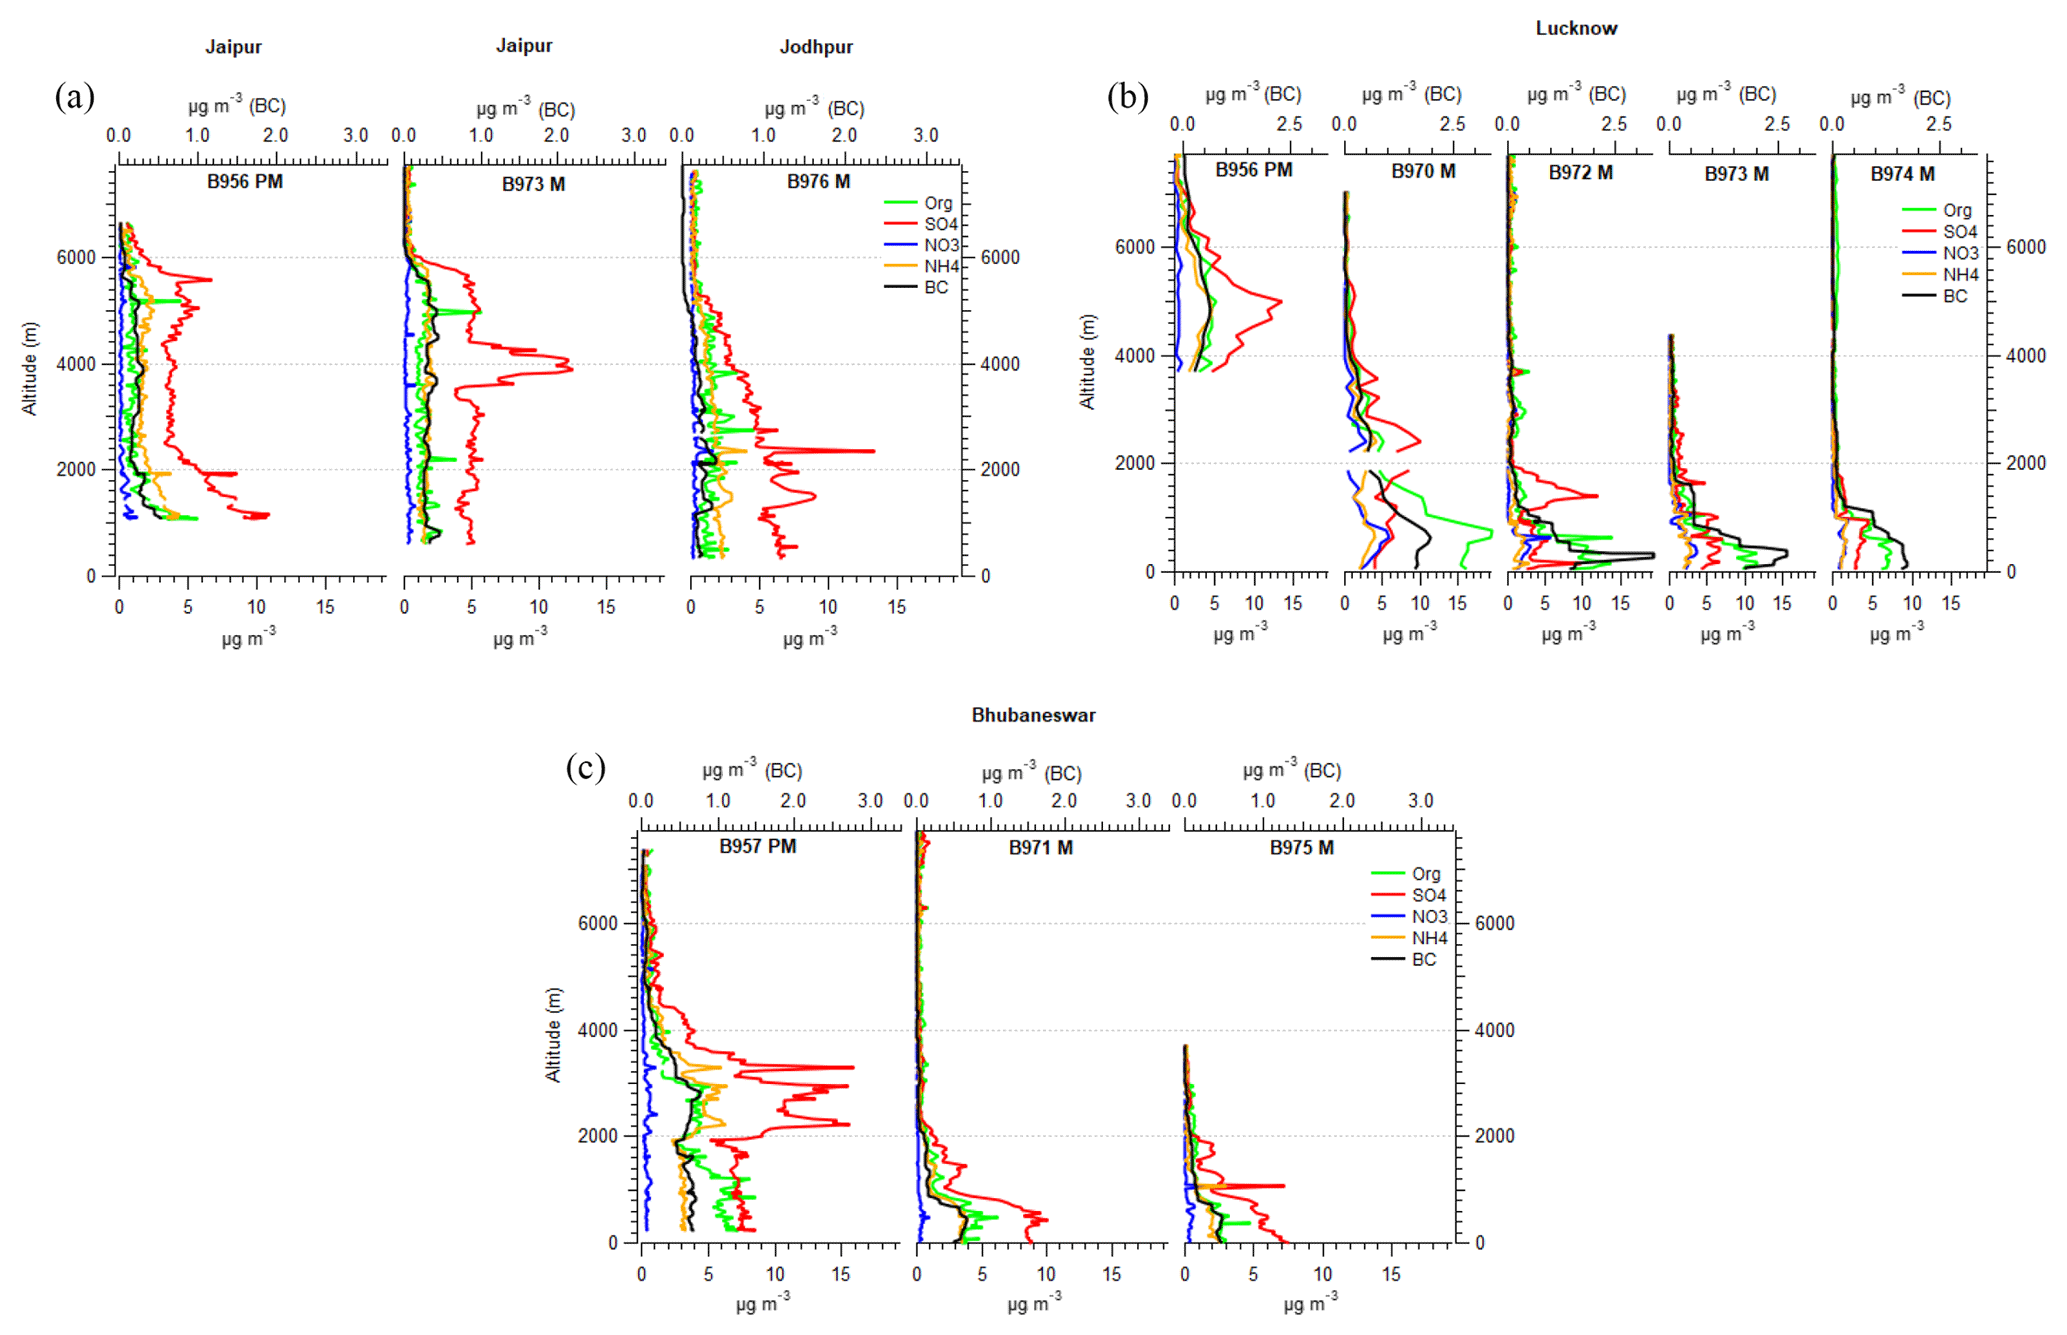
Figure 11Vertical profile aerosol chemical composition for (a) Jaipur/Jodhpur in NW India, (b) Lucknow in the IGP, and (c) Bhubaneswar in NE India. Data presented here are for the pre-monsoon (PM) and monsoon (M) season. The figures show AMS (bottom x axis) and SP2 (BC) (top x axis).
Inside the IGP, organic aerosol dominated the aerosol loading (43 %) up to ∼2 km with mass concentrations of ∼15 µg m−3 and is consistent with the boundary layer transects already discussed. Black carbon mass concentrations were largest in the boundary layer in the IGP (∼2 µg m−3). Other inorganic aerosol species also had significant mass concentrations in the boundary layer, with sulfate, ammonium and nitrate each contributing ∼5 µg m−3. Above the boundary layer, an EAL existed between 2 and 7 km with sulfate the dominating aerosol species (50 %) at concentrations of ∼10 µg m−3. Other aerosol species were also seen in the EAL, but in much lower mass concentrations compared to within the boundary layer (5 µg m−3 OA, 0.5 µg m−3 BC).
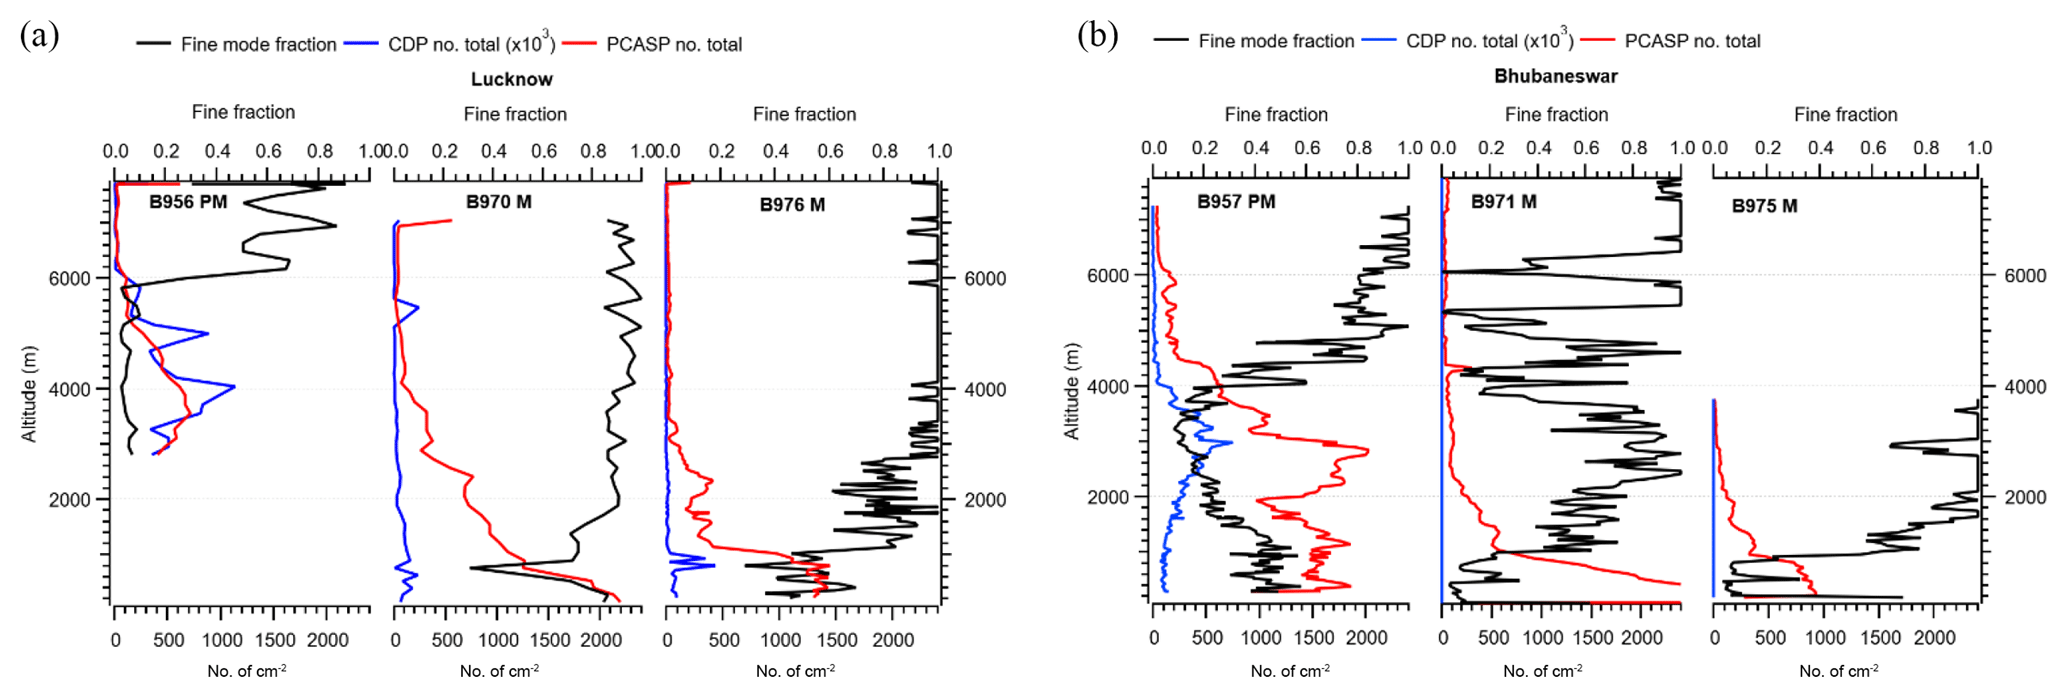
Figure 12Vertical profiles of aerosol physical properties (CDP no. total, PCASP no. total and fine mode fraction) for (a) Lucknow and (b) Bhubaneswar for one PM and two M flights.
Outside the IGP, the aerosol column had a different structure. In the boundary layer, the dominant aerosol species was sulfate (44 %) up to around 1.5 km, with mass concentrations of 8–10 µg m−3. Black carbon mass concentrations were much lower outside the IGP (0.5 µg m−3). Organic aerosol had significant mass concentrations in the boundary layer column but much lower concentrations than inside the IGP (3–5 µg m−3 in the NW and 1–2 µg m−3 in the NE). It was also similar for ammonium mass concentrations (2–3 µg m−3) but even lower mass concentrations of nitrate in the column were found outside the IGP. The aerosol in the boundary layer extended vertically to a maximum height of 6–7 km, with an EAL present between 2 and 5 km dependent on location. For NE India near Bhubaneswar, the EAL was present between 2 and 4 km, with sulfate aerosol dominating similar to that over the IGP. Over NW India around Jaipur, the EAL was present between 3 and 6 km, again with sulfate dominating in this layer.
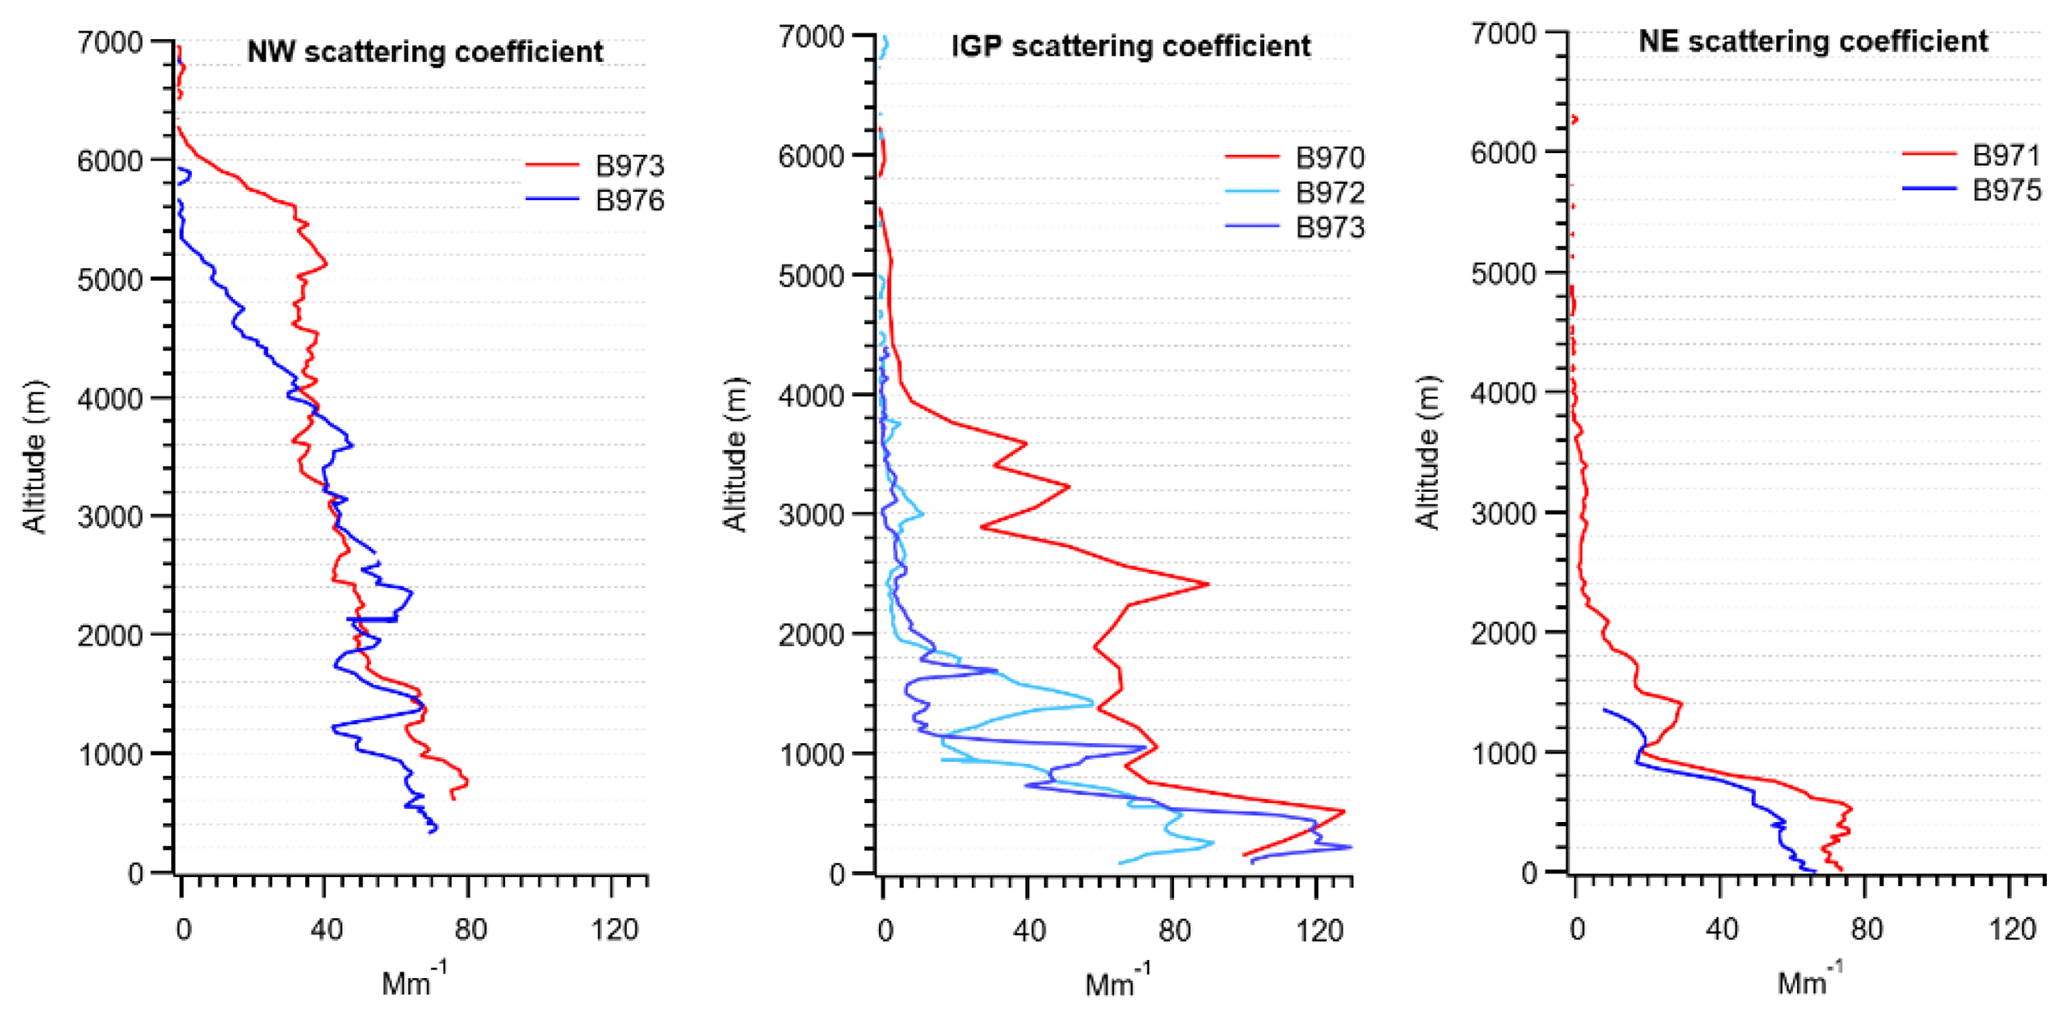
Figure 13Aerosol scattering coefficient (Mm1) in the vertical profile for NW India (Jaipur/Jodhpur: 26.91∘ N, 75.79∘ E/26.24∘ N, 73.02∘ E), IGP (Lucknow: 26.85∘ N, 80.95∘ E) and NE India (Bhubaneswar: 20.30∘ N, 85.83∘ E). The colours represent different science flights, with various progression into the monsoon season.
The aerosol physical properties throughout the column are shown in Figs. 12 and 13. Inside the IGP, the aerosol in the boundary layer included both accumulation and coarse mode particles with scattering coefficient values of ∼120 Mm−1. Above the boundary layer in the EAL, the aerosol included both accumulation and coarse mode particles, with lower scattering coefficient values of ∼80 Mm−1. Outside the IGP, for the NW India region, a larger proportion of particles were in the coarse mode and scattering aerosol coefficients were consistent at 40–60 Mm−1 through the entire atmospheric column, indicative of sulfate and dust aerosol presence throughout.
3.2.2 Monsoon
The monsoon arrival had a strong impact on aerosol properties throughout the atmospheric column (as seen in Figs. 11–13). During the pre-monsoon, the EAL was present across northern India, but this layer diminished as the monsoon continued. The monsoon system arrived first across the study region in NE India over Bhubaneswar, where large decreases in total aerosol mass concentration were witnessed from 25–30 to ∼15 µg m−3 in the EAL. Decreases occurred in the height at which the aerosol load was maximum, decreasing from 5 km in the pre-monsoon to below 2 km when the monsoon progressed over the region, with the EAL between 2 and 4 km being removed. These changes were also witnessed when the monsoon progressed and developed over the IGP and NW India locations. Inside the IGP, the EAL diminished during the monsoon, leaving behind aerosol only within the boundary layer, with mass concentrations decreased from ∼30 to ∼20 µg m−3. The height of the maximum aerosol load decreased from 6 km to less than 2 km when the monsoon had fully covered this region. The changes in NW India were slightly different to the IGP and NE India, however. This was in part due to the late arrival of the monsoon at these locations, with the monsoon arrival 2 weeks late over LKN, so the flights that took place in this study were not carried out late enough into July 2016 to witness full monsoon development in NW India. Due to this, the changes to the aerosol profile were somewhat less severe. Aerosol mass concentrations throughout the profile decreased, but the maximum aerosol height extent did not decrease as much as over the IGP and NE India (max height from 6 to 5 km). The EAL over NW India did remain in position as the monsoon system progressed over the region, but decreases in mass concentration did occur. Over NW India it is clear that monsoon washout has been less significant due to the later onset date, which is reflected in the potential temperature and RH values indicating only partial monsoon arrival.
These changes in vertical structure were also reflected in the aerosol physical properties (as shown in Figs. 12 and 13). Data coverage was poor with regards to capturing physical characteristics vertically as the monsoon progressed, but limited information is available across northern India. Despite this it is evident that aerosol number concentrations were decreasing, with the largest decreases occurring for larger particle sizes, as shown by the number and volume size distributions. Over the IGP, coarse mode aerosol was dominant in the pre-monsoon but as the monsoon progressed there was a clear increase in the aerosol fine mode fraction alongside a decrease in the aerosol scattering coefficient to between 80 and 100 Mm−1 in the boundary layer and between 20 and 40 Mm−1 aloft (fine mode fraction is 1 when concentrations are very low). In addition, the height at which the coarse mode aerosol was present in abundance decreased as the monsoon progressed. Outside the IGP in NE India, similar trends in scattering coefficients were present from ∼80 Mm−1 in the pre-monsoon to ∼50 Mm−1 in the monsoon season. The impact in NW India was less pronounced due to the late monsoon onset in this region, but decreases in the maximum height of scattering aerosol were seen as the monsoon progressed.
This study presents data for the first time from an aircraft platform collecting aerosol chemical composition and physical properties across northern India, thus providing a unique and unprecedented dataset. There is a clear need to conduct measurements of the aerosol haze in and around the IGP, with the chemical and physical properties of the aerosol representing a significant unknown. The level of performance of the instruments provided high temporal and spatial resolution across northern India as the monsoon progressed, with the results in this study building upon previous work conducted over previous years and delivering new observations to meet some of the key measurement gaps.
In the vertical profile, inside the IGP, there was an elevated aerosol layer (EAL) present in the pre-monsoon which diminished as the monsoon progressed. With organic matter and fine mode absorbing aerosol dominating in the boundary layer inside the IGP, the EAL was dominated by SO4 and coarse mode aerosol with lower mass concentrations of other aerosol species. In contrast, outside the IGP, the vertical profile was dominated by SO4 and coarse mode aerosol in and above the boundary layer. The data presented in this study fill significant gaps in previous understanding, due to the temporal and spatial coverage of the aircraft platform. Column and vertical profile measurements have been carried out in our study across northern India, where, to date, intensive measurements are lacking as they have only been carried out over the Arabian Sea or Bay of Bengal during the winter or earlier in the pre-monsoon season (Padmakumari et al., 2013). Sarangi et al. (2016) explain that the EAL over northern India consists of fine mode anthropogenic aerosol alongside coarse mode natural aerosol, i.e. dust, but the exact physical and chemical composition was unknown. Previous work in March and April has shown elevated aerosol layers extended above the boundary layer to an altitude of ∼5 km (Kulkarni et al., 2012; Sinha et al., 2013; Babu et al., 2016; Sarangi et al., 2016) and with monsoon arrival the elevated aerosol layer is removed (Ratnam et al., 2018; Vernier et al., 2018), but our in situ measurements were able to quantify the aerosol presence and its characteristics above these heights during the pre-monsoon and how they developed as the monsoon progressed. The maximum black carbon mass concentrations of ∼0.5–1 µg m−3 occurred at an altitude of ∼2 km in previous studies (Moorthy et al., 2009; Nair et al., 2013), consistent with the EAL in our data present between 2 and 7 km, with similar concentrations of ∼0.5 µg m−3 of BC in the elevated layers. Our study also highlights how the monsoon progresses over northern India and the impact of this on the EAL, with the diminishing mass concentrations and maximum height of aerosol particles. Throughout both the boundary layer and aloft, low NO3 mass concentrations were present during the pre-monsoon (0–1 µg m−3) with increases as the monsoon progressed (∼5 µg m−3). Coupled with large SO4 mass concentrations, Sharma et al. (2014) explain that this pattern could be indicative of aerosols undergoing long-range transport. For example, during the pre-monsoon there is clear long-range transport, especially aloft, aiding in the formation of the SO4 dominant EAL. The regional air mass directions are consistently from the north-west during the pre-monsoon, from the Thar Desert region that is also coincident with high density of mining and power plants (Garg and Shukla, 2009). This region could be a potential source of the significant SO4 mass concentrations, with this being a topic in need of further study to ascertain the influence on SO4 mass concentration.
By making use of in situ and remote sensing techniques, studies have shown that dust aerosols are significant contributors to elevated aerosol loadings over the IGP during the pre-monsoon season (Gautam et al., 2010; Vaishya et al., 2018), along with input from absorbing aerosol species such as BC. The elevated aerosol layers, such as those in our study, have been highlighted to originate from Arabian and Thar Desert regions, driven by winds across the IGP around the height of 850 hPa 3–5 km−1 (Das et al., 2013). The in situ measurements, however, of aerosol optical properties have been lacking until recently (Vaishya et al., 2018). The scattering coefficient values from our study provide useful comparison to those from Vaishya et al. (2018) despite the lack of in situ absorption coefficient values through the vertical profile. In both datasets, vertical heterogeneity is clear in optical properties across northern India. Like Vaishya et al. (2018) the vertical variations are weak over NW India over locations such as Jaipur and Jodhpur but are much stronger over the central IGP (Lucknow) and NE India (Bhubaneswar) locations. Over NW India, scattering coefficient values are high in the boundary layer and aloft at values of around 50–60 Mm−1, comparable to Vaishya et al. (2018). In the IGP around Lucknow, in a similar region to the central IGP location of Varanasi in Vaishya et al. (2018), the scattering coefficients are high in the boundary layer (80–120 Mm−1), with decreased values in the elevated aerosol layer (∼60 Mm−1). Finally, in NE India, the scattering coefficient values are consistent and lower than the NW and IGP profiles, with coefficients of 60–70 Mm−1 in the boundary layer and very low aloft. These findings are consistent with the others in our study, highlighting the presence of larger dust aerosol particles aloft with varying properties in the boundary layer dependent on location across northern India. Our scattering coefficient values also show agreement with previous literature values, such as Babu et al. (2016) for all locations and Ram et al. (2016) for Lucknow.
The spatial distribution of submicron aerosol chemical composition and physical properties has been characterised here based upon airborne measurements throughout the vertical column across northern India, during the pre-monsoon and monsoon seasons. Aerosol source analysis in the literature can provide useful context for the aerosol composition presented. Across the IGP, it has been found that the residential sector provides the greatest particulate emissions, over double the emissions from large industry and transport (Pandey et al., 2014). Organic matter (wood burning stoves and open fires) and black carbon aerosol (kerosene lamps, woodstoves and agricultural residue-based stoves) are known to arise largely from residential fuel burning activities (Fleming et al., 2018), consistent with our findings as these practices are seen widely across the IGP region where organic matter and BC values are greatest. Distinctive to the IGP were high OA : BC ratios (10–15), which are somewhat higher than for similar polluted environments such as China during summer with a ratio of ∼4 (Ho et al., 2006; Ni et al., 2018). It has been indicated that OA : BC ratios over India could be greater than expected due to the dominance of biomass burning rather than fossil fuel emissions, with the highest values in the pre-monsoon season (Ram and Sarin, 2011; Bisht et al., 2015; Kumar and Yadav, 2016) as seen in our data. Outside the IGP, the aerosol species concentrations are consistent with the aerosol sources, with more informal industries and manufacturing industries present that form high concentrations of SO4 aerosol through the conversion of sulfur dioxide (SO2) into sulfuric acid (H2SO4). Ammonium mass concentrations correlate well with SO4 regional patterns within the boundary layer, which is a strong indication of (NH4)2SO4 formation in the atmosphere.
This source information, coupled with the extensive in situ measurements, will prove pivotal in producing more accurate climate models and being able to calculate the energy balance and climate forcing accurately through the monsoon.
Processed data are available through the SWAAMI and parent FAAM archives at the Centre for Environmental Data Analysis (CEDA) (http://data.ceda.ac.uk/badc/faam, last access: 26 April 2019, FAAM, 2016).
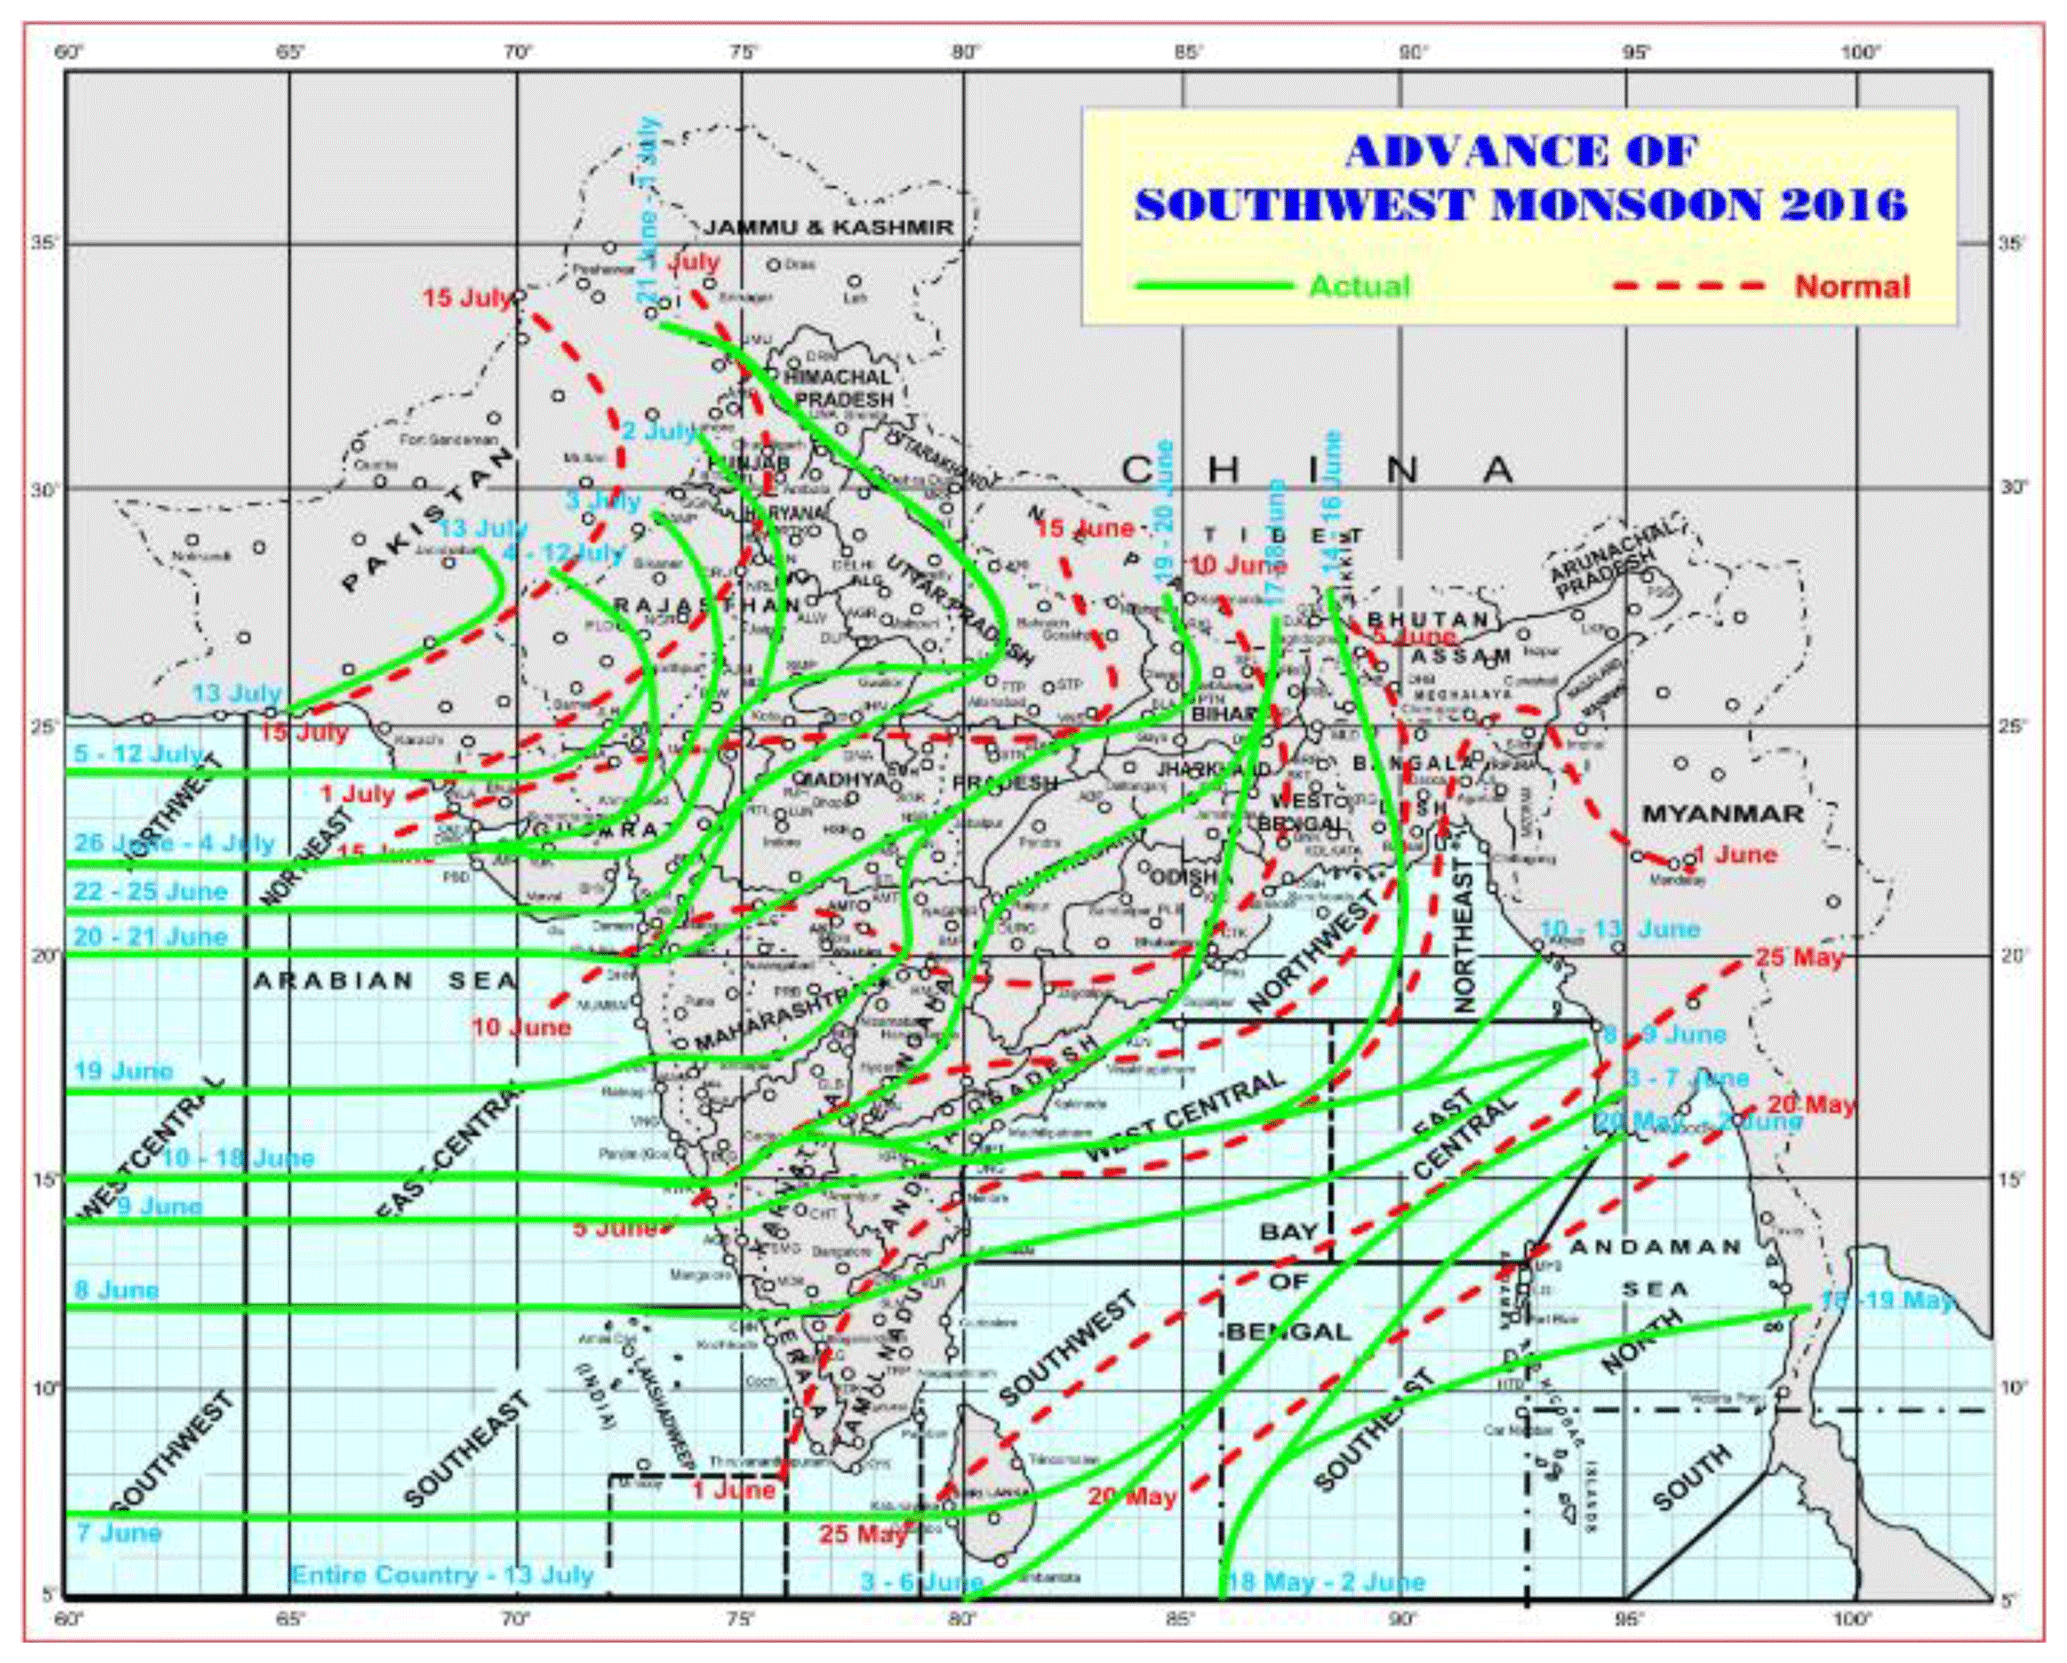
Figure A1Advance of the Indian summer monsoon of 2016 (India Meteorological Department, Ministry of Earth Sciences, India).
JB was responsible for the AMS and SP2 instrument operation in the field, data processing, data analysis, and the writing of this paper. JA and PW were responsible for the maintenance and running of the AMS prior to and during the campaign, and DL supplied expertise and operation of the SP2 prior to and during the campaign. SK also contributed to the operation of the AMS and SP2 in the field. JH, EH, SB, SS, AT and HC were the project investigators for this campaign. CF and JL were responsible for the data processing of the PCASP, CDP, Nephelometer and PSAP data. DS processed and analysed the lidar data.
The authors declare that they have no conflict of interest.
This article is part of the special issue “Interactions between aerosols and the South West Asian monsoon”. It is not associated with a conference.
We would like to thank those involved in the SWAAMI project, which is part of the larger MONSOON project. This includes the Facility for Airborne Atmospheric Measurements (FAAM) and AirTask who manage and operate the BAe-146 Atmospheric Research Aircraft, which is jointly funded by the Natural Environmental Research Council (NERC) and the Met Office. A number of institutions were involved in logistics, planning and support of the MONSOON campaign: the Met Office, University of Reading, Vikram Sarabhai Space Centre India, and the Indian Institute of Science India. ERA-Interim wind field data were provided courtesy of ECMWF. The lead author was supported by a NERC studentship grant NE/L002469/1 and the authors supported by NERC grant numbers NE/L013886/1, NR/L01386X/1 and NE/P003117/1.
This paper was edited by B. V. Krishna Murthy and reviewed by two anonymous referees.
Allan, J. D., Jimenez, J. L., Williams, P. I., Alfarra, M. R., Bower, K. N., Jayne, J. T., Coe, H., and Worsnop, D. R.: Quantitative sampling using an Aerodyne aerosol mass spectrometer 1. Techniques of data interpretation and error analysis, J. Geophys. Res.-Atmos., 108, https://doi.org/10.1029/2002JD002358, 2003.
Allan, J. D., Delia, A. E., Coe, H., Bower, K. N., Alfarra, M. R., Jimenez, J. L., Middlebrook, A. M., Drewnick, F., Onasch, T. B., Canagaratna, M. R., and Jayne, J. T.: A generalised method for the extraction of chemically resolved mass spectra from Aerodyne aerosol mass spectrometer data, J. Aerosol Sci., 35, 909–922, 2004.
Babu, S. S., Moorthy, K. K., Manchanda, R. K., Sinha, P. R., Satheesh, S. K., Vajja, D. P., Srinivasan, S., and Kumar, V. H.: Free tropospheric black carbon aerosol measurements using high altitude balloon: do BC layers build “their own homes” up in the atmosphere?, Geophys. Res. Lett., 38, https://doi.org/10.1029/2011GL046654, 2011.
Babu, S. S., Nair, V. S., Gogoi, M. M., and Moorthy, K. K.: Seasonal variation of vertical distribution of aerosol single scattering albedo over Indian sub-continent: RAWEX aircraft observations, Atmos. Environ., 125, 312–323, https://doi.org/10.1016/j.atmosenv.2015.09.041, 2016.
Banerjee, T., Murari, V., Kumar, M., and Raju, M. P.: Source apportionment of airborne particulates through receptor modeling: Indian scenario, Atmos. Res., 164, 167e187, https://doi.org/10.1016/j.atmosres.2015.04.017, 2015.
Baumgardner, D., Kok, G., and Raga, G.: Warming of the Arctic lower stratosphere by light absorbing particles, Geophys. Res. Lett., 31, https://doi.org/10.1029/2003GL018883, 2004.
Bhattu, D. and Tripathi, S. N.: CCN closure study: Effects of aerosol chemical composition and mixing state, J. Geophys. Res.-Atmos., 120, 766–783, 2015.
Bisht, D. S., Dumka, U. C., Kaskaoutis, D. G., Pipal, A. S., Srivastava, A. K., Soni, V. K., Attri, S. D., Sateesh, M., and Tiwari, S.: Carbonaceous aerosols and pollutants over Delhi urban environment: temporal evolution, source apportionment and radiative forcing, Sci. Total Environ., 521, 431–445, 2015.
Bond, T. C., Anderson, T. L., and Campbell, D.: Calibration and intercomparison of filter-based measurements of visible light absorption by aerosols, Aerosol Sci. Tech., 30, 582–600, 1999.
Cai, Y., Snider, J. R., and Wechsler, P.: Calibration of the passive cavity aerosol spectrometer probe for airborne determination of the size distribution, Atmos. Meas. Tech., 6, 2349–2358, https://doi.org/10.5194/amt-6-2349-2013, 2013.
Chakraborty, A., Bhattu, D., Gupta, T., Tripathi, S. N., and Canagaratna, M. R.: Real-time measurements of ambient aerosols in a polluted Indian city: Sources, characteristics, and processing of organic aerosols during foggy and nonfoggy periods, J. Geophys. Res.-Atmos., 120, 9006–9019, 2015.
Chakraborty, A., Gupta, T., and Tripathi, S. N.: Chemical composition and characteristics of ambient aerosols and rainwater residues during Indian summer monsoon: Insight from aerosol mass spectrometry, Atmos. Environ., 136, 144–155, https://doi.org/10.1016/j.atmosenv.2016.04.024, 2016.
Crosier, J., Allan, J. D., Coe, H., Bower, K. N., Formenti, P., and Williams, P. I.: Chemical composition of summertime aerosol in the Po Valley (Italy), northern Adriatic and Black Sea, Q. J. Roy. Meteor. Soc., 133, 61–75, 2007.
Crosier, J., Bower, K. N., Choularton, T. W., Westbrook, C. D., Connolly, P. J., Cui, Z. Q., Crawford, I. P., Capes, G. L., Coe, H., Dorsey, J. R., Williams, P. I., Illingworth, A. J., Gallagher, M. W., and Blyth, A. M.: Observations of ice multiplication in a weakly convective cell embedded in supercooled mid-level stratus, Atmos. Chem. Phys., 11, 257–273, https://doi.org/10.5194/acp-11-257-2011, 2011.
Das, S., Dey, S., Dash, S. K., and Basil, G.: Examining mineral dust transport over the Indian subcontinent using the regional climate model, RegCM4.1, Atmos. Res., 134, 64–76, https://doi.org/10.1016/j.atmosres.2013.07.019, 2013.
Dee, D. P., Uppala, S. M., Simmons, A. J., Berrisford, P., Poli, P., Kobayashi, S., Andrae, U., Balmaseda, M. A., Balsamo, G., Bauer, D. P., and Bechtold, P.: The ERA-Interim reanalysis: Configuration and performance of the data assimilation system, Q. J. Roy. Meteor. Soc., 137, 553–597, 2011.
Eresmaa, N., Karppinen, A., Joffre, S. M., Räsänen, J., and Talvitie, H.: Mixing height determination by ceilometer, Atmos. Chem. Phys., 6, 1485–1493, https://doi.org/10.5194/acp-6-1485-2006, 2006.
Facility for Airborne Atmospheric Measurements (FAAM): SWAAMI: in-situ airborne observations by the FAAM BAE-146 aircraft, Centre for Environmental Data Analysis, Natural Environment Research Council, Met Office, available at: http://catalogue.ceda.ac.uk/uuid/c115c8f8693346bbbcad373348a32367 (last access: 26 April 2019), 2016.
Fleming, L. T., Lin, P., Laskin, A., Laskin, J., Weltman, R., Edwards, R. D., Arora, N. K., Yadav, A., Meinardi, S., Blake, D. R., Pillarisetti, A., Smith, K. R., and Nizkorodov, S. A.: Molecular composition of particulate matter emissions from dung and brushwood burning household cookstoves in Haryana, India, Atmos. Chem. Phys., 18, 2461–2480, https://doi.org/10.5194/acp-18-2461-2018, 2018.
Foltescu, V. L., Selin, E., and Below, M.: Corrections for particle losses and sizing errors during aircraft aerosol sampling using a rosemount inlet and the PMS LAS-X, Atmos. Environ., 29, 449–453, 1995.
Ganguly, D., Gadhavi, H., Jayaraman, A., Rajesh, T. A., and Misra, A.: Single scattering albedo of aerosols over the central India: Implications for the regional aerosol radiative forcing, Geophys. Res. Lett., 32, https://doi.org/10.1029/2005GL023903, 2005.
Garg, A. and Shukla, P. R.: Coal and energy security for India: Role of carbon dioxide (CO2) capture and storage (CCS), Energy, 34, 1032–1041, 2009.
Gautam, R., Hsu, N. C., and Lau, K. M.: Premonsoon aerosol characterization and radiative effects over the Indo-Gangetic plains: Implications for regional climate warming, J. Geophys. Res.-Atmos., 115, D17208, https://doi.org/10.1029/2010JD013819, 2010.
Gautam, R., Hsu, N. C., Tsay, S. C., Lau, K. M., Holben, B., Bell, S., Smirnov, A., Li, C., Hansell, R., Ji, Q., Payra, S., Aryal, D., Kayastha, R., and Kim, K. M.: Accumulation of aerosols over the Indo-Gangetic plains and southern slopes of the Himalayas: distribution, properties and radiative effects during the 2009 pre-monsoon season, Atmos. Chem. Phys., 11, 12841–12863, https://doi.org/10.5194/acp-11-12841-2011, 2011.
Gerbig, C., Schmitgen, S., Kley, D., Volz-Thomas, A., Dewey, K., and Haaks, D.: An improved fast-response vacuum-UV resonance fluorescence CO instrument. J. Geophys. Res.-Atmos., 104, 1699–1704, 1999.
Haeffelin, M., Angelini, F., Morille, Y., Martucci, G., Frey, S., Gobbi, G. P., Lolli, S., O'dowd, C. D., Sauvage, L., Xueref-Rémy, I., and Wastine, B.: Evaluation of mixing-height retrievals from automatic profiling lidars and ceilometers in view of future integrated networks in Europe, Bound.-Lay. Meteorol., 143, 49–75, 2012.
Haywood, J. M. and Osborne, S. R.: Corrections to be applied to the PSAP and nephelometer for accurate determination of the absorption coefficient, scattering coefficient and single scattering albedo, MRF Tech. Note, 31, 2000.
Ho, K. F., Lee, S. C., Cao, J. J., Li, Y. S., Chow, J. C., Watson, J. G., and Fung, K.: Variability of organic and elemental carbon, water soluble organic carbon, and isotopes in Hong Kong, Atmos. Chem. Phys., 6, 4569–4576, https://doi.org/10.5194/acp-6-4569-2006, 2006.
Jethva, H., Satheesh, S. K., and Srinivasan, J.: Seasonal variability of aerosols over the Indo-Gangetic basin, J. Geophys. Res.-Atmos., 110, https://doi.org/10.1029/2005JD005938, 2005.
Jimenez, J. L., Jayne, J. T., Shi, Q., Kolb, C. E., Worsnop, D. R., Yourshaw, I., Seinfeld, J. H., Flagan, R. C., Zhang, X., Smith, K. A., and Morris, J. W.: Ambient aerosol sampling using the aerodyne aerosol mass spectrometer. J. Geophys. Res.-Atmos., 108, https://doi.org/10.1029/2001JD001213, 2003.
Kumar, P. and Yadav, S.: Seasonal variations in water soluble inorganic ions, OC and EC in PM10 and PM10 aerosols over Delhi: Influence of sources and meteorological factors, Aerosol Air Qual. Res, 16, 1165–1178, 2016.
Kumar, B., Chakraborty, A., Tripathi, S. N., and Bhattu, D.: Highly time resolved chemical characterization of submicron organic aerosols at a polluted urban location, Environm. Sci., 18, 1285–1296, 2016.
Laborde, M., Mertes, P., Zieger, P., Dommen, J., Baltensperger, U., and Gysel, M.: Sensitivity of the Single Particle Soot Photometer to different black carbon types, Atmos. Meas. Tech., 5, 1031–1043, https://doi.org/10.5194/amt-5-1031-2012, 2012.
Lau, K. M. and Yang, S.: Climatology and interannual variability of the Southeast Asian summer monsoon, Adv. Atmos. Sci., 14, 141–162, 1997.
Li, Z., Lau, W. M., Ramanathan, V., Wu, G., Ding, Y., Manoj, M. G., Liu, J., Qian, Y., Li, J., Zhou, T., and Fan, J.: Aerosol and monsoon climate interactions over Asia, Rev. Geophys., 54, 866–929, 2016.
Liu, D., Flynn, M., Gysel, M., Targino, A., Crawford, I., Bower, K., Choularton, T., Jurányi, Z., Steinbacher, M., Hüglin, C., Curtius, J., Kampus, M., Petzold, A., Weingartner, E., Baltensperger, U., and Coe, H.: Single particle characterization of black carbon aerosols at a tropospheric alpine site in Switzerland, Atmos. Chem. Phys., 10, 7389–7407, https://doi.org/10.5194/acp-10-7389-2010, 2010.
Liu, D., Allan, J. D., Young, D. E., Coe, H., Beddows, D., Fleming, Z. L., Flynn, M. J., Gallagher, M. W., Harrison, R. M., Lee, J., Prevot, A. S. H., Taylor, J. W., Yin, J., Williams, P. I., and Zotter, P.: Size distribution, mixing state and source apportionment of black carbon aerosol in London during wintertime, Atmos. Chem. Phys., 14, 10061–10084, https://doi.org/10.5194/acp-14-10061-2014, 2014.
Liu, D., Taylor, J. W., Young, D. E., Flynn, M. J., Coe, H., and Allan, J. D.: The effect of complex black carbon microphysics on the determination of the optical properties of brown carbon, Geophys. Res. Lett., 42, 613–619, 2015.
Marenco, F.: Nadir airborne lidar observations of deep aerosol layers, Atmos. Meas. Tech., 6, 2055–2064, https://doi.org/10.5194/amt-6-2055-2013, 2013.
Marenco, F., Johnson, B., Turnbull, K., Newman, S., Haywood, J., Webster, H., and Ricketts, H.: Airborne lidar observations of the 2010 Eyjafjallajökull volcanic ash plume, J. Geophys. Res.-Atmos., 116, https://doi.org/10.1029/2011JD016396, 2011.
Marenco, F., Amiridis, V., Marinou, E., Tsekeri, A., and Pelon, J.: Airborne verification of CALIPSO products over the Amazon: a case study of daytime observations in a complex atmospheric scene, Atmos. Chem. Phys., 14, 11871–11881, https://doi.org/10.5194/acp-14-11871-2014, 2014.
Marenco, F., Johnson, B., Langridge, J. M., Mulcahy, J., Benedetti, A., Remy, S., Jones, L., Szpek, K., Haywood, J., Longo, K., and Artaxo, P.: On the vertical distribution of smoke in the Amazonian atmosphere during the dry season, Atmos. Chem. Phys., 16, 2155–2174, https://doi.org/10.5194/acp-16-2155-2016, 2016.
McMeeking, G. R., Hamburger, T., Liu, D., Flynn, M., Morgan, W. T., Northway, M., Highwood, E. J., Krejci, R., Allan, J. D., Minikin, A., and Coe, H.: Black carbon measurements in the boundary layer over western and northern Europe, Atmos. Chem. Phys., 10, 9393–9414, https://doi.org/10.5194/acp-10-9393-2010, 2010.
Middlebrook, A. M., Bahreini, R., Jimenez, J. L., and Canagaratna, M. R.: Evaluation of composition-dependent collection efficiencies for the aerodyne aerosol mass spectrometer using field data, Aerosol Sci. Tech., 46, 258–271, 2012.
Moorthy, K. K., Babu, S. S., Sunilkumar, S. V., Gupta, P. K., and Gera, B. S.: Altitude profiles of aerosol BC, derived from aircraft measurements over an inland urban location in India, Geophys. Res. Lett., 31, https://doi.org/10.1029/2004GL021336, 2004.
Moorthy, K. K., Sunilkumar, S. V., Pillai, P. S., Parameswaran, K., Nair, P. R., Ahmed, Y. N., and Satheesh, S. K.: Wintertime spatial characteristics of boundary layer aerosols over peninsular India, J. Geophys. Res.-Atmos., 110, https://doi.org/10.1029/2004JD005520, 2005.
Moorthy, K. K., Nair, V. S., Babu, S. S., and Satheesh, S. K.: Spatial and vertical heterogeneities in aerosol properties over oceanic regions around India: Implications for radiative forcing, Q. J. Roy. Meteor. Soc., 135, 2131–2145, 2009.
Moorthy, K., Suresh Babu, S., Manoj, M. R., and Satheesh, S. K.: Buildup of aerosols over the Indian Region, Geophys. Res. Lett., 40, 1011–1014, 2013.
Moorthy, K. K., Satheesh, S. K., Sarin, M. M., and Panday, A. K.: South Asian aerosols in perspective: Preface to the special issue, Atmos. Environ., 125, 2016.
Morgan, W. T.: Pollution aerosol across Northern Europe: Assessing properties, processes and effects on regional climate, Doctoral dissertation, University of Manchester, 221 pp., 2010.
Morgan, W. T., Allan, J. D., Bower, K. N., Highwood, E. J., Liu, D., McMeeking, G. R., Northway, M. J., Williams, P. I., Krejci, R., and Coe, H.: Airborne measurements of the spatial distribution of aerosol chemical composition across Europe and evolution of the organic fraction, Atmos. Chem. Phys., 10, 4065–4083, https://doi.org/10.5194/acp-10-4065-2010, 2010.
Müller, D., Ansmann, A., Mattis, I., Tesche, M., Wandinger, U., Althausen, D., and Pisani, G.: Aerosol-type-dependent lidar ratios observed with Raman lidar, J. Geophys. Res.-Atmos., 112, https://doi.org/10.1029/2006JD008292, 2007.
Müller, T., Laborde, M., Kassell, G., and Wiedensohler, A.: Design and performance of a three-wavelength LED-based total scatter and backscatter integrating nephelometer, Atmos. Meas. Tech., 4, 1291–1303, https://doi.org/10.5194/amt-4-1291-2011, 2011.
Myhre, G., Samset, B. H., Schulz, M., Balkanski, Y., Bauer, S., Berntsen, T. K., Bian, H., Bellouin, N., Chin, M., Diehl, T., Easter, R. C., Feichter, J., Ghan, S. J., Hauglustaine, D., Iversen, T., Kinne, S., Kirkevåg, A., Lamarque, J.-F., Lin, G., Liu, X., Lund, M. T., Luo, G., Ma, X., van Noije, T., Penner, J. E., Rasch, P. J., Ruiz, A., Seland, Ø., Skeie, R. B., Stier, P., Takemura, T., Tsigaridis, K., Wang, P., Wang, Z., Xu, L., Yu, H., Yu, F., Yoon, J.-H., Zhang, K., Zhang, H., and Zhou, C.: Radiative forcing of the direct aerosol effect from AeroCom Phase II simulations, Atmos. Chem. Phys., 13, 1853–1877, https://doi.org/10.5194/acp-13-1853-2013, 2013.
Nair, V. S., Solmon, F., Giorgi, F., Mariotti, L., Babu, S. S., and Moorthy, K. K.: Simulation of South Asian aerosols for regional climate studies. J. Geophys. Res.-Atmos., 117, https://doi.org/10.1029/2011JD016711, 2012.
Nair, V. S., Babu, S. S., Moorthy, K. K., and Prijith, S. S.: Spatial gradients in aerosol-induced atmospheric heating and surface dimming over the oceanic regions around India: anthropogenic or natural?. J. Climate, 26, 7611–7621, 2013.
Ni, H., Huang, R.-J., Cao, J., Liu, W., Zhang, T., Wang, M., Meijer, H. A. J., and Dusek, U.: Source apportionment of carbonaceous aerosols in Xi'an, China: insights from a full year of measurements of radiocarbon and the stable isotope 13C, Atmos. Chem. Phys., 18, 16363–16383, https://doi.org/10.5194/acp-18-16363-2018, 2018.
O'Shea, S. J., Allen, G., Gallagher, M. W., Bauguitte, S. J.-B., Illingworth, S. M., Le Breton, M., Muller, J. B. A., Percival, C. J., Archibald, A. T., Oram, D. E., Parrington, M., Palmer, P. I., and Lewis, A. C.: Airborne observations of trace gases over boreal Canada during BORTAS: campaign climatology, air mass analysis and enhancement ratios, Atmos. Chem. Phys., 13, 12451–12467, https://doi.org/10.5194/acp-13-12451-2013, 2013.
Pan, X., Chin, M., Gautam, R., Bian, H., Kim, D., Colarco, P. R., Diehl, T. L., Takemura, T., Pozzoli, L., Tsigaridis, K., Bauer, S., and Bellouin, N.: A multi-model evaluation of aerosols over South Asia: common problems and possible causes, Atmos. Chem. Phys., 15, 5903–5928, https://doi.org/10.5194/acp-15-5903-2015, 2015.
Pandey, A., Sadavarte, P., Rao, A. B., and Venkataraman, C.: Trends in multi-pollutant emissions from a technology-linked inventory for India: II. Residential, agricultural and informal industry sectors, Atmos. Environ., 99, 341–352, 2014.
Parker, D. J., Willetts, P., Birch, C., Turner, A. G., Marsham, J. H., Taylor, C. M., Kolusu, S., and Martin, G. M.: The interaction of moist convection and mid-level dry air in the advance of the onset of the Indian monsoon. Q. J. Roy. Meteor. Soc., 142, 2256–2272, 2016.
Pawar, H., Garg, S., Kumar, V., Sachan, H., Arya, R., Sarkar, C., Chandra, B. P., and Sinha, B.: Quantifying the contribution of long-range transport to particulate matter (PM) mass loadings at a suburban site in the north-western Indo-Gangetic Plain (NW-IGP), Atmos. Chem. Phys., 15, 9501–9520, https://doi.org/10.5194/acp-15-9501-2015, 2015.
Ram, K. and Sarin, M. M.: Day-night variability of EC, OC, WSOC and inorganic ions in urban environment of Indo-Gangetic Plain: implications to secondary aerosol formation, Atmos. Environ., 45, 460–468, 2011.
Ram, K., Singh, S., Sarin, M. M., Srivastava, A. K., and Tripathi, S. N.: Variability in aerosol optical properties over an urban site, Kanpur, in the Indo-Gangetic Plain: A case study of haze and dust events, Atmos. Res., 174, 52–61, https://doi.org/10.1016/j.atmosres.2016.01.014, 2016.
Ramanathan, V., Crutzen, P. J., Lelieveld, J., Mitra, A. P., Althausen, D., Anderson, J., Andreae, M. O., Cantrell, W., Cass, G. R., Chung, C. E., and Clarke, A. D.: Indian Ocean Experiment: An integrated analysis of the climate forcing and effects of the great Indo-Asian haze, J. Geophys. Res.-Atmos., 106, 28371–28398, 2001.
Ramanathan, V., Chung, C., Kim, D., Bettge, T., Buja, L., Kiehl, J. T., Washington, W. M., Fu, Q., Sikka, D. R., and Wild, M.: Atmospheric brown clouds: Impacts on South Asian climate and hydrological cycle, P. Natl. Acad. Sci. USA, 102, 5326–5333, 2005.
Ratnam, M. V., Prasad, P., Raman, M. R., Ravikiran, V., Rao, S. V. B., Murthy, B. K., and Jayaraman, A.: Role of dynamics on the formation and maintenance of the elevated aerosol layer during monsoon season over south-east peninsular India, Atmos. Environ., 188, 43–49, 2018.
Samset, B. H., Myhre, G., Schulz, M., Balkanski, Y., Bauer, S., Berntsen, T. K., Bian, H., Bellouin, N., Diehl, T., Easter, R. C., Ghan, S. J., Iversen, T., Kinne, S., Kirkevåg, A., Lamarque, J.-F., Lin, G., Liu, X., Penner, J. E., Seland, Ø., Skeie, R. B., Stier, P., Takemura, T., Tsigaridis, K., and Zhang, K.: Black carbon vertical profiles strongly affect its radiative forcing uncertainty, Atmos. Chem. Phys., 13, 2423–2434, https://doi.org/10.5194/acp-13-2423-2013, 2013.
Sarangi, C., Tripathi, S. N., Mishra, A. K., Goel, A., and Welton, E. J.: Elevated aerosol layers and their radiative impact over Kanpur during monsoon onset period. J. Geophys. Res.-Atmos., 121, 7936–7957, 2016.
Satheesh, S. K. and Ramanathan, V.: Large differences in tropical aerosol forcing at the top of the atmosphere and Earth's surface, Nature, 405, 60, https://doi.org/10.1038/35011039, 2000.
Schwarz, J. P., Gao, R. S., Spackman, J. R., Watts, L. A., Thomson, D. S., Fahey, D. W., Ryerson, T. B., Peischl, J., Holloway, J. S., Trainer, M., Frost, G. J., Baynard, T., Lack, D. A., de Gouw, J. A., Warneke, C., and Del Negro, L. A.: Measurement of the mixing state, mass, and optical size of individual black carbon particles in urban and biomass burning emissions, Geophys. Res. Lett., 35, 2008.
Seibert, P., Beyrich, F., Gryning, S. E., Joffre, S., Rasmussen, A., and Tercier, P.: Review and intercomparison of operational methods for the determination of the mixing height, Atmos. Environ., 34, 1001–1027, 2000.
Sen, A., Abdelmaksoud, A. S., Ahammed, Y. N., Banerjee, T., Bhat, M. A., Chatterjee, A., Choudhuri, A. K., Das, T., Dhir, A., Dhyani, P. P., and Gadi, R.: Variations in particulate matter over Indo-Gangetic Plains and Indo-Himalayan Range during four field campaigns in winter monsoon and summer monsoon: role of pollution pathways, Atmos. Environ., 154, 200–224, 2017.
Sharma, S. K., Kumar, M., Gupta, N. C., Saxena, M., and Mandal, T. K.: Characteristics of ambient ammonia over Delhi, India, Meteorol. Atmos. Phys., 124, 67–82, 2014.
Shiraiwa, M., Kondo, Y., Moteki, N., Takegawa, N., Sahu, L. K., Takami, A., Hatakeyama, S., Yonemura, S., and Blake, D. R.: Radiative impact of mixing state of black carbon aerosol in Asian outflow, J. Geophys. Res.-Atmos., 113, https://doi.org/10.1029/2008JD010546, 2008.
Singh, S., Singh, B., Gera, B. S., Srivastava, M. K., Dutta, H. N., Garg, S. C., and Singh, R.: A study of aerosol optical depth in the central Indian region (17.3–8.6∘ N) during ISRO-GBP field campaign, Atmos. Environ., 40, 6494–6503, 2006.
Singh, N., Mhawish, A., Deboudt, K., Singh, R. S., and Banerjee, T.: Organic aerosols over Indo-Gangetic Plain: Sources, distributions and climatic implications, Atmos. Environ., 157, 69–74, https://doi.org/10.1016/j.atmosenv.2017.03.008, 2017.
Sinha, P. R., Manchanda, R. K., Kaskaoutis, D. G., Kumar, Y. B., and Sreenivasan, S.: Seasonal variation of surface and vertical profile of aerosol properties over a tropical urban station Hyderabad, India, J. Geophys. Res.-Atmos., 118, 749–768, 2013.
Sreekanth, V., Krishna Moorthy, K., Satheesh, S. K., Suresh Babu, S., Nair, V. S., and Niranjan, K.: Airborne measurements of aerosol scattering properties above the MABL over Bay of Bengal during W_ICARB – characteristics and spatial gradients, Ann. Geophys., 29, 895–908, https://doi.org/10.5194/angeo-29-895-2011, 2011.
Stephens, M., Turner, N., and Sandberg, J.: Particle Identification by Laser-Induced Incandescence in a Solid-State Laser Cavity. Appl. Opt., 42, 3726–3736, 2003.
Taylor, J. W., Allan, J. D., Liu, D., Flynn, M., Weber, R., Zhang, X., Lefer, B. L., Grossberg, N., Flynn, J., and Coe, H.: Assessment of the sensitivity of core/shell parameters derived using the single-particle soot photometer to density and refractive index, Atmos. Meas. Tech., 8, 1701–1718, https://doi.org/10.5194/amt-8-1701-2015, 2015.
Trembath, J., Bart, M., and Brooke, J.: Efficiencies of modified rosemount housings for sampling aerosol on a fast atmospheric research aircraft, availabe at: https://old.faam.ac.uk/index.php/faam-documents/science-instruments/1673-inlet-efficiency/file, FAAM Technical Note, 27 pp., 2012.
Vaishya, A., Babu, S. N. S., Jayachandran, V., Gogoi, M. M., Lakshmi, N. B., Moorthy, K. K., and Satheesh, S. K.: Large contrast in the vertical distribution of aerosol optical properties and radiative effects across the Indo-Gangetic Plain during the SWAAMI-RAWEX campaign, Atmos. Chem. Phys., 18, 17669–17685, https://doi.org/10.5194/acp-18-17669-2018, 2018.
Vernier, J. P., Fairlie, T. D., Deshler, T., Venkat Ratnam, M., Gadhavi, H., Kumar, B. S., Natarajan, M., Pandit, A. K., Akhil Raj, S. T., Hemanth Kumar, A., and Jayaraman, A.: BATAL: the balloon measurement campaigns of the asian Tropopause aerosol layer, B. Am. Meteorol. Soc., 99, 955–973, 2018.