the Creative Commons Attribution 4.0 License.
the Creative Commons Attribution 4.0 License.
 | 30 Apr 2019
High efficiency of livestock ammonia emission controls in alleviating particulate nitrate during a severe winter haze episode in northern China
Zhenying Xu
Mingxu Liu
Minsi Zhang
Yu Song
Lin Zhang
Tingting Xu
Tiantian Wang
Caiqing Yan
Tian Zhou
Yuepeng Pan
Mei Zheng
Although nitrogen oxide (NOx) emission controls have been implemented for several years, northern China is still facing high particulate nitrate () pollution during severe haze events in winter. In this study, the thermodynamic equilibrium model (ISORROPIA-II) and the Weather Research and Forecast model coupled with chemistry (WRF-Chem) were used to study the efficiency of NH3 emission controls on alleviating particulate during a severe winter haze episode. We found that particulate- formation is almost NH3-limited in extremely high pollution but HNO3-limited on the other days. The improvements in manure management of livestock husbandry could reduce 40 % of total NH3 emissions (currently 100 kt month−1) in northern China in winter. Consequently, particulate was reduced by approximately 40 % (on average from 40.8 to 25.7 µg m−3). Our results indicate that reducing livestock NH3 emissions would be highly effective in reducing particulate during severe winter haze events.
- Article
(1971 KB) - Full-text XML
-
Supplement
(668 KB) - BibTeX
- EndNote


In northern China (including Beijing, Tianjin, Hebei, Shandong, Shanxi and Henan), severe haze pollution events occur frequently during wintertime, with the concentration of PM2.5 (particles with an aerodynamic diameter less than 2.5 µm) reaching hundreds of micrograms per cubic meter and SIA (secondary inorganic aerosol) accounting for more than 50 % of PM2.5 (Zheng et al., 2016; Tan et al., 2018). To mitigate fine-particle pollution, the Chinese government has been taking strong measures to control SO2 emissions (http://www.gov.cn/zwgk/2011-12/20/content_2024895.htm, last access: 5 January 2019). Since 2007, SO2 emissions have been reduced by 75 % in China (Li et al., 2017). Consequently, the particulate-sulfate concentration has also been declining continuously in the past decade (Geng et al., 2017).
Although NOx emissions in 48 Chinese cities decreased by 21 % from 2011 to 2015 (Liu et al., 2017a), unfortunately, no obvious decreasing trend for particulate has been observed in northern China during recent years (Zhang et al., 2015). In October 2015, a severe haze episode was reported in the North China Plain (NCP), with the hourly peak concentration of particulate exceeding 70 µg m−3 (Zhang et al., 2018b). Even in November 2018, during a heavy haze episode in northern China, the hourly peak concentration of PM2.5 still exceeded 289 µg m−3, of which particulate accounted for 30 % (http://www.mee.gov.cn/xxgk2018/xxgk/xxgk15/201811/t20181116_674022.html, last access: 5 January 2019).
Another way to alleviate the particulate- pollution is to control NH3 emissions. Previous studies were performed to demonstrate the necessity of NH3 emissions abatement in reducing PM2.5 concentrations in the United States (Pinder et al., 2007, 2008; Tsimpidi et al., 2007; Wu et al., 2016) and Europe (de Meij et al., 2009; Bessagnet et al., 2014; Backes et al., 2016). Recently, a feature article pointed out that NH3 could be key to limiting particulate pollution (Plautz, 2018). In contrast with low particulate matter pollution levels in the United States and Europe, what we are facing in northern China is the extremely high particulate- pollution, especially during severe winter haze events.
Although Fu et al. (2017) proposed that the NH3 emission controls are urgently required in China, the effectiveness of NH3 emissions mitigation to alleviate the particulate- peaks during severe winter haze episodes was seldom reported. Only Guo et al. (2018) used a thermodynamic model to estimate the sensitivity of particulate to TA (sum of ammonia and ammonium) during one winter haze episode in Beijing. In their study, the atmospheric chemistry simulations based on NH3 emission controls scenario were lacking to demonstrate the regional effects.
It is urgent to alleviate severe particulate- pollution in northern China, and the study on the effectiveness on NH3 emission controls is necessary. In this study, we firstly compile a comprehensive NH3 emission inventory for northern China for the winter of 2015 and estimate the NH3 emission reductions by improving manure management. Then, the thermodynamic equilibrium model (ISORROPIA-II) and Weather Research and Forecast Model coupled with chemistry (WRF-Chem) are used to investigate the effectiveness of NH3 emission reductions in alleviating particulate during a severe haze episode. The molar ratio based on observations is used to explore the efficiency of particulate- reductions during the severe haze conditions in wintertime.
2.1 Observational data
Hourly time-resolution aerosol and gas measurements were conducted at the Peking University urban atmosphere environment monitoring station (PKUERS) (39.991∘ N, 116.313∘ E) in Beijing in December 2015 and December 2016. A commercialized semicontinuous in situ gas and aerosol composition (IGAC) monitor was used to measure the concentrations of water-soluble ions (e.g., , , , Na+, K+, Ca2+, Mg2+, Cl−) in PM2.5 and inorganic gases (e.g., NH3, HNO3, HCl). Relative humidity (RH) and temperature were observed at 1 min resolution at the same site. The quality assurance and control for the IGAC was described in Liu et al. (2017b). A typical severe haze episode occurred from 6 to 10 December 2015, with daily average concentrations of PM2.5 exceeding 150 µg m−3 for 3 days (PM2.5 data are from the China National Environmental Monitoring Centre). The average RH and temperature in this haze event were 60.9 ± 11.4 % and 276.5 ± 1.4 K. The south wind was dominant with wind speed mostly less than 3 m s−1. The average concentrations of particulate , and were 39.8 ± 14.7, 27.7 ± 8.6 and 42.4 ± 16.0 µg m−3, respectively. The ratios of particulate- concentrations to SNA (sulfate, nitrate and ammonium) were 36.5 ± 4.0 %.
2.2 NH3 emission inventory
A comprehensive NH3 emission inventory of northern China (including the six provinces mentioned above) in December 2015 at a monthly and 1 km × 1 km resolution is developed based on our previous studies (Huang et al., 2012; Kang et al., 2016). This is a brief introduction to our inventory. More detailed descriptions and validation are found in our previous studies. Our NH3 emission inventory is a bottom–up process-based and statistical model which considers a diverse range of sources, including both agricultural (livestock manure and chemical fertilizer) and nonagricultural sectors (traffic, biomass burning, etc.). According to our inventory, the estimated NH3 emission amount in northern China was 100 kt in December 2015. The largest source was livestock waste (57 kt, 57.0 % of the total emissions), following by vehicle (12.2 %), chemical industry (8.8 %), biomass burning (5.4 %), waste disposal (4.0 %), synthetic fertilizer applications (2.4 %) and other minor sources (9.1 %). The proportion of chemical fertilizer is small due to the limited fertilization activity in winter. In the past few years, our inventory has been compared with many studies to prove its reliability. For example, the spatial pattern of NH3 emissions calculated in our inventory agreed well with the distribution of the NH3 column concentrations in eastern Asia retrieved from the satellite measurements of the Infrared Atmospheric Sounding Interferometer (IASI) (Van Damme et al., 2014). In particular, our estimation of livestock NH3 emissions in China is comparable to the results of Streets et al. (2003) and Ohara et al. (2007).
Another method for estimating NH3 emissions is the inverse modeling method, which provides top–down emission estimates through optimizing comparisons of model simulations with measurements. For example, Paulot et al. (2014) used the adjoint of a global chemical transport model (GEOS-Chem) and data of wet deposition fluxes to optimize NH3 emissions estimation in China. Zhang et al. (2018a) applied the the Tropospheric Emission Spectrometer (TES) satellite observations of NH3 column concentration and GEOS-Chem to provide top–down constraints on NH3 emissions in China. Their estimates are 10.2 and 11.7 Tg a−1, respectively, which are close to our results (9.8 Tg a−1) (Paulot et al., 2014; Zhang et al., 2018a). The accuracy of this method relies on many factors, such as the accuracy of initial conditions, the emission inventories, meteorological inputs, reaction rate constants and deposition parameters in the chemical transport model. Errors in these parameters could cause biases in the top–down estimation of NH3 emissions. In addition, measurements of NH3 or used in this method, including surface and satellite date, are usually sparse in spatial coverage and have uncertainties, which will also affect the estimation of NH3 emissions.
2.3 ISORROPIA-II and WRF-Chem models
The thermodynamic equilibrium model, ISORROPIA-II (Fountoukis and Nenes, 2007), being used to determine the phase state and composition of an –––K+–Ca2+–Mg2+–Na+–Cl−–H2O aerosol system with its corresponding gas components in thermodynamic equilibrium, was used to investigate the response of particulate to NH3 emission reductions. Using measurements of water-soluble ions, T and RH from PKUERS as inputs and only including the thermodynamic equilibrium, ISORROPIA-II can avoid the inherent uncertainty in estimates of emission inventories, pollutant transport and chemical transformation. In this study, ISORROPIA-II was run in the “forward mode” and assuming particles are “metastable” with no solid precipitates, which is due to the relatively high RH range observed during this haze event (RH = 60.9 ± 11.4 %).
We assess the performance of ISORROPIA-II by comparing measured and predicted particulate , and gaseous HNO3, and NH3. An error metric, the mean bias (MB), is used to quantify the bias (the description of MB is shown below Fig. S1 in the Supplement). The predicted particulate , and NH3 agree well with the measurements and the values of R2 are 0.99, 0.94 and 0.84, respectively (Fig. S1). The MB is only 1.0, 0.3 and −1.8 µg m−3, respectively. However, the model performs poorly on HNO3, with an R2 of only 0.06 and an MB of −1.0 µg m−3. This is because particulate is predominantly in the particle phase (the mass ratio of particulate to the total nitric acid (TN = ) was 99.2 ± 1.9 %), and small errors in predicting particulate are amplified in HNO3 predicting. Since the MB of HNO3 is much smaller than the observed particulate (39.8 ± 14.7 µg m−3) and (27.7 ± 8.6 µg m−3), this bias has little influence on simulating the efficiency of particulate- reductions.
In the real atmosphere, changes in the level of TA (TA = ) can affect the lifetime of TN (Pandis and Seinfeld, 1990). This is because the gaseous HNO3 has a faster deposition rate in the atmosphere than particulate , and reductions in may prompt particulate- partitioning into the gas phase. In such a case, the concentration of TN would not remain constant but decrease. In order to consider these, we use WRF-Chem (version 3.6.1) to investigate the effect of NH3 emission controls on particulate- formation on the regional scale. The simulations were performed for the severe haze event from 6 to 10 December 2015. The modeling domain covered the whole of northern China with horizontal resolution of 25 km and 24 vertical layers from the surface to 50 hPa. The initial meteorological fields and boundary conditions were taken from the 6 h National Centers for Environmental Prediction (NCEP) global final analysis with a spatial resolution. The inorganic gas–aerosol equilibrium was predicted by the Multicomponent Equilibrium Solver for Aerosols (MESA) in WRF-Chem (Zaveri et al., 2005). The Carbon-Bond Mechanism version Z (CBMZ) photochemical mechanism and Model for Simulating Aerosol Interactions and Chemistry (MOSAIC) were used in this study (Fast et al., 2006). Anthropogenic emissions from power plants, industrial sites, residential locations and vehicles were taken from the Multi-resolution Emission Inventory for China (MEIC; available at http://www.meicmodel.org/, last access: 5 January 2019).
The performance of WRF-Chem is evaluated by comparing measured and simulated , , and TA. Specifically, the observed and simulated values are as follows: (1) – 39.8 ± 14.7 µg m−3 versus 39.1 ± 15.6 µg m−3; (2) – 27.7 ± 8.6 µg m−3 versus 26.5 ± 11.7 µg m−3; (3) – 42.4 ± 16.0 µg m−3 versus 39.7 ± 20.8 µg m−3; and (4) TA – 34.6 ± 8.5 µg m−3 versus 32.1 ± 11.0 µg m−3. The MBs of these four species are −0.7, −1.2, −2.7 and −2.5 µg m−3, respectively. Simulated particulate , , and TA approximately agreed with the measurements (Fig. S2). There are still some simulation biases that may affect the simulation of particulate- reduction efficiency. This is discussed in detail in Sect. 3.3.
3.1 High-potential reduction in wintertime NH3 emissions in northern China
Livestock husbandry accounts for the largest proportion of NH3 emissions in northern China in winter (approximately 60 %), which is mainly caused by poor manure management. There are three main animal rearing systems in China: free-range, grazing and intensive. On the one hand, the proportion of intensive livestock husbandry in China is only about 40 %, far lower than that of developed countries (Harun and Ogneva-Himmelberger, 2013). As a result, the widespread free-range and grazing animal rearing systems contribute more than half of the total livestock NH3 emissions due to a lack of manure collection and treatment (Kang et al., 2016). On the other hand, there were no relevant regulations about the storage of manure for intensive farms in China in the past few decades. This causes most livestock farms to also lack necessary measures and facilities for manure collection and storage (Chadwick et al., 2015).
Due to the current poor manure management in China, the improved manure management may have great potential for NH3 emission reductions from livestock husbandry (Wang et al., 2017). The improved manure management mainly includes three phases: in-house handling, storage and land application (Chadwick et al., 2011). For winter, the emission reduction measures mainly focus on in-house handling and storage, since land application mainly occurs in spring and summer. According to previous studies, for in-house handling, regularly washing the floor and using slatted floor or deep litter to replace solid floor could both reduce NH3 emissions by more than 50 % (Groenestein and Van Faassen, 1996; Monteny and Erisman, 1998; Gilhespy et al., 2009; Hou et al., 2015). For storage, covering slurry and manure could reduce NH3 emissions by about 50 %–70 % (Balsari et al., 2006; Petersen et al., 2013; Hou et al., 2015; Wang et al., 2017).
Based on the above research results, the livestock NH3 emission reduction strategies applied in this study include the following steps. Firstly, the proportion of intensive livestock production was raised from 40 % to 80 % in our NH3 emission inventory model. In our model, the animals in free-range and grazing animal rearing systems are assumed to live outdoors for half a day, and the improved manure management is only effective for indoor animals. Therefore, increasing the proportion of intensive livestock production is conducive to better manure management (Hristov et al., 2011). Secondly, the ratios of NH3 emission reductions mentioned above were multiplied by NH3 emission factors in two phases of manure management: a 50 % reduction for in-house handling and 60 % (average value of 50 % and a 70 %) reduction for storage. With these measures, we estimate that the NH3 emission factors for livestock in China could be comparable to those in Europe and the USA (shown in Table S1 in the Supplement). Meanwhile, our NH3 emission model predicted that the livestock NH3 emissions were reduced by 60 % (from 57 to 23 kt), causing an approximately 40 % reduction in total NH3 emissions. Spatially, NH3 emissions decreased significantly in Hebei, Henan and Shandong, where the livestock NH3 emissions accounted for a large proportion of the total (shown in Fig. S3).
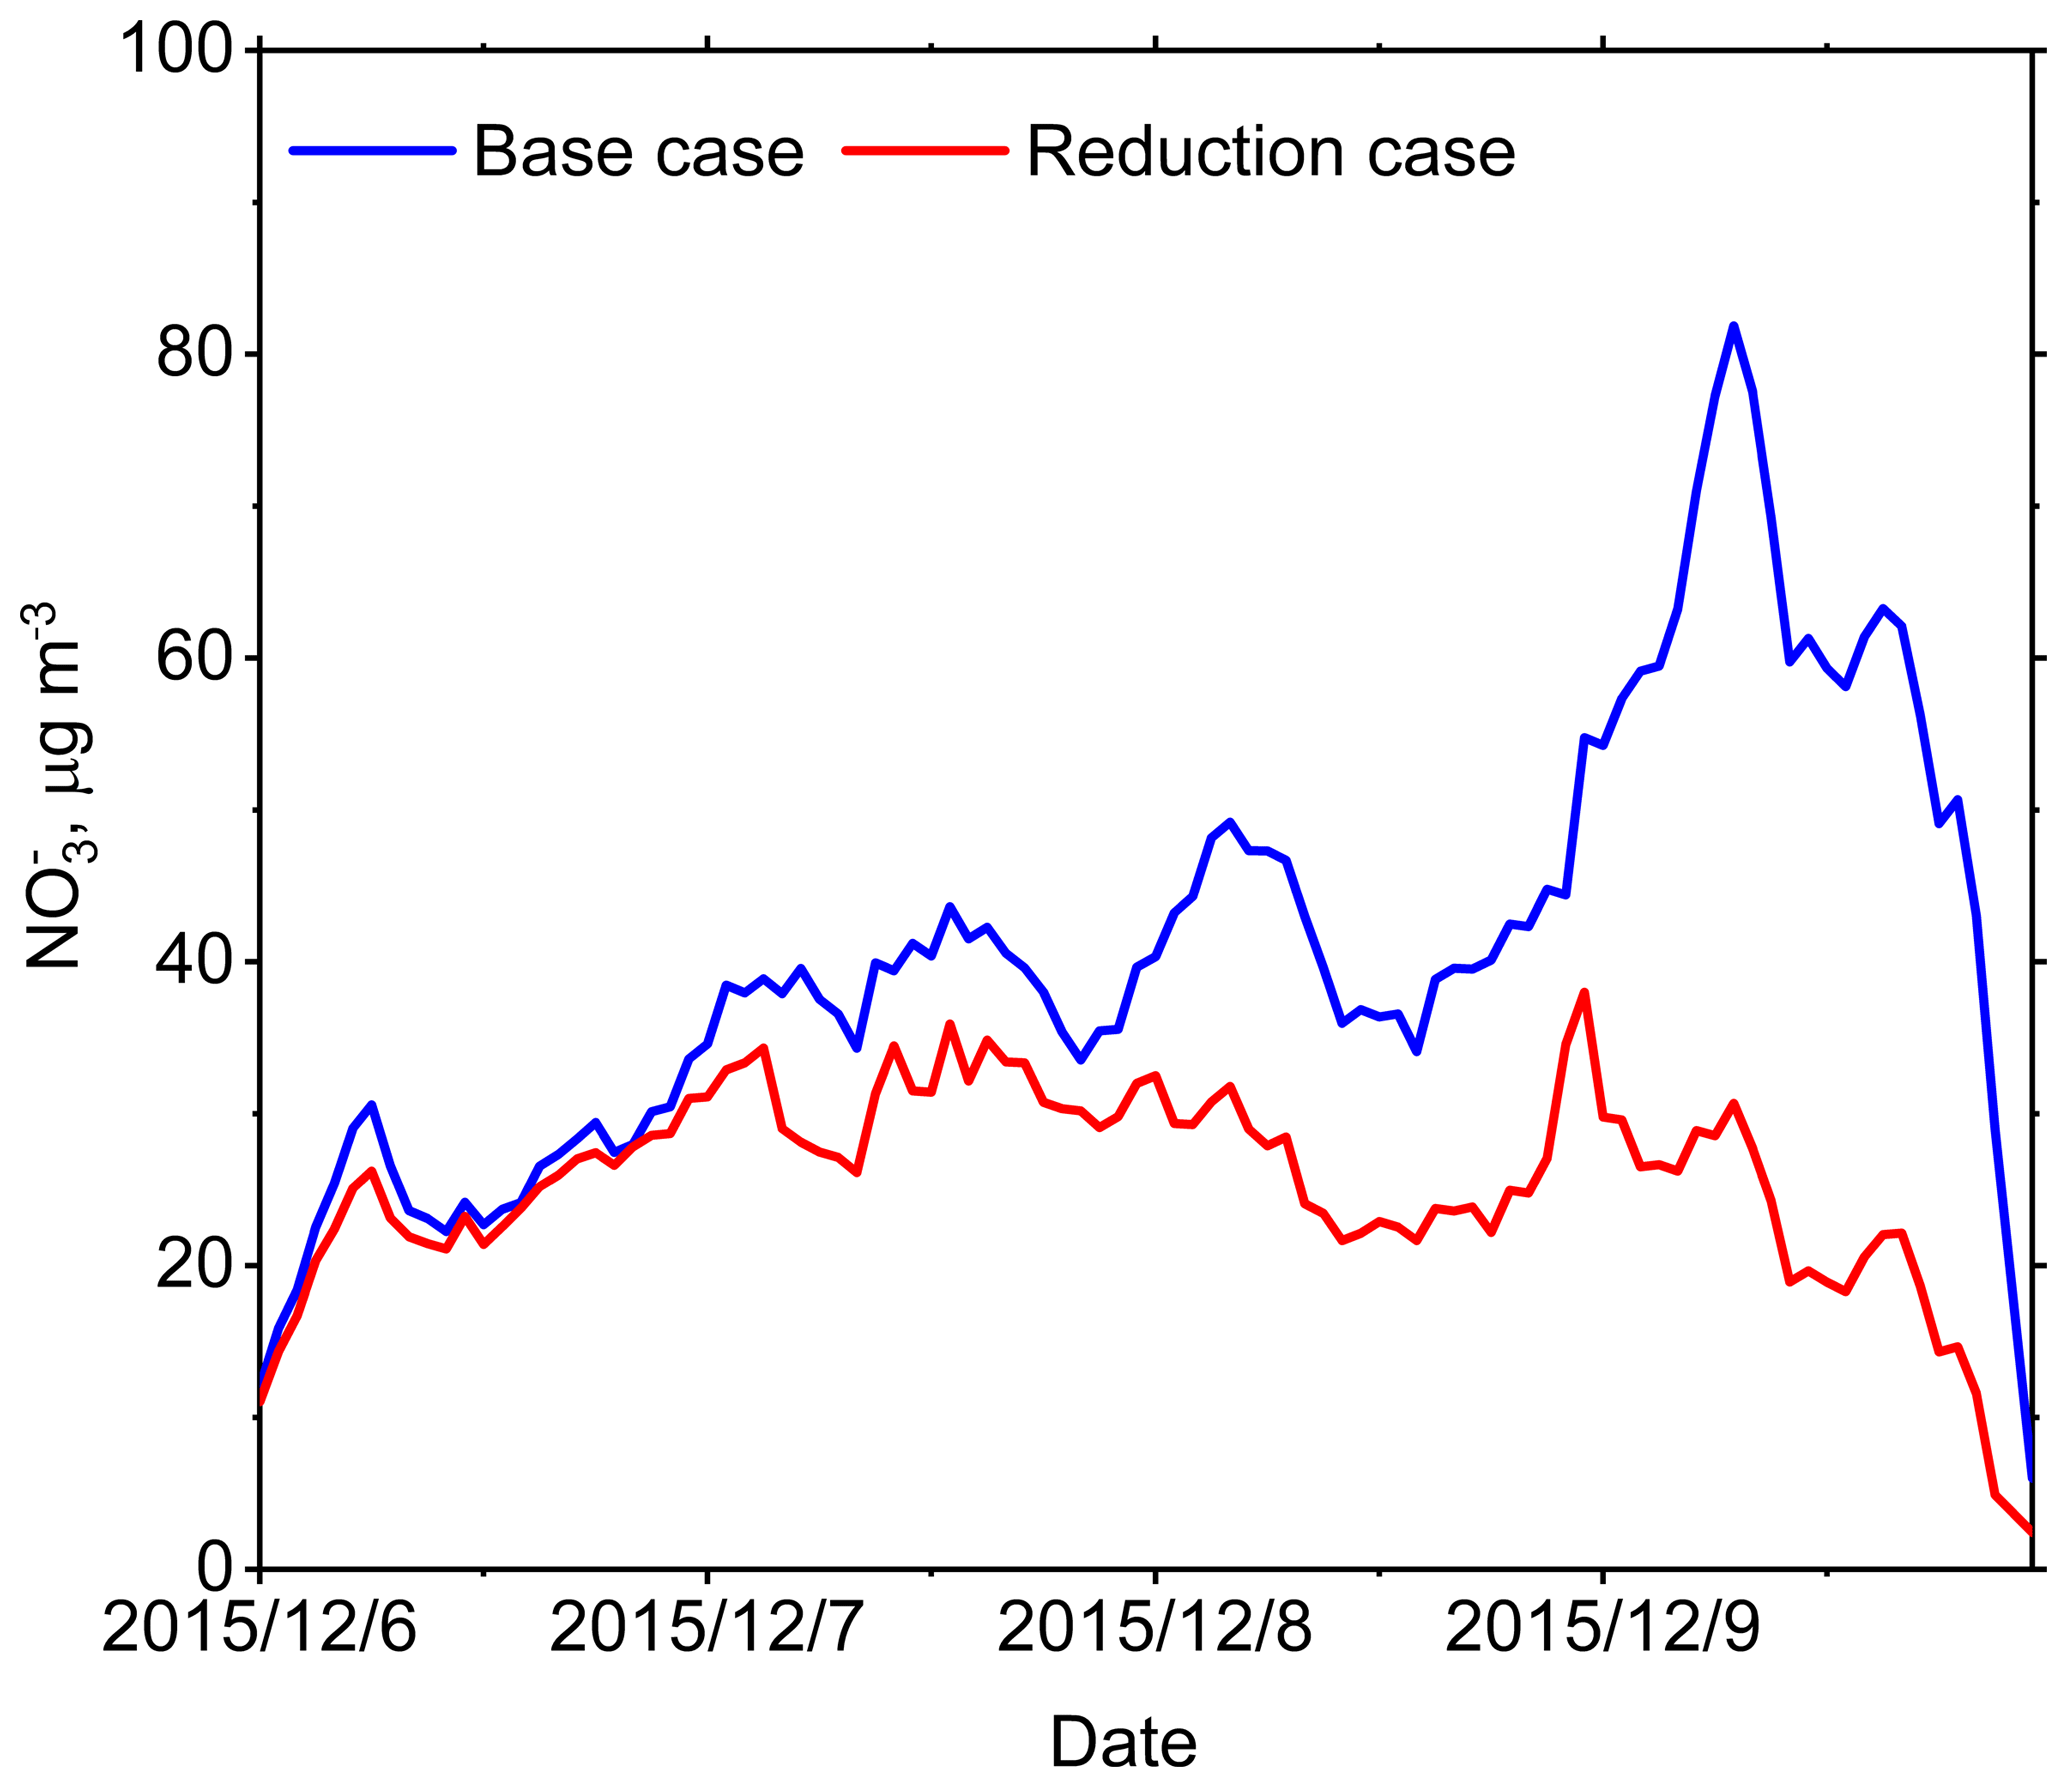
Figure 1A comparison of particulate nitrate () between the base (blue line) and emission reduction cases (red line) simulated by the ISORROPIA-II model in this severe haze episode.
3.2 Simulations of reduction due to NH3 emission controls
In the ISORROPIA-II simulation, a 40 % reduction in TA was used to reflect the effects of reducing NH3 emissions by 40 %. This approach has been used in many previous studies (Blanchard and Hidy, 2003; Vayenas et al., 2005). However, in the real atmosphere, the reductions in NH3 emission are not always equal to the reductions in TA due to the regional transmission. Their differences are discussed in the WRF-Chem simulation.
In this haze event (from 6 to 10 December 2015), the mean concentration of particulate decreased from 40.8 to 25.7 µg m−3 (a 37 % reduction). In addition, the peak hourly concentration of decreased from 81.9 to 30.7 µg m−3 (a 63 % reduction) (shown in Fig. 1). The fundamental thermodynamic processes of TA reductions in decreasing particulate are explained below. Firstly, we found that NH3 was readily available to react with HNO3 in the thermodynamic equilibrium system because NH3 was 6.6±3.8 µg m−3 while HNO3 was only 0.4±1.1 µg m−3. Secondly, almost all particulate condensed into the aerosol phase (the mass ratio of particulate to TN was 99.2 ± 1.9 %) under such low temperature conditions (276.5 ± 1.4 K). Thirdly, the NH3–HNO3 partial pressure production (KP) was as low as about 0.1 ppb2 (calculated from ISORROPIA-II outputs, depending not only on temperature and RH but also on sulfate concentration). The value of KP would remain constant if the temperature, RH and sulfate concentration remained unchanged. In general, NH4NO3 was not easy to volatilize into the gas phase under these circumstances.

Figure 2Spatial distribution of particulate- concentrations in northern China predicted by WRF-Chem from 6 to 10 December 2015, for (a) the base case, (b) the emission reduction case, and (c) the difference between the base case and the emission reduction case. The scope of this study focuses on the black box, including Beijing (BJ), Tianjin (TJ), Hebei (HB), Shanxi (SX), Shandong (SD) and Henan (HN).
When TA was reduced by 40 %, the average mass concentration of gaseous NH3 decreased from 6.6 to 0.01 µg m−3 (from 8.8 to 0.05 ppb). In order to keep the value of KP constant in the thermodynamic equilibrium state, the reductions in NH3 increased HNO3, which shifted the particulate- partitioning toward the gas phase. Hence, when NH3 in gas phase was almost completely depleted, HNO3 increased from 0.4 to 15.5 µg m−3 (from 0.1 to 5.6 ppb), leading to a reduction in particulate from 40.8 to 25.7 µg m−3 (a 37.0 % reduction). Meanwhile, also decreased from 27.9 to 20.6 µg m−3, and there was almost no change in sulfate level (decreased from 39.7 to 39.3 µg m−3), with only a trace amount of NH4HSO4 produced. This indicated that the reduction in particulate and was mainly due to the reduction in NH4NO3. The sum of particulate and decreased from 68.7 to 46.3 µg m−3 (a 32.6 % reduction).
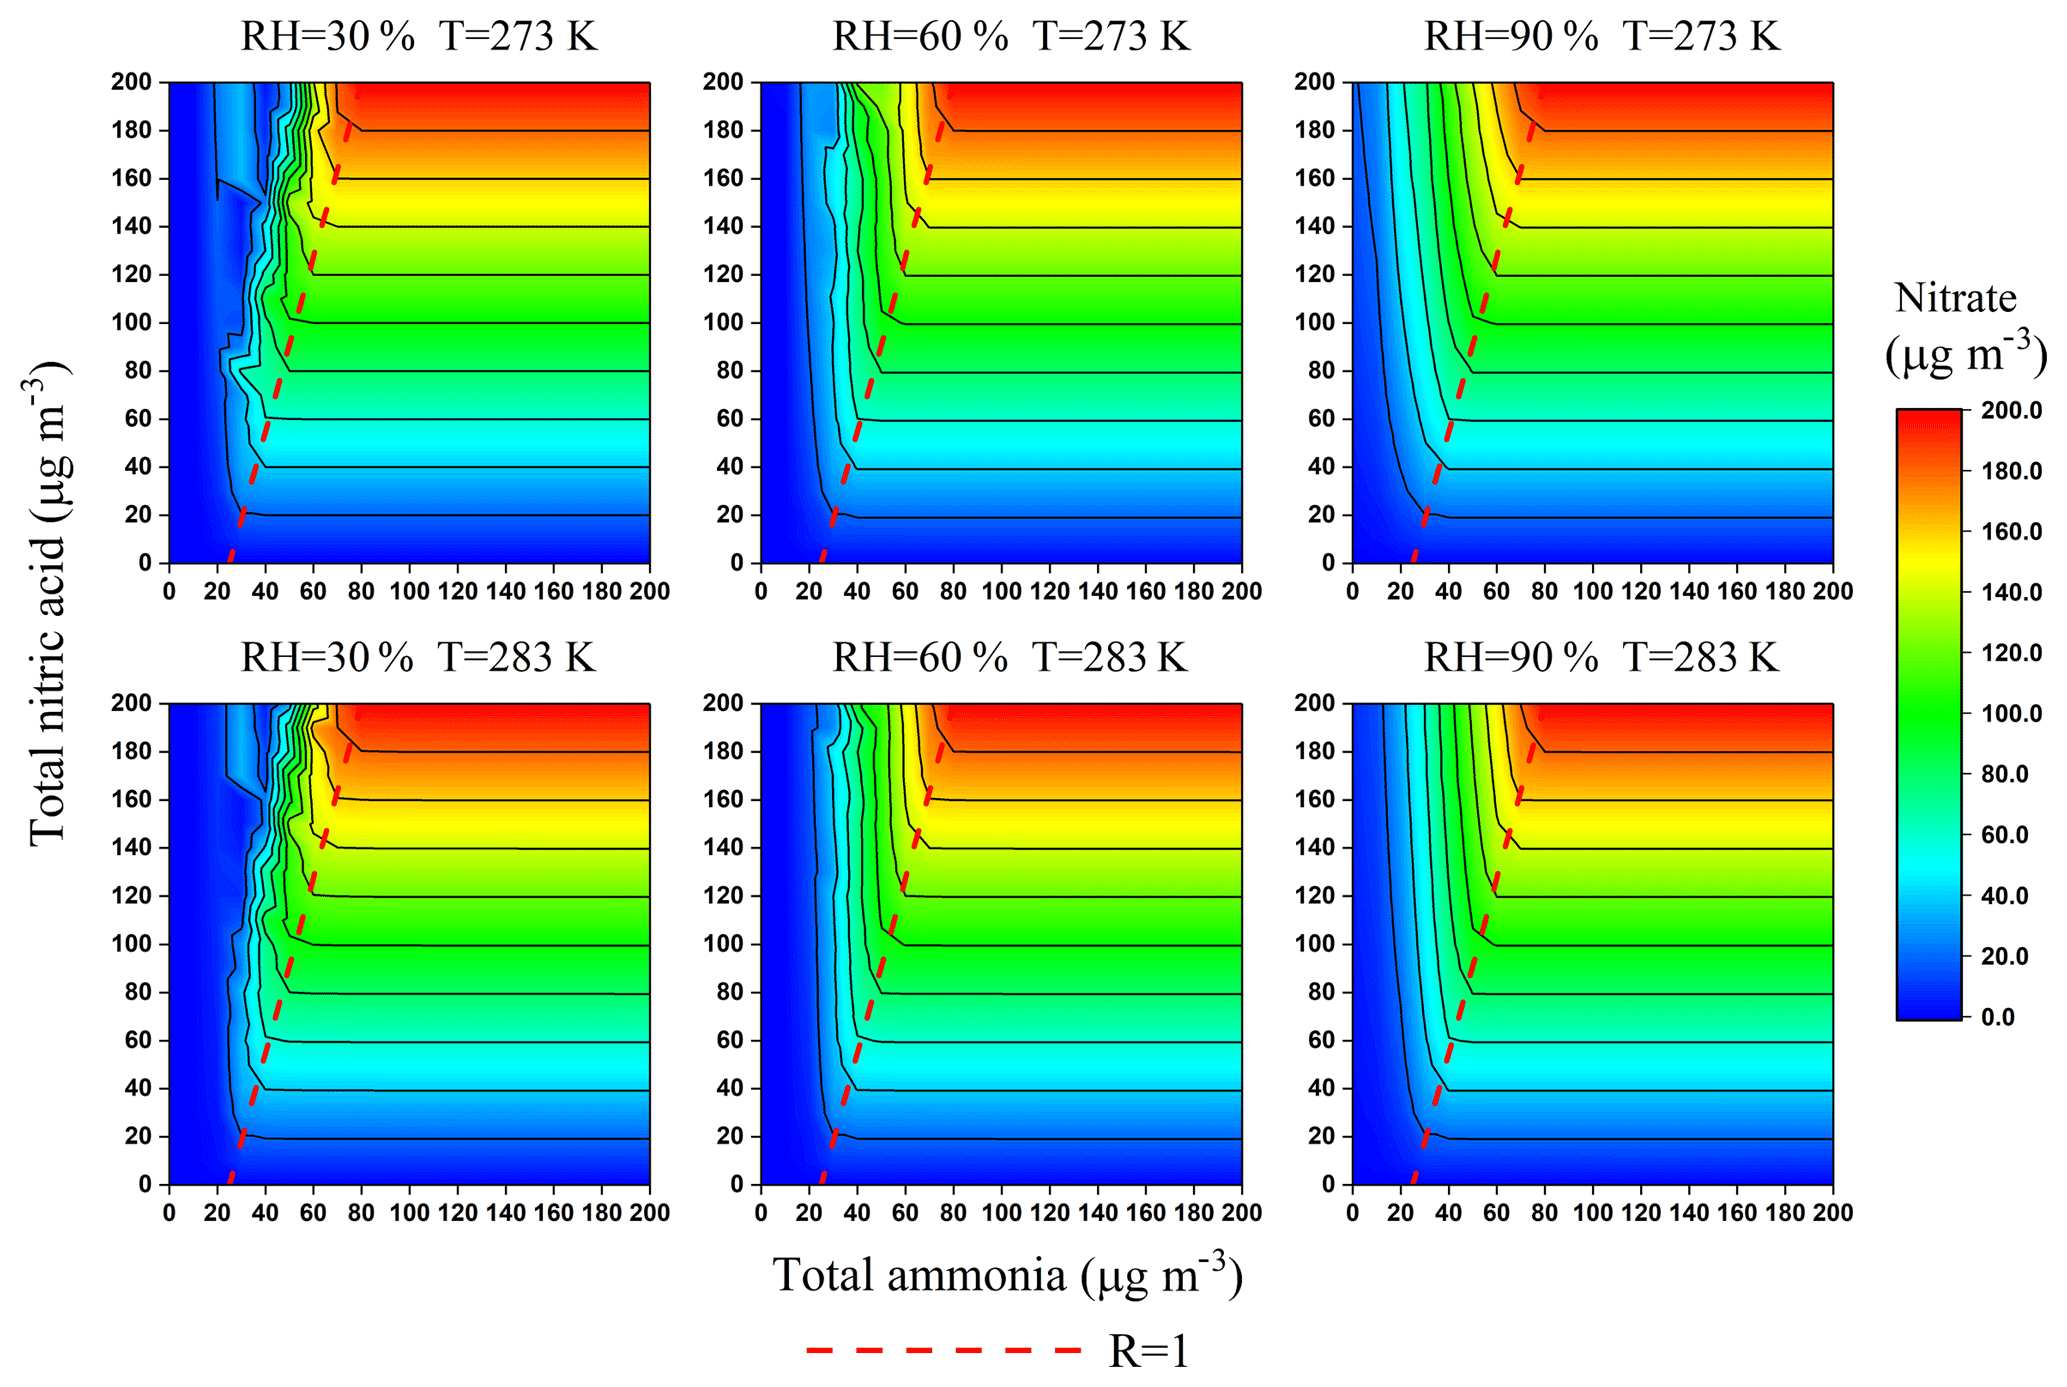
Figure 3Isopleths of the particulate- concentration (µg m−3) as a function of TN and TA under average severe haze conditions in winter. The concentration of , Cl−, K+, Ca2+, Na+ and Mg2+ was 60.2, 9.3, 0.56, 0.04, 0.75 and 0.03 µg m−3, respectively. Values are averages from all severe hazes during the observation period.
We also conducted WRF-Chem simulations to quantify the impacts of NH3 emission controls on particulate regionally. A 60 % reduction in livestock NH3 emissions was used as an emission reductions scheme, and Fig. 2 shows the spatial distribution of particulate under the base case and the emission reduction case. The spatial distribution of particulate was mainly concentrated in most parts of Henan (HN) and Hebei (HB), with average concentration over 30 µg m−3 (included in the black box shown in Fig. 2a). The highest particulate- concentrations, more than 60 µg m−3, were mainly located in central south of Hebei and northern Henan. In the emission reduction case, the mean concentration of particulate decreased from 30.6 to 18.5 µg m−3 (a 39.4 % reduction) in the range of the black box. Meanwhile, the particulate decreased from 16.3 to 11.7 µg m−3 (a 28.1 % reduction). The sum of particulate and decreased from 46.9 to 30.2 µg m−3 (a 35.6 % reduction). Besides, the sulfate concentration slightly changed from 19.7 to 17.6 µg m−3, and PM2.5 concentration dropped from 143.4 to 125.4 µg m−3. The largest reductions in particulate were mainly located in the central north of Henan and central Hebei, where the percentage reduction was generally more than 60 % (shown in Fig. 2b). In some areas with high particulate- concentrations, particulate had been effectively reduced by more than 30 µg m−3 (shown in Fig. 2c). In these regions, severe haze events occurred frequently due to their large emissions of air pollutants, including NH3 (Wang et al., 2014; Zhao et al., 2017). In addition, TN was reduced by 34.1 % (from 31.8 to 21.0 µg m−3), which was in line with the assumption in Sect. 2.3. Correspondingly, TA decreased by 40.7 % (from 17.2 to 10.2 µg m−3), very close to the reductions in NH3 emission (40 %). This indicates that it is reasonable to use TA reductions to represent NH3 emission reductions in the ISORROPIA-II simulation.
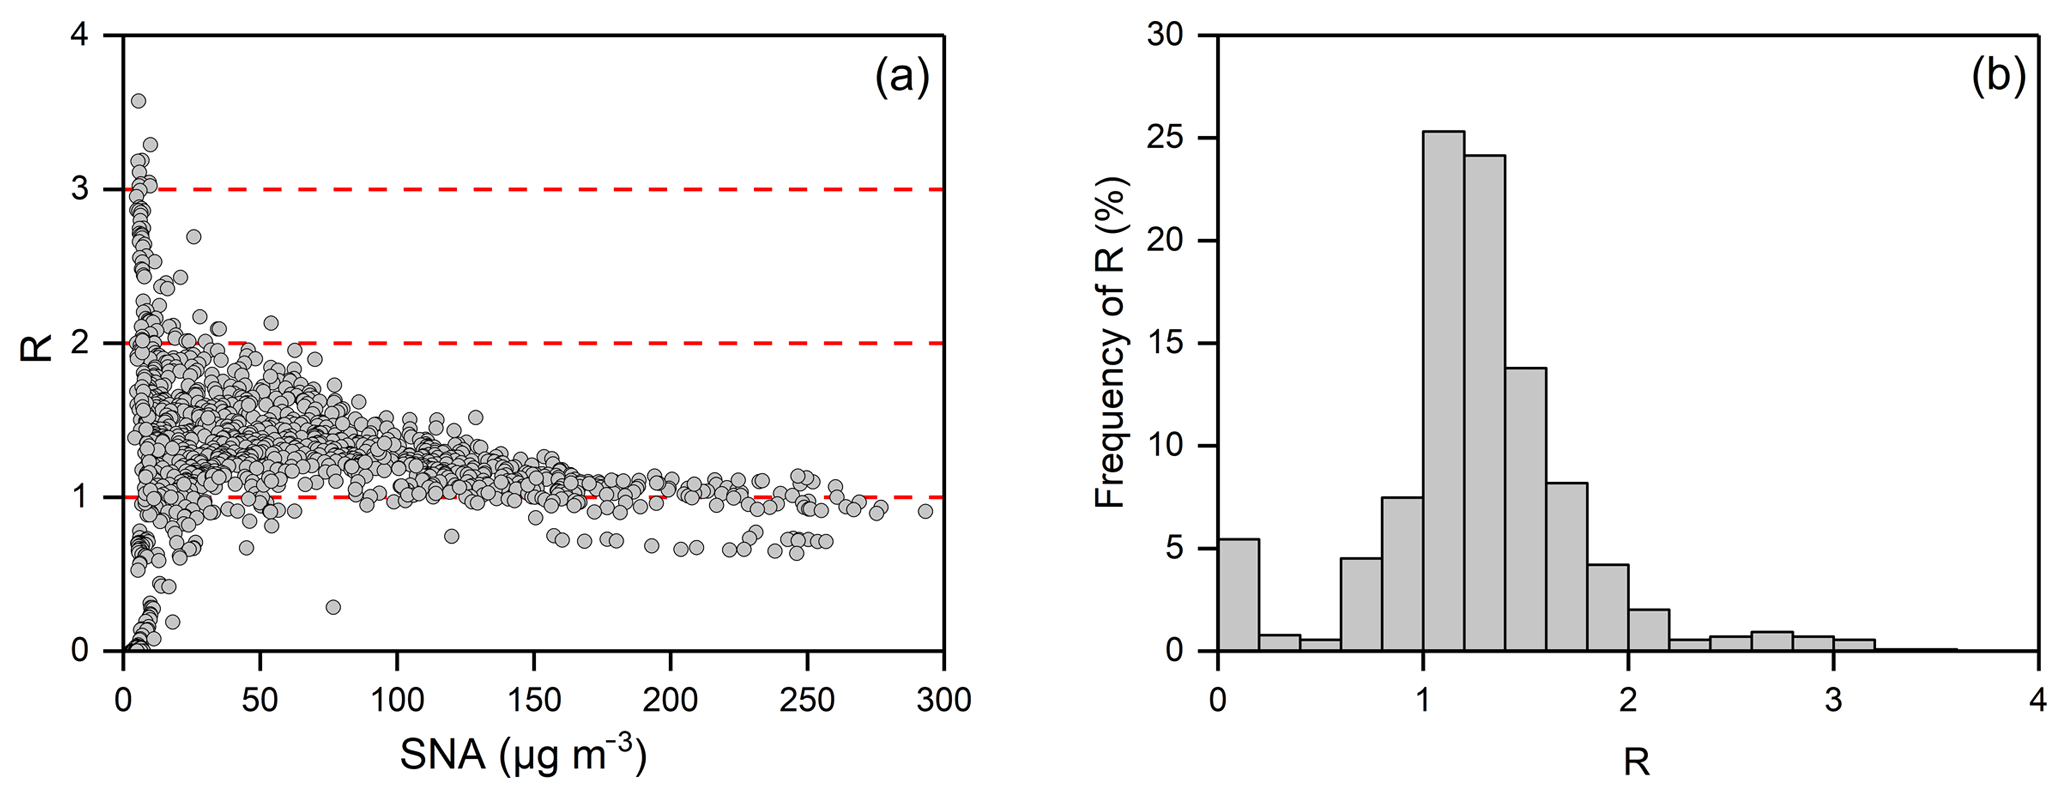
Figure 4(a) The observed molar ratio (R) and the concentrations of SNA in PKUERS in December 2015 and December 2016. (b) The frequency of R during the same period.
3.3 The particulate- reduction efficiency during the wintertime
The sensitivity of particulate to NH3 is often determined by the availability of ambient NH3, which can be represented by the observable indicator (Seinfeld and Pandis, 2006). In this study, we use the observed molar ratio (R) of TA to the sum of sulfate, total chlorine and TN minus Na+, K+, Ca2+ and Mg2+ to represent the availability of ambient NH3 and predict the sensitivity of the particulate to changes in TN and TA.
The accuracy of R was examined by constructing the isopleths of particulate- concentrations as a function of TN and TA (shown in Fig. 3). The concentration was constructed by varying the input concentrations of TA and TN from 0 to 200 µg m−3 in increments of 10 µg m−3 independently in ISORROPIA-II, while using the observed average value for the other components. Over a range of temperatures (273–283 K) and RHs (30 %–90 %), the dashed line of R=1 divides each isopleth into two regions with a tiny bias, which indicates that R can be used to qualitatively predict the response of the particulate to changes in concentrations of TN and TA.
On the right side of the dashed line (R>1), particulate- formation is HNO3-limited. The NH3 is surplus and almost all particulate exists in the aerosol phase. The TA reductions mainly reduce NH3 with negligible effects on particulate . By contrast, particulate- formation is NH3-limited to the left of the dashed line (R<1). There is less NH3 present in the gas phase, and TA reductions could reduce particulate efficiently. For example, when the concentrations of TN and TA are 100 and 50 µg m−3 (RH = 60 % and T=273 K), the concentration of particulate is about 100 µg m−3 and the value of R is close to 1 (typical observational values during the severe haze in this study). In such cases, if TA were reduced by 50 % to 25 µg m−3, the particulate would be significantly reduced from 100 to 20 µg m−3, an 80 % reduction.
Under the typical winter conditions in northern China, the value of R was generally greater than 1 and gradually declining with the increase in SNA concentrations (shown in Fig. 4a). When the concentration of SNA is greater than 150 µg m−3, the values of R become close to and frequently lower than 1. This indicated that particulate- formation would easily become NH3-limited under severe haze conditions when NH3 emissions were reduced. In general, particulate will be reduced effectively by a 40 % reduction in NH3 emissions on the condition that the value of R is less than 1.4 (shown in Fig. S4). This situation accounts for 68.1 % of all of December (shown in Fig. 4b). It should also be noted that particulate is insensitive to a 40 % reduction in NH3 emissions when the value of R is greater than 1.4 (shown in Fig. S4). This situation mainly occurs on relatively clean days (the concentration of SNA is less than 75 µg m−3), accounting for only 31.9 % of all of December (shown in Fig. 4a, b). Overall, reducing 40 % of NH3 emissions could effectively reduce the levels of particulate under typical severe winter haze conditions in northern China.
The observed R provides a simple method to rapidly estimate the efficiency of NH3 emission reductions in particulate- reductions, which can avoid the drawbacks of the air quality model, especially the uncertain estimates of meteorology. However, it also needs to be examined in more detail for specific pollution and meteorological conditions. Therefore, the observed indicator and air quality models should be used in a complementary way to assess the effectiveness of NH3 emission control strategies.
Based on the above analysis, the influence of WRF-Chem simulation biases on particulate- reduction efficiency simulation mainly depends on the simulation bias of R. During the simulation case, the average simulated value of R is 1.3, which is equivalent to the observed value (1.3). Since WRF-Chem has a good estimation of the availability of ambient NH3, its estimation of the efficiency of particulate- reductions is reliable.
It is noteworthy that the efficiency of particulate- reductions by NH3 emission controls in northern China during severe winter hazes may be higher than that in the United States and Europe. Compared with our results (40 % NH3 emission reductions lead to about 40 % particulate- reductions), in the United States and Europe, NH3 emissions often need to be reduced by more than 70 % before particulate begins to decrease (Pozzer et al., 2017; Guo et al., 2018). This is mainly because the strict emission controls of SO2 and NOx in these areas lead to a more ammonia-rich environment, which makes particulate insensitive to NH3 emission reductions.
In this study, we found that during severe winter haze episodes, the particulate- formation is NH3-limited, resulting in its high sensitivity to NH3 emission reductions. Meanwhile, livestock NH3 emission control is a very efficient way to alleviate particulate- pollution during severe winter hazes. The estimations showed that improvements in the manure management of livestock husbandry could effectively reduce total NH3 emissions by 40 % (from 100 to 60 kt) in northern China in winter. This would lead to a reduction in particulate by about 40 % (on average from 40.8 to 25.7 µg m−3) during severe haze conditions.
NOx emission controls could be a more direct and effective way to reduce particulate than NH3 emission reductions. However, in northern China, the target of NOx emission reductions is only about 25 % in the 13th Five-Year Plan (2016–2020) (http://www.gov.cn/zhengce/content/2017-01/05/content_5156789.htm, last access: 5 January 2019). Due to the dominance of free-range animal rearing systems and the lack of emission controls policies, livestock NH3 emission reductions in China could be practicable. In order to control PM2.5 pollution more effectively in northern China, measures to improve manure management in livestock urgently need to be implemented.
The model input data and the NH3 emission inventory used in this study are available from the corresponding author.
The supplement related to this article is available online at: https://doi.org/10.5194/acp-19-5605-2019-supplement.
YS, SW and MZ initiated the investigation. CY, TZ and MZ conducted the aerosol and gas measurements. ZX, TW and ML performed the modeling analyses. ZX, SW, LZ, CY and MZ wrote and edited the manuscript. MZ, TX, TW, YS, YP, MH and TZ contributed to discussions of the results and the manuscript.
The authors declare that they have no conflict of interest.
This study was funded by the National Key R&D Program of China
(2016YFC0201505), the National Natural Science Foundation of China (NSFC)
(91644212 and 41675142), the Beijing Science and Technology Project (Z181100005418016), and the National Research Program for Key Issues in Air
Pollution Control (DQGG0208).
Edited by: Qiang Zhang
Reviewed by: two anonymous referees
Backes, A. M., Aulinger, A., Bieser, J., Matthias, V., and Quante, M.: Ammonia emissions in Europe, Part II: How ammonia emission abatement strategies affect secondary aerosols, Atmos. Environ., 126, 153–161, https://doi.org/10.1016/j.atmosenv.2015.11.039, 2016.
Balsari, P., Dinuccio, E., and Gioelli, F.: A low cost solution for ammonia emission abatement from slurry storage, Int. Congr. Ser., 1293, 323–326, https://doi.org/10.1016/j.ics.2006.02.045, 2006.
Bessagnet, B., Beauchamp, M., Guerreiro, C., de Leeuw, F., Tsyro, S., Colette, A., Meleux, F., Rouil, L., Ruyssenaars, P., Sauter, F., Velders, G. J. M., Foltescu, V. L., and van Aardenne, J.: Can further mitigation of ammonia emissions reduce exceedances of particulate matter air quality standards?, Environ. Sci. Policy, 44, 149–163, https://doi.org/10.1016/j.envsci.2014.07.011, 2014.
Blanchard, C. L. and Hidy, G. M.: Effects of changes in sulfate, ammonia, and nitric acid on particulate nitrate concentrations in the southeastern United States, J. Air Waste Manage., 53, 283–290, https://doi.org/10.1080/10473289.2003.10466152, 2003.
Chadwick, D., Sommer, S. G., Thorman, R., Fangueiro, D., Cardenas, L., Amon, B., and Misselbrook, T.: Manure management: Implications for greenhouse gas emissions, Anim. Feed Sci. Tech., 166, 514–531, https://doi.org/10.1016/j.anifeedsci.2011.04.036, 2011.
Chadwick, D., Jia, W., Tong, Y. A., Yu, G. H., Shen, Q. R., and Chen, Q.: Improving manure nutrient management towards sustainable agricultural intensification in China, Agr. Ecosyst. Environ., 209, 34–46, https://doi.org/10.1016/j.agee.2015.03.025, 2015.
de Meij, A., Thunis, P., Bessagnet, B., and Cuvelier, C.: The sensitivity of the CHIMERE model to emissions reduction scenarios on air quality in Northern Italy, Atmos. Environ., 43, 1897–1907, https://doi.org/10.1016/j.atmosenv.2008.12.036, 2009.
Fast, J. D., Gustafson, W. I., Easter, R. C., Zaveri, R. A., Barnard, J. C., Chapman, E. G., Grell, G. A., and Peckham, S. E.: Evolution of ozone, particulates, and aerosol direct radiative forcing in the vicinity of Houston using a fully coupled meteorology-chemistry-aerosol model, J. Geophys. Res.-Atmos., 111, D21305, https://doi.org/10.1029/2005jd006721, 2006.
Fountoukis, C. and Nenes, A.: ISORROPIA II: a computationally efficient thermodynamic equilibrium model for K+-Ca2+-Mg2+--Na+---Cl−-H2O aerosols, Atmos. Chem. Phys., 7, 4639–4659, https://doi.org/10.5194/acp-7-4639-2007, 2007.
Fu, X., Wang, S. X., Xing, J., Zhang, X. Y., Wang, T., and Hao, J. M.: Increasing Ammonia Concentrations Reduce the Effectiveness of Particle Pollution Control Achieved via SO2 and NOx Emissions Reduction in East China, Environ. Sci. Technol. Lett., 4, 221–227, 2017.
Geng, G., Zhang, Q., Tong, D., Li, M., Zheng, Y., Wang, S., and He, K.: Chemical composition of ambient PM2.5 over China and relationship to precursor emissions during 2005–2012, Atmos. Chem. Phys., 17, 9187–9203, https://doi.org/10.5194/acp-17-9187-2017, 2017.
Gilhespy, S. L., Webb, J., Chadwick, D. R., Misselbrook, T. H., Kay, R., Camp, V., Retter, A. L., and Bason, A.: Will additional straw bedding in buildings housing cattle and pigs reduce ammonia emissions?, Biosyst. Eng., 102, 180–189, https://doi.org/10.1016/j.biosystemseng.2008.10.005, 2009.
Groenestein, C. M. and Van Faassen, H. G.: Volatilization of ammonia, nitrous oxide and nitric oxide in deep-litter systems for fattening pigs, J. Agr. Eng. Res., 65, 269–274, https://doi.org/10.1006/jaer.1996.0100, 1996.
Guo, H., Otjes, R., Schlag, P., Kiendler-Scharr, A., Nenes, A., and Weber, R. J.: Effectiveness of ammonia reduction on control of fine particle nitrate, Atmos. Chem. Phys., 18, 12241–12256, https://doi.org/10.5194/acp-18-12241-2018, 2018.
Harun, S. M. R. and Ogneva-Himmelberger, Y.: Distribution of Industrial Farms in the United States and Socioeconomic, Health, and Environmental Characteristics of Counties, Geography, 2013, 385893, https://doi.org/10.1155/2013/385893, 2013.
Hou, Y., Velthof, G. L., and Oenema, O.: Mitigation of ammonia, nitrous oxide and methane emissions from manure management chains: a meta-analysis and integrated assessment, Global Change Biol., 21, 1293–1312, 2015.
Hristov, A. N., Hanigan, M., Cole, A., Todd, R., McAllister, T. A., Ndegwa, P. M., and Rotz, A.: Review: Ammonia emissions from dairy farms and beef feedlots, Can. J. Anim. Sci., 91, 1–35, 2011.
Huang, X., Song, Y., Li, M. M., Li, J. F., Huo, Q., Cai, X. H., Zhu, T., Hu, M., and Zhang, H. S.: A high-resolution ammonia emission inventory in China, Global Biogeochem. Cy., 26, GB1030, https://doi.org/10.1029/2011gb004161, 2012.
Kang, Y., Liu, M., Song, Y., Huang, X., Yao, H., Cai, X., Zhang, H., Kang, L., Liu, X., Yan, X., He, H., Zhang, Q., Shao, M., and Zhu, T.: High-resolution ammonia emissions inventories in China from 1980 to 2012, Atmos. Chem. Phys., 16, 2043–2058, https://doi.org/10.5194/acp-16-2043-2016, 2016.
Li, C., McLinden, C., Fioletov, V., Krotkov, N., Carn, S., Joiner, J., Streets, D., He, H., Ren, X., Li, Z., and Dickerson, R. R.: India Is Overtaking China as the World's Largest Emitter of Anthropogenic Sulfur Dioxide, Sci. Rep., 7, 14304, https://doi.org/10.1038/s41598-017-14639-8, 2017.
Liu, F., Beirle, S., Zhang, Q., van der A, R. J., Zheng, B., Tong, D., and He, K.: NOx emission trends over Chinese cities estimated from OMI observations during 2005 to 2015, Atmos. Chem. Phys., 17, 9261–9275, https://doi.org/10.5194/acp-17-9261-2017, 2017a.
Liu, M. X., Song, Y., Zhou, T., Xu, Z. Y., Yan, C. Q., Zheng, M., Wu, Z. J., Hu, M., Wu, Y. S., and Zhu, T.: Fine particle pH during severe haze episodes in northern China, Geophys. Res. Lett., 44, 5213–5221, https://doi.org/10.1002/2017gl073210, 2017b.
Monteny, G. J. and Erisman, J. W.: Ammonia emission from dairy cow buildings: A review of measurement techniques, influencing factors and possibilities for reduction, Neth. J. Agr. Sci., 46, 225–247, 1998.
Ohara, T., Akimoto, H., Kurokawa, J., Horii, N., Yamaji, K., Yan, X., and Hayasaka, T.: An Asian emission inventory of anthropogenic emission sources for the period 1980–2020, Atmos. Chem. Phys., 7, 4419–4444, https://doi.org/10.5194/acp-7-4419-2007, 2007.
Pandis, S. N. and Seinfeld, J. H.: On the Interaction between Equilibration Processes and Wet or Dry Deposition, Atmos. Environ., 24, 2313–2327, https://doi.org/10.1016/0960-1686(90)90325-H, 1990.
Paulot, F., Jacob, D. J., Pinder, R. W., Bash, J. O., Travis, K., and Henze, D. K.: Ammonia emissions in the United States, European Union, and China derived by high-resolution inversion of ammonium wet deposition data Interpretation with a new agricultural emissions inventory (MASAGE_NH3), J. Geophys. Res.-Atmos., 119, 4343–4364, https://doi.org/10.1002/2013jd021130, 2014.
Petersen, S. O., Dorno, N., Lindholst, S., Feilberg, A., and Eriksen, J.: Emissions of CH4, N2O, NH3 and odorants from pig slurry during winter and summer storage, Nutr. Cycl. Agroecosys., 95, 103–113, https://doi.org/10.1007/s10705-013-9551-3, 2013.
Pinder, R. W., Adams, P. J., and Pandis, S. N.: Ammonia emission controls as a cost-effective strategy for reducing atmospheric particulate matter in the eastern United States, Environ. Sci. Technol., 41, 380–386, https://doi.org/10.1021/es060379a, 2007.
Pinder, R. W., Gilliland, A. B., and Dennis, R. L.: Environmental impact of atmospheric NH3 emissions under present and future conditions in the eastern United States, Geophys. Res. Lett., 35, L12808, https://doi.org/10.1029/2008gl033732, 2008.
Plautz, J.: Piercing the Haze, Science, 361, 1060–1063, https://doi.org/10.1126/science.361.6407.1060, 2018.
Pozzer, A., Tsimpidi, A. P., Karydis, V. A., de Meij, A., and Lelieveld, J.: Impact of agricultural emission reductions on fine-particulate matter and public health, Atmos. Chem. Phys., 17, 12813–12826, https://doi.org/10.5194/acp-17-12813-2017, 2017.
Seinfeld, J. H. and Pandis, S. N.: Atmospheric Chemistry and Physics: From Air Pollution to Climate Change, 2nd Edition, John Wiley & Sons, New York, 1202 pp., 2006.
Streets, D. G., Bond, T. C., Carmichael, G. R., Fernandes, S. D., Fu, Q., He, D., Klimont, Z., Nelson, S. M., Tsai, N. Y., Wang, M. Q., Woo, J. H., and Yarber, K. F.: An inventory of gaseous and primary aerosol emissions in Asia in the year 2000, J. Geophys. Res.-Atmos., 108, 8809, https://doi.org/10.1029/2002jd003093, 2003.
Tan, T. Y., Hu, M., Li, M. R., Guo, Q. F., Wu, Y. S., Fang, X., Gu, F. T., Wang, Y., and Wu, Z. J.: New insight into PM2.5 pollution patterns in Beijing based on one-year measurement of chemical compositions, Sci. Total Environ., 621, 734–743, https://doi.org/10.1016/j.scitotenv.2017.11.208, 2018.
Tsimpidi, A. P., Karydis, V. A., and Pandis, S. N.: Response of inorganic fine particulate matter to emission changes of sulfur dioxide and ammonia: The eastern United States as a case study, J. Air Waste. Manage., 57, 1489–1498, https://doi.org/10.3155/1047-3289.57.12.1489, 2007.
Van Damme, M., Clarisse, L., Heald, C. L., Hurtmans, D., Ngadi, Y., Clerbaux, C., Dolman, A. J., Erisman, J. W., and Coheur, P. F.: Global distributions, time series and error characterization of atmospheric ammonia (NH3) from IASI satellite observations, Atmos. Chem. Phys., 14, 2905–2922, https://doi.org/10.5194/acp-14-2905-2014, 2014.
Vayenas, D. V., Takahama, S., Davidson, C. I., and Pandis, S. N.: Simulation of the thermodynamics and removal processes in the sulfate-ammonia-nitric acid system during winter: Implications for PM2.5 control strategies, J. Geophys. Res.-Atmos., 110, D07S14, https://doi.org/10.1029/2004jd005038, 2005.
Wang, L. T., Wei, Z., Yang, J., Zhang, Y., Zhang, F. F., Su, J., Meng, C. C., and Zhang, Q.: The 2013 severe haze over southern Hebei, China: model evaluation, source apportionment, and policy implications, Atmos. Chem. Phys., 14, 3151–3173, https://doi.org/10.5194/acp-14-3151-2014, 2014.
Wang, Y., Dong, H. M., Zhu, Z. P., Gerber, P. J., Xin, H. W., Smith, P., Opio, C., Steinfeld, H., and Chadwick, D.: Mitigating Greenhouse Gas and Ammonia Emissions from Swine Manure Management: A System Analysis, Environ. Sci. Technol., 51, 4503-4511, 2017.
Wu, Y. Y., Gu, B. J., Erisman, J. W., Reis, S., Fang, Y. Y., Lu, X. H., and Zhang, X. M.: PM2.5 pollution is substantially affected by ammonia emissions in China, Environ. Pollut., 218, 86–094, https://doi.org/10.1016/j.envpol.2016.08.027, 2016.
Zaveri, R. A., Easter, R. C., and Peters, L. K.: A computationally efficient multicomponent equilibrium solver for aerosols (MESA), J. Geophys. Res.-Atmos., 110, D24203, https://doi.org/10.1029/2004jd005618, 2005.
Zhang, X. Y., Wang, J. Z., Wang, Y. Q., Liu, H. L., Sun, J. Y., and Zhang, Y. M.: Changes in chemical components of aerosol particles in different haze regions in China from 2006 to 2013 and contribution of meteorological factors, Atmos. Chem. Phys., 15, 12935–12952, https://doi.org/10.5194/acp-15-12935-2015, 2015.
Zhang, L., Chen, Y., Zhao, Y., Henze, D. K., Zhu, L., Song, Y., Paulot, F., Liu, X., Pan, Y., Lin, Y., and Huang, B.: Agricultural ammonia emissions in China: reconciling bottom-up and top-down estimates, Atmos. Chem. Phys., 18, 339–355, https://doi.org/10.5194/acp-18-339-2018, 2018a.
Zhang, R., Sun, X. S., Shi, A. J., Huang, Y. H., Yan, J., Nie, T., Yan, X., and Li, X.: Secondary inorganic aerosols formation during haze episodes at an urban site in Beijing, China, Atmos. Environ., 177, 275–282, https://doi.org/10.1016/j.atmosenv.2017.12.031, 2018b.
Zhao, B., Wu, W., Wang, S., Xing, J., Chang, X., Liou, K.-N., Jiang, J. H., Gu, Y., Jang, C., Fu, J. S., Zhu, Y., Wang, J., Lin, Y., and Hao, J.: A modeling study of the nonlinear response of fine particles to air pollutant emissions in the Beijing-Tianjin-Hebei region, Atmos. Chem. Phys., 17, 12031–12050, https://doi.org/10.5194/acp-17-12031-2017, 2017.
Zheng, G. J., Duan, F. K., Ma, Y. L., Zhang, Q., Huang, T., Kimoto, T., Cheng, Y. F., Su, H., and He, K. B.: Episode-Based Evolution Pattern Analysis of Haze Pollution: Method Development and Results from Beijing, China, Environ. Sci. Technol., 50, 4632–4641, https://doi.org/10.1021/acs.est.5b05593, 2016.