the Creative Commons Attribution 4.0 License.
the Creative Commons Attribution 4.0 License.
 | 29 Apr 2019
Precursors and formation of secondary organic aerosols from wildfires in the Euro-Mediterranean region
Karine Sartelet
Grazia Maria Lanzafame
Florian Couvidat
Youngseob Kim
Mounir Chrit
Solene Turquety
This work aims at quantifying the relative contribution of secondary organic aerosol (SOA) precursors emitted by wildfires to organic aerosol (OA) formation during summer of 2007 over the Euro-Mediterranean region, where intense wildfires occurred. A new SOA formation mechanism, H2Oaro, including recently identified aromatic volatile organic compounds (VOCs) emitted from wildfires, is developed based on smog chamber experiment measurements under low- and high-NOx regimes. The aromatic VOCs included in the mechanism are toluene, xylene, benzene, phenol, cresol, catechol, furan, naphthalene, methylnaphthalene, syringol, guaiacol, and structurally assigned and unassigned compounds with at least six carbon atoms per molecule (USC>6). This mechanism H2Oaro is an extension of the H2O (hydrophilic–hydrophobic organic) aerosol mechanism: the oxidation of the precursor forms surrogate species with specific thermodynamic properties (volatility, oxidation degree and affinity to water). The SOA concentrations over the Euro-Mediterranean region in summer of 2007 are simulated using the chemistry transport model (CTM) Polair3D of the air-quality platform Polyphemus, where the mechanism H2Oaro was implemented. To estimate the relative contribution of the aromatic VOCs, intermediate volatility, semi-volatile and low-volatility organic compounds (I/S/L-VOCs), to wildfires OA concentrations, different estimations of the gaseous I/S/L-VOC emissions (from primary organic aerosol – POA – using a factor of 1.5 or from non-methanic organic gas – NMOG – using a factor of 0.36) and their ageing (one-step oxidation vs. multi-generational oxidation) are also tested in the CTM.
Most of the particle OA concentrations are formed from I/S/L-VOCs. On average during the summer of 2007 and over the Euro-Mediterranean domain, they are about 10 times higher than the OA concentrations formed from VOCs. However, locally, the OA concentrations formed from VOCs can represent up to 30 % of the OA concentrations from biomass burning. Amongst the VOCs, the main contributors to SOA formation are phenol, benzene and catechol (CAT; 47 %); USC>6 compounds (23 %); and toluene and xylene (12 %). Sensitivity studies of the influence of the VOCs and the I/S/L-VOC emissions and chemical ageing mechanisms on PM2.5 concentrations show that surface PM2.5 concentrations are more sensitive to the parameterization used for gaseous I/S/L-VOC emissions than for ageing.
Estimating the gaseous I/S/L-VOC emissions from POA or from NMOG has a high impact on local surface PM2.5 concentrations (reaching −30 % in the Balkans, −8 % to −16 % in the fire plume and +8 % to +16 % in Greece). Considering the VOC as SOA precursors results in a moderate increase in PM2.5 concentrations mainly in the Balkans (up to 24 %) and in the fire plume (+10 %).
- Article
(3995 KB) - Full-text XML
- BibTeX
- EndNote


Atmospheric particulate matter (PM) has a strong impact on human health (Pope et al., 2002; Naeher et al., 2006; Johnston et al., 2012), climate (Pilinis et al., 1995; Bond et al., 2013) and visibility (Eldering and Cass, 1996; Hand et al., 2007). Chemistry transport models (CTMs) play an important role in simulating the formation of these particles and their concentrations. PM is composed of different compounds, namely organic and inorganic compounds, dust, and black carbon (Jimenez et al., 2009).
Organic aerosols (OA) are classified either as primary organic aerosols (POA) or as secondary organic aerosols (SOA). POA are directly emitted into the atmosphere, whereas SOA are formed by gas–particle conversion of oxidation products of precursors. OA can be classified based on their saturation concentrations (C*): volatile organic compounds (VOCs; with µg m−3), intermediate volatility organic compounds (I-VOCs; with 10 µg m−3), semi-volatile organic compounds (S-VOCs; with µg m−3) and low-volatility organic compounds (L-VOCs; with µg m−3; Lipsky and Robinson, 2006; Grieshop et al., 2009). Both SOA and POA may be composed of components of different volatilities such as S-VOCs and L-VOCs, which may partition between the gas and particle phases (Robinson et al., 2007). Depending on the ambient concentrations, some components only exist in the gas phase (e.g., I-VOCs). In the following, OAtot denotes the sum of gaseous and particle-phase organic aerosol concentrations with volatility lower than VOCs.
POAtot originates mostly from anthropogenic (e.g., traffic and industry) sources and from biomass burning, which is considered to be one of the major sources of PM (Bian et al., 2017), with contributions from both anthropogenic (e.g., residential heating) as well as natural sources such as wildfires.
Wildfires are one of the largest sources of primary carbonaceous aerosols globally. They are also an important source of trace gases including organic vapors, which themselves can serve as precursors of SOA (Akagi et al., 2011; Stockwell et al., 2015). SOA from wildfires may contribute significantly to organic aerosol loading in the atmosphere (Konovalov et al., 2015). However, the concentration of SOA is highly uncertain because of the complexities of physical and chemical evolution of wildfire plumes (Bian et al., 2017). Although several modeling studies have examined SOA formation from VOCs released from biomass burning (Marson et al., 2006; Alvarado and Prinn, 2009; Alvarado et al., 2015), the compounds that act as precursors of SOA are still not well understood. Considering only traditional SOA precursors (mainly toluene, xylene, benzene and naphthalene; Appel et al., 2017) in SOA models leads to a substantial underestimation of SOA concentrations (Dawson et al., 2016; Bian et al., 2017). This can probably partly be explained by the limited knowledge about SOA precursors. Recently, aromatic VOCs (namely toluene, xylene, benzene, phenol, cresol, catechol, furan, guaiacol, syringol, naphthalene and methylnaphthalene) were identified as the major SOA precursors emitted by biomass burning (Akagi et al., 2011; Stockwell et al., 2015; Bruns et al., 2016). To develop mechanisms of SOA formation from these aromatic compounds, many laboratory studies have investigated the gas-phase oxidation of VOCs (mainly initiated by reactions with a hydroxyl radical – OH; Calvert et al., 2002; Atinkson and Arey, 2003; Chhabra et al., 2011; Nakao et al., 2011; Yee et al., 2013), and SOA yields have been measured under various conditions (Odum et al., 1996; Ng et al., 2007): a low-NOx regime where the concentrations of NOx are low and the production of ozone and oxidants is mainly governed by the NOx levels and a high-NOx regime where the production of ozone and oxidants is controlled by the VOC levels (Sillman et al., 1990; Kleinman, 1994). Odum et al. (1996) model SOA formation by a gas–particle partitioning absorption scheme (Pankow, 1994) using data from smog chamber experiments. In CTMs, the SOA formation may be represented using different approaches mostly based on data from smog chamber experiments: the two-lumped-product approach, which uses an empirical representation of SOA formation (Odum et al., 1996; Schell et al., 2001), the molecular or surrogate approach (Pun et al., 2006; Bessagnet et al., 2008; Carlton et al., 2010; Couvidat et al., 2012; Chrit et al., 2017), which represents the formation of SOA using surrogate molecules with associated physico-chemical properties, and the volatility basis set (VBS) approach (Donahue et al., 2006) in which surrogates are associated to classes of different volatilities. The ageing (oxidation by OH) of each surrogate may lead to the formation of surrogates of lower volatility classes through the competition of two processes: fragmentation and functionalization. Fragmentation corresponds to the cleavage of C–C bonds, and it leads to oxidation products of a lower carbon number and higher volatility than the precursor. Functionalization corresponds to the addition of oxygen-containing functional groups, and it leads to oxidation products of a higher oxygen number.
SOA formation mechanisms may rely not only on smog chamber experiments but also on explicit chemical mechanisms when experimental data are not available. Examples of such mechanisms are the master chemical mechanisms (MCMs; Saunders et al., 1997) or the generator for explicit chemistry and kinetics of organics in the atmosphere (GECKO-A; Aumont et al., 2005).
Recent studies take into account not only the oxidation of selected VOCs but also gaseous intermediate volatility, semi-volatile and low-volatility organic compounds (I/S/L-VOCs) emitted by biomass burning to model SOA formation (Koo et al., 2014; Konovalov et al., 2015; Ciarelli et al., 2017). Majdi et al. (2019) show that near fire regions and during the summer of 2007, 52 % to 87 % of the PM2.5 concentrations are organic aerosol that is mainly composed of primary and secondary I/S/L-VOCs (62 % to 84 %). They highlight that neglecting primary gaseous I/S/L-VOC emissions from wildfires tends to lessen the surface PM2.5 concentrations (−30 %). Since ignoring primary gaseous I/S/L-VOC emissions biases model predictions of SOA production, several studies based on smog chamber data aim at estimating them (Yokelson et al., 2013; Jathar et al., 2014, 2017). The primary gaseous I/S/L-VOCs emitted by biomass burning are usually calculated using the emissions of POA (Couvidat et al., 2012; Koo et al., 2014) because a part of these I/S/L-VOCs may correspond to POA due to the gas-to-particle partitioning. However, these gaseous I/S/L-VOC emissions may also correspond to an unspeciated fraction of non-methane organic gas (NMOG; Jathar et al., 2014, 2017). Jathar et al. (2014) estimate that about 20 % of the total NMOG emitted from biomass burning is assumed to be I/S/L-VOCs in the gas phase, while Yokelson et al. (2013) estimate that as much as 35 % to 64 % of NMOG is I/S/L-VOCs in the gas phase.
Although primary gaseous I/S/L-VOCs are not considered to be or classified as unspeciated NMOG in emission inventories, their contribution to the SOA budget may be substantial, despite being a small fraction of the overall organic gas emissions (Koo et al., 2014; Konovalov et al., 2015; Ciarelli et al., 2017). The gaseous I/S/L-VOCs are usually classified according to their volatilities (Couvidat et al., 2012; May et al., 2013) by taking into account the variation in their average oxidation state (Koo et al., 2014). Different parameterizations have been used to simulate the ageing of gaseous I/S/L-VOCs emitted by the biomass burning: a simple one-step oxidation scheme (Couvidat et al., 2012) or a multi-generational oxidation scheme taking simultaneously functionalization and fragmentation into account at each step (Koo et al., 2014; Ciarelli et al., 2017).
The objective of this work is to quantify the contribution of recently identified SOA precursors from wildfires (guaiacol, syringol, benzene, phenol, catechol, cresol, furan, naphthalene, methylnaphthalene and USC>6 compounds). To that end, a new SOA formation mechanism is developed for those precursors, based on smog chamber experiments under low- and high-NOx conditions. This new mechanism is used in conjunction with the H2O mechanism previously developed for biogenic and anthropogenic VOC precursors (xylene, toluene, isoprene, monoterpenes, sesquiterpenes, etc.).
This study aims also to quantify the relative contribution of VOCs and I/S/L-VOCs to OA formation. The OA concentrations are simulated using the chemistry transport model (CTM) Polair3D of the Polyphemus modeling air-quality platform.
This study focuses on two severe fire events that occurred during the summer of 2007 over the Euro-Mediterranean area. Majdi et al. (2019) show a large contribution of wildfires (reaching ∼90 %), mainly in Greece (24–30 August 2007) and in the Balkans (20–31 July 2007, 24–30 August 2007).
This paper is structured as follows. Section 2 details the SOA formation mechanisms from VOCs and I/S/L-VOCs. Then, Sect. 3 describes the model and the simulation setup during summer of 2007. The main OAtot precursors (VOCs and4 gaseous I/S/L-VOCs) emitted from wildfires, their emission factors and their emissions are detailed in Sect. 4. Section 5 presents the sensitivity simulations performed to understand the relative impact of VOCs and I/S/L-VOCs on OA formation.
2.1 SOA formation from VOC oxidation
This section presents a new SOA formation mechanism H2Oaro developed to represent the SOA formation from the main aromatic VOCs that are estimated to be SOA precursors. The new mechanism (H2Oaro) is an extension of the hydrophilic–hydrophobic organic (H2O) SOA mechanism, which details the formation of organic aerosols from the oxidation of precursors (Couvidat et al., 2012). Laboratory chamber studies provide the fundamental data that are used to parameterize the atmospheric SOA formation under low- or high-NOx conditions. The formed organic aerosols are represented by surrogate compounds, with varying water affinity (hydrophobic and hydrophilic). In the original H2O mechanism, the precursors are I/S/L-VOCs, aromatics (xylene and toluene), isoprene, monoterpenes and sesquiterpene. In the extension H2Oaro developed here, other VOCs are considered to be SOA precursors (phenol, cresol, catechol, benzene, furan, guaiacol, syringol, naphthalene and methylnaphthalene).
Laboratory chamber studies provide the fundamental data that are used to parameterize the atmospheric SOA formation under low- or high-NOx conditions. All the experiments used in this paper were conducted under dry conditions, with a relative humidity (RH) lower than 10 % and a temperature ranging between 292 and 300 K.
For each VOC, precursor of SOA and chamber experiment, the SOA mass yield (Y) is defined as the fraction of the reactive organic gas (ROG) that is converted to SOA. The relationship between the yield and the measured organic aerosol mass concentration (i.e., formed SOA) M0 (Odum et al., 1996) is
where αi is the molar stoichiometric coefficient of the product (surrogate) i, and Kp,i is its gas–particle partitioning equilibrium constant.
The chamber experimental results are analyzed according to the absorption gas–particle partitioning model developed by Pankow (1994) and Odum et al. (1996). For each VOC, the experimental results (Y, M0) are fitted (with the least-mean-square method) either with a one-product model or two-product model by plotting the Odum curve. The stoichiometric coefficients of SOA products, their saturation vapor pressures and their partitioning gas–particle constants are determined from the experimental results and the Odum curve. Then candidates for SOA surrogates formed by the VOC oxidation are estimated from the literature. For each candidate, the saturation vapor pressure and the partitioning constant are estimated from an empirical method called “the group contribution method” proposed by SIMPOL.1 (Pankow and Asher, 2008). These parameters are used to choose the SOA surrogates amongst the candidates: the SOA surrogates are chosen so that their saturation pressure and partitioning constant are the closest to the ones determined experimentally from the Odum plot.
2.1.1 Oxidation of phenol and catechol
Under low-NOx conditions, the chamber experiments of Yee et al. (2013), Chhabra et al. (2011) and Nakao et al. (2011) are used to model the SOA formation from phenol oxidation.
In their studies, and in agreement with the explicit chemical mechanism MCM version 3.3.1 (MCM.v3.3.1), CAT is the dominant product of the first oxidation step of phenol. Therefore, catechol is assumed to be the main intermediary leading to SOA formation from OH oxidation of phenol following Reaction (R1):
where the kinetic constant exp(1220∕T) molecule−1 cm3 s−1 and the stoichiometric coefficient of catechol are given by MCM.v3.3.1. SOA from phenol are produced essentially from the oxidation of catechol, which is mostly present in the gas phase (Kp=2.57 m3 g−1). The yields of the SOA surrogates formed from the catechol oxidation by OH are estimated, assuming that Reaction (R1) holds and using the Odum approach with the results (yields and M0) of the experiments conducted by Yee et al. (2013) and Chhabra et al. (2011) for phenol oxidation. The Odum approach (Odum et al., 1996) is used here with only one surrogate (one-product model) to estimate SOA formation parameters, as similar partitioning constants and stoichiometric coefficients are obtained with two surrogates. Figure 1 shows the plots of the SOA yields against the SOA concentrations M0. The blue stars are yields from smog chamber experiments, and the red circles are yields estimated by the one-product model.
The one-product model with a stoichiometric coefficient α1 of 0.28 and a vapor pressure of torr correctly reproduces the experimental data. To quantify the spread between the model and experimental data, the root-mean-square error (RMSE) is used as a statistical estimator and calculated as
where Yieldmodel refers to the modeled SOA yield, Yieldexp is the experimental SOA yield and N is the number of experiments. A small amount of spread between the model and experimental data (RMSE of 3.1 %) is quantified. Note that this stoichiometric coefficient (0.28) is similar to the one obtained using the experimental result of Nakao et al. (2011) for the OH oxidation of catechol (0.26). Yee et al. (2013) identified SOA products from phenol oxidation under low-NOx conditions. For each product proposed by Yee et al. (2013), vapor saturation pressures are calculated with SIMPOL.1 using the group contribution method. The surrogate is chosen so that its estimated saturation vapor pressure corresponds to the experimental one estimated from the Odum curve. The product ACIDMAL (C6H6O5, maleylacetic acid) is chosen, as its theoretical vapor pressure ( torr) is the closest to the experimental one ( torr). The van Krevelen diagram in Chhabra et al. (2011) presents the properties of SOA from phenol oxidation in terms of O∕C and H∕C ratios. According to the van Krevelen diagram, the O∕C and H∕C ratios of SOA from phenol vary from 0.8 to 1 and between 1 and 1.5 respectively. This confirms that ACIDMAL is an acceptable SOA surrogate for the OH oxidation of phenol (O∕C = 0.83 and H∕C = 1). Because of the lack of experimental data of phenol oxidation under high NOx, ACIDMAL is also used as a high-NOx surrogate.

Figure 1SOA yield from smog chamber experiments under low-NOx conditions (Yee et al., 2013; Chhabra et al., 2011; Nakao et al., 2011), and yield curve for phenol–OH reaction using one-product model.
Finally, the oxidation of catechol is modeled following Reaction (R2):
where the kinetic constant molecule−1 cm3 s−1 is taken from MCM.v3.3.1.
2.1.2 Oxidation of cresol
As detailed in the chemical mechanism MCM.v3.3.1, the OH oxidation of cresol (CRESp) leads to the formation of methylcatechol (MCAT), which is the dominant product of the first oxidation step of cresol, presented in Reaction (R3):
where the kinetic constant molecule−1 cm3 s−1, and the stoichiometric coefficient are from MCM.v3.3.1.
The oxidation of methylcatechol by OH leads to the formation of SOA, following a chemical mechanism detailed in Schwantes et al. (2017). Because of the lack of the experimental data under high-NOx conditions, we consider cresol chemical mechanisms under low- and high-NOx conditions to be similar. Aerosol yields from the experiments of Nakao et al. (2011) under low-NOx conditions are used for the Odum approach. The one-product model is sufficiently accurate to reproduce correctly the data from the smog chamber. Figure 2 plots the SOA yields against the SOA concentrations. A stoichiometric coefficient and a saturation vapor pressure 0.39 and torr respectively are found to fit the experimental data accurately, with small differences between the model and experimental data (RMSE of ∼3 %). The oxidation mechanism of MCAT developed by Schwantes et al. (2017) presents the potential candidates of SOA surrogates. For each candidate, the theoretical vapor saturation pressure is calculated using SIMPOL.1 DHMB (C7H6O4, dihydroxymethylbenzoquinone) has the closest vapor saturation pressure ( torr) to the experimental vapor pressure calculated from the Odum plot ( torr), and it is also close to the experimental pressure given in Schwantes et al. (2017) ( torr).
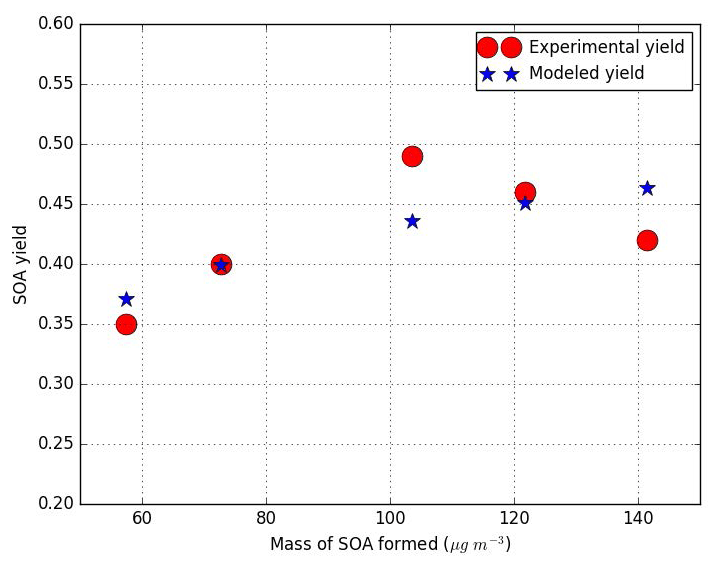
Figure 2SOA yield data from smog chamber under low-NOx conditions (Nakao et al., 2011), and yield curve for cresol–OH reaction using one-product model.
Finally, the oxidation of methylcatechol is modeled following Reaction (R4):
where the kinetic constant molecule−1 cm3 s−1 is from MCM.v3.3.1, and the stoichiometric coefficient of DHMB is deduced from the Odum plot.
Several studies focus also on the oxidation of cresol by NO3 (Olariu et al., 2013; Grosjean, 1990). This oxidation may not contribute significantly to SOA formation because the NO3 oxidation products of cresol are highly volatiles.
2.1.3 Oxidation of benzene
According to MCM.v3.3.1, benzene (BENZ) reacts with OH to form phenol, as presented in Reaction (R5).
where exp() molecule−1 cm3 s−1 is from MCM.v3.3.1. For the case of benzene, only the formation through the phenolic route is taken into account for simplification purposes. However, due to the high SOA yield of phenol and the high amount of phenol formed through benzene oxidation, the phenolic route should be one of the main pathways for SOA formation. By using the phenol SOA mechanism developed previously in Sect. 2.1.1, the SOA yield through the phenolic of 0.28 is evaluated. This yield is within the range of SOA yields from benzene oxidation (between 0.22 and 0.33) reported by Nakao et al. (2011) for low-NOx conditions. It confirms that phenol is probably the main intermediate for the formation of SOA.
2.1.4 Oxidation of furan
According to MCM.v3.3.1, furan (FUR) reacts with OH to form an unsaturated 1,4-dicarbonyl product (butendial – ButDial), following Reaction (R6):
where molecule−1 cm3 s−1 is from MCM.v3.3.1.
According to MCM.v3.3.1, ButDial reacts with OH to form highly volatile products (not detailed here because they may not form SOA) and a radical (RADButenalCOO), as presented in Reaction (R7):
where molecule−1 cm3 s−1 is from MCM.v3.3.1.
Under high-NOx conditions, according to MCM.v3.3.1, the oxidation of RADButenalCOO forms highly volatile products (glyoxal and maleic anhydride), which are not considered here for SOA formation (Reaction R8):
where exp(980∕T) molecule−1 cm3 s−1 is from MCM.v3.3.1.
Under low-NOx conditions, the oxidation of RADButenalCOO forms malealdehydic acid (ButenalCOOH) as shown in Reactions (R9) and (R10):
where exp(980∕T) molecule−1 cm3 s−1, and molecule−1 cm3 s−1 are from MCM.v3.3.1.
ButenalCOOH is mostly in the gas phase ( m3 g−1) and not in the particle phase. However, according to GECKO-A, it may be oxidized by OH to form a radical (RADButenalCOOHCOO) following Reaction (R11):
where molecule−1 cm3 s−1 is from GECKO-A. The radical RADButenCOOHCOO can react similarly to RADButenCOO under low-NOx conditions to form the diacid (Buten(COOH)2) as presented in Reactions (R12) and (R13):
Note that the oxidation mechanism of furan presented in this section probably overestimates the SOA concentrations from the OH-oxidation route because several reactions such as ozonolysis and photolysis of both ButenalCOOH and Butenal(COOH)2 are not considered. These reactions may lead to the loss of the main intermediary responsible of SOA formation (ButenalCOOH and Butenal(COOH)2).
Furthermore, other routes may be more efficient at forming SOA from furan. Jiang et al. (2018) showed that NOx levels and relative humidity (RH) may significantly influence SOA formation from furan, with higher SOA concentrations at high-NOx levels and high humidity.
2.1.5 Oxidation of syringol and guaiacol
According to Lauraguais et al. (2014), the SOA formation mechanisms from methoxyphenols, namely syringol and guaiacol, are split into two steps. The first step consists of Reactions (R14) and (R15) with the radical OH:
where molecule−1 cm3 s−1 and molecule−1 cm3 s−1 are given by Lauraguais et al. (2012) and Coeur-Tourneur et al. (2010a) respectively.
The parameterization is developed for syringol and guaiacol by considering low-NOx and high-NOx conditions based on SOA yields reported by Chhabra et al. (2011), Yee et al. (2013), Lauraguais et al. (2012) and Yee et al. (2013). Generally this compound represents low-NOx oxidation products. In this first parameterization it is also used as a high-NOx surrogate. Figure 3 shows the modeled Odum plots for syringol SOA formation under both low-NOx and high-NOx conditions. A one-product parameterization is sufficient for properly representing the experimental data for the two regimes. The same surrogate compound can be used for both regimes, as similar partitioning constants are estimated. Among the compounds recognized as syringol oxidation products, C8H10O5 (PSYR) is the only product with a vapor saturation pressure, calculated with SIMPOL.1 ( torr), close to the experimental one estimated from the Odum plot ( torr). Stoichiometric coefficients of 0.57 and 0.36 are also estimated from the Odum curve under low- and high-NOx conditions respectively.

Figure 3SOA experimental and modeled yield data from smog chamber for syringol under low-NOx conditions (a) (experimental data from Chhabra et al., 2011; Yee et al., 2013) and under high-NOx conditions (b) (experimental data from Yee et al., 2013; Lauraguais et al., 2012).
The second reaction step for SOA formation is then represented with the following Reactions (R16), (R17) and (R18):
where exp(1300∕T) molecule−1 cm3 s−1, exp(360∕T) molecule−1 cm3 s−1 and molecule−1 cm3 s−1 are from MCM.V3.3.1.
Similarly, for guaiacol, the two NOx regimes are distinguished. One surrogate compound is used for the high-NOx and the low-NOx parameterizations. Odum plots are presented in Fig. 4.
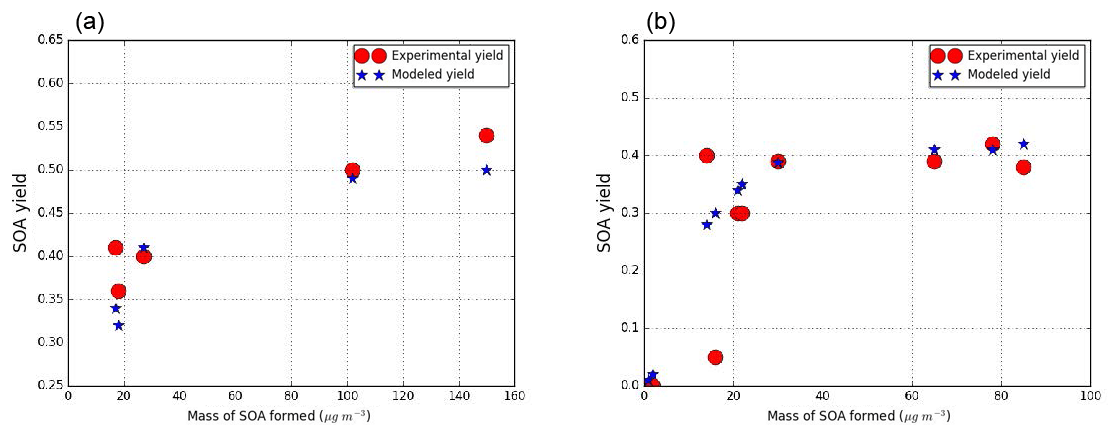
Figure 4SOA experimental and modeled yield data from smog chamber for guaiacol under low-NOx conditions (a) (experimental data from Chhabra et al., 2011; Yee et al., 2013) and under high-NOx conditions (b) (experimental data from Yee et al., 2013; Lauraguais et al., 2012).
The surrogate compound chosen to represent SOA formation in both conditions is C7H10O5 (GHDPerox), a hydroperoxide proposed as an oxidation product for guaiacol in Yee et al. (2013). It was chosen because the calculated saturation vapor pressure with SIMPOL.1 ( torr) is close to the one estimated by the Odum method ( torr). Stoichiometric coefficients of 0.37 and 0.32 are also estimated from the Odum curve under low-NOx and high-NOx conditions respectively. Moreover, according to the van Krevelen plot proposed by Chhabra et al. (2011), the most appropriate guaiacol SOA surrogate has an O∕C and H∕C ratio respectively in the ranges 0.7–1 and 1.2–1.5. With its O∕C and H∕C ratios of 0.71 and 1.43 ratios, GHDPerox is in the right position of the van Krevelen plot.
The second part of the OH-oxidation mechanism for guaiacol follows Reactions (R19), (R20) and (R21):
2.1.6 Oxidation of naphthalene and methylnaphthalene
As detailed in Couvidat et al. (2013), data from the chamber experiments of Chan et al. (2009) are used to fit two products from the oxidation of naphthalene and methylnaphthalene under low-NOx and high-NOx conditions. The SOA surrogates are chosen amongst the compounds detected by Kautzman et al. (2010). Under low-NOx conditions (reactions with HO2, the methylperoxy radical MEO2 and the peroxyacetyl radical C2O3), BBPAHlN (C6H6O6, dihydroxyterephthalic acid) is the surrogate chosen to represent SOA formation from the oxidation of naphthalene and methylnaphthalene. Under high-NOx conditions, BBPAHhN (C8H6O4, phthalic acid) is the surrogate chosen because its theoretical saturation vapor pressure ( torr), estimated with SIMPOL.1 (Pankow and Asher, 2008), is the closest to the experimental one (10−6 torr) estimated from the Odum curve plotted by Couvidat et al. (2013). The oxidation reactions leading to SOA formation from naphthalene and methylnaphthalene are presented in Table B3 of Appendix B.
2.1.7 Oxidation of USC>6 compounds
It is not easy to design a chemical mechanism for the structurally assigned and unassigned compounds with at least six carbon atoms per molecule (USC>6 compounds). Because Bruns et al. (2016) estimated that SOA yields for USC>6 compounds are high, they are represented in the model by a high-yield compound. Phenol and naphthalene are good candidates. Because the oxidation products of naphthalene and phenol are very different (e.g., volatility), a sensitivity simulation is performed by choosing the oxidation mechanism of naphthalene rather than phenol to evaluate the impact of changing the oxidation mechanism.
Table B3 in Appendix B summarizes the oxidation reactions added to the chemical mechanism CB05 for each VOC. All properties of the added compounds are presented in Table B1 of Appendix B. The chemical structure of the SOA compounds is given in Table B2.
2.2 SOA formation from I/S/L-VOCs
Different parameterizations may be used to describe the formation of SOA from the gaseous I/S/L-VOCs emitted from wildfires, with or without an ageing scheme: a one-step oxidation scheme (no ageing) and multi-generational oxidation scheme.
In the one-step oxidation scheme, used, for example, in Couvidat et al. (2012), Zhu et al. (2016) and Sartelet et al. (2018), the primary organic aerosols emitted by biomass burning (BBPOAlP for compounds of low volatility, BBPOAmP for compounds of medium volatility and BBPOAhP for compounds of high volatility of saturation concentration C*: log(C*) is and 3.5 respectively) undergo one oxidation step in the gas phase, leading to the formation of secondary surrogates (BBSOAlP, BBSOAmP and BBSOAhP).
Compared to the primary products, the volatility of the secondary products is reduced by a factor of 100, and their molecular weight is increased by 40 % (Couvidat et al., 2012; Grieshop et al., 2009). Tables in Appendix C list the three OH-oxidation reactions and the properties of the primary and secondary surrogates.
For the multi-generational scheme, the VBS approach based on the hybrid VBS (Donahue et al., 2006, 2011; Koo et al., 2014; Ciarelli et al., 2017) is used. In this scheme (Koo et al., 2014; Ciarelli et al., 2017), the basis set uses five volatility surrogates with different saturation concentrations ranging from 0.1 to 1000 µg m−3. BBPOA0, BBPOA1, BBPOA2, BBPOA3 and BBPOA4 refer to the primary surrogates, and BBSOA0, BBSOA1, BBSOA2 and BBSOA3 refer to the secondary ones (see Table D2 of Appendix D for their properties). In the gas phase, the primary and secondary surrogates react with OH at a rate of molecule−1 cm3 s−1 (Robinson et al., 2007). During each oxidation step, the oxidation of the surrogate increases the surrogate oxygen number and decreases its volatility and carbon number due to functionalization and fragmentation, which are considered simultaneously during each oxidation reaction. The reactions and the properties of the surrogates of the multi-generational scheme are shown in Appendix D.
The impact of wildfires on PM concentrations and optical depths in the Euro-Mediterranean during the summer of 2007 was studied by Majdi et al. (2019).
Here, the CTM Polair3D or Polyphemus (Mallet et al., 2007; Sartelet et al., 2012) is used with a similar setup to Majdi et al. (2019) and summarized here. A modified version of the Carbon Bond 05 model (CB05; Yarwood et al., 2005; Kim et al., 2011) is used for gas-phase chemistry with the SIze REsolved Aerosol Model (SIREAM; Debry et al., 2007) for aerosol dynamics (coagulation and condensation or evaporation). The meteorological fields are provided by the European Centre for Medium-Range Weather Forecasts (ECMWF; ERA-Interim). Boundary conditions of the nesting domain are obtained from the global chemistry transport model MOZART–GEOS5 6-hourly simulation outputs (Emmons et al., 2010). Anthropogenic emissions are generated from EMEP inventory for 2007 (European Monitoring and Evaluation Programme; http://www.emep.int, last access: 19 April 2019). Biogenic emissions are estimated with the Model of Emissions of Gases and Aerosols from Nature (MEGAN-LHIV, Guenther et al., 2006). Sea-salt emissions are parameterized following Monahan (1986). The soil and surface database of Menut et al. (2013) is used to calculate the dust emissions considering the spatial extension of potentially emitted area in Europe described in Briant et al. (2017). The daily fire emissions are calculated using the APIFLAME fire emission model v1.0 (Turquety et al., 2014), as described in Majdi et al. (2019).
Two domains are considered in this study (Fig. 5): one nesting domain covering Europe and North Africa and one nested over the Mediterranean. The horizontal resolutions used are 0.5∘ × 0.5∘ and 0.25∘ × 0.25∘ for the nesting and nested domains respectively. The vertical dimension is discretized with 14 levels in Polyphemus (from the ground to 12 km). Since the largest fires in the Euro-Mediterranean domain occur mainly in the Balkans and eastern Europe (between 20 July and 31 July 2007), in Greece (between 24 August and 30 August), and in southern Italy (between 9 July and 31 July 2007; Majdi et al., 2019), we choose to focus on the subregion indicated in the green box in Fig. 5.
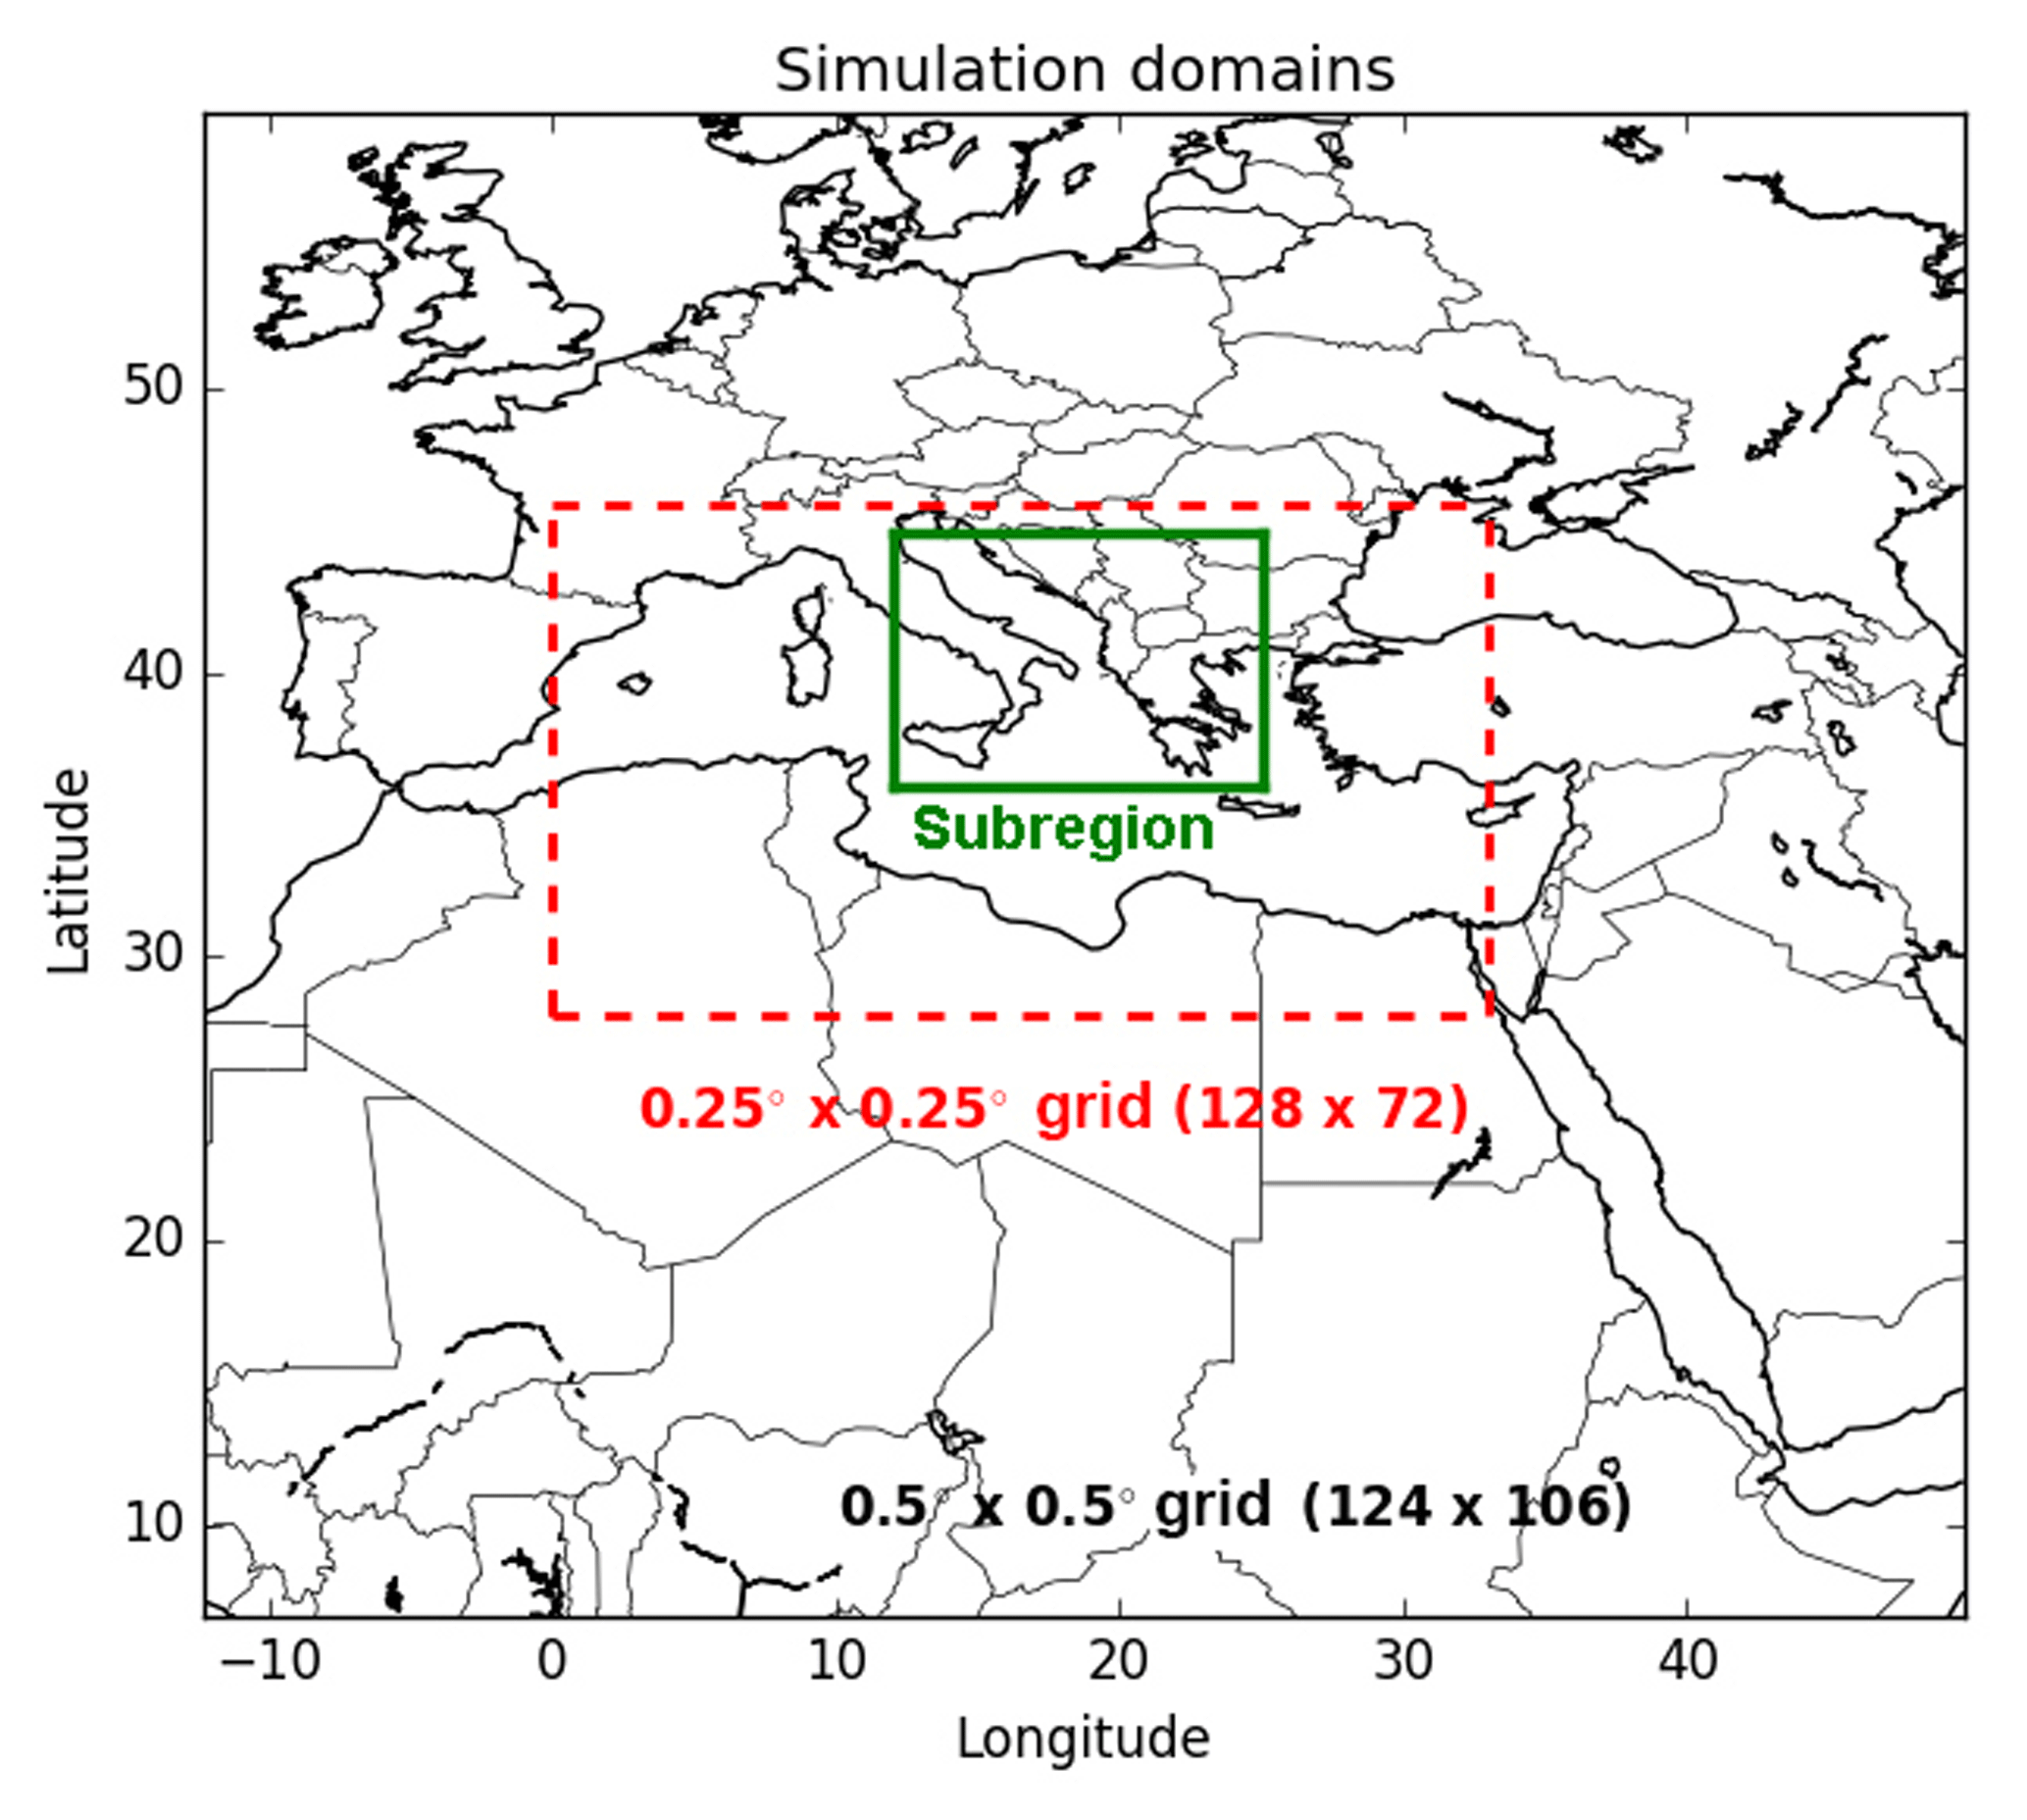
Figure 5Simulation domains, including one large domain (with a 0.5∘ × 0.5∘ horizontal resolution) and a smaller domain (at a 0.25∘ × 0.25∘ horizontal resolution) delimited by the dotted red box. The subregion (Balkans, Greece, Eastern Europe and Italy) indicated in green box, is used in this study.
The CB05 gas-phase chemical mechanism is used in conjunction with the chemical mechanism H2O to model the formation of SOA from five classes of precursors, namely I/S/L-VOCs of anthropogenic emissions, aromatic VOCs, isoprene, monoterpene and sesquiterpenes (Kim et al., 2011; Couvidat et al., 2012). In this work, the SOA mechanism H2Oaro developed in Sect. 2.1 for aromatic VOCs, precursors of SOA, is added. Gas–particle partitioning is modeled using a thermodynamic equilibrium model for multiphase multicomponent inorganic aerosols (ISORROPIA; Nenes et al., 1999) for inorganics and using a secondary organic aerosol processor (SOAP) for organics (Couvidat and Sartelet, 2015), assuming thermodynamic equilibrium between gases and particles.
As in Majdi et al. (2019), POA from fire and anthropogenic emissions are assumed to be the condensed phase of I/S/L-VOCs. The gaseous emissions of I/S/L-VOCs from wildfires and their ageing are described in Sect. 2.2.
Dry deposition of gaseous I/S/L-VOCs from wildfires is parameterized based on Wesely (1989), modeling deposition as a series of resistors consisting of an atmospheric, laminar sublayer and bulk surface resistance. The surface resistance is a function of the effective Henry's law constant (Heff; M atm−1). For I/S/L-VOCs, this constant varies with the volatility, as detailed in Hodzic et al. (2016). The reactivity factor f0, which corresponds to the ability of a dissolved gas to oxidize biological substances in solution, may range from 0 for non-reactive species to 1 for highly reactive species. In this work, the f0 value is set to 0.1 (Karl et al., 2010; Knote et al., 2015). All the parameters used to compute the dry-deposition velocities of the I/S/L-VOCs are summarized in Table E1 of Appendix E.
The reference simulation uses the same setup as Majdi et al. (2019). The evaluation of Majdi et al. (2019) of the simulation includes both ground-based and satellite remote-sensing (MODIS) observations. Ground-based observations of PM2.5 at eight AIRBASE stations and of aerosol optical depth at six AERONET stations are used. The evaluation shows good performances of the model, especially when wildfires are taken into account in the simulation. Enhancements in PM concentrations due to wildfires are simulated at ±1 d of uncertainty in the timing compared to satellite observations (MODIS), with a strong contribution from organic compounds (61 %; Majdi et al., 2019).
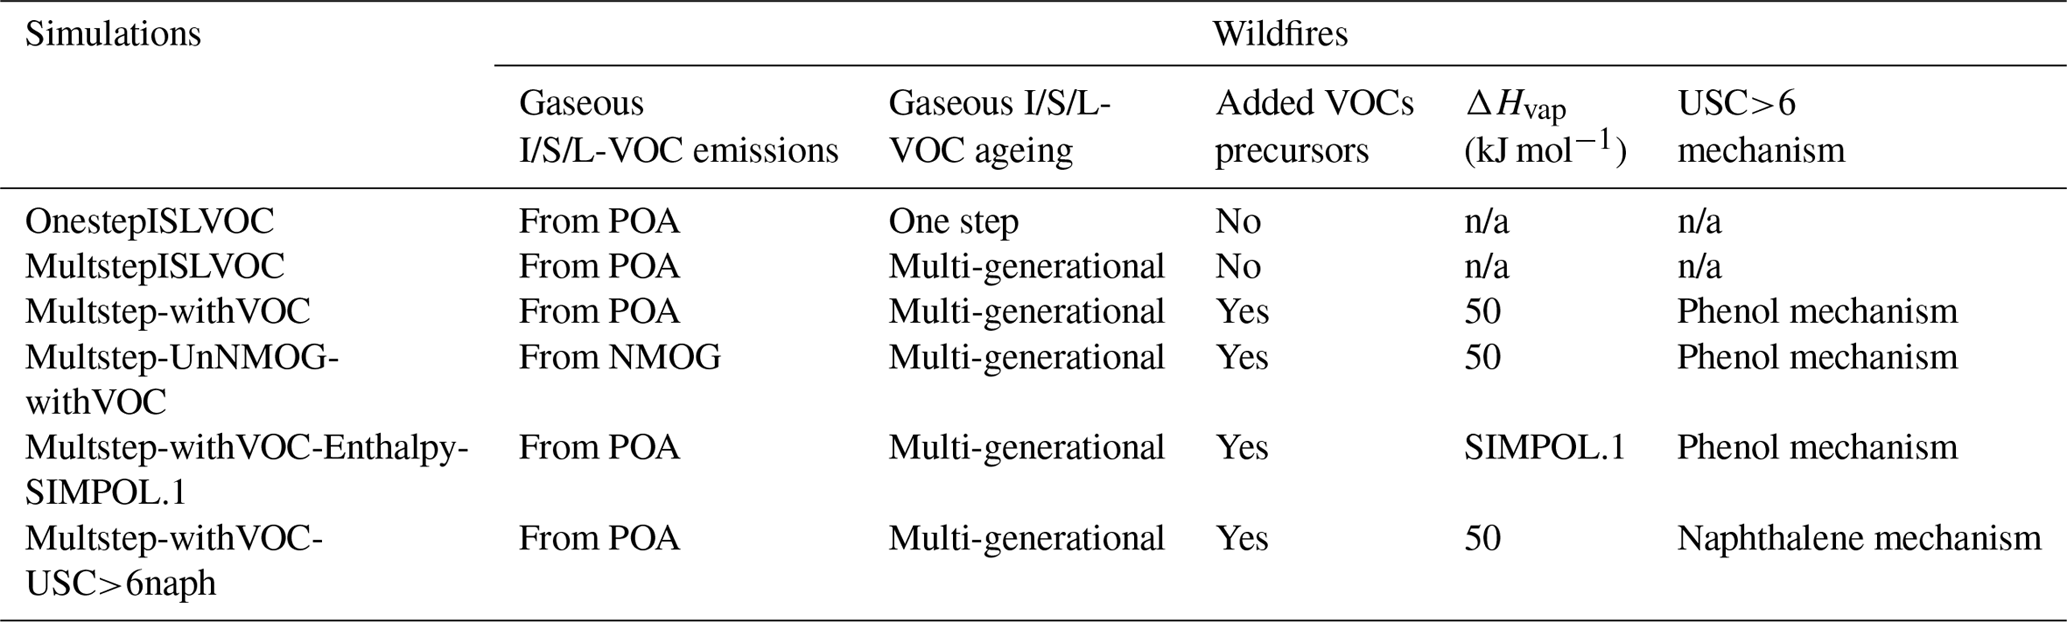
To assess the relative influence of emissions of VOCs and I/S/L-VOCs from wildfires on OA concentrations, six sensitivity simulations are performed. The setup of the different simulations is summarized in Table 1.
The reference simulation OnestepISLVOC uses the default setup, i.e., the setup used in the previous study (Majdi et al., 2019): for VOC emissions, only toluene and xylene are considered (as detailed in Sect. 5.1), while gaseous I/S/L-VOC emissions are estimated from POA emissions, and their ageing is modeled using a one-step oxidation scheme. The simulation MultstepISLVOC is conducted to highlight the impact of the ageing scheme of the gaseous I/S/L-VOCs from wildfires on SOA formation. To do so, the multi-generational scheme (Ciarelli et al., 2017) is used for the gaseous I/S/L-VOCs from wildfires.
To assess the impact of VOCs on SOA formation, the Simulation Multstep-withVOC uses the same setup as the simulation MultstepISLVOC, but all the VOCs, which are SOA precursors, are added to the model, as detailed in Sect. 5. Because the relative impact of I/S/L-VOCs on OA formation depends on how gaseous I/S/L-VOC emissions are computed, the simulation Multstep-UnNMOG-withVOC is the same as the simulation Multstep-withVOC, but the gaseous I/S/L-VOC emissions are assumed to be unidentified NMOG, and they are estimated from NMOG emissions (as described in Sect. 5.2).
The sensitivity of two parameters involved in the modeling of the ageing of these VOCs is also assessed: the enthalpy of vaporization (ΔHvap) of the SOA formed from the oxidation of the VOCs and the SOA formation mechanism from USC>6 compounds.
Several studies consider ΔHvap of the formed SOA to be constant (Sheehan and Bowman, 2001; Donahue et al., 2005; Stanier et al., 2007). For SOA from α-pinene, Donahue et al. (2005) estimated ΔHvap to be about 30 kJ mol−1. This is lower than the ΔHvap values calculated for individual components using SIMPOL.1. The calculated ΔHvap values are in the range of 54–132 kJ mol−1. Stanier et al. (2007) also estimated ΔHvap to be in the range of 10–50 kJ mol−1. In the simulation Multstep-withVOC-Enthalpy-SIMPOL.1, the enthalpy of vaporization is calculated for the SOA surrogates formed from VOCs using SIMPOL.1 rather than being constant as in the simulation Multstep-withVOC. In the simulation Multstep-withVOC-USC>6naph, the SOA formation mechanism from USC>6 compounds is taken to be the formation mechanism of naphthalene, rather than being the same as the formation mechanism of phenol in the simulation Multstep-withVOC.
Table 1Summary of the sensitivity simulations performed by Polyphemus (n/a: not applicable).
To better understand the contribution of OAtot precursors emitted by wildfires and their relative importance for OAtot and OA formation, the estimation of OAtot precursors emissions is first detailed. Two categories of SOA precursors are distinguished depending on their volatilities: VOCs and gaseous I/S/L-VOCs.
5.1 VOC emissions
Bruns et al. (2016) identified the most significant gaseous VOC precursors of SOA from residential wood combustion and presented their contribution to SOA concentrations. Although wood fire stove smoke emissions may not be representative of wildfires, they provide some indication of the SOA precursors involved during wildfires. In this work, VOC precursors emitted from wildfires are chosen based on the list of Bruns et al. (2016), their emission factors for wildfires and SOA yields. Toluene, xylene, phenol, benzene, catechol, cresol, furan, naphthalene, methylnaphthalene, and the structurally assigned and unassigned compounds with at least six carbon atoms per molecule (USC>6 compounds) are retained. Table A1 in Appendix A shows the VOCs, the corresponding SOA yields and emission factors from fires of various vegetation types. Note that although Biogenic VOC (BVOC) emissions may increase during wildfires, as suggested by Ciccioli et al. (2014), the potential increase in BVOC emissions from wildfires is not considered here due to a lack of data.
Daily fire emissions of toluene, xylene, phenol, benzene and furan are estimated by the APIFLAME fire emission model (Turquety et al., 2014). The emissions of factors in Akagi et al. (2011) are used to calculate the emissions of each species from the carbon emissions. The emission factors of toluene, xylene, benzene, furan and phenol are available in the Akagi et al. (2011) inventory and provided in terms of grams of species per kilogram of dry biomass burned for different standard vegetation types (temperate forest, crop residues, pasture maintenance, savanna and chaparral). Using an aggregation matrix, emissions of these inventory VOCs are converted to model species.
However, cresol, catechol, syringol, guaiacol, naphthalene and methylnaphthalene emission factors are missing from the Akagi et al. (2011) inventory. For cresol, catechol, guaiacol and syringol, these emission factors are calculated from the molar emission ratio to phenol, and for naphthalene and methylnaphthalene, they are calculated from the molar emission ratio to benzene (Stockwell et al., 2015) following Eq. (3):
where i represents a VOC (cresol, catechol, guaiacol, syringol, naphthalene and methylnaphthalene), ERmass,i is the mass emission ratio of the VOC i to phenol or benzene, EFx is the mass emission factor of phenol or benzene (determined using APIFLAME), ERmol,i is the molar emission ratio of the VOC i (cresol, catechol, guaiacol, syringol, naphthalene and methylnaphthalene), Mw,i is the molar weight of the VOC i, and Mwx is the molar weight of phenol (=90 g mol−1) or benzene (=78 g mol−1).
For two types of vegetation j (chaparral and crop residue), the emission ratios ER are obtained from Stockwell et al. (2015). Then in each model grid cell, the emission ratio of the VOC i (cresol, catechol, guaiacol, syringol, naphthalene or methylnaphthalene) to phenol or benzene is obtained by weighting the emission ratios over the burned vegetation types:
where Fvegj is the burning fraction for each vegetation type, and ER is the emission ratio of the VOC i to phenol or benzene for each vegetation type.
Considering only these two types of vegetation (crop residue and chaparral) for which emission ratios are available may lead to an underestimation of the emission factors and therefore the emissions of cresol, catechol, guaiacol, syringol, naphthalene and methylnaphthalene emissions. Indeed, Fig. 6 shows the percentages of the different vegetation types in the burned area detected over the subregion. Chaparral and crop residue make only 29.5 % of burned area detections. Savanna and temperate forest are considered to be the dominant vegetation types detected in the burned areas, and their contributions to burned area detections reach 32.7 % and 37.2 % respectively. Therefore, neglecting the emission factors for temperate forest and savanna would lead to a significant underestimation of the SOA precursor emissions. Because the EF of VOCs emitted by wildfires of crop residue, chaparral, temperate forest and savanna in the inventory of Akagi et al. (2011) are often of the same order of magnitude (Table A1 of Appendix A), it is assumed here that temperate forest and savanna have the same EF as chaparral for cresol, catechol, guaiacol, syringol, naphthalene and methylnaphthalene. This assumption is justified by considering uncertainties linked to emissions: Turquety et al. (2014) estimated that the uncertainties in the emitted carbon related to fire emissions can reach 100 %. They found that the database used for the type of vegetation burned plays a significant role in the emitted carbon (∼75 % associated uncertainty). Moreover, the inventory used in this work (APIFLAME Turquety et al., 2014) is mainly based on the emission factors of Akagi et al. (2011) using data from different field and laboratory experiments. Uncertainties related to these emission factors are high. For example, Alves et al. (2011) measured carbon monoxide (CO) emissions for forest fires in Portugal that were 2.6 times higher than the values of Akagi et al. (2011) for extra-tropical forests.
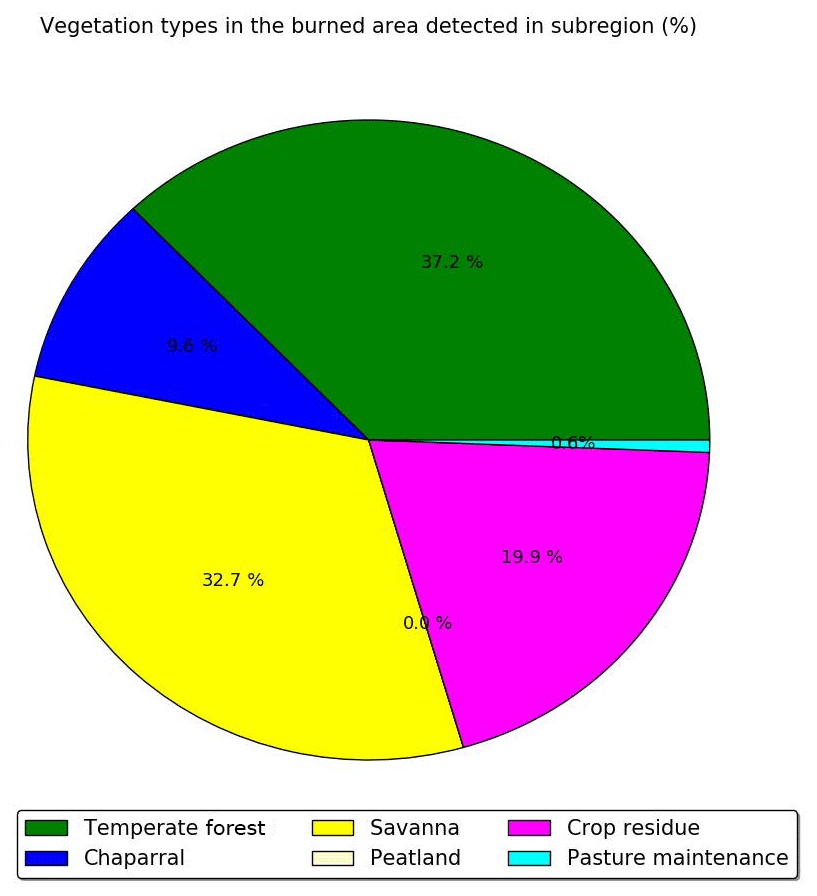
Figure 6Percentage of the different vegetation types in the burned area detected over the subregion during the summer of 2007.
According to Bruns et al. (2016), the structurally assigned and unassigned compounds with at least six carbon atoms per molecule (USC>6 compounds) are expected to contribute to SOA formation based on their structures, but their SOA yields are unknown. In this work, USC>6 compound emissions are deduced by multiplying phenol emissions by a factor of 1.7, deduced from the ratio of the SOA contribution of USC>6 compounds to the SOA contribution of phenol (Bruns et al., 2016).
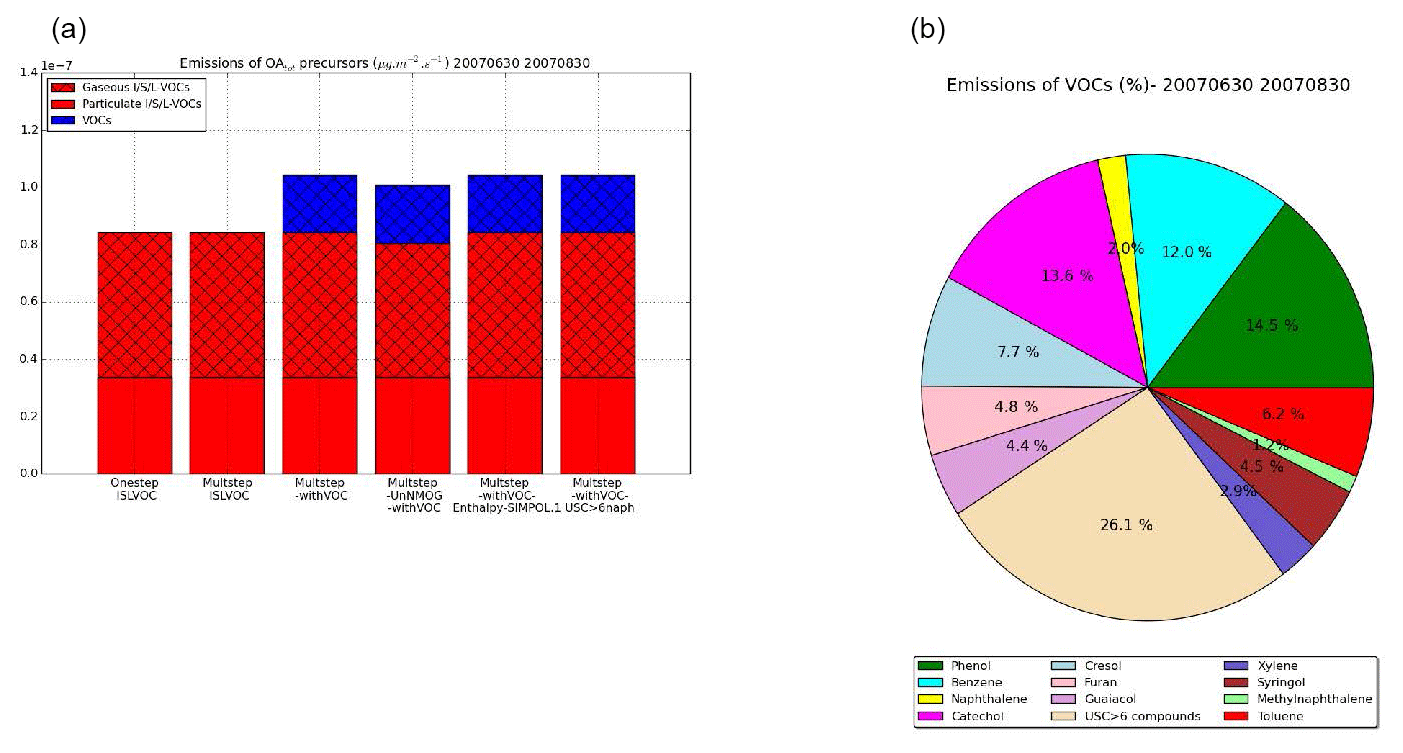
Figure 7Emissions of the OAtot precursors from wildfires for the different sensitivity simulations (a) and percentage of emissions for each VOC (b) over the subregion during the summer of 2007.
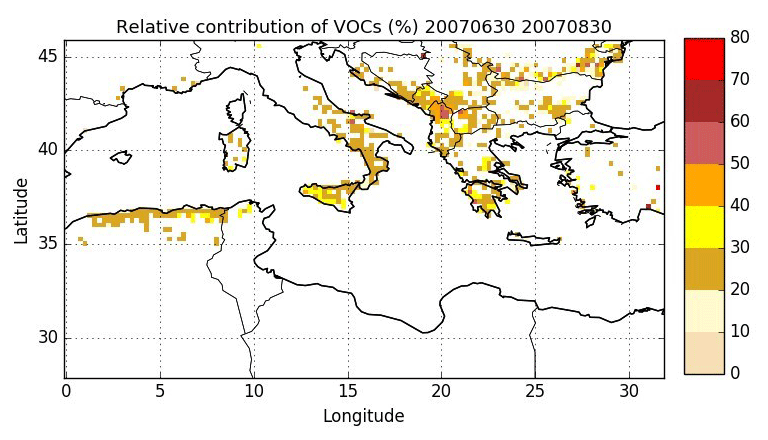
Figure 8Relative contribution of VOCs to gaseous precursors (VOCs plus gaseous I/S/L-VOCs; %) emitted by wildfires over the Mediterranean area during the summer of 2007.
5.2 I/S/L-VOC emissions
The gaseous I/S/L-VOC emissions from wildfires are estimated either from the POA emissions released from wildfires, by multiplying them by a constant ratio of (Kim et al., 2016), or from the unspeciated NMOG released from wildfires (Jathar et al., 2014). The fraction of unspeciated NMOG is estimated as the difference between the total NMOG emissions from the Akagi et al. (2011) inventory and the VOC emissions, which represent the sum of the total identified NMOG in the Akagi et al. (2011) inventory plus the VOCs previously added to the Akagi et al. (2011) inventory (cresol, catechol, guaiacol, syringol, naphthalene, methylnaphthalene and USC>6 compounds). In this work, as in Jathar et al. (2017), these unspeciated NMOG are assumed to be gaseous I/S/L-VOCs. They represent 36 % of the total NMOG emissions, consistent with the work of Yokelson et al. (2013), which estimates that between 35 % to 64 % of NMOG are the gaseous I/S/L-VOCs. Similarly to anthropogenic emissions (detailed in Sect. 3), the gaseous I/S/L-VOC emissions from wildfires are distributed into three volatility bins depending on their saturation concentration (log(C*): low volatility – BBPOAlP, log(; medium volatility – BBPOAmP, log(; and high volatility – BBPOAhP, log(). The volatility distribution at emission is 25 %, 32 % and 43 % for BBPOAlP, BBPOAmP and BBPOAhP respectively (Couvidat et al., 2012; May et al., 2013; Ciarelli et al., 2017).
5.3 Emissions over the Mediterranean domain
Fig. 7a presents the emissions of total (gas plus particle) OAtot precursors (VOCs and I/S/L-VOCs) for the different sensitivity simulations, spatially and temporally averaged over the subregion (Fig. 5) and during the summer of 2007. The emissions of VOCs and I/S/L-VOCs are similar in all the sensitivity simulations except for the simulation Multstep-UnNMOG-withVOC, which estimates the gaseous I/S/L-VOC emissions from NMOG. The emissions of gaseous I/S/L-VOCs estimated from NMOG emissions are slightly lower than those estimated from POA emissions. The emissions of gaseous I/S/L-VOCs (estimated from POA or from NMOG) are higher by a factor of about 2.5 than the emissions of VOCs.
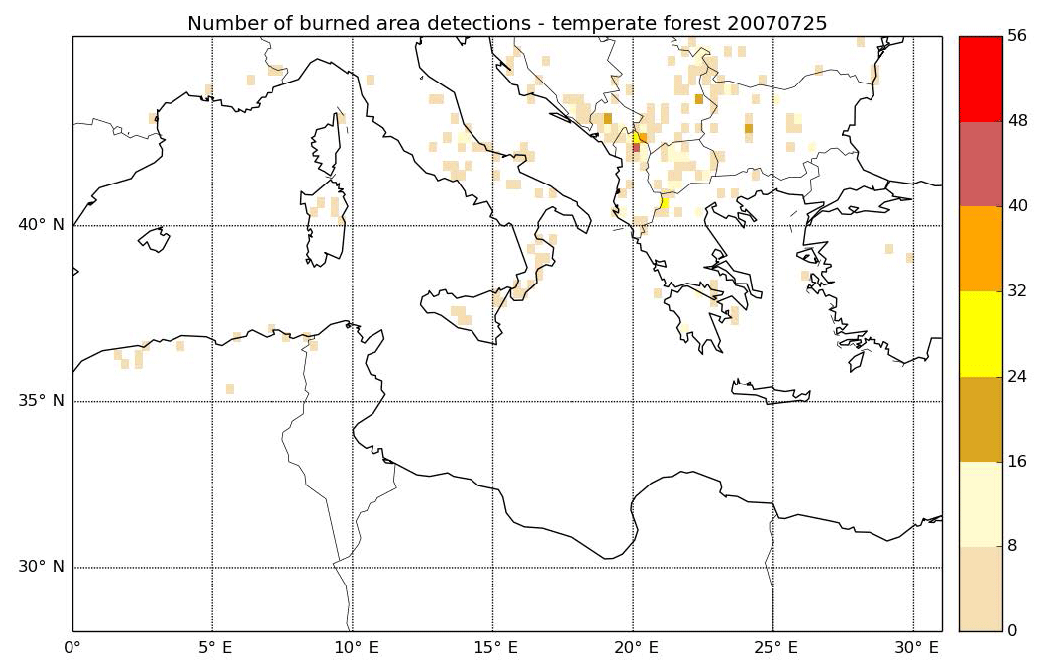
The spatial distribution of the relative contribution of VOCs to gaseous precursors emissions (I/S/L-VOCs from NMOG plus VOCs) is assessed in Fig. 8. Emissions of wildfires occur mostly over the Balkans, Greece, southern Italy, Eastern Europe and northern Algeria, with a relative contribution of VOCs mostly between 20 % and 40 %. Locally, over the Balkans, the contribution of VOCs can be higher (between 40 % and 60 %). Figure 9 shows the number of burned area detections for temperate forest. The high contribution of VOCs in the Balkans is probably explained by the high number of burned areas detected for temperate forest, which is considered one of the dominant vegetation types in the burned areas.
Fig. 7b shows the distribution of VOCs between the different compounds emitted over the subregion during the summer of 2007. USC>6 compounds dominate (26.1 %), followed by phenol (14.5 %), catechol (13.6 %), benzene (12 %), toluene (7 %), furan (5 %) and cresol (4 %). The other VOCs (SOA precursors) contribute to 3 % or less of the VOC emissions.
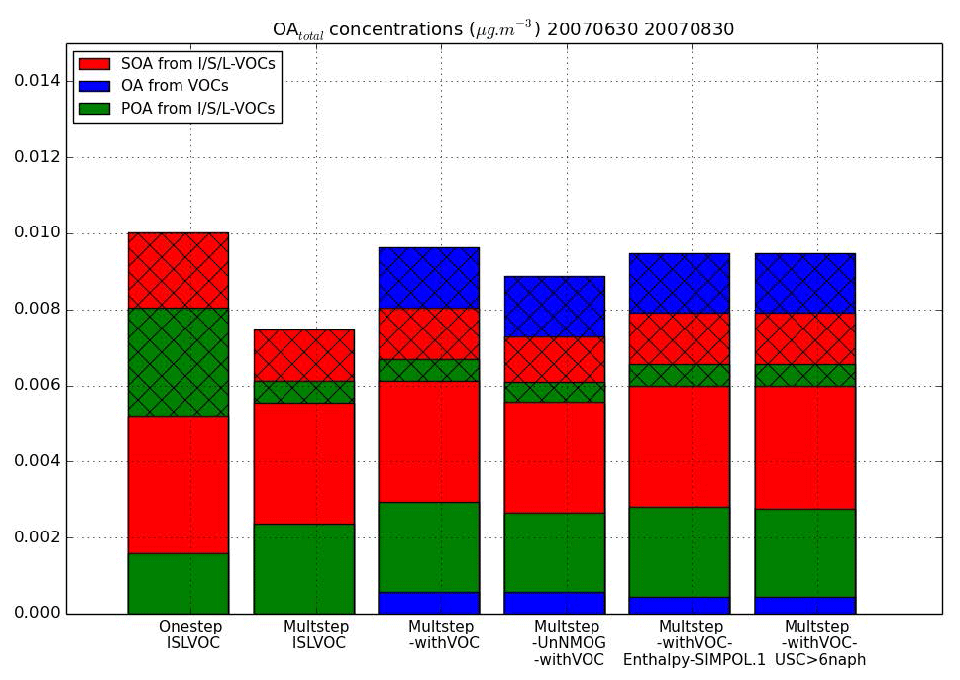
Figure 10Mean surface OAtot concentrations from different OAtot precursors over the subregion for each sensitivity simulation. The cross-hatched part corresponds to OA concentrations in the gaseous phase, while the plain parts correspond to OA concentrations in the particle phase.
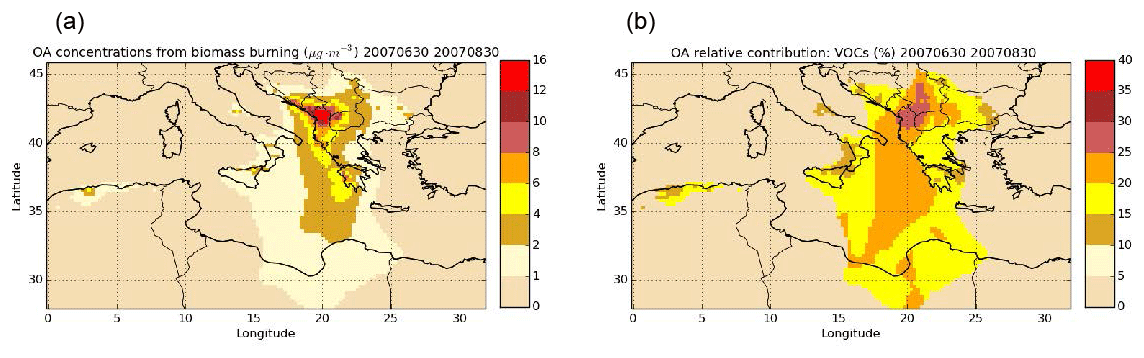
Figure 11Daily mean surface OA concentrations from wildfires (a) and the relative contribution of VOCs (%) to OA from wildfires (b) during the summer of 2007 (simulation Multstep-withVOC).
The influence of VOCs and I/S/L-VOCs on OA and OAtot concentrations is discussed in this section as well as the sensitivity to some parameters for OA and OAtot formation from VOCs and gaseous I/S/L-VOCs.
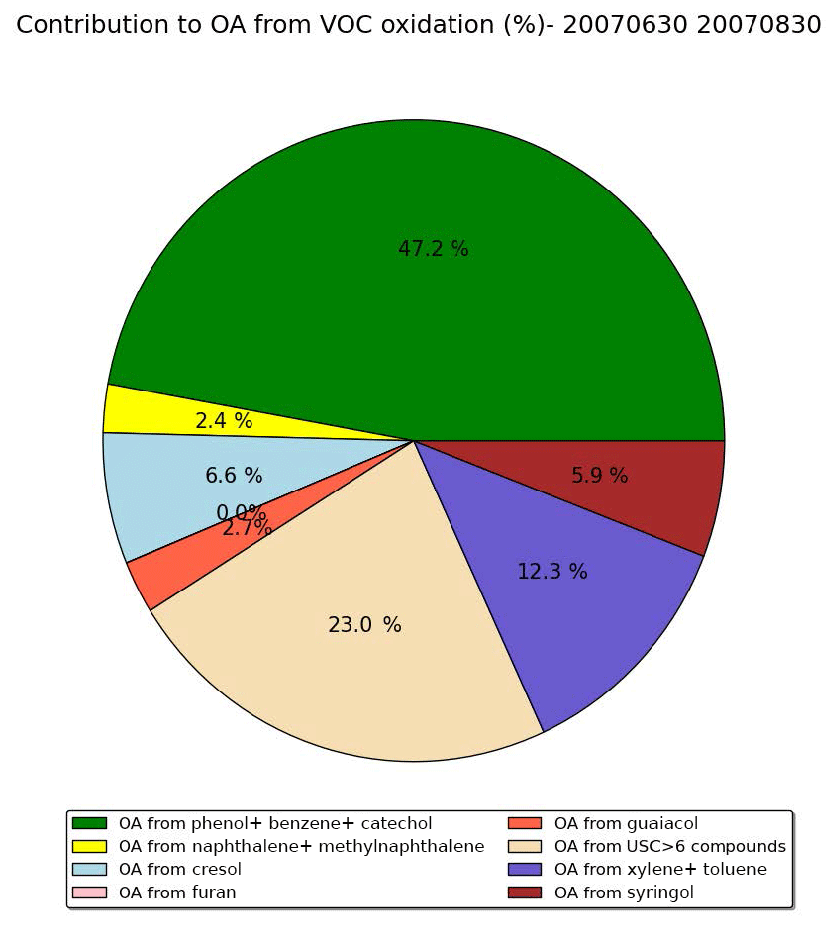
Figure 12Distribution of the OA concentrations formed from the different VOCs emitted by wildfires over the subregion during the summer of 2007 (simulation Multstep-withVOC).
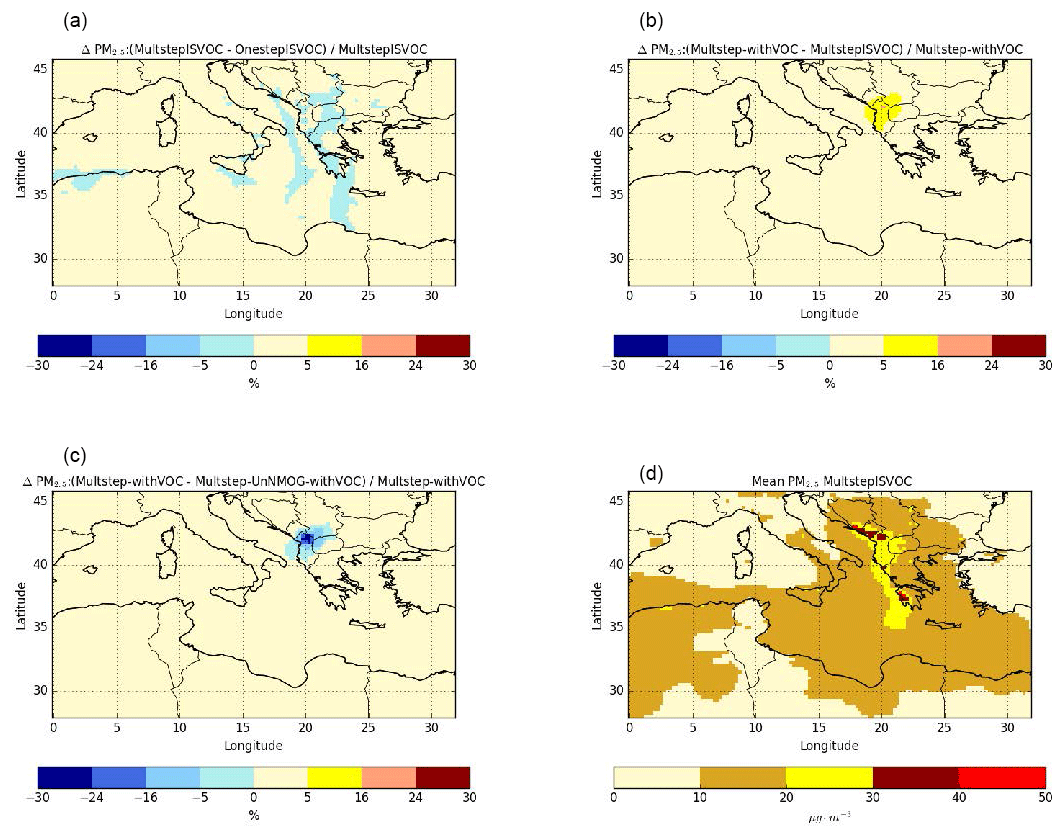
Figure 13Sensitivity of surface PM2.5 concentrations to the gaseous I/S/L-VOC ageing scheme (a), the SOA from the selected VOC (b), the SOA from gaseous I/S/L-VOC emissions estimated from NMOG (c) and daily mean PM2.5 concentrations from the Multstep-withVOC simulation (d) during the summer of 2007 (from 30 June to 30 August 2007).
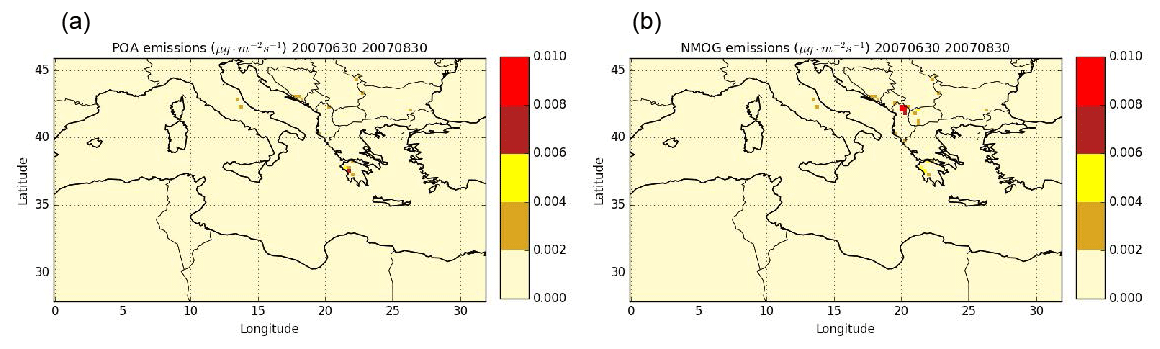
Figure 14Daily mean POA (a) and NMOG (b) emissions from wildfires during the summer of 2007.
6.1 Influence on OA concentrations
Figure 10 presents the OAtot concentrations from different precursors emitted by biomass burning (VOCs and I/S/L-VOCs). The contributions of the different OAtot precursors from different simulations are compared. In the simulation Multstep-withVOC, the precursors are VOCs and I/S/L-VOCs with gaseous emissions estimated from POA and with ageing by the multi-step oxidation scheme. In the simulations OnestepISLVOC and MultstepISLVOC, the precursors are I/S/L-VOCs with gaseous emissions estimated from POA emissions and with ageing by the one-step and the multi-step oxidation schemes respectively. In the simulation Multstep-UnNMOG-withVOC, the precursors are VOCs and I/S/L-VOCs with gaseous emissions estimated from NMOG emissions and with ageing by the multi-step oxidation scheme.
The emissions of VOCs are lower than those of gaseous I/S/L-VOCs estimated from NMOG (or POA) emissions by almost a factor of about 2.5. This preponderance of I/S/L-VOCs is observed not only for emissions but also for concentrations. The primary and secondary OA concentrations from gaseous I/S/L-VOCs (estimated from NMOG emissions and from POA emissions) are about 10 times higher than the OA concentrations from VOCs. Most of the OA and OAtot concentrations are formed from I/S/L-VOCs (about 90 % and 75 % respectively). The OA concentrations are slightly higher (by about 10 %) when the gaseous I/S/L-VOCs are estimated from POA rather than from NMOG emissions. This difference corresponds to the difference observed in emissions (gaseous I/S/L-VOC emissions estimated from POA are slightly higher than those estimated from NMOG).
Across our cases, 28 % to 42 % of the OA concentrations from I/S/L-VOC emissions are primary. The amount of POA from I/S/L-VOC emissions in simulation OnestepISLVOC (28 %) is lower than the one in the simulation MultstepISLVOC (42 %) because of the differences in the volatility properties of the species in the two ageing schemes.
The OA concentrations simulated with the one-step and the multi-generational schemes are nearly similar (about 5 % difference). However, the primary and secondary OAvapor concentrations (the gas phase of OAtot concentrations) are lower with the multi-generational scheme because of fragmentation.
A large part of OAtot concentrations from VOCs (∼70 %) is in the gas phase. This suggests that the influence of the VOC emissions on particle OA concentrations could be larger if the surrogates from these VOC oxidations partition more easily to the particle phase. This could be the case if further ageing mechanisms are considered for these VOCs or if the particles are very viscous (Kim et al., 2019).
Using the SOA formation mechanism of naphthalene rather than the SOA formation mechanism of phenol affects the OAtot concentrations from VOCs slightly (∼3 %). Similar results are found when calculating the enthalpy of vaporization of the formed SOA with SIMPOL.1 instead of using a constant (ΔH=50 kJ mol−1). This shows that the SOA formation from VOCs is poorly sensitive to these parameters involved in the modeling of the VOCs ageing.
Figure 11 presents the contribution of VOCs to biomass-burning OA concentrations, as simulated by the simulation Multstep-withVOC. In agreement with the preponderance of the contribution of I/S/L-VOCs discussed above, the VOC contribution is between 10 % and 25 % in most of the Mediterranean where biomass-burning OA concentrations are above 1 µg m−3. A larger contribution of VOCs (reaching 30 %) is observed in the Balkans, where the biomass-burning OA concentrations are the highest, with a large fraction of temperate forests burning.
Figure 12 shows the distribution of the OA concentrations formed from the different VOCs emitted by wildfires in the simulation Multistep-withVOC over the subregion during the summer of 2007. The largest contribution comes from phenol, benzene and catechol. It represents about 47 % of the OA concentrations from VOCs and 40 % of the VOC emissions. The second-largest contribution comes from USC>6 compounds. It represents about 23 % of the OA concentrations from VOCs and 26 % of the VOC emissions. Toluene and xylene, which were taken into account in the previous version of the model, have a high yield compared to other VOCs. They make about 12 % of the OA concentrations from VOCs, whereas their emissions represent about 9 % of the VOC emissions. Furan, which makes about 5 % of VOC emissions, does not contribute to OA concentrations (contribution lower than 1 %). Cresol contributes equally to VOC emissions and SOA concentrations (about 7 %). Syringol, which contributes to only 4 % of VOC emissions, contributes to about 6 % of the OA concentrations. The other VOCs (naphthalene, methylnaphthalene and guaiacol) have a low contribution (equal to or lower than 3 %).
6.2 Sensitivity of PM2.5 concentrations
To assess the sensitivity of PM2.5 concentrations to VOCs and gaseous I/S/L-VOCs and parameters related to their emissions or ageing, differences of PM2.5 concentrations among the sensitivity simulations are compared. The sensitivity to the gaseous I/S/L-VOC ageing scheme is assessed by computing relative differences between the simulations OnestepISLVOC and MultstepISLVOC. The sensitivity to the gaseous I/S/L-VOC emissions is assessed by computing the relative difference between the simulations Multstep-withVOC and Multstep-UnNMOG-withVOC. The sensitivity to the VOC emissions is assessed by computing the relative difference between the simulations Multstep-withVOC and MultstepISLVOC.
Figure 13 shows the average PM2.5 concentrations as well as relative differences of PM2.5 concentrations among the sensitivity simulations. The PM2.5 concentrations are especially high, with average concentrations above 20 µg m−3 where wildfires occur, especially in the Balkans and Greece. Majdi et al. (2019) studied the simulation OnestepISLVOC and found that comparing to PM2.5 observations, the model tends to underestimate PM2.5 concentrations ( %). Moreover, they highlighted that surface PM2.5 concentrations are sensitive to gaseous I/S/L-VOC emissions, and their impact on surface PM2.5 concentrations over the fire regions can reach 10 %–20 % in the fire plume and 30 % locally.
Concerning the influence of the gaseous I/S/L-VOC ageing scheme, the relative differences between the simulations OnestepISLVOC and MultstepISLVOC are low (below 5 %). The differences can be positive or negative because the one-step oxidation scheme and the multi-step oxidation schemes lead to SOA of different volatilities. The sign of the differences depends on the SOA volatilities and on the partitioning between the gas and the particle phases of I/S/L-VOCs, which itself depends on PM2.5 concentrations. The comparison of the relative difference of PM2.5 concentrations between the simulations OnestepISLVOC and MultstepISLVOC (Fig. 13a) and the daily mean PM2.5 concentrations (Fig. 13d) shows that the differences tend to be positive (higher concentrations with multi-generational ageing than with one-step ageing) in the regions of strong fires where PM2.5 concentrations are high and negative in the fire plume where PM2.5 concentrations are lower.
The emissions of the added VOCs (namely benzene, phenol, cresol, catechol, furan, guaiacol, syringol, naphthalene, methylnaphthalene, and the structurally assigned and unassigned compounds with at least six carbon atoms per molecule (USC>6) lead to a moderate increase in PM2.5 concentrations (up to 25 % in the Balkans; Fig. 13b). PM2.5 concentrations are more sensitive to the parameterization used to estimate the gaseous I/S/L-VOC emissions.
Estimating the gaseous I/S/L-VOC emissions from POA rather than from NMOG results in higher local PM2.5 concentrations (+8 % to +16 % in Greece) and lower PM2.5 concentrations mainly in the Balkans (−30 %) and in the fire plume that is visually determined (−8 % to −16 %). The larger fraction of PM2.5 concentrations is shown in the Balkans, where the gaseous I/S/L-VOC emissions from NMOG are higher than those emitted from POA. This is explained by differences in NMOG and POA emissions. Figure 14 shows daily mean emissions of POA and NMOG from wildfires during the summer of 2007. The main differences between POA and NMOG emissions are located in the Balkans, where the largest fraction of burned temperate forest is observed. In Akagi et al. (2011), the emission factor of POA is unavailable for temperate forest. This may be explained by the lower POA emissions in the Balkans.
This study quantified the relative contribution of OAtot precursors (VOCs and I/S/L-VOCs) emitted by wildfires to OA formation and particle concentrations during the summer of 2007 over the Euro-Mediterranean region. A new chemical mechanism H2Oaro was developed to represent the SOA formation from selected VOCs, namely toluene, xylene, benzene, phenol, cresol, catechol, furan, guaiacol, syringol, naphthalene, methylnaphthalene, and the structurally assigned and unassigned compounds with at least six carbon atoms per molecule (USC>6), based on smog chamber experiments under low- and high-NOx conditions. This mechanism was implemented in the chemistry transport model Polair3D of the air-quality platform Polyphemus. Over the Euro-Mediterranean area, the OA concentrations emitted by wildfires originate mostly from I/S/L-VOCs. The OA concentrations from gaseous I/S/L-VOCs are about 10 times higher than the OA concentrations from VOCs. However, the contribution of the oxidation of VOCs to the OA concentrations is locally significant (it reaches 30 % in the area close to where wildfires are emitted and 20 % in the fire plume). Air-quality models often represent SOA formation from only a few VOCs, such as toluene and xylene. This study points out the need to consider the contribution of a variety of VOCs, namely, phenol, benzene, catechol, cresol, xylene, toluene and syringol, when modeling SOA formation from wildfires. The contribution of these VOCs may even be underestimated here for two reasons. First, the yields from smoke chamber experiments were not corrected for wall losses, and they may therefore be underestimated, leading to an underestimation of the SOA formation from VOCs in the model. Second, a large part of OA concentrations from VOCs is in the gas phase (∼70 %). This suggests that the influence of the VOC emissions on OA concentrations could be larger if the surrogates from these VOC oxidations partition more easily to the particle phase. This could be the case if further ageing mechanisms are considered for these VOCs or if the particles are very viscous (Kim et al., 2019). Emissions of gaseous I/S/L-VOCs are a large source of uncertainties. However, similar estimates were obtained here by using, as a proxy, POA emissions (with a factor of 1.5) or NMOG emissions (with a factor of 0.36). Sensitivity simulations were performed to quantify the uncertainties in OA and PM2.5 concentrations linked to I/S/L-VOC emissions and chemical evolution (ageing). They are found to be lower than the uncertainties associated with SOA formation from VOC emissions. This stresses the need to consider a variety of VOCs in SOA formation model and to better characterize their emission factors.
Data can be requested from the corresponding author (marwa.majdi@enpc.fr).
Table A1The VOCs that are SOA precursors and their emission factors (EFs) and SOA yields. EFs from Akagi et al. (2011) are in regular font, ERs from Stockwell et al. (2015) are in italic font, and EFs in bold font are deduced from the assumption considering that temperate forest and savanna have the same EF as chaparral.
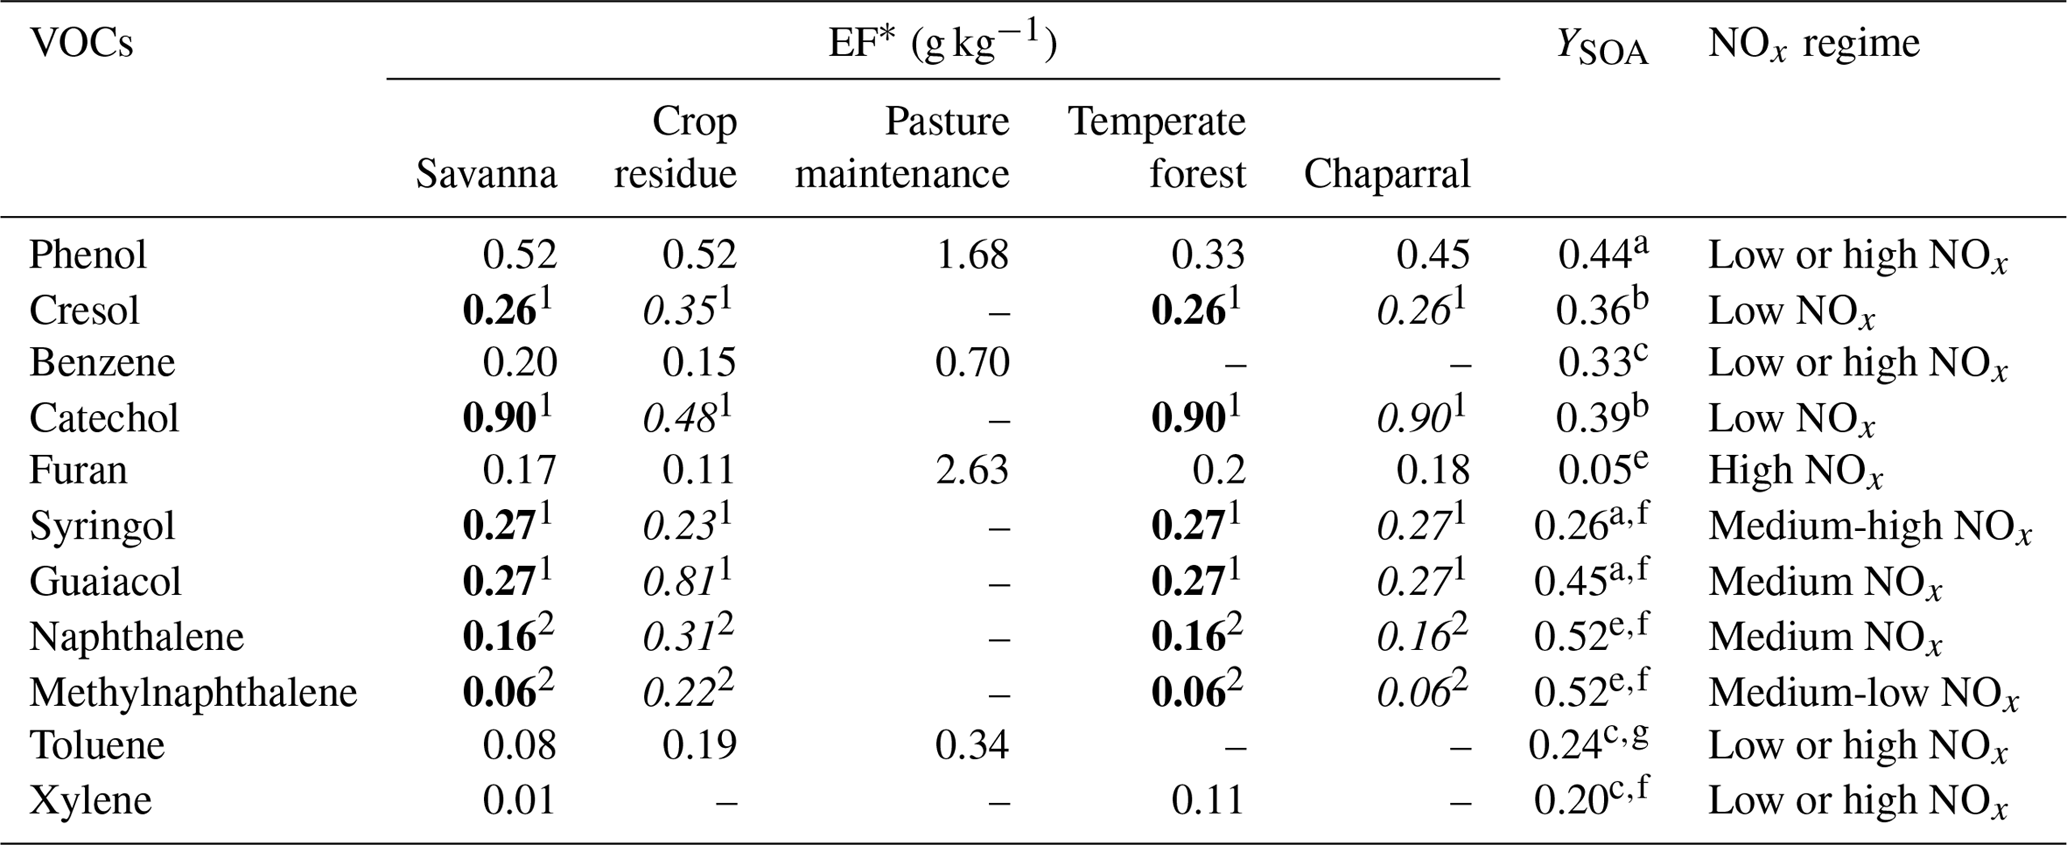
a Yee et al. (2013). b Nakao et al. (2011). c Ng et al. (2007). d Gómez et al. (2008). e Chan et al. (2009). f Chhabra et al. (2011). g Hildebrandt et al. (2009). 1 Emission ratio (ER) of the VOC to phenol from Stockwell et al. (2015). 2 Emission ratio of the VOC to benzene from Stockwell et al. (2015).
Table B1Properties of the compounds added to the model.

a Molar weight (g mol−1). b Enthalpy of vaporization (kJ mol−1). c Saturation vapor pressure (torr). d Partitioning constant (m3 g−1). e Henry's law constant (M atm−1).
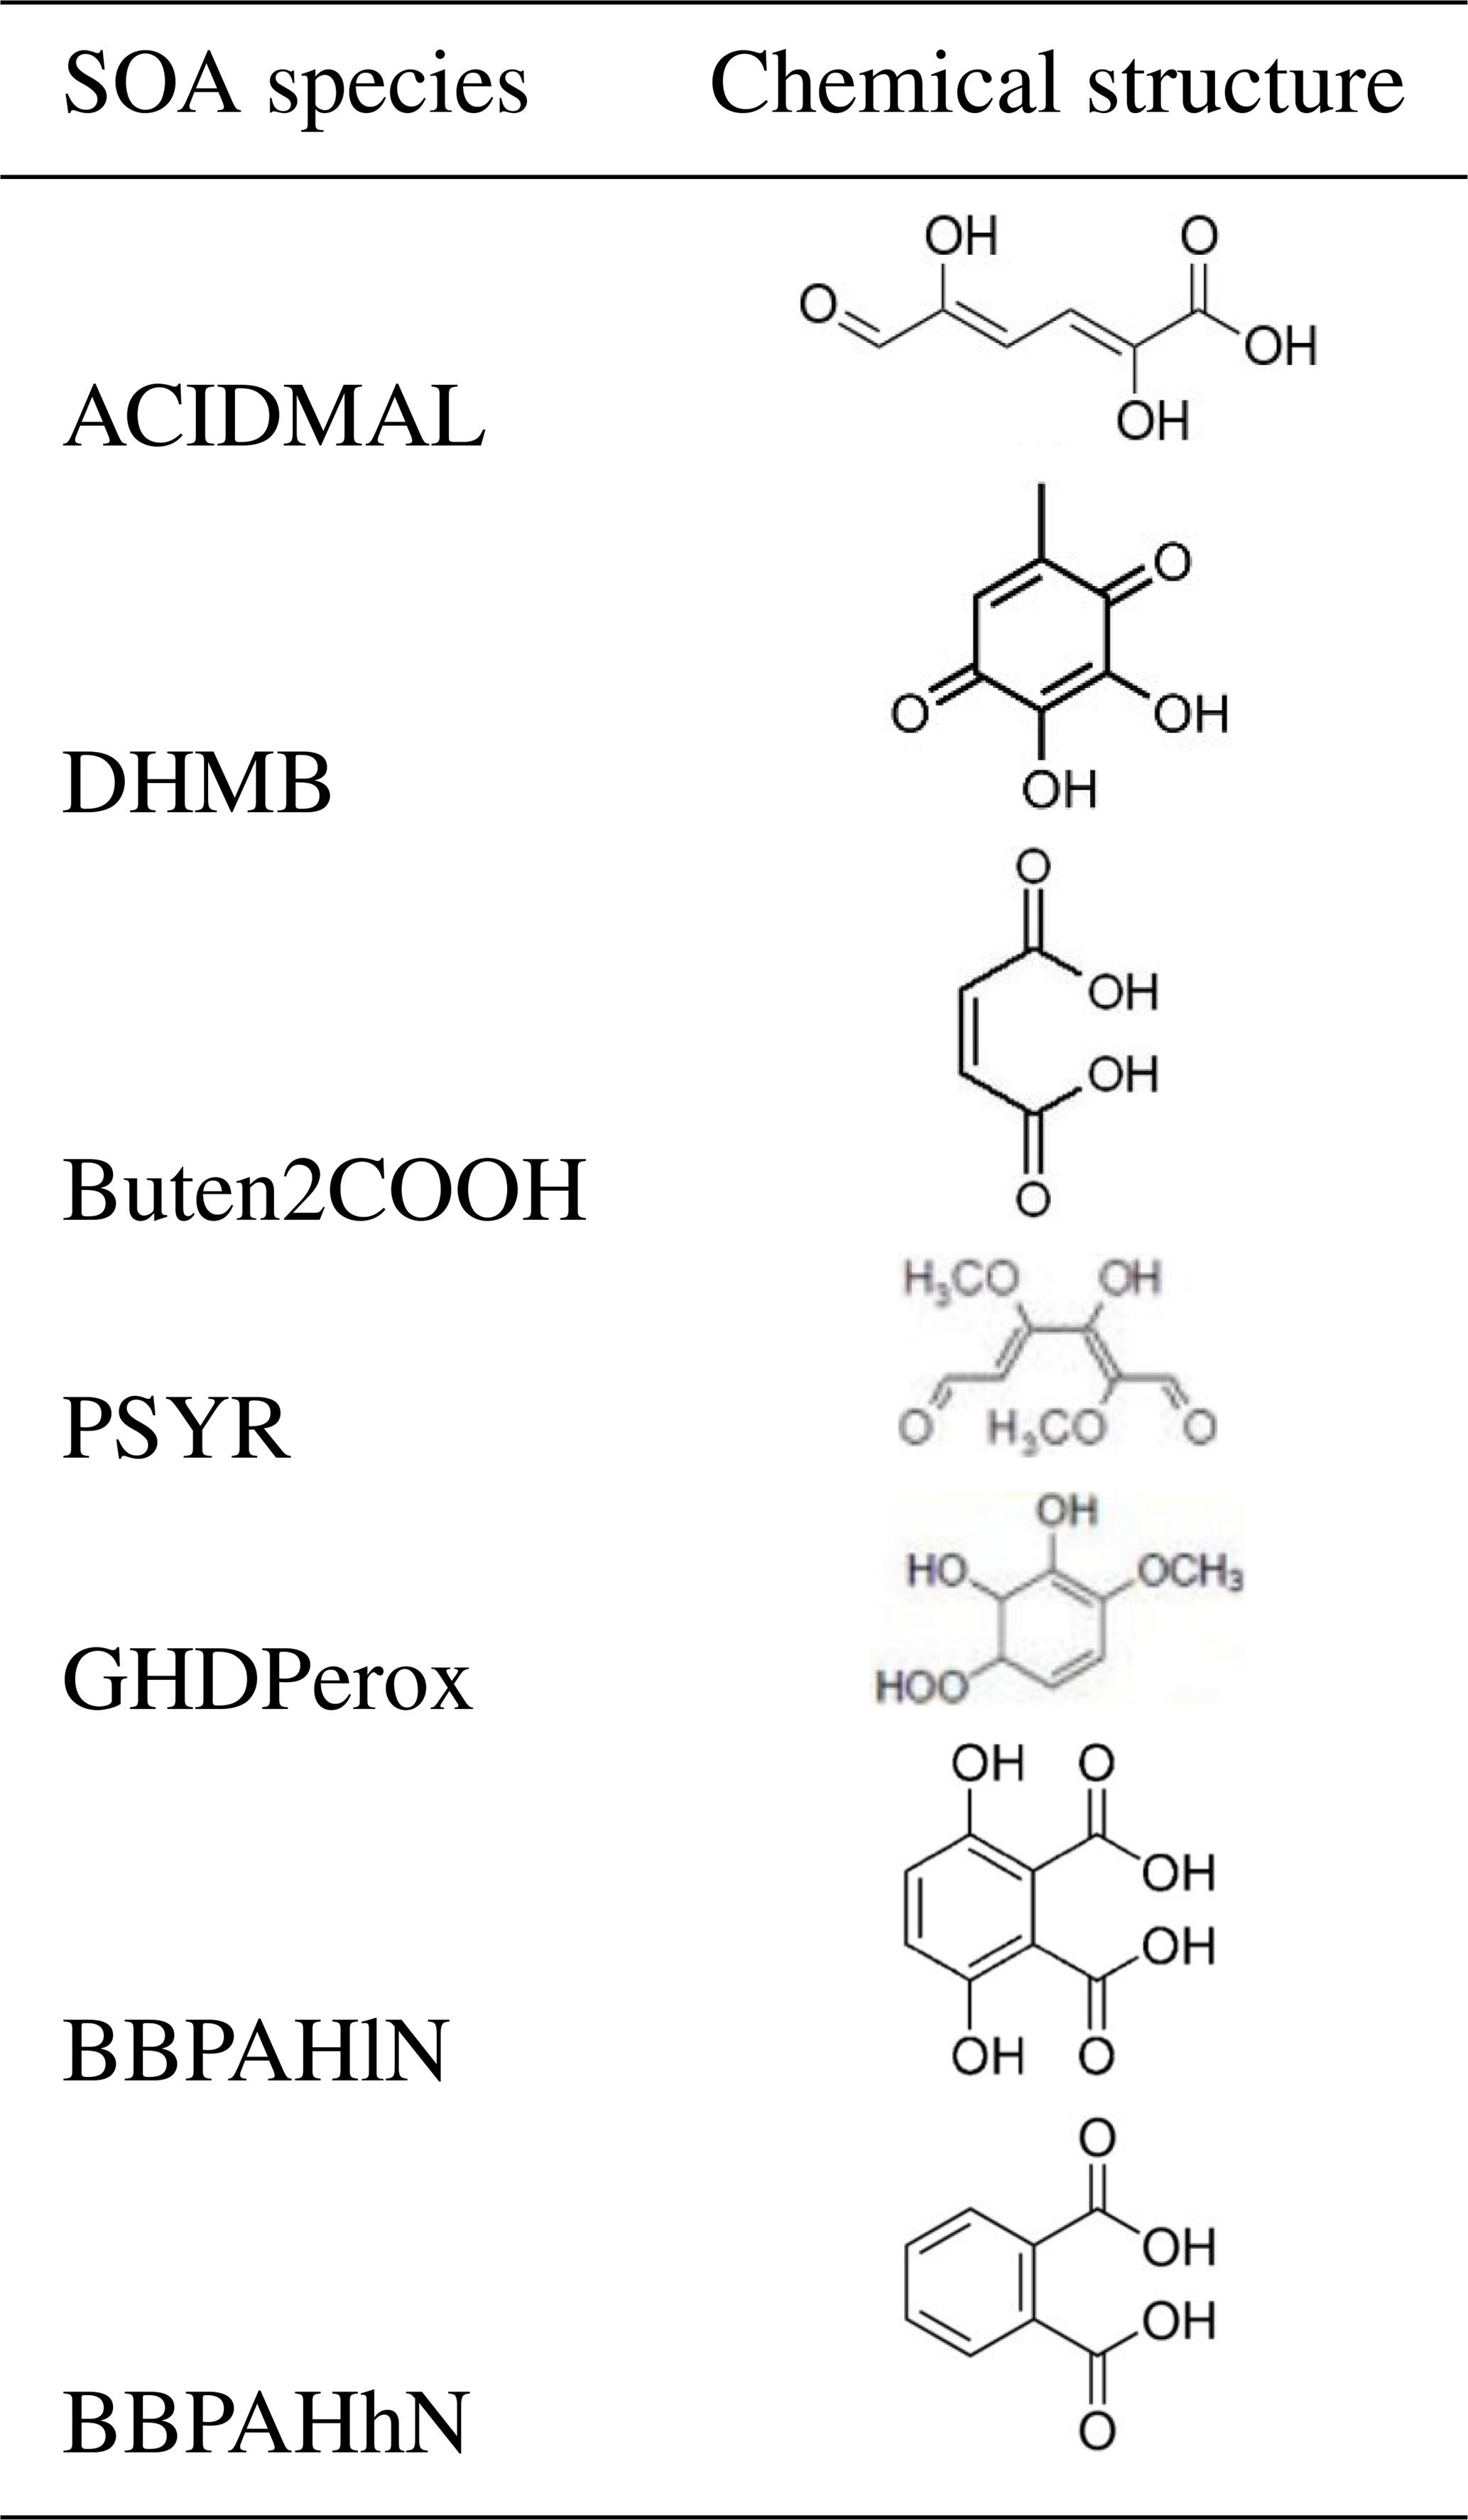
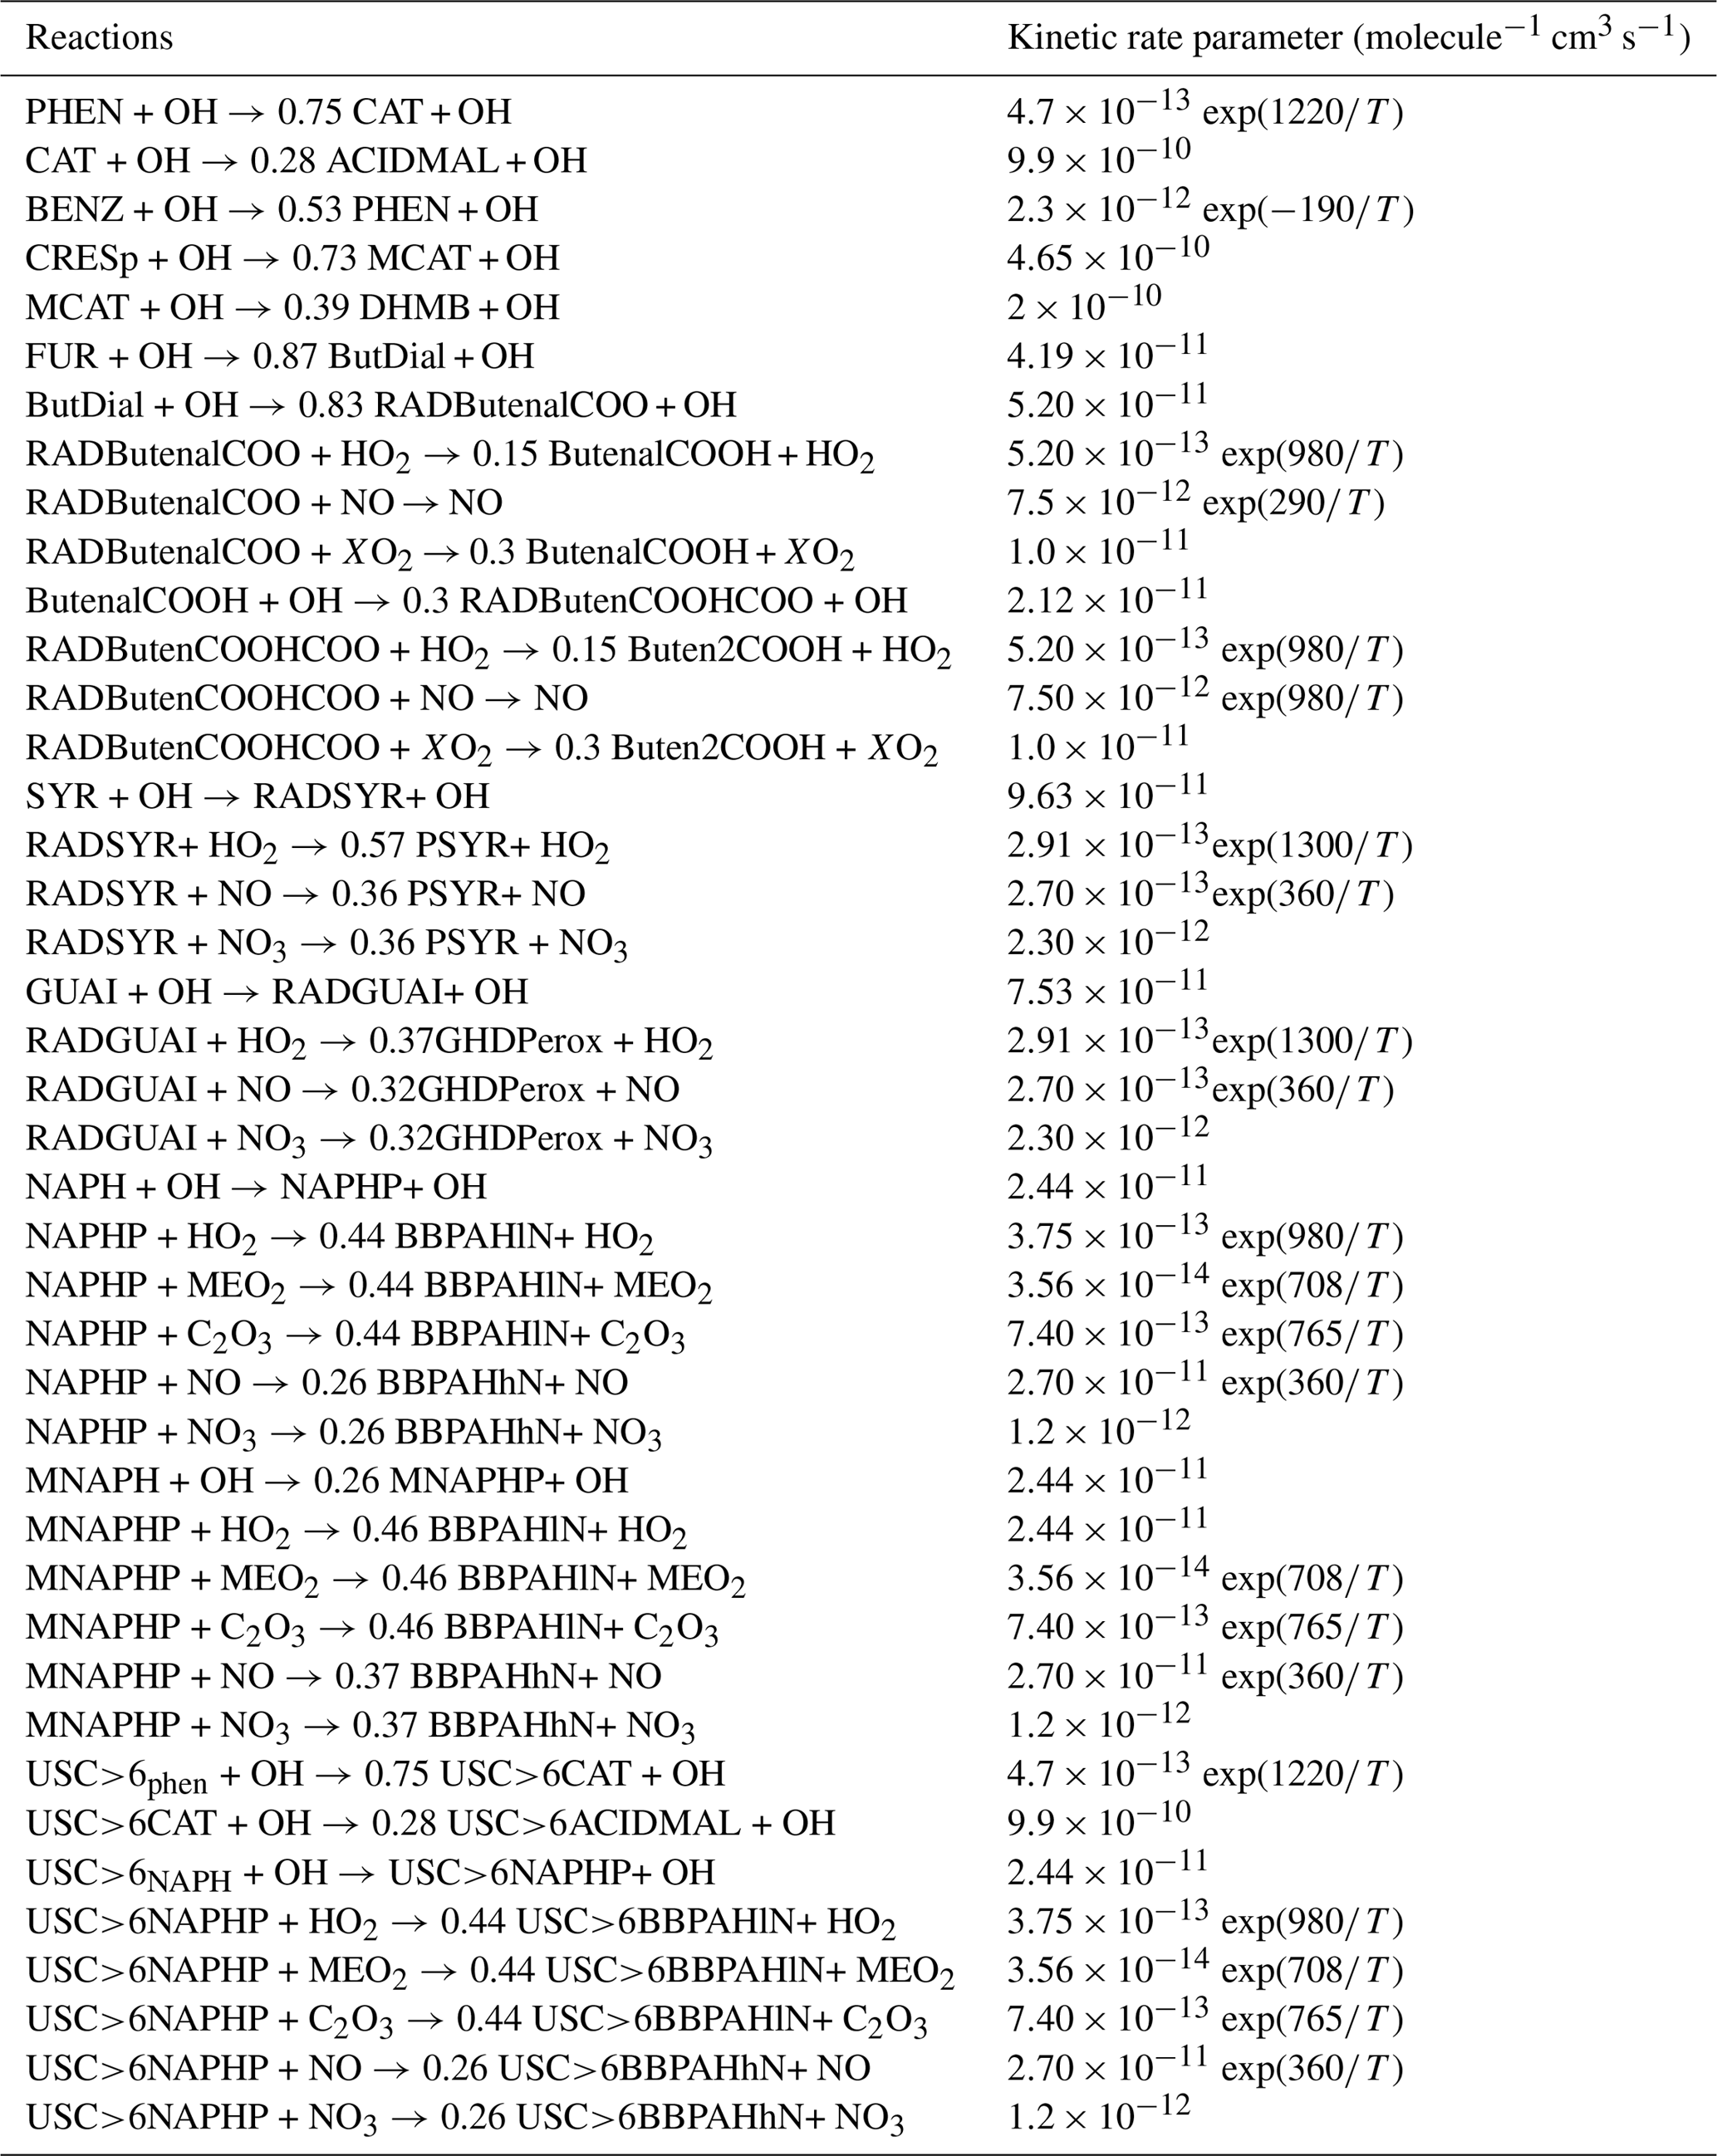
Table C1Ageing mechanism of I/S/L-VOCs using Couvidat approach (Couvidat et al., 2012).
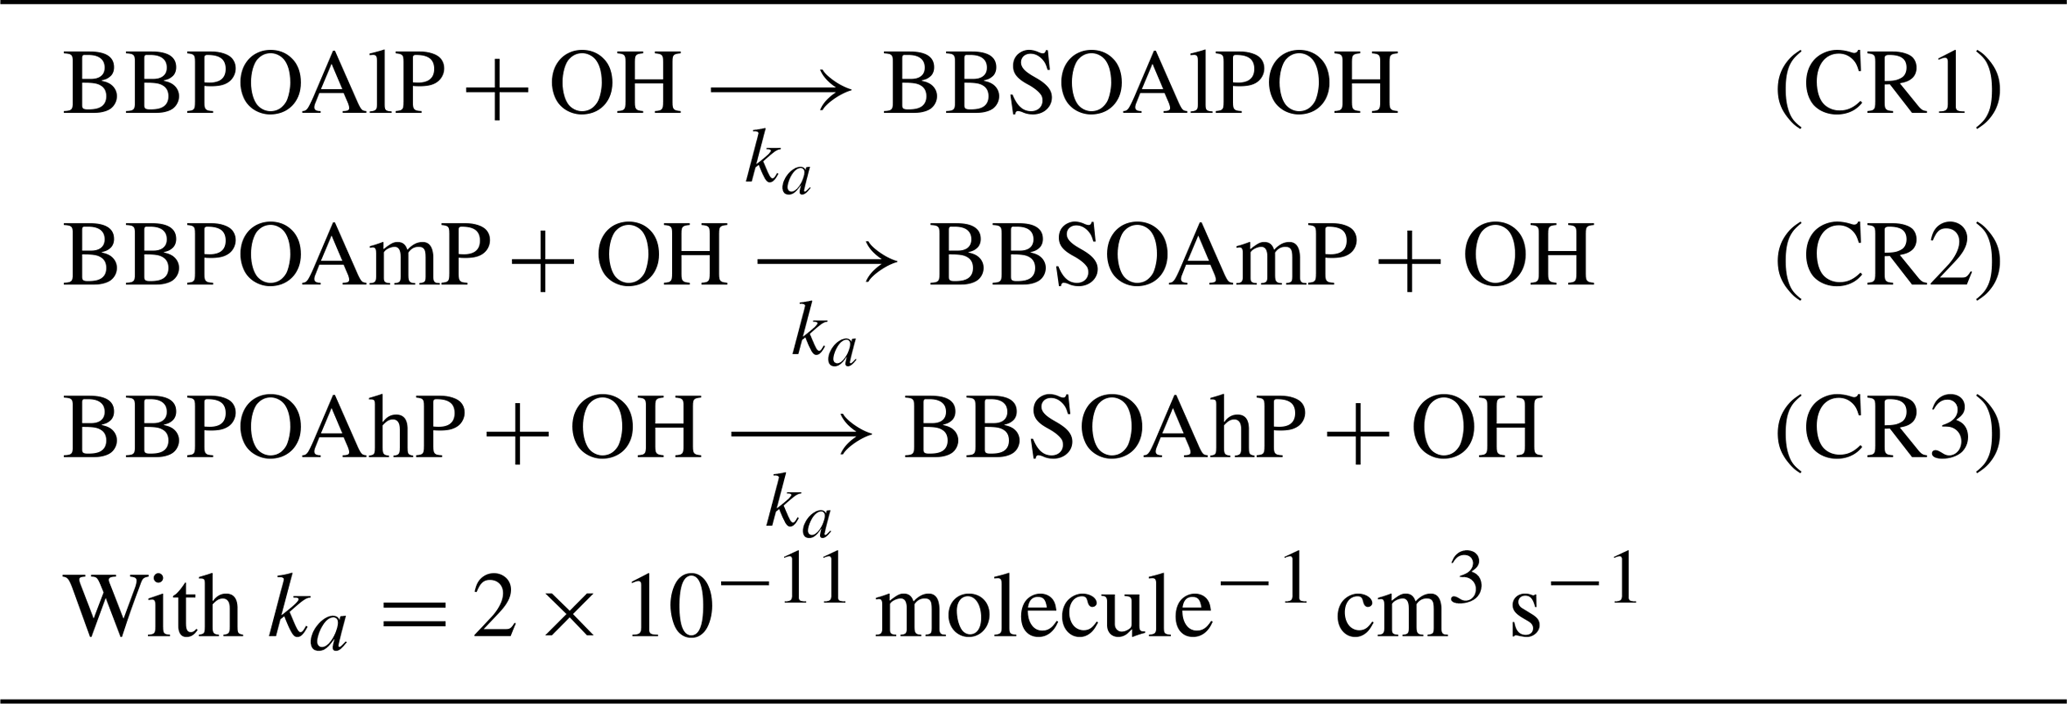

Table D1Ageing mechanism of I/S/L-VOCs using Ciarelli approach (Ciarelli et al., 2017).
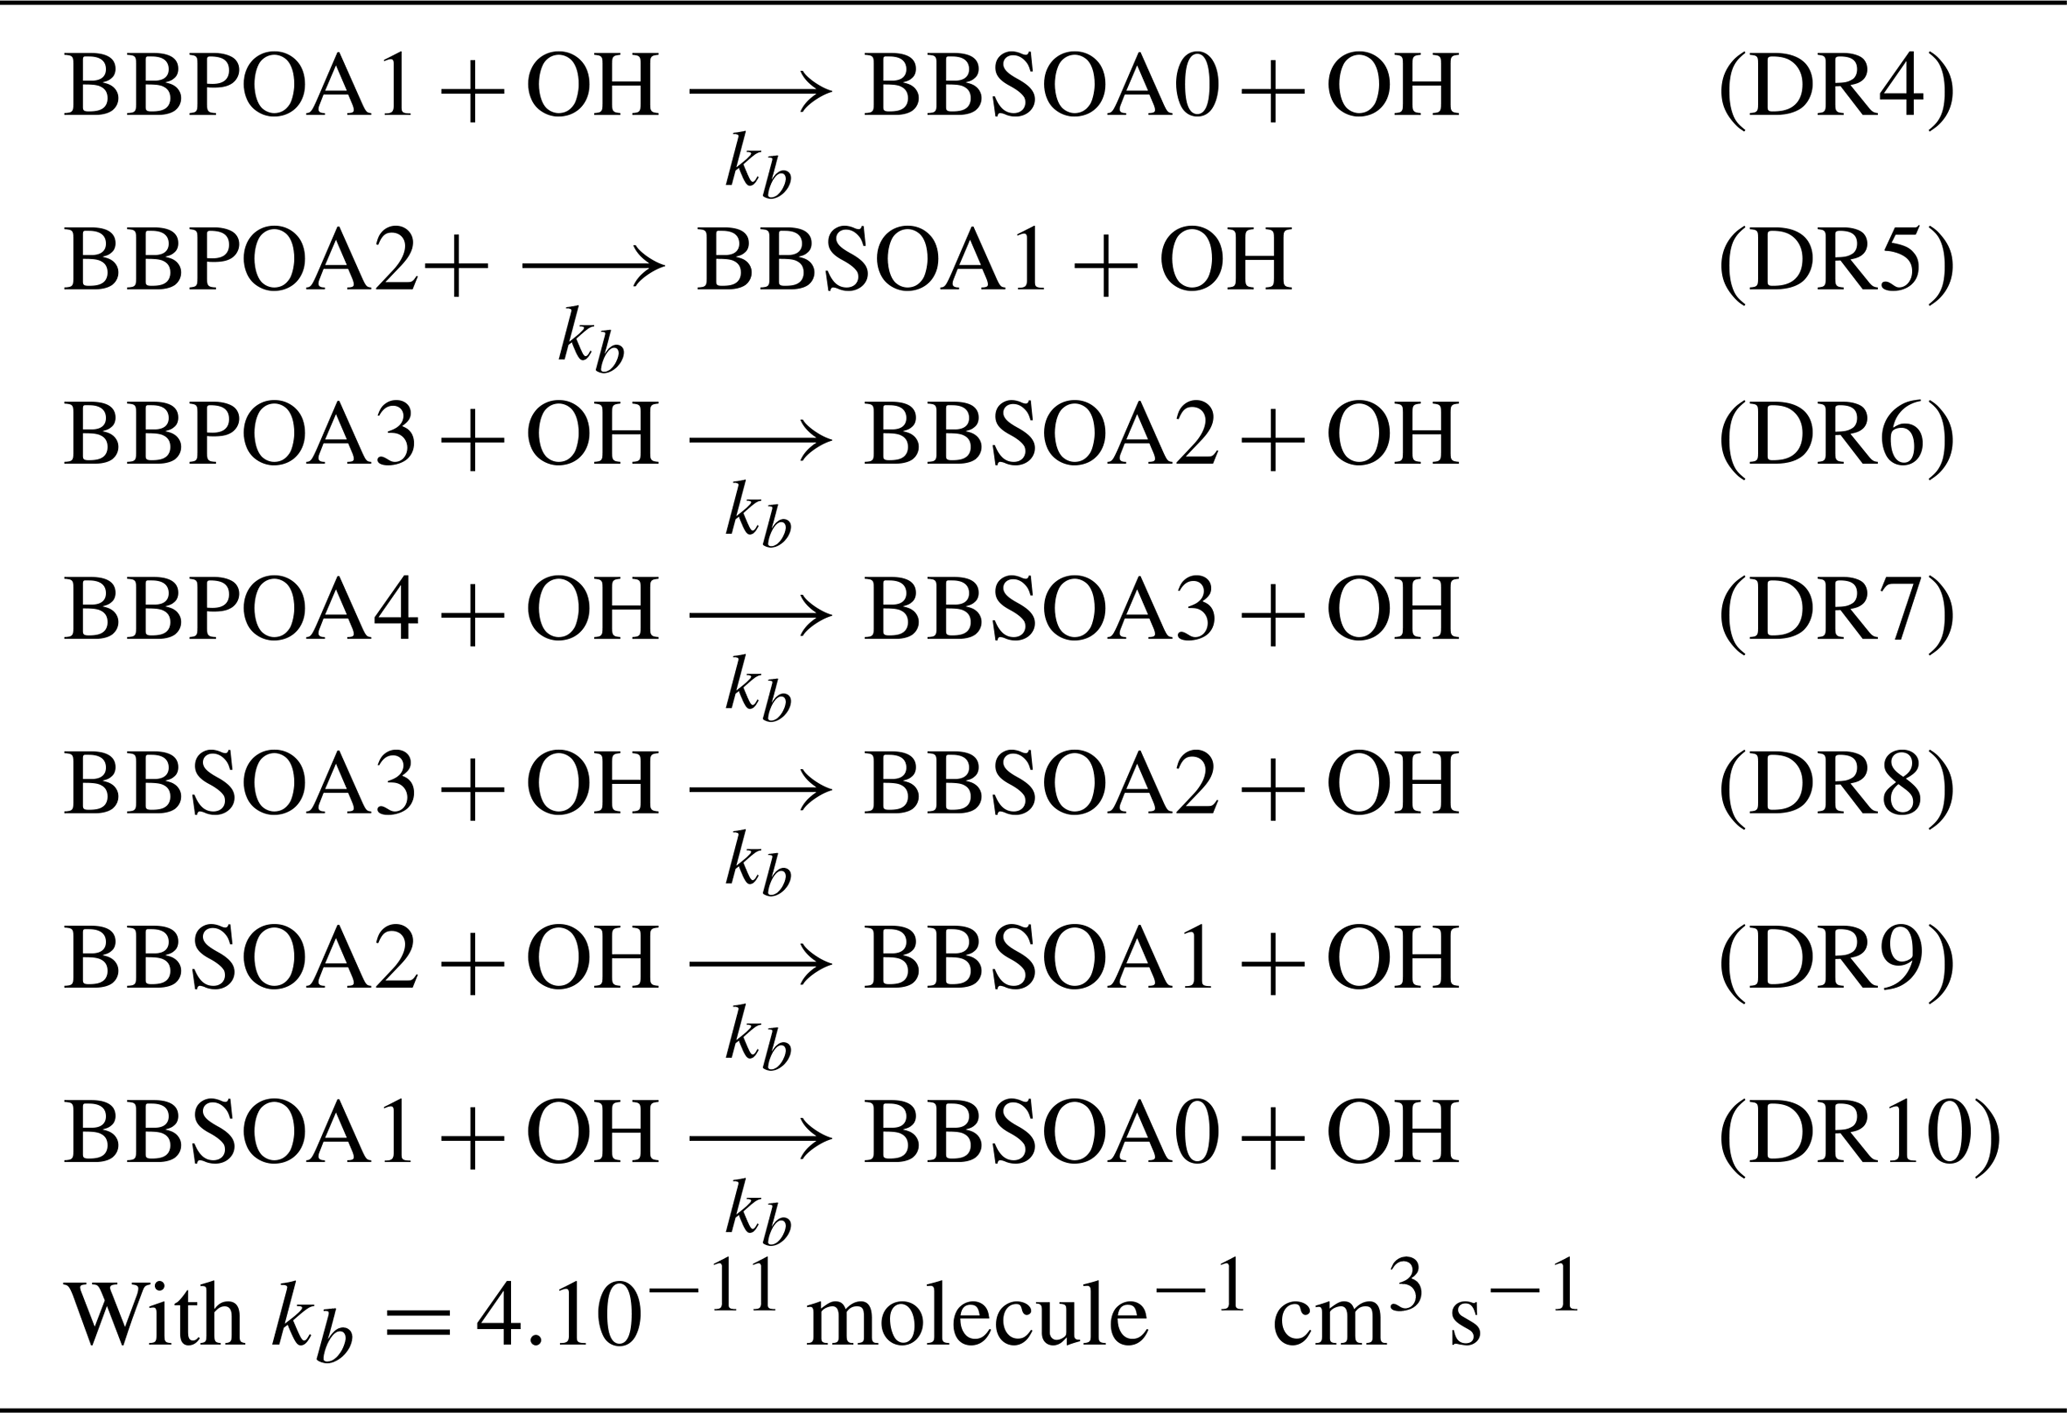
Table D2Properties of the VBS species (primary and secondary I/S/L-VOCs).
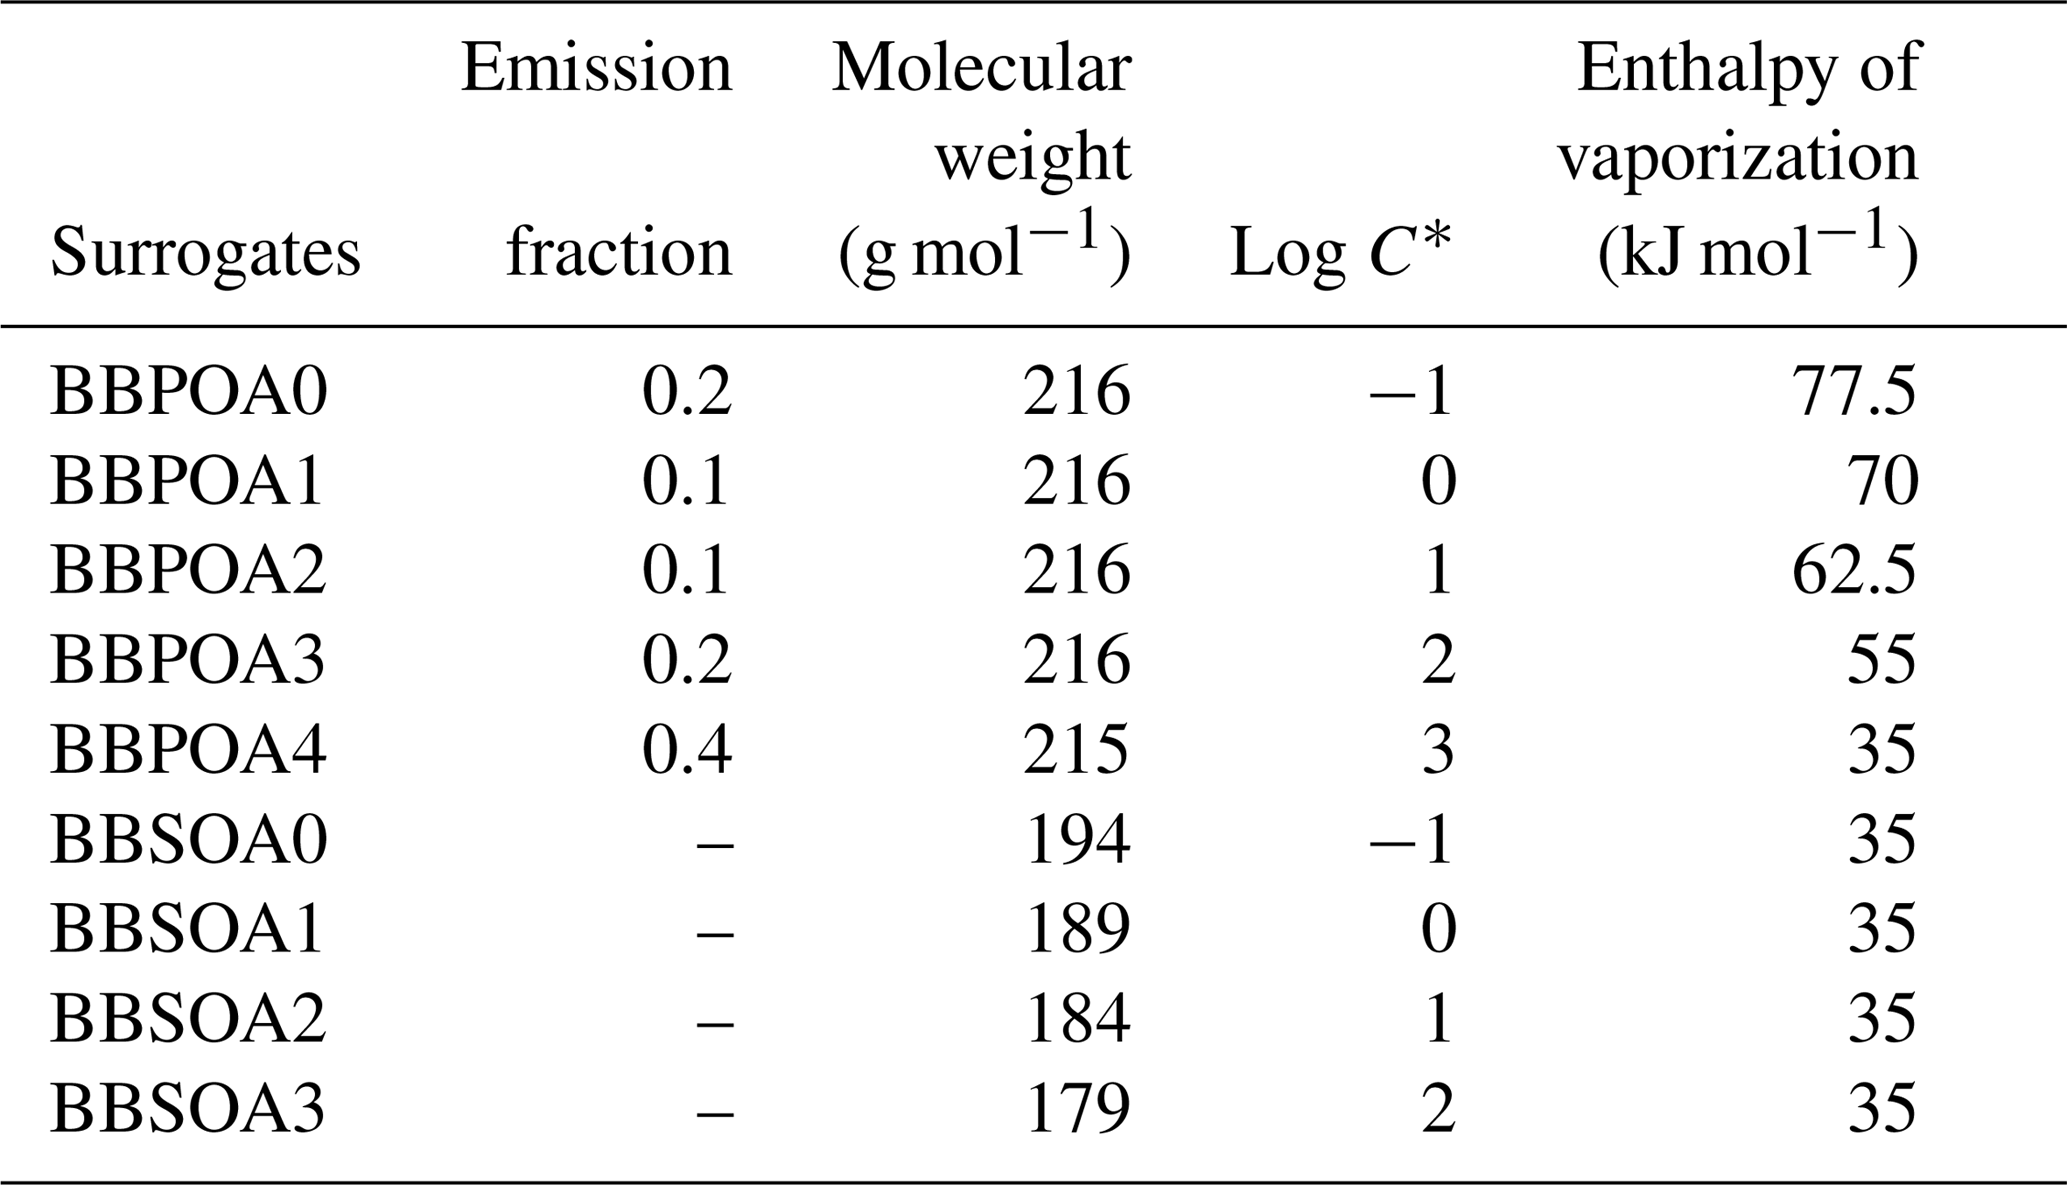
Table E1Summary of the parameters used to compute the dry-deposition velocities of the gaseous I/S/L-VOCs.
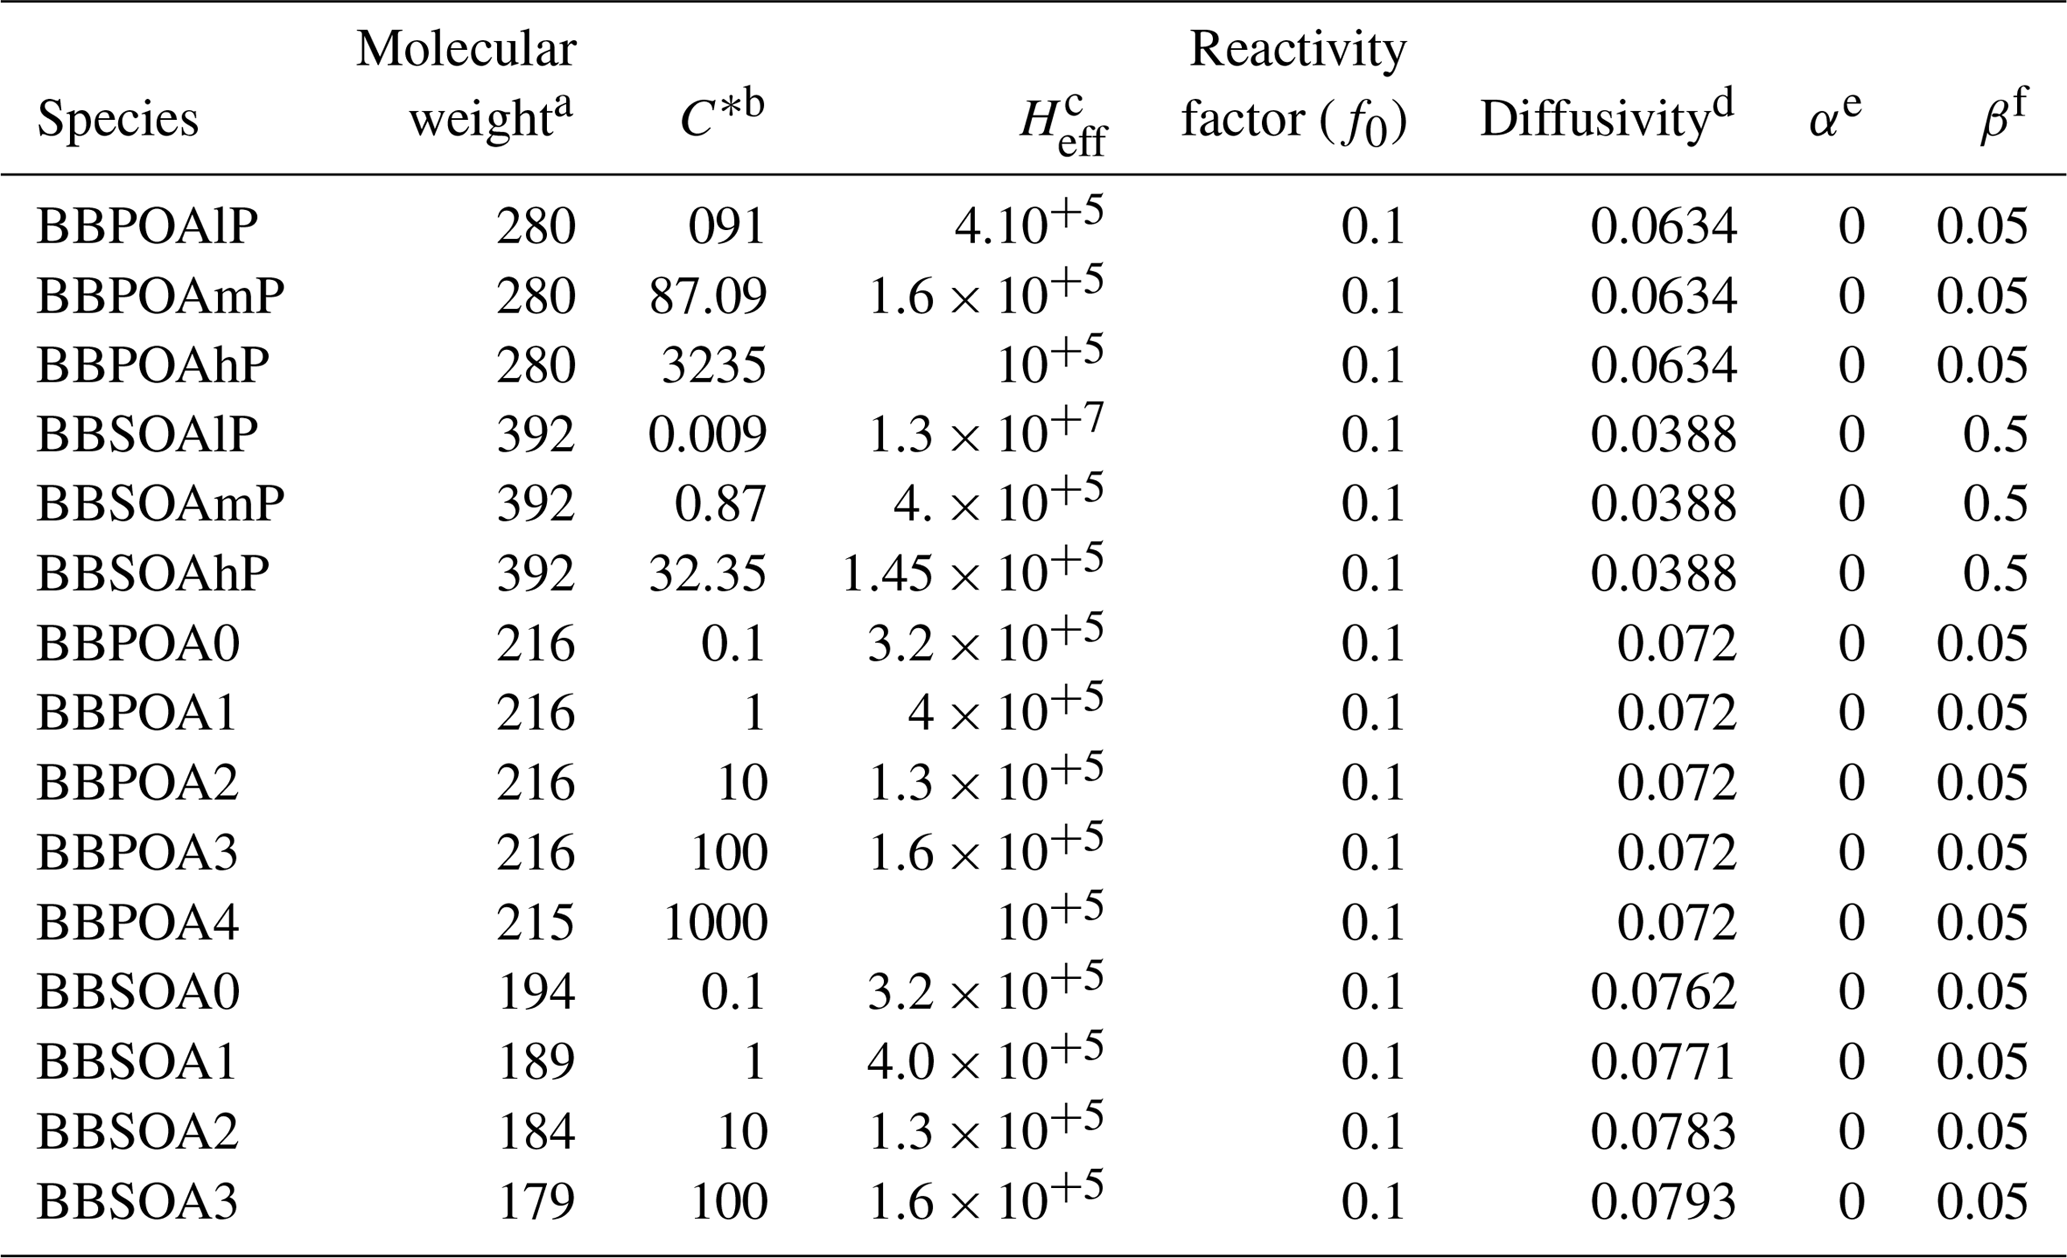
a Molar weight (g mol−1). b Saturation concentration (µg m−3). c Effective Henry constant (M atm−1). d Diffusivity (cm−2 s−1). e Parameter for cuticle and soil resistance scaling to SO2. f Parameter for cuticle and soil resistance scaling to O3.
MM, KS, GL and FC developed the chemical mechanisms. ST and MM prepared VOC emissions from fires. MM performed the simulations, with help from MC and KS for the post-processing. MM, KS and GL prepared the paper with contributions from all co-authors.
The authors declare that they have no conflict of interest.
CEREA is a member of the Institut Pierre-Simon Laplace (IPSL). A PhD grant from École des Ponts ParisTech partially funded this research.
This paper was edited by Alma Hodzic and reviewed by two anonymous referees.
Akagi, S. K., Yokelson, R. J., Wiedinmyer, C., Alvarado, M. J., Reid, J. S., Karl, T., Crounse, J. D., and Wennberg, P. O.: Emission factors for open and domestic biomass burning for use in atmospheric models, Atmos. Chem. Phys., 11, 4039–4072, https://doi.org/10.5194/acp-11-4039-2011, 2011. a, b, c, d, e, f, g, h, i, j, k, l, m
Alvarado, M. and Prinn, R.: Formation of ozone and growth of aerosols in young smoke plumes from biomass burning: Three-dimensional Eulerian studies, J. Geophys. Res.-Atmos., 114, D09306, https://doi.org/10.1029/2008JD011144, 2009. a
Alvarado, M. J., Lonsdale, C. R., Yokelson, R. J., Akagi, S. K., Coe, H., Craven, J. S., Fischer, E. V., McMeeking, G. R., Seinfeld, J. H., Soni, T., Taylor, J. W., Weise, D. R., and Wold, C. E.: Investigating the links between ozone and organic aerosol chemistry in a biomass burning plume from a prescribed fire in California chaparral, Atmos. Chem. Phys., 15, 6667–6688, https://doi.org/10.5194/acp-15-6667-2015, 2015. a
Alves, C., Vicente, A., Nunes, T., Gonçalves, C., Fernandes, A., Mirante, F., Tarelho, L., Sanchez de la Campa, A., Querol, X., Caseiro, A., Monteiro, C., Evtyugina, M., and Pio, C.: Summer 2009 wildfires in Portugal: emission of trace gases and aerosol composition, Atmos. Environ., 45, 641–649, https://doi.org/10.1016/j.atmosenv.2010.10.031, 2011. a
Appel, K. W., Napelenok, S. L., Foley, K. M., Pye, H. O. T., Hogrefe, C., Luecken, D. J., Bash, J. O., Roselle, S. J., Pleim, J. E., Foroutan, H., Hutzell, W. T., Pouliot, G. A., Sarwar, G., Fahey, K. M., Gantt, B., Gilliam, R. C., Heath, N. K., Kang, D., Mathur, R., Schwede, D. B., Spero, T. L., Wong, D. C., and Young, J. O.: Description and evaluation of the Community Multiscale Air Quality (CMAQ) modeling system version 5.1, Geosci. Model Dev., 10, 1703–1732, https://doi.org/10.5194/gmd-10-1703-2017, 2017. a
Atinkson, R. and Arey, J.: Atmospheric Degradation of Volatile Organic Compounds, Chem. Rev., 103, 4605–4638, https://doi.org/10.1021/cr0206420, 2003. a
Aumont, B., Szopa, S., and Madronich, S.: Modelling the evolution of organic carbon during its gas-phase tropospheric oxidation: development of an explicit model based on a self generating approach, Atmos. Chem. Phys., 5, 2497–2517, https://doi.org/10.5194/acp-5-2497-2005, 2005. a
Bessagnet, B., Menut, L., Aymoz, G., Chepfer, H., and Vautard, R.: Modeling dust emissions and transport within Europe: the Ukraine March 2007 event, J. Geophys. Res., 113, D15202, https://doi.org/10.1029/2007JD009541, 2008. a
Bian, Q., Jathar, S. H., Kodros, J. K., Barsanti, K. C., Hatch, L. E., May, A. A., Kreidenweis, S. M., and Pierce, J. R.: Secondary organic aerosol formation in biomass-burning plumes: theoretical analysis of lab studies and ambient plumes, Atmos. Chem. Phys., 17, 5459–5475, https://doi.org/10.5194/acp-17-5459-2017, 2017. a, b, c
Bond, T. C., Doherty, S. J., Fahey, D. W., Forster, P. M., Berntsen, T., DeAngelo, B. J., Flanner, M. G., Ghan, S., Kärcher, B., Koch, D., Kinne, S., Kondo, Y., Quinn, P. K., Sarofim, M. C., Schultz, M. G., Schulz, M., Venkataraman, C., Zhang, H., Zhang, S., Bellouin, N., Guttikunda, S. K., Hopke, P. K., Jacobson, M. Z., Kaiser, J. W., Klimont, Z., Lohmann, U., Schwarz, J. P., Shindell, D., Storelvmo, T., Warren, S. G., and Zender, C. S.: Bounding the role of black carbon in the climate system: A scientific assessment, J. Geophys. Res.-Atmos., 118, 5380–5552, https://doi.org/10.1002/jgrd.50171, 2013. a
Briant, R., Tuccella, P., Deroubaix, A., Khvorostyanov, D., Menut, L., Mailler, S., and Turquety, S.: Aerosol-radiation interaction modelling using online coupling between the WRF 3.7.1 meteorological model and the CHIMERE 2016 chemistry-transport model, through the OASIS3-MCT coupler, Geosci. Model Dev., 10, 927–944, https://doi.org/10.5194/gmd-10-927-2017, 2017. a
Bruns, E., El Haddad, I., Slowik, J., Kilic, D., Klein, F., Baltensperger, U., and Prévôt, A.: Identification of significant precursor gases of secondary organic aerosols from residential wood combustion, Sci. Rep., https://doi.org/10.1038/srep27881, 2016. a, b, c, d, e, f
Calvert, J., Atkinson, R., Becker, K., Kamens, R., Seinfeld, J., Wallington, T., and Yarwood, G.: The Mechanisms of Atmospheric Oxidation of Aromatic Hydrocarbons, Oxford University Press, 2002. a
Carlton, A., Pinder, R., Bhave, P., and Pouliot, G.: What extent can biogenic SOA be controlled, Environ. Sci. Techno., 9, 3376–3380, https://doi.org/10.1021/es903506b, 2010. a
Chan, A. W. H., Kautzman, K. E., Chhabra, P. S., Surratt, J. D., Chan, M. N., Crounse, J. D., Kürten, A., Wennberg, P. O., Flagan, R. C., and Seinfeld, J. H.: Secondary organic aerosol formation from photooxidation of naphthalene and alkylnaphthalenes: implications for oxidation of intermediate volatility organic compounds (IVOCs), Atmos. Chem. Phys., 9, 3049–3060, https://doi.org/10.5194/acp-9-3049-2009, 2009. a, b
Chhabra, P. S., Ng, N. L., Canagaratna, M. R., Corrigan, A. L., Russell, L. M., Worsnop, D. R., Flagan, R. C., and Seinfeld, J. H.: Elemental composition and oxidation of chamber organic aerosol, Atmos. Chem. Phys., 11, 8827–8845, https://doi.org/10.5194/acp-11-8827-2011, 2011. a, b, c, d, e, f, g, h, i, j
Chrit, M., Sartelet, K., Sciare, J., Pey, J., Marchand, N., Couvidat, F., Sellegri, K., and Beekmann, M.: Modelling organic aerosol concentrations and properties during ChArMEx summer campaigns of 2012 and 2013 in the western Mediterranean region, Atmos. Chem. Phys., 17, 12509–12531, https://doi.org/10.5194/acp-17-12509-2017, 2017. a
Ciarelli, G., El Haddad, I., Bruns, E., Aksoyoglu, S., Möhler, O., Baltensperger, U., and Prévôt, A. S. H.: Constraining a hybrid volatility basis-set model for aging of wood-burning emissions using smog chamber experiments: a box-model study based on the VBS scheme of the CAMx model (v5.40), Geosci. Model Dev., 10, 2303–2320, https://doi.org/10.5194/gmd-10-2303-2017, 2017. a, b, c, d, e, f, g, h
Ciccioli, P., Centritto, M., and Loreto, F.: Biogenic volatile organic compound emissions from vegetation fires, Plant Cell Environ., 37, 1810–1825, https://doi.org/10.1111/pce.12336, 2014. a
Coeur-Tourneur, C., Cassez, A., and Wenger, J. C.: Rate coefficients for the gas-phase reaction of hydroxyl radicals with 2-Methoxyphenol (guaiacol) and related compounds, J. Phys. Chem. A., 114, 11645–11650, https://doi.org/10.1021/jp1071023, 2010a. a
Couvidat, F. and Sartelet, K.: The Secondary Organic Aerosol Processor (SOAP v1.0) model: a unified model with different ranges of complexity based on the molecular surrogate approach, Geosci. Model Dev., 8, 1111–1138, https://doi.org/10.5194/gmd-8-1111-2015, 2015. a
Couvidat, F., Debry, E., Sartelet, K., and Seigneur, C.: A hydrophilic/hydrophobic organic (H2O) aerosol model: Development,evaluation and sensitivity analysis, J. Geophys. Res., 117, D10304, https://doi.org/10.1029/2011JD017214, 2012. a, b, c, d, e, f, g, h, i, j
Couvidat, F., Kim, Y., Sartelet, K., Seigneur, C., Marchand, N., and Sciare, J.: Modeling secondary organic aerosol in an urban area: application to Paris, France, Atmos. Chem. Phys., 13, 983–996, https://doi.org/10.5194/acp-13-983-2013, 2013. a, b
Dawson, M. L., Xu, J., Griffin, R. J., and Dabdub, D.: Development of aroCACM/MPMPO 1.0: a model to simulate secondary organic aerosol from aromatic precursors in regional models, Geosci. Model Dev., 9, 2143–2151, https://doi.org/10.5194/gmd-9-2143-2016, 2016. a
Debry, E., Fahey, K., Sartelet, K., Sportisse, B., and Tombette, M.: Technical Note: A new SIze REsolved Aerosol Model (SIREAM), Atmos. Chem. Phys., 7, 1537–1547, https://doi.org/10.5194/acp-7-1537-2007, 2007. a
Donahue, N., Hartz, K., Chuong, B., Presto, A., Stanier, C., Rosenhorn, T., Robinson, A., and Pandis, S.: Critical factors determining the variation in SOA yields from terpene ozonolysis: a combined experimental and computational study, Farady Discuss., 130, 295–309, https://doi.org/10.1039/B417369D, 2005. a, b
Donahue, N. M., Robinson, A. L., Stanier, C. O., and Pandis, S. N.: Coupled partitioning, dilution and chemical aging of semivolatile organics, Environ. Sci. Technol., 40, 2635–2643, https://doi.org/10.1021/es052297c, 2006. a, b
Donahue, N. M., Epstein, S. A., Pandis, S. N., and Robinson, A. L.: A two-dimensional volatility basis set: 1. organic-aerosol mixing thermodynamics, Atmos. Chem. Phys., 11, 3303–3318, https://doi.org/10.5194/acp-11-3303-2011, 2011. a
Eldering, A. and Cass, G.: Source-oriented model for air pollutant effects on visibility, J. Geophys. Res.-Atmos., 101, 19343–19369, https://doi.org/10.1029/95JD02928, 1996. a
Emmons, L. K., Walters, S., Hess, P. G., Lamarque, J.-F., Pfister, G. G., Fillmore, D., Granier, C., Guenther, A., Kinnison, D., Laepple, T., Orlando, J., Tie, X., Tyndall, G., Wiedinmyer, C., Baughcum, S. L., and Kloster, S.: Description and evaluation of the Model for Ozone and Related chemical Tracers, version 4 (MOZART-4), Geosci. Model Dev., 3, 43–67, https://doi.org/10.5194/gmd-3-43-2010, 2010. a
Gómez, E., Borras, E., Viidanoja, J., and Hjorth, J.: Unsaturated dicarbonyl products from OH-initiated photo-oxidation of furan, 2-methylfuran and 3-methylfuran, Atmos. Environ., 43, 1603–1612, https://doi.org/10.1016/j.atmosenv.2008.12.019, 2008. a
Grieshop, A. P., Logue, J. M., Donahue, N. M., and Robinson, A. L.: Laboratory investigation of photochemical oxidation of organic aerosol from wood fires 1: measurement and simulation of organic aerosol evolution, Atmos. Chem. Phys., 9, 1263–1277, https://doi.org/10.5194/acp-9-1263-2009, 2009. a, b
Grosjean, D.: Atmospheric Fate of Toxic Aromatic Compounds, Sci. Total Environ., 100, 367–414, 1990. a
Guenther, A., Karl, T., Harley, P., Wiedinmyer, C., Palmer, P. I., and Geron, C.: Estimates of global terrestrial isoprene emissions using MEGAN (Model of Emissions of Gases and Aerosols from Nature), Atmos. Chem. Phys., 6, 3181–3210, https://doi.org/10.5194/acp-6-3181-2006, 2006. a
Hand, K., Carlson, R., and Chyba, C.: Energy, Chemical Disequilibrium, and Geological Constraints on Europa, Astrobiology, 7, 1006-22, https://doi.org/10.1089/ast.2007.0156, 2007. a
Hildebrandt, L., Donahue, N. M., and Pandis, S. N.: High formation of secondary organic aerosol from the photo-oxidation of toluene, Atmos. Chem. Phys., 9, 2973–2986, https://doi.org/10.5194/acp-9-2973-2009, 2009. a
Hodzic, A., Kasibhatla, P. S., Jo, D. S., Cappa, C. D., Jimenez, J. L., Madronich, S., and Park, R. J.: Rethinking the global secondary organic aerosol (SOA) budget: stronger production, faster removal, shorter lifetime, Atmos. Chem. Phys., 16, 7917–7941, https://doi.org/10.5194/acp-16-7917-2016, 2016. a
Jathar, S. H., Gordon, T. D., Hennigan, C. J., Pye, H. O. T., Pouliot, G., Adams, J., Donahue, N. M., and Robinson, A. L.: Unspeciated organic emissions from combustion sources and their influence on the secondary organic aerosol budget in the United States, P. Natl. Acad. Sci. USA, 111, 10473–10478, https://doi.org/10.1073/pnas.1323740111, 2014. a, b, c, d
Jathar, S. H., Woody, M., Pye, H. O. T., Baker, K. R., and Robinson, A. L.: Chemical transport model simulations of organic aerosol in southern California: model evaluation and gasoline and diesel source contributions, Atmos. Chem. Phys., 17, 4305–4318, https://doi.org/10.5194/acp-17-4305-2017, 2017. a, b, c
Jiang, X., Tsona, N. T., Jia, L., Liu, S., Zhang, H., Xu, Y., and Du, L.: Secondary organic aerosol formation from photooxidation of furan: effects of NOx and humidity, Atmos. Chem. Phys. Discuss., https://doi.org/10.5194/acp-2019-89, in review, 2019. a
Jimenez, J. L., Canagaratna, M. R., Donahue, N. M., Prevot, A. S. H., Zhang, Q., Kroll, J. H., DeCarlo, P. F., Allan, J. D., Coe, H., Ng, N. L., Aiken, A. C., Docherty, K. S., Ulbrich, I. M., Grieshop, A. P., Robinson, A. L., Duplissy, J., Smith, J. D., Wilson, K. R., Lanz, V. A., Hueglin, C., Sun, Y. L., Tian, J., Laaksonen, A., Raatikainen, T., Rautiainen, J., Vaattovaara, P. M., Ehn, M., Kulmala, J. M., Tomlinson, D. R., Collins, M. J., Cubison, E., Dunlea, J., Huffman, J. A., Onasch, T. B., Alfarra, M. R., Williams, P. I., Bower, K., Kondo, Y., Schneider, J., Drewnick, F., Borrmann, S., Weimer, S., Demerjian, K., Salcedo, D., Cottrell, L. R., Griffin, R., Takami, A., Miyoshi, T., Hatakeyama, S., Shimono, A., Sun, J. Y., Zhang, Y. M., Dzepina, K., Kimmel, J. R., Sueper, D.and Jayne, J. T., Herndon, S. C., Trimborn, A. M., William, L. R., Wood, E. C., Middlebrook, A. M., Kolb, C. E., Baltensperger, U., and Worsnop, D. R.: Evolution of organic aerosols in the atmosphere, Science, 326, 1525–1529, https://doi.org/10.1126/science.1180353, 2009. a
Johnston, F., Henderson, S., Chen, Y., Randerson, J., Marlier, M.and DeFries, R., Kinney, P., Bowman, D., and Brauer, M.: Estimated Global Mortality Attributable to Smoke from Landscape Fires, Environ. Health Perspect., 120, 695–701, https://doi.org/10.1289/ehp.1104422, 2012. a
Karl, T., Harley, P., Emmons, L., Thornton, B., Guenther, A., Basu, C., Turnipseed, A., and Jardine, K.: Efficient atmospheric cleansing of oxidized organic trace gases by vegetation, Science, 330, 816–819, https://doi.org/10.1126/science.1192534, 2010. a
Kautzman, K. E., Surratt, J. D., Chan, M. N., Chan, A. W. H., Hersey, S. P., Chhabra, P. S., Dalleska, N. F., Wennberg, P. O., Flagan, R. C., and Seinfeld, J. H.: Chemical Composition of Gas- and Aerosol-Phase Products from the Photooxidation of Naphthalene, J. Phys. Chem., 114, 913–934, https://doi.org/10.1021/jp908530s, 2010. a
Kim, Y., Couvidat, F., Sartelet, K., and Seigneur, C.: Comparison of Different Gas-Phase Mechanisms and Aerosol Modules for Simulating Particulate Matter Formation, J. Air Waste Manage. Assoc., 61, 1218–1226, https://doi.org/10.1080/10473289.2011.603999, 2011. a, b
Kim, Y., Sartelet, K., Seigneur, C., Charron, A., Besombes, J. L., and Jaffrezo, J. L.: Effect of measurement protocol on organic aerosol measurements of exhaust emissions from gasoline and diesel vehicles., Atmos. Environ., 140, 176–187, https://doi.org/10.1016/j.atmosenv.2016.05.045, 2016. a
Kim, Y., Sartelet, K., and Couvidat, F.: Modeling the effect of non-ideality, dynamic mass transfer and viscosity on SOA formation in a 3-D air quality model, Atmos. Chem. Phys., 19, 1241–1261, https://doi.org/10.5194/acp-19-1241-2019, 2019. a, b
Kleinman, L. I.: Low and high NOx tropospheric photochemistry, J. Geophys. Res., 99, 16831–16837, https://doi.org/10.1029/94JD01028, 1994. a
Knote, C., Hodzic, A., and Jimenez, J. L.: The effect of dry and wet deposition of condensable vapors on secondary organic aerosols concentrations over the continental US, Atmos. Chem. Phys., 15, 1–18, https://doi.org/10.5194/acp-15-1-2015, 2015. a
Konovalov, I. B., Beekmann, M., Berezin, E. V., Petetin, H., Mielonen, T., Kuznetsova, I. N., and Andreae, M. O.: The role of semi-volatile organic compounds in the mesoscale evolution of biomass burning aerosol: a modeling case study of the 2010 mega-fire event in Russia, Atmos. Chem. Phys., 15, 13269–13297, https://doi.org/10.5194/acp-15-13269-2015, 2015. a, b, c
Koo, B., Knipping, E., and Yarwood, G.: 1.5-Dimensional volatility basis set approach for modeling organic aerosol in CAMx and CMAQ, Atmos. Environ., 95, 158–164, https://doi.org/10.1016/j.atmosenv.2014.06.031, 2014. a, b, c, d, e, f, g
Lauraguais, A., Coeur-Tourneur, C., Cassez, A., and Seydi, A.: Rate constant and secondary organic aerosol yields for the gas-phase reaction of hydroxyl radicals with sy- ringol (2,6-dimethoxyphenol), Atmos. Environ., 55, 48–48, https://doi.org/10.1016/j.atmosenv.2012.02.027, 2012. a, b, c, d
Lauraguais, A., Coeur-Tourneur, C., Cassez, A., Deboudt, K., Fourmentin, M., and Choel, M.: Atmospheric reactivity of hydroxyl radicals with guaiacol (2-methoxyphenol), a biomass burning emitted compound: Secondary organic aerosol formation and gas-phase oxidation products, Atmos. Environ., 86, 155–163, https://doi.org/10.1016/j.atmosenv.2013.11.074, 2014. a
Lipsky, E. and Robinson, A.: Effects of dilution on fine particle mass and partitioning of semivolatile organics in diesel exhaust and wood smoke, Environ. Sci. Technol., 40, 155–162, https://doi.org/10.1021/Es050319P, 2006. a
Majdi, M., Turquety, S., Sartelet, K., Legorgeu, C., Menut, L., and Kim, Y.: Impact of wildfires on particulate matter in the Euro-Mediterranean in 2007: sensitivity to some parameterizations of emissions in air quality models, Atmos. Chem. Phys., 19, 785–812, https://doi.org/10.5194/acp-19-785-2019, 2019. a, b, c, d, e, f, g, h, i, j, k, l
Mallet, V., Qu'élo, D., Sportisse, B., Ahmed de Biasi, M., Debry, É., Korsakissok, I., Wu, L., Roustan, Y., Sartelet, K., Tombette, M., and Foudhil, H.: Technical Note: The air quality modeling system Polyphemus, Atmos. Chem. Phys., 7, 5479–5487, https://doi.org/10.5194/acp-7-5479-2007, 2007. a
Marson, S., Trentmann, J., Winterrath, T., Yokelson, R., Christian, T., Carlson, L., Warner, W., Wolfe, L., and Andreae, M.: Intercomparison of Two Box Models of the Chemical Evolution in Biomass-Burning Smoke Plumes, Environ. Sci. Technol., 55, 273–297, https://doi.org/10.1007/s10874-006-9039-5, 2006. a
May, A. A., Levin, E., Hennigan, C. J., Riipinen, I., Lee, T., Collett Jr., J., Jimenez, J. L., Kreidenweis, S. M., and Robinson, A. L.: Gas-particle partitioning of primary organic aerosol emissions: 3. Biomass burning, J. Geophys. Res.-Atmos., 118, 327–338, https://doi.org/10.1002/jgrd.50828, 2013. a, b
Menut, L., Perez Garcia-Pando, C., Haustein, K., Bessagnet, B., Prigent, C., and Alfaro, S.: Relative impact of roughness and soil texture on mineral dust emission fluxes modeling, J. Geophys. Res.-Atmos., 118, 6505–6520, https://doi.org/10.1002/jgrd.50313, 2013. a
Monahan, E. C.: In The Role of Air-Sea Exchange in Geochemical Cycling, Chap., The ocean as a source of atmospheric particles, 129–163, Kluwer Academic Publishers, 1986. a
Naeher, L., Brauer, M., Lipsett, M., Zelikoff, J., Simpson, D., Koenig, J., and Smith, R.: Woodsmoke Health Effects: A Review, Inhalation Toxicol., 19, 67–106, https://doi.org/10.1080/08958370600985875, 2006. a
Nakao, S., Clark, C., Tang, P., Sato, K., and Cocker III, D.: Secondary organic aerosol formation from phenolic compounds in the absence of NOx, Atmos. Chem. Phys., 11, 10649–10660, https://doi.org/10.5194/acp-11-10649-2011, 2011. a, b, c, d, e, f, g, h
Nenes, A., Pandis, S., and Pilinis, C.: Continued development and testing of a new thermodynamic aerosol module for urbban and regional air quality models, Atmos. Environ., 33, 1553–1560, https://doi.org/10.1016/S1352-2310(98)00352-5, 1999. a
Ng, N., Kroll, J., Chan, W., Chabara, P., Flagan, R., and Seinfeld, J.: Secondary organic aerosol formation from m-xylene, toluene, and benzene, Atmos. Chem. Phys., 7, 3909–3922, https://doi.org/10.5194/acp-7-3909-2007, 2007. a, b
Odum, J., Hoffmann, T., Bowman, F., Collins, D., Flagan, R., and Seinfeld, J.: Gas/Particle Partitioning and Secondary Organic Aerosol Yield, Environ. Sci. Technol., 30, 2580–2585, https://doi.org/10.1021/es950943, 1996. a, b, c, d, e, f
Olariu, R., Barnes, I., Bejan, I., Arsene, C., Vione, D., Klotz, B., and Becker, K.: FT-IR Product Study of the Reactions of NO3 Radicals With ortho-, meta and para-Cresol, Environ. Sci. Technol., 47, 7729–7738, https://doi.org/10.1021/es401096w, 2013. a
Pankow, J.: An absorption model of gas/particle partitioning involved in the formation of secondary organic aerosol, Atmos. Environ., 28A, 189–193, https://doi.org/10.1016/1352-2310(94)90094-9, 1994. a, b
Pankow, J. F. and Asher, W. E.: SIMPOL.1: a simple group contribution method for predicting vapor pressures and enthalpies of vaporization of multifunctional organic compounds, Atmos. Chem. Phys., 8, 2773–2796, https://doi.org/10.5194/acp-8-2773-2008, 2008. a, b
Pilinis, C., Pandis, S., and Seinfeld, J.: Sensitivity of direct climate forcing by atmospheric aerosols to aerosol size and composition, J. Geophys. Res.-Atmos., 1001, 18739–18754, https://doi.org/10.1029/95JD02119, 1995. a
Pope, C. A., Burnett, R. T., Thun, M. J., Calle, E. E., Krewski, D., and Thurston, K. I. G. D.: Lung cancer, cardiopulmonary mortality, and long-term exposure to fine particulate air pollution, JAMA, 287, 1132–1141, 2002. a
Pun, B. K., Seigneur, C., and Lohman, K.: Modeling secondary organic aerosol formation via multiphase partitioning with molecular data, Environ. Sci. Technol., 40, 4722–4731, https://doi.org/10.1021/es0522736, 2006. a
Robinson, A. L., Donahue, N., Shrivastava, M., Weitkamp, E., Sage, A., Grieshop, A., Lane, T., Pierce, J., and Pandis, S.: Rethinking organic aerosols; Semivolatile emissions and photochemical ageing, Science, 315, 1259–1262, https://doi.org/10.1126/science.1133061, 2007. a, b
Sartelet, K., Couvidat, F., Seigneur, C., and Roustan, Y.: Impact of biogenic emissions on air quality over Europe and North America, Atmos. Environ., 53, 131–141, https://doi.org/10.1016/j.atmosenv.2011.10.046, 2012. a
Sartelet, K., Zhu, S., Moukhtar, S., André, M., André, J., Gros, V., Favez, O., Brasseur, A., and Redaelli, M.: Emission of intermediate, semi and low volatile organic compounds from traffic and their impact on secondary organic aerosol concentrations over Greater Paris, Atmos. Environ., 180, 126–137, https://doi.org/10.1016/j.atmosenv.2018.02.031, 2018. a
Saunders, S. M., Jenkin, M. E., Derwent, R. G., and Pilling, M. J.: World wide web site of a master chemical mechanism (MCM) for use in tropospheric chemistry models, Atmos. Environ., 31, 1249–1249, https://doi.org/10.1016/S1352-2310(97)85197-7, 1997. a
Schell, B., Ackermann, I. J., Hass, H., Binkowski, F. S., and Ebel, A.: Modeling the formation of secondary organic aerosol within a comprehensive air quality model system, J. Geophys. Res., 106, 28275–28293, https://doi.org/10.1029/2001JD000384, 2001. a
Schwantes, R. H., Schilling, K. A., McVay, R. C., Lignell, H., Coggon, M. M., Zhang, X., Wennberg, P. O., and Seinfeld, J. H.: Formation of highly oxygenated low-volatility products from cresol oxidation, Atmos. Chem. Phys., 17, 3453–3474, https://doi.org/10.5194/acp-17-3453-2017, 2017. a, b, c
Sheehan, P. and Bowman, F.: Estimated effects of temperature on secondary organic aerosol concentrations, Environ. Sci. Technol., 35, 2129–2135, https://doi.org/10.1021/es001547g, 2001. a
Sillman, S., Logan, J. A., and Wofsy, S.: The sensitivity of ozone to nitrogen oxides and hydrocarbons in regional ozone episodes, J. Geophys. Res., 95, 1837–1851, https://doi.org/10.1016/j.agrformet.2004.12.007, 1990. a
Stanier, C., Pathak, R., and Pandis, S.: Measurements of the volatility of aerosols from α-piene ozonolysis, Environ. Sci. Technol., 41, 2756–2763, https://doi.org/10.1021/es0519280, 2007. a, b
Stockwell, C. E., Veres, P., Williams, J., and Yokelson, R.: Characterization of biomass burning emissions from cooking fires, peat, crop residue, and other fuels with high-resolution proton-transfer-reaction time-of-flight mass spectrometry, Atmos. Chem. Phys., 15, 845–865, https://doi.org/10.5194/acp-15-845-2015, 2015. a, b, c, d, e, f, g
Turquety, S., Menut, L., Bessagnet, B., Anav, A., Viovy, N., Maignan, F., and Wooster, M.: APIFLAME v1.0: high-resolution fire emission model and application to the Euro-Mediterranean region, Geosci. Model Dev., 7, 587–612, https://doi.org/10.5194/gmd-7-587-2014, 2014. a, b, c, d
Wesely, M.: Parameterization of surface resistances to gaseous dry deposition in regional-scale numerical models, Atmos. Environ., 23, 1293–1304, https://doi.org/10.1016/0004-6981(89)90153-4, 1989. a
Yarwood, G., Rao, S., Yocke, M., and Whitten, G.: Updates to the carbon bond chemical mechanism: CB05 Final report to the US EPA, 2005. a
Yee, L., Kautzman, K., Loza, C., Schilling, K., Coggon, M., Chhabra, P., Chan, M., Chan, A., Hersey, S., Crounse, J., Wennberg, P., Flagan, R., and Seinfeld, J.: Secondary organic aerosol formation from biomass burning intermediates: phenol and methoxyphenols, Atmos. Chem. Phys., 13, 8019–8043, https://doi.org/10.5194/acp-13-8019-2013, 2013. a, b, c, d, e, f, g, h, i, j, k, l, m, n
Yokelson, R., Burling, I., Gilman, J., Warneke, C., Stockwell, C., De Gouw, J., Akagi, S., Urbanski, S., Veres, P., Roberts, J., Kuster, W. C., Reardon, J., Griffith, D. W. T., Johnson, T. J., Hosseini, S., Miller, J. W., Cocker, D., Jung, H., and Weise, D. R.: Coupling field and laboratory measurements to estimate the emission factors of identified and unidentified trace gases for prescribed fires, Atmos. Chem. Phys., 13, 89–116, https://doi.org/10.5194/acp-13-89-2013, 2013. a, b, c
Zhu, S., Sartelet, K., Zhang, Y., and Nenes, A.: Three-dimensional modelling of the mixing state of particles over Greater Paris, J. Geophys. Res., 121, 5930–5947, https://doi.org/10.1002/2015JD024241, 2016. a
- Abstract
- Introduction
- SOA formation from VOCs and I/S/L-VOCs
- 3-D simulation over the Mediterranean region
- Sensitivity simulations
- Emissions of SOA precursors from wildfires
- Results and discussion
- Conclusions
- Data availability
- Appendix A
- Appendix B
- Appendix C
- Appendix D
- Appendix E
- Author contributions
- Competing interests
- Acknowledgements
- Review statement
- References