the Creative Commons Attribution 4.0 License.
the Creative Commons Attribution 4.0 License.
 | 25 Apr 2019
Ozone source apportionment during peak summer events over southwestern Europe
Gotzon Gangoiti
Marc Guevara
Sergey Napelenok
Xavier Querol
Oriol Jorba
Carlos Pérez García-Pando
It is well established that in Europe, high O3 concentrations are most pronounced in southern/Mediterranean countries due to the more favourable climatological conditions for its formation. However, the contribution of the different sources of precursors to O3 formation within each country relative to the imported (regional and hemispheric) O3 is poorly quantified. This lack of quantitative knowledge prevents local authorities from effectively designing plans that reduce the exceedances of the O3 target value set by the European air quality directive. O3 source attribution is a challenge because the concentration at each location and time results not only from local biogenic and anthropogenic precursors, but also from the transport of O3 and precursors from neighbouring regions, O3 regional and hemispheric transport and stratospheric O3 injections. The main goal of this study is to provide a first quantitative estimation of the contribution of the main anthropogenic activity sectors to peak O3 events in Spain relative to the contribution of imported (regional and hemispheric) O3. We also assess the potential of our source apportionment method to improve O3 modelling. Our study applies and thoroughly evaluates a countrywide O3 source apportionment method implemented in the CALIOPE air quality forecast system for Spain at high resolution (4 × 4 km2) over a 10-day period characterized by typical summer conditions in the Iberian Peninsula (IP). The method tags both O3 and its gas precursor emissions from source sectors within one simulation, and each tagged species is subject to the typical physico-chemical processes (advection, vertical mixing, deposition, emission and chemistry) as the actual conditions remain unperturbed. We quantify the individual contributions of the largest NOx local sources to high O3 concentrations compared with the contribution of imported O3. We show, for the first time, that imported O3 is the largest input to the ground-level O3 concentration in the IP, accounting for 46 %–68 % of the daily mean O3 concentration during exceedances of the European target value. The hourly imported O3 increases during typical northwestern advections (70 %–90 %, 60–80 µg m−3), and decreases during typical stagnant conditions (30 %–40 %, 30–60 µg m−3) due to the local NO titration. During stagnant conditions, the local anthropogenic precursors control the O3 peaks in areas downwind of the main urban and industrial regions (up to 40 % in hourly peaks). We also show that ground-level O3 concentrations are strongly affected by vertical mixing of O3-rich layers present in the free troposphere, which result from local/regional layering and accumulation, and continental/hemispheric transport. Indeed, vertical mixing largely explains the presence of imported O3 at ground level in the IP. Our results demonstrate the need for detailed quantification of the local and remote contributions to high O3 concentrations for local O3 management, and show O3 source apportionment to be an essential analysis prior to the design of O3 mitigation plans in any non-attainment area. Achieving the European O3 objectives in southern Europe requires not only ad hoc local actions but also decided national and European-wide strategies.
- Article
(8821 KB) - Full-text XML
-
Supplement
(1886 KB) - BibTeX
- EndNote


Tropospheric ozone (O3) is an air pollutant of major public concern as it harms human health (WHO, 2013) and sensitive vegetation (Booker et al., 2009), and contributes to climate change (Jacob and Winner, 2009). O3 is formed in the atmosphere through non-linear photochemical reactions among carbon monoxide (CO), peroxy radicals generated by the photochemical oxidation of volatile organic compounds (VOCs) and nitrogen oxides (NOx) (Crutzen, 1974). Therefore, meteorological stagnation, high temperatures, high solar radiation and low precipitation enhance tropospheric O3 formation (Demuzere et al., 2009; Otero et al., 2016). Atmospheric circulation also controls the short- and long-range transport of O3 affecting its lifetime in the atmosphere (Monks et al., 2015). For example, the transport of precursors emitted in urban and industrialized areas may cause O3 production downwind (Holloway et al., 2003).
According to the European Environmental Agency (EEA) around 95 %–98 % of the population in Europe were exposed to O3 concentrations that exceeded the guidelines of the World Health Organization (WHO) during 2013–2015 period (EEA, 2017). These guidelines establish a maximum daily 8 h averaged (MDA8) O3 concentration of 100 µg m−3 never to be exceeded. The European air quality directive (2008/50/EC) is less restrictive as it sets an O3 target value of 120 µg m−3 for the MDA8 concentration, which can be exceeded up to 25 days per calendar year averaged over 3 years.
Southern European countries around the Mediterranean Basin are particularly exposed to exceedances of the O3 target value in summer due to the influence of frequent anticyclonic and clear-sky conditions that favour photochemical O3 formation in the troposphere (EEA, 2017). In addition, its geographic location also makes the basin a receptor of the long-range transport of pollution from Europe, Asia and even North America (Lelieveld et al., 2002; Gerasopoulos, 2005). The importance of long-range transport on surface O3 has been studied in the Mediterranean Basin, indicating that the emission sources within the basin have a dominating influence on surface O3, whereas remote sources are more important than local sources for O3 mixing ratios at higher altitudes (Richards et al., 2013; Safieddine et al., 2014). Recent studies have suggest that the upper O3-rich air masses could increase the surface O3 concentration in the Mediterranean Basin (Kalabokas et al., 2017; Querol et al., 2018). Further detailed and quantitative studies on the mechanism linking the upper O3-rich layer with increases in the ground-level O3 concentration in episodes require further clarification particularly regarding the contribution of O3 transported at regional and hemispheric scales.
Several studies in the Iberian Peninsula (IP) have addressed the causes of O3 episodes by looking at the circulation of air masses (Millán, 2014, and references therein). In the Atlantic region, the blocking anticyclones over western Europe favour the inter-regional transport of O3 in the area and its accumulation for several days during the most severe episodes (Alonso et al., 2000; Gangoiti et al., 2002, 2006; Valdenebro et al., 2011; Saavedra et al., 2012; Monteiro et al., 2016). Conversely, on the Mediterranean coast, the typical summer synoptic meteorological conditions with a lack of strong synoptic advection, combined with the orographic characteristics and the sea and land breezes, favour episodes where high levels of O3 are accumulated by recirculation of air masses loaded with O3 precursors (Millán et al., 1997, 2000; Toll and Baldasano, 2000; Gangoiti et al., 2001; Pérez et al., 2004; Jiménez et al., 2006; Gonçalves et al., 2009; Millán, 2014; Querol et al., 2017, 2018). The coupling between synoptic and mesoscale processes governing the levels of O3 in the western Mediterranean Basin need further research in order to understand the O3 intercontinental contribution. Furthermore, based on our understanding there is a lack of research quantifying the contribution of the activity sources to the O3 local formation during peak events in this region.
O3 analyses in the western Mediterranean Basin show that regional background O3 levels have remained high without significant changes (EEA, 2017; EMEP-CCC, 2016; Querol et al., 2016). However, they have increased at traffic and urban background sites (EEA, 2017; Querol et al., 2016; Sicard et al., 2016; Saiz-Lopez et al., 2017). The reasons behind the urban O3 upward trend are not clear yet due to the complex VOC–NOx regime; part of the O3 increase may have resulted from the reduction of NO emissions relative to NO2 and therefore to a lower NO titration effect in VOC-limited regimes. The most intense O3 events in the last decade, measured by the number of exceedances of the O3 target value are recorded over areas downwind of large urban and industrial hot spots (Monterio et al., 2012; Querol et al., 2016; EEA, 2016). Overall, a number of these types of O3 events occur in June–July and during summer heat waves (i.e. 2003 and 2015).
According to the European air quality directive, in zones exceeding the O3 target value, EU member states must develop plans to attain compliance by reducing the emission of O3 precursors. Abatement of the tropospheric O3 concentration in the western Mediterranean Basin has been insufficient thus far (Querol et al., 2018). Effective planning requires an accurate quantitative knowledge of the sources of these precursors and their respective contributions to the exceedances of the O3 target value (Querol et al., 2016; Borrego et al., 2016). However, source attribution of surface O3 concentrations remains a challenge, because the concentration at each location and time results not only from local biogenic and anthropogenic precursors, but also from the transport of O3 and its precursors from neighbouring regions, O3 hemispheric transport (UNECE, 2010) and stratospheric O3 injections (Monks et al., 2015).
At present, there are no methods based on observations that distinguish the origin of O3. Despite their inherent uncertainties, chemical transport models (CTMs) allow for the apportionment of the contribution of any source (by sector and/or region) to O3 concentrations. The most widely used approach is the “brute force” method, which consists of running an ensemble of simulations zeroing out the sources one by one and then comparing them with a baseline simulation that accounts for all of the sources. Several O3 source apportionment studies at a European scale have applied the brute force method to quantify the contribution of one or two emission sectors. For example, road transport emissions using the EMEP model (Reis et al., 2000), biogenic and anthropogenic emissions using the Polyphemus model (Sartelet et al., 2012), transport-related emissions including road transport, shipping and aviation using the WRF-CMAQ model (TRANSPHORM, 2014), and ship emissions with CAMx (Aksoyoglu et al., 2016). Brute force is simple to implement, as it does not require additional coding in the CTM. However, as it quantifies the contribution of each source based on its absence, it does not reproduce actual atmospheric conditions; therefore, it is susceptible to inaccuracies in the prediction of O3 peaks under non-linear regimes (Cohan and Napelenok, 2011). Actually, brute force is not suitable for retrieving source contributions when the relationship between emissions and concentrations is non-linear, but it is useful for analysing the concentration responses to emission abatement scenarios (Clappier et al., 2017).
Recently, CTMs include algorithms that tag multiple pollutants by source (region and/or sector) all the way through the pollutant's lifetime, from emission to deposition. This integrated source apportionment approach has several advantages. First, it allows for the identification of the main sources contributing to high O3 levels under actual atmospheric conditions, which is a preliminary step towards designing refined and efficient emission abatement scenarios. Second, as we show below, it supports enhanced model evaluation and therefore potential model improvements by identifying problems in emission estimates (sectors or regions) or chemical boundary conditions. The Integrated Source Apportionment Method (ISAM) within the Community Multiscale Air Quality (CMAQ) model has shown promising results for O3 tagging, exhibiting less noise in locations where brute force results are demonstrably inaccurate (Kwok et al., 2013, 2015). Recent ISAM experiments have quantified that the contribution of traffic in the cities of Madrid and Barcelona to the daily O3 peaks downwind of the urban areas is particularly significant (up to 80–100 µg m−3) (Valverde et al., 2016a). O3 tagging methods are also included in other regional and global models applied over Europe (Karamchandani et al., 2017; Butler et al., 2018).
The integrated source apportionment tools combined with high-resolution emission and meteorological models can help unravelling the sources responsible for peak summer events of O3 in the western Mediterranean Basin. Quantifying the contribution of emission sources during acute O3 episodes is a prerequisite for the design of future mitigation strategies in the region. In this framework, the main goal of this study is to provide a first quantitative estimation of the contribution of the main anthropogenic activity sectors compared to the imported concentration (regional and hemispheric) to peak O3 events in Spain. We also assess the potential of our source apportionment method to improve O3 modelling. Our study applies, for the first time, a countrywide O3 source apportionment at high resolution over the IP during the period between 21 and 31 July 2012, which is representative of the typical summer synoptic conditions in the region. We use the CMAQ-ISAM within the CALIOPE air quality forecast system for Spain (http://www.bsc.es/caliope/es, last access: 4 April 2019), which runs at a horizontal resolution of 4 × 4 km2 over the IP. The system is fed by the HERMESv2.0 emission model, which provides disaggregated emissions based on local information and state-of-the-art bottom-up approaches for the most prevalent pollution sectors.
The paper is organized as follows. In Sect. 2 we introduce the CALIOPE system, the set-up of ISAM and the HERMESv2.0 emission model for O3 source apportionment studies, and the methodology used to quantify the evaluation of the model. In Sect. 3 we demonstrate the representativeness of the selected episode, we evaluate the model and we provide an analysis of the source-sector contribution to Spanish O3 under the different synoptic patterns occurring during the study period. In Sect. 4, we discuss our findings, the regulatory implications and future research.
2.1 Air quality model
We used the CALIOPE air quality modelling system (http://www.bsc.es/caliope) to simulate the O3 dynamics over the IP during the selected episode. CALIOPE is described elsewhere (Baldasano et al., 2008, 2011; Pay et al., 2010, 2012; and reference therein). The system consists of the HERMESv2.0 emission model (Guevara et al., 2013), the WRF-ARWv3.6 meteorological model (Skamarock and Klemp, 2008), the CMAQ v5.0.2 chemical transport model (Byun and Schere, 2006) and the BSC-DREAM8bv2 mineral dust model (Basart et al., 2012). CALIOPE first runs over Europe at a 12 × 12 km2 horizontal resolution (EU12 domain) and then over the IP at a 4 × 4 km2 resolution (IP4 domain) (Fig. S1 in the Supplement). In the present work, the system is configured with 38 sigma layers up to 50 hPa, both for WRF and CMAQ. The planetary boundary layer (PBL) is characterized by approximately 11 layers, and the bottom layer's depth is ∼39 m. The EU12 domain uses meteorological initial and boundary conditions from the final analyses provided by the National Centers of Environmental Prediction (FNL/NCEP) at a 0.5∘ × 0.5∘ resolution. The first 12 h of each meteorological run are treated as cold start, and the next 23 h are provided to the chemical transport model. Boundary conditions for reactive gases and aerosols come from the global MOZART-4/GEOS-5 model at 1.9∘ × 2.5∘ horizontal resolution (Emmons et al., 2010). CMAQ uses the CB05 gas-phase mechanism with active chlorine chemistry, an updated toluene mechanism (CB05TUCL; Whitten et al., 2010; Sarwar et al., 2012) and the sixth-generation CMAQ aerosol mechanism including sea salt, aqueous/cloud chemistry and the ISORROPIA II thermodynamic equilibrium module (AERO6; Reff et al., 2009; Appel et al., 2013). Table S1 in the Supplement depicts the remaining CALIOPE configuration options.
For the IP4 domain, HERMESv2.0 estimates emissions for Spain with a temporal and spatial resolution of 1 h and up to 1 km × 1 km, according to the Selected Nomenclature for Air Pollution (SNAP), which are then aggregated to a 4 × 4 km2 resolution (Guevara et al., 2013). HERMESv2.0 is suitable for source apportionment studies thanks to its level of detail in the calculation of the emission fluxes by source (Guevara et al., 2014). The model is currently based on data from 2009, which was the closest year with updated information on local emission activities in HERMESv2.0 at the time that this work started. For neighbouring countries and international shipping activities, HERMESv2.0 uses the annual gridded national emission inventory provided by the European Monitoring and Evaluation Programme (EMEP) disaggregated to a 4 × 4 km2 resolution using a SNAP-sector-dependent spatial, temporal and speciation treatment (Ferreira et al., 2013).
HERMESv2.0 integrates the Model of Emissions of Gas and Aerosols from Nature (MEGANv2.0.4; Guenther et al., 2006) to estimate VOCs and NOx emissions from vegetation, which play a major role in O3 photochemistry, using temperature and solar radiation from the WRF model. Note that we configured MEGAN to compute VOC emissions from cultivated crops; the agriculture emission module in HERMESv2.0 estimates the VOCs from manure management and field burning of agricultural residues. In this study, we have updated MEGANv2.0.4 with emission factors from MEGANv2.1 (http://lar.wsu.edu/megan/guides.html, last access: 4 April 2019). In Sect. 2 of the Supplement, we provide a comparison with measurements from the DAURE campaign (Pandolfi et al., 2014) that shows the reasonably good behaviour of our modelled isoprene.
Urban VOC emissions could be a relevant source of O3. Over Spanish urban areas, HERMESv2.0 estimates VOC emissions from road transport and the use of solvents (Fig. 1) following bottom-up approaches (Guevara et al., 2013). However, uncertainties in the estimation of urban VOC emission inventories, as stated recently by several works (Pan et al., 2015; Liu et al., 2017; McDonald et al., 2018; Lewis, 2018) makes the urban VOC contribution to tropospheric O3 uncertain. In order to overcome this problem, continuous monitoring of urban VOCs should be performed in Spanish cities, following the example of other regions in which O3 is also a major problem such as Mexico City (Jaimes-Palomera et al., 2016). In addition, the use of formaldehyde satellite observations to constrain urban VOC emissions could also be pointed out as a future task to improve the representativeness of urban emission inventories (Zhu et al., 2014).
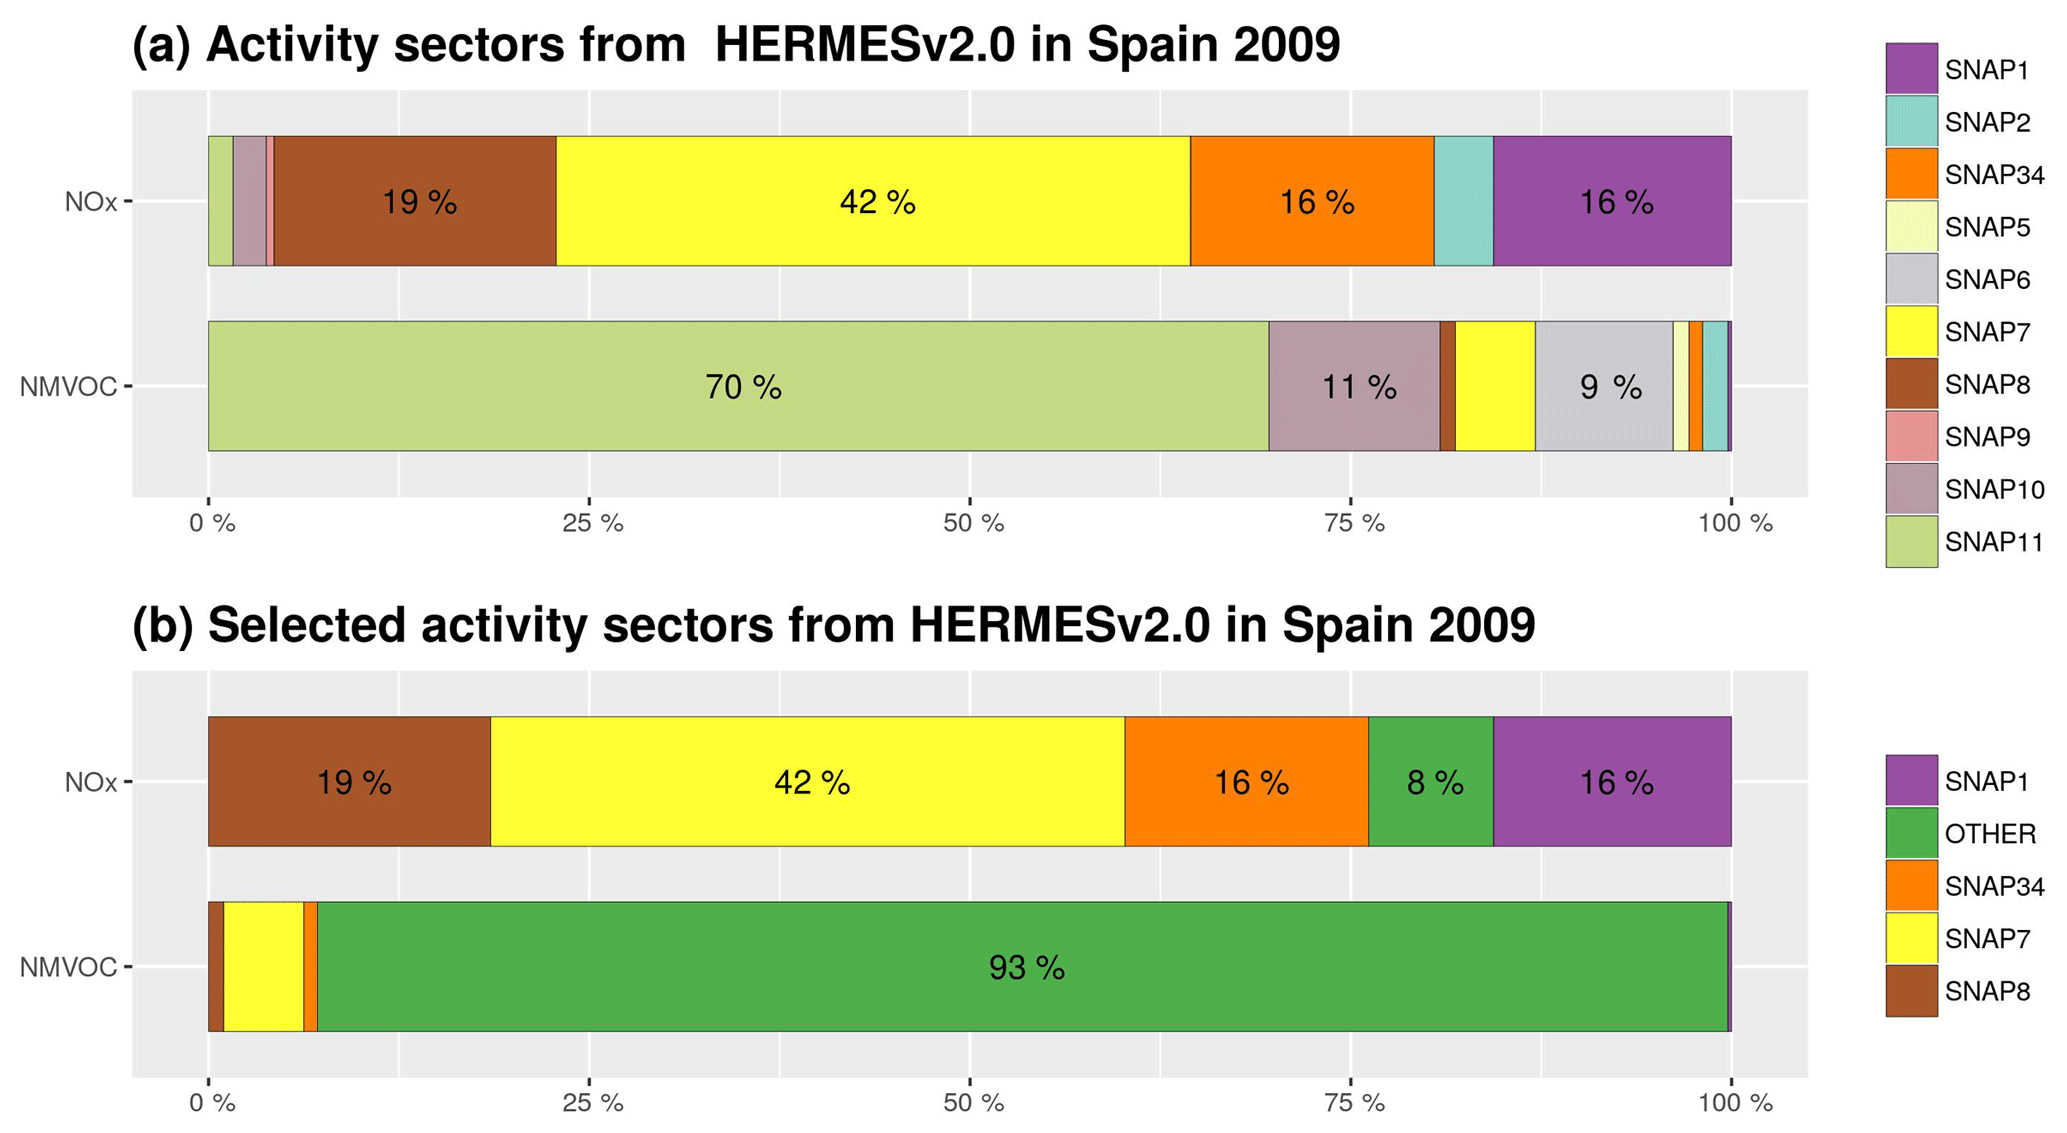
Figure 1Percentage of the contribution of emissions to total annual emissions by SNAP sector calculated by HERMES for Spain 2009 (a) and for the selected SNAP sector accounting for more than 90 % of NOx total emission to be tracked with ISAM (b). “OTHER” compiles the SNAP categories 2 (residential combustion), 5 (fugitive emissions from fuels), 6 (solvent use), 9 (waste management), 10 (agriculture) and 11 (other sources). (NMVOC refers to non-methane volatile organic compounds.)
2.2 Ozone source apportionment method
We applied ISAM to quantify contributions from different SNAP categories to the surface O3 over the IP. The ISAM O3 tagging method is a mass-balance technique that tags both O3 and its gas precursor emissions (NOx and VOC) from each source sector within one simulation (Kwok et al., 2013, 2015). Each tagged species undertakes typical physico-chemical processes (advection, vertical mixing, deposition, emission and chemistry) without perturbing the actual conditions. The O3 rate of change for each tag in any grid cell is calculated as follows (Eq. 1):
where Ctag represents the O3 concentration related to a tagged source of interest, Ptag is the chemical production rate of O3 formed by the precursors emitted for each tag and D is the total chemical destruction rate of O3 in this grid cell. Different ratios of NOx∕VOC cause the formation of O3 in each grid cell, which is either controlled by NOx- or VOC-limited conditions. ISAM uses the H2O2∕HNO3 ratio to determine whether O3 is NOx- or VOC-sensitive (above or below 0.35, respectively) (Zhang et al., 2009). The bulk O3 concentration in each model grid cell (Pbulk) is equal to the sum of O3 tracers that were produced under either NOx- or VOC-sensitive conditions (Eq. 2),
where P and P are the O3 produced under NOx- and VOC-limited conditions, respectively, according to Eqs. (3) and (4):
In Eqs. (3) and (4), NOx,tag and VOCj,tag are the respective concentrations of the x nitrogen and y VOC species in CB05 that participate in the photochemical O3 formation for each source sector tag and grid cell, and MIRy is the maximum incremental reactivity factor of each y species of VOC emitted by each source-sector tag, corresponding to the O3 generating potential of each single VOC species (Carter, 1994).
2.3 Ozone tagged species
Table 1 summarizes the O3 tagged sources in the present study, and Fig. 1a depicts the HERMESv2.0 model estimates of the contribution from each SNAP category to the total emissions of O3 precursors in Spain. The largest NOx sources are road transport (SNAP7, 42 %), non-road transport (SNAP8, 19 %), manufacturing industries (SNAP34, 16 %) and energy production (SNAP1, 16 %). VOCs are dominated by biogenic sources (SNAP11, 70 %) and to a lesser extent by the agricultural sector (SNAP10, 11 %), solvent and other product uses (SNAP6, 9 %), and road transport (SNAP7, < 7 %). The selected (tagged) SNAP categories in this study are the energy, industrial, road transport and non-road transport sectors (Fig. 1b), which account for 92 % of the total NOx emissions in Spain. An additional tracer (OTHER) gathers the remaining emission categories that were not explicitly tracked (i.e. SNAP2, 5, 6, 9, 10 and 11).
Table 1Description of the O3 tagged sources in the present study.
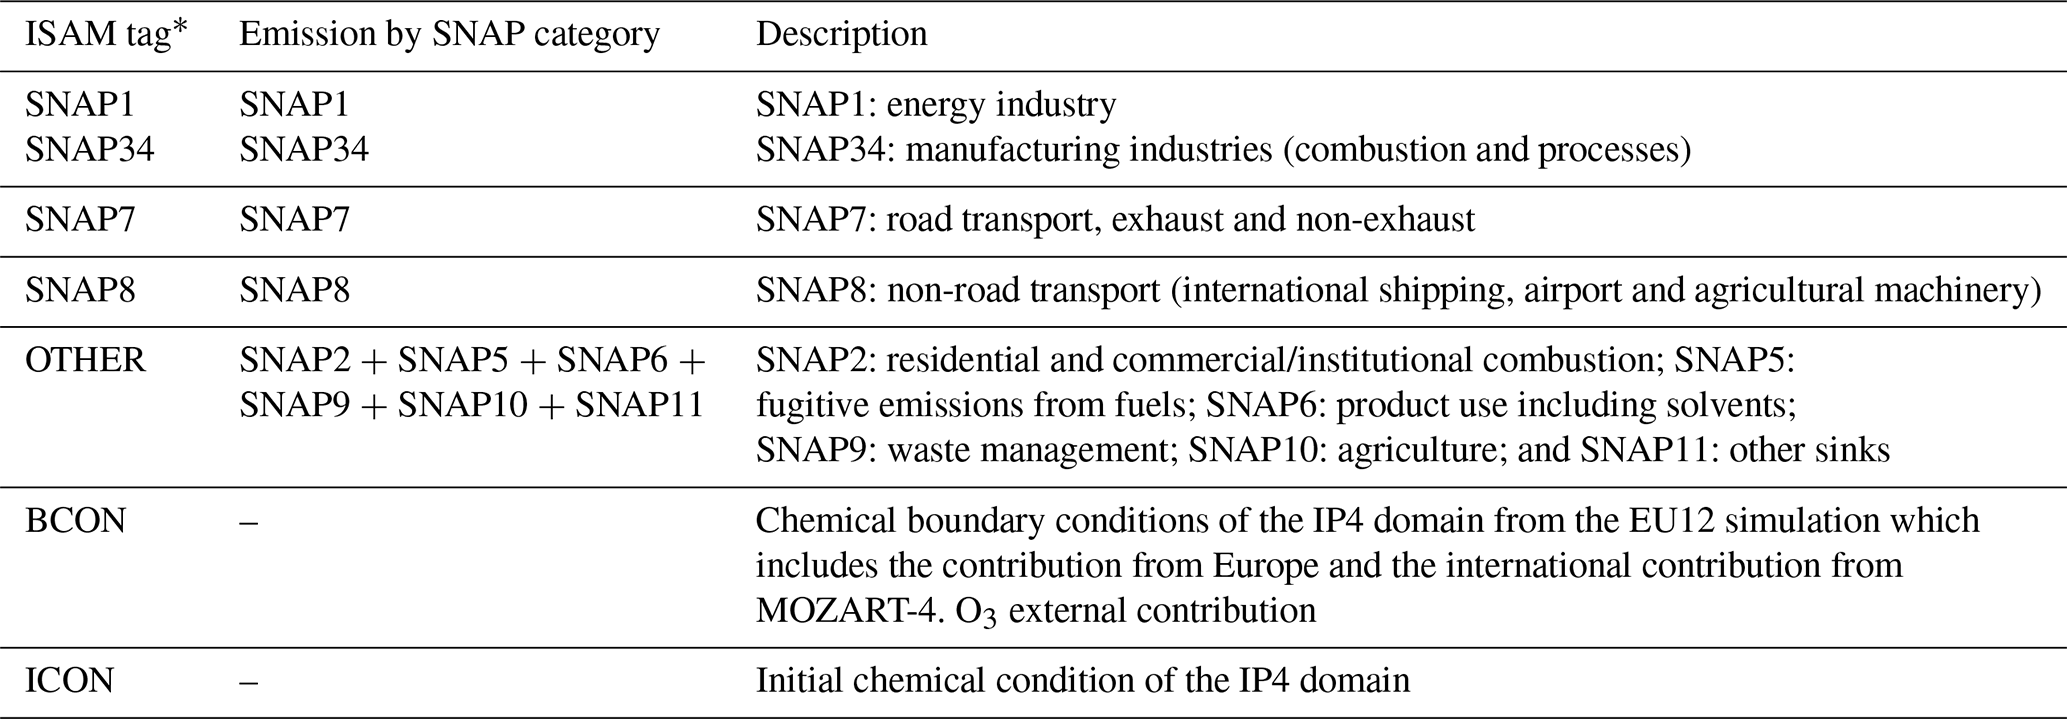
* Each ISAM tag is applied to O3 and its precursor species in the CB05 (NOx and VOCs). NOx species contributing to O3 formation involve (9 species): NO, NO2, nitrogen trioxide (NO3), dinitrogen pentoxide (N2O5), nitrous acid (HONO), peroxyacyl nitrates (PAN), higher peroxyacyl nitrates (PANX), peroxynitric acid (PNA) and organic nitrates (NTR). VOC species contributing to O3 formation include (14 species): acetaldehyde (ALD2), higher aldehydes (ALDX), ethene (ETH), ethane (ETHA), ethanol (ETOH), formaldehyde (FORM), internal olefin (IOLE), isoprene (ISOP), methanol (MEOH), olefin (OLE), paraffin (PAR), monoterpene (TERP), toluene (TOL) and xylene (XYL).
In addition to the selected sources, we tracked the contributions of the chemical boundary conditions (BCON) and the initial conditions (ICON). BCON represents both the O3 directly transported through the IP4 domain boundaries and the formation of O3 resulting from precursors that are also transported through the boundaries. BCON O3 comes from the EU12 parent domain, which includes the O3 produced in Europe and the O3 transported at a global scale (both tropospheric and stratospheric O3) provided by the MOZART-4/GEOS model (Fig. S1 in the Supplement). In the following, we name BCON O3 as the imported O3 to the IP4 domain. Tagging the initial O3 allows for the quantification of the number of spin-up days to minimize the impact of model initialization. For the present run, we required 6 days of spin-up to set the contribution of initial conditions to less than 1 % of the net hourly O3 concentration over 95 % of the available O3 stations.
2.4 Evaluation method
We evaluate the simulated concentrations against air quality measurements from the Spanish monitoring stations that are part of the European Environment Information and Observation Network (EIONET; https://www.eionet.europa.eu/, last access: 4 April 2019). The EIONET network provides a relatively dense geographical coverage of the Spanish territory. During the 21–31 July episode, we used the measurements from 347 stations for O3 and 357 stations for NO2 with a temporal coverage above 85 % on an hourly basis. Figure S2 in the Supplement shows the distribution of the stations for O3 and NO2.
The evaluation based on discrete statistics includes the correlation coefficient (r), the mean bias (MB), the normalized mean bias (NMB) and the root mean square error (RMSE) (Appendix B). We used the “openair” package (Carslaw and Ropkins, 2012) for R (v3.3.2; R Core Team, 2016) to compute the statistics. We calculate statistics on an hourly basis for O3 and NO2, as well as for the regulatory MDA8 in the case of O3. The evaluation also takes the station type, following the categories established by the EEA into account (i.e. rural background, suburban background, urban background, industrial and traffic).
There are no direct evaluation methods for apportioned pollutants. Instead, we designed a diagnostic plot for source apportionment analysis at each individual receptor, including a time series of measured and observed O3 and NO2 concentrations as well as the simulated tagged sources. In addition, this plot includes the simulated wind speed and direction. These plots are helpful as they compare the modelled O3 and NO2 with the observations, while highlighting the sources and circulation patterns at least partly responsible for the model behaviour. This work will only discuss the source apportionment plots at key O3 receptor regions in detail, given the high number of stations (260) that simultaneously measure O3 and NO2.
Evaluation results are discussed together with the source apportionment results. On the one hand, the interpretation of the source apportionment results benefits from model evaluation. On the other hand, the source apportionment results support enhanced model evaluation as it allows for the identification of potential errors in emission estimates for specific sectors and/or in the chemical boundary conditions.
3.1 Description of the ozone episode
Our first estimation of the origin of peak O3 events in Spain focuses on the episode from 21 to 31 July 2012. Figure 2a illustrates the relevance of the episode showing the observed MDA8 O3 concentrations trends at the Spanish EIONET stations during the (extended) summers (i.e. from April to September) from 2000 to 2012, in addition to the concentrations recorded during the episode. Although the selected episode is not the most severe between 2000 and 2012 at a national scale, it comprises a period with high MDA8 O3 concentrations measured at rural background stations, (the 75th percentile of those values was above the target value) similar to the particularly severe summer of 2003 (Solberg et al., 2008).

Figure 2(a) Temporal distribution of the MDA8 O3 concentration during the extended summer (from April to September, AMJJAS) at the Spanish EIONET stations for the 2000-2012 period and the episode (from 21 to 31 July 2012) by station type: IN (industrial), RB (rural background), TR (traffic) and UB (urban background). (b) The 90th percentile of the MDA8 O3 concentration at the Spanish EIONET stations during the episode. Numbers indicate the stations cited in Sect. 3.4.
This episode is also interesting because it was widespread and affected large areas of Europe (EEA, 2013). During this period alone, 33 % and 12 % of the total number of exceedances for the information threshold and the target value in 2012, respectively, were measured. The O3 regional context of the episode allows us to study the influence of the imported O3 to Spain.
The maps of the 90th percentile of the measured MDA8 O3 concentrations over Spain (Fig. 2b) show high concentration spots throughout the domain. The exceedances of the target value were found in the regions surrounding large urban areas (Madrid, Barcelona, Valencia and Seville) and along Spanish valleys (i.e. Ebro Valley and Guadalquivir Valley).
There were more than 100 exceedances of the O3 target value on most of the days during the episode, with relative maxima on 25, 28 and 31 July attributed to the change in the synoptic conditions (Fig. S3 in the Supplement). Figure 3 shows the meteorological patterns (2 m temperature, 10 m wind, precipitation, mean sea level pressure and geopotential height at 500 hPa) modelled by WRF-ARW during the 3 distinctive days over the outer EU12 domain.
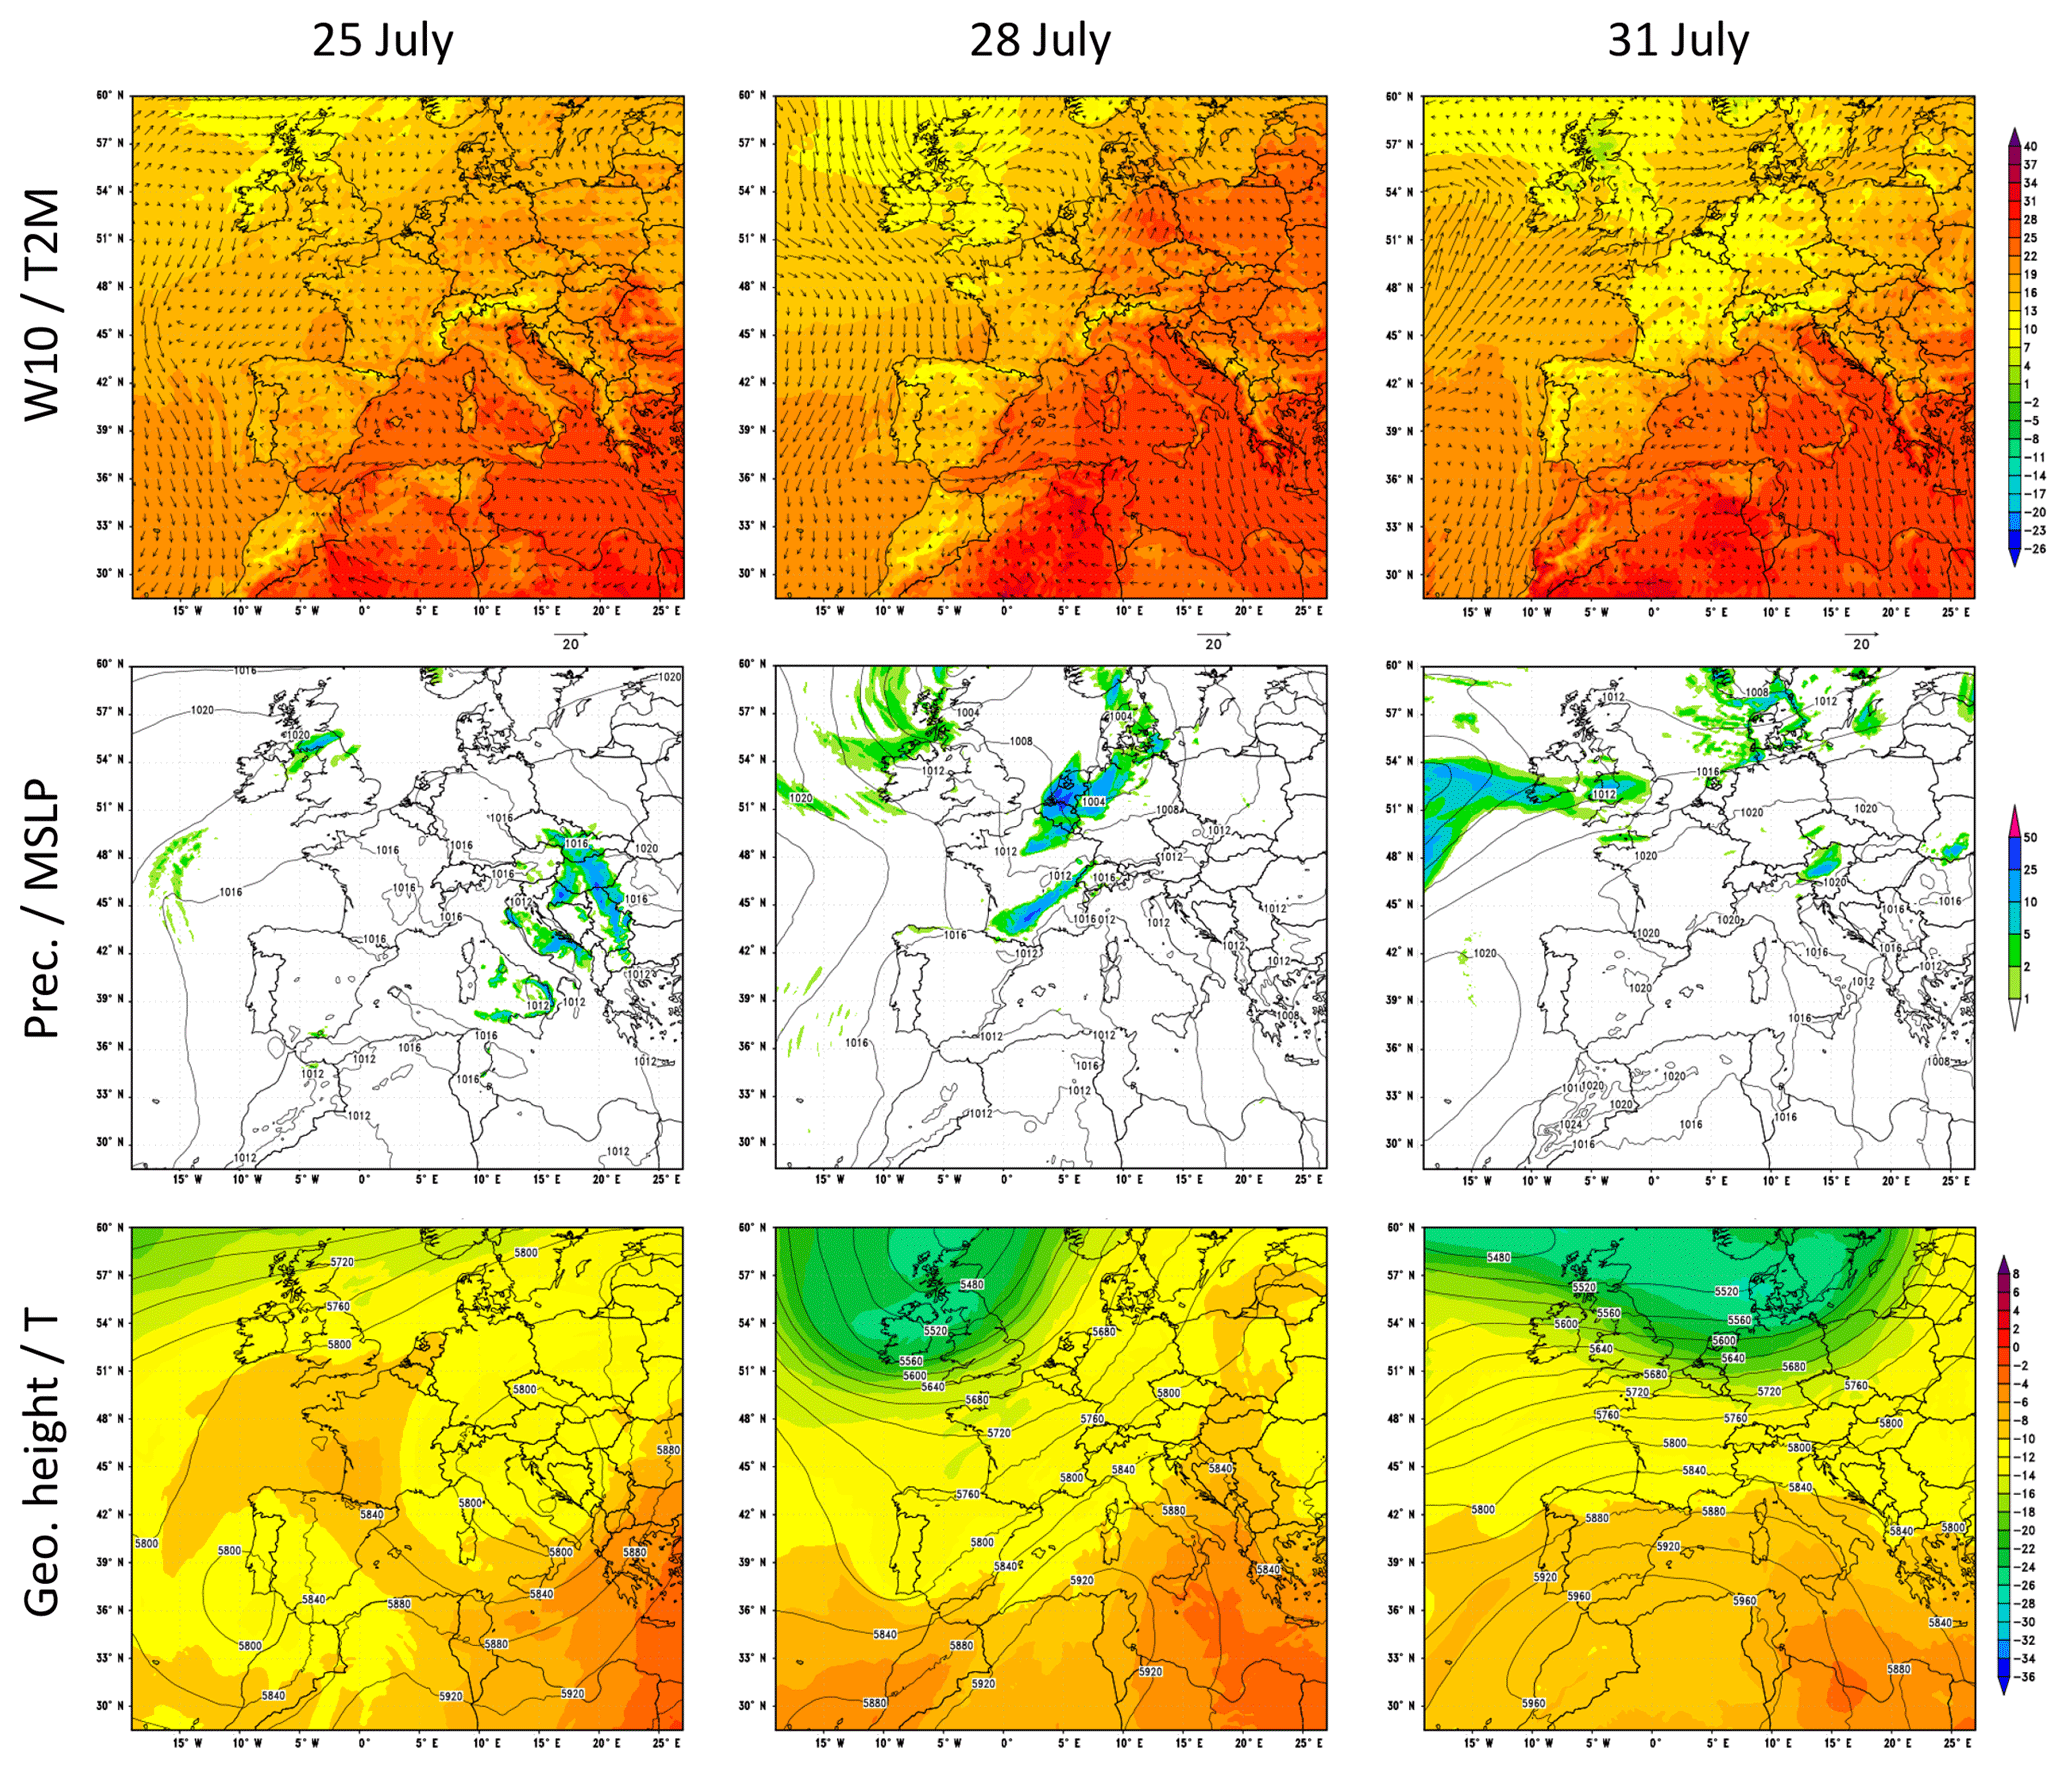
Figure 3WRF-ARW meteorological fields at 06:00 UTC for 25, 28 and 31 July in the EU12 domain: 10 m wind speed (W10, ms−1), 2 m temperature (T2M, C), 6 h accumulated precipitation (Prec., mm), mean sea level pressure (MSLP, hPa), 500 hPa geopotential height in contours (Geo. height, m), and 500 hPa temperature in shaded colours (T, ∘C).
Our characterization of the study period is based on the circulation type classification proposed in Valverde et al. (2014), who applied an objective synoptic classification method over the period from 1983 to 2012, specifically designed to study air quality dynamics over the IP. Stagnant conditions and northwestern advections are the most frequent summer synoptic circulation patterns over the IP, occurring on ∼44 % of the days in a year (Jorba et al., 2004; Valverde et al., 2014). Stagnant conditions are characterized by reduced surface pressure gradients and weak synoptic winds, intense solar radiation, and the development of the Iberian thermal low (ITL). The ITL forces the convergence of surface winds from the coastal areas towards the central plateau enhancing sea breezes and mountain–valley winds and subsidence over the western Mediterranean Basin, as described by Millán et al. (1997, 2000) and Millán (2014). In contrast, northwestern advections (NWad) transport air masses from the Atlantic towards the north and west of the IP and they are characterized by atmospheric instability and intense ventilation. Periods of accumulation and venting of pollutants follow the same sequence of pressure ridging and troughing respectively, of the lower and middle troposphere of the IP during the warm season (Querol et al., 2017, 2018). According to the circulation type classification in Valverde et al. (2014), the selected episode started with the development of the ITL (21–25 July), followed by a NWad-venting period (26–29 July) and ended with the development of another ITL (30–31 July).
Figure 4 shows the 90th percentile (p90) of the simulated hourly O3 and NO2 concentrations corresponding to the 3 distinctive days with the relative maxima of exceedances. In the northern Spanish Mediterranean areas, intense O3 episodes often affect the plains and valleys located 60 km north of the Barcelona metropolitan area (BMA) in summer (Toll and Baldasano, 2000; Gonçalves et al., 2009; Valverde et al., 2016a; Querol et al., 2017). High NOx concentrations from the BMA combined with high biogenic VOC levels are driven inland by mesoscale processes (sea breezes and mountain–valley winds). This happened on 31 July when the highest p90 of the hourly O3 concentrations (160–180 µg m−3) in Spain occurred over the north and northwest regions of the BMA. Occasionally, as occurred on 25 July, anticyclonic winds over the western Mediterranean Sea deflect the sea-breeze flow enriched with precursors from the BMA towards the Gulf of Lion where it reaches the highest p90 of the hourly O3 concentrations (160–180 µg m−3) in the IP Mediterranean region. Eastern Spanish Mediterranean areas show similar O3 dynamics, with inland regions depicting the highest O3 peaks (140–160 µg m−3) when stagnant conditions cover the central and eastern IP.
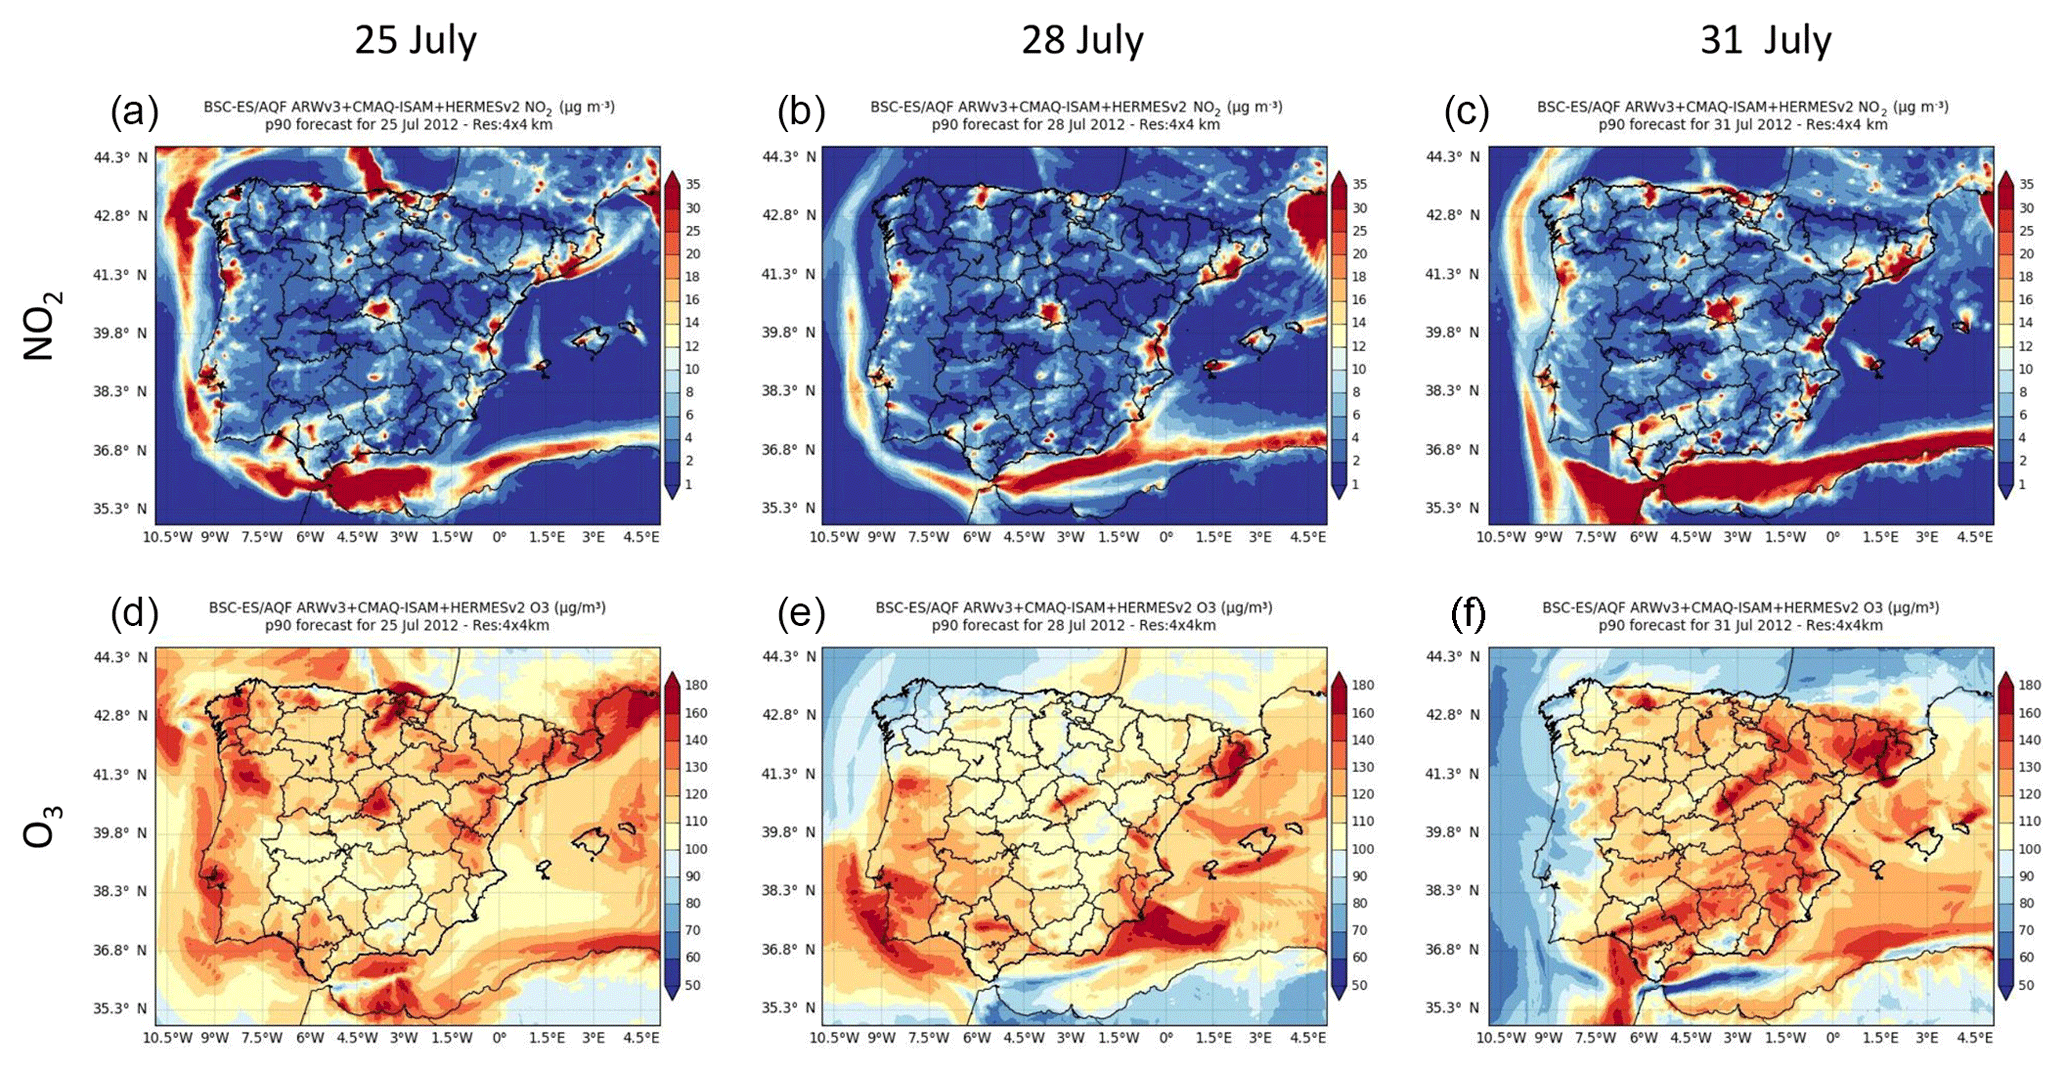
Figure 4Ground-based concentration maps (in µg m−3) for NO2 (a, b, c) and O3 (d, e, f) corresponding to the 90th percentile of the average hourly concentrations on 25 (a, d), 28 (b, e) and 31 (c, f) July 2012.
In the centre of the IP, intense O3 episodes occurred during the development of the ITL, where the affected area depends on the synoptic conditions (Querol et al., 2018). Under the absence of synoptic forcing (e.g. 25 July), the MMA had the highest p90 of the hourly O3 concentrations (∼140–160 µg m−3). In contrast, when mountain–valley winds are reinforced with synoptic westerlies (e.g. 31 July; Fig. 3) the urban NOx plume is channelled along the mountain ranges in Madrid towards the northeast and the highest p90 values of the hourly O3 concentrations are found along the valley (∼140–160 µg m−3).
In the north and northeast of the IP, the p90 values of the hourly O3 concentrations show a significant increase when the blocking anticyclone over western Europe is combined with the development of the ITL (e.g. 25 July). The stagnant conditions favour the accumulation of O3 precursors around main cities and industrial areas and enhance the local O3 formation.
The NWad pattern (e.g. 28 July) significantly decreases the p90 of the hourly O3 concentrations in the centre and north of the IP. The northwesterly winds decrease the temperature and therefore the O3 formation. As a consequence, O3 levels are reduced in the plumes from the BMA and the MMA, although they are still significant in the latter. Overall, the p90 of the hourly O3 concentrations during the NWadv pattern was ∼100 µg m−3 in most background areas. In contrast, during the ITL it was above 120 µg m−3.
3.2 Statistical evaluation
CALIOPE has been evaluated in detail elsewhere (Pay et al., 2014, and references therein). Furthermore, the system has been evaluated using the DELTA Tool (Thunis and Cuvelier, 2014) developed by the Forum for Air Quality Modelling in Europe to support and harmonize the model evaluation in the frame of the air quality directive. Valverde et al. (2016a, b) used DELTA Tool v4.0 and showed that CALIOPE accomplishes the quality objectives as defined in the air quality directive for 78 % of the NO2 and 91 % of the O3 monitoring stations during the summer 2012. Here, we evaluate the updated version of CALIOPE using ISAM to quantify the system's ability to reproduce O3 and NO2 concentrations during the selected episode. Table 2 compiles the quartiles of the statistics calculated by station type.
Table 2Statistics for average hourly O3, MDA8 O3 and average hourly NO2 concentrations in the episode as a function of the station type. Exceedances indicate the number of exceedances of the European air quality directive standards for hourly O3 (180 µg m−3), MDA8 O3 (120 µg m−3) and average hourly NO2 (200 µg m−3). N indicates the number of monitoring stations used in the statistical calculation. MO and MM depict the measured and modelled mean concentrations, respectively. Statistics are calculated by considering more than 75 % of the hours in a day, as established by Directive 2008/50/EC. The statistics correspond to the 50th (25th, 75th) quantiles by station. Type indicates the station categories in the calculation of statistics: all of the stations (ALL), industrial (IN), traffic (TR), urban background (UB), suburban background (SB) and rural background (RB) stations.

The model slightly overestimates the average hourly and MDA8 O3 concentrations with MB values of +12 and +6 µg m−3, respectively. The r is above 0.6 at more than 50 % of the stations and above 0.7 at 25 % of them. The MB values for the average hourly and MDA8 O3 concentrations are lower at RB stations (±4 µg m−3) than at IN, TR and UB stations (between +6 and +16 µg m−3) at 50 % of the stations. As expected, the highest number of exceedances of the O3 target value was recorded at RB stations (260 exceedances) followed by IN stations (204 exceedances).
At RB stations, average hourly O3 is overestimated (+4 µg m−3) and MDA8 O3 is underestimated (−4 µg m−3), which indicates that nighttime O3 is overestimated. The nighttime overestimation is a common feature of CTMs and it is typically attributed to the underestimation of the O3 titration by NO (Bessagnet et al., 2016; Sharma et al., 2017).
CALIOPE underestimates the average hourly NO2 concentrations with −7 µg m−3 at TR stations and −2 µg m−3 at RB stations. This partly explains the high overestimation of the average hourly and MDA8 O3 concentration at TR and UB stations, as well as the systematic overestimation of average hourly O3 concentration at nighttime (due to a lack of O3 titration by NO). The average hourly NO2 concentration at TR stations features the highest r (with 25 % of stations above 0.6), which proves the reasonably accurate representation of temporal emission in urban areas by the HERMESv2.0 model (Guevara et al., 2014; Baldasano et al., 2011). In contrast, the RMSE is highest at TR stations, which results from the underestimation of NO2 peaks during traffic rush hours. Underestimation of NO2 traffic peaks is a common problem in Eulerian mesoscale models (Pay et al., 2014), as emission heterogeneity is lost in the grid cell-averaging process, which is especially critical in urban areas. Next generation microscale models will potentially solve this problem (Lateb et al., 2016). Besides the dilution of the emission in the grid, meteorology may also play an important role in the low performance of NO2 and O3 in hotspot areas. Several inter-comparison studies (e.g. EURODELTA and AQMEII) agree on the limitations of models to simulate meteorological variables that affect the average hourly NO2 temporal variability, which controls model performance for O3 in high-NOx environments and their downwind areas (Bessagnet et al., 2016).
Figure 5 classifies the average hourly and MDA8 O3 concentrations at the air quality stations into four MB categories that account for 93 % of the stations. The best performance for O3 (type B) is found at the 28 % of stations located in the areas surrounding the MMA, the BMA and most of the northern Mediterranean stations, which is consistent with the highest r (0.6 < r < 0.9) found in the centre and north of the IP (Fig. S4 in the Supplement). The highest O3 overestimations (type D) are present at the 36 % of stations that are mainly located in highly industrialized areas in Spain (Guadalquivir Valley, Strait of Gibraltar, Valencia) and inside the MMA. The next sections analyse the origin of these O3 biases using the source apportionment time series.
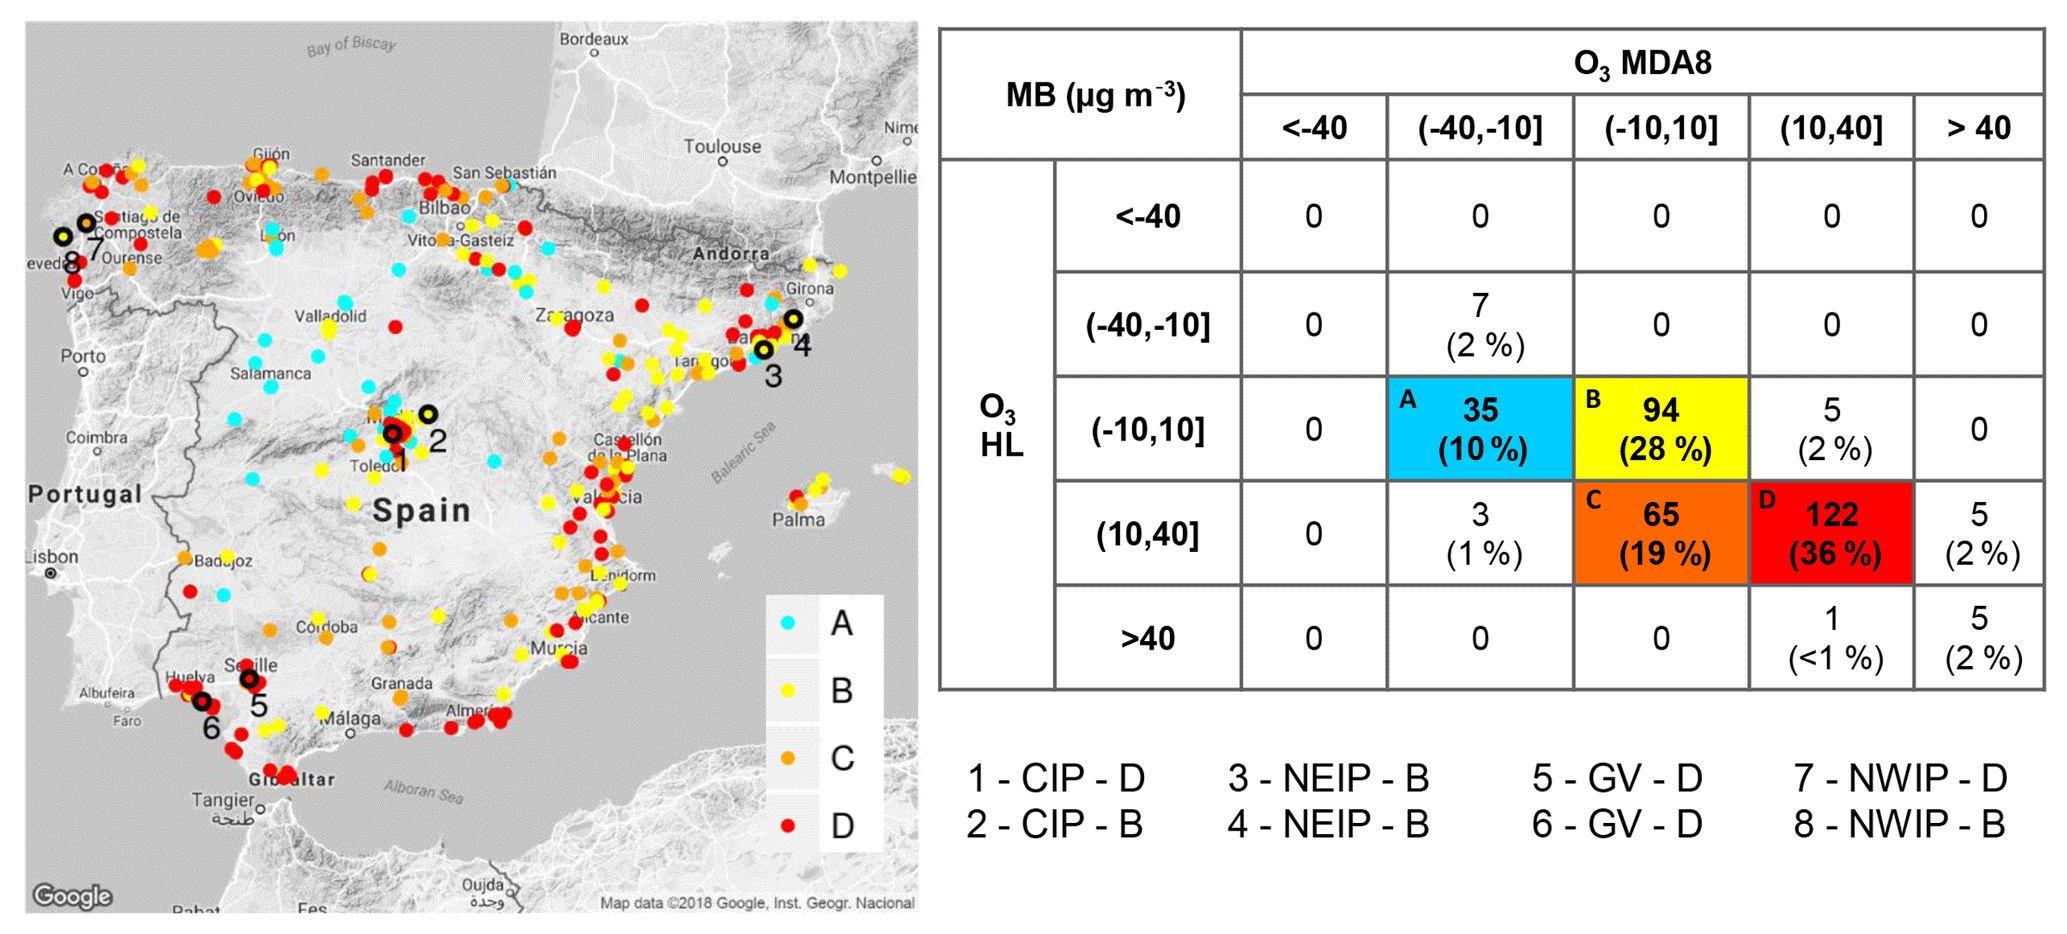
Figure 5Air quality stations classified by both mean bias (MB, in µg m−3) for average hourly and MDA8 O3 at the Spanish EIONET stations and lumped by category (A, B, C and D). Numbered black circles indicate the stations under study in central IP (CIP; stations 1 and 2), northeastern IP (NEIP; station 3 and 4), Guadalquivir Valley (GV; stations 5 and 6) and northwestern IP (NWIP; stations 7 and 8).
The comparison with previous CALIOPE studies (Baldasano et al., 2011; Pay et al., 2014) indicates that r is in the same range for O3 (0.6–0.7) and NO2 (0.4–0.5) at individual stations; the same applies for the RMSE (15–29 and 10–20 µg O3 m−3). Modelled O3 shows better performance at traffic stations in large cities, as stations influenced by road transport emissions (i.e. high-NOx environments) are better characterized with a more pronounced daily variability (Baldasano et al., 2011). At the European scale, several model inter-comparisons (Giornado et al., 2015; Bessagnet et al., 2016) have indicated that O3 concentrations in summer agree with the surface observations with r values between 0.5 and 0.6. NO2 hourly variability is underestimated overall due to uncertainties in the emission estimates, meteorological inputs and model resolution. These studies highlight the limitations of models with respect to simulating meteorological variables that affect the NO2 hourly variability, and therefore the model performance for O3 in high-NOx environments and their downwind areas.
Section S4 in the Supplement discusses the meteorological evaluation results and their impact on pollutant concentrations. Not surprisingly, temperature shows the best behaviour when compared with observations (Table S2 in the Supplement). The modelled wind speed is overestimated, particularly during nighttime (Fig. S5 in the Supplement), coincident with low-level wind speed. The nighttime overestimation of wind is a source of error in modelled NO2 and O3 nighttime concentrations (Vautard et al., 2012; Bessagnet et al., 2016).
3.3 Source-sector ozone contributions during peak episodes
Figure 6 shows the p90 of the average hourly O3 concentration over the IP tagged by source type (Table 1) for different days (25, 28 and 31 July). (Fig. S6 in the Supplement shows similar plots for NO2.) The imported O3 is by far the largest contributor showing a p90 ranging from 70 to 120 µg m−3 in the east/north/centre of the IP on 25/28/31 July, respectively. The imported O3 enters the study domain through the IP4 domain boundaries and it can only be transported, scavenged, deposited or depleted by O3 precursors. Therefore, areas with low imported O3 concentrations (< 50 µg m−3) are good indicators of (1) the accumulation of specific O3 precursors that deplete imported O3, and (2) the subsequent O3 photochemical production that occur mostly under stagnant conditions and around the largest industrial/urban areas. The p90 of the hourly imported O3 concentration shows the lowest values under two different conditions and in regions. On 25 July in the northwestern IP and Portugal, stagnant conditions allow the accumulation of pollutants that titrate the imported O3 concentrations down to 30–70 µg m−3. At the same time O3 is locally produced downwind of major northern cities due to traffic emissions (La Coruña, Gijón, Bilbao) (60–120 µg m−3), shipping activities (up to 40 µg m−3) and the generation of energy and industrial processes (10–20 µg m−3). On 31 July in the northeast of the IP, the pollutants transported from the Gulf of Lion and Catalonia towards the Mediterranean act as a sink of imported O3 reducing its concentration down to 60 µg m−3. As a result, there is local O3 formation up to 120–160 µg m−3 along the Ebro Valley and the Lleida Plain. In a source attribution study over northern Portugal, Borrego et al. (2016) also found a reduction of imported O3 and subsequent O3 formation by local sources under similar meteorological conditions.

Figure 6Tagged O3 concentrations (in µg m−3) corresponding to the 90th percentile (p90) of the average hourly concentrations: SNAP1, SNAP34, SNAP7, SNAP8, OTHER and BCON for 25 July (first column), 28 July (second column) and 31 July (third column) in 2012.
Following imported O3, the largest contributor to O3 is the road transport sector. Downwind of major urban areas in Spain (i.e. Madrid, Barcelona, Bilbao, Seville and Valencia), on-road traffic contributed as much as 60–120 µg m−3 to the p90 of the hourly O3 concentrations, and affected different areas depending on the synoptic/mesoscale regimes (Fig. 6). In the north of the BMA, the p90 of the hourly O3 concentration from the road transport sector reaches its maximum when stagnant conditions affect the centre and eastern IP (e.g. 31 July). As noted above, mesoscale winds carry traffic O3 precursors from the BMA inland, channelled by north–south valleys towards the intra-mountain plain in the north. Over the MMA, the p90 of the hourly O3 concentration from the road transport sector showed a maximum when the ITL was combined with the synoptic westerlies (e.g. 31 July), carrying high O3 as far as the Ebro Valley, as shown in Fig. 4.
Regarding the contribution from the non-road transport sector, the Atlantic regions of the IP show the highest p90 of the average hourly O3 concentration (25–40 µg m−3) on 25 July. The stagnant conditions favoured the accumulation of precursors from the Atlantic shipping route and the formation of O3 within the region. The Spanish Mediterranean region shows the highest p90 of the average hourly O3 concentrations from the non-road transport sector close to the southeastern coasts of the IP (∼180 µg m−3) when the westerlies in the Strait of Gibraltar inject precursors from international shipping into the Mediterranean Basin (e.g. 28 and 31 July). Note that during days with high p90 of the average hourly O3 concentration from non-road transport, the imported O3 concentration shows the lowest p90 due to the NO titration effect over emission areas.
The elevated point source emission sectors (i.e. energy and industry) contributed less to O3 than the traffic sector, but their contributions were significant reaching 15–25 µg m−3 of the p90 of the average hourly O3 concentrations (Fig. 6). The north and northeast of the IP, the Mediterranean coast and the Guadalquivir Valley are the most affected regions under stagnant conditions.
The contribution of the remaining sectors (OTHER) to the p90 of the average hourly O3 concentrations was similar to that of the elevated point sources (15–25 µg m−3), but it reached up to 30 µg m−3 in areas downwind of Oporto and Lisbon (Fig. 6). OTHER includes the formation of O3 from the remaining anthropogenic and biogenic sources (accounting for less than 8 % of total NOx emissions, but 93 % of total VOC). The high OTHER concentration around the biggest cities in Portugal may be related to precursors emitted by the residential sector (SNAP2 and SNAP9) and biogenic emissions, as found in other source apportionment studies over Portugal (Borrego et al., 2016; Karamchandani et al., 2017).
3.4 Regionalization of source-sector contributions
We have identified 10 O3 receptor regions with similar characteristics in terms of meteorological and geographical patterns, O3 dynamics and main source contributors (Figs. 4 and 6). The receptor regions defined in our work are consistent with Diéguez et al. (2014) and Querol et al. (2016), who proposed a similar regionalization based on observations from air quality stations. Figure 7c shows the location of the air quality stations belonging to each receptor region corresponding to the centre of the IP (CIP), the east of the IP (EIP), the Ebro Valley (EV), the Guadalquivir Valley (GV), the Mediterranean Sea (MED), the northeast of the IP (NEIP), the north of the IP (NIP), the northwest of the IP (NWIP), the south of the IP (SIP) and the west of the IP (WIP).
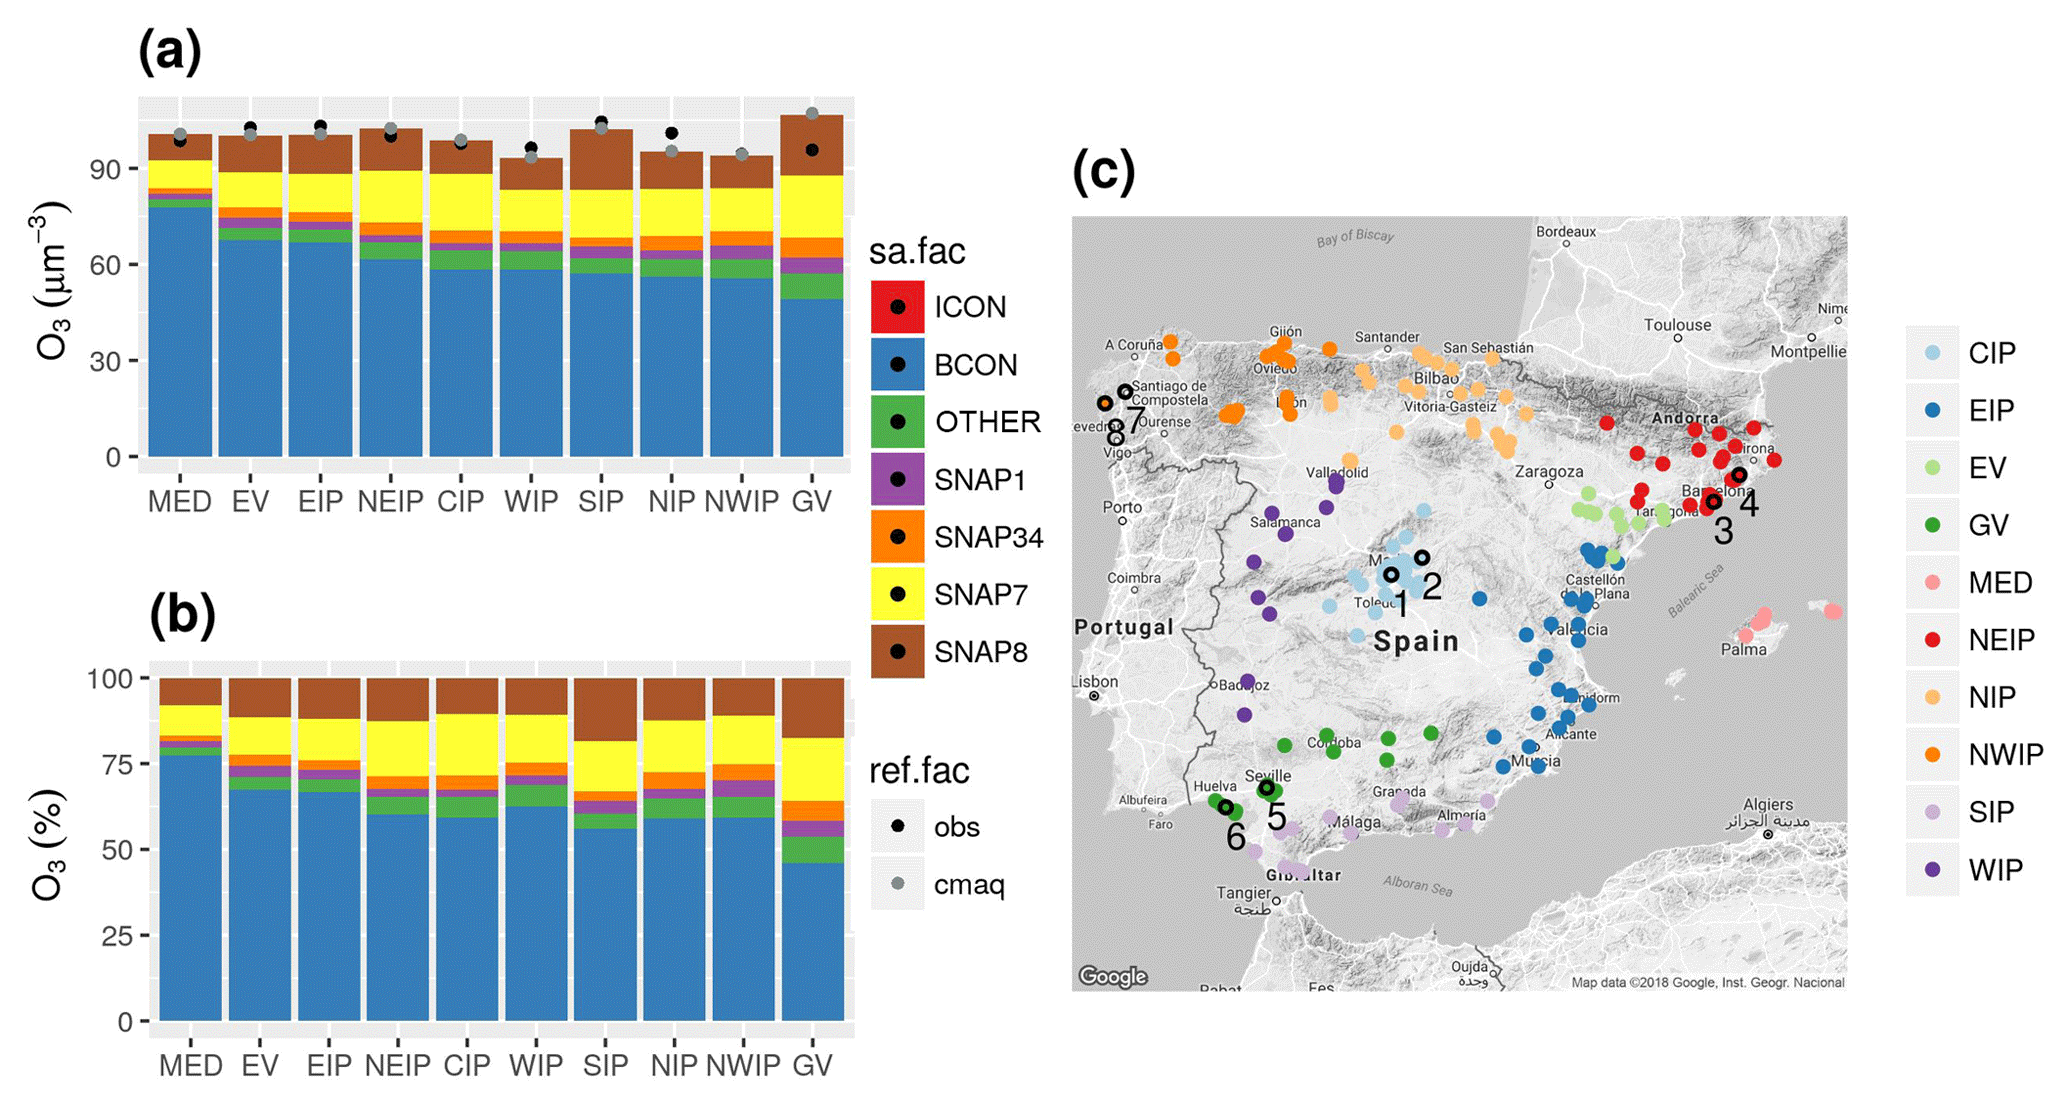
Figure 7Daily mean contribution in µg m−3 (a) and in percentage (b) of tagged sources of O3 during exceedances of the observed 120 µg m−3 for MDA8 O3 averaged by the identified receptor regions (c). Black and grey dots represent observed and modelled daily mean concentrations during exceedances of 120 µg m−3 of the observed MDA8 O3. Regions correspond to the centre of the IP (CIP), the east of the IP (EIP), the Ebro Valley (EV), the Guadalquivir Valley (GV), the Mediterranean Sea (MED), the northeast of the IP (NEIP), the north of the IP (NIP), the northwest of the IP (NWIP), the south of the IP (SIP) and the west of the IP (WIP). Numbered black circles indicate the stations under study CI (1–2), NEIP (3–4), GV (5–6) and NWIP (7–8).
Figure 7a shows the absolute O3 contribution of each tagged source at air quality stations by region along with the modelled and observed daily mean concentration during exceedances of 120 µg m−3 of the observed MDA8 ozone. Note that differences between sectors are more evident when normalizing (Fig. 7b). (Table S3 in the Supplement compiles the numerical values of Fig. 7.) Figure 7 indicates that during exceedances of the MDA8 target value there is a good agreement (r=0.79) between the sum of apportioned O3 and the observed concentrations over the receptor regions.
The MED region shows the highest imported O3 contribution (76 %) because it is relatively far from important anthropogenic NOx+VOC sources in the IP. Under the ITL influence (25 and 31 July), MED received air masses enriched with on-road traffic precursors from southern France and the NEIP, which enhanced O3 production up to 7 %. Shipping emissions in the MED region contributed up to 8 % of the total O3.
After MED, there is a cluster of regions along the Spanish Mediterranean coast (i.e. NEIP, EV and EIP) that show imported O3 contributions between 60 % and 68 % of the daily mean O3 under exceedances. This is explained by their proximity to the eastern boundary and the frequent mesoscale phenomena enhancing the recirculation and accumulation of imported O3 along the Spanish Mediterranean coast. The contribution of road and non-road transport is similar (∼ 11 %–16 %) because these regions have both important roads and maritime trade routes. Note that the SIP region, which is also located on the Spanish Mediterranean coast, shows a daily mean imported O3 concentration lower than other regions along the Spanish Mediterranean coast (∼57 %) and the highest non-road transport contribution in Spain (19 %). The main sink of imported O3 are precursors resulting from dense shipping traffic through the Strait of Gibraltar, which have a substantial impact on the O3 production downwind (either in the Alboran Sea or the Gulf of Cadiz).
The regions including the largest metropolitan areas in Spain are the CIP (Madrid) and the NEIP (Barcelona). Both regions show an imported O3 contribution of ∼60 % and a similar contribution from the road transport sector (18 % and 16 %, respectively). However, the NEIP shows a slightly higher contribution from non-road transport (13 vs. 10 %) due to the influence of international shipping near coastal areas.
The northern and northwestern regions of the IP (NIP and NWIP) had relatively lower imported O3 contributions (56 %–59 %). The contribution of non-road transport was ∼10 %–12 %, slightly lower than in the Mediterranean coast, and that of road transport was also significant (∼14 %–15 %). The contribution from the industrial sector was one of the highest in the country (∼5 %) which was probably related to the influence of the large industrial facilities located in several areas of the north of Spain. The contribution from the energy sector in the NWIP region was the highest in Spain (∼5 %) due to emissions from large coal-fired power plants located in the area.
The WIP had the lowest daily mean O3 concentrations during days exceeding the O3 target value (93.5 µg m−3) and a high imported O3 contribution (∼63 %). NOx emissions in the WIP region are moderate (Fig. 4), which could explain the low daily mean O3 concentration. There is a significant contribution from traffic (14 % for road transport and 11 % for non-road transport) and industrial and energetic sectors (7 %) to the daily mean O3 concentrations. These anthropogenic contributions suggest that O3 in the WIP may be produced by precursors transported from the surrounding cities (Porto, Lisbon and Madrid) and the highly industrialized areas in the NWIP and the NIP (Fig. 6).
The Guadalquivir Valley had the lowest imported O3 contribution in the IP (∼46 %) and the highest daily O3 concentration during days of exceedance. The on-road traffic was the highest anthropogenic contributor to O3 (∼18 %) due to the emissions from three major cities (Seville, Huelva and Cordoba). Although O3 in Huelva may be overestimated (as discussed later), shipping is the second most important contributor to O3 in the Guadalquivir Valley (∼17 %) which is probably linked to the important fluvial transport along the river. (The Guadalquivir River is one of the most important routes for merchandise transport in Europe.) In fact, the non-road transport sector is the highest contributor (∼17 %–19 %) in southern Spain, both in the Guadalquivir Valley and the SIP, which is also due to the dense maritime routes across the Strait of Gibraltar.
The following sections analyse the source apportionment results at regions with a high on-road traffic contribution (i.e. CIP and NEIP) and a high contribution from industry and energy production (i.e. NWIP and Guadalquivir Valley).
3.4.1 The centre of the Iberian Peninsula
Figure 8 shows the source apportionment time series of the average hourly O3 and NO2 concentrations at two stations, an urban station in Madrid (station 1 in Fig. 8a), and another station located in Guadalajara (station 2 in Fig. 8b), which is a medium size city affected by Madrid's urban plume. At the urban station, the model reproduces the O3 traffic cycle (r=0.66 and MB=22.5 µg m−3) featuring the typical low O3 concentrations (< 40 µg m−3) in the early morning and in the afternoon due to O3 titration (Fig. 8a). However, O3 was overestimated (MB type D) during daytime peaks due to the overestimation of the NO2 morning peaks during stagnant conditions, coincident with the highest road transport contribution for both pollutants. The results point towards a poor representation of the meteorological condition in the city during stagnant conditions as shown in the meteorological evaluation (Sect. 4 in the Supplement).
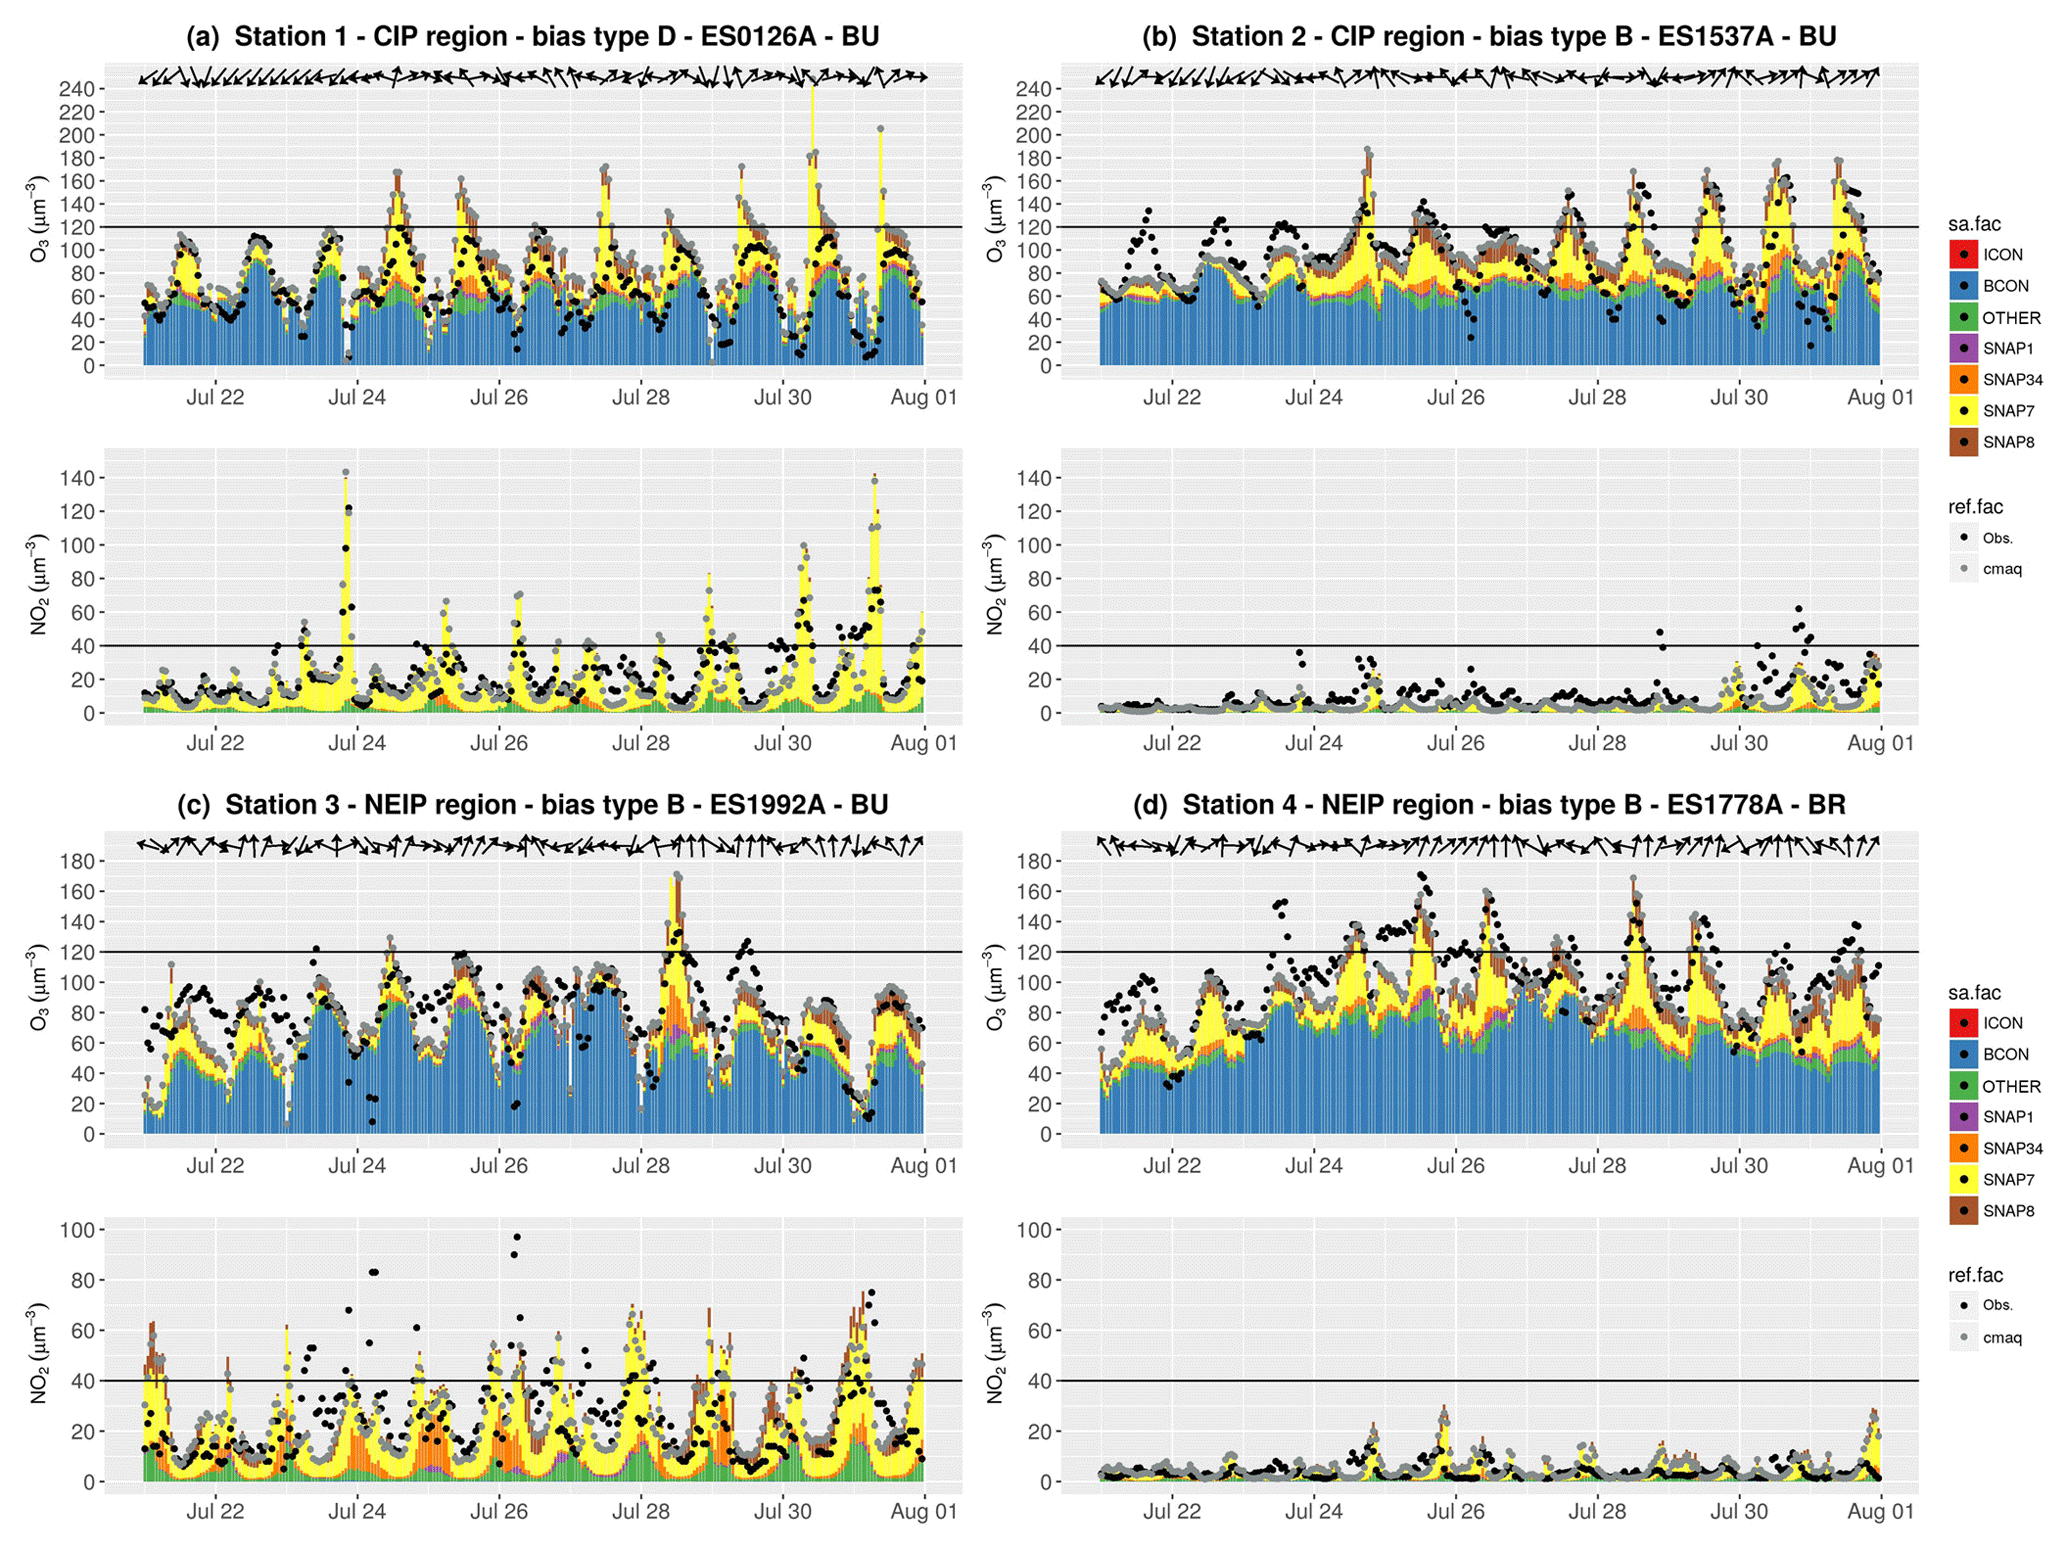
Figure 8Source apportionment time series for O3 and NO2 concentrations (in µg m−3) in the episode at the selected stations in the centre of the IP (CIP) region (a, b), and in the northeast of the IP (NEIP) (c, d). Colour bars (sa.fac) indicate the O3 tags, and black and grey dots (ref.fac) indicate the respective observed and modelled concentrations. Black horizontal lines represent the O3 target value (120 µg m−3) and the NO2 limit value (40 µg m−3) as a reference. The locations of the stations are shown in Fig. 7 using the corresponding numbers.
At the urban station downwind (Fig. 8b), modelled O3 is positively biased (MB type B) due to the underestimation of NO2. Note that the uncertainty in NO2 traffic emissions in medium-sized cities is larger than in the largest urban areas (i.e. Madrid and Barcelona) because data are generally unavailable and emissions are estimated based on population density (Baldasano et al., 2011).
The imported O3 is the main contributor at both stations, but O3 formation due to traffic increases significantly during peaks at both stations. The highest O3 concentrations (∼160 µg m−3) are modelled when westerly winds channelled along the Tajo Valley carry the polluted air masses in a northeasterly direction. This results in an O3 contribution of ∼70 µg m−3 from the road transport sector in downwind areas (see wind vectors in Fig. 8b on 28 and 31 July). The O3 contribution from the industrial sector (whose precursors could come from facilities in the south of the MMA, Fig. 4) reinforces the O3 peaks up to ∼10 µg m−3, whereas the contribution from non-road transport systematically increases the background O3 concentration by ∼15 µg m−3. The O3 contribution from non-road transport in this region may arise mainly from Madrid's airports and the agricultural machinery operating in the surrounding rural areas.
3.4.2 The northeast of the Iberian Peninsula
Figure 8c and d show the source apportionment time series at two stations in the NEIP, an urban station in Barcelona (station 3) and a remote rural downwind area (station 4). Not surprisingly, at the urban station, NO2 levels of up to 100 µg m−3 affect O3 concentrations by titration during traffic peaks. In contrast, the rural station downwind depicts a higher O3 and lower NO2 concentration than the urban station. Absolute O3 biases at both stations are ∼10 µg m−3 (MB type B).
O3 mostly results from import and from the NO titration effect due to local road transport and industrial sources (Fig. 8c). However, the O3 diurnal cycle in the urban areas of the NEIP is less marked than in the CIP due to the persistently high O3 concentration at night (∼60 µg m−3). The breezes and mountain–valley winds contribute to the accumulation and recirculation of pollutants in this region.
At the rural station, modelled O3 peaks (> 120 µg m−3) are in a good agreement with observations (Fig. 8d), which suggests that the model generally reproduces the main transport paths, photochemical processes and relative contributions from different sources. Imported O3 is one of the main contributors to ground-level O3 (from 40 to 100 µg m−3), but during peaks the on-road traffic contribution sharply increases up to 80 µg m−3.
The O3 concentration from the road transport sector arriving at rural areas in the NEIP, mainly originates from Barcelona and its surroundings as a result of the afternoon sea breezes (see wind vectors in Fig. 8c and d). However, under specific meteorological patterns these winds also carry precursors from other cities located in the northwestern Mediterranean Basin. Other authors (Gangoiti et al., 2001) have hypothesized that the high O3 concentration in the western Mediterranean Basin is influenced by transport from France via the Carcassonne gap. The present experiment cannot quantify the contribution of French cities to the O3 concentration over the NEIP, but future studies could explicitly tag the emission from the French regions.
3.4.3 Guadalquivir Valley
We have selected two stations along the Guadalquivir Valley, one in the urban area of Seville (station 5 in Fig. 9a), and one in a rural coastal area (station 6 in Fig. 9b). The contribution of non-road transport is due the influence of one of the largest Spanish harbours. The contribution of the energy sector to the O3 concentration is also noticed (e.g. 2 July). As expected, the urban station (Fig. 9a) shows a high NO2 concentration dominated by on-road traffic. NOx from traffic is the main sink of O3 in the city and the model reproduces the titration effect in agreement with observations (e.g. 28–31 July).
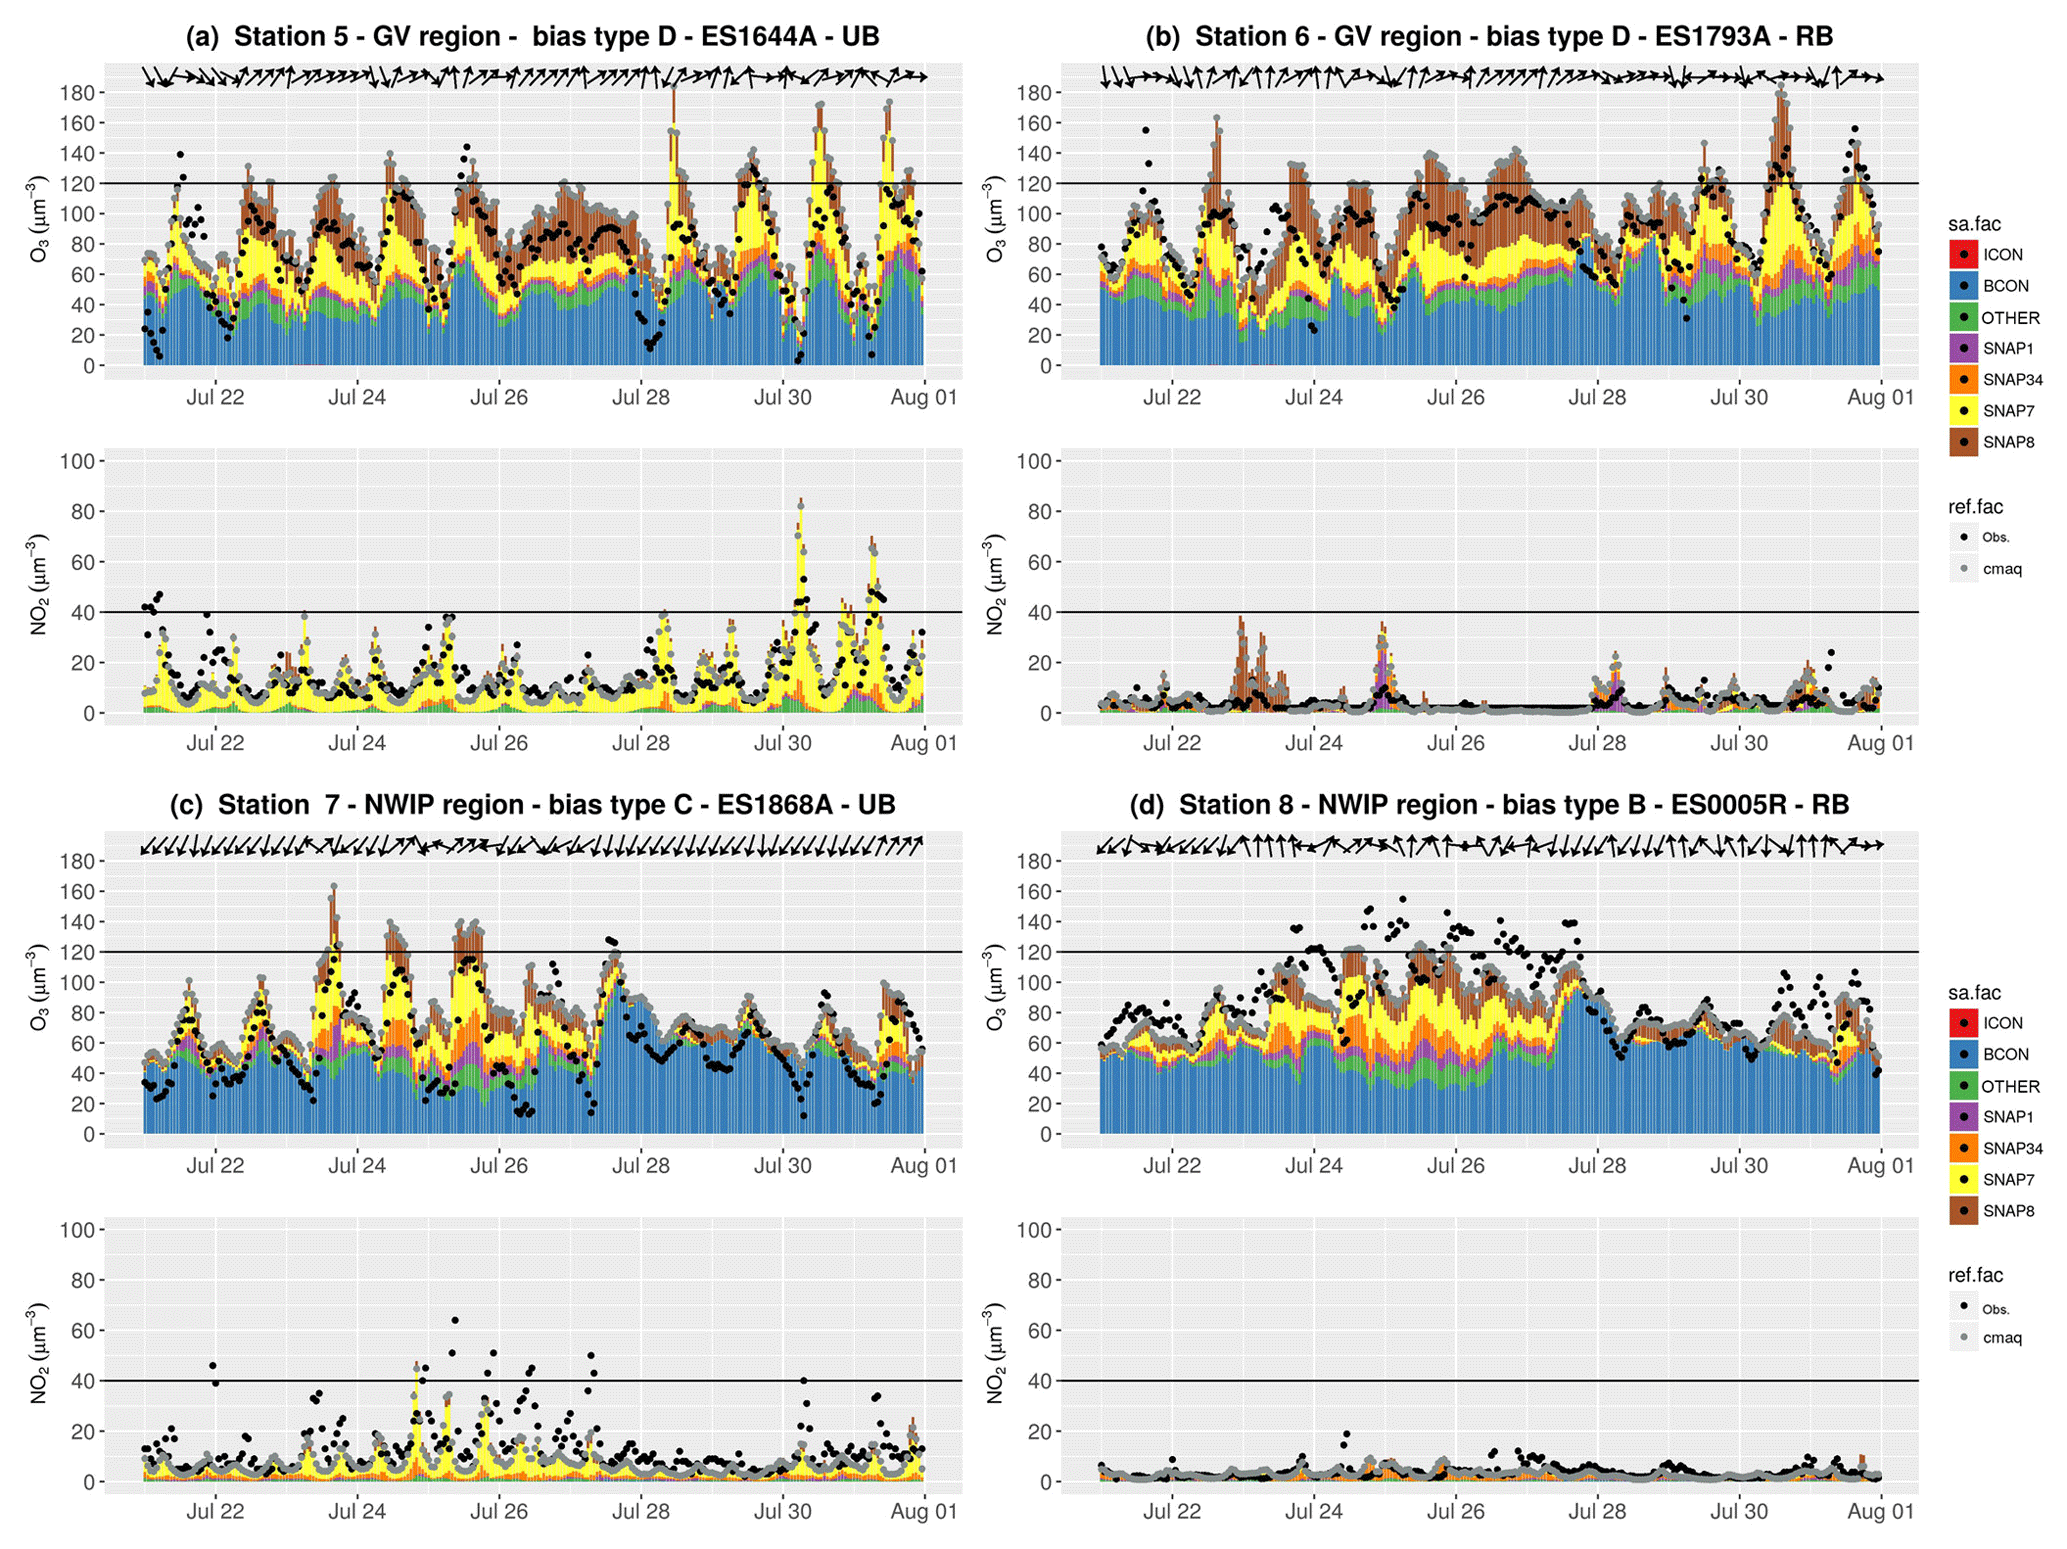
Figure 9Source apportionment time series for O3 and NO2 concentrations (in µg m−3) in the episode at the selected stations in the Guadalquivir Valley (GV) (a, b), and in the northwest of the IP (NWIP) (c, d). Colour bars (sa.fac) indicate the O3 tags, and black and grey dots (ref.fac) indicate the respective observed and modelled concentrations. Black horizontal lines represent the O3 target value (120 µg m−3) and the NO2 limit value (40 µg m−3) as a reference. The locations of the stations are shown in Fig. 7 using the corresponding numbers.
High O3 overestimations (10–30 µg m−3) at both stations (Fig. 9a and b) were detected during the 25–28 July period which correspond to intense and persistent southwesterly winds transporting air masses from the Atlantic Sea along the Guadalquivir Valley, as shown by the wind vectors in Fig. 9a and b. Although the model overestimates O3 concentrations, it reproduces the temporal variability.
Our results suggest that the non-road transport sector is a significant contributor along the Guadalquivir Valley during these days. The impact of shipping emission on O3 in the Guadalquivir Valley region is mainly evidenced by the relative high NOx from ship exhaust (Fig. S3 in the Supplement). The NO2 time series at the coastal station (Fig. 9b) indicates that the model overestimates NO2 concentrations during hours when the NO2 contribution from non-road transport is highest. The unrealistic NO2 peaks from non-road transport suggest that shipping emissions are overestimated in the HERMESv2.0 model, which uses the EMEP gridded emission inventory at 50 km × 50 km horizontal resolution to estimate shipping emissions and spatially distributes them to the 4 × 4 km2 IP4 domain using the marine routes reported by Wang et al. (2008).
A recent review on the state-of-the-art of marine traffic emissions (Russo et al., 2018) indicates that STEAM appears as the most reliable and detailed emissions inventory, as it is based on Automatic Identification System data and specific vessel information, with a resolution of 2.5×2.5 km2 (Jalkanen et al., 2016). A comparative analysis indicates that EMEP gridded inventories are overestimated, in particular over hotspots on the Mediterranean shipping routes, and underestimated on secondary routes. This factor, added to the 15 % decrease of NOx shipping emissions observed in Europe between 2009 (HERMESv2.0 base year) and 2012 (EMEP CEIP, 2019) can at least partly explain the discrepancies observed.
3.4.4 The northwest of the Iberian Peninsula
Figure 9c and d show the source apportionment time series at one urban (station 7) and one rural (station 8) background station in the NWIP. The urban station (Fig. 9c) located in Santiago de Compostela, a medium size city with ∼100 000 inhabitants, shows a high NO2 concentration with a dominant contribution from the road transport sector. Traffic NO2 is the main sink of urban O3 via titration. Because NO2 is underestimated, especially during stagnant conditions (24–27 July), O3 concentrations are overestimated (MB type C).
Despite the O3 biases during stagnant conditions, the modelled O3 concentration is in general agreement with observations at the rural background station (Fig. 9d). NO2 is likely to be underestimated due to missing traffic emissions. As previously noted, traffic emissions are poorly constrained in small and medium-sized cities, due to a lack of detailed information. There is also additional uncertainty in the precursors emitted from the large coal power plants and industries in the region (Valverde et al., 2016b). Our study uses emissions for 2009, and it has been estimated that between 2009 and 2012 energy production in coal-fired power plants increased from 13.1 % to 19.4 % (IEA, 2019). This implies an increase in NOx emissions from the power industry sector of around 19.5 % (EMEP CEIP, 2019).
The time series show that the model reproduces the observed O3 variability reasonably well under different synoptic conditions. O3 reaches its highest concentrations (∼ 100/150 µg m−3 in urban/rural areas) under stagnant conditions (24–27 July) when the contribution of anthropogenic sources from all activity sectors is highest (60 %–70 %). O3 concentrations decrease down to ∼70 µg m−3 under northwest advective conditions (e.g. 28–30 July) when the imported O3 shows the highest contribution (80 %–90 %). Saavedra et al. (2012) found that stationary anticyclones over the NWIP play an important role in the occurrence of high O3 concentrations. Our results show that under these stagnant conditions O3 concentrations are largely due to in situ production (photochemistry) from on-road traffic, shipping, power plants and industry in almost the same proportion.
3.5 Imported ozone
Our results indicate that imported O3 represents the highest contribution to the ground-level O3 concentration in southwestern Europe. Imported O3 enters the IP4 domain through the boundaries; it includes the contribution of O3 from the EU12 domain, which in turn includes the contribution of hemispheric O3 from the MOZART-4 global model. The imported O3 contribution is as large as the background O3 regionally produced within the IP. Note that the small biases at rural background stations obtained in the evaluation section indicate an overall high performance of the modelled background O3 in the IP4 domain (Fig. S1 in the Supplement). Given the important implications and robustness of these results, we further analyse this contribution below. In particular, we aim to understand its high contribution within the IP, even far from the model domain boundaries.
Figure 10 shows the vertical cross-sections at 06:00, 12:00 and 18:00 UTC for O3 and NO2 at a constant latitude (40.38∘ N) on 25, 28 and 30 July. It helps to understand the vertical variability of both pollutants according to the PBL as schematized by Millán et al. (1996). The model predicts a pronounced O3 vertical gradient above a height of 4 km above sea level (a.s.l.), showing that O3 in the free troposphere is, to a large extent, imported to the IP4 domain (Safieddine et al., 2014). As expected, NO2 mixing ratios show a negative gradient with altitude as it is mainly emitted at the surface. In the morning, the sun starts to heat the ground up, producing convective thermals and forcing the growth of the mixing layer. At noon, the mixing height reaches its maximum: it is highest in the CIP (2–4 km) and decreases towards the coast (< 1 km) (Fig. 10). At the top of the mixing layer the O3-enriched air aloft is entrained into the mixing layer, mixing with O3 and other pollutants produced locally within the mixing layer. When the mixing height decreases, O3 is left in the free troposphere forming high O3 residual layers (Gangoiti et al., 2001) that contribute to the regional transport. Over the following days, these residual layers (composed of imported O3 and local O3 produced within the domain over previous days) can be entrained by fumigation into the mixing layer to reach the surface. This fumigation effect, previously described in the eastern USA (Zhang and Rao, 1999; Langford et al., 2015) and in the western Mediterranean Basin (Kalabokas et al., 2017; Querol et al., 2018), leads to a rapid increase in O3 concentrations at ground level. The accumulation and recirculation of air masses is intensified along the eastern Mediterranean coast (Millán et al., 1996, 2000; Gangoiti et al., 2001; Querol et al., 2017) by the action of the breezes and mountain–valley winds. Furthermore, the small deposition velocity of O3 over the sea and its high atmospheric lifetime in the free troposphere contributes to enrich the O3 background concentration (ca. several weeks, Monks et al., 2015; Seinfeld and Pandis, 2016).

Figure 10Cross section of modelled mixing ratios (in ppb) for O3 (a) and NO2 (b) at a constant latitude (latitude = 40.38∘, Madrid city) of the daily Iberian thermal low circulation, equivalent to the conceptual scheme of Millán et al. (1996) for 25 July (first column), 28 July (second column) and 30 July (third column) at 06:00, 12:00 and 18:00 UTC. Dotted lines indicate the PBL height. Vertical arrows indicate the vertical wind. Up arrows depict positive winds. Note the different scales of the y axes between O3 and NO2.
The O3 fumigation effect was particularly intense from 30 to 31 July, when high O3 levels are found in the free troposphere compared with previous days (Fig. 10). The analysis of the O3 concentration map with the imported O3 contributions (Fig. 6) indicates that ground-based O3 is neither advected nor titrated; therefore, it can only result from vertical mixing. The high O3 mixing ratio in the free troposphere was mainly due to O3 advection entering the Atlantic boundary driven by westerlies (Fig. 3). We hypothesize that two events may have contributed to the increase of the O3 concentration by long-range transport: first, a low-pressure system in the British islands on 28 July could have transported significant amounts of O3 from the stratosphere to the free troposphere (Fig. S7 in the Supplement); second, O3 episodes generated in mid-July over the eastern USA predicted by the MOZART-4 model could have contributed to an increase in the O3 transported from North America to Europe by the action of the prevailing westerlies (Fig. S7 in the Supplement) associated with cyclonic systems along the “warm conveyor belt” (Pausata et al., 2012; Derwent et al., 2015).
Our study has provided a first estimation of the main sources responsible for high O3 concentrations in the western Mediterranean Basin during the 21–31 July 2012 period. We used the Integrated Source Apportionment Method (ISAM) within the CALIOPE system to estimate the contribution of the main anthropogenic activity sectors to peak O3 events in Spain compared with the imported O3. In addition, the use of ISAM has allowed an in-depth evaluation of the model.
The results demonstrate that the O3 problem over the western Mediterranean Basin is local, regional and hemispheric. Long-range transport of O3 from beyond the IP domain is the main contributor to the ground-level daily mean O3 concentration (∼45 %) during peak episodes. The imported O3 contribution ranges from 40 % during O3 peaks to 80 % at night or during well-ventilated conditions. The absolute imported O3 is higher in the northeast of the IP than in the central IP due to the recirculation and accumulation of pollutants along the Mediterranean. The high imported O3 at the surface far away from the model boundaries is consistent with the high levels of O3 in the free troposphere (resulting from local/regional layering and accumulation, and continental/hemispheric transport) along with intense vertical mixing during the day.
Our results support the European Commission (EC, 2004) in pointing out that the effectiveness of abatement strategies for achieving compliance with the European air quality standards in southern Europe might be compromised by the long-range transport of O3. This is especially true in Mediterranean regions (i.e. NEIP, EV and EIP) where the contribution of imported O3 is particularly dominant (60 %–68 % of the daily mean O3 concentration) as a result of the accumulation and recirculation of pollutants over the Mediterranean Basin. In these areas, if the long-range transport of O3 is not reduced, the mean background level will not decrease, making it more vulnerable to exceedances of the O3 target values by enhanced local production under stagnant conditions.
During high O3 events, the imported O3 is added to the formation from local and regional anthropogenic sectors. Road transport is an important contributor to the O3 concentration in rural areas downwind of large cities in Spain; it contributed up to 16 %–18 % of the daily mean O3 concentration under exceedances of the target value for human health protection, and up to 70 µg m−3 on an hourly basis downwind of Barcelona and Madrid.
The non-road transport sector (including international shipping, airports and agricultural machinery) is as significant as road transport inland (10 %–19 % of the daily mean O3 concentration during the peaks). There is a high influence of international shipping (13 %), affecting the coastal areas in the Mediterranean and the south of the IP (along the Strait of Gibraltar) with contributions of up to ∼20 and ∼30 µg m−3, respectively. Although the non-road transport contribution was found to be overestimated in coastal areas in the south of the IP in the present experiment, it cannot be neglected; furthermore, actions controlling international shipping should be considered as important as those related to road transport, especially in regions with big harbours (e.g. Huelva and Barcelona). Dalsøren et al. (2010) indicated that the annual O3 concentration is increasing annually between 1 and 5 µg m−3 in areas impacted by shipping activities. Recent studies indicate that shipping emissions are projected to increase significantly due to increases in transportation demand and traffic. As the Strait of Gibraltar is the only shipping route connecting the Atlantic Ocean with the Mediterranean Basin, the regulation of these emissions is key in order to control O3 exceedances in Spain and the Mediterranean Basin. Shipping emissions can be regulated by each country within 400 km of coastlines, but policy-induced controls for offshore emissions are very dependent on the success of adopted and proposed regulations within the International Maritime Organization.
The energy and industrial sectors contribute ∼6 %–11 % of the daily mean O3 concentration during the peaks and over all the receptor regions. As they are usually injected at high altitudes, their contribution extends way beyond their surroundings. The energy combustion sector (3 %) and industrial and non-industrial combustion sectors (3 %) have a mean contribution of 2–4 µg m−3, reaching to 4–6 µg m−3 in NOx-limited areas (i.e. the western IP). In highly industrialized regions (i.e. Guadalquivir Basin and northwestern IP), abatement strategies affecting all sectors at a regional scale could contribute to decrease the local formation of O3 as the regional/local anthropogenic contribution can be greater than 50 % over several days.
In the Barcelona metropolitan area the contribution from energy and industrial sectors to the NO2 concentrations can be in the same range as the contribution from road transport (∼40 %–60 %, Fig. 8c). In contrast, in areas downwind of Barcelona the contribution from energy and industrial sectors to O3 concentrations is relatively low compared with the contribution from road transport (Fig. 8d). The different contributions to the O3 concentration might be related to the different reactivity of VOCs for O3 formation. Each VOC emission source emits a different mix of VOCs, which contributes differently to photochemical ozone formation. For example, in the UK, Derwent et al. (2007) showed a higher photochemical O3 creation potential for road transport emissions than for production processes and combustion. Future national policy actions to control the emissions of VOCs should tackle the sources that contribute more to photochemical O3 formation.
The remaining sectors (i.e. SNAP 2, 5, 6, 9 and 11; see Table 1), are the fourth main contributors to the daily mean O3 concentration during the days exceeding the target value (∼2 %–8 %). Future work should tag biogenic sources as an individual sector as they are the main contributor to VOC emissions in Spain (i.e. ∼70 % in 2009 according to the HERMESv2.0 model).
The air quality and meteorological evaluations indicate that uncertainties in our model are in the same range as the most recent inter-comparison studies using state-of-the-art air quality models. In addition, our model evaluation and the source apportionment results have allowed for a better understanding of the origin of model errors related to emission estimates. Our methodological choice was to use a detailed bottom-up emission inventory instead of a typical top-down regional emission inventory. Bottom-up emissions, estimated using source-specific emission factors and activity statistics, accurately characterize pollutant sources and allow for more realistic results to be obtained than those reported by top-down or regional emission inventories. To understand the impact of the use of 2009 data to study the year 2012, we revised the EMEP Centre on Emission Inventories and Projections (EMEP-CEIP), which collects and reviews the national emission inventories from parties to the Convention on Long-range Transboundary Air Pollution. Between 2009 and 2012, total NOx and non- methane volatile organic compound (NMVOC) emissions in Spain decreased by −10.6 % and −10.7 %, respectively (EMEP CEIP, 2019). For NOx, around 80 % of this reduction is linked to a reduction of road transport emissions, whereas in the case of NMVOCs ∼50 % of the reduction is due to a decrease in industrial emissions. For our modelling study, we consider these differences as small and acceptable (and as not creating any major inconsistency). The difference of 10 %–15 % in emissions for certain precursors between 2009 and 2012 is within the typically larger ranges of uncertainty in emission inventories.
Another relevant and uncertain source of O3 is the VOC emitted in urban areas. Future research works should be devoted to the continuous monitoring of urban VOC and take advantage of satellite observations to improve speciation and spatial variability of urban VOC emissions.
We have identified two sources of uncertainty in the estimation of the imported O3. First, it depends on both the performance of the CALIOPE system over EU12 and on MOZART-4 at a global scale. The small biases at rural background stations support an overall high performance baseline background O3 in the IP4 domain (Fig. S1 in the Supplement). Second, our set-up involves some uncertainty in the estimation of the imported contribution of O3. In reality, there is a fraction of the imported O3 that may have been generated within the IP4 domain before the period of simulation (including the spin-up). We have assumed that this fraction is negligible and future works should check the extent to which this assumption is correct.
For regulatory applications, further source apportionment studies should target not only emissions from activity sectors, but also the source regions where the emission abatement strategies should be applied. In addition, future studies should preferentially cover multiple summer periods in order to improve representativeness. We note that our results cannot predict whether emission abatement will have either a positive or a negative effect in O3 changes due to the non-linearity of the O3 generation process. Subsequent source sensitivity analyses tailoring the identified main contribution sources could predict how O3 will respond to reductions in precursor emissions, which are essential to define the most efficient O3 abatement strategies in the western Mediterranean Basin.
Overall, we find that the imported O3 is the largest input to the ground-level O3 concentration in the IP during the episode studied. However, during stagnant conditions, the emission from local anthropogenic activities in the IP control the O3 peaks in areas downwind of the main urban and industrial regions. Furthermore, ground-level O3 concentrations are strongly affected by vertical downward mixing of O3-rich layers in the free troposphere, which result from local/regional layering and accumulation, and continental/hemispheric transport. The importance of both imported and local contributions to the O3 peaks in the IP demonstrates the need for detailed quantification of both contributions to high O3 concentrations for local O3 management. Furthermore, the influence of local sources and topographical and meteorological conditions in the high O3 concentration indicate the importance of designing O3 abatement policies at the local scale.
This work has quantified the local and imported contributions to O3 during an episode in a particular area in southwestern Europe. In addition, we have provided a perspective regarding the potential use of source apportionment methods for regulatory studies in non-attainment regions. Further O3 source apportionment studies targeting other non-attainment regions in Europe are necessary prior to designing local mitigation measures that complement national and European-wide abatement efforts.
Air quality measurements are available at the EIONET database (https://www.eea.europa.eu/data-and-maps/data/aqereporting-8\#tab-figures-produced, European Environmental Agency, Air Quality e-Reporting, last access 4 April 2019). The CMAQ code is available at https://www.cmascenter.org/ (Community Modeling and Analysis System, last access 4 April, 2019). The WRF-ARW code is available at The WRF-ARW code is available at http://www2.mmm.ucar.edu/wrf/users/download/get_source.html, (National Center for Atmospheric Research, last access: 4 April 2019). Download Mozart-4 outputs are available at https://www2.acom.ucar.edu/gcm/mozart, (National Center for Atmospheric Research, last access: 4 April 2019). The program that generates CMAQ boundary conditions from MOZART-4 output is available at http://www.camx.com/getmedia/a0c2d710-6187-47bb-af3f-bd9b4a4d19bb/mozart2camx-12jul17, (Ramboll Environ, last access: 4 April 2019). The HERMESv2 outputs are available upon request. The modelled data in this study are available upon request from the corresponding author.
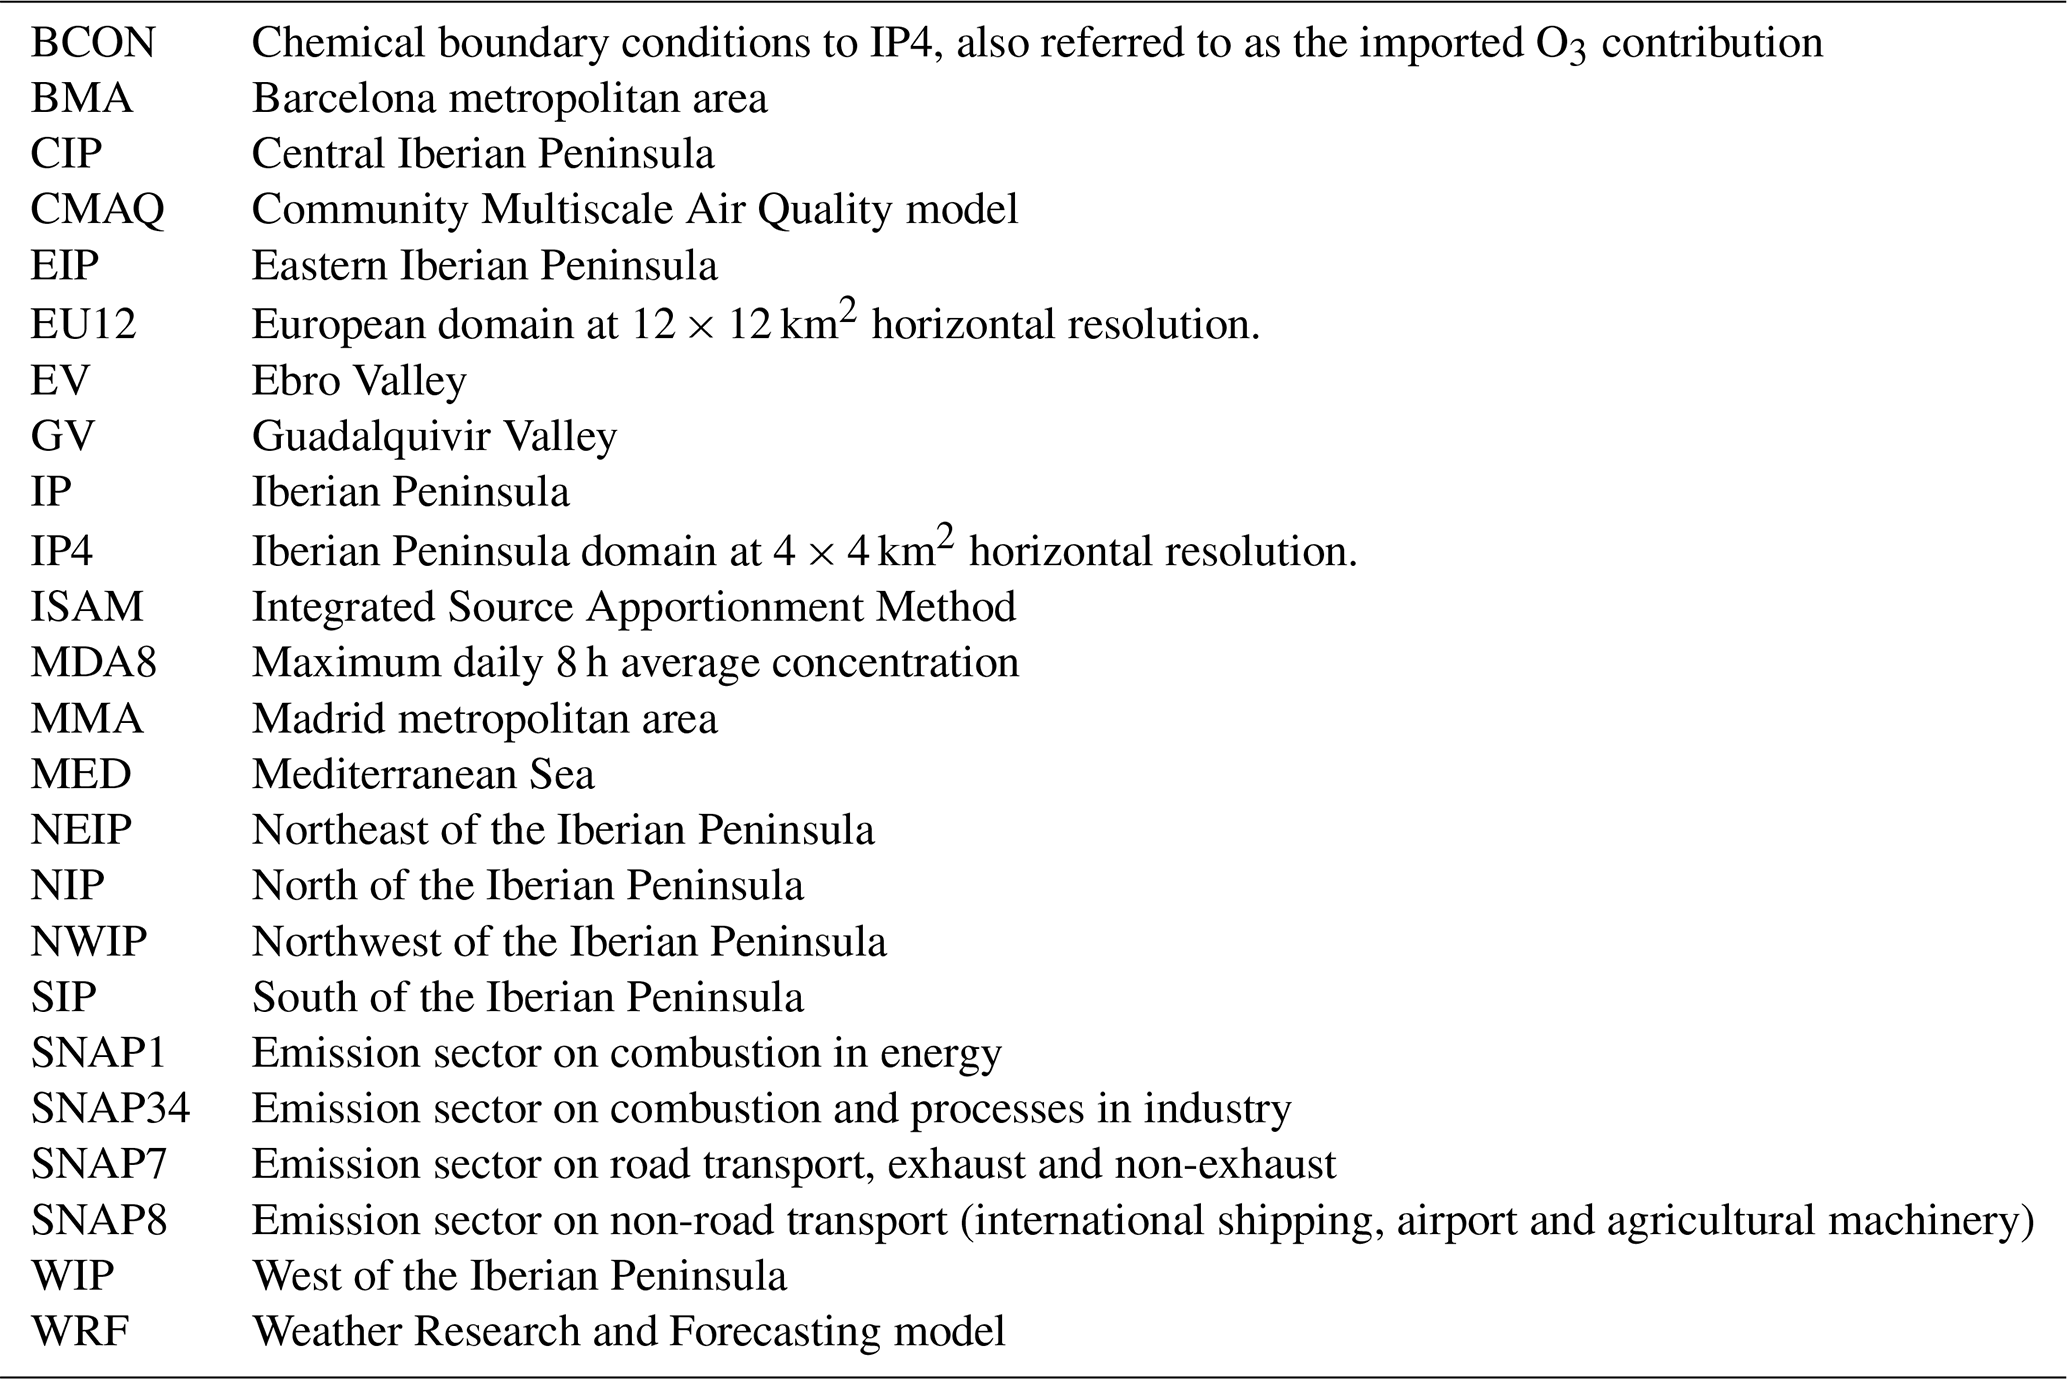
Definition of the discrete statistics used in the evaluation: correlation coefficient (r, Eq. B1), mean bias (MB, Eq. B2), normalized mean bias (NMB, Eq. B3) and root mean squared error (RMSE, Eq. B4). Where Cm(x, t) and Co(x,t) are the respective modelled and observed concentrations at a location (x) and time (t); N is the number of pairs of data. and are the modelled and observed mean concentrations over the whole period, respectively.
The supplement related to this article is available online at: https://doi.org/10.5194/acp-19-5467-2019-supplement.
MTP designed the research. SN provided support regarding the ISAM set-up for this experiment. MTP performed the model simulations. All the authors analysed the data and discussed the results. MTP and CPGP wrote the paper.
The authors declare that they have no conflict of interest.
This study has been supported by the Spanish Ministry of Economy and Competitiveness and FEDER funds under the PAISA (CGL2016-75725-R) project. This work was granted access to the high performance computer resources of the “Red Española de Supercomputación” (AECT-2017-1-0008). The views expressed in this article are those of the authors and do not necessarily represent the views or policies of the US Environmental Protection Agency. Carlos Pérez García-Pando acknowledges long-term support from the AXA Research Fund, as well as the support received through the Ramón y Cajal programme (grant no. RYC-2015-18690) of the Spanish Ministry of Economy and Competitiveness.
This paper was edited by Andrea Pozzer and reviewed by three anonymous referees.
Aksoyoglu, S., Baltensperger, U., and Prévôt, A. S. H.: Contribution of ship emissions to the concentration and deposition of air pollutants in Europe, Atmos. Chem. Phys., 16, 1895–1906, https://doi.org/10.5194/acp-16-1895-2016, 2016.
Appel, K. W., Pouliot, G. A., Simon, H., Sarwar, G., Pye, H. O. T., Napelenok, S. L., Akhtar, F., and Roselle, S. J.: Evaluation of dust and trace metal estimates from the Community Multiscale Air Quality (CMAQ) model version 5.0, Geosci. Model Dev., 6, 883–899, https://doi.org/10.5194/gmd-6-883-2013, 2013.
Baldasano, J. M., Jiménez-Guerrero, P., Jorba, O., Pérez, C., López, E., Güereca, P., Martín, F., Vivanco, M. G., Palomino, I., Querol, X., Pandolfi, M., Sanz, M. J., and Diéguez, J. J.: Caliope: an operational air quality forecasting system for the Iberian Peninsula, Balearic Islands and Canary Islands – first annual evaluation and ongoing developments, Adv. Sci. Res., 2, 89–98, https://doi.org/10.5194/asr-2-89-2008, 2008.
Baldasano, J. M., Pay, M. T., Jorba, O., Gassó, S., and Jiménez-Guerrero, P.: An annual assessment of air quality with the CALIOPE modeling system over Spain, Sci. Total Environ., 409, 2163–2178, https://doi.org/10.1016/j.scitotenv.2011.01.041, 2011.
Basart, S., Pérez, C., Nickovic, S., Cuevas, E., and Baldasano, J. M.: Development and evaluation of the BSC-DREAM8b dust regional model over Northern Africa, the Mediterranean and the Middle East, Tellus B, 64, 18539, https://doi.org/10.3402/tellusb.v64i0.18539, 2012.
Bessagnet, B., Pirovano, G., Mircea, M., Cuvelier, C., Aulinger, A., Calori, G., Ciarelli, G., Manders, A., Stern, R., Tsyro, S., Gar- cía Vivanco, M., Thunis, P., Pay, M.-T., Colette, A., Couvidat, F., Meleux, F., Rouïl, L., Ung, A., Aksoyoglu, S., Baldasano, J. M., Bieser, J., Briganti, G., Cappelletti, A., D'Isidoro, M., Fi- nardi, S., Kranenburg, R., Silibello, C., Carnevale, C., Aas, W., Dupont, J.-C., Fagerli, H., Gonzalez, L., Menut, L., Prévôt, A. S. H., Roberts, P., and White, L.: Presentation of the EURODELTA III intercomparison exercise – evaluation of the chemistry transport models' performance on criteria pollutants and joint analysis with meteorology, Atmos. Chem. Phys., 16, 12667–12701, https://doi.org/10.5194/acp-16-12667-2016, 2016.
Booker, F. L., Muntifering, R., McGrath, M., Burkey, K., Decoteau, D., Fiscus, E., Manning, W., Krupa, S., Chappelka, A., and Grantz, D.: The ozone component of global change: potential effects on agricultural and horticultural plant yield, product quality and interactions with invasive species, J. Integr. Plant Biol., 51, 337–351, https://doi.org/10.1111/j.1744-7909.2008.00805.x, 2009.
Borrego, C., Monteiro, A., Martins, H., Ferreira, J., Fernandes, A. P., Rafael, S., Miranda, A. I., Guevara, M., and Baldasano, J. M.: Air quality plan for ozone: an urgent need for North Portugal, Air Qual. Atmos. Health, 8, 352–366, https://doi.org/10.1007/s11869-015-0352-5, 2016.
Butler, T., Lupascu, A., Coates, J., and Zhu, S.: TOAST 1.0: Tropospheric Ozone Attribution of Sources with Tagging for CESM 1.2.2, Geosci. Model Dev., 11, 2825–2840, https://doi.org/10.5194/gmd-11-2825-2018, 2018.
Byun, D. W. and Schere, K. L.: Review of the governing equations, computational algorithms and other components of the Models-3 Community Multiscale Air Quality (CMAQ) Modeling System, Appl. Mech. Rev., 59, 51–77, https://doi.org/10.1115/1.2128636, 2006.
Carslaw, D. C. and Ropkins, K.: Openair – an R package for air quality data analysis. Environ. Modell. Softw., 27, 52–61, https://doi.org/10.1016/j.envsoft.2011.09.008, 2012.
Carter, W. P. L.: Development of ozone reactivity scales for volatile organic compounds, J. Air Waste Manage. Assoc., 45, 4438–4445, https://doi.org/10.1080/1073161X.1994.10467290, 1994.
Clappier, A., Belis, C. A., Pernigotti, D., and Thunis, P.: Source apportionment and sensitivity analysis: two methodologies with two different purposes, Geosci. Model Dev., 10, 4245–4256, https://doi.org/10.5194/gmd-10-4245-2017, 2017.
Crutzen, P. J.: Photochemical reactions initiated by an influencing ozone in the unpolluted troposphere, Tellus, 26, 47–57, https://doi.org/10.1111/j.2153-3490.1974.tb01951.x, 1975.
Dalsøren, S. B., Eide, M. S., Myhre, G., Endresen, O., Isaksen, I. S. A., and Fuglestvedt, J. S.: Impacts of the large increase in international ship traffic 2000–2007 on tropospheric ozone and methane, Environ. Sci. Technol., 44, 2482–2489, https://doi.org/10.1021/es902628e, 2010.
Demuzere, M., Trigo, R. M., Vila-Guerau de Arellano, J., and van Lipzig, N. P. M.: The impact of weather and atmospheric circulation on O3 and PM10 levels at a rural mid-latitude site, Atmos. Chem. Phys., 9, 2695–2714, https://doi.org/10.5194/acp-9-2695-2009, 2009.
Derwent, R., Jenkin, M. E., Passant, N. R., and Pilling, M. J.: Photochemical ozone creation potentials (POCPs) for different emission sources of organic compounds under European conditions estimated with a Master Chemical Mechanism, Atmos. Environ., 41, 2570–2579, https://doi.org/10.1016/j.atmosenv.2006.11.019, 2007.
Derwent, R., Utembe, S. R., Jenkin, M. E., and Shallcross, D. E.: Tropospheric ozone production regions and the intercontinental origins of surface ozone over Europe, Atmos. Environ., 112, 216–224, https://doi.org/10.1016/j.atmosenv.2015.04.049, 2015.
Diéguez, J. J., Calatayud, V., and Mantilla, E.: Informe final. Memoria Técnica Proyecto CONOZE (Contaminación por Ozono en España), 139 pp., available at: https://www.miteco.gob.es/es/calidad-y-evaluacion-ambiental/temas/atmosfera-y-calidad-del-aire/Informe_t% C3% A9cnico_CONOZE% 5B1% 5D_tcm30-187899.pdf (last access 4 April 2019), 2014.
EC: European Commission Decision of 19 March 2004, Concerning guidance for implementation of Directive 2002/3/EC of the European Parliament and the Council relating to ozone in ambient air (2004/279/EC), Official Journal of the European Union, L87/50 of 25 March 2004, 2004.
EEA: Air pollution by ozone across Europe during summer 2012, EEA Report No. 3/2013, 48 pp., https://doi.org/10.2800/70933, 2013.
EEA: Air quality in Europe – 2017 report, EEA Report, No. 13/2017, ISSN 978-92-9213-920-9, 2017.
EMEP-CCC: Air pollution trends in the EMEP region between 1990 and 2012, EMEPCCC-Report 2016/1, 102 pp., available at: http://icpvegetation.ceh.ac.uk/publications/documents/EMEP_Trends_Report_final_published.pdf (last access: 4 April 2019), 2016.
EMEP CEIP: Officially reported emission data, available at: http://www.ceip.at/ms/ceip_home1/ceip_home/data_viewers/official_tableau/ last access: February 2019.
Emmons, L. K., Walters, S., Hess, P. G., Lamarque, J.-F., Pfister, G. G., Fillmore, D., Granier, C., Guenther, A., Kinnison, D., Laepple, T., Orlando, J., Tie, X., Tyndall, G., Wiedinmyer, C., Baughcum, S. L., and Kloster, S.: Description and evaluation of the Model for Ozone and Related chemical Tracers, version 4 (MOZART-4), Geosci. Model Dev., 3, 43–67, https://doi.org/10.5194/gmd-3-43-2010, 2010.
Ferreira, J., Guevara, M., Baldasano, J. M., Tchepel, O., Schaap, M., Miranda, A. I., and Borrego, C.: A comparative analysis of two highly spatially resolved atmospheric emission inventories that are available in Europe, Atmos. Environ., 75, 43–57, https://doi.org/10.1016/j.atmosenv.2013.03.052, 2013.
Gangoiti, G., Millán, M. M., Salvador, R., and Mantilla, E.: Long-range transport and re-circulation of pollutants in the western Mediterranean during the project Regional Cycles of Air Pollution in the West-Central Mediterranean Area, Atmos. Environ. 35, 6267–6276, https://doi.org/10.1016/S1352-2310(01)00440-X, 2001.
Gangoiti, G., Alonso, L., Navazo, M., Albizuri, A., Pérez-Landa, G., Matabuena, M., Valdenebro, V., Maruri, M., García, J. A., and Millán, M. M.: Regional transport of pollutants over de Bay of Biscay: analysis of an ozone episode under a blocking anticyclone in west-central Europe, Atmos. Environ., 36, 1349–1361, https://doi.org/10.1016/S1352-2310(01)00536-2, 2002.
Gangoiti, G., Albizuri, A., Alonso, L., Navazo, M., Matabuena, M., Valdenebro, V., García, J. A., and Millán, M. M.: Sub-continental transport mechanisms and pathways during two ozone episodes in northern Spain, Atmos. Chem. Phys., 6, 1469–1484, https://doi.org/10.5194/acp-6-1469-2006, 2006.
Gerasopoulos, E., Kouvarakis, G., Vrekoussis, M., Kanakidou, M., and Mihalopoulos, N.: Ozone variability in the marine boundary layer of the Eastern Mediterranean based on 7-year observations, J. Geophys. Res., 110, D15309, https://doi.org/10.1029/2005JD005991, 2005.
Gonçalves, M., Jiménez-Guerrero, P., and Baldasano, J. M.: Contribution of atmospheric processes affecting the dynamics of air pollution in South-Western Europe during a typical summertime photochemical episode, Atmos. Chem. Phys., 9, 849–864, https://doi.org/10.5194/acp-9-849-2009, 2009.
Guenther, A., Karl, T., Harley, P., Wiedinmyer, C., Palmer, P. I., and Geron, C.: Estimates of global terrestrial isoprene emissions using MEGAN (Model of Emissions of Gases and Aerosols from Nature), Atmos. Chem. Phys., 6, 3181–3210, https://doi.org/10.5194/acp-6-3181-2006, 2006.
Guevara, M., Martínez, F., Arévalo, G., Gassó, S., and Baldasano, J. M.: An improved system for modelling Spanish emissions: HERMESv2.0, Atmos. Environ., 81, 209–221, https://doi.org/10.1016/j.atmosenv.2013.08.053, 2013.
Guevara, M., Pay, M. T., Martínez, F., Soret, A., van der Gon, H. D., and Baldasano, J. M.: Inter-comparison between HERMESv2.0 and TNO-MACC-II emission data using the CALIOPE air quality system (Spain), Atmos. Environ. 98, 134–145, https://doi.org/10.1016/j.atmosenv.2014.08.067, 2014.
Holloway, T., Fiore, A., and Galanter Hastings, M.: Intercontinental transport of air pollution: will emerging science lead to a new hemispheric treaty?, Environ. Sci. Technol., 37, 4535–4542, https://doi.org/10.1021/es034031g, 2003.
IEA: International Energy Agency, available at: https://www.iea.org/statistics/?country=SPAIN&year=2016&category=Key indicators&indicator=ElecGenByFuel&mode=chart&dataTable=ELECTRICITYANDHEAT, last access: 4 April 2019.
Im, U., Bianconi, R., Solazzo, E., Kioutsioukis, I., Badia, A., Balzarini, A., Baró, R., Bellasio, R., Brunner, D., Chemel, C., and Curci, G.: Evaluation of operational on-line-coupled regional air quality models over Europe and North America in the context of AQMEII phase 2. Part I: Ozone. Atmos. Environ., 115, 404–420, https://doi.org/10.1016/j.atmosenv.2014.09.042, 2015.
Jacob, D. and Winner, D.: Effect of climate change on air quality, Atmos. Environ., 43, 51–63, https://doi.org/10.1016/j.atmosenv.2008.09.051, 2009.
Jaimes-Palomera, M., Retama, A., Elias-Castro, G., Neria-Hernández, A., Rivera-Hernández, O., and Velasco, E.: Non-methane hydrocarbons in the atmosphere of Mexico City: Results of the 2012 ozone-season campaign, Atmos. Environ., 132, 258–275, https://doi.org/10.1016/j.atmosenv.2016.02.047, 2016.
Jalkanen, J.-P., Johansson, L., and Kukkonen, J.: A comprehensive inventory of ship traffic exhaust emissions in the European sea areas in 2011, Atmos. Chem. Phys., 16, 71–84, https://doi.org/10.5194/acp-16-71-2016, 2016.
Jiménez, P., Lelieveld, J., and Baldasano, J. M.: Multiscale modelling of air pollutants dynamics in the northwestern Mediterranean basing during a typical summertime episode, J. Geophys. Res., 111, D18306, https://doi.org/10.1029/2005JD006516, 2006.
Jorba, O., Pérez, C., Rocadenbosch, F., and Baldasano, J. M.: Cluster analysis of 4-Day Back Trajectories Arriving in the Barcelona Area, Spain, from 1997 to 2002, J. Appl. Meteorol., 43, 887–901, 2004.
Kalabokas, P., Hjorth, J., Foret, G., Dufour, G., Eremenko, M., Siour, G., Cuesta, J., and Beekmann, M.: An investigation on the origin of regional springtime ozone episodes in the western Mediterranean, Atmos. Chem. Phys., 17, 3905–3928, https://doi.org/10.5194/acp-17-3905-2017, 2017.
Karamchandani, P., Long, Y., Pirovano, G., Balzarini, A., and Yarwood, G.: Source-sector contributions to European ozone and fine PM in 2010 using AQMEII modeling data, Atmos. Chem. Phys., 17, 5643–5664, https://doi.org/10.5194/acp-17-5643-2017, 2017.
Kwok, R. H. F., Napelenok, S. L., and Baker, K. R.: Implementation and evaluation of PM2.5 source contribution analysis in a photochemical model, Atmos. Environ., 80, 398–407, https://doi.org/10.1016/j.atmosenv.2013.08.017, 2013.
Kwok, R. H. F., Baker, K. R., Napelenok, S. L., and Tonnesen, G. S.: Photochemical grid model implementation and application of VOC, NOx, and O3 source apportionment, Geosci. Model Dev., 8, 99–114, https://doi.org/10.5194/gmd-8-99-2015, 2015.
Lateb, M., Meroney, R. N., Yataghene, M., Fellouah, H., Saleh, F., and Boufadel, M. C.: On the use of numerical modelling for near-field pollutant dispersion in urban environments – A review, Environ. Pollut., 208, 271–283, https://doi.org/10.1016/j.envpol.2015.07.039, 2016.
Langford, A. O., Sen, C. J., Alvarez, R. J., Brioude, J., Cooper, O. R., Holloway, J. S., Lind, M. Y., Marchbanksa, R. D., Pierce, R. B., Sandberg, S. P., Weickmann, A. M., and Williams, E. J.: An Overview of the 2013 Las Vegas Ozone Study (LVOS): Impact of stratospheric intrusions and long-range transport on surface air quality, Atmos. Environ., 109, 305–322, 2015.
Lelieveld, J., Berresheim, H., Borrmann, S., Crutzen, P. J., Dentener, F. J., Fischer, H., Feichter, J., Flatau, P. J., Heland, J., Holzinger, R., Korrmann, R., Lawrence, M. G., Levin, Z., Markowicz, K. M., Mihalopoulos, N., Minikin, A., Ramanathan, V., de Reus, M., Roelofs, G. J., Scheeren, H. A., Sciare, J., Schlager, H., Schultz, M., Siegmund, P., Steil, B., Stephanou, E. G., Stier, P., Traub, M., Warneke, C., Williams, J., and Ziereis, H.: Global air pollution crossroads over the Mediterranean, Science, 298, 794–799, 2002.
Lewis, A. C.: The changing face of urban air pollution, Science, 359, 744–745, https://doi.org/10.1126/science.aar4925, 2018.
Liu, H., Man, H., Cui, H., Wang, Y., Deng, F., Wang, Y., Yang, X., Xiao, Q., Zhang, Q., Ding, Y., and He, K.: An updated emission inventory of vehicular VOCs and IVOCs in China, Atmos. Chem. Phys., 17, 12709–12724, https://doi.org/10.5194/acp-17-12709-2017, 2017.
McDonald, B. C., de Gouw, J. A., Gilman, J. B., Jathar, S. H., Akherati, A., Cappa, C. D., Jimenez, J. L., Lee-Taylor, J., Hayes, P. L., McKeen, S. A., Cui, Y. Y., Kim, S.-W., Gentner, D. R., Isaacman-VanWertz, G., Goldstein, A. H., Harley, R. A., Frost, G. J., Roberts, J. M., Ryerson, T. B., and Trainer, M.: Volatile chemical products emerging as largest petrochemical source of urban organic emissions, Science, 359, 760–764, 2018.
Millán, M. M.: Extreme hydrometeorological events and climate change predictions in Europe, J. Hydrol., 518, 206–224, https://doi.org/10.1016/j.jhydrol.2013.12.041, 2014.
Millán, M. M., Salvador, R., Mantilla, E., and Artiñano, B.: Meterology and photochemical air pollution in southern Europe: experimental results from EC research projects, Atmos. Environ., 30, 1909–1924, https://doi.org/10.1016/1352-2310(95)00220-0, 1996.
Millán, M. M., Salvador, R., Mantilla, E., and Kallos, G.: Photooxidant dynamics in the Mediterranean basin in summer: results from European research projects, J. Geophys. Res., 102, 8811–8823, https://doi.org/10.1029/96JD03610, 1997.
Millán, M. M., Mantilla, E., Salvador, R., Carratalá, A., Sanz, M. J., Alonso, L., Gangoiti, G., and Navazo, M.: Ozone cycles in the western Mediterranean basin: interpretation of monitoring data in complex coastal terrain, J. Appl. Meteorol. 39, 487–508, https://doi.org/10.1175/1520-0450(2000)039<0487:OCITWM>2.0.CO;2, 2000.
Monks, P. S., Archibald, A. T., Colette, A., Cooper, O., Coyle, M., Derwent, R., Fowler, D., Granier, C., Law, K. S., Mills, G. E., Stevenson, D. S., Tarasova, O., Thouret, V., von Schneidemesser, E., Sommariva, R., Wild, O., and Williams, M. L.: Tropospheric ozone and its precursors from the urban to the global scale from air quality to short-lived climate forcer, Atmos. Chem. Phys. 15, 8889–8973, https://doi.org/10.5194/acp-15-8889-2015, 2015.
Monteiro, A., Gama, C., Cândido, M., Ribeiro, I., Carvalho, D., and Lopes, M.: Investigating ozone high levels and the role of sea breeze on its transport, Atmos. Poll. Res., 7, 339–347, 2016.
Otero, N., Sillmann, J., Schnell, J. L., Rust, H. W., and Butler, T.: Synoptic and meteorological drivers of extreme ozone concentration over Europe, Environ., Res. Lett., 11, 024005, https://doi.org/10.1088/1748-9326/11/2/024005, 2016.
Pandolfi, M., Querol, X., Alastuey, A., Jimenez, J. L., Jorba, O., Day, D., Ortega, A., Cubison, M. J., Comerón, A., Sicard, M., Mohr, C., Prévot, A. S. H., Minguillón, M. C., Pey, J., Baldasano, J. M., Burkhart, J. F., Seco, R., Peñuelas, J., van Drooge, B. L., Artiñano, B., Di Marco, C., Nemitz, E., Schallhart, S.,, Metzger, A., Hansel, A., Lorente, J., Ng, S., Jayne, J., and Szidat, S.: Effects of soures and meteorology on particulate matter in the Western Mediterranean Basing: An overview of the DAURE campaign, J. Geophys. Res.-Atmos., 119, 4978–5010, 2014.
Pausata, F. S. R., Pozzoli, L., Vignati, E., and Dentener, F. J.: North Atlantic Oscillation and tropospheric ozone variability in Europe: model analysis and measurements intercomparison, Atmos. Chem. Phys., 12, 6357–6376, https://doi.org/10.5194/acp-12-6357-2012, 2012.
Pay, M. T., Piot, M., Jorba, O., Basart, S., Gassó, S., Jiménez-Guerrero, P., Gonçalves, M., Dabdub, D., and Baldasano, J. M.: A full year evaluation of the CALIOPE-EU air quality system in Europe for 2004: a model study, Atmos. Environ., 44, 3322–3342, 2010.
Pay, M. T., Jiménez-Guerrero, P., Jorba, O., Basart, S., Pandolfi, M., Querol, X., and Baldasano, J. M.: Spatio-temporal variability of levels and speciation of particulate matter across Spain in the CALIOPE modeling system, Atmos. Environ., 46, 376–396, 2012.
Pay, M. T., Martínez, F., Guevara, M., and Baldasano, J. M.: Air quality forecasts on a kilometer-scale grid over complex Spanish terrains, Geosci. Model Dev., 7, 1979–1999, https://doi.org/10.5194/gmd-7-1979-2014, 2014.
Pérez, C., Sicard, M., Jorba, O., Comerón, A., and Baldasano, J. M.: Summertime re-circulations of air pollutants over the north-eastern Iberian coast observed from systematic EARLINET lidar measurements in Barcelona, Atmos. Environ., 38, 3983–4000, https://doi.org/10.1016/j.atmosenv.2004.04.010, 2004.
Querol, X., Alastuey, A., Reche, C., Orio, A., Pallares, M., Reina, F., Dieguez, J. J., Mantilla, E., Mantilla, M., Alonso, L, Gangoiti, G., and Millán, M.: On the origin of the highest ozone episodes in Spain, Sci. Total Environ., 572, 379–389, https://doi.org/10.1016/j.scitotenv.2016.07.193, 2016.
Querol, X., Gangoiti, G., Mantilla, E., Alastuey, A., Minguillón, M. C., Amato, F., Reche, C., Viana, M., Moreno, T., Karanasiou, A., Rivas, I., Pérez, N., Ripoll, A., Brines, M., Ealo, M., Pandolfi, M., Lee, H.-K., Eun, H.-R., Park, Y.-H., Escudero, M., Beddows, D., Harrison, R. M., Bertrand, A., Marchand, N., Lyasota, A., Codina, B., Olid, M., Udina, M., Jiménez-Esteve, B., Soler, M. R., Alonso, L., Millán, M., and Ahn, K.-H.: Phenomenology of high-ozone episodes in NE Spain, Atmos. Chem. Phys., 17, 2817–2838, https://doi.org/10.5194/acp-17-2817-2017, 2017.
Querol, X., Alastuey, A., Gangoiti, G., Perez, N., Lee, H. K., Eun, H. R., Park, Y., Mantilla, E., Escudero, M., Titos, G., Alonso, L., Temime-Roussel, B., Marchand, N., Moreta, J. R., Revuelta, M. A., Salvador, P., Artíñano, B., García dos Santos, S., Anguas, M., Notario, A., Saiz-Lopez, A., Harrison, R. M., Millán, M., and Ahn, K.-H.: Phenomenology of summer ozone episodes over the Madrid Metropolitan Area, central Spain, Atmos. Chem. Phys., 18, 6511–6533, https://doi.org/10.5194/acp-18-6511-2018, 2018.
R Core Team: R: A language and environment for statistical computing. R Foundation for Statistical Computing, Vienna, Austria, http://www.R-project.org/ (last access: 4 April 2019), 2014.
Reff, A., Bhave, P. V., Simon, H., Pace, T. G., Pouliot, G. A., Mobley, J. D., and Houyoux, M.: Emissions inventory of PM2.5 trace elements across the United States, Environ. Sci. Technol., 43, 5790–5796, https://doi.org/10.1021/es802930x, 2009.
Reis, S., Simpson, D., Friedrich, R., Jonson, J. E., Unger, S., and Obermeier, A.: Road traffic emissions – predictions of future contributions to regional ozone levels in Europe, Atmos. Environ., 34, 4701–4710, https://doi.org/10.1016/S1352-2310(00)00202-8, 2000.
Richards, N. A. D., Arnold, S. R., Chipperfield, M. P., Miles, G., Rap, A., Siddans, R., Monks, S. A., and Hollaway, M. J.: The Mediterranean summertime ozone maximum: global emission sensitivities and radiative impacts, Atmos. Chem. Phys., 13, 2331–2345, https://doi.org/10.5194/acp-13-2331-2013, 2013.
Russo, M. A., Leitão, J., Gama, C., Ferreira, J., and Monteiro, A.: Shipping emissions over Europe: A state-of-the-art and comparative analysis, Atmos. Environ., 177, 187–194, 2018.
Saavedra, S., Rodríguez, A., Taboada, J. J., Souto, J. A., and Casares, J. J.: Synoptic patterns and air mass transport during ozone episodes in northwestern Iberia. Sci. Total Environ., 441, 97–110, https://doi.org/10.1016/j.scitotenv.2012.09.014, 2012.
Safieddine, S., Boynard, A., Coheur, P.-F., Hurtmans, D., Pfister, G., Quennehen, B., Thomas, J. L., Raut, J.-C., Law, K. S., Klimont, Z., Hadji-Lazaro, J., George, M., and Clerbaux, C.: Summertime tropospheric ozone assessment over the Mediterranean region using the thermal infrared IASI/MetOp sounder and the WRF-Chem model, Atmos. Chem. Phys., 14, 10119–10131, https://doi.org/10.5194/acp-14-10119-2014, 2014.
Saiz-Lopez, A., Borge, R., Notario, A., Adame, J. A., de la Paz, D., Querol, X., Artíñano, B., Gómez-Moreno, F. J., and Cuevas, C. A.: Unexpected increase in the oxidation capacity of the urban atmosphere of Madrid, Spain, Sci. Rep., 7, 45956, https://doi.org/10.1038/srep45956, 2017.
Sartelet, K. N., Couvidat, F., Seigneur, C., and Roustan, Y.: Impact of biogenic emissions on air quality over Europe and North America, Atmos. Environ., 53, 131–141, https://doi.org/10.1016/j.atmosenv.2011.10.046, 2012.
Sarwar, G., Simon, H., Bhave, P., and Yarwood, G.: Examining the impact of heterogeneous nitryl chloride production on air quality across the United States, Atmos. Chem. Phys., 12, 6455–6473, https://doi.org/10.5194/acp-12-6455-2012, 2012.
Seinfeld, J. H. and Pandis, S. N.: Atmospheric chemistry and physics: from air pollution to climate change, 1–1152, John Wiley & Sons, 2016.
Sharma, S., Sharma, P., and Khare, M.: Photo-chemical transport modelling of tropospheric ozone: a review, Atmos. Environ., 159, 34–54, https://doi.org/10.1016/j.atmosenv.2017.03.047, 2017.
Sicard, P., Serra, R., and Rossello, P.: Spatiotemporal trends in ground-level ozone concentrations and metrics in France over the time period 1999–2012, Environ. Res., 149, 122–144, https://doi.org/10.1016/j.envres.2016.05.014, 2016.
Skamarock, W. C. and Klemp, J. B.: A time-split nonhydrostatic atmospheric model for weather research and forecasting applications, J. Comput. Phys., 227, 3465–3485, https://doi.org/10.1016/j.jcp.2007.01.037, 2008.
Solberg, S., Hov, Ø., Søvde, A., Isaksen, I. S. A., Coddeville, P., De Backer, H., Foster, C., Orsolini, Y., and Uhse, K.: European surface ozone in the extreme summer 2003, J. Geophys. Res., 113, D07307, https://doi.org/10.1029/2007JD009098, 2008.
Soret, A., Guevara, M., and Baldasano, J. M.: The potential impacts of electric vehicles on air quality in the urban areas of Barcelona and Madrid (Spain), Atmos. Environ., 99, 51–63, 2014.
Thunis, P. and Cuvelier, C.: DELTA Version 4.0, Joint Research Center, Ispra, available at: https://fairmode.jrc.ec.europa.eu/document/fairmode/WG1/DELTA_UserGuide_V5_4.pdf last access: 4 April 2019), 2014.
TRANSPHORM: Source Contributions of Transport Emissions for European Air Quality and Exposure, Deliverable 2.4.4, available at: http://www.transphorm.eu/Portals/51/Documents/Deliverables (last access: 11 August 2017), 2014.
UNECE: Hemispheric transport of air pollution 2010. Part A: ozone and particulate matter, Air Pollution Studies, 17, UNECE, LRTAP, 278 pp., ECE/EB.AIR/100, ISBN 978–92–1-117043-6, 2010.
Valdenebro, V., Gangoiti, G., Albizuri, A., Alonso, L., Navazo, M., García, J. A., Iza, J., and Millán, M. M.: Buil-up and decay of two ozone episodes through northern Iberia and southern France – An inter-regional transport analysis, Atmos. Environ., 45, 1591–1603, https://doi.org/10.1016/j.atmosenv.2010.12.031, 2011.
Valverde, V., Pay, M. T., and Baldasano, J. M.: Circulation-type classification derived on a climatic basis to study air quality dynamics over the Iberian Peninsula, Int. J. Climatol., 35, 2877–2897, https://doi.org/10.1002/joc.4179, 2014.
Valverde, V., Pay, M. T., and Baldasano, J. M.: Ozone attributed to Madrid and Barcelona on-road transport emissions: characterization of plume dynamics over the Iberian Peninsula, Sci. Total Environ., 543, 670–682, https://doi.org/10.1016/j.scitotenv.2015.11.070, 2016a.
Valverde, V., Pay, M. T., and Baldasano, J. M.: A model-based analysis of SO and NO dynamics from coal-fired power plants under representative synoptic circulation types over the Iberian Peninsula, Sci. Total Environ., 541, 701–713, https://doi.org/10.1016/j.scitotenv.2015.09.111, 2016b.
Vautard, R., Moran, M. D., Solazzo, E., Gilliam, R. C., Matthias, V., Bianconi, R., Chemel, C., Ferreira, J., Geyer, B., Hansen, A. B., Jericevic, A., Prank, M., Segers, A., Silver, J. D., Werhahn, J., Wolke, R., Rao, S. T., and Galmarini, S.: Evaluation of the meteorological forcing used for the Air Quality Model Evaluation International Initiative (AQMEII) air quality simulations, Atmos. Environ., 53, 15–37, 2012.
Wang, C., Corbett, J. J., and Firestone, J.: Improving Spatial Representation of Global Ship Emissions Inventories, Environ. Sci. Technol., 42, 193–199, https://doi.org/10.1021/es0700799, 2008.
WHO: Review of evidence on health aspects of air pollution – REVIHAAP project: technical report, WHO Regional Office for Europe, Copenhagen, 302 pp., available at: http://www.euro.who.int/__data/assets/pdf_file/0004/193108/REVIHAAP-Final-technical-report-final-version.pdf?ua=1 (last access: 4 April 2019), 2013.
Whitten, G. Z., Heo, G., Kimura, Y., McDonald-Buller, E., Allen, D. T., Carter, W. P. L., and Yarwood, G.: A new condensed toluene mechanism for Carbon Bond: CB05-TU, Atmos. Environ., 44, 5346–5355, https://doi.org/10.1016/j.atmosenv.2009.12.029, 2010.
Zhang, J. and Rao, S. T.: The role of vertical mixing in the temporal evolution of ground-level ozone concentration, J. Appl. Meteorol., 38, 1674–1690, https://doi.org/10.1175/1520-0450(1999)038<1674:TROVMI>2.0.CO;2, 1999.
Zhang, Y., Wen, X.-Y., Wang, K., Vijayaraghavan, K., and Jacobson, M. S.: Probing into regional O3 and particulate matter pollution in the United States: 2. An examination of formation mechanisms through a process analysis technique and sensitivity study, J. Geosci. Res., 114, D22305, https://doi.org/10.1029/2009JD011900, 2009.
Zhu, L., Jacob, D. J., Mickley, L. J., Marais, E. A., Cohan, D. S., Yoshida, Y., Duncan, B. N., González Abad, G., and Chance, K. V.: Anthropogenic emissions of highly reactive volatile organic compounds in eastern Texas inferred from oversampling of satellite (OMI) measurements of HCHO columns, Environ. Res. Lett., 9, 114004, https://doi.org/10.1088/1748-9326/9/11/114004, 2014.