the Creative Commons Attribution 4.0 License.
the Creative Commons Attribution 4.0 License.
 | 24 Apr 2019
Mixed-phase orographic cloud microphysics during StormVEx and IFRACS
Douglas H. Lowenthal
A. Gannet Hallar
Robert O. David
Ian B. McCubbin
Randolph D. Borys
Gerald G. Mace
Wintertime mixed-phase orographic cloud (MPC) measurements were conducted at the Storm Peak Laboratory (SPL) during the Storm Peak Lab Cloud Property Validation Experiment (StormVEx) and Isotopic Fractionation in Snow (IFRACS) programs in 2011 and 2014, respectively. The data include 92 h of simultaneous measurements of supercooled liquid cloud droplet and ice particle size distributions (PSDs). Average cloud droplet number concentration (CDNC), droplet size (NMD), and liquid water content (LWC) were similar in both years, while ice particle concentration (Ni) and ice water content (IWC) were higher during IFRACS. The consistency of the liquid cloud suggests that SPL is essentially a cloud chamber that produces a consistent cloud under moist, westerly flow during the winter. A variable cloud condensation nuclei (CCN)-related inverse relationship between CDNC and NMD strengthened when the data were stratified by LWC. Some of this variation is due to changes in cloud base height below SPL. While there was a weak inverse correlation between LWC and IWC in the data as a whole, a stronger relationship was demonstrated for a case study on 9 February 2014 during IFRACS. A minimum LWC of 0.05 g m−3 showed that the cloud was not completely glaciated on this day. Erosion of the droplet distribution at high IWC was attributed to the Wegener–Bergeron–Findeisen process as the high IWC was accompanied by a 10-fold increase in Ni. A relationship between large cloud droplet concentration (25–35 µm) and small ice particles (75–200 µm) under cold ( ∘C) but not warm ( ∘C) conditions during IFRACS suggests primary ice particle production by contact or immersion freezing. The effect of blowing snow was evaluated from the relationship between wind speed and Ni and by comparing the relative (percent) ice particle PSDs at high and low wind speeds. These were similar, contrary to expectation for blowing snow. However, the correlation between wind speed and ice crystal concentration may support this explanation for high crystal concentrations at the surface. Secondary processes could have contributed to high crystal concentrations but there was no direct evidence to support this. Further experimental work is needed to resolve these issues.
- Article
(6392 KB) - Full-text XML
- BibTeX
- EndNote


Aerosols and their effects on cloud microphysical properties have been shown to alter precipitation formation and distribution over complex terrain (e.g., Pruppacher and Klett, 1997; Borys et al., 2003; Rosenfeld and Givati, 2006; Lowenthal et al., 2011; Saleeby et al., 2013). Higher concentrations of cloud condensation nuclei (CCN) produce more numerous but smaller cloud droplets (Twomey et al., 1984; Peng et al., 2002; Lowenthal et al., 2002). This leads to decreased riming efficiency and decreased precipitation on the windward slope (Borys et al., 2000, 2003) and has been shown to redistribute precipitation over mountain barriers in modeling studies (Saleeby et al., 2009, 2013).
There are numerous studies and reviews of ice nucleation theory, measurements, and modeling (Vali, 1996, 1999; Diehl et al., 2006; Hoose and Möhler, 2012; Ladino Moreno et al., 2013; Murray et al., 2012; Knopf and Alpert, 2013; Kanji et al., 2017; Knopf et al., 2018). In mixed-phase clouds (MPCs), a small fraction of aerosols can act as heterogeneous ice-nucleating particles (INPs) and produce ice through four known freezing modes: deposition, immersion, condensation, and contact freezing. Contact freezing has been found to occur at higher temperatures than immersion freezing for a given INP (Pitter and Pruppacher, 1973; Lohmann and Diehl, 2006; Nagare et al., 2016). Biological INPs have been found to produce ice at relatively higher temperatures than non-biological INPs (Levin and Yankofsky, 1983; Du et al., 2017).
Secondary ice production (SIP) processes were reviewed by Field et al. (2017). Sullivan et al. (2018) modeled SIP by rime splintering (Hallett–Mossop process), droplet shattering, and collisional breakup with ice particle enhancement depending on temperature, updraft velocity, and INP concentration. Rime splintering is thought to occur when a supercooled droplet with a diameter larger than ∼25 µm freezes onto an ice particle or other surface and shatters at temperatures between −8 and −3 ∘C (Hallett and Mossop, 1974; Mossop, 1985). Keppas et al. (2017) found evidence for rime splintering in warm (−6 to 0 ∘C) frontal clouds. Here, lollie-shaped crystals formed by riming of columnar crystals by droplets larger than 100 µm were associated with high concentrations of small columnar crystals. Rangno and Hobbs (2001) concluded that shattering of freezing droplets larger than 50 µm could have accounted for high observed ice particle concentrations in Arctic stratus.
At mountaintop observatories, ice crystal concentrations frequently exceed aircraft measurements by an order of magnitude or more (Rogers and Vali, 1987; Geerts et al., 2015; Lloyd et al., 2015; Beck et al., 2018). Lloyd et al. (2015) considered blowing snow, rime splintering, and detachment of surface frost (Bacon et al., 1998) as sources of high ice particle concentrations at the Jungfraujoch Sphinx Observatory (JFJ). They ultimately favored the latter mechanism by process of elimination, albeit with no direct evidence. In contrast, Beck et al. (2018) suggested that the enhanced ice crystal concentrations at the Sonnblick Observatory (SBO) were due to blowing snow, turbulence near the mountain surface, or convergence of ice crystals near mountaintop due to orographic lifting.
Several studies have shown a link between cloud droplet size and ice particle concentrations (e.g., Hobbs and Rangno, 1985; Rangno and Hobbs, 2001; Lance et al., 2011; de Boer et al., 2011). Hobbs and Rangno (1985) found a strong relationship between the width of cloud droplet spectra and ice particle concentrations in cumuliform and stratiform clouds where cloud top temperature ranged between −36 and −6 ∘C. Lance et al. (2011) found higher concentrations of ice particles larger than 400 µm in clean Arctic clouds with larger droplets sizes than in polluted Arctic clouds with smaller but more numerous drops.
Previous studies have furthered our understanding of precipitation formation and distributions in complex terrain from dynamical and microphysical perspectives but have been unable to establish a link between cloud microphysics aloft and at the surface. Rogers and Vali (1987) observed cloud microphysics at the Elk Mountain Observatory (EMO) located in the Medicine Bow Mountains of southern Wyoming and from the University of Wyoming Queen Air (UWQA) aircraft. Comparisons between crystal concentrations at EMO and on the UWQA routinely showed higher crystal concentrations at the surface. The authors attributed higher surface concentrations to an unspecified process of ice crystal production in supercooled orographic clouds in contact with snow-covered mountain surfaces. However, blowing snow can also introduce the potential for artifacts in observed ice crystal concentrations at mountaintop locations (Roger and Vali, 1987; Geerts et al., 2015).
The Storm Peak Lab Cloud Property Validation Experiment (StormVEx) was conducted from 15 November 2010 to 25 April 2011 at the Desert Research Institute's (DRI) Storm Peak Laboratory (SPL) to produce a correlative data set to validate cloud retrievals using in situ measurements at SPL (Mace et al., 2010; Matrosov et al., 2012). The Isotopic Fractionation in Snow (IFRACS) study was conducted at SPL from 20 January to 27 February 2014 to explore the impacts of microphysical processes in wintertime orographic clouds on the water isotopic composition of falling snow (Lowenthal et al., 2016; Moore et al., 2016). This paper examines microphysical properties of wintertime orographic MPC at SPL using data collected during StormVEx and IFRACS. A large record of concurrent measurements of ice and supercooled liquid water was produced by these studies. These data enable exploration of statistical relationships among microphysical properties, the temporal variation of cloud properties over two winters at this site, the relationship between the ice and liquid phases, and ice production mechanisms. Potential measurement artifacts due to instrumental characteristics and blowing snow are evaluated.
SPL (3210 m a.s.l.; 40.456570∘ N, 106.739948∘ W) is located on the summit of Mt. Werner in the Park Range near Steamboat Springs, Colorado (Wetzel et al., 2004). In wintertime, SPL is in snowing, supercooled liquid cloud roughly 25 % of the time (Borys and Wetzel, 1997). Storms occur roughly weekly under a variety of synoptic conditions (Rauber and Grant, 1986; Rauber et al., 1986; Borys and Wetzel, 1997). As noted by Lowenthal et al. (2016), given sufficient moisture during winter, a cloud forms and produces persistent snowfall at SPL. Winds are generally from the west or northwest during snowfall events. Clouds and snowfall can be inhibited by blocking from the Flat Top range (maximum elevation 3768 m a.s.l.) under flow from the southwest.
Cloud microphysical properties were measured with the same instruments during StormVEx and IFRACS. The cloud probes were mounted on a rotating wind vane (to orient them into the wind) located on the west (upwind) railing of the roof approximately 6 m above the snow surface (Fig. 1). Cloud droplet number concentrations (CDNCs) and particle size distributions (PSDs) from 2 to 47 µm were measured with an aspirated Particle Measurement Systems (PMS), Inc. (Boulder, CO) FSSP-100 forward-scattering spectrometer probe that was electronically modified by Droplet Measurement Technologies (DMT), Inc. (Boulder, CO). Liquid water content was calculated from the FSSP-100 PSDs. During IFRACS, the FSSP-100 inlet was equipped with a “scarf tube”, which narrows and accelerates the flow in the sample volume to 25 m s−1 according to PMS. The air speed at the center of the inlet was measured at 9.4 m s−1, which corresponds to a velocity of 26.7 m s−1 in the sample volume. The scarf tube was removed during StormVEx such that the air speed at the inlet should have been the same as that in the sample volume. Attempts were made to measure the air speed at the inlet during StormVEx but these were inconsistent. Therefore, StormVEx FSSP-100 concentrations were calculated using the face velocity of 9.4 m s−1 measured during IFRACS.
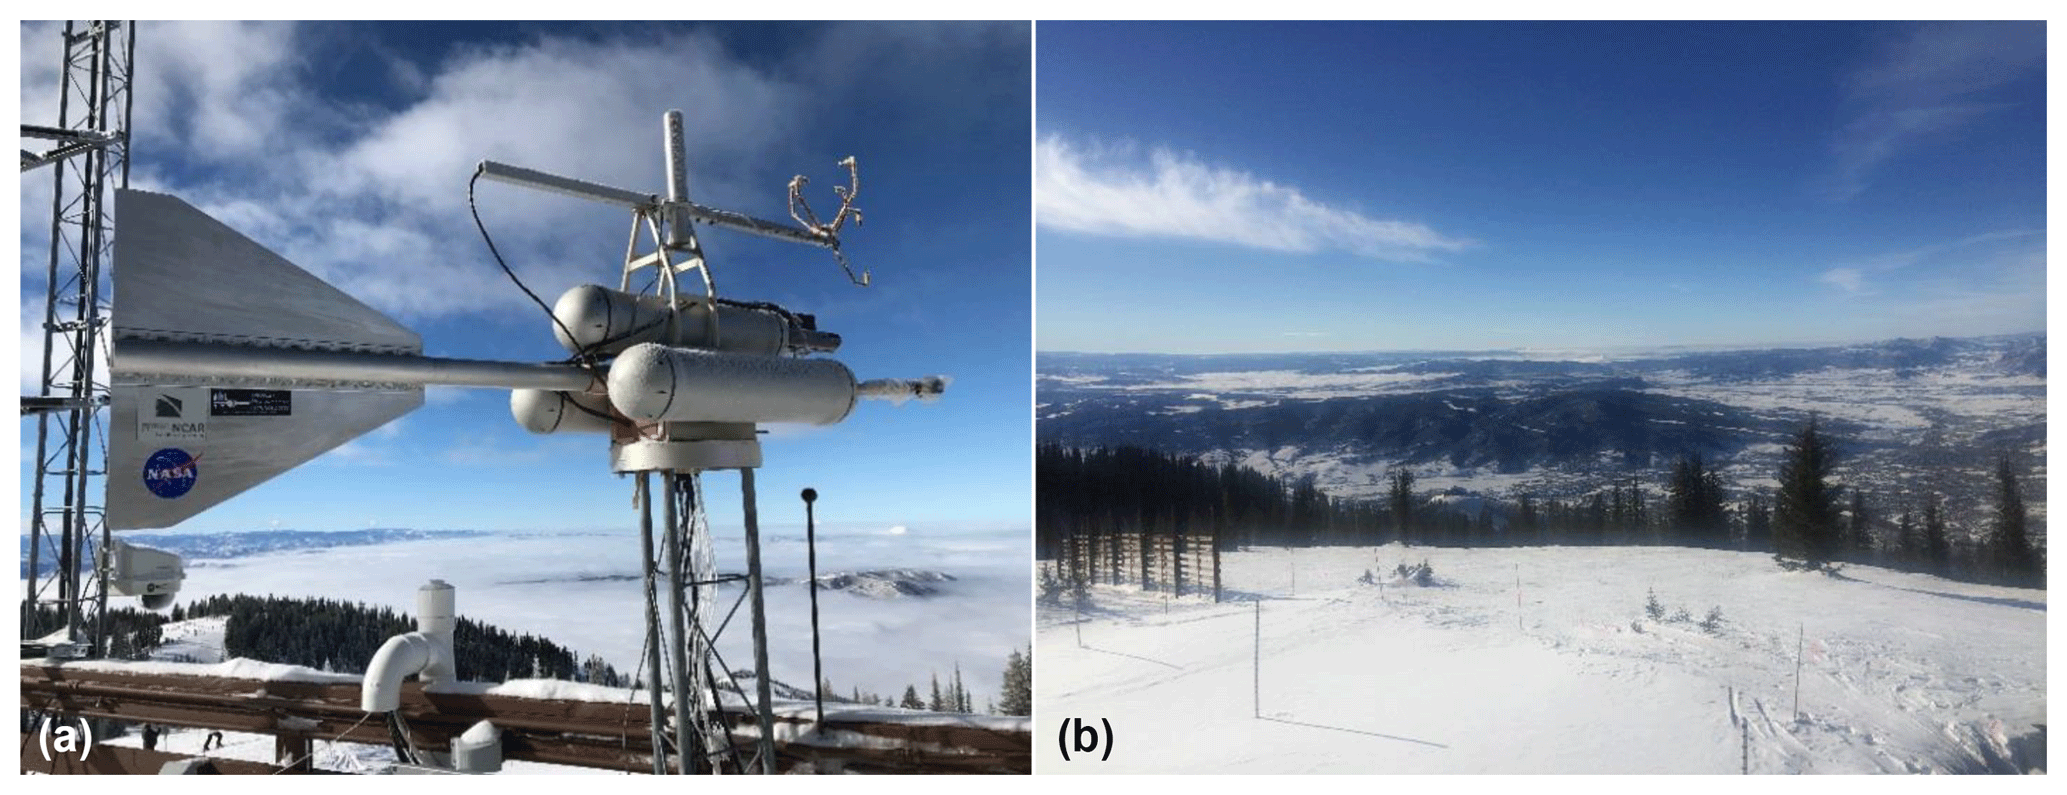
Figure 1Recent picture of SPL probe stand with FSSP-100 in the foreground, Cloud Imaging Probe (CIP) in the background, and sonic anemometer on top (a); view facing west over the railing (b).
Table 1Average of concurrent 1 min CIP and FSSP-100 measurements during StormVEx and IFRACS. The values in parentheses are the coefficients of variation.
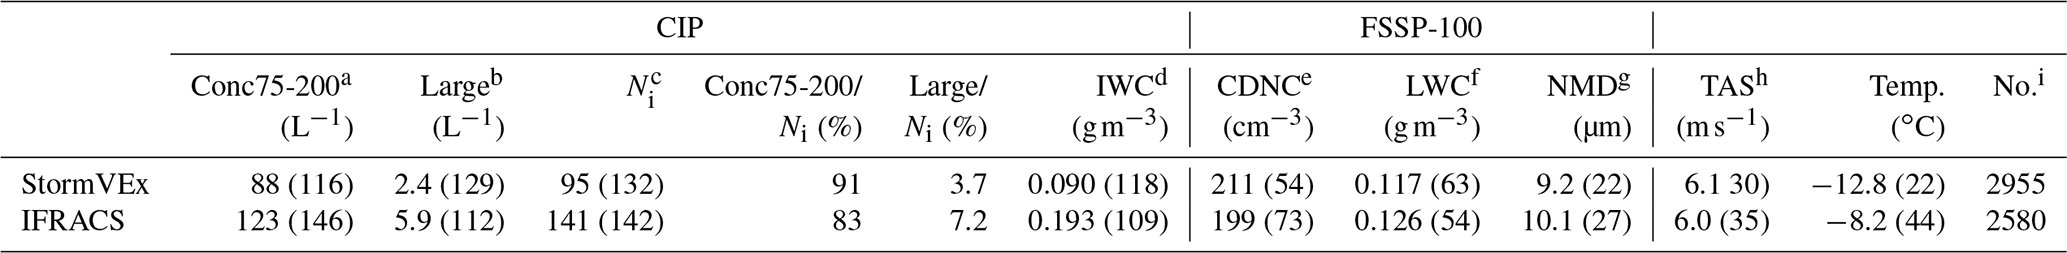
a Cloud Imaging Probe (CIP) concentration from 75 to 200 µm. b CIP concentration ≥400 µm. c CIP concentration ≥75 µm. d Ice water content. e Cloud droplet number concentration. f Cloud liquid water content. g Cloud droplet number-weighted mean diameter. h TAS is the horizontal wind speed. i Number of 1 min observations in the average.
Ice particle PSDs were measured with a DMT Cloud Imaging Probe (CIP; 25–1600 µm) optical array probe (OAP) with 64 size channels and a resolution of 25 µm. An array diode is triggered when a particle obscures >50 % of the incident laser energy on the diode. During IFRACS, an Applied Technologies, Inc. (ATI) (Longmont, CO) SATI three-axis sonic anemometer supplied the wind speed along the horizontal axis of the CIP probe. For aircraft measurements, this is referred to as true air speed (TAS). This terminology is adopted to refer to horizontal air speed. During StormVEx, a Lufft Ventus UMB two-axis sonic anemometer was substituted for the ATI instrument after 8 February 2011. Data were collected at 1 Hz. The cloud probes were calibrated and serviced at DMT prior to each field campaign.
The 2-D CIP images from StormVEx and IFRACS were processed using the Optical Array Shadow Imaging Software (OASIS) program developed at the University of Manchester (Crosier et al., 2011; Lloyd et al., 2015) and marketed by DMT (http://www.dropletmeasurement.com/optical-array-shadow-imaging-software-oasis, last access: 15 April 2019). The CIP depth of field was corrected as a function of particle size (Baumgardner and Korolev, 1997). Ice particle shattering on the probe tips was found to be insignificant based on particle interarrival time (Field et al., 2006). This is consistent with relatively low wind speeds at the surface compared with aircraft speeds (∼100 m s−1). Concentrations in the first two CIP channels (nominally smaller than 62.5 µm) were ignored because of sizing uncertainties (Korolev et al., 1998; Strapp et al., 2001) and because some of these particles are likely to be cloud droplets in MPC. The total CIP concentration excluding the first two channels is referred to as Ni. The center-in approach, which includes particles that obscure an end diode, was used to identify particles and estimate the sample volume (Heymsfield and Parrish, 1978). Particle size was described as the area-equivalent diameter, i.e., the diameter of a circle with the same area as the particle, as determined from the number of shadowed pixels and the probe resolution. Ice water content (IWC) was estimated by OASIS using the approach of Brown and Francis (1995). This estimate is uncertain because mass-dimensional relationships vary significantly with ice particle habit, riming extent, aggregation, and temperature (Mitchell, 1996; Schmitt and Heymsfield, 2010).
In aircraft studies, the volume of air sampled by cloud probes is proportional to TAS. At aircraft speeds, particles are sampled along the horizontal axes of, and perpendicular to, the sample area of the cloud probes. This is not necessarily the case with ground-based sampling, even when the probes are mounted on a wind vane such as those used at SPL or JFJ, where cloud probes were mechanically oriented into the wind based on sonic anemometer measurements (Lloyd et al., 2015). If the particle trajectory is not as described above, the particles can appear misshapen but not necessarily incorrectly sized according to the area-equivalent diameter. CIP data used in the following analysis were constrained as follows: (1) 1 s TAS >1 and <20 m s−1. A lower limit is needed to ensure that particles traversed the CIP diode array as close to horizontally as possible. Note that the updraft near the mountain tends to impart a horizontal trajectory on falling ice particles (Borys et al., 2000). An upper limit is needed to guard against contamination by blowing snow. During StormVEx and IFRACS, snow and supercooled cloud water samples were collected in bags and on cloud sieves (Borys et al., 2000). Such sampling is not practical at wind speeds above 15 m s−1, where snow may blow out of the bags and the cloud sieves may become overloaded. For the January and February period during StormVEx, TAS was >20 m s−1 during 34 out of 492 995 (0.007 %) 1 s CIP measurements. The corresponding frequency during IFRACS was 3663 out of 338 230 (1.1 %). The 5 min average temperature, pressure, and humidity were measured by the SPL weather station. Water vapor concentration and isotopic composition were measured during IFRACS with a Picarro L2130-i water vapor isotopic analyzer (Lowenthal et al., 2016).
The full StormVEx program lasted nearly 6 months, from November 2010 to April 2011, while IFRACS was designed as a 6-week field project in January and February 2014. During IFRACS, the Picarro analyzer began collecting data on 20 January; however, the weather was clear until 27 January (Lowenthal et al., 2016). For a consistent comparison between the two studies, StormVEx data are limited to January and February 2011. Cloud probe measurements were made on 30 d during StormVEx and 15 d during IFRACS. Measurement periods during StormVEx were intended for comparison with ground-based remote sensing instruments. The probes were turned on when it started snowing but were not necessarily turned off if SPL was not in MPC. Measurements during IFRACS were started only when SPL was in MPC to sample liquid and ice for isotopic analysis. While there were twice as many sampling days during StormVEx, the CIP probe measured particles for 101.4 and 77.2 h during StormVEx and IFRACS, respectively. The 1 s data were averaged to 1 min with a 75 % (at least 45 s) data completeness requirement. To ensure that the measurements represented MPC, only seconds when Ni was >0, LWC was >0.01 g m−3 and CDNC was ≥10 cm−3 were included. With these constraints, there were 49.2 and 43 h of concurrent MPC measurements during StormVEx and IFRACS, respectively.
3.1 FSSP-100 and CIP particle size distributions
Average PSDs calculated from concurrent 1 min average FSSP-100 and CIP measurements are shown in Fig. 2a and b for StormVEx and IFRACS, respectively. The average PSDs were similar in the two studies. Corresponding averages of 1 min CIP and FSSP-100 concentrations are summarized in Table 1, which shows that LWC and CDNC were similar in the two studies. Average IWC during IFRACS was twice that during StormVEx. Small (75–200 µm, referred to as Conc75-200) and large (>400 µm) ice particle concentrations were also higher during IFRACS. The average LWC at SPL was more than an order of magnitude lower than LWC observed in the Sierra Nevada (1.5 g m−3) and Cascade (2 g m−3) mountains, respectively (Lamb et al., 1976; Hobbs, 1975). The ratios of average Conc75-200 to average Ni were 91 % and 83 % during StormVEx and IFRACS, respectively. Based on their coefficients of variation, liquid cloud properties (CDNC and LWC) were much less variable than Conc75-200, large ice particles, and Ni at SPL.
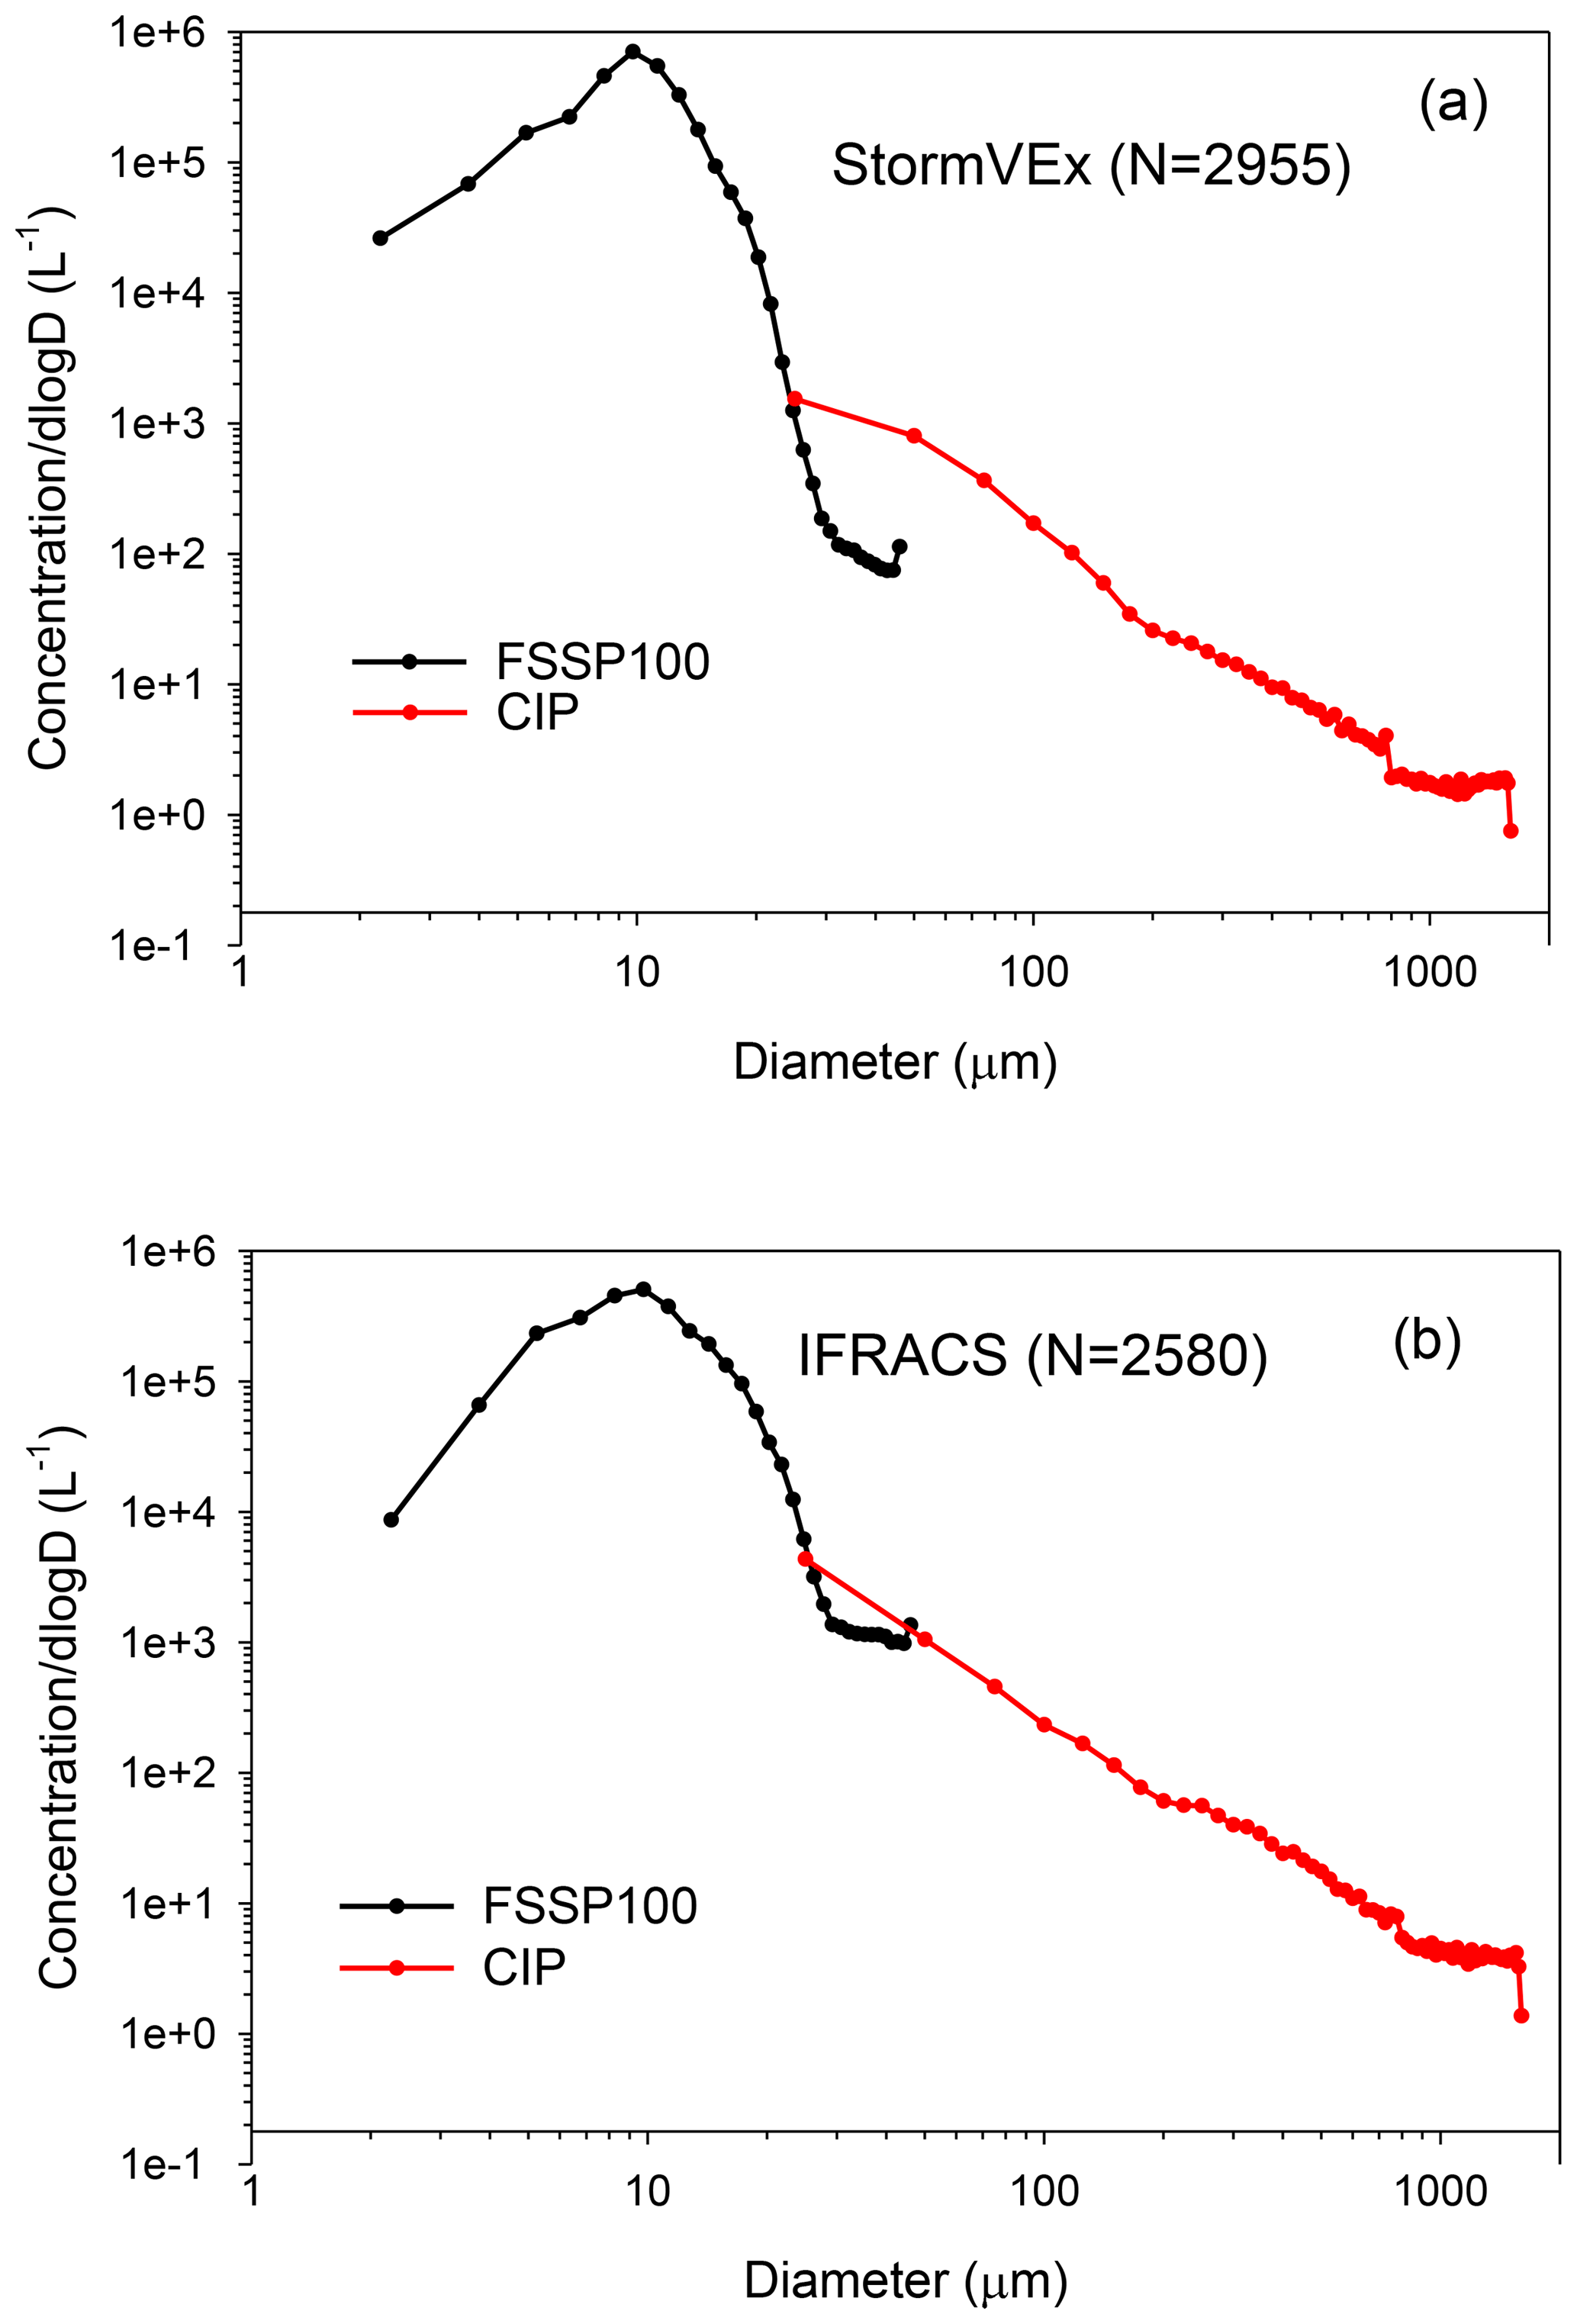
Figure 2Average of concurrent 1 min FSSP-100 and CIP particle size distributions (PSDs) from StormVEx (a) and IFRACS (b).
While the first CIP channel, nominally 12.5–37.5 µm, lines up with the FSSP-100 PSD at ∼25 µm in both studies (Fig. 2), concentrations of FSSP-100 particles larger than 25 µm undershot the CIP PSD during StormVEx, and to a lesser extent, during IFRACS. The FSSP-100 reported non-zero concentrations of particles larger than 25 µm for 14 % and 56 % of 1 s measurements during StormVEx and IFRACS, respectively. During these periods, average CDNC, LWC, and NMD were similar, i.e., 200 cm−3, 0.105 g m−3, and 9.1 µm, respectively, during StormVEx, and 210 cm−3, 0.103 g m−3, and 9.2 µm, respectively, during IFRACS. Average TAS was 6.1 m s−1 during StormVEx and 6.0 m s−1 during IFRACS. At an FSSP-100 sampling flow speed of 9.4 m s−1 at the inlet and an average TAS of ∼6 m s−1, sampling is super-isokinetic, leading to undersampling of larger droplets. Gerber et al. (1999) demonstrated inertial enhancement of large drop concentrations in the aspirated FSSP fitted with a flow accelerator (scarf tube). Thus, the loss of large droplets caused by super-isokinetic sampling may have been partially offset by inertial concentration of large droplets by the scarf tube during IFRACS. However, it is difficult to see how undersampling would have totally eliminated large droplets when they were present.
Spherical liquid drops and ice particles can be distinguished with image analysis; however, this is only possible for particles with area-equivalent diameters larger than about 110 µm for the CIP with 25 µm resolution (Crosier et al., 2011). The average of 1 s CIP PSDs in mixed-phase (wet) cases were compared with dry cases when Conc75-200 was >0 and LWC was 0 (no particles detected by the FSSP-100). Figure 3 shows the ratio of the average of 1 s wet to average dry CIP concentrations as a function of size for StormVEx and IFRACS. In both studies, the ratio was elevated in the first CIP channel only. The ratio decreased significantly and was flat between the third and eighth CIP channels, i.e., Conc75-200. This suggests that, on average, the CIP measurements were only affected by cloud droplets in the first CIP channel.
Average Conc75-200 was higher under wet than dry conditions: 78 versus 49 L−1 during StormVEx and 118 versus 21 L−1 during IFRACS. Average TAS values under wet and dry conditions were similar, i.e., 5.9 and 6.5 m s−1, respectively, during StormVEx and 5.9 and 5.2 m s−1, respectively, during IFRACS. The potential impact of ice particles on FSSP-100 measurements cannot be observed directly with these instruments. However, the magnitude of the ratio of wet∕dry concentrations in CIP channel 1 constrains the effect of ice particles on the FSSP-100 measurements. The relative fraction of crystals in CIP channel 1 can be estimated from the ratio of wet∕dry in CIP channel 1 to the average of the ratios of wet∕dry in CIP channels 3–8, where droplets were absent and where the ratios of wet∕dry were constant. These values, 2.3 and 6 for StormVEx and IFRACS, respectively, imply that 43 % (1∕2.3) and 16.7 % (1∕6) of particles in CIP channel 1 were ice crystals during StormVEx and IFRACS, respectively. Because of the sizing uncertainty for particles which triggered a single diode (CIP channel 1), it is impossible to know precisely which FSSP-100 channels were impacted by ice crystals.
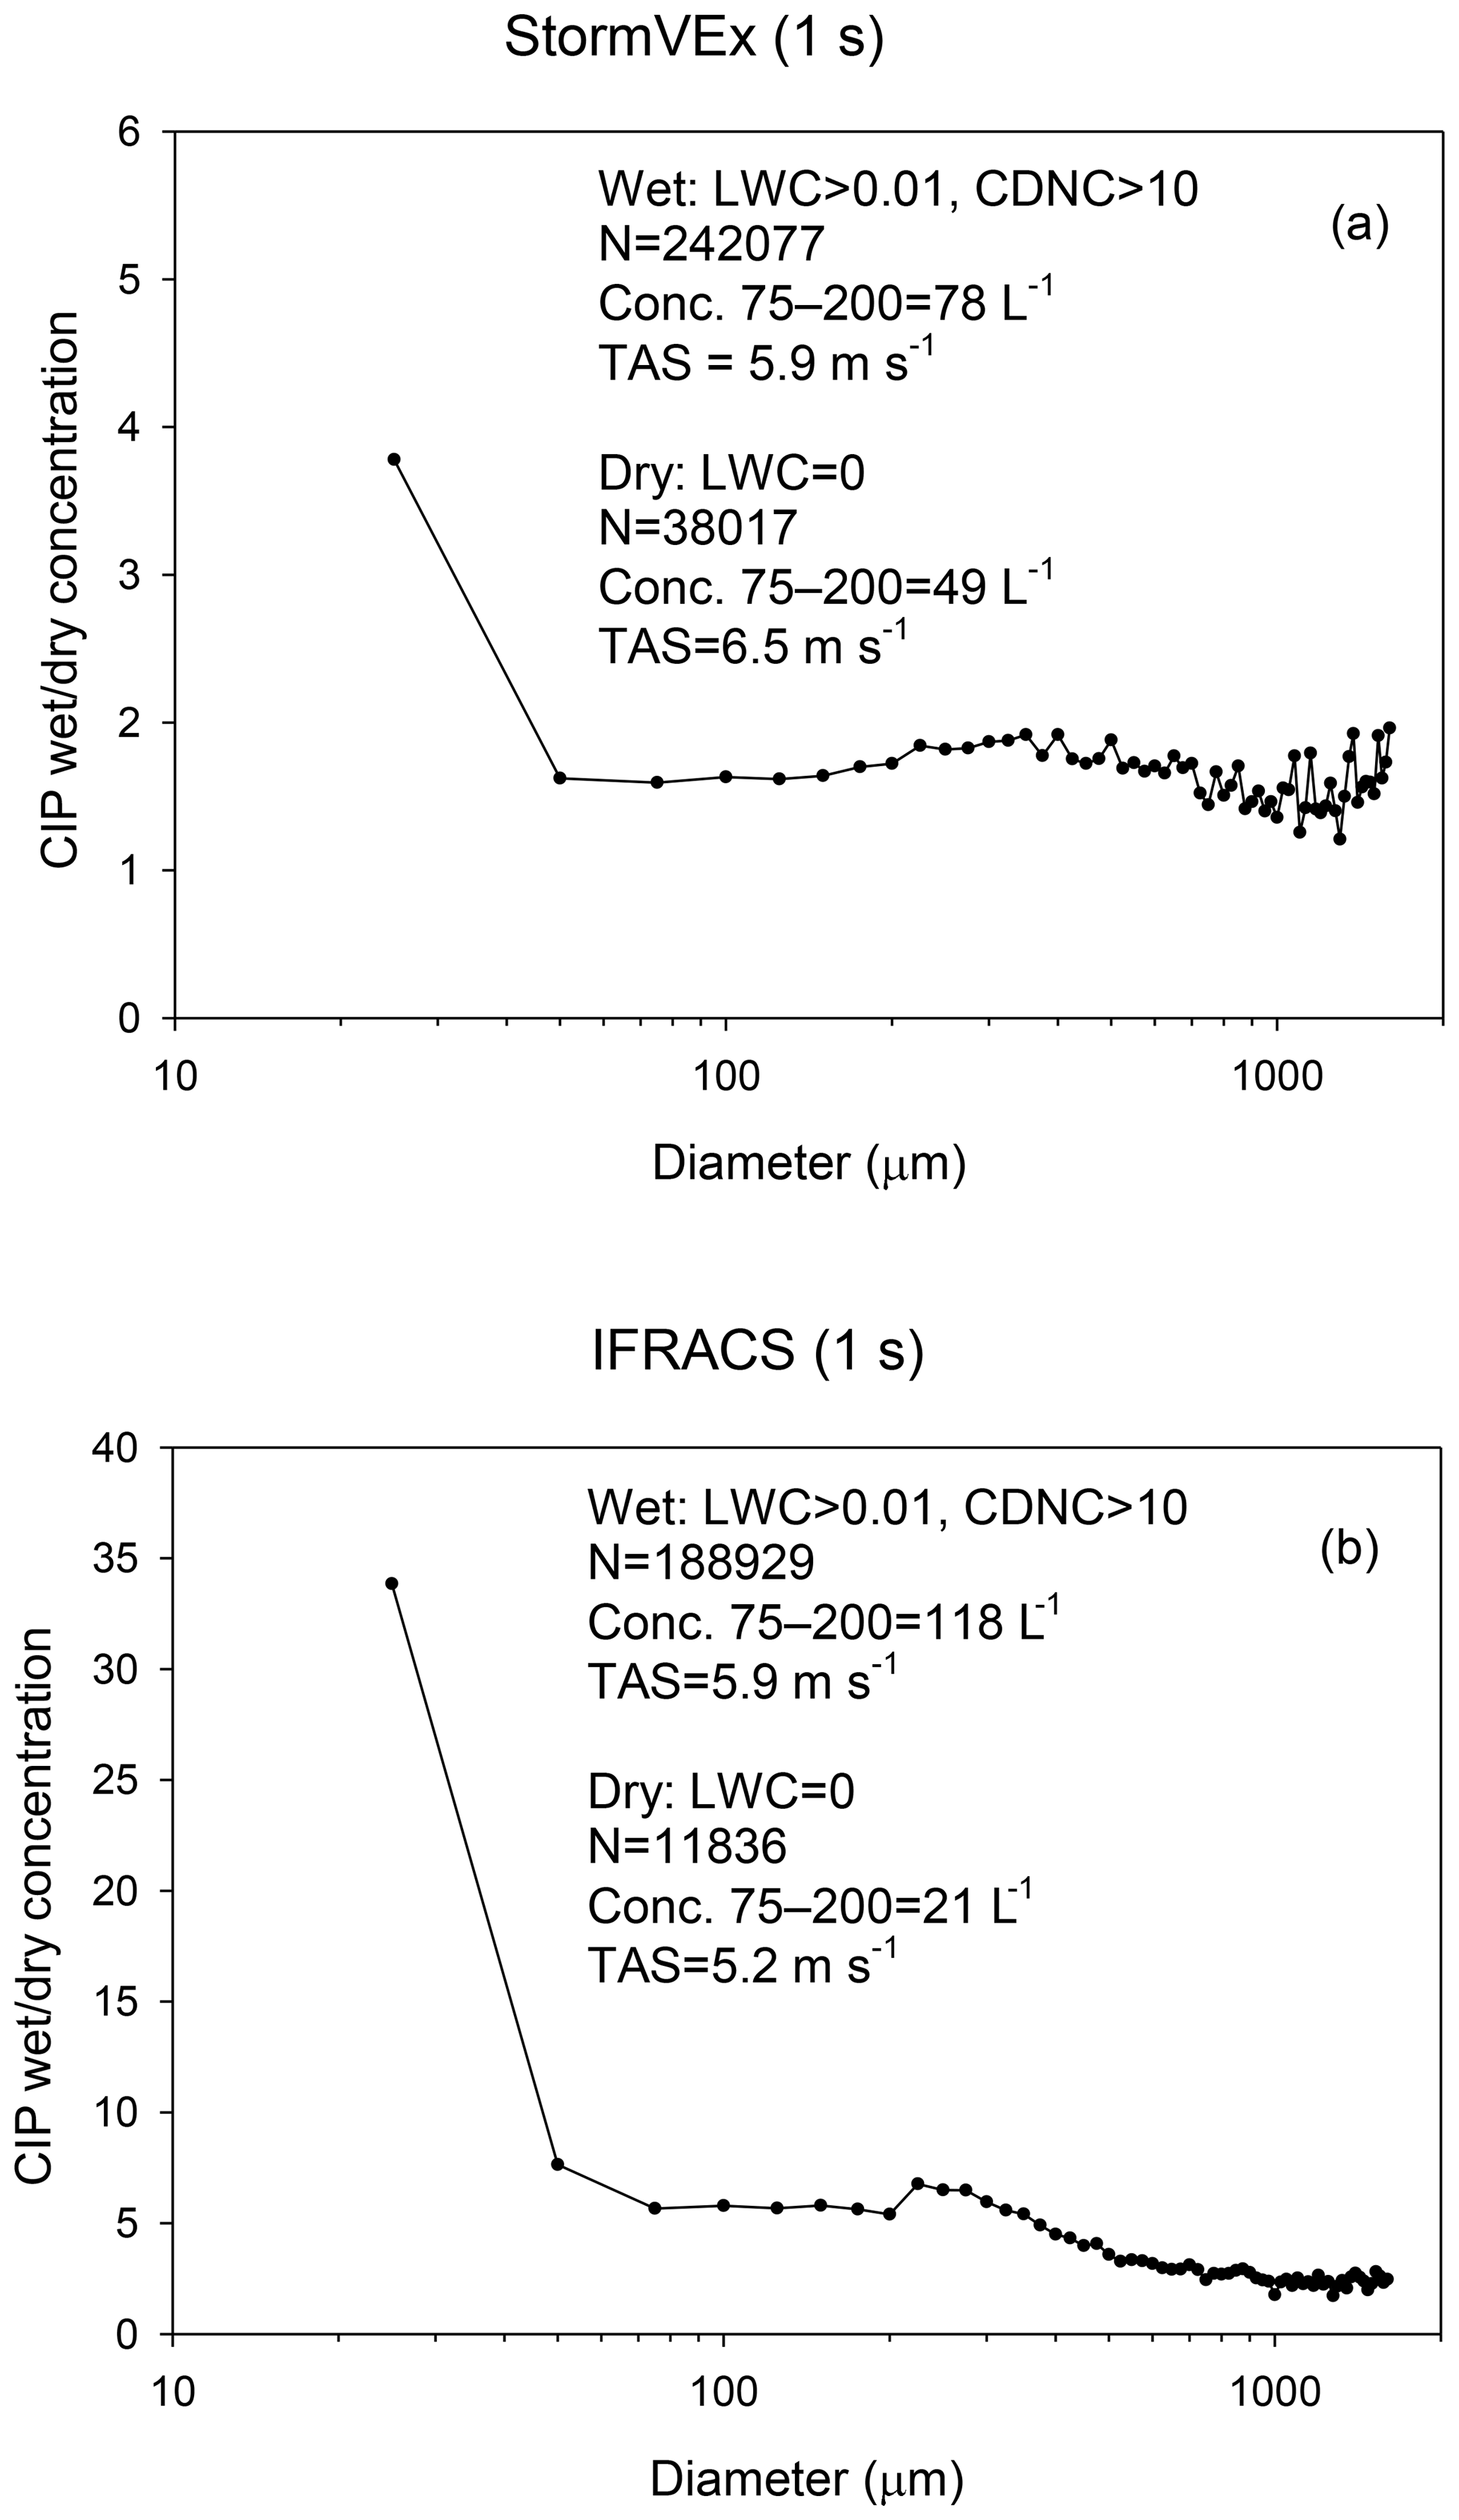
Figure 3Ratio of average mixed-phase (LWC>0.01 g m−3, CDNC>10 cm−3) wet to dry (LWC=0) PSDs for StormVEx (a) and IFRACS (b).
Table 2Frequency distribution of Conc75-200, wind speed, and temperature as a function of wind direction.
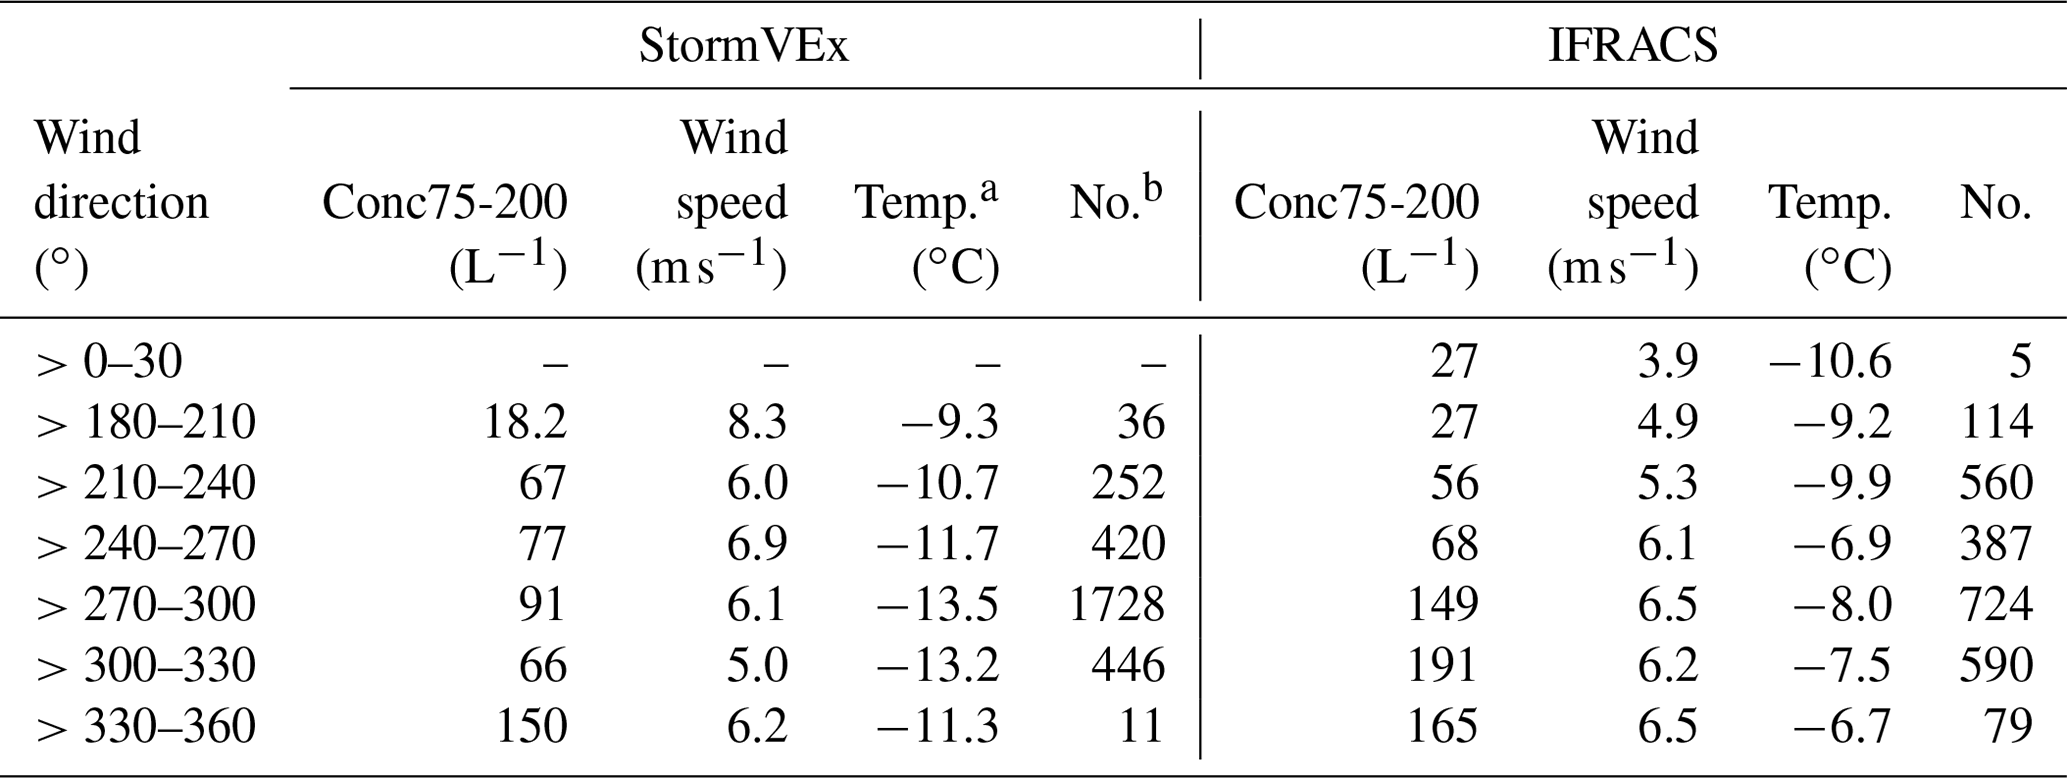
a Temperature based on 5 min average measurements.
b There were 2893/2955 and 2459/2580 1 min measurements when the wind
vane was not frozen during StormVEx and IFRACS, respectively.
The distributions of Conc75-200, wind speed, and temperature as a function of wind direction during StormVEx and IFRACS are summarized in Table 2. During StormVEx, mostly all of the NNW (300 to 360∘) cases were on 22 January 2011. The 5 min average wind direction was exactly the same (351.9∘) for 3.5 h. It is not likely that a 5 min average value could be the same to a tenth of a degree for two consecutive 5 min periods, much less 18. During IFRACS, many of the NNW wind directions exhibited the same value for 30 min or more. The reason is that the wind vane can become iced by riming and does not move. The data were screened for repeated 5 min wind speeds and these were eliminated. This reduced the number of 1 min observations by 2 % and 4.7 % during StormVEx and IFRACS, respectively. Winds were from the NW sector ∼75.3 % and 57 % of the time during StormVEx and IFRACS, respectively. There was one 5 min period during IFRACS when the wind direction was 11∘. High Conc75-200 values were seen in the NW sector in both studies but the highest concentrations were seen in the NNW sector, albeit at low frequency. When segregated by wind direction, there was no relationship between Conc75-200 and temperature or wind speed in either study.
3.2 Supercooled liquid cloud microphysics
In non-precipitating warm clouds, an increase in CCN should increase CDNC while decreasing droplet size at constant LWC (Albrecht, 1989). Smaller drops may inhibit collision coalescence and precipitation and increase LWC (Zheng et al., 2010). Borys et al. (2000) demonstrated a direct relationship between clear-air-equivalent sulfate concentration (a surrogate for pre-cloud CCN) and CDNC and an inverse relationship between CDNC and droplet size (NMD) in MPC at SPL. In such clouds, the droplet distribution may be impacted by riming of ice particles and by transitions between the liquid and ice phases. Figure 4 presents the relationship between 1 min droplet NMD and CDNC in MPC during StormVEx (Fig. 4a) and IFRACS (Fig. 4c). The relationship is stronger when the data are stratified by LWC. The average NMD and CDNC were calculated for each of the four ranges of LWC in Fig. 4 and are plotted in the figures as a function of LWC. NMD and CDNC increased monotonically with LWC in both studies. This is consistent with enhanced growth of droplets as cloud base drops below SPL. However, for CDNC to increase with LWC, either the supersaturation must increase or CCN aerosols must become entrained in the cloud between cloud base and SPL. Figure 4b and d present average FSSP-100 PSDs for low (0.05–0.1 g m−3) and high (0.2–0.3 g m−3) LWC, corresponding to Fig. 4a and c, respectively. The distributions are shifted to larger sizes at high LWC and the increase in CDNC is evident for droplet sizes larger than 10 µm. Note that the shift in the PSDs to larger sizes at high LWC stops at about 35 µm; i.e., the concentration of very large drops is higher at low LWC.
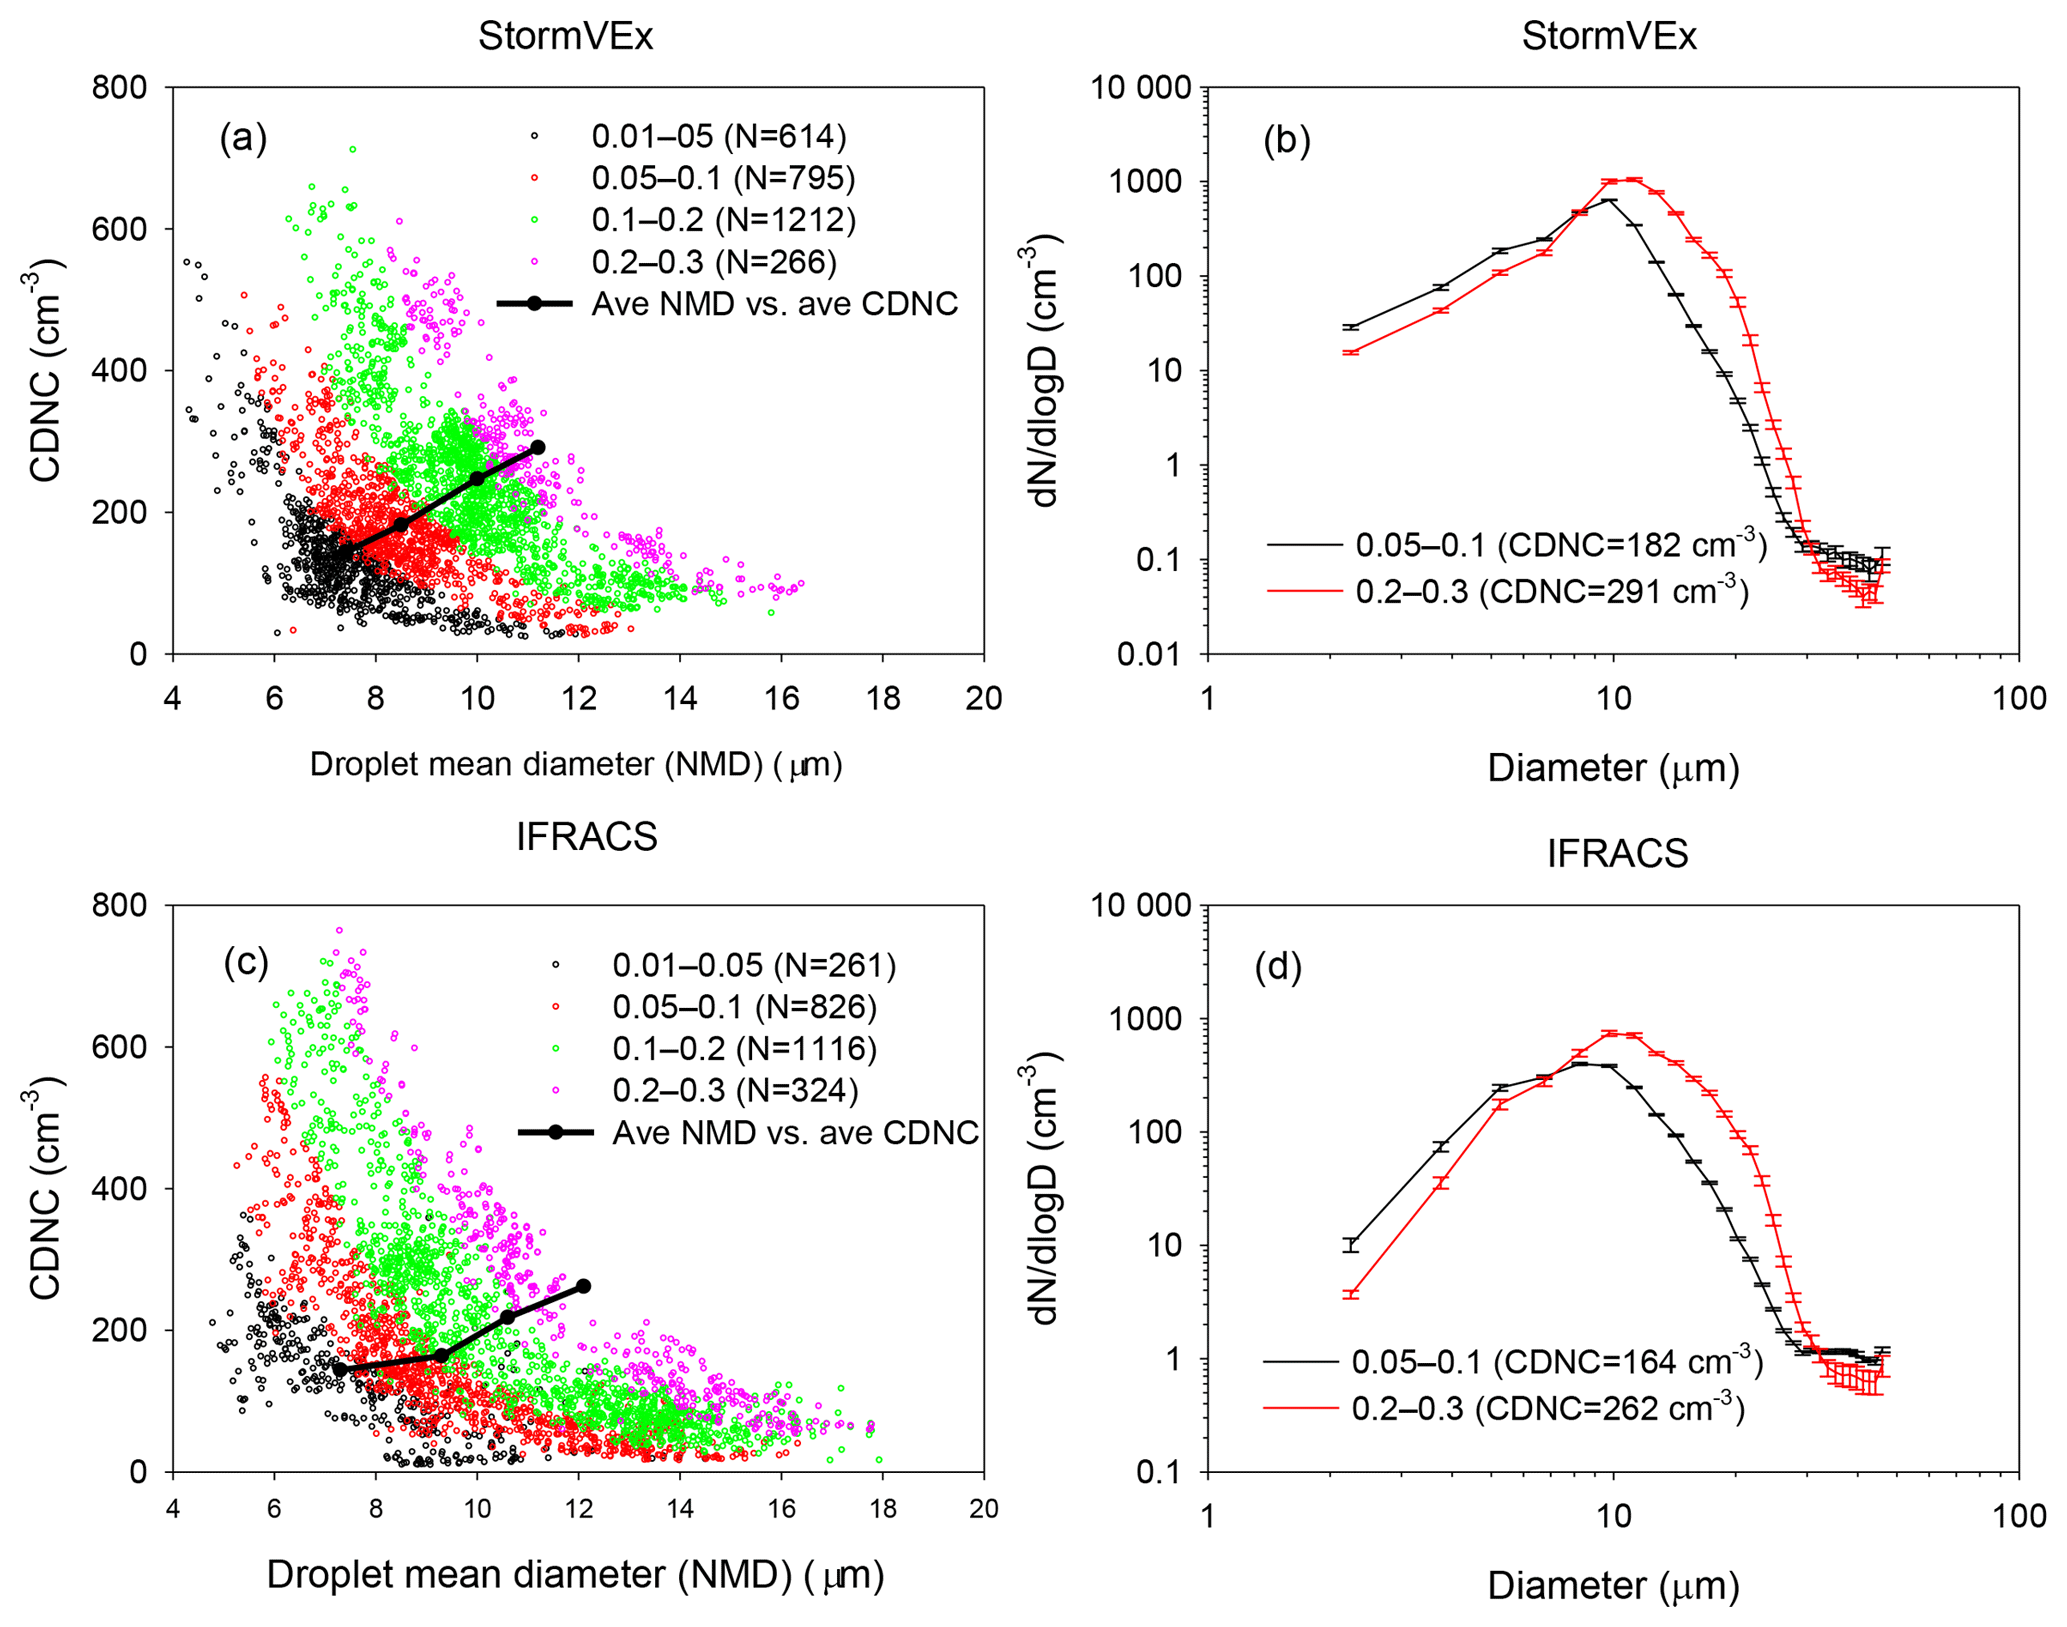
Figure 4Relationships among 1 min average mean cloud droplet diameter (NMD) and concentration (CDNC), segregated by liquid water content (LWC, g m−3), as shown by colors in the legend, during StormVEx (a) and IFRACS (c). Corresponding average PSDs for low (0.01–0.05 g m−3) and high (0.2–0.3 g m−3) LWC are shown in panels (b) and (d). The error bars in panels (b) and (d) are standard errors.
3.3 Relationship between LWC and IWC
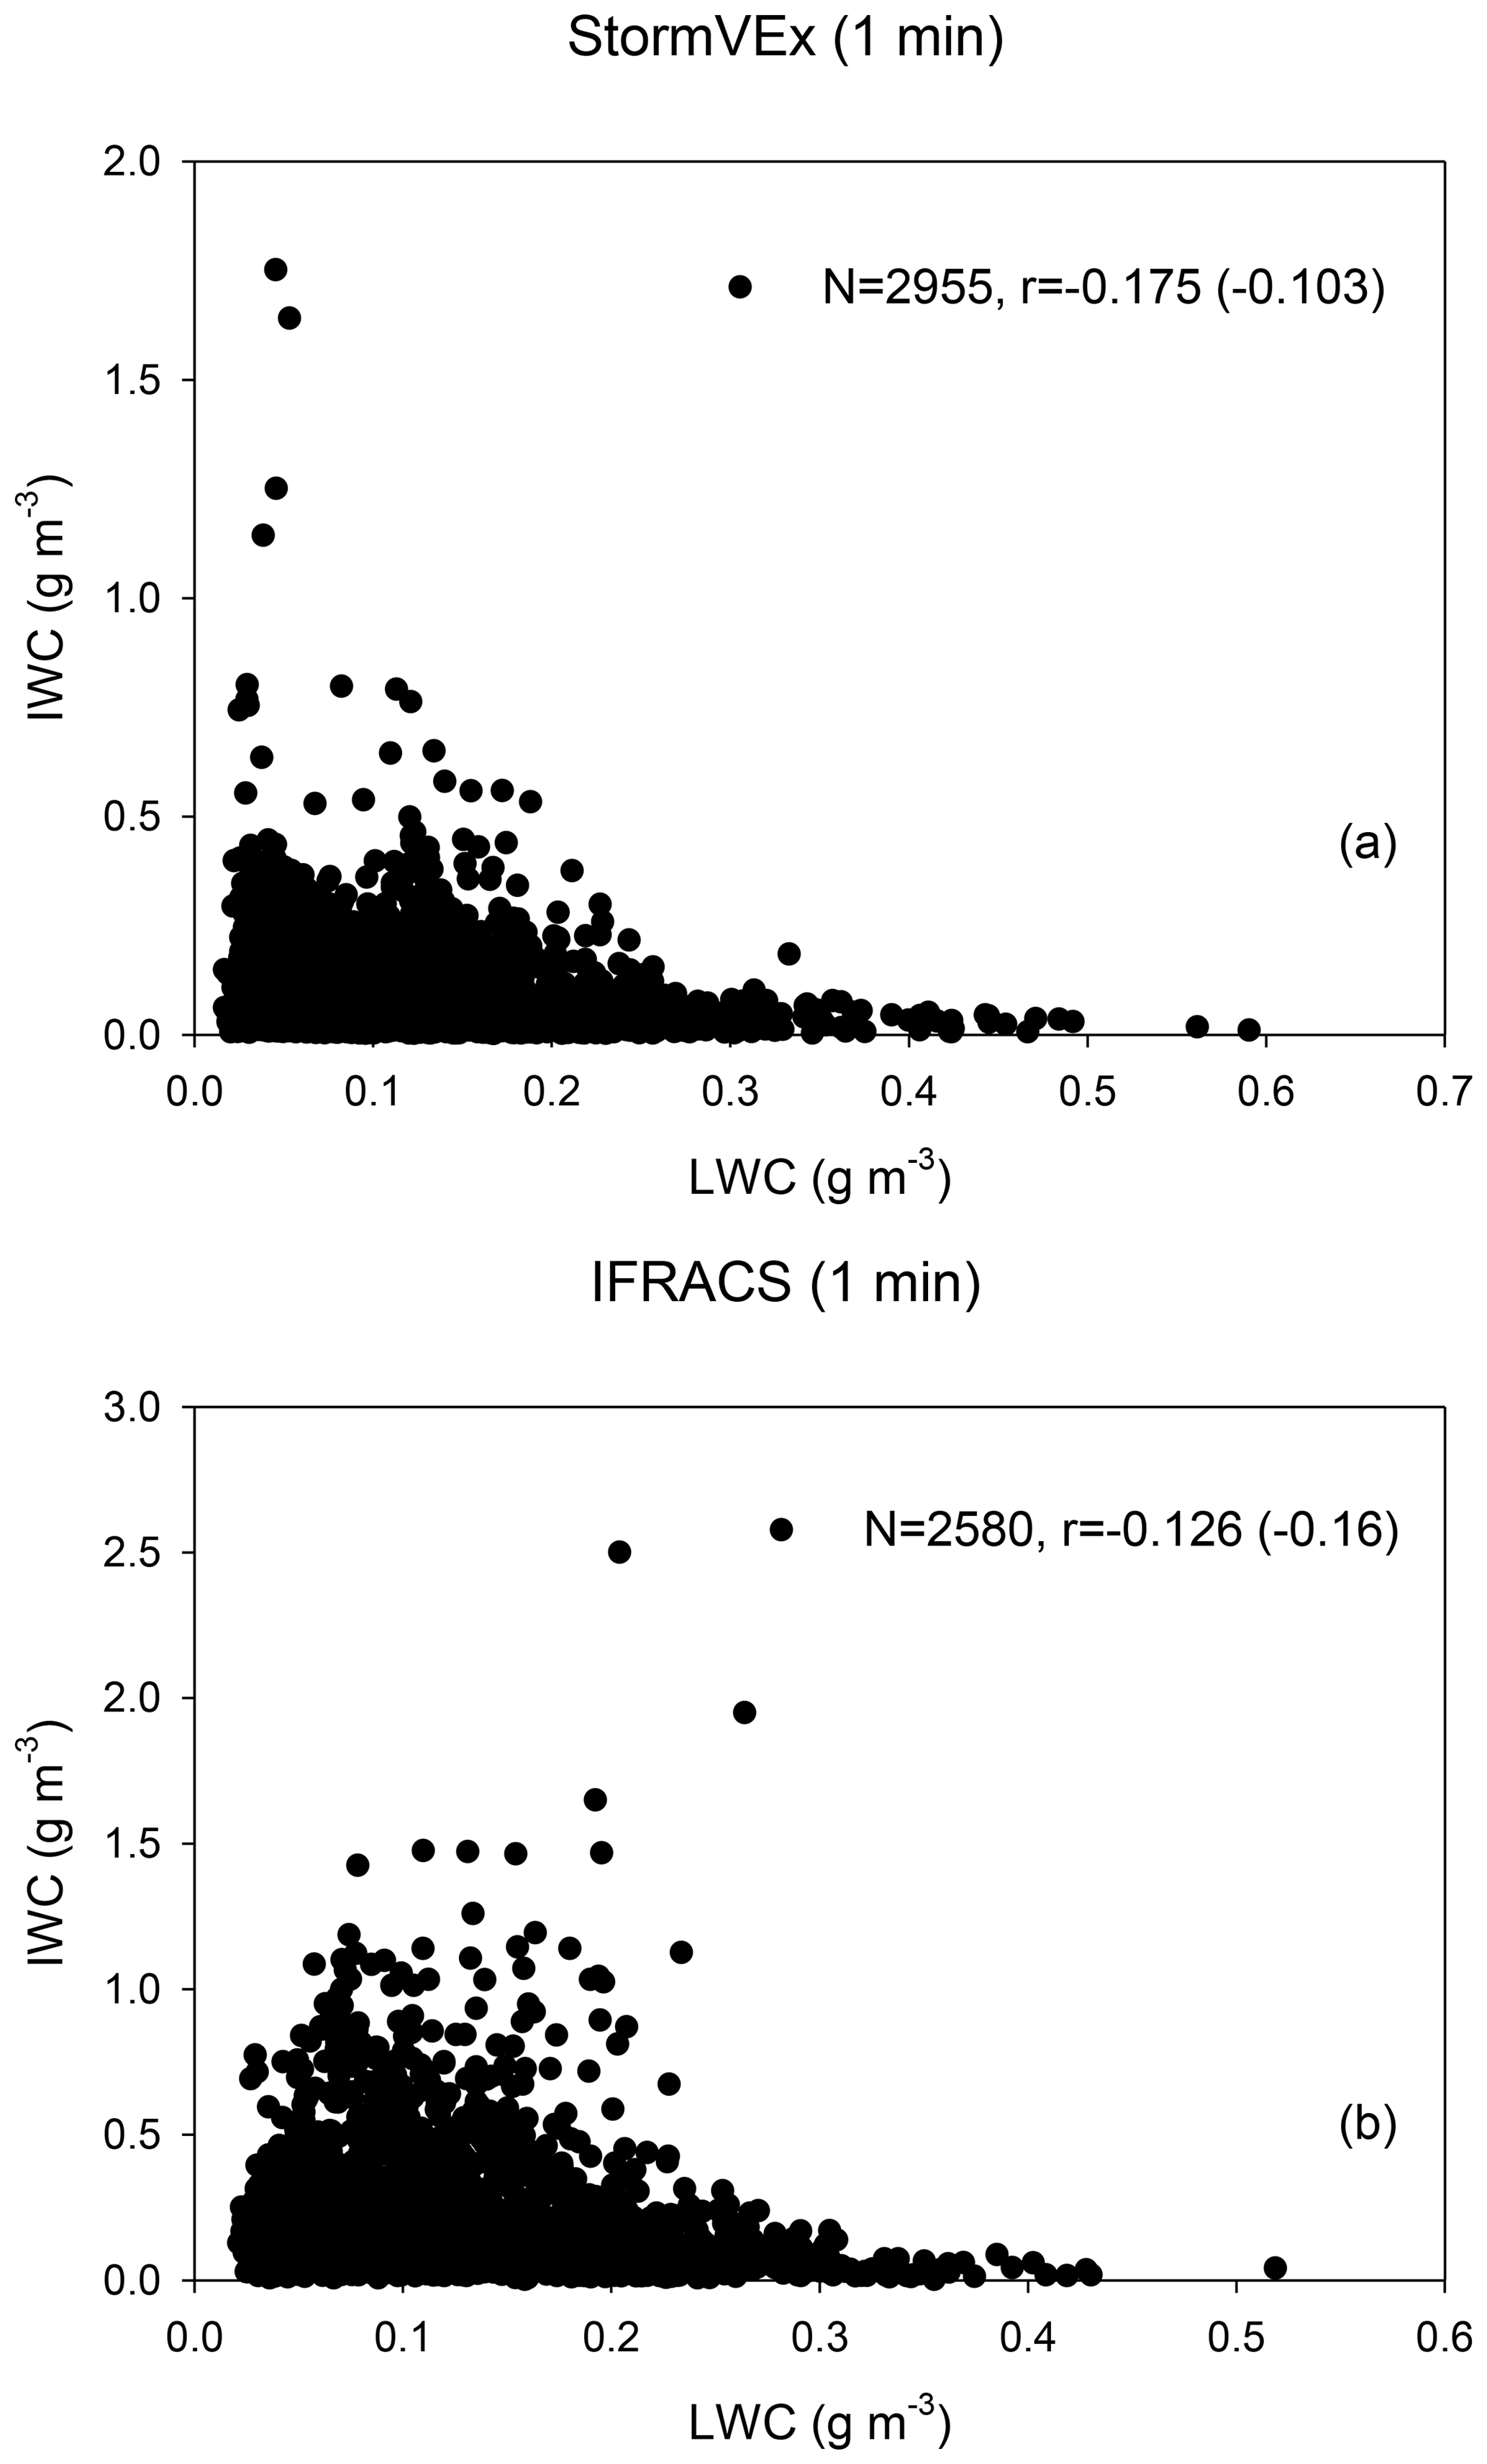
As noted above with respect to Table 1, liquid cloud microphysical properties at SPL were less variable than those of the ice phase. One reason for this is that the ice phase is impacted by processes occurring upwind and at higher altitude. Lowenthal et al. (2011, 2016) estimated that most of the snow mass was formed within 1 km above SPL. This does not preclude ice nucleation at higher altitudes, as small, freshly nucleated crystals contribute little to IWC. Even though riming occurs, most efficiently for large droplets, it is not apparent from Fig. 2 that the liquid cloud was impacted by the ice phase. Indeed, the Pearson and Spearman rank (non-parametric) correlations between all concurrent 1 min average IWC and LWC were only −0.18 and −0.10, respectively, during StormVEx and −0.13 and −0.16, respectively, during IFRACS. The effect of outliers, characteristic of skewed distributions, is reduced with the non-parametric statistic. Henceforth, the Spearman rank correlation is displayed in parenthesis after the Pearson correlation. Scatter plots of IWC versus LWC are shown in Fig. 5a and b for StormVEx and IFRACS, respectively. The edge in the data suggests that there were periods when IWC and LWC were more strongly anti-correlated. If only days with at least 2 h of valid, 1 min average data are considered, there were 4 out of 11 and 3 out of 11 d during StormVEx and IFRACS, respectively, where the Pearson and Spearman rank correlations between IWC and LWC were less than −0.5.
A sampling day during IFRACS with relatively high average IWC (0.23 g m−3) and LWC (0.182 g m−3) was identified for closer examination. Figure 6 presents time series of 1 min average IWC and LWC on 9 February 2014. In this case, the correlation between IWC and LWC was −0.59 (−0.60), suggesting interaction between the ice and liquid phases. The minimum 1 min average LWC was 0.05 g m−3and there were no “dry” (LWC=0) 1 s sample periods on this day. To contrast periods with high and low IWC, average FSSP-100 PSDs were calculated for a high-ice period between 12:45 and 13:17 MST (Fig. 6) and for low-ice periods outside of that interval with the additional constraint that the LWC∕IWC ratio was greater than 2. These PSDs are presented in Fig. 7. Figure 8a and b present CIP images from the high- and low-ice periods, respectively. Note the relatively higher concentration of “dots” in Fig. 8b (low IWC, high LWC). These represent cloud droplets that occluded a single CIP diode. The average IWC and LWC were 0.72 and 0.088 and 0.054 and 0.25 g m−3 for the high- and low-ice periods, respectively. The average IWC and LWC during the high-ice periods were 3.7 and 1.98 times higher, respectively, than the study-wide averages (Table 1). Compared with the low-ice period, the high-ice FSSP-100 PSD displays a marked loss of particles with diameters between ∼5 and 23 µm. The corresponding loss of liquid water was 0.181 g m−3 (Fig. 7). The most obvious explanation is evaporation of droplets (Wegener–Bergeron–Findeisen process). The loss of LWC is much lower than the more-than-order-of-magnitude difference in IWC for the two cases. The high-ice period is characterized by an order of magnitude higher Ni concentration (525 L−1) compared with 50 L−1 during the low-ice period. The correlation between IWC and Ni was 0.98 (0.98). There were no relationships between LWC or IWC and either temperature or water vapor concentration, which were relatively invariant, i.e., ∘C and 8064±204 ppmv, respectively.
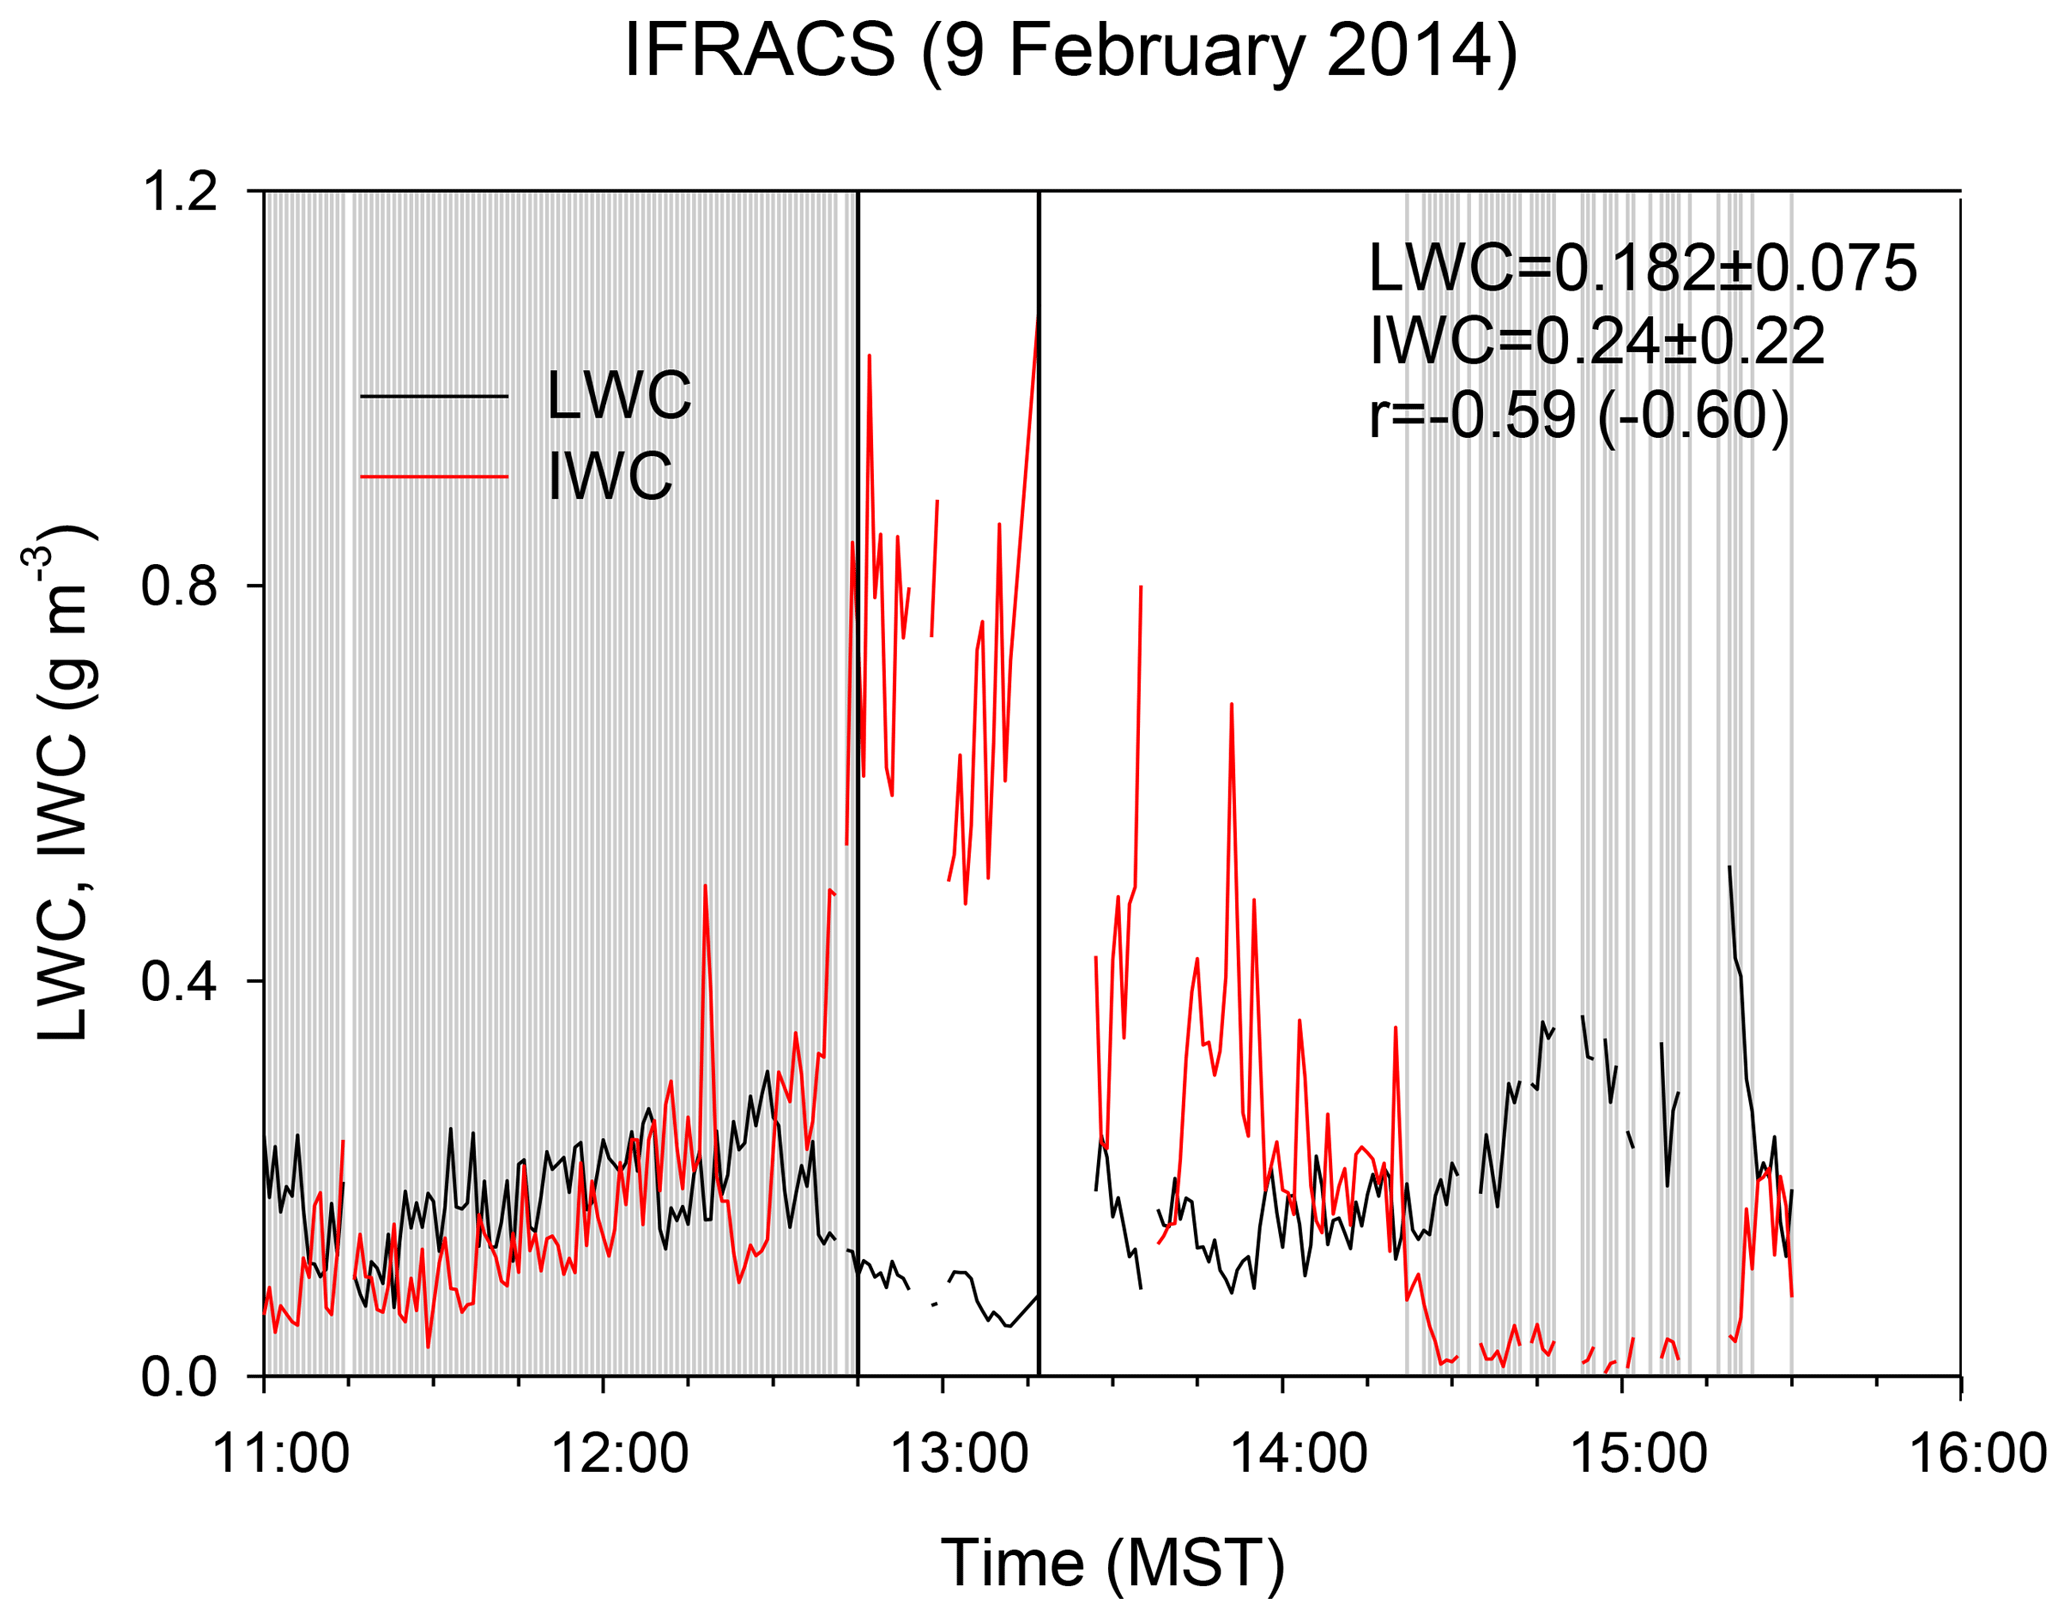
Figure 6Time series of LWC and IWC on 9 February 2014 during IFRACS. The high-ice period is from 12:45 to 13:17 MST. The low-ice periods are indicated by the shaded areas.
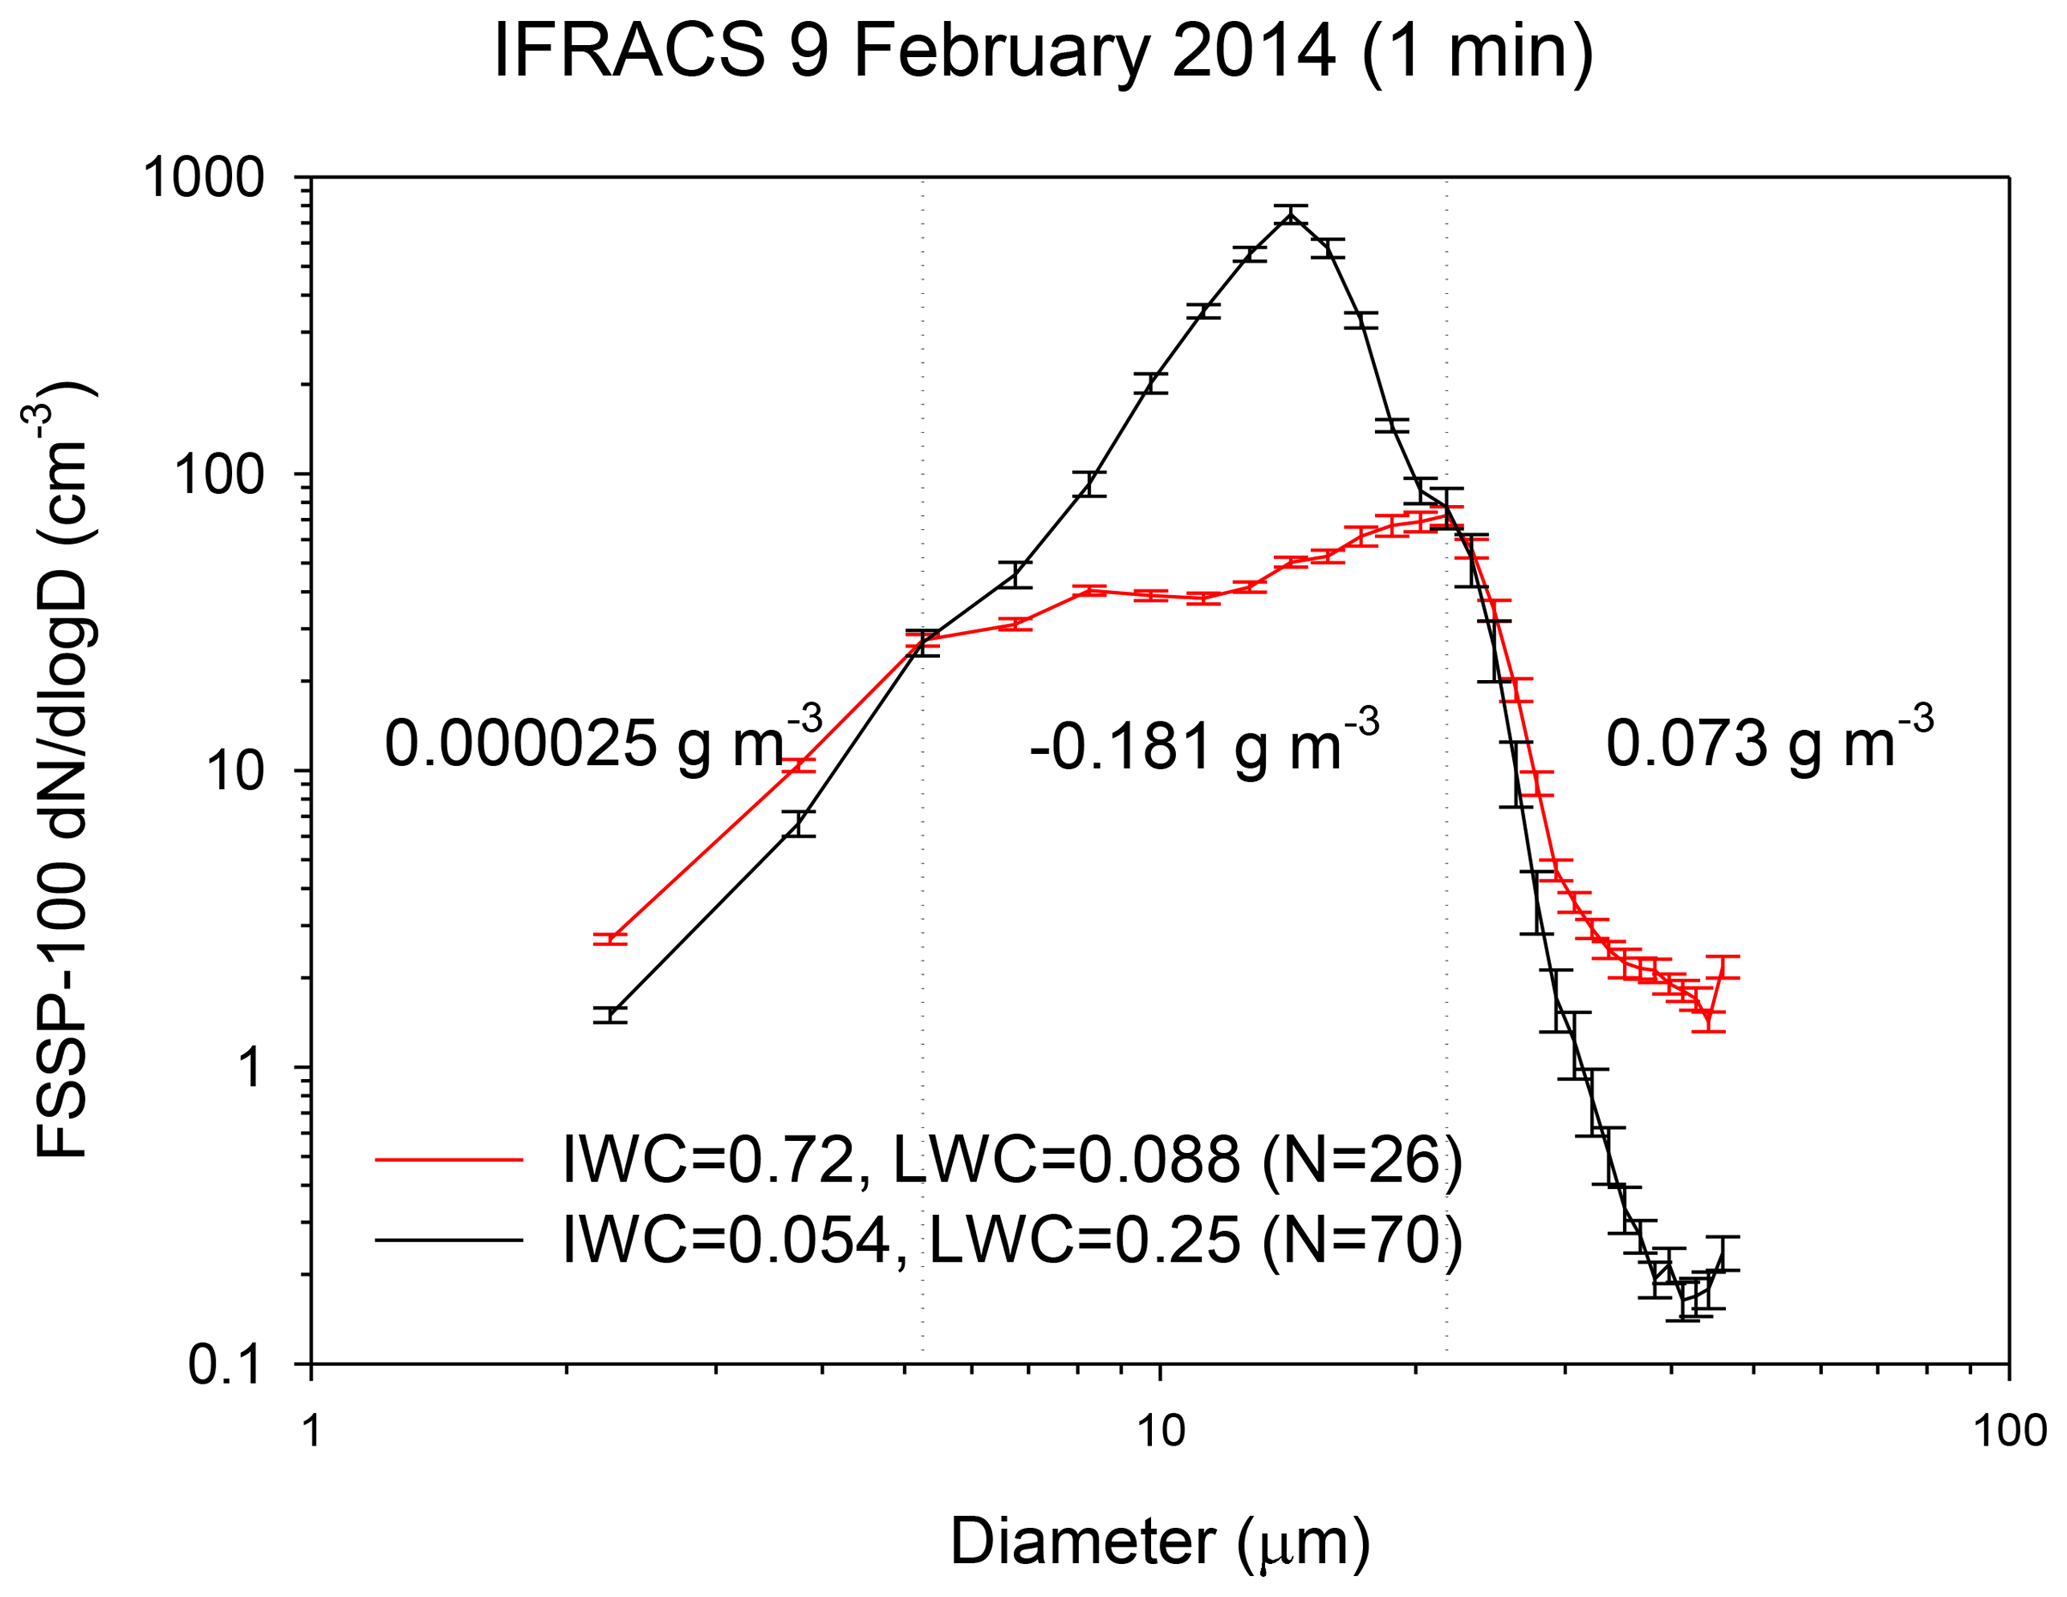
Figure 7Average PSDs for high-ice (12:45–13:17 MST) and low-ice (<12:45 or >13:17 MST and ) periods in Fig. 6. The values in the middle of the plot are the differences between the high (red) and low (black) cumulative LWC in the three sections of the distributions defined by the vertical dotted lines. The error bars are standard errors.
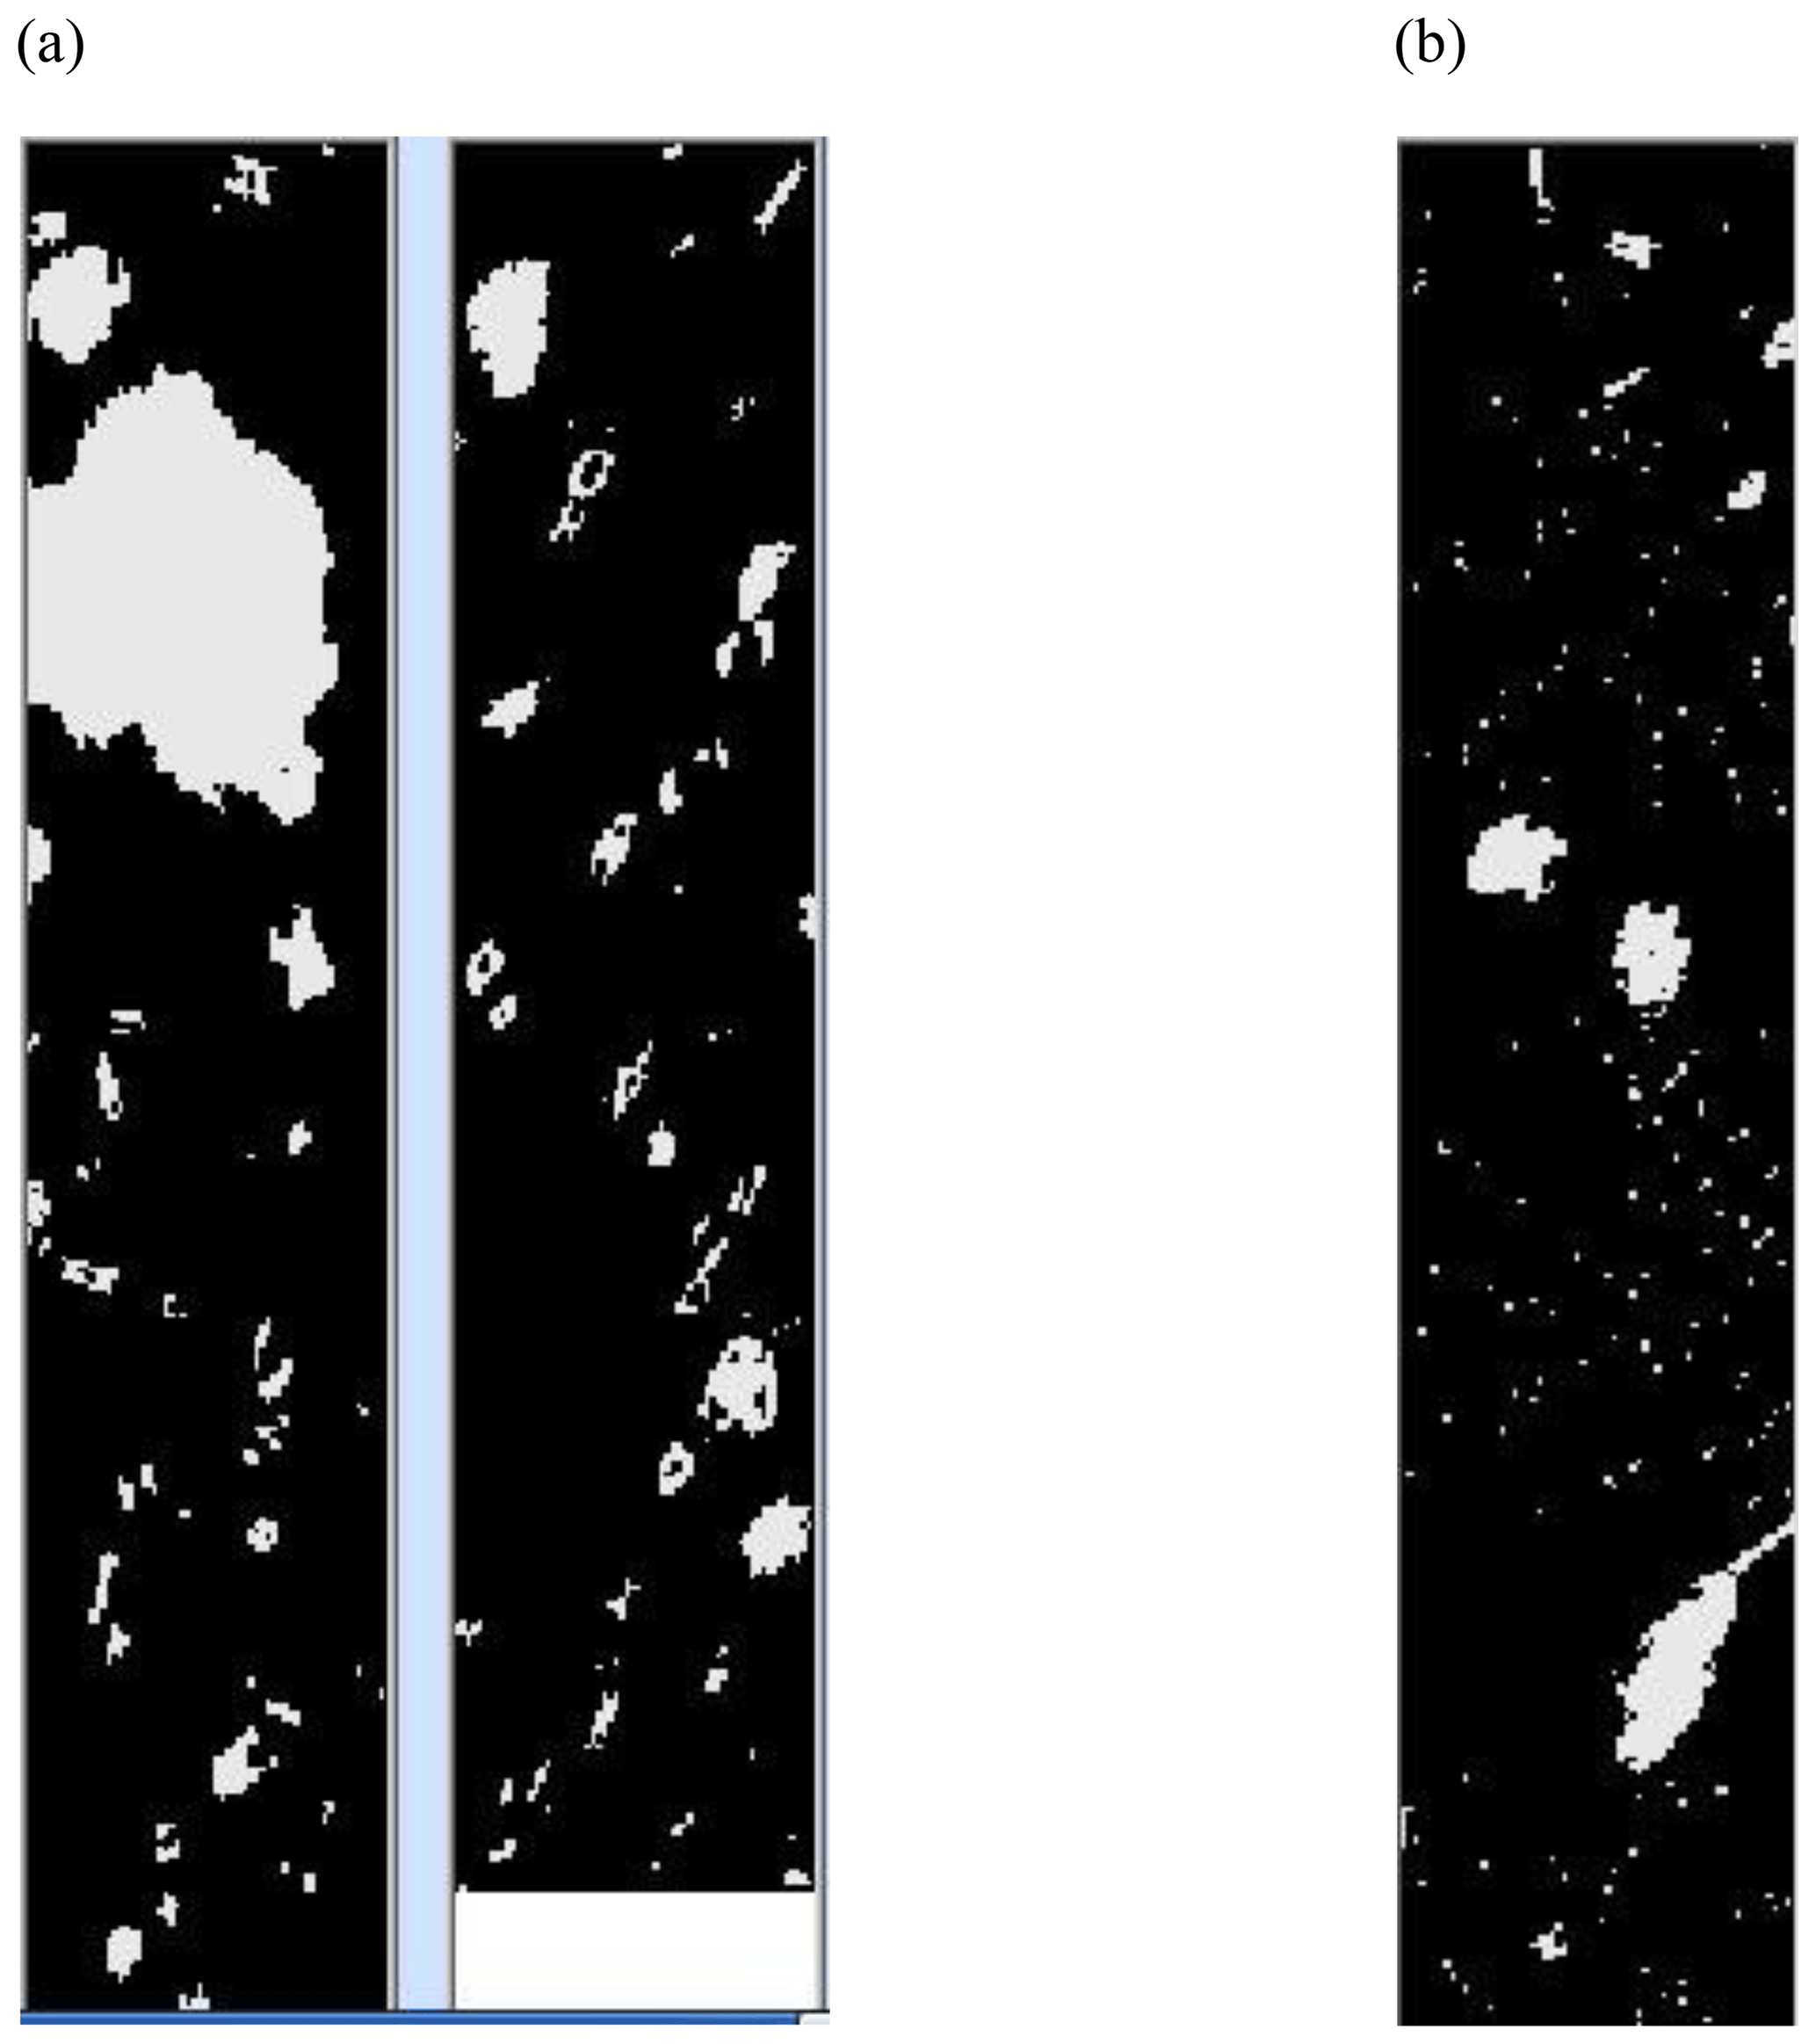
Figure 8CIP images from 9 February 2014: (a) 13:12:19 MST, high-ice and low-LWC, and (b) 12:29:09 MST, low-ice and high-LWC periods. The vertical bars contain all of the images sampled in 1 s. The width of each bar corresponds to 1600 µm.
3.4 Liquid-mediated ice production
In this section, the hypothesis that ice production in MPC at SPL was related to large droplet concentration is examined. Large droplets are defined as CDNC25-35 with diameters between 25 and 35 µm. Because of the paucity of CDNC25-35 concentrations >0 during StormVEx, the analysis is confined to IFRACS. The 30 s averages were calculated for periods with CDNC25-35 >0 and Conc75-200 >0 using the 75 % data completeness criterion. The relationships between 30 s average CDNC25-35 and Conc75-200 were examined under cold ( ∘C) and warm ( ∘C) conditions. This is intended to distinguish cold and warm primary or secondary (e.g., Hallett–Mossop rime splintering) ice production processes. Figure 9a and b present relationships for IFRACS under cold and warm conditions, respectively. The average temperatures for the cold and warm periods were and ∘C, respectively. Figure 9a shows a moderate relationship (r=0.72 [0.73]) between CDNC25-35 and Conc75-200 at cold temperatures but no relationship at warm temperatures (r=0.161 [−0.165]).
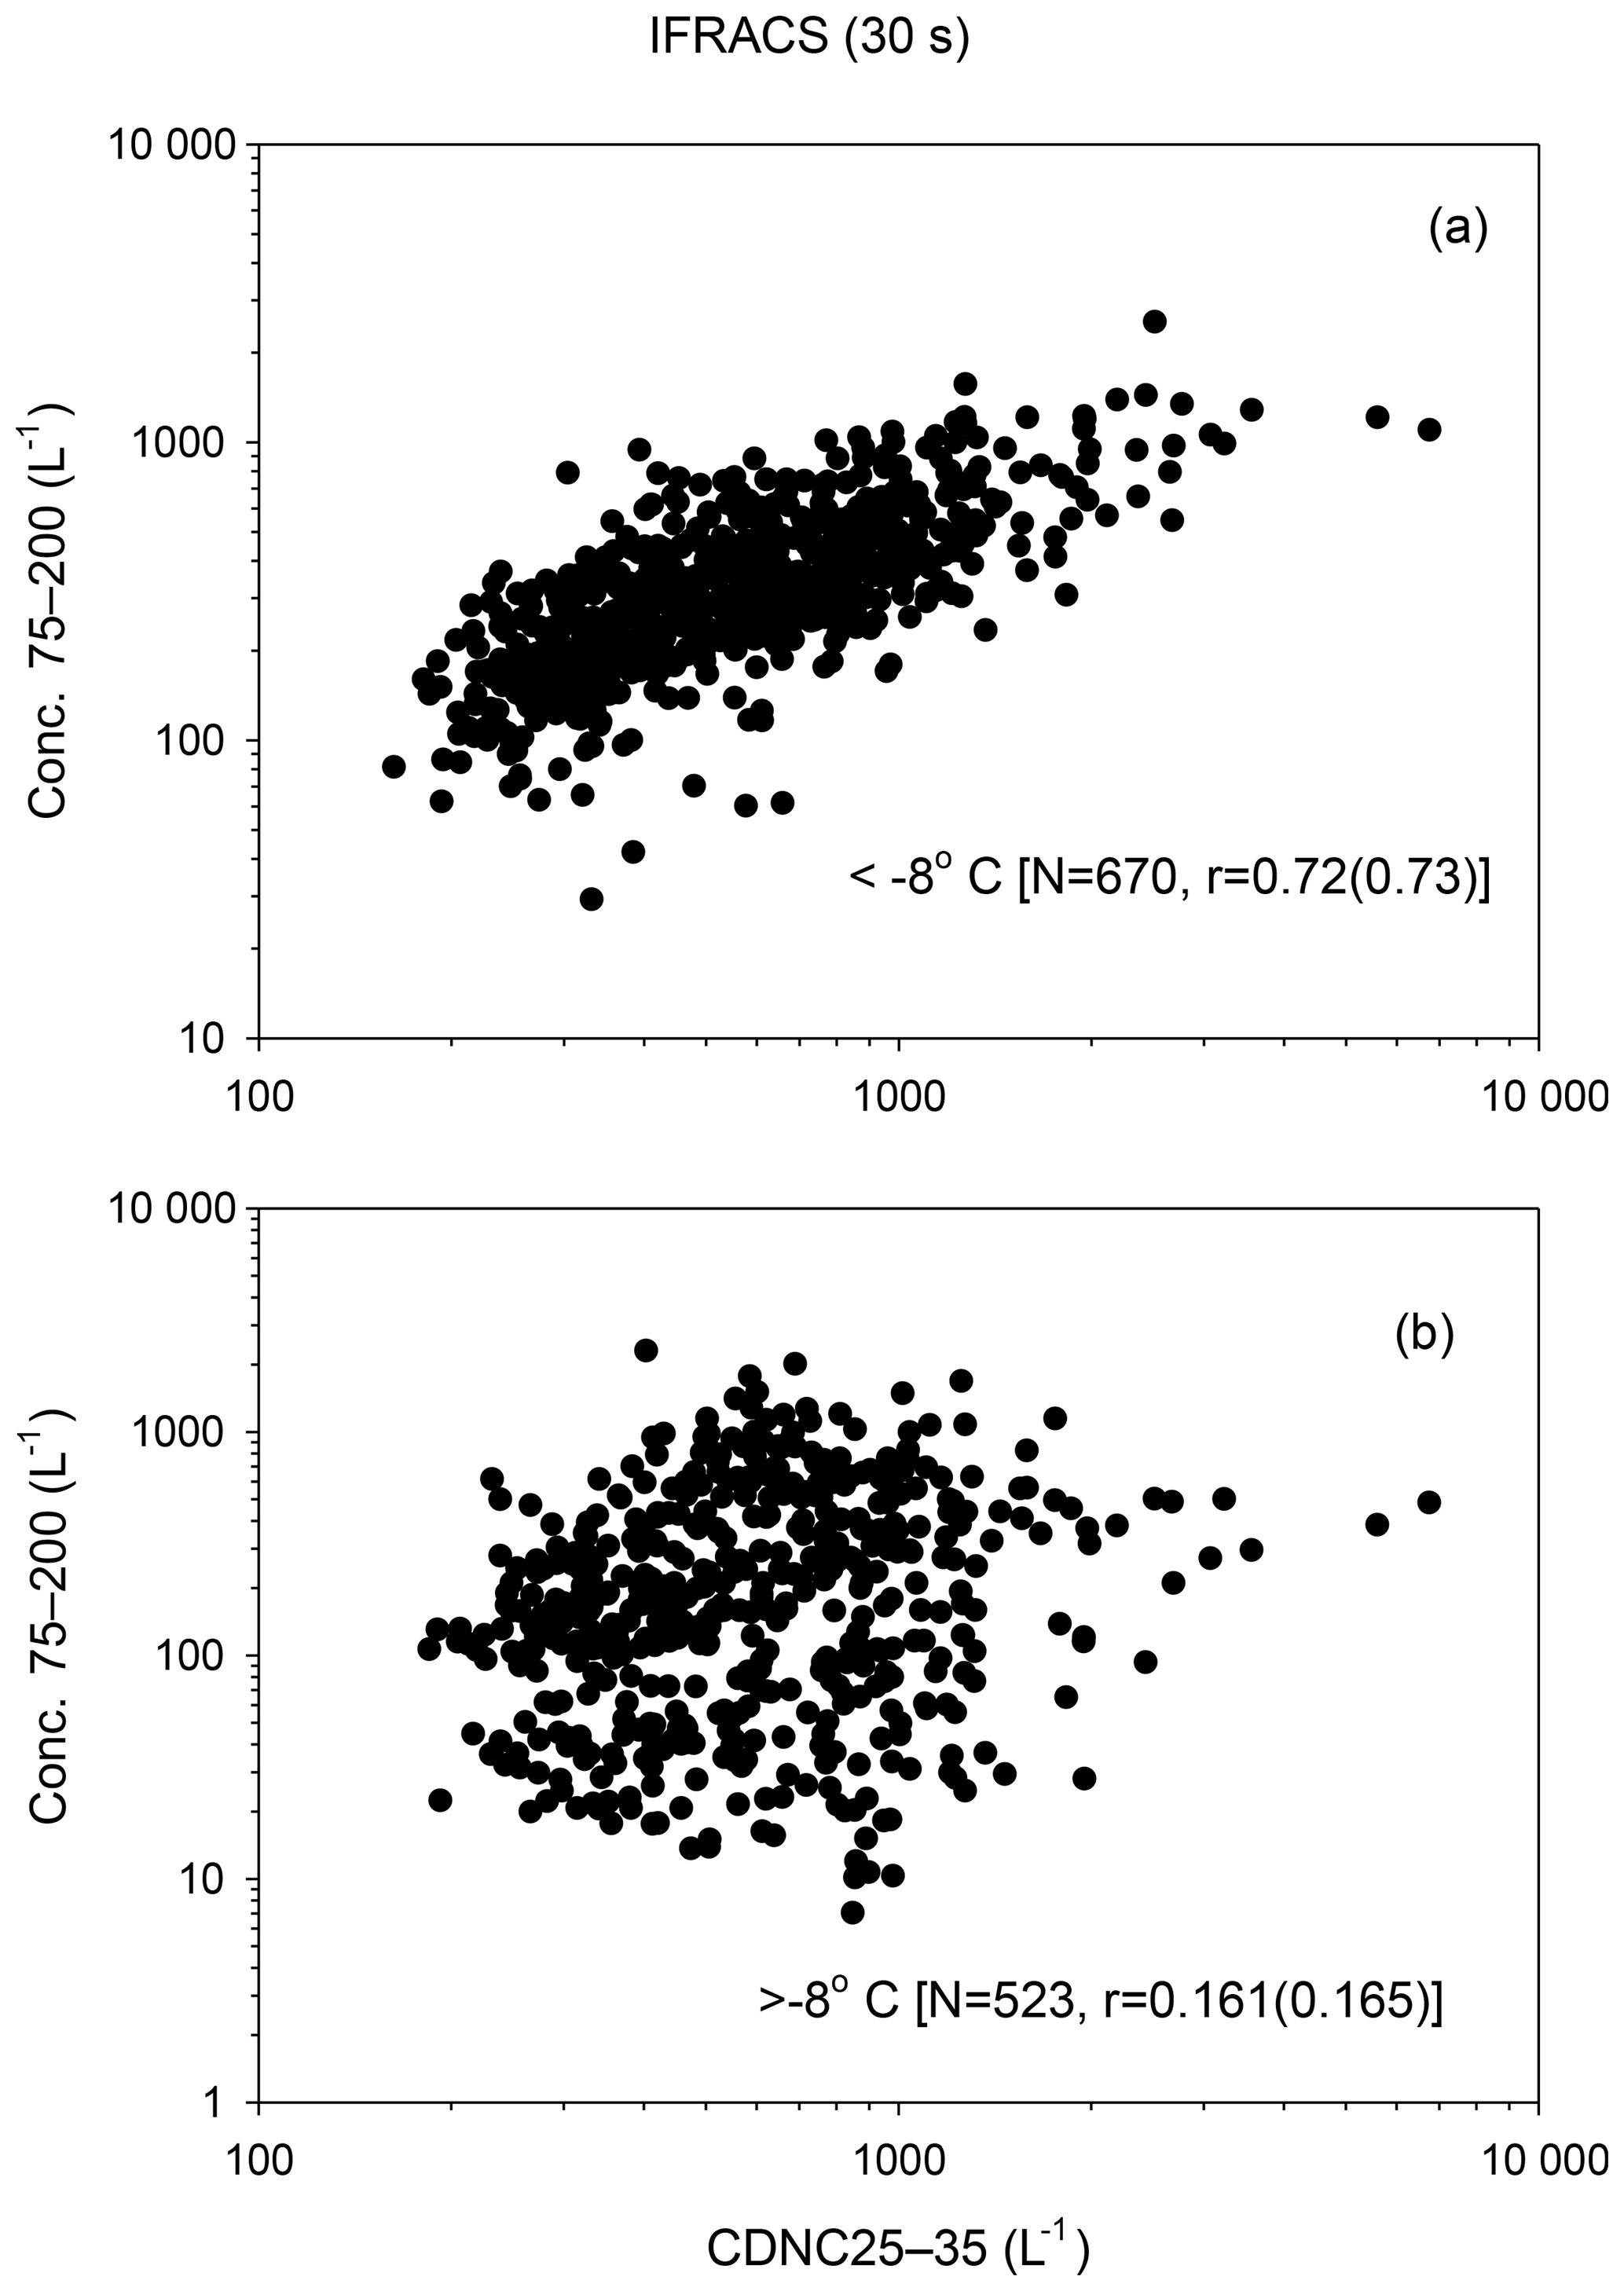
Figure 9Relationships between 30 s average concentrations of large cloud droplets (CDNC25-35) and small ice crystals (Conc75-200) during IFRACS under cold conditions (<8 ∘C) and warm (>8 ∘C) conditions. The number of observations and the Pearson (Spearman rank) correlations are shown.
Given the relationships between large droplet and small ice crystal concentrations, is the temperature range at SPL consistent with immersion and/or contact freezing? This appears to be the case at colder temperatures ( ∘C) at SPL for contact freezing, as seen in Figs. 7 and 13 in Ladino Moreno et al. (2013) and for immersion freezing, particularly for biological INPs (Levin and Yankofsky, 1983; Du et al., 2017; Kanji et al., 2017). The lack of a relationship at warm temperatures would appear to preclude secondary ice formation by the Hallett–Mossop process. As noted above, the FSSP-100 cannot distinguish liquid droplets from ice crystals. It is possible that the relationship between CDNC25-35 and Conc75-200 represents an autocorrelation between two segments of the ice crystal distribution. Two factors argue against this: (1) Fig. 3 suggests that ice particles are 6 times more prevalent than droplets in the large droplet size range; and (2) the relationship does not exist at ∘C. Higher-resolution instruments, such as the holographic imagers used by Beals et al. (2015) and Beck et al. (2018), should be used to address this issue.
3.5 Blowing snow
Blowing snow can cause significant artifacts in ice crystal measurements at surface locations. Rogers and Vali (1987) found higher ice crystal concentrations at the Elk Mountain Observatory compared with those observed aloft on the University of Wyoming Queen Air but discounted blowing snow as the explanation for this difference. Lloyd et al. (2015) concluded that high ice crystal concentrations at JFJ were not caused by blowing snow. Geerts et al. (2015) compared CIP concentrations (≥75 µm) at SPL with those measured aboard the University of Wyoming King Air (UWKA) during the Colorado Airborne Multiphase Cloud Study (CAMPS) when the aircraft was in the vicinity of SPL. Concentrations were considerably higher at SPL when the maximum wind speed associated with 5 min average measurements was above about 4 m s−1. This was attributed to blowing snow. However, a valid comparison between aircraft and surface measurements depends on the assumption that both platforms measure the same ice crystal population. This would require establishing crystal trajectories from a point upwind aloft to a point downwind at the surface. Even if a direct link between the PSDs aloft and at the surface could be demonstrated, the falling crystal PSD is likely to be modified by depositional growth at ice supersaturation in the low-level liquid cloud, riming and aggregation, or sublimation in subsaturated regions. Beck et al. (2018) reported a large increase in Ni when the maximum wind speed increased from 14–16 to ≥16 m s−1 at the Sonnblick Observatory in Rauris, Austria, when winds were from the south.
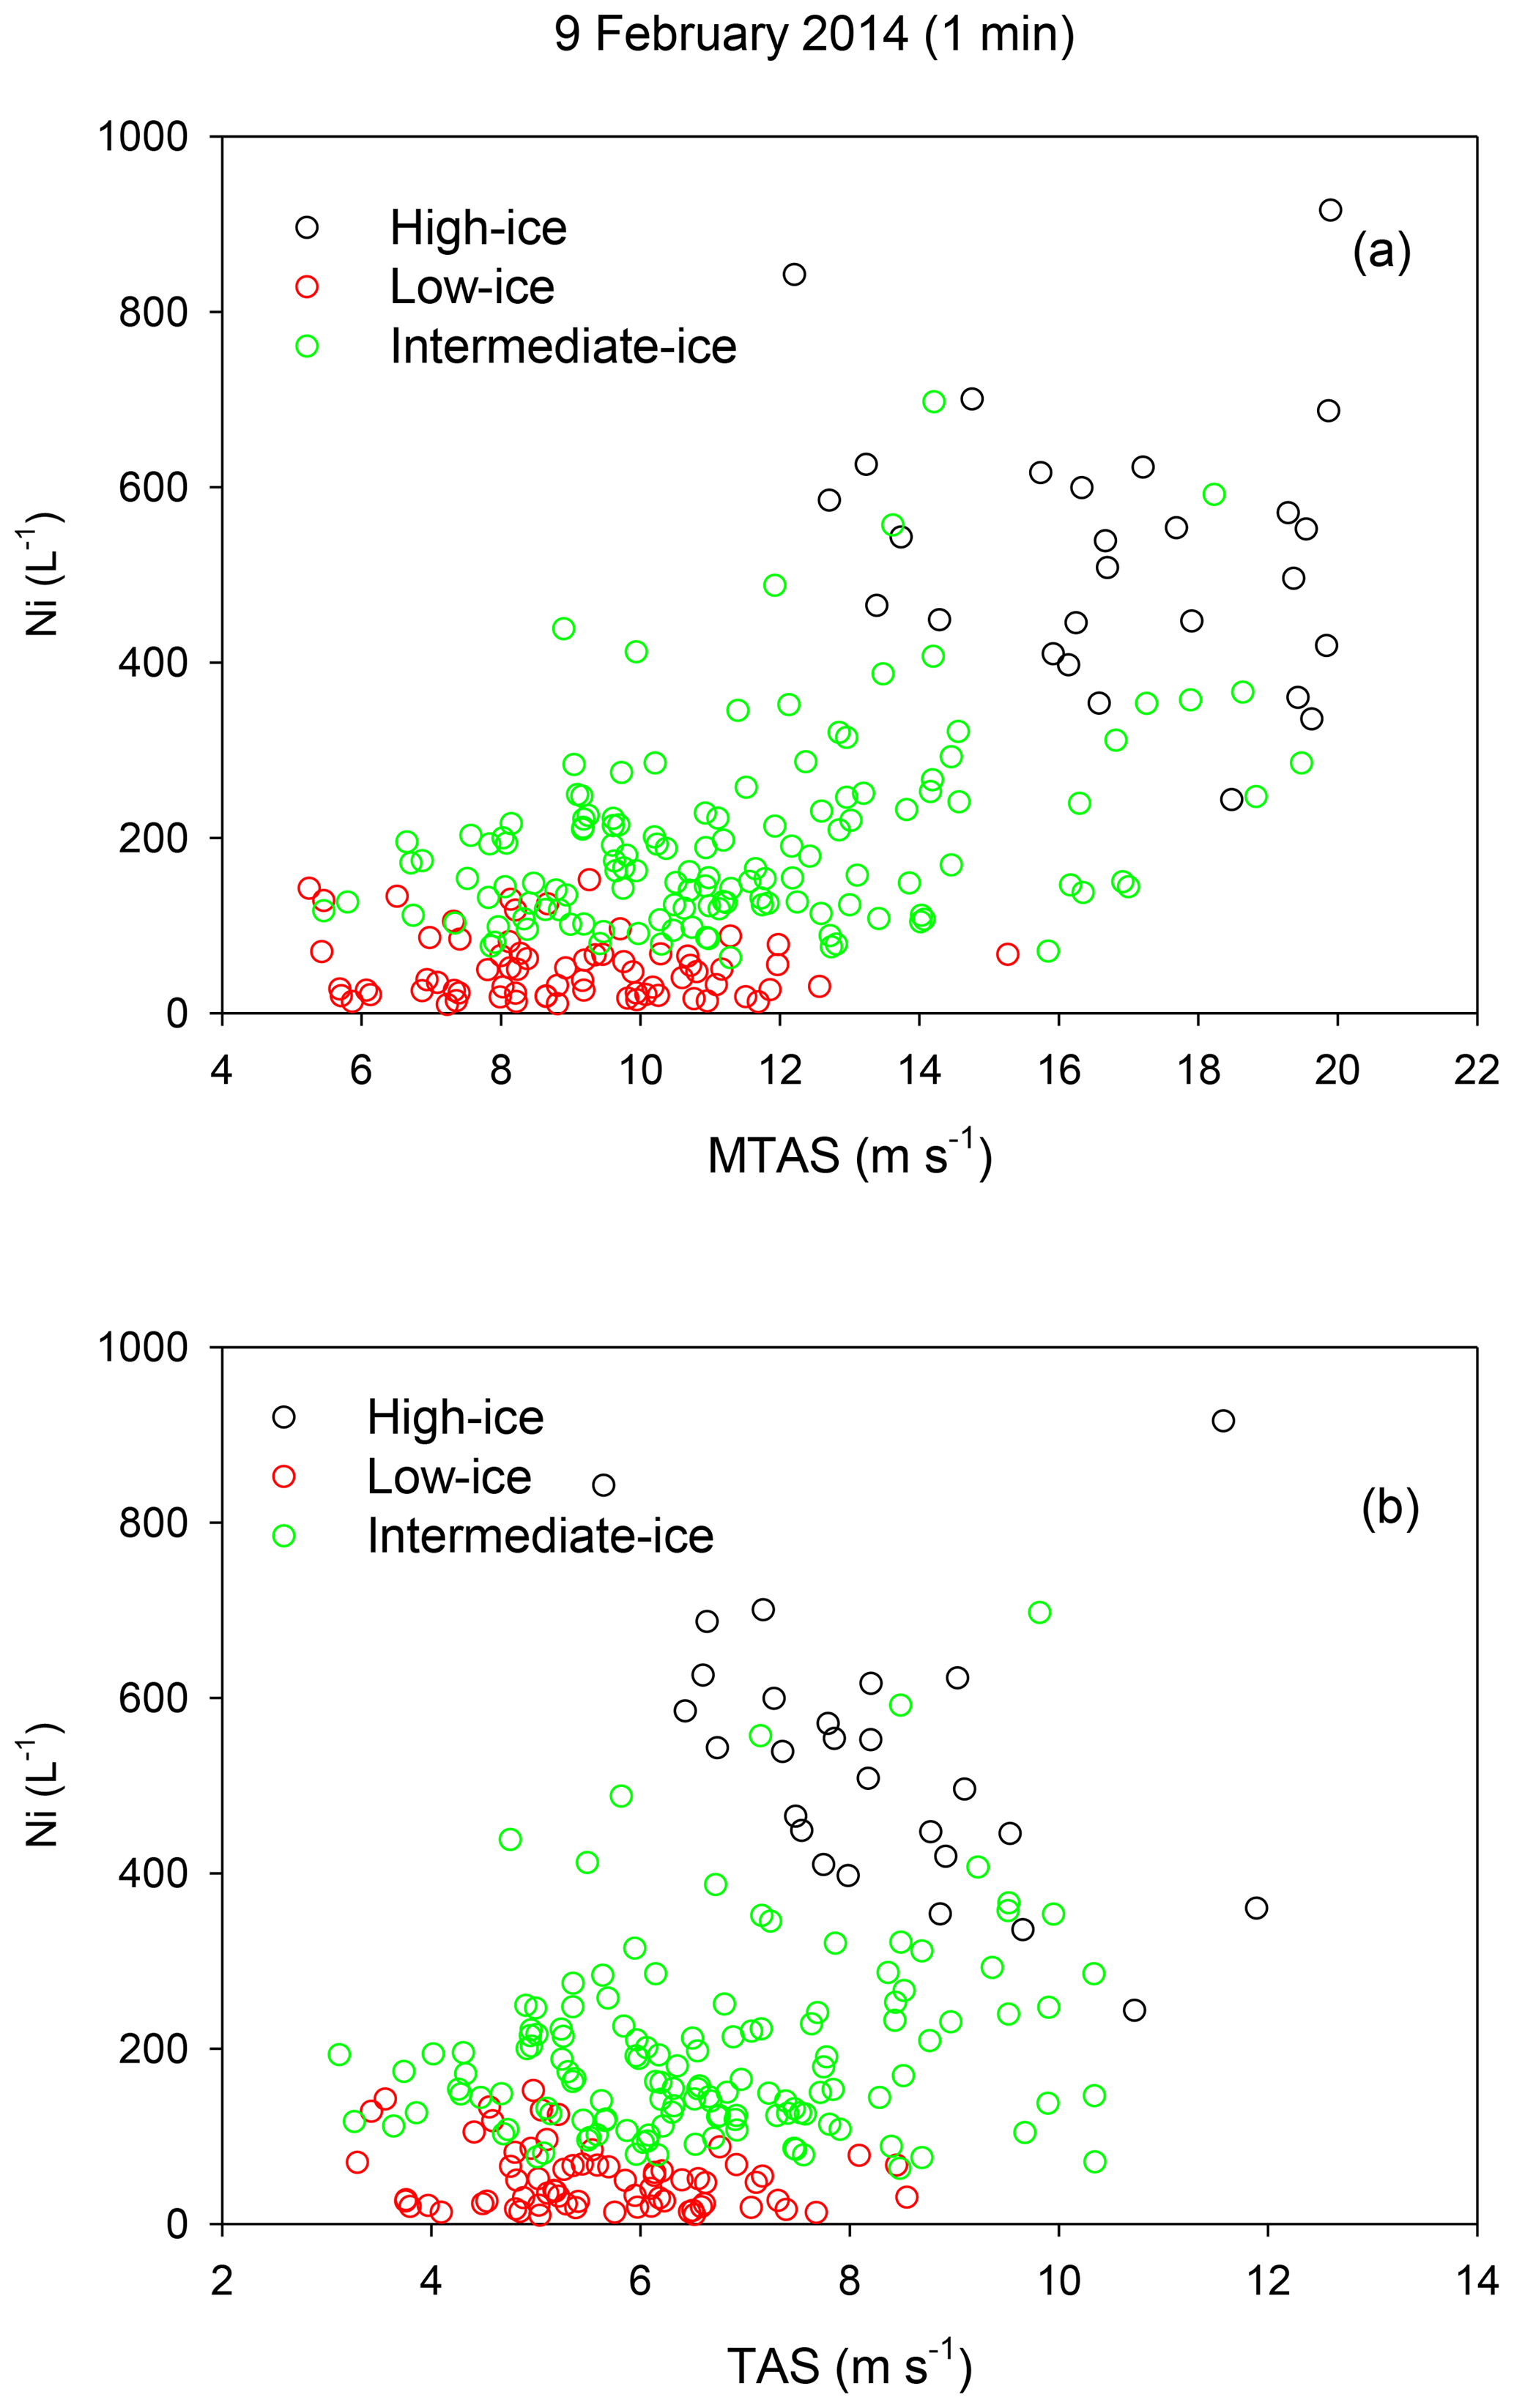
Figure 10Relationships between maximum 1 s TAS (MTAS) (a) and 1 min average TAS (b) and Ni for high-ice, low-ice, and intermediate-ice (all other 1 min periods) periods on 9 February 2014.
Figure 10a plots the 1 s maximum TAS (MTAS) during a 1 min period and the corresponding 1 min average TAS (Fig. 10b) against 1 min average Ni for high-ice, low-ice, and all other (intermediate-ice) periods on 9 February 2014. MTAS was highly correlated with TAS [0.90 (0.90] over the course of the day. The highest Ni values correspond to the highest MTAS (and TAS), and vice versa. Average MTAS was 16.6±2.4, 8.9±2.0, and 11.3±2.8 m s−1 during high-, low-, and intermediate-ice periods, respectively. This could imply that high Ni resulted from blowing snow when the winds were higher in the early afternoon. However, contrary to results reported by Beck et al. (2018), there was no step function in Ni corresponding to a threshold in MTAS. Further, there appears to be an inverse relationship between 1 min MTAS and 1 min Ni, especially for the high- and low-ice regimes. Beck et al. (2018) noted that a correlation between MTAS and blowing snow could be reduced if the averaging time was too long or obscured because of an (indeterminate) lag between the arrival of the gust and the particles that may have been lofted by it. Beck et al. (2018) suggested using an averaging time of 10–15 s. Figure 11 plots 15 s average (using the 75 % data completeness criterion) MTAS against Ni for the high-ice, low-ice, and intermediate-ice periods on 9 February 2014. Figure 11 shows that while both MTAS and Ni varied considerably in each case, there was no apparent wind speed threshold and the correlations between MTAS and Ni were actually negative under high- and low-ice conditions. These results are not consistent with the blowing snow hypothesis.
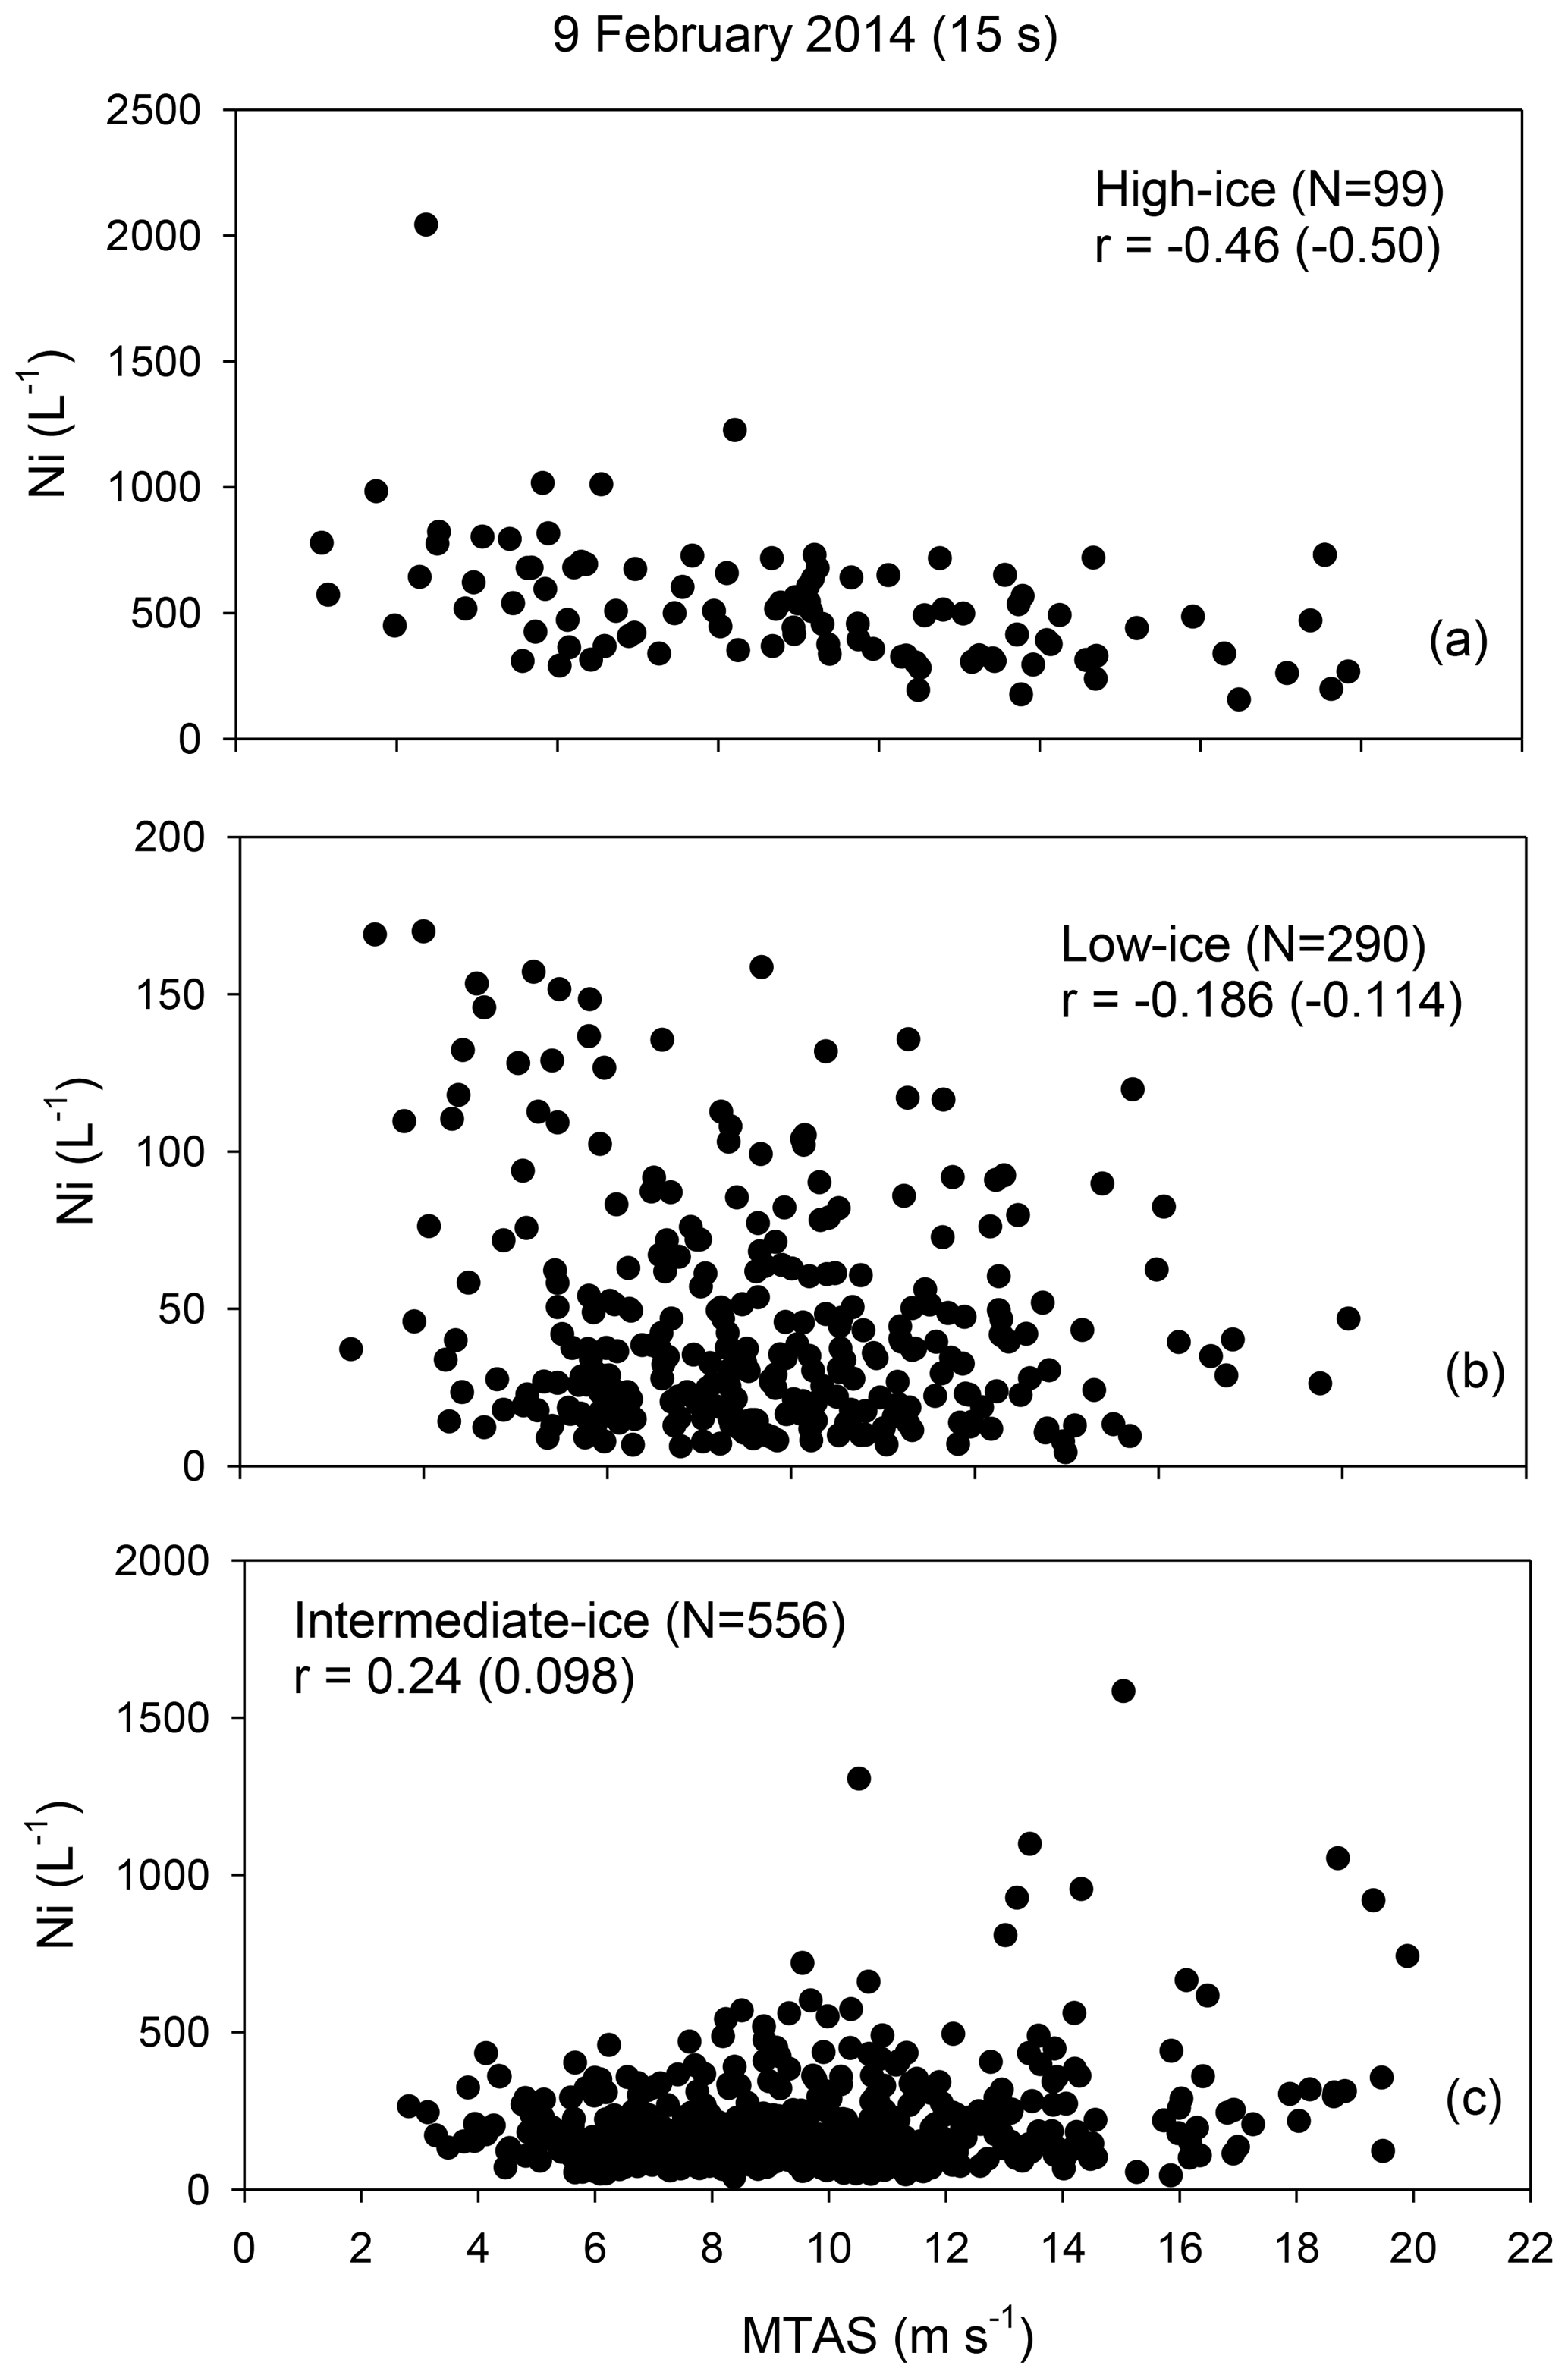
Figure 11Relationships between 15 s average Ni and MTAS for high-ice (a), low-ice (b), and intermediate-ice (c) periods on 9 February 2014.
Table 3Relationships between TAS and small ice crystal concentrations (Conc75-200) during StormVEx and IFRACS. r is the Pearson (Spearman rank) correlation.
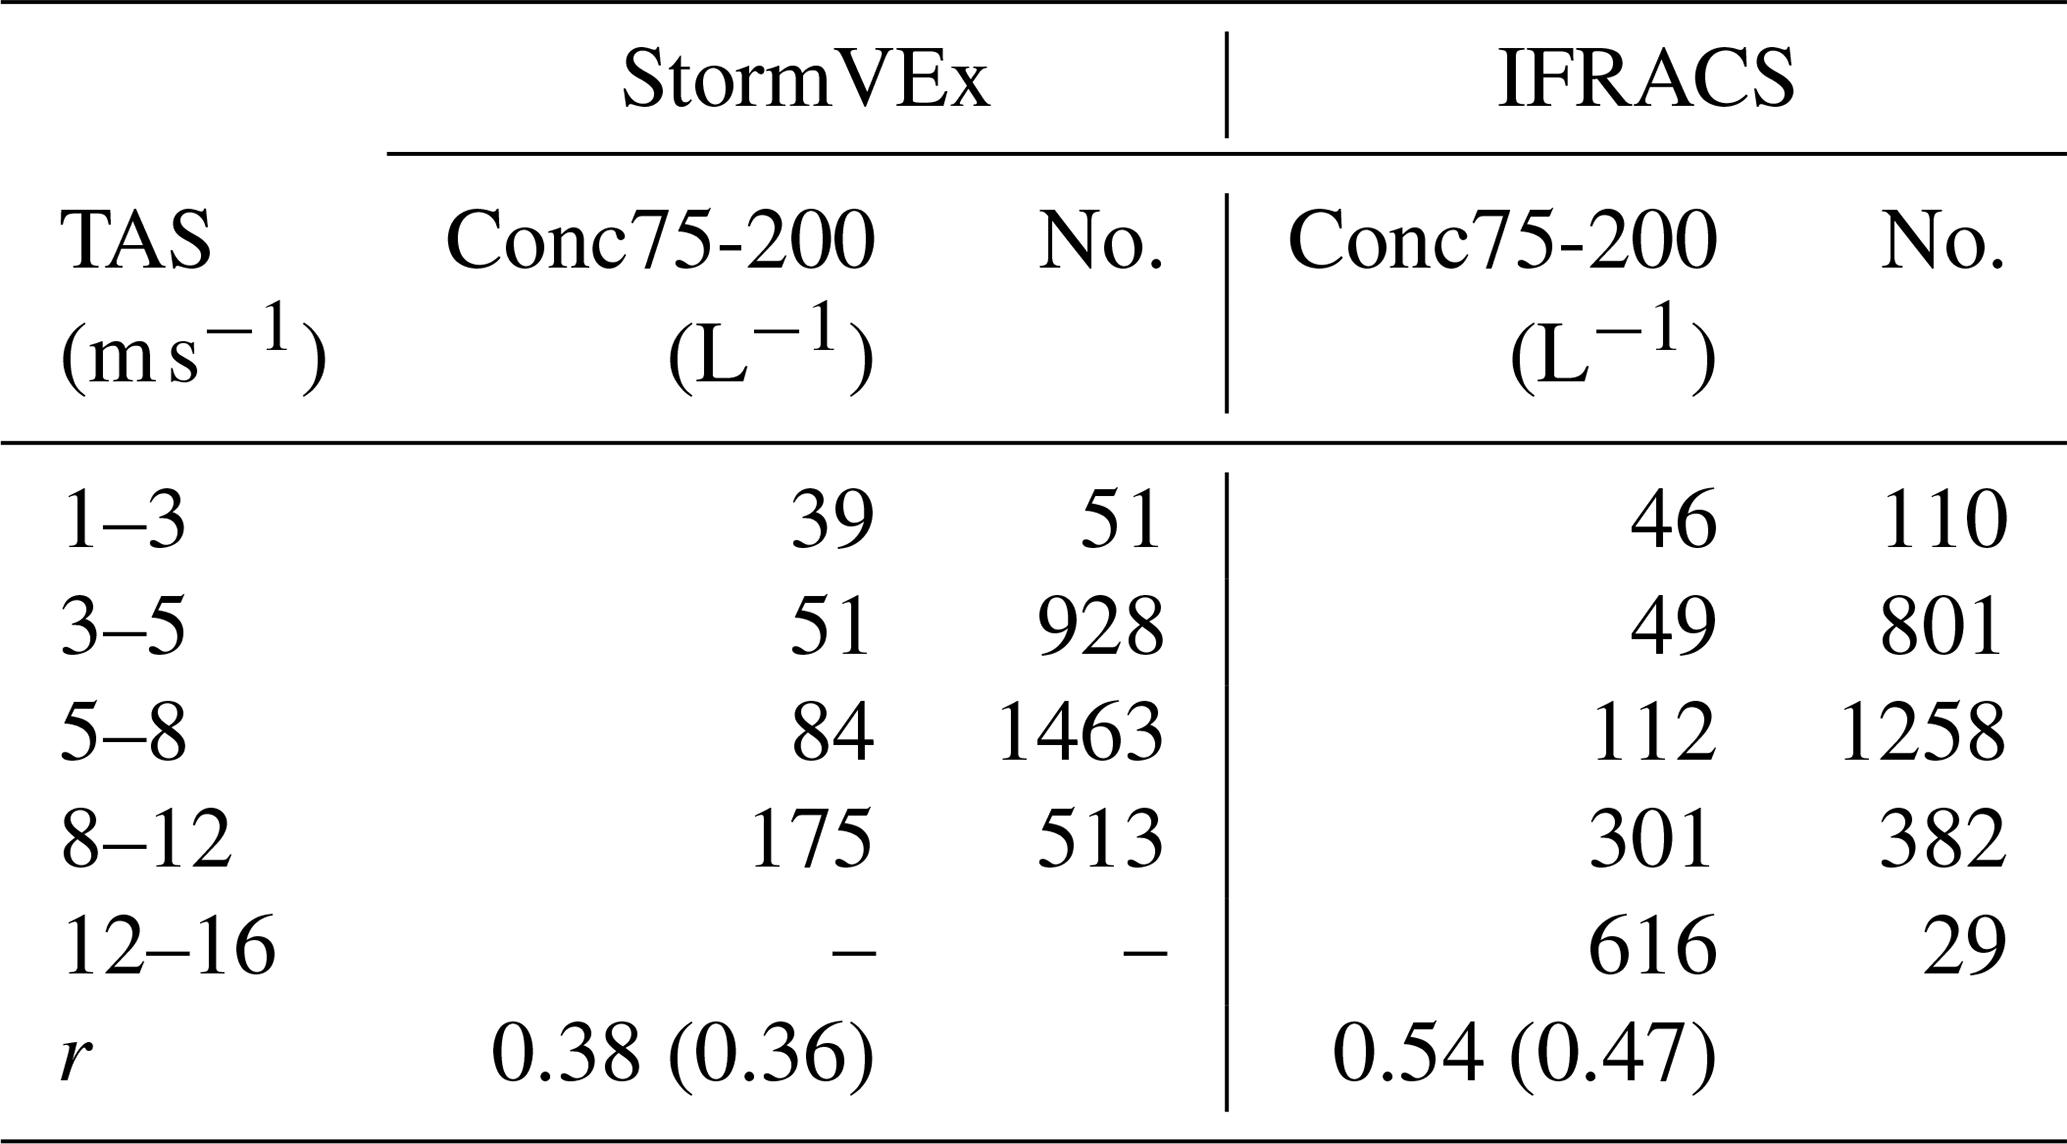
Examining all available data, Table 3 presents average Conc75-200 over ranges of TAS during StormVEx and IFRACS. Conc75-200 increases monotonically, if not linearly, with TAS in both studies. If it is assumed that smaller crystals should be lofted more efficiently from the snow surface and remain suspended farther downwind than larger ones (Schmidt Jr., 1982), blowing snow should result in a relative enrichment of small crystals in the CIP PSD, independent of absolute concentration. Average 1 min CIP PSDs were calculated, normalized to average Ni, and expressed as percentages. These are presented for high (8–12 m s−1) and low (1–3 m s−1) TAS in Fig. 12. During StormVEx, Conc75-200 was 83 % and 93 % of Ni at low and high TAS, respectively. The corresponding percentages during IFRACS were 79 % and 87 %, respectively. The relative enrichments of Conc75-200 at high TAS, i.e., 10 % and 8 %, during StormVEx and IFRACS, respectively, are consistent with expectations for blowing snow. However, these percentages cannot explain the large differences in the absolute concentrations of Conc75-200 at high and low wind speeds, which are factors of 4.5 and 6.5 during StormVEx and IFRACS, respectively (Table 3). They also do not explain the large differences between surface and aircraft measurements observed by Rogers and Vali (1987) and Geerts et al. (2015). Correlation of wind speed with crystal concentrations does not necessarily imply blowing snow. In mountain clouds, ice crystal concentrations vary with synoptic and orographic dynamics. Stronger uplift nucleates more crystals upwind and above the mountain barrier as droplets continue to grow and temperatures decrease (e.g., Neiman et al., 2002; Stoelinga et al., 2013). The correlations between 1 min average TAS and vertical velocity were 0.75 (0.72) and 0.66 (0.67) during StormVEx and IFRACS, respectively.
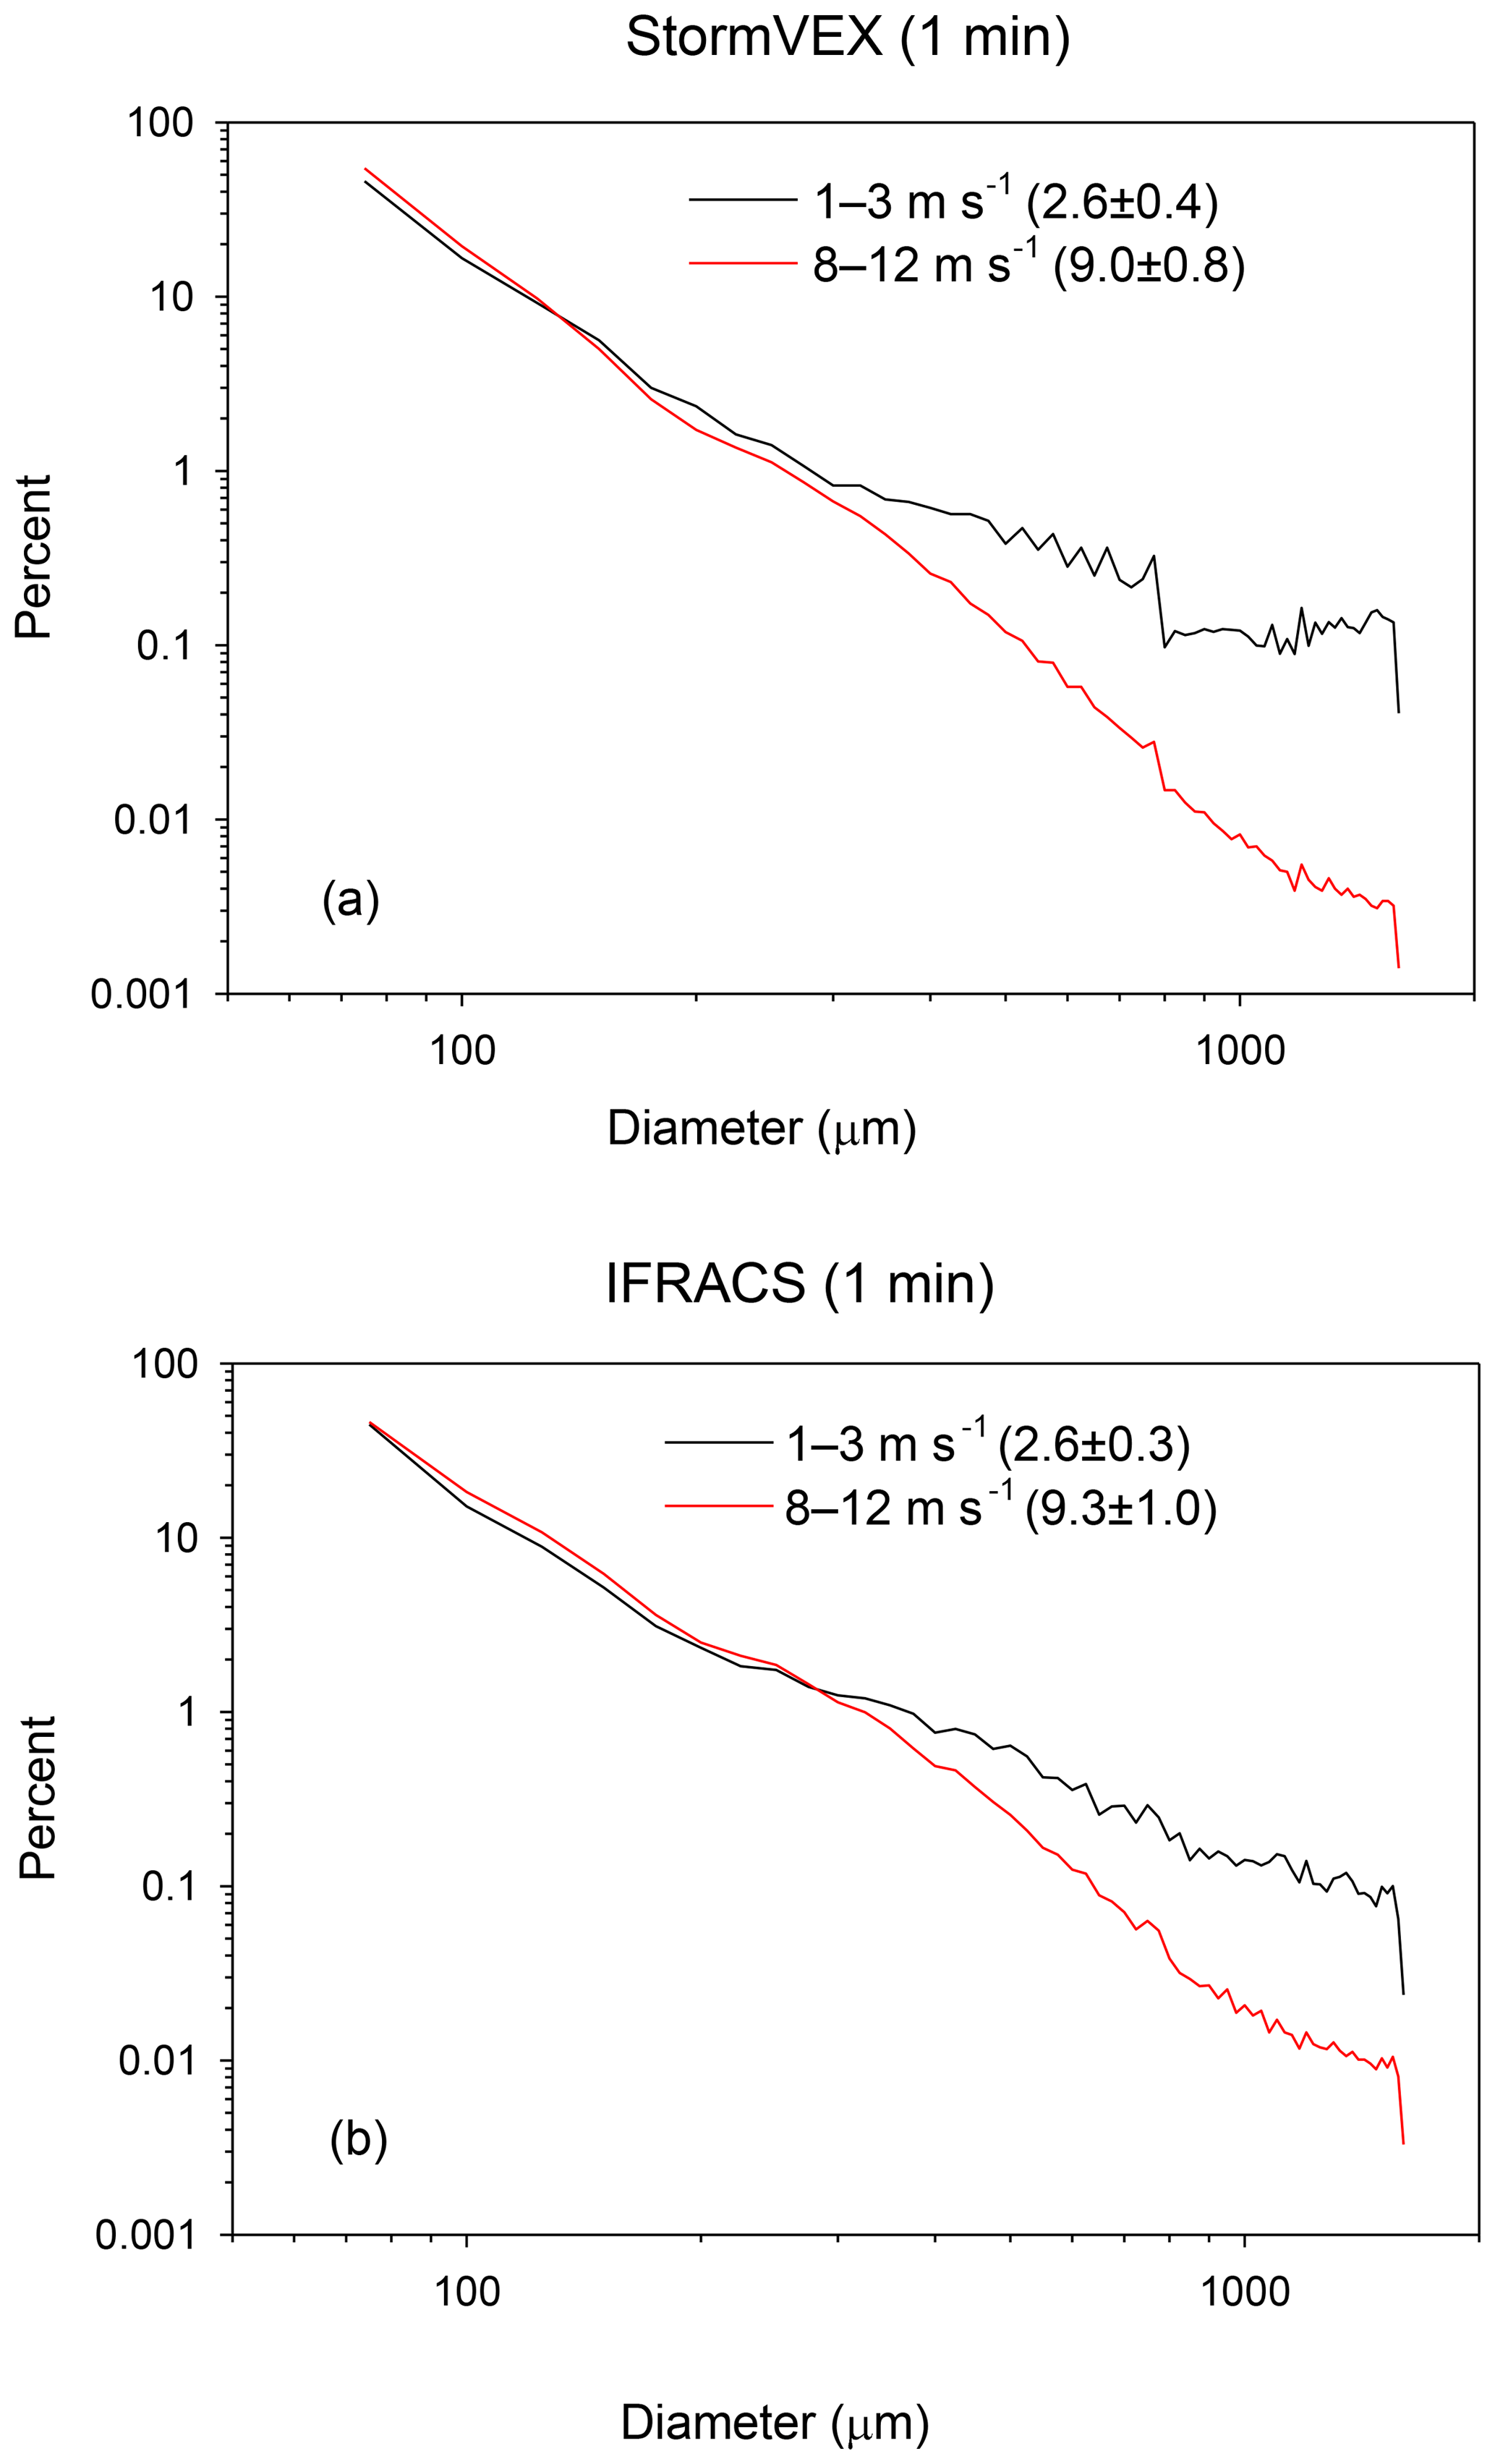
Figure 12Averages of 1 min relative (% of Ni) CIP PSDs at low (1–3 m s−1) and high (8–12 m s−1) TAS during StormVEx (a) and IFRACS (b). Average TAS values are shown in parentheses.
3.6 Secondary ice production
Secondary ice production (SIP) mechanisms have been extensively reviewed (e.g., Field et al., 2017). Sullivan et al. (2018) modeled SIP by rime splintering, droplet shattering, and collisional breakup. Rangno and Hobbs (2001) concluded that shattering of large droplets (>50 µm) upon freezing could have accounted for high observed ice particle concentrations in Arctic stratus. While there is no evidence of droplets this large at SPL, they could be present upwind and above SPL. Keppas et al. (2017) concluded that rime splintering occurred in warm (−6 to 0 ∘C) frontal clouds. Lollie-shaped crystals were taken as evidence of riming of columnar crystals by droplets larger than 100 µm. Neither ice lollies nor droplets this large have been observed in MPC at SPL. Lloyd et al. (2015) considered blowing snow, rime splintering, and detachment of surface frost (Bacon et al., 1998) as sources of high ice particle concentrations at JFJ. They ultimately favored the latter process, albeit with no direct evidence. There is also no evidence regarding surface frost splinters at SPL. Snow was continually falling during measurement periods at SPL, leaving no undisturbed icy surface to accumulate frost. Rime splintering (Hallett–Mossop) is thought to occur at temperatures above −8 ∘C. During StormVEx, average Conc75-200 was 13.6 and 89 L−1 at temperatures warmer than −8 ∘C and colder than −12 ∘C, respectively. The corresponding average TAS values were 5.8 and 5.2 m s−1, respectively. During IFRACS, average Conc75-200 was 95 and 116 L−1 at temperatures warmer than −8 ∘C and colder than −12 ∘C, respectively. The corresponding average TAS values were 6.1 and 4.9 m s−1, respectively. While rime splintering may have occurred, it was not the dominant ice formation mechanism.
Studies of orographic MPCs were conducted at SPL in northwestern Colorado in January and February during StormVEx (2011) and IFRACS (2014). In total, the data represent ∼92 h when SPL was immersed in supercooled liquid cloud and it was snowing. On average, liquid cloud PSDs, CDNC, NMD, and LWC were similar between years, while Ni and IWC were 48 % and 114 % higher, respectively, during IFRACS. Average wind speeds were similar (∼6 m s−1) in both studies, while average temperatures were colder during StormVEx (−12.8 ∘C) than IFRACS (−8.2 ∘C). Supercooled liquid cloud properties at SPL were consistent between the two studies. The microphysical properties of ice particles were more variable as they depend on the structure of the cloud above and upstream of SPL.
The inverse relationship between cloud droplet size (NMD) and concentration (CDNC) is related to CCN at SPL (Borys et al., 2000). This relationship is stronger when the data are stratified by LWC. Both CDNC and NMD increase with increasing LWC, demonstrating droplet growth and enhanced activation or entrainment of CCN below SPL. Future studies at SPL would benefit from direct measurement of cloud base height. There was a weak relationship between LWC and IWC for all data (the correlation was −0.18 (−0.10) and −0.13 (−0.16) during StormVEx and IFRACS, respectively); however, a stronger inverse relationship was evident on several days during each study. This was demonstrated for a case on 9 February 2014, where the correlation between IWC and LWC was −0.59 (−0.60). During a period of maximum IWC on this day, the droplet PSD showed a significant loss of liquid water and a decrease in droplet concentration compared to periods with low IWC and high LWC. As there was an order of magnitude increase in the ice crystal concentration (Ni) between the high- and low-ice periods, the loss of LWC was likely due to crystal growth at the expense of evaporating droplets (Wegener–Bergeron–Findeisen process).
A relationship between large cloud droplets (CDNC25-35) and small ice crystals (Conc75-200) during IFRACS suggests that droplet freezing (contact or immersion) was involved in ice production at SPL. This relationship was only evident at temperatures below −8 ∘C. There was no evidence that secondary ice production mechanisms such as rime splintering, large droplet freezing, or frost splintering influenced Conc75-200 at SPL. It is unclear how these processes could have produced the observed correlation between large droplet and small ice crystal concentrations. Blowing snow can significantly impact surface ice crystal concentrations and has been invoked to explain large differences between surface and aircraft ice crystal measurements. The potential effect of blowing snow on ice crystal measurements at SPL was evaluated from two perspectives. On 9 February 2014, during IFRACS, 1 min average Ni increased with both 1 min average TAS and the 1 s maximum TAS (MTAS), although there was no threshold wind speed or step function in Ni. However, during high-ice and low-ice periods, there was an inverse correlation between 15 s average Ni and MTAS over a wide range of MTAS. This is not consistent with blowing snow. For the entire data set, Ni also increased with wind speed. To test the hypothesis that this was caused by blowing snow, it was assumed that blowing snow should preferentially enhance the relative abundance of small crystals (Conc75-200) in the CIP PSD. Comparison of the relative (expressed as percentages of Ni) ice crystal PSDs at high (8–12 m s−1) and low (1–3 m s−1) TAS showed that Conc75-200 was enriched by 8 %–10 % at higher TAS. However, this level of enrichment cannot explain the factor of 4.5–6.5 higher Conc75-200 at high TAS at SPL or previously reported orders of magnitude differences between surface and aircraft measurements. Stronger dynamics, especially orographic and/or convective uplift, also contribute to ice production upwind and above the mountain. It is possible that both primary production and blowing snow were active at SPL. These results highlight the need for targeted experiments to quantify the contributions of blowing snow to ice crystal concentrations at mountaintop locations. They also demonstrate the limitations of instrumentation such as the FSSP-100 and CIP (2-D optical array probe) for distinguishing liquid droplets from small ice crystals in mixed-phase clouds. Higher-resolution instruments are required for this purpose.
Data are available at https://www.dri.edu/doug-lowenthal-research-reviews, last access: 15 April 2019.
DHL is Professor Emeritus at DRI, was the principal investigator on IFRACS, worked on the IFRACS field experiment, analyzed the StormVEx and IFRACS data, and produced the first draft and subsequent revisions of the manuscript and the responses to the reviewers. AGH is the director of the Desert Research Institute's Storm Peak Laboratory, was a principal investigator on StormVEx and co-principal investigator on IFRACS, contributed to the first draft and subsequent revisions of the manuscript, and provided input on the responses to the reviewers. ROD was a graduate student at DRI who worked on the IFRACS field experiment, used the results in his Master's thesis, contributed to the first draft and subsequent revisions of the manuscript, and provided input on the responses to the reviewers. IBM is the site manager at Storm Peak Laboratory, supervised the StormVEx and IFRACS field programs, and participated in the StormVEx and IFRACS field experiments. RDB is Professor Emeritus at DRI, participated in the IFRACS field experiment, and provided input to the first draft of the manuscript. GGM was a principal investigator on StormVEx and provided input to the first draft of the manuscript.
The authors declare that they have no conflict of interest.
This work was supported by Department of Energy Atmospheric System Research Program grant DE-SC0014304 and by National Science Foundation Division of Atmospheric Sciences grant AGS-1260462. Logistical assistance from the Steamboat Ski and Resort Corporation is greatly appreciated. The Desert Research Institute is an equal opportunity service provider and employer and is a permittee of the Medicine Bow–Routt National Forests. We would especially like to thank and acknowledge the hard work of many people who made the StormVEx project possible, including the many DOE ATSC and ASR staff, Storm Peak Laboratory (SPL) local volunteers, the Steamboat Ski and Resort Corporation, the US Forest Service, the Grand Junction National Weather Service office, and all of the graduate students (Betsy Berry, Stewart Evans, Ben Hillman, Will Mace, Clint Schmidt, Carolyn Stwertka, Adam Varble, and Christy Wall), who put considerable effort into data collection.
This paper was edited by Ottmar Möhler and reviewed by two anonymous referees.
Albrecht, B. A.: Aerosols, cloud microphysics, and fractional cloudiness, Science, 245, 1227–1230, https://doi.org/10.1126/science.245.4923.1227, 1989.
Bacon, N. J., Swanson, B. D., Baker, M. B., and Davis, E. J.: Breakup of levitated frost particles. J. Geophys. Res., 103, 13763–13775, https://doi.org/10.1029/98JD01162, 1998.
Baumgardner, D. and Korolev, A.: Airspeed corrections for optical array probe sample volumes, J. Atmos. Ocean. Tech., 14, 1224–1229, https://doi.org/10.1175/1520-0426(1997)014<1224:ACFOAP>2.0.CO;2, 1997.
Beals, M. J., Fugal, J. P., Shaw, R. A., Lu, J., Spuler, S. M., and Stith, J. L.: Holographic measurements of inhomogeneous cloud mixing at the centimeter scale, Science, 350, 87–89, https://doi.org/10.1126/science.aab0751, 2015.
Beck, A., Henneberger, J., Fugal, J. P., David, R. O., Lacher, L., and Lohmann, U.: Impact of surface and near-surface processes on ice crystal concentrations measured at mountain-top research stations, Atmos. Chem. Phys., 18, 8909–8927, https://doi.org/10.5194/acp-18-8909-2018, 2018.
Borys, R. D. and Wetzel, M. A.: Storm Peak Laboratory: a research, teaching, and service facility for the atmospheric sciences, B. Am. Meteorol. Soc., 78, 2115–2123, https://doi.org/10.1175/1520-0477(1997)078<2115:SPLART>2.0.CO;2, 1997.
Borys, R. D., Lowenthal, D. H., and Mitchell, D. L.: The relationships among cloud microphysics, chemistry, and precipitation rate in cold mountain clouds, Atmos. Environ., 34, 2593–2602, https://doi.org/10.1016/S1352-2310(99)00492-6, 2000.
Borys, R. D., Lowenthal, D. H., Cohn, S. A., and Brown, W. O. J.: Mountaintop and radar measurements of aerosol effects on snow growth and snowfall rate, Geophys. Res. Lett., 30, 1538, https://doi.org/10.1029/2002GL016855, 2003.
Brown, P. R. A. and Francis, P. N.: Improved measurements of the ice water-content in cirrus using a total-water probe, J. Atmos. Ocean. Tech., 12, 410–414, https://doi.org/10.1175/1520-0426(1995)012<0410:IMOTIW>2.0.CO;2, 1995.
Crosier, J., Bower, K. N., Choularton, T. W., Westbrook, C. D., Connolly, P. J., Cui, Z. Q., Crawford, I. P., Capes, G. L., Coe, H., Dorsey, J. R., Williams, P. I., Illingworth, A. J., Gallagher, M. W., and Blyth, A. M.: Observations of ice multiplication in a weakly convective cell embedded in supercooled mid-level stratus, Atmos. Chem. Phys., 11, 257–273, https://doi.org/10.5194/acp-11-257-2011, 2011.
de Boer, G., Morrison, H., Shupe, M. D., and Hildner, R.: Evidence of liquid dependent ice nucleation in high-latitude stratiform clouds from surface remote sensors, Geophys. Res. Lett., 38, L01803, https://doi.org/10.1029/2010GL046016, 2011.
Diehl, K., Simmel, M., and Wurzler, S.: Numerical sensitivity studies on the impact of aerosol properties and drop freezing modes on the glaciation, microphysics, and dynamics of clouds, J. Geophys. Res., 111, D07202, https://doi.org/10.1029/2005JD005884, 2006.
Du, R., Du, P., Lu, Z., Ren, W., Liang, Z., Qin, S., Li, Z., Wang, Y., and Fu, P.: Evidence for a missing source of efficient ice nuclei, Sci. Rep.-UK, 7, 39673, https://doi.org/10.1038/srep39673, 2017.
Field, P. R., Heymsfield, A. J., and Bansemer, A.: Shattering and particle interarrival times measured by optical array probes, J. Atmos. Ocean. Tech., 23, 1357–1371, https://doi.org/10.1175/JTECH1922.1, 2006.
Field, P. R., Lawson, R. P., Brown, P. R. A., Lloyd, G., Westbrook, C., Moisseev, D., Miltenberger, A., Nenes, A., Blyth, A., Choularton, T., Connolly, P., Buehl, J., Crosier, J., Cui, Z., Dearden, C., DeMott, P., Flossmann, A., Heymsfield, A., Huang, Y., Kalesse, H., Kanji, Z. A., Korolev, A., Kirchgaessner, A., Lasher-Trapp, S., Leisner, T., McFarquhar, G., Phillips, V., Stith, J., and Sullivan, S.: Secondary ice production: current state of the science and recommendations for the future, Meteorological Monographs, 58, 7.20, https://doi.org/10.1175/AMSMONOGRAPHS-D-16-0014.1, 2017.
Geerts, B., Pokharel, B., and Kristocich, D. A. R.: Blowing snow as a natural glaciogenic cloud seeding mechanism, Mon. Weather Rev., 143, 5017–5033, https://doi.org/10.1175/MWR-D-15-0241.1, 2015.
Gerber, H., Frick, G., and Rodi, A. R.: Ground-based FSSP and PVM measurements of liquid water content, J. Atmos. Ocean. Tech., 16, 1143–1149, https://doi.org/10.1175/1520-0426(1999)016<1143:GBFAPM>2.0.CO;2, 1999.
Hallett, J. and Mossop, S. C.: Production of secondary particles during the riming process, Nature, 249, 26–28, https://doi.org/10.1038/249026a0, 1974.
Heymsfield, A. and Parrish, J. L.: A computational technique for increasing the effective sampling volume of the PMS 2-D particle size spectrometer, J. Appl. Meteorol., 17, 1566–1572, https://doi.org/10.1175/1520-0450(1978)017<3C1566:ACTFIT>2.0.CO;2, 1978.
Hobbs, P. V.: The nature of winter clouds and precipitation in the Cascade Mountains and their modification by artificial seeding: Part I. Natural conditions, J. Appl. Meteorol., 14, 783–804, https://doi.org/10.1175/1520-0450(1975)014<0783:TNOWCA>2.0.CO;2, 1975.
Hobbs, P. V. and Rangno, A. L.: Ice particle concentration in clouds, J. Atmos. Sci., 42, 2523–2549, https://doi.org/10.1175/1520-0469(1985)042<2523:IPCIC>2.0.CO;2, 1985.
Hoose, C. and Möhler, O.: Heterogeneous ice nucleation on atmospheric aerosols: a review of results from laboratory experiments, Atmos. Chem. Phys., 12, 9817–9854, https://doi.org/10.5194/acp-12-9817-2012, 2012.
Kanji, Z. A., Ladino, L. A., Wex, H., Boose, Y., Burkert-Kohn, M., Cziczo, D. J., and Kramer, M.: Overview of ice nucleating particles, Meteorological Monographs, 58, 1.1–1.33, https://doi.org/10.1175/AMSMONOGRAPHS-D-16-0006.1, 2017.
Keppas, S. C., Crosier, J., Choularton, T. W., and Bower, K. N.: Ice lollies: An ice particle generated in supercooled conveyor belts, Geophys. Res. Lett., 44, 5222–5230, https://doi.org/10.1002/2017GL073441, 2017.
Knopf, D. A. and Alpert, P. A.: A water activity based model of heterogeneous ice nucleation kinetics for freezing of water and aqueous solution droplets, Faraday Discuss., 165, 513–534, https://doi.org/10.1039/c3fd00035d, 2013.
Knopf, D. A., Alpert, P. A., and Wang, B.: The role of organic aerosol in atmospheric ice nucleation: a review, ACS Earth Space Chem., 2, 168–202, https://doi.org/10.1021/acsearthspacechem.7b00120, 2018.
Korolev, A., Strapp, J., and Isaac, G.: Evaluation of the accuracy of PMS Optical Array Probes, J. Atmos. Ocean. Tech., 15, 708–720, https://doi.org/10.1175/1520-0426(1998)015<0708:EOTAOP>2.0.CO;2, 1998.
Ladino Moreno, L. A., Stetzer, O., and Lohmann, U.: Contact freezing: a review of experimental studies, Atmos. Chem. Phys., 13, 9745–9769, https://doi.org/10.5194/acp-13-9745-2013, 2013.
Lamb, D., Nielsen, K. W., Klieforth, H. E., and Hallett, J.: Measurement of liquid water content in cloud systems over the Sierra Nevada, J. Appl. Meteorol., 15, 763–775, https://doi.org/10.1175/1520-0450(1976)015<0763:MOLWCI>2.0.CO;2, 1976.
Lance, S., Shupe, M. D., Feingold, G., Brock, C. A., Cozic, J., Holloway, J. S., Moore, R. H., Nenes, A., Schwarz, J. P., Spackman, J. R., Froyd, K. D., Murphy, D. M., Brioude, J., Cooper, O. R., Stohl, A., and Burkhart, J. F.: Cloud condensation nuclei as a modulator of ice processes in Arctic mixed-phase clouds, Atmos. Chem. Phys., 11, 8003–8015, https://doi.org/10.5194/acp-11-8003-2011, 2011.
Levin, Z. and Yankofsky, S. A.: Contact versus immersion freezing of freely suspended droplets by bacterial ice nuclei, J. Appl. Meteorol. Climatol., 22, 1964–1966, https://doi.org/10.1175/1520-0450(1983)022<1964:CVIFOF>2.0.CO;2, 1983.
Lloyd, G., Choularton, T. W., Bower, K. N., Gallagher, M. W., Connolly, P. J., Flynn, M., Farrington, R., Crosier, J., Schlenczek, O., Fugal, J., and Henneberger, J.: The origins of ice crystals measured in mixed-phase clouds at the high-alpine site Jungfraujoch, Atmos. Chem. Phys., 15, 12953–12969, https://doi.org/10.5194/acp-15-12953-2015, 2015.
Lohmann, U. and Diehl, K.: Sensitivity studies of the importance of dust ice nuclei for the indirect aerosol effect on stratiform mixed-phase clouds, J. Atmos. Sci., 63, 968–982, https://doi.org/10.1175/JAS3662.1, 2006.
Lowenthal, D. H., Borys, R. D., and Wetzel, M. A.: Aerosol distributions and cloud interactions at a mountaintop laboratory, J. Geophys. Res., 107, 4345, https://doi.org/10.1029/2001JD002046, 2002.
Lowenthal, D. H., Borys, R. D., Cotton, W., Saleeby, S., Cohn, S. A., and Brown, W. O. J.: The altitude of snow growth by riming and vapor deposition in mixed-phase orographic clouds, Atmos. Environ., 45, 519–522, https://doi.org/10.1016/j.atmosenv.2010.09.061, 2011.
Lowenthal, D. H., Hallar, A. G., McCubbin, I., David, R., Borys, R., Blossey, P., Muehlbauer, A., Kuang, Z., and Moore, M.: Isotopic fractionation in wintertime orographic clouds. I: isotopic measurements, J. Atmos. Ocean. Tech., 33, 2663–2678, https://doi.org/10.1175/JTECH-D-15-0233.1, 2016.
Mace, J., Matrosov, S., Shupe, M., Lawson, P., Hallar, G., McCubbin, I., Marchand, R., Orr, B., Coulter, R., Sedlacek, A., Avallone, L., and Long, C.: StormVEx: The Storm Peak Lab Cloud Property Validation Experiment science and operations plan, U.S. Department of Energy Tech Rep. DOE/SCARM-10-021, 45 pp., available at: https://www.arm.gov/publications/programdocs/doe-sc-arm-10-021.pdf (last access: 7 August 2018), 2010.
Matrosov, S. Y., Mace, G. G., Marchand, R., Shupe, M. D., Hallar, A. G., and McCubbin, I. B.: Observations of ice crystal habits with a scanning polarimetric W-band radar at slant linear depolarization ratio mode, J. Atmos. Ocean. Tech., 29, 989–1008, https://doi.org/10.1175/jtech-d-11-00131.1, 2012.
Mitchell, D. L.: Use of mass- and area-dimensional power laws for determining precipitation particle terminal velocities, J. Atmos. Sci., 53, 1710–1723, https://doi.org/10.1175/1520-0469(1996)053<1710:UOMAAD>2.0.CO;2, 1996.
Moore, M., Blossey, P. N., Muehlbauer, A., and Kuang, K.: Microphysical controls on the isotopic composition of wintertime orographic precipitation, J. Geophys. Res., 121, 7235–7253, https://doi.org/10.1002/2015JD023763, 2016.
Mossop, S. C.: Secondary ice particle production during rime growth: The effect of drop size distribution and rimer velocity, Q. J. Roy. Meteorol. Soc., 111, 1113–1124, https://doi.org/10.1002/qj.49711147012, 1985.
Murray, B. J., O'Sullivan, D., Atkinson, J. D., and Webb, M. E.: Ice nucleation by particles immersed in supercooled cloud droplets, Chem. Soc. Rev., 41, 6519–6554, https://doi.org/10.1039/c2cs35200a, 2012.
Nagare, B., Marcolli, C., Welti, A., Stetzer, O., and Lohmann, U.: Comparing contact and immersion freezing from continuous flow diffusion chambers, Atmos. Chem. Phys., 16, 8899–8914, https://doi.org/10.5194/acp-16-8899-2016, 2016.
Neiman, P. J., Ralph, F. M., White, A. B., Kingsmill, D. E., and Persson, P. O. G.: The statistical relationship between upslope flow and rainfall in California's coastal mountains: Observations during CALJET, Mon. Weather Rev., 130, 1468–1492, https://doi.org/10.1175/1520-0493(2002)130<1468:TSRBUF>2.0.CO;2, 2002.
Peng, Y., Lohmann, U., Leaitch, R., Banic, C., and Couture, M.: The cloud albedo-cloud droplet effective radius relationship for clean and polluted clouds from RACE and FIRE.ACE, J. Geophys. Res., 107, 4106, https://doi.org/10.1029/2000JD000281, 2002.
Pitter, R. L. and Pruppacher, H. R.: A wind tunnel investigation of freezing of small water drops falling at terminal velocity in air, Q. J. Roy. Meteorol. Soc., 99, 540–550, https://doi.org/10.1002/qj.49709942111, 1973.
Pruppacher, H. R. and Klett, J. D.: Microphysics of clouds and precipitation, 2nd edn., Kluwer Academic Publishers, Boston, 954 pp., https://doi.org/10.1007/978-0-306-48100-0, 1997.
Rangno, A. L. and Hobbs, P. V.: Ice particles in stratiform clouds in the Arctic and possible mechanisms for the production of high ice concentrations, J. Geophys. Res., 106, 15065–15075, https://doi.org/10.1029/2000JD900286, 2001.
Rauber, R. M. and Grant, L. O.: The characteristics and distribution of cloud water over the mountains of northern Colorado during wintertime storms. Part II: Microphysical characteristics, J. Clim. Appl. Meteorol., 25, 489–504, https://doi.org/10.1175/1520-0450(1986)025<0489:TCADOC>2.0.CO;2, 1986.
Rauber, R. M., Grant, L. O., Feng, D., and Snider, J. B.: The characteristics and distribution of cloud water over the mountains of northern Colorado during wintertime storms. Part I: temporal variations, J. Clim. Appl. Meteorol., 25, 468–488, https://doi.org/10.1175/1520-0450(1986)025<0468:TCADOC>2.0.CO;2 1986.
Rogers, D. and Vali, G.: Ice crystal production by mountain surfaces, J. Clim. Appl. Meteorol., 26, 1152–1168, https://doi.org/10.1175/1520-0450(1987)026<1152:ICPBMS>2.0.CO;2, 1987.
Rosenfeld, D. and Givati, A.: Evidence of orographic precipitation suppression by air pollution-induced aerosols in the western United States, J. Appl. Meteor. Climatol., 45, 893–911, https://doi.org/10.1175/JAM2380.1, 2006.
Saleeby, S. M., Cotton, W. R., Lowenthal, D., Borys, R. D., and Wetzel, M. A.: Influence of cloud condensation nuclei on orographic snowfall, J. Appl. Meteor. Climatol., 48, 903–922, https://doi.org/10.1175/2008JAMC1989.1, 2009.
Saleeby, S. M., Cotton, W. R., Lowenthal, D., and Messina, J.: Aerosol Impacts on the Microphysical Growth Processes of Orographic Snowfall, J. Appl. Meteor. Climatol., 52, 834–852, https://doi.org/10.1175/JAMC-D-12-0193.1, 2013.
Schmidt Jr., R. A.: Properties of blowing snow, Rev. Geophys. Space Phys., 20, 39–44, https://doi.org/10.1029/RG020i001p00039, 1982.
Schmitt, C. G. and Heymsfield, A. J.: The dimensional characteristics of ice crystal aggregates from fractal geometry, J. Atmos. Sci., 67, 1605–1616, https://doi.org/10.1175/2009JAS3187.1, 2010.
Stoelinga, M. T., Stewart, R. E., Thompson, G., and Thériault, J. M.: Microphysical processes within winter orographic cloud and precipitation systems, in: Mountain Weather Research and Forecasting, edited by: Chow, F., De Wekker, S., and Snyder, B., Springer Atmospheric Sciences, Springer, Dordrecht, https://doi.org/10.1007/978-94-007-4098-3_7, 2013.
Strapp, J. W., Albers, F., Reuter, A., Korolev, A. V., Maixner, U., Rashke, E., and Vukovic, Z.: Laboratory measurements of the response of a PMS OAP-2DC, J. Atmos. Ocean. Tech., 18, 1150–1170, https://doi.org/10.1175/1520-0426(2001)018<1150:LMOTRO>2.0.CO;2, 2001.
Sullivan, S. C., Hoose, C., Kiselev, A., Leisner, T., and Nenes, A.: Initiation of secondary ice production in clouds, Atmos. Chem. Phys., 18, 1593–1610, https://doi.org/10.5194/acp-18-1593-2018, 2018.
Twomey, S., Piepgrass, M., and Wolfe, T. L.: An assessment of the impact of pollution on global cloud albedo, Tellus, 36B, 356–366, https://doi.org/10.3402/tellusb.v36i5.14916, 1984.
Vali, G.: Ice nucleation – a review, in: Nucleation and Atmospheric Aerosols 1996, presented at the 14th International Conference on Nucleation and Atmospheric Aerosols, Helsinki, 26–30 August 1996.
Vali, G.: Ice nucleation – theory, a tutorial, presented at the NCAR/ASP 1999 Summer Colloquium, available at: http://www-das.uwyo.edu/~vali/nucl_th.pdf (last access: 7 August 2018), 1999.
Wetzel, M., Meyers, M., Borys, R., McAnelly, R., Cotton, W., Rossi, A., Frisbie, P., Nadler, D., Lowenthal, D., Cohn, S., and Brown, W.: Mesoscale snowfall prediction and verification in mountainous terrain, Wea. Forecast., 19, 806–828, https://doi.org/10.1175/1520-0434(2004)019<0806:MSPAVI>2.0.CO;2, 2004.
Zheng, X., Albrecht, B., Minnis, P., Ayers, K., and Jonson, H. H.: Observed aerosol and liquid water path relationships in marine stratocumulus, Geophys. Res. Lett., 37, L17803, https://doi.org/10.1029/2010GL044095, 2010.