the Creative Commons Attribution 4.0 License.
the Creative Commons Attribution 4.0 License.
Diurnal cycle of coastal anthropogenic pollutant transport over southern West Africa during the DACCIWA campaign
Adrien Deroubaix
Laurent Menut
Cyrille Flamant
Joel Brito
Cyrielle Denjean
Volker Dreiling
Andreas Fink
Corinne Jambert
Norbert Kalthoff
Peter Knippertz
Russ Ladkin
Sylvain Mailler
Marlon Maranan
Federica Pacifico
Bruno Piguet
Guillaume Siour
Solène Turquety
During the monsoon season, pollutants emitted by large coastal cities and biomass burning plumes originating from central Africa have complex transport pathways over southern West Africa (SWA). The Dynamics–Aerosol–Chemistry–Cloud Interactions in West Africa (DACCIWA) field campaign has provided numerous dynamical and chemical measurements in and around the super-site of Savè in Benin (≈185 km away from the coast), which allows quantification of the relative contribution of advected pollutants. Through the combination of in situ ground measurements with aircraft, radio-sounding, satellite, and high-resolution chemistry-transport modeling with the CHIMERE model, the source attribution and transport pathways of pollutants inland (here, NOx and CO) are carefully analyzed for the 1–7 July 2016 period. The relative contributions of different sources (i.e., emissions from several large coastal cities) to the air quality in Savè are characterized. It is shown that a systematic diurnal cycle exists with high surface concentrations of pollutants from 18:00 to 22:00 UTC. This evening peak is attributed to pollution transport from the coastal city of Cotonou (Benin). Numerical model experiments indicate that the anthropogenic pollutants are accumulated during the day close to the coast and transported northward as soon as the daytime convection in the atmospheric boundary layer ceases after 16:00 UTC, reaching 8∘ N at 21:00 UTC. When significant biomass burning pollutants are transported into continental SWA, they are mixed with anthropogenic pollutants along the coast during the day, and this mixture is then transported northward. At night, most of the coastal anthropogenic plumes are transported within the planetary boundary layer (below about 500 m above ground level), whereas the biomass burning pollutants are mostly transported above it, thus generally not impacting ground level air quality.
- Article
(18710 KB) - Full-text XML
- BibTeX
- EndNote
The United Nations Department of Economic and Social Affairs, Population Division reported 31 megacities globally (urban agglomerations with more than 10 million inhabitants in 2016) and that their number is projected to rise up to 41 by 2030. In southern West Africa (SWA), Lagos is considered a megacity (with more than 13 million inhabitants) and is expected to reach 24 million in 2030. The urban agglomeration extends along the coast to Cotonou (Benin) and even to Lomé (Togo). Moreover Accra in Ghana (with a population predicted to increase from 2.3 in 2016 to 3.3 million in 2030), Kumasi in Ghana (with a population predicted to increase from 2.7 in 2016 to 4.2 million in 2030) and Abidjan in Côte d'Ivoire (with a population predicted to increase from 5.0 in 2016 to 7.8 million in 2030) will all contribute to form a more or less continuously urbanized strip at some point during the twenty-first century. This growth is associated with enhanced pollutant emissions and low air quality, which leads to chronic health problems (Lelieveld et al., 2015) and contributes to anthropogenically forced climate change.
The vertical structure of air pollution is complex along the Guinea coast during the period when the West African monsoon (WAM) is established in the boreal summer. From the surface to the top of the planetary boundary layer (PBL), marine air transported by the northeastward monsoon flow gets enriched with anthropogenic pollution emitted at the coast before moving further inland (Knippertz et al., 2015b). Above the marine PBL, biomass burning (BB) aerosol layers, resulting from incomplete combustion of fires in central Africa (Giglio et al., 2006; Zuidema et al., 2016), can on occasion be observed reaching the Guinea coast after being transported over thousands of kilometers (Menut et al., 2018). In higher layers, at altitudes from 3 to 5 km, the Saharan air layer (SAL) is generally observed to be advected from the north depending on the meridional disturbances of the African easterly jet (AEJ), carrying desert dust (Crumeyrolle et al., 2011; Flamant et al., 2009; Lafore et al., 2011). This general picture is often perturbed by the presence of organized convective systems, which propagate along the Guinea coast from Nigeria to Liberia (Maranan et al., 2018). The latter authors also note the presence of land–sea breeze convective systems in the immediate coastal strip.
The EU-funded project Dynamics–Aerosol–Chemistry–Cloud Interactions in West Africa (DACCIWA) was designed to focus specifically on the Guinea coastal atmospheric dynamics and the interactions among aerosols, chemistry, and clouds (Knippertz et al., 2015a). An intensive measurement campaign took place in Nigeria, Benin, Togo, Ghana, and Côte d'Ivoire during June–July 2016, which corresponds to the climatological onset period of the WAM (Janicot et al., 2008). Three research aircraft flew over the Guinea coastal region with different scientific objectives, notably with flight plans designed to map out city, shipping, and flaring emissions, or they focused on sampling BB aerosol layers (Flamant et al., 2018b). The DACCIWA field campaign took place in so-called post-WAM post-onset conditions, i.e., after deep convection (and related precipitation) had migrated from the coast inland over the Sahel (Knippertz et al., 2017).
During the WAM, the atmospheric composition over the Gulf of Guinea coastal region is the result of a complex mix of natural and anthropogenic sources, which include urban, BB, biogenic, desert dust, and oceanic compounds. Using numerical tracer experiments, Menut et al. (2018) have highlighted that fire emissions in central Africa impacting the surface aerosol and gaseous species concentrations over the Gulf of Guinea are mostly transported over the southeast Atlantic above the marine PBL. Using WRF–CHIMERE numerical simulations of the WAM during the African Monsoon Multidisciplinary Analyses (AMMA) campaign period from May to July 2006, Deroubaix et al. (2018) quantified the relative contributions of anthropogenic and BB sources to carbon monoxide (CO) concentrations over SWA, which in July 2006 were about 25 % local anthropogenic and 50 % BB from central Africa. The remaining 25 % are the background corresponding to long-range transport from outside of Africa. In order to better distinguish the contributions from different sources to background concentrations, additional studies are needed focusing on Africa as has been carried out for other regions (Kulkarni et al., 2015; Sobhani et al., 2018; Yang et al., 2017). However the high BB contribution is partly due to the significant underestimation of anthropogenic emissions for the Gulf of Guinea region (Keita et al., 2018; Liousse et al., 2017; Marais and Wiedinmyer, 2016; Marais et al., 2014).
Table 1Characteristics of the studied cities with country, latitude, longitude, elevation above mean sea level (a.m.s.l.), and number of inhabitants of urban agglomerations. The population in bold is given for the year 2015 according to the World Urbanization Prospects report (United Nations report, 2011). National general population and habitat census is used to estimate the population of Cotonou and Savè (INSAE report, 2015).

AMMA was focused on the Sahelian region combining a multi-scale approach to better characterize the interactions among atmosphere, land, and ocean during the monsoon (Janicot et al., 2008; Redelsperger et al., 2006), whereas the DACCIWA project is dedicated to the interactions among aerosols, clouds, and radiation along the highly urbanized coastline of the Gulf of Guinea (Knippertz et al., 2015a). Over SWA, Adler et al. (2017) and Deetz et al. (2018) have documented a regular occurrence of a coastal front, which is located where the strongest horizontal gradients of wind speed and potential temperature occur. It develops during the daytime and propagates inland in the evening. After the frontal passage, the wind in the lowermost troposphere brings air masses, and probably also anthropogenic pollutants emitted from coastal urban areas (Djossou et al., 2018) and BB pollutants imported by monsoon flow (Reeves et al., 2010), from the coast northward, especially at night with the nocturnal low-level jet (NLLJ) (Schuster et al., 2013).
The main objective of this article is to understand the diurnal cycle of anthropogenic pollutant transport from the coast to the continental SWA. We present numerical tracer experiments made with high-resolution CHIMERE simulations set up in order to separate the contribution of each important urban agglomeration, namely Abidjan, Accra, Lomé, Cotonou, and Lagos. We take advantage of the DACCIWA measurements made by the three research aircraft, by an enhanced radio-sounding network, and at the super-site of Savè in central Benin (Knippertz et al., 2015a). The super-site of Savè is a representative location to assess the impact of pollution transport from the coast on the air quality of remote inland cities characterized by low local emissions. We focus on the period of 1–7 July 2016, during which a case of long-range transport of BB aerosol from central Africa was observed (Flamant et al., 2018b). We aim at answering the following questions:
-
What is the relative contribution of each coastal urban area to the air pollution at Savè? How does it evolve during the day?
-
How are BB and anthropogenic pollutants mixed along the coast and inland? Is it usually a mixture of the two pollution types that is transported inland in the PBL?
This study is focused on one specific period and location. However, the conclusions are representative of a longer time period as meteorological conditions at the coast during the so-called monsoon post-onset period were found to be quite stable for several weeks (Knippertz et al., 2017). Spatially, the results are directly representative of the studied region only, the main goal being to estimate the influence of the emissions from four coastal cities on the atmospheric composition in the lower troposphere over inland Benin. Given the broad southwesterly monsoon flow in the region, a similar transport from coastal pollution inland will likely be found along most of the Guinea coast. We shall answer these questions using a synergistic combination of observations and numerical modeling experiments, described in Sect. 2. Section 3 analyzes the temporal evolution of meteorology and air pollution over a portion of SWA including Côte d'Ivoire, Ghana, Togo, Benin, and Nigeria. Then, we focus on urban anthropogenic (URB) and long-range BB pollutant transport in Sect. 4. Conclusions are given in Sect. 5.
In the DACCIWA project, there are strong components on both in situ observations and modeling. Here, we present all studied sites (Sect. 2.1), observational datasets used (Sect. 2.2), and numerical simulations performed to analyze the pollution transport pathways (Sect. 2.3).
2.1 Studied sites
We focus on six locations, five major urban agglomerations of the Guinean coastal region, and one small town, Savè, which is 185 km north of Cotonou (Benin). Table 1 shows the coordinates and the population of the urban agglomerations studied. For Abidjan, Accra, Lomé, and Lagos, we present estimations for the year 2015 of the department of social and economic affairs of United Nations (United Nations report, 2011). In this report, these cities are associated with large administrative areas in contrast to Cotonou.
Comparing Lomé and Cotonou, Lomé has a large administrative area while Cotonou is a city with a very high population density over a small area. The population of Lomé is about 839 000 inhabitants in the city according to the general population and habitat census of Togo (DGSCN report, 2016) and about 1 830 000 inhabitants in the administrative state (United Nations report, 2011). Cotonou city is estimated by the World Urbanization Prospects report to have about 1 086 000 inhabitants (United Nations report, 2011).
According to the general population and habitat census of Benin (INSAE report, 2015), the population of Cotonou only slightly increased by 2.09 % over the period of 2002–2013 because of the limited possibility of expansion. They note that along the shores of Lake Nokoué the population has increased rapidly, thus forming an agglomeration of 2 194 000 inhabitants, calculated as the sum of the Cotonou district and several cities of the Atlantique district (Abomey-Calavi and Sô-Ava) and of the Ouémé district (Sèmè Kpodji, Porto Novo, Avrankou, and Akpro-Missérété).
2.2 Observational datasets
During the DACCIWA field campaign, several observational platforms were deployed to perform in situ and remote-sensing measurements (Flamant et al., 2018b; Knippertz et al., 2017). In this study, we use datasets acquired by ground-based stations, aircraft, radiosondes, and satellites. Table 2 gives the main information on each dataset. Figure 1 presents the location of the aircraft flight tracks and of the stations. Our studied domain is located in the Greenwich mean time (GMT). Hence local time is the same as UTC. During the aircraft campaign period, sunrise occurred around 06:00 UTC and sunset around 18:00 UTC.
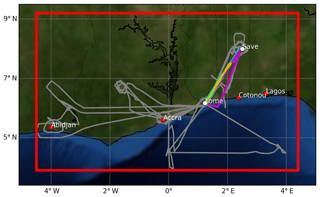
Figure 1Map of the modeling domain (red rectangles) with location of the major cities (red dots), of the Lomé airport, and of the Savè super-site (white dots). Superimposed are the flight tracks of the three research aircraft during the 1–7 July 2016 period (gray lines). The aircraft flight tracks on 5 July are colored for the German Falcon (blue line), the French ATR 42 (violet line), and the British Twin Otter (yellow line).
Three super-sites have been implemented in the framework of the DACCIWA project in Kumasi (Ghana), Ile-Ife (Nigeria), and Savè (Benin). Unlike the two others, Savè is representative of transport-related air quality issues affecting small cities, characterized by low local emissions, downstream of large coastal cities. It is ideal in that the terrain is very flat with no orographically induced circulation impacting the monsoonal flow. Thus to study NOx and CO from coastal urbanized areas, this rural environment is well suited.
At Savè, the Karlsruhe Institute of Technology (KIT) and the Paul Sabatier University (UPS) have set up meteorological and atmospheric composition measurements. UPS installed a chemical analyzer (ThermoEnvironment instrument), which measured NO2, NO, and CO surface concentrations (Kalthoff et al., 2018; Pacifico et al., 2018). Raw observations acquired at 10 s are averaged hourly. The detection limit of the instrument is 0.05 ppb for NO2 and NO and 12 ppb for CO (Derrien and Bezombes, 2016). The measurement site is upwind of Savè city when the wind corresponds to the monsoon flow (SW sector). On 3 July from 18:00 to 21:00 UTC, the wind direction was shifted, which corresponds to local pollution. This period has been removed from the analysis.
The DACCIWA aircraft campaign took place during the period of 25 June–14 July 2016 and was based at the Lomé (Togo) airport (Flamant et al., 2018b). Three research aircraft were involved: a Twin Otter operated by the British Antarctic Survey (BAS), an ATR 42 operated by the French Service des Avions Français Instrumentés pour la Recherche en Environment (SAFIRE), and a Falcon operated by the German Deutsches Zentrum für Luft- und Raumfahrt (DLR). We base our study on three variables, namely relative humidity (RH), wind direction, and wind speed, which are measured by core meteorological instrumentation. The flight trajectories used are depicted in Fig. 1. For the three aircraft, raw observations acquired at 1 Hz are averaged over 3 min time steps.
The DACCIWA project included a large radiosonde component with locations carefully chosen building on the AMMA radiosonde campaign experiences (Fink et al., 2011; Lothon et al., 2008; Parker et al., 2008; Schuster et al., 2013). We use radiosondes launched from four locations: Abidjan, Accra, Cotonou, and Savè (see Table 1). There were four releases per day at around 00:00, 06:00, 12:00, and 18:00 UTC. In Savè, more radiosondes were launched every 1.5 to 3 h at the super-site during the intensive observation period of 1–7 July 2016 (Kalthoff et al., 2018).
We analyze the horizontal spatial extent of the main aerosol plumes from satellite observations of aerosol optical depth (AOD) at 550 nm made by MODIS (Moderate Resolution Imaging Spectroradiometer) on both the Aqua platform (MYD08-D3-6 dataset DOI: https://doi.org/10.5067/MODIS/MYD08_D3.061, passing over the studied region at 13:30 UTC) and the Terra platform (MOD08-D3-6 dataset DOI: https://doi.org/10.5067/MODIS/MOD08_D3.061, passing over the studied region at 10:30 UTC). Daily MODIS AOD averages at 1∘ resolution have been calculated from the Collection 6 combined product of the Dark Target retrieval available over oceans or non-bright continental surface and the Deep Blue retrieval available over deserts (Hsu et al., 2013; Sayer et al., 2013, 2014).
In order to identify the altitude of aerosols together with their speciation, we use the spaceborne Cloud-Aerosol Lidar with Orthogonal Polarization (CALIOP) aerosol type classification (Winker et al., 2009). This classification is suited and accurate to distinguish homogenous aerosol plumes with different optical properties such as sea salt, dust, and BB (Menut et al., 2018). The CALIOP cross sections are very useful since this is a realistic way to have an instantaneous evaluation of the aerosol layer altitudes, with their type depending on backscattered optical measurements, (Winker et al., 2013). Data are available on https://www-calipso.larc.nasa.gov/ (last access: 10 January 2019).
2.3 Numerical modeling by WRF–CHIMERE models
The WRF–CHIMERE simulations presented in this study have a setup similar to those used by Deroubaix et al. (2018). Both models are run offline in a nested configuration on the same grids with two domains: a regional domain (10 km × 10 km, extending from 1∘ S to 14∘ N and from 11∘ W to 11∘ E) and a high-resolution coastal domain (2 km × 2 km). The simulations over the regional domain are started on 1 June 2016. In the following, we present only results modeled over the high-resolution domain (Fig. 1). The simulated period over the high-resolution domain (1 to 7 July) is entirely included in the 2016 WAM post-onset phase, which has been defined from 22 June to 20 July 2016 by Knippertz et al. (2017).
2.3.1 Meteorological fields from the WRF model
Meteorological variables are modeled with the regional non-hydrostatic WRF model (Skamarock and Klemp, 2008). The domains have a constant horizontal resolution with 32 vertical levels from the surface to 50 hPa, including about 10 vertical levels below 1 km a.m.s.l. We use a two-way nesting for the communication between different domains.
Global meteorological fields are taken from the US Global Forecast System (operational final analyses) produced by the National Center for Environmental Prediction (ds083.3 dataset DOI: https://doi.org/10.5065/D65Q4T4Z). These fields are used to provide meteorological initial and boundary conditions and to nudge hourly fields of pressure, temperature, humidity, and wind in the WRF simulations, with spectral nudging, which has been evaluated for regional models by von Storch et al. (2000). In order to enable the PBL variability to be resolved by WRF, low-frequency spectral nudging is used only above 850 hPa.
The WRF model setup is as follows: the microphysics scheme is the WRF Single-Moment 6-class Microphysics Scheme (WSM6), the radiation scheme is the Rapid Radiative Transfer Model for General Circulation Models (RRTMG) with the Monte Carlo independent column approximation (McICA) method of random cloud overlap from Mlawer et al. (1997), the PBL physics are computed using the Yonsei University scheme (Hong et al., 2006), the cumulus parametrization is the ensemble Grell–Dévényi scheme (for the high-resolution domain, convective precipitation is explicitly calculated and not parametrized), the surface layer scheme is the Carlson–Boland viscous sublayer, and the surface physics is calculated with the Noah land surface model scheme with four soil temperatures and moisture layers (Ek et al., 2003). This setup has already been used by Deroubaix et al. (2018) because it allows the reproduction of a satisfactory diurnal cycle of wind speed over SWA according to Schuster et al. (2013).
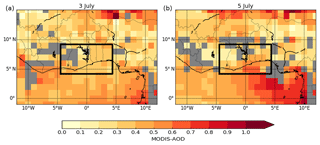
Figure 2MODIS AOD 1-day moving average of two products acquired by Aqua and Terra (the combined Dark Target and Deep Blue MYD08-D3 and MOD08-D3 products, respectively) on 3 July 2016 (a) and 5 July 2016 (b). Data excluded by the cloud screening process are in gray. The modeling domain is presented by the black square.
2.3.2 Gaseous tracers transport from the CHIMERE model
CHIMERE is a regional chemistry-transport model (version 2017), fully described in Menut et al. (2013) and Mailler et al. (2017). The 32 vertical levels of the WRF model are projected onto the 20 levels for CHIMERE from the surface and up to 200 hPa.
In this study, the model is used in its tracer version and there is no atmospheric chemistry. We choose to release passive gaseous tracers in the simulation because we want to analyze only their transport (no chemistry, no deposition) caused by the monsoonal flow. Since we want to distinguish the relative contribution of several coastal cities from the pollution further inland, we designed a first experiment for which we impose the tracer emissions at specific urbanized locations: Abidjan (Côte d'Ivoire), Accra (Ghana), Lomé (Togo), Cotonou (Benin), and Lagos (Nigeria) (see Table 1 for coordinates). Specific tracers are emitted for a given city in order to distinguish their relative contributions at inland locations. Thus the tracer emissions occur in a single grid cell corresponding to the center of each city.
The tracer emissions are constant and continuous during the modeled period (1–7 July). This allows the quantification of the variability due to the meteorology only. Emissions are released at the lowest level of the model (below 10 m in altitude) and are proportional to the population of each city; this approach has also been used by Flamant et al. (2018a). We defined an arbitrary emission for 1 million inhabitants. Then we multiply this emission by a factor depending on the population (see Table 1): 1.8 for Lomé, 2.2 for Cotonou, 3 for Accra, 5 for Abidjan, and 13 for Lagos.
A second objective is to understand the interactions between urban (URB) and BB pollutants resulting from long-rang transport on 5 July. For this, we design a second numerical tracer experiment in which BB tracers are added to the URB tracers and are tagged to be different from the URB tracers. BB tracers are released to reproduce the BB layer observed with MODIS on 5 July at 00:00 UTC to 6 July at 23:00 UTC with a spatial horizontal extent going from 1∘ W to 2∘ E at 4.5∘ N and at an altitude of ≈1.5 km (see Fig. 9 and Sects. 3.1 and 4.3 for justifications).
The two tracer experiments are summarized in Table 3. They are accessible on the DACCIWA database (https://doi.org/10.6096/BAOBAB-DACCIWA.1760, Deroubaix, 2018a).
Table 3Main characteristics of the two numerical tracer experiments using high-resolution modeling at 2 km grid spacing with tracer emissions relevant for biomass burning (BB) and urban pollutants (URB).

The tracers are transported using the van Leer scheme (van Leer, 1979). There is no sink for tracers (no deposition and no chemical reaction). The tracers are chosen to be gaseous and are representative of the gaseous part of the URB emissions and the BB plume. This choice of gaseous tracers was made to be consistent with the gaseous concentrations measured by the aircraft and the surface gaseous concentrations measured at the Savè super-site. The period is not associated with widespread rain. At Savè, there were only some small precipitation events (Kalthoff et al., 2018). We focus our analysis on gaseous species but we suppose similar transport patterns for aerosol and gaseous pollutants because of the constant monsoon flow blowing over SWA during our studied period. The only difference from aerosol is the absence of settling. But this long-term impact could be considered negligible in this study focused on a few days and a spatially restricted region: it is assumed that gaseous and aerosol species are transported in the same way by the meteorological flow.
This section is dedicated to analysis of the atmospheric dynamics, thermodynamics, and composition across SWA using AOD from satellites in Sect. 3.1, together with RH and wind from radiosondes in Sect. 3.2 and from aircraft in Sect. 3.3. The prerequisite to realistic numerical tracer experiments is the accuracy of the meteorological simulation. The WRF meteorological simulation is therefore extensively compared to in situ observations made by both radiosondes and aircrafts.
3.1 Regional-scale aerosol distribution
This section investigates the daily MODIS AOD observations for the period of 1 to 7 July 2016. Two important types of aerosols can be advected towards SWA: dust from the north and BB from the south. We focus on two different days, 3 and 5 July 2016 (Figs. 2 and A1). Note that we present 1-day moving averages (Figs. 2) because we analyze the long-range transport of aerosols (using the MODIS level 3 product with a coarse resolution of 1∘).
During the studied period, high AOD values are found north of the domain over the Sahel (north of 14∘ N) and south of the domain over the Gulf of Guinea (on average over the period of 1–7 July, Fig. A1). The origin of the high AOD over the Gulf of Guinea is well known. This is the BB layer coming from central Africa, where intense vegetation fires occur during this season (Giglio et al., 2006) with increasing trends over the period of 2001–2012 (Andela and Van Der Werf, 2014). Part of this pollution is transported over the Gulf of Guinea and the BB plume reaches the Guinea coast, as seen during the AMMA campaign (Reeves et al., 2010; Sauvage et al., 2005). The BB pollutant concentrations observed along the Guinea coast depend on the synoptic wind patterns (Menut et al., 2018). The presence of this layer is confirmed over the Gulf of Guinea using CALIPSO data acquired on 5 July (Fig. A2), which gives a layer altitude between 1 and 3 km above mean sea level (a.m.s.l.). It is worth noting that during this period, there is no evidence of mineral dust transport over the studied cities. The dates 3 and 5 July 2016 are two contrasting days in terms of AOD values over the Gulf of Guinea (Fig. 2). On 2 July, AOD values are low over the continent and moderate over the ocean (Fig. A1), which is in agreement with Flamant et al. (2018a), who have shown that the BB layer is present close to the Guinea coast but it does not reach the coast. On 3 July, AOD values are low to moderate over our domain (AOD < 0.5, Fig. 2). On 4 July, there is a pattern of high AOD (AOD > 0.5) 100 km south of the coast (Fig. A1). On 5 July, the BB layer reaches the coastline (Fig. 2), then on 6 July it seems to penetrate inland but clouds prevent AOD retrievals over Togo and Benin (Fig. A1). On 7 July, this layer is no longer visible close to the Guinea coast (Fig. A1).
For 6 July, Flamant et al. (2018b) have shown a clear large-scale BB signature between Abidjan and Accra with in situ measurements made onboard the research aircraft. Moreover Brito et al. (2018) have analyzed atmospheric chemistry and demonstrated mixing of urban pollutants with advected BB into the region. This interpretation has been supported by backward trajectories locating the origin of the BB plume in central Africa.
3.2 Vertical layers in the lowermost troposphere
In this section, we combine observations from the high-resolution radiosondes (Sect. 3.2.1) and the three aircraft (Sect. 3.2.2) over the period of 1–7 July. For radiosondes, we analyze 32 vertical profiles in Abidjan, 32 in Accra, 26 in Cotonou, and 51 in Savè (Fig. 3). For aircraft data, we analyzed 11 flights including six of the ATR 42, four of the Falcon, and one of the Twin Otter (Table 4). Aircraft observations are acquired only during the daytime. The modeled and observed dynamical and thermodynamical variables are compared in order to identify the different layers. The modeled variables have been interpolated along the balloon trajectories and aircraft flight tracks using a spatial bilinear interpolation and then temporal and vertical linear interpolations with a 3 min time step.
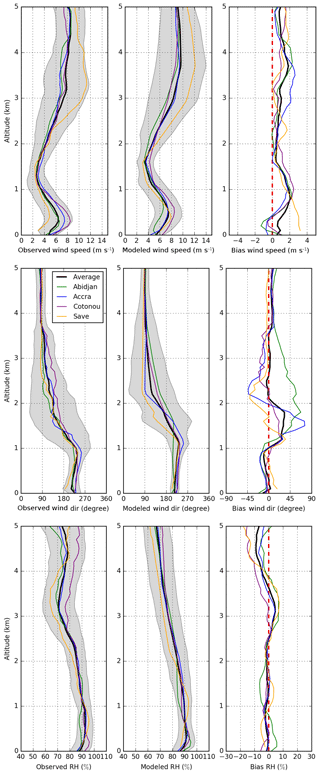
Figure 3Observed and modeled mean vertical profiles of wind speed (m s−1) and direction (360∘ circle with 0 and 360∘ is the north and 90∘ is the east) and relative humidity (RH in %) averaged for all profiles over the period of 1–7 July 2016 at Abidjan in Côte d'Ivoire (green line), Accra in Ghana (blue line), Cotonou in Benin (purple line), and Savè in Benin (orange line). The mean and standard deviation at the four locations are represented by the black line and the gray shading. WRF-derived variables are interpolated to the radiosonde positions. The right panel presents the (mod–obs) mean vertical bias of each location and of the average of the four locations.
3.2.1 Identification from radiosondes
For wind speed, the vertical profiles observed at the four locations have a similar shape (Fig. 3). The mean wind speed increases from the surface to 300 m a.m.s.l., then decreases to 3 m s−1 at 1.5 km a.m.s.l. and finally increases to a maximum of about 8 m s−1 between 3 and 5 km a.m.s.l. The model predicts a vertical wind profile in good agreement with observations from the surface to 300 m a.m.s.l. but there is an increasing positive bias from 300 m to 1 km a.m.s.l., reaching +2 m s−1 at 1 km a.m.s.l. At 300 m a.m.s.l., observed wind speed reaches 6 m s−1 on average, which shows the NLLJ signature (Schuster et al., 2013). The model reproduces this signature with wind speed reaching 7 m s−1 but over-estimates its altitude (at 400 m a.m.s.l.) at the three coastal sites (Abidjan, Accra, Cotonou).
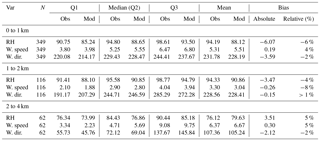
Table 4Observed and modeled distribution (first quartile, median, third quartile), mean and bias (absolute and relative) of relative humidity (%), and wind direction (∘) and speed (m s−1) measured by the three aircraft over the period of 1–7 July 2016 separated into three altitude ranges: surface to 1 km, 1 to 2 km, and 2 to 4 km a.m.s.l.
The vertical profile observed at Savè stands out from the three other cities with lower wind speed below 1 km and higher wind speed above 2 km a.m.s.l. The lower wind speed near the surface may be related to the greater distance from the coast, resulting in a stronger deceleration by friction, which is not reproduced by the model. When looking at 3 km a.m.s.l., this is close to the altitudinal maximum of the AEJ. Savè is located at a latitude closer to the AEJ core, which is seen at about 10∘ N (Knippertz et al., 2017). The jet is clearly observed only at Savè, with wind speeds of up to 10 m s−1 at 3 km a.m.s.l., which is modeled in good agreement.
For wind direction, the four cities have again similar profiles. The mean observed and modeled vertical profiles are composed of three distinct layers. From the surface to 1 km a.m.s.l., the monsoon layer corresponds to wind coming from the sector between 210 and 240∘. From 2 to 5 km a.m.s.l., wind direction is also almost constant between 80 and 120∘. In between these two layers, which are well defined in terms of direction, there is a layer characterized by a quick change of direction from 240 to 120∘. This layer associated with weak wind speed is a directional shear layer. On average, the monsoon layer depth seems to be overestimated by about 200 m because the modeled wind direction is biased by about +20∘ between 1.2 and 2 km a.m.s.l.
For the three variables, the profiles of their standard deviation present the same modeled and observed characteristics (gray shading in Fig. 3). For wind speed, the standard deviation is about 2 m s−1 from the surface to 2 km a.m.s.l., and it increases up to 4 m s−1 from 2 to 4 km a.m.s.l. For wind direction, the standard deviation is low (about 45∘) from the surface to 1 km a.m.s.l.; it increases from 1 to 2 km in the directional shear layer and it decreases from 2 to 4 km a.m.s.l. For RH, the standard deviation is about 10 % from the surface to 2 km a.m.s.l., and it increases in the AEJ layer but the model does not reproduce the low observed RH values in this layer.
This analysis shows that the modeled monsoon layer is too deep when it arrives at the coast. Further inland the monsoon flow is too fast when it reaches Savè. The comparison between observed and modeled meteorology also reveals that the model reproduces the several vertical layers in terms of wind direction and speed and thus most likely the transport that we want to characterize using the tracer experiments well enough.
3.2.2 Identification from research aircraft
The atmospheric vertical structure can be separated into three different layers (see Sect. 3.2.1): (i) from the surface to 1 km a.m.s.l., there is the monsoon flow with RH > 90 %, wind speed >4 m s−1 and direction from the southwesterly sector; (ii) between 1 and 2 km a.m.s.l., there is a directional shear layer associated with high RH > 90 % and with low wind speed and changing wind direction; (iii) between 2 and 4 km a.m.s.l., this is the AEJ layer with RH < 80 %, reversed wind direction coming from the northeast, and wind speed up to 8 m s−1. In order to evaluate the model, aircraft measurements during the daytime are separated into three corresponding altitude ranges (Table 4).
From the surface to 1 km a.m.s.l., the modeled wind speed and direction match well with the observations (absolute bias lower than 0.2 m s−1 and 4∘, respectively). The observed distribution of the monsoon wind is captured by the model up to 1 km a.m.s.l. (interquartile range 3.80–6.47 m s−1 for the observations and 3.98–6.80 m s−1 in the simulation). The modeled distribution of RH shows a dry bias in the monsoonal flow (of −6 %).
In the directional shear layer, from 1 to 2 km a.m.s.l., observed and modeled wind speed distributions are narrower than in the monsoon layer (interquartile ranges being 2.10–4.04 m s−1 and 1.88–3.94 m s−1, respectively), showing that this layer is well defined over the domain. The modeled wind direction is in good agreement with observations (relative bias lower than 1 %), although with a wider distribution (observed interquartile range 191.17–285.29∘ and modeled 214.17–237.67∘) than in the monsoon layer (observed interquartile range 220.08–244.41∘ and modeled 207.29–272.28∘).
In the main easterly layer, from 2 to 4 km a.m.s.l., the observed distribution of wind speed is wider at lower altitudes, which is in good agreement with the modeled distribution. Observed and modeled RH and wind direction distributions are also consistent.
In conclusion, during the daytime, the monsoon layer is reproduced with a dry bias. The low (relative) biases of wind speed (+4 %) and direction (−2 %) in this layer are of prime importance to accurately model the URB transport.
3.3 From the coast to the north: 5 July Lomé–Savè flights
As we want to understand northward pollution transport, we need to focus on the wind direction and speed from the coast to the north. In this section, we analyze the spatial variability in the wind over the Lomé–Savè transect. We compare aircraft measurements of wind to modeled values using data acquired during three specific flights conducted on 5 July at different times of day with similar flight plans (see Fig. 1) and similar altitude ranges (i.e., flying mostly below 2 km a.m.s.l.). The French ATR 42 flight took place between 08:00 and 11:00 UTC, that of the German Falcon between 11:20 and 15:00 UTC, and that of the British Twin Otter between 16:00 and 17:50 UTC.
Using ceilometer measurements, Flamant et al. (2018b) have described the cloud base height evolution on 5 July at Savè, which was between 200 and 1000 m during the ATR 42 fight, between 400 and 1800 m during the Falcon flight, and between 1000 and 3800 m during the Twin Otter flight. This was a cloudy day, which allowed the operational center to plan for characterizing the diurnal cycle of low level clouds (Flamant et al., 2018b).
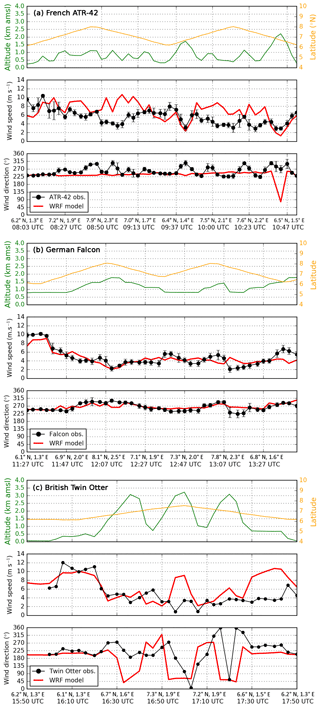
Figure 4Time series on 5 July 2016 of (a) the French ATR 42, (b) German Falcon, and (c) British Twin Otter aircraft data, composed of three panels for each aircraft: (top) altitude (m) with the latitude (∘N), (middle) wind speed (m s−1), and (bottom) wind direction (degrees). Modeled values with the WRF model are interpolated along the flight positions (red line). Observed value averages are the black dots with the hourly standard deviation (error bars).
During the ATR 42 flight in the morning, measurements of wind speed range from 2 to 10 m s−1 (Fig. 4). The highest values are observed close to the coast (greater than 8 m s−1) during the two times the aircraft passes there. The model reproduces the spread of the observed values below 2 km a.m.s.l. When the altitude reaches 2 km a.m.s.l., observed wind speed decreases below 4 m s−1. Wind direction ranges from 240 to 300∘, even at about 2 km a.m.s.l. The model predicts a constant direction at 250∘, except when flying above 2 km a.m.s.l. because the modeled direction changes, revealing an underestimation of the modeled PBL depth.
In the morning, the monsoon layer is modeled with an overestimation of the wind speed and with a sharp directional shear at 2 km a.m.s.l., whereas we observe an important variability in wind speed without reaching the directional shear layer up to 2 km a.m.s.l. This behavior of the model suggests that low-level clouds are not well represented, leading to modeled PBL depth underestimation.
During the Falcon flight around midday, wind speed also decreases from the beginning of the flight at the coast (up to 10 m s−1) to 100 km further north (less than 4 m s−1). Wind direction varies smoothly from 250∘ at the coast to 300∘ close to Savè. The model is able to reproduce the weakening of the monsoon layer linked to daytime dry convection (Adler et al., 2017; Deetz et al., 2018), and the variability in observed and modeled wind direction and speed is in better agreement.
In contrast to the ATR 42 and Falcon flights, the Twin Otter flew only one time over Savè and made three vertical profiles up to 3 km a.m.s.l. During the Twin Otter flight in the afternoon, the range of wind speed increases compared to the two previous flights, reaching between 1 and 12 m s−1. The model reproduces the wind in the monsoon layer well but does not capture the wind direction changes between 1 and 3 km a.m.s.l. There is no clear change of the direction during the first sounding, but during the latter two soundings, wind direction changes from southwesterly winds at 1 km a.m.s.l. (about 225∘) to northeasterly winds at 3 km a.m.s.l. (about 45∘). The model predicts a too sharp wind direction change from 1 to 3 km a.m.s.l., which shows that the directional shear layer depth is underestimated.
Overall below 1 km a.m.s.l., wind speed ranges from 4 to 10 m s−1 with a direction from about 250∘, which is in good agreement with the model. Knippertz et al. (2017) have shown that 5 July was during a period when the AEJ weakens and becomes more fragmented, which has led to relatively patchy signals in wind and vorticity. This results in observed wind direction mostly greater than the third quartile of the distribution measured over the period of 1–7 July 2016 (Q3 = 244∘ below 1 km a.m.s.l.; see Table 4).
The three aircraft cover the same region from 08:00 to 17:00 UTC. It is thus possible to quantify the evolution of dynamical variables during the daytime. We have selected a box crossed many times by the aircraft in order to compare hourly averages of in situ wind speed and direction observations to the modeled values. The box is delimited in latitude from 6.6 to 7.8∘ N, in longitude from 1.5 to 2.2∘ E, and in altitude from 300 to 1000 m a.m.s.l. (Fig. A3). When the three flights cross this box, the average and standard deviation are calculated from observed values. For the model, we present the average and standard deviation of each hour calculated from all grid cells included in the box. Wind speed observations decrease from 08:00 to 13:00 UTC (Fig. A3), then increase again in the afternoon (but there are only a few measurements made by the Twin Otter aircraft in the two boxes at 17:00 UTC). The model does not capture the morning evolution, when the NLLJ is eroded, well. We note that the minimum of wind speed is modeled and observed in the early afternoon, when vertical mixing is strongest. Observed wind directions are almost constant in the box at about 225∘. There is a change of the direction between 16:00 and 18:00 UTC for both the model and the observations, which shows the establishment of the NLLJ.
On the one hand, these comparisons with aircraft measurements reinforce our confidence in the model to adequately reproduce the wind speed and direction and thus the main characteristics of pollution transport between Lomé and Savè. On the other hand, this analysis confirms that the PBL depth is not accurately modeled, especially in the morning, which could in turn impact the pollution mixing and dilution. During the day, the surface concentration could be overestimated and the concentration at the PBL top height underestimated, especially going further away from the sources.
Firstly, this section investigates CO and NOx concentrations at the Savè super-site (Sect. 4.1). Secondly, we analyze the contribution of the major cities along the coastline to the pollution budget in Savè (Sect. 4.2). Thirdly, we study how URB plumes and the BB layer observed on 5 July interact at the coast and are transported inland.
4.1 Surface pollutant concentrations at Savè
We analyze the temporal evolution of CO, NO2, and NO concentrations. Trace gas concentrations were measured at the ground level at the Savè DACCIWA super-site. We study the hourly temporal variability in observed concentrations over the studied period (1 to 7 July).
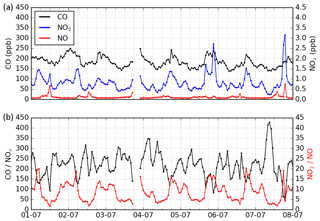
Figure 5Time series of (a) carbon monoxide (CO), nitrogen dioxide (NO2), and nitrogen monoxide (NO) hourly concentration averages (ppb) observed at Savè (Benin) for the period of 1–7 July 2016 and (b) of the ratios CO∕NOx (in black) and NO2∕NO (in red). The vertical dashed lines indicate periods of 6 h starting at 00:00 UTC.
During this period, the hourly CO concentration varies between 140 and 250 ppb (Fig. 5a). Moreover, looking at the entire campaign period (25 June to 15 July), hourly CO concentration ranges from 110 to 250 ppb (Fig. A4a). Comparing these two periods, we note that our studied period seems representative for the diurnal cycle over the campaign period. There is a clear diurnal cycle with the maximum occurring every day at the beginning of the night (between 220 and 250 ppb) and the minimum at the beginning of the day.
Hourly NO2 concentration ranges from 0.2 to 3.5 ppb. We note also that every day there are periods of high NO2 concentrations in the evening and low NO2 concentrations from the morning to the afternoon. It is worth noting that high CO values noticed in the evening are associated with high NO2 but not with high NO concentrations.
Given the short lifetime of NO (less than 1 h) in the PBL (Monks et al., 2009), the analysis of NO concentration gives some clues to understand NO2 variability because NO is mostly linked to local sources (i.e., not transported). The baseline of NO concentration is 0.09 ppb (median). High NO concentrations (>0.5 ppb) are measured on 1 and 7 July in the evening. Moreover, there is an increase every evening, which shows that there are local sources close to the instrument location, probably associated with charcoal stove cooking or traffic time.
In order to identify periods of high NO2 associated with low NO concentrations, we have computed the NO2∕NO ratio (Fig. 5b). This ratio is expected to increase at night by the ozone titration (O3+NO reaction). During the daytime, it depicts local or transported pollution (respectively a low or high NO2∕NO ratio). Every day we note a sharp increase from 18:00 to 00:00 UTC (NO2∕NO > 15) associated with low NO concentrations (NO < 0.2 ppb), which suggests transported pollutants.
In order to identify periods of high CO associated with low NOx concentrations, we have computed the CO∕NOx ratio (Fig. 5b). When a BB layer reaches the Guinea coast, gaseous nitrogen oxide concentrations are lower than 0.1 ppb (Capes et al., 2009; Reeves et al., 2010) because gaseous nitrogen oxides have been converted into the particulate phase during the transport over the southeast Atlantic. We therefore expect an increase in CO and constant NOx, when the BB layer reaches Savè without being mixed with URB (containing NOx in the gaseous phase). At Savè, the CO∕NOx ratio is not higher after the arrival of the BB layer on 5 July (see Sect. 3.1). There is an increase in CO together with a NOx increase; thus when the BB layer reaches Savè, it is mixed with urban pollution or transported above the PBL.
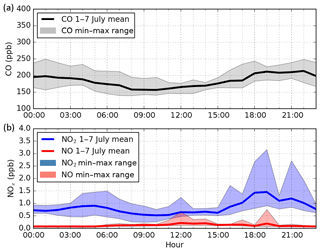
Figure 6Hourly diurnal cycles of (a) carbon monoxide (CO in black), (b) nitrogen dioxide (NO2 in blue), and nitrogen monoxide (NO in red) concentrations (ppb) observed at Savè (Benin). Means of each hour are presented by the lines over the period of 1–7 July 2016 and the upper and lower shading limits correspond to the hourly ranges (maximum and minimum of each hour over the period).
In order to determine the diurnal cycle of the three pollutants, we present observed hourly averages over 1–7 July together with the maximum and minimum of each hour measured (Fig. 6). There is a clear diurnal cycle of hourly CO concentration averages with the minimum occurring at 08:00 UTC (about 160 ppb) and with the maximum occurring between 18:00 and 22:00 UTC (greater than 200 ppb) over the period of 1–7 July (Fig. 6) and also over the entire campaign period (Fig. A5). This time is in agreement with Adler et al. (2017) and Deetz et al. (2018), who have found using the super-site instrumentation that the coastal front starts moving northward after 16:00 UTC, reaching Savè in the evening. It also corresponds to the highest hourly minimum (190 ppb) and maximum (250 ppb). It is worth noting that CO concentration remains greater than 180 ppb from 22:00 to 04:00 UTC.
For NO2, we also note a clear diurnal cycle with low hourly concentration averages between 08:00 and 15:00 UTC and with high hourly concentration averages (greater than 1 ppb) from 18:00 to 21:00 UTC over the studied period and also over the entire campaign period (Fig. A5). The two small NO increases (from 0.2 to 0.6 ppb) at 12:00 and 19:00 UTC are consistent with the usual time of local activities such as traffic and charcoal cooking. At 21:00 UTC, there is a high NO2 concentration, as well as a high CO concentration, which is not associated with a high NO concentration, suggesting pollution transport because it is the time of the coastal front passage (Adler et al., 2017; Deetz et al., 2018).
The NO2 diurnal cycle is similar to the one of CO with a minimum at 08:00 UTC (about 0.6 ppb) and a maximum between 18:00 and 21:00 UTC. The main difference of the NO2 and CO diurnal cycles occurs at night between 21:00 and 02:00 UTC because CO remains high (≈200 ppb), whereas NO2 decreases from 1.3 to 0.7 ppb. This result could be linked to a higher ratio of BB compared to URB.
In conclusion, at Savè, there are similar diurnal cycles of CO and NO2 with maxima between 18:00 and 21:00 UTC. Moreover NO concentration is very low at 21:00 UTC, indicating pollution transport from the coastal urban agglomerations and not local production. The BB layer could interact with the URB plumes in the PBL, thus increasing the CO concentration. We need to understand how the BB layer is mixed with URB at the coast and how it is transported further inland.
4.2 Contribution of major coastal cities to the pollution budget at Savè
This section aims at identifying which major cities have a significant contribution to inland pollution at Savè. For this, we analyze Tracer Experiment 1 described in the model section (see Table 3 in Sect. 2.3.2).
In order to present this experiment, the synoptic wind patterns and the pollution plumes of the coastal cities with the URB tracers are displayed in a single figure (Fig. 7). This figure represents an average of the modeled plumes over the period of 1–7 July in the monsoon layer (from surface to 1 km). Results are presented in an arbitrary unit with the same isocontour value (Iso1) of tracer concentration for each city (color shadings in Fig. 7).
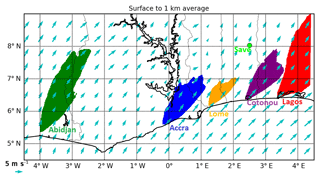
Figure 7Maps of URB tracer concentration (in arbitrary units) averaged over the period of 1 to 7 July 2016 in the monsoon layer (from the surface to 1 km a.m.s.l.). Tracers are released from Abidjan (Côte d'Ivoire) in green, from Accra (Ghana) in blue, from Lomé (Togo) in orange, from Cotonou (Benin) in violet, and from Lagos (Nigeria) in red. The same threshold of tracer concentration is used for all city plumes for the color shading (Iso1). Wind vectors at 10 m modeled by WRF are presented by the light blue arrows. The location of the DACCIWA super-site (Savè in Benin) is presented by the light green dot.
Over the Gulf of Guinea, we can see markedly higher wind speed than over the continent. This figure shows that the pollution plumes of Accra, Lomé, and Cotonou could reach Savè, while the direction of the Lagos and Abidjan plumes is not oriented towards Savè.
We now focus on the temporal variability reproduced by the tracer experiment at Savè (light green dot in Fig. 7). The tracer concentration of the five cities has been interpolated to Savè coordinates (Fig. 8a). The tracer emissions started on 1 July at 00:00 UTC. The first tracer plume that reaches Savè is that from Cotonou in the evening. We can see that tracers emitted from Cotonou reach Savè every day in the evening, typically at around 19:00 UTC. In the morning, the Lomé pollution plume reaches Savè, while the Accra pollution plume reaches Savè in the afternoon. There is a short period when hourly concentrations are at a maximum every day, and this peak is associated with the arrival of the Cotonou plume in the evening. This pattern is seen repeatedly over the entire 1–7 July period. The model clearly predicts identified periods when Savè is under the influence of different cities, which implies that these periods correspond to pollution plumes characterized by different chemical ages.
From 5 to 6 July, the contribution of Cotonou decreases and the Accra and Lomé contributions increase, which suggests a modification of wind patterns. From midnight to the end of the night, there is no city plume reaching Savè. However, we have seen in Sect. 4.1 that a high CO concentration persists during the night.
The average diurnal cycle of tracers is presented with the contribution of each city (Fig. 8b). It confirms that there are distinct periods when Savè is under the successive influences of Lomé in the morning (06:00 to 12:00 UTC), of Accra in the afternoon (12:00 to 18:00 UTC), and of Cotonou in the evening (18:00 to 01:00 UTC). Lagos tracers do not reach Savè because of the southwesterly monsoon flow.
The observed increases in surface concentration may be explained by a couple processes: long-range transport of the URB plume and/or a local collapse of the nocturnal boundary layer, quickly concentrating locally emitted pollutants. In our case, the dominant effect is the long-range transport, which is mainly associated with the transport of the Cotonou plume. Moreover, during the entire campaign, we did not note any increase in NO at night (Figs. A4 and A5). These results suggest that the Cotonou plume affects Savè during a short period with a maximum between 21:00 and 22:00 UTC (about 2 times greater than the peak magnitude due to Lomé). This is in agreement with observations of CO and NOx concentrations (see Sect. 4.1). We now need to investigate the diurnal cycle of pollutant transport from coastal cities.
4.3 Mixing and transport of urban anthropogenic and biomass burning
In this section, results of Tracer Experiment 2 (see Table 3) are discussed. We present the spatial patterns of URB and BB tracer concentrations averaged over the three layers described in Sect. 3.2 and then we analyze the vertical structure of these two types of pollution. We focus on 5 July when the BB layer reaches the Guinea coast (see Sect. 3.1). The first layer height is 300 m, which is roughly the minimum PBL top height at night.
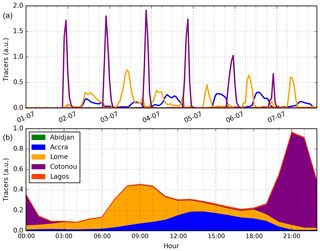
Figure 8Time series of hourly URB tracer concentrations (in arbitrary units) modeled by the CHIMERE model at the DACCIWA field campaign ground station in Savè (Benin) for the period of 1–7 July 2016. Urban tracers are released from five coastal cities: Abidjan (Côte d'Ivoire) in green, Accra (Ghana) in blue, Lomé (Togo) in orange, Cotonou (Benin) in violet, and Lagos (Nigeria) in red.
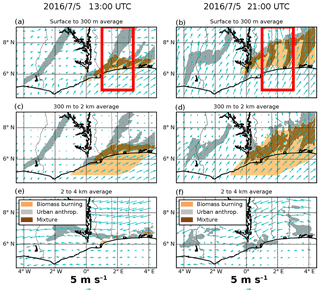
Figure 9Maps of concentrations of URB (in gray) and BB (in brown) numerical tracers on 5 July 2016 at 13:00 UTC (column a, c, e) and at 21:00 UTC (column b, d, f). Concentrations are averaged over three layers (a, b) from the surface to 300 m a.m.s.l., (c, d) from 0.3 to 2 km a.m.s.l., and (e, f) from 2 to 4 km a.m.s.l. Wind vectors at 10 m from the WRF model are presented by the light blue arrows. The meridional–vertical transect shown in Fig. 10 corresponds to the zonally averaged area of the red rectangle.
In order to analyze the interactions between URB emissions and the BB layer, we use the information on the spatial characteristics and vertical extent of the BB layer derived from MODIS and CALIPSO observations (Sect. 3.1) by releasing passive gaseous tracers with a spatial horizontal extent from 1∘ W to 2∘ E at 4.5∘ N and with an altitude of ≈1.5 km a.m.s.l. from 5 July at 00:00 UTC to 6 July at 23:00 UTC (see Table 3). Although a non-negligible part of BB is transported in the marine PBL, measurements performed during the DACCIWA campaign have confirmed that the BB layer altitude over the ocean is mostly between 1 and 3 km a.m.s.l. (Reeves et al., 2010). URB tracers are not separated by city in this experiment. The threshold of URB tracer concentration for the isocontour presented in the maps is Iso2 = Iso1 × 5 (Fig. 9).
On 5 July at 13:00 UTC when shallow dry convection is well developed and looking at the URB in the surface layer, the Accra and Abidjan plumes are transported towards the north, whereas the Lomé, Cotonou, and Lagos plumes have a strong eastward component (Fig. 9a). This matches the difference in wind direction along the coastline. From 1 to 2 km a.m.s.l., the URB tracer distribution is almost the same (with lower wind speed), which shows that the PBL reaches 1 km a.m.s.l. at 13:00 UTC. The BB layer emitted at 4.5∘ N is transported northward between 1 and 2 km a.m.s.l. over the Gulf of Guinea. BB tracers are not mixed with the marine PBL but with URB tracers from the coast to ≈7∘ N.
On 5 July at 21:00 UTC, when the dry convection has stopped, the model predicts consistent wind speed between the ocean and the continent with a stronger northward component than at 13:00 UTC, especially over the continent. The shape of URB plumes in the first two layers presents two distinct parts, which seems to follow the change of the wind patterns. The area where BB and URB tracers are mixed extends from the coast to ≈8∘ N.
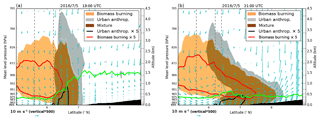
Figure 10Meridional–vertical transect of concentrations of URB (in gray) and BB (in brown) numerical tracers on 5 July 2016 at 13:00 UTC (a) and at 21:00 UTC (b). PBL top height from the WRF model is the green line. The vertical dashed gray lines show the latitude of Accra (5.6∘ N), Lomé (6.2∘ N), and Cotonou (6.4∘ N). The black area is the topography. Vectors (light blue arrows) represent wind in the plan of the transect (with an aspect ratio of 500 between the meridional and vertical lengths).
The vertical structure of the wind is now analyzed using cross sections along a meridional transect from 1 to 3∘ E (the red square in Fig. 9). We present the same hours of the simulation (13:00 and 21:00 UTC on 5 July), with isocontours Iso2 and other isocontours (Iso3) for both tracers in order to see the core of the plumes: Iso3 = Iso2 × 5.
The vertical structure changes markedly from 13:00 and 21:00 UTC (Fig. 10). At 13:00 UTC, shallow dry convection occurs between the coast and ≈7∘ N, which leads to a vertical mixing of BB and URB tracers (Fig. 10). The rising motion at the coast is linked to the coastal front that occurs during the day (Adler et al., 2017; Deetz et al., 2018). The sinking motion over the ocean is linked to the land–sea breeze circulation (Knippertz et al., 2017). BB tracers are transported over the marine PBL without mixing. They reach the surface between the coast and ≈7∘ N. URB and BB tracers accumulate along the coastline until the coastal front begins moving northward, which is in agreement with Adler et al. (2017) and Deetz et al. (2018).
At 21:00 UTC, the NLLJ is established at about 400 m a.m.s.l. from the coast up to 9∘ N where the front is located. At the coast itself, the front is not present; thus URB and BB tracers are not mixed anymore. The mixture of URB and BB occurring during the daytime is transported northward up to 8∘ N. The Iso3 isocontour of BB does not reach the surface. It shows that at night the BB layer penetrates further inland. BB and URB plumes are mostly transported above (between 0.5 and 2.5 km a.m.s.l.) and within the PBL, respectively.
The discussion in this section is supported by two video supplements (click on the links below):
-
three layer maps https://doi.org/10.5446/37228 (Deroubaix, 2018b)
-
vertical–meridional transects https://doi.org/10.5446/ 39159 (Deroubaix, 2018c).
The two videos further illustrate the analysis made at 13:00 and 21:00 UTC on 5 July. They also provide useful additional information to analyze the day-to-night transition leading to the evening maximum at Savè (Sect. 4.1). Our simulation reproduces the main features of the diurnal cycle, which are that vertical mixing occurs during the daytime, while meridional advection of pollutants is most efficient at night (Parker et al., 2005).
From the wind patterns, we note that the coastal front is present from 09:00 to 15:00 UTC from the coast up to ≈7∘ N. It leads to the accumulation of URB pollutants. This period is referred as “daytime drying” by Deetz et al. (2018). From 16:00 to 02:00 UTC (from 03:00 to 08:00 UTC), the meridional wind increases (decreases) in the PBL and URB pollutants are mostly transported northward within the PBL. This period is referred to “Atlantic inflow” (“moist morning”) by Deetz et al. (2018).
During the daytime drying period, we notice that URB and BB tracers accumulate along the coastline in the PBL (on 5 and 6 July from 11:00 to 15:00 UTC). When dry convection stops (at 16:00 UTC), wind speed quickly increases with a stronger northward component. BB and URB tracers are simultaneously transported northward from the coast. From 16:00 to 02:00 UTC, the front moves towards the north, and the mixture of BB and URB tracers is advected accordingly. A similar diurnal evolution of BB and URB transport is simulated on 5 and 6 July.
The timing of the coastal front propagation in our simulation is in agreement with Adler et al. (2017) and Deetz et al. (2018), who have shown the same regular occurrence of a coastal front that develops during the daytime and propagates inland in the evening. After the frontal passage, there is the establishment of the NLLJ (with a jet axis around 250 m a.m.s.l.), which is also reproduced in our simulation (with an overestimation of jet axis altitude of about 150 m).
In this study, several observational datasets together with high-resolution model simulation are used to analyze the diurnal cycle of atmospheric pollution transport over SWA. We focus on two distinct pollution sources, URB and BB pollutants, in order to understand their mixing and their advection inland. We first studied the dynamics and thermodynamics in the lowermost troposphere over SWA using aircraft, radio-sounding, and ground-based measurements made during part of the DACCIWA field campaign (from 1 to 7 July 2016). The second part of the study uses high-resolution numerical tracer experiments. We analyzed pollution transport from the main urban emission centers of the Guinea coast (Abidjan, Accra, Lomé, Cotonou, and Lagos) at the super-site of Savè in order to assess the impact on the air quality of remote inland cities characterized by low local emissions.
Observations at Savè (185 km to the north of Cotonou) show that there is a clear diurnal cycle of NO2 and CO, with a maximum occurring every day between 18:00 and 22:00 UTC, suggesting URB transport from remote emission sites. From the tracer experiments, we demonstrated that there are clear and successive periods of the day when air quality in Savè is affected by different city plumes. More precisely, the contribution of tracers released from Lomé is greater than 50 % (of the total amount of tracers) between 02:00 and 12:00 UTC, while from 12:00 to 18:00 UTC tracers released from Accra constitute the main contributor. Then, during 3 h (from 20:00 to 22:00 UTC), tracers released from Cotonou reach Savè, leading to a contribution of greater than 80 %, while it is lower than 10 % during the other 15 h (from 03:00 to 18:00 UTC). Over this period, tracers released from Cotonou represent a contribution of 40 %, from Lomé of 36 %, and from Accra of 23 %. Our results suggest that the successive periods affected by different city plumes are characterized by different chemical ages.
Previous studies have already highlighted the importance of the diurnal cycle of the wind along the coastline in the lowermost troposphere over the Gulf of Guinea during the monsoon (Adler et al., 2017; Deetz et al., 2018; Lothon et al., 2008; Parker et al., 2005; Schrage and Fink, 2012; Schuster et al., 2013) and suggested an influence on pollution transport. The WRF simulation reproduces a diurnal cycle of the wind over SWA in agreement with Adler et al. (2017) and Deetz et al. (2018). Indeed, the structure of the wind changes from the morning to the evening. When the shallow dry convection over the land is well developed, wind speed in the PBL reaches a minimum. A coastal front develops during the day (from 09:00 to 15:00 UTC) and when it ceases, wind speed quickly increases with a stronger northward component. There is a specific time of the day (16:00 to 02:00 UTC) for the transport of pollutants from the coast toward the north, which affects inland air quality over SWA, human health, and radiative transfer and the diurnal cycle of low-level clouds.
Our results based on modeling experiments suggest that URB and BB (transported from central Africa) are accumulated and mixed along the coastline during the day from 09:00 to 16:00 UTC, whereas at night, URB plumes are transported within the shallow PBL (below about 300 m a.m.s.l.) and the BB layer is mostly transported between the PBL top and 2 km a.m.s.l. The mixture of both URB and BB accumulated over coastal areas is transported northward in the surface layer from 16:00 UTC onward and reaches Savè at 21:00 UTC.
Over SWA, both wind and URB emissions have a diurnal cycle. The strength of numerical tracer experiments is to enable the dichotomy between the variability linked to the meteorology and the emissions by imposing a constant emission (i.e., we do not account for any diurnal cycle). In this article, only the observed variability linked to the meteorology is analyzed; we demonstrated that there are clear periods of the day when Savè is impacted by pollution plumes from different cities. In future research, integrated analyses should be conducted to characterize both the URB plumes and the BB layer in terms of composition, gaseous and particulate phase, oxidation of the organic components, and spatiotemporal variability. The DACCIWA campaign provides unique and valuable observations that will allow the investigation of the perspectives in this article based on tracer experiments.
For the CHIMERE model, it is possible to download the code using the address http://www.lmd.polytechnique.fr/chimere/ (last access: 11 January 2019, Mailler et al., 2017). All datasets are accessible: (i) the numerical tracer experiments in Deroubaix (2018a), (ii) the MODIS AOD in MODIS Atmosphere Science Team (2017a, b), (iii) the GFS meteorological fields in National Centers for Environmental Prediction/National Weather Service/NOAA/U.S. Department of Commerce (2015), and (iv) the measurements of the Savé super-site in Derrien and Bezombes (2016).
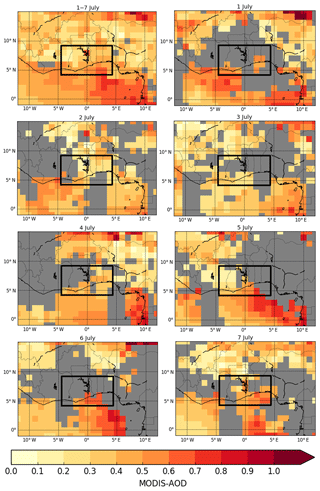
Figure A1MODIS AOD daily average of two products acquired by Aqua and Terra (the combined Dark Target and Deep Blue MYD08-D3 and MOD08-D3 products, respectively) over the 1–7 July 2016 period (top left) and over each day of the period. Data excluded by the cloud screening process are in gray. The modeling domain is presented by the black square.
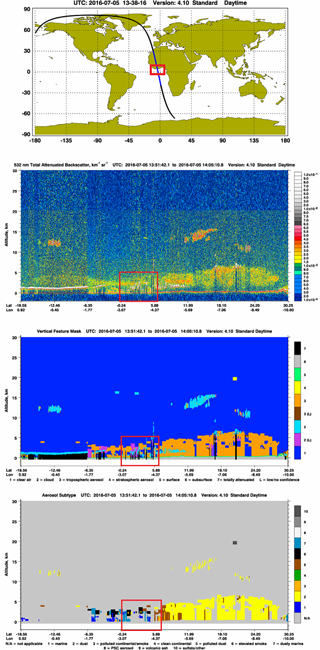
Figure A2Space lidar CALIPSO data on board the CALIOP platform on 5 July 2016 with the orbit track location, the vertical profile of the total attenuated backscatter, the vertical feature mask, and the aerosol subtype. The modeling domain is the red box (data are available at https://www-calipso.larc.nasa.gov/, last access: 10 January 2019).
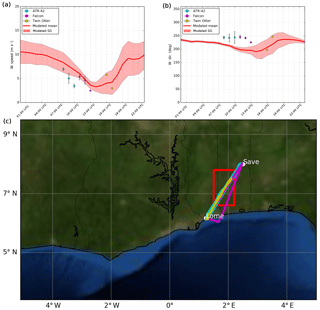
Figure A3Wind speed (a) and direction (b) hourly averages and standard deviations on 5 July 2016 for all aircraft measurements (dots and error bars) acquired in a box (latitude from 6.6 to 7.8∘ N, longitude from 1.5 to 2.2∘ E, at an altitude from 300 to 1000 m). The horizontal extent of the box and the aircraft tracks are displayed on the map (c). Modeled value averages of the whole box are presented by the red line (and standard deviation by red shading). Blue dots correspond to ATR 42 measurements, violet to Falcon, and yellow to Twin Otter.
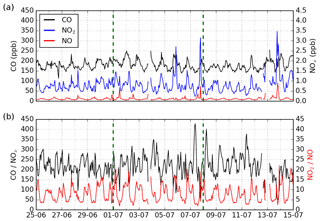
Figure A4Time series of (a) carbon monoxide (CO), nitrogen dioxide (NO2), and nitrogen monoxide (NO) hourly concentrations (ppb) observed at Savè (Benin) over the entire campaign period (25 June to 15 July 2016) and (b) of the ratios CO∕NOx (in black) and NO2∕NO (in red). The studied period (1–7 July 2016) is defined by the two green dashed vertical lines.
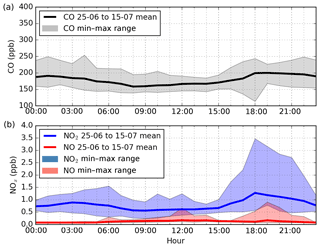
Figure A5Hourly diurnal cycles of (a) carbon monoxide (CO in black), (b) nitrogen dioxide (NO2 in blue), and nitrogen monoxide (NO in red) concentrations (ppb) observed at Savè (Benin). Means of each hour are presented by the lines over the entire campaign period (25 June to 15 July 2016). The upper and lower shading limits correspond to the hourly ranges (maximum and minimum of each hour over the period).
AD, CF, and LM designed the numerical experiments. AD conducted the CHIMERE simulation and carried out the data analysis. VD, BP, and RL provided the aircraft datasets. AF, MM, FP, CJ, and NK provided ground-based measurements. AD prepared the paper with contributions from all co-authors.
The authors declare that they have no conflict of interest.
This article is part of the special issue “Results of the project “Dynamics-aerosol-chemistry-cloud interactions in West Africa” (DACCIWA) (ACP/AMT inter-journal SI)”. It is not associated with a conference.
The research leading to these results has received funding from the European
Union 7th Framework Programme (FP7/2007–2013) under grant agreement no.
603502 (EU project DACCIWA: Dynamics-aerosol-chemistry-cloud interactions in
West Africa). The Service des Avions Français Instrumentés pour la
Recherche en Environnement (SAFIRE, a joint entity of CNRS, Météo-France,
and CNES and operator of the ATR 42), the British Antarctic Survey (BAS,
operator of the Twin Otter), and the Deutsches Zentrum für Luft- und
Raumfahrt (operator of the Falcon 20) are thanked for their support. We
acknowledge Claire Delon and Fabienne Lohou (Laboratoire d'Aérologie) for
helpful discussions.
Edited by: Mathew Evans
Reviewed by: two anonymous referees
Adler, B., Kalthoff, N., and Gantner, L.: Nocturnal low-level clouds over southern West Africa analysed using high-resolution simulations, Atmos. Chem. Phys., 17, 899–910, https://doi.org/10.5194/acp-17-899-2017, 2017. a, b, c, d, e, f, g, h, i
Andela, N. and Van Der Werf, G. R.: Recent trends in African fires driven by cropland expansion and El Niño to la Niña transition, Nat. Clim. Change, 4, 791–795, https://doi.org/10.1038/nclimate2313, 2014. a
Brito, J., Freney, E., Dominutti, P., Borbon, A., Haslett, S. L., Batenburg, A. M., Colomb, A., Dupuy, R., Denjean, C., Burnet, F., Bourriane, T., Deroubaix, A., Sellegri, K., Borrmann, S., Coe, H., Flamant, C., Knippertz, P., and Schwarzenboeck, A.: Assessing the role of anthropogenic and biogenic sources on PM1 over southern West Africa using aircraft measurements, Atmos. Chem. Phys., 18, 757–772, https://doi.org/10.5194/acp-18-757-2018, 2018. a
Capes, G., Murphy, J. G., Reeves, C. E., McQuaid, J. B., Hamilton, J. F., Hopkins, J. R., Crosier, J., Williams, P. I., and Coe, H.: Secondary organic aerosol from biogenic VOCs over West Africa during AMMA, Atmos. Chem. Phys., 9, 3841–3850, https://doi.org/10.5194/acp-9-3841-2009, 2009. a
Crumeyrolle, S., Tulet, P., Gomes, L., Garcia-Carreras, L., Flamant, C., Parker, D. J., Matsuki, A., Formenti, P., and Schwarzenboeck, A.: Transport of dust particles from the Bodélé region to the monsoon layer – AMMA case study of the 9–14 June 2006 period, Atmos. Chem. Phys., 11, 479–494, https://doi.org/10.5194/acp-11-479-2011, 2011. a
Deetz, K., Vogel, H., Haslett, S., Knippertz, P., Coe, H., and Vogel, B.: Aerosol liquid water content in the moist southern West African monsoon layer and its radiative impact, Atmos. Chem. Phys., 18, 14271–14295, https://doi.org/10.5194/acp-18-14271-2018, 2018. a, b, c, d, e, f, g, h, i, j, k
Deroubaix, A.: Simu_tracer_BB_Anthr_1-7July_CHIMERE, https://doi.org/10.6096/BAOBAB-DACCIWA.1760, 2018a. a, b
Deroubaix, A.: Maps of three vertical layer averages, Urban and biomass burning pollutants over West Africa using numerical tracers in the WRF-CHIMERE model, TIB, https://doi.org/10.5446/37228, 2018b. a, b
Deroubaix, A.: Meridional-vertical transect of urban and biomass burning pollutants mixing, Urban and biomass burning pollutants over West Africa using numerical tracers in the WRF-CHIMERE model, TIB, https://doi.org/10.5446/39159, 2018c. a, b
Deroubaix, A., Flamant, C., Menut, L., Siour, G., Mailler, S., Turquety, S., Briant, R., Khvorostyanov, D., and Crumeyrolle, S.: Interactions of atmospheric gases and aerosols with the monsoon dynamics over the Sudano-Guinean region during AMMA, Atmos. Chem. Phys., 18, 445–465, https://doi.org/10.5194/acp-18-445-2018, 2018. a, b, c
Derrien, S. and Bezombes, Y.: DACCIWA field campaign, Savè super-site, UPS instrumentation, SEDOO OMP, https://doi.org/10.6096/dacciwa.1618, 2016. a, b
DGSCN report: Quatrième Recensement Général de la Population et de l'Habitation du Togo – RGPH4, Direction Générale de la Statistique et de la Comptabilité Nationale, Ministère de la Planification, du Développement et de l'Aménagement du Territoire, available at: http://www.stat-togo.org/contenu/pdf/pb/pb-vol-2-rgph4-tg-2010.pdf (last access: 21 March 2018), 2016. a
Djossou, J., Léon, J.-F., Akpo, A. B., Liousse, C., Yoboué, V., Bedou, M., Bodjrenou, M., Chiron, C., Galy-Lacaux, C., Gardrat, E., Abbey, M., Keita, S., Bahino, J., Touré N'Datchoh, E., Ossohou, M., and Awanou, C. N.: Mass concentration, optical depth and carbon composition of particulate matter in the major southern West African cities of Cotonou (Benin) and Abidjan (Côte d'Ivoire), Atmos. Chem. Phys., 18, 6275–6291, https://doi.org/10.5194/acp-18-6275-2018, 2018. a
Ek, M. B., Mitchell, K. E., Lin, Y., Rogers, E., Grunmann, P., Koren, V., Gayno, G., and Tarpley, J. D.: Implementation of Noah land surface model advances in the National Centers for Environmental Prediction operational mesoscale Eta model, J. Geophys. Res.-Atmos., 108, 8851, https://doi.org/10.1029/2002JD003296, 2003. a
Fink, A. H., Agustí-Panareda, A., Parker, D. J., Lafore, J.-P., Ngamini, J.-B., Afiesimama, E., Beljaars, A., Bock, O., Christoph, M., Didé, F., Faccani, C., Fourrié, N., Karbou, F., Polcher, J., Mumba, Z., Nuret, M., Pohle, S., Rabier, F., Tompkins, A. M., and Wilson, G.: Operational meteorology in West Africa: observational networks, weather analysis and forecasting, Atmos. Sci. Lett., 12, 135–141, https://doi.org/10.1002/asl.324, 2011. a
Flamant, C., Lavaysse, C., Todd, M. C., Chaboureau, J. P., and Pelon, J.: Multl-platform observations of a springtime case of Bodele and Sudan dust emission, transport and scavenging over West Africa, Q. J. Roy. Meteor. Soc., 135, 413–430, https://doi.org/10.1002/qj.376, 2009. a
Flamant, C., Deroubaix, A., Chazette, P., Brito, J., Gaetani, M., Knippertz, P., Fink, A. H., de Coetlogon, G., Menut, L., Colomb, A., Denjean, C., Meynadier, R., Rosenberg, P., Dupuy, R., Dominutti, P., Duplissy, J., Bourrianne, T., Schwarzenboeck, A., Ramonet, M., and Totems, J.: Aerosol distribution in the northern Gulf of Guinea: local anthropogenic sources, long-range transport, and the role of coastal shallow circulations, Atmos. Chem. Phys., 18, 12363–12389, https://doi.org/10.5194/acp-18-12363-2018, 2018a. a, b
Flamant, C., Knippertz, P., Fink, A. H., Akpo, A., Brooks, B., Chiu, C. J., Coe, H., Danuor, S., Evans, M., Jegede, O., Kalthoff, N., Konaré, A., Liousse, C., Lohou, F., Mari, C., Schlager, H., Schwarzenboeck, A., Adler, B., Amekudzi, L., Aryee, J., Ayoola, M., Batenburg, A. M., Bessardon, G., Borrmann, S., Brito, J., Bower, K., Burnet, F., Catoire, V., Colomb, A., Denjean, C., Fosu-Amankwah, K., Hill, P. G., Lee, J., Lothon, M., Maranan, M., Marsham, J., Meynadier, R., Ngamini, J.-B., Rosenberg, P., Sauer, D., Smith, V., Stratmann, G., Taylor, J. W., Voigt, C., and Yoboué, V.: The Dynamics-Aerosol-Chemistry-Cloud Interactions in West Africa field campaign: Overview and research highlights, B. Am. Meteorol. Soc., 99, 83–104, https://doi.org/10.1175/BAMS-D-16-0256.1, 2018b. a, b, c, d, e, f, g
Giglio, L., Csiszar, I., and Justice, C. O.: Global distribution and seasonality of active fires as observed with the Terra and Aqua Moderate Resolution Imaging Spectroradiometer (MODIS) sensors, J. Geophys. Res.-Biogeo., 111, 1–12, https://doi.org/10.1029/2005JG000142, 2006. a, b
Hong, S.-Y., Noh, Y., and Dudhia, J.: A new vertical diffusion package with an explicit treatment of entrainment processes, Mon. Weather Rev., 134, 2318–2341, https://doi.org/10.1175/MWR3199.1, 2006. a
Hsu, N. C., Jeong, M.-J., Bettenhausen, C., Sayer, A. M., Hansell, R., Seftor, C. S., Huang, J., and Tsay, S.-C.: Enhanced Deep Blue aerosol retrieval algorithm: The second generation, J. Geophys. Res.-Atmos., 118, 9296–9315, https://doi.org/10.1002/jgrd.50712, 2013. a
INSAE report: Quatrième Recensement Général de la Population et de l'Habitation du Bénin – RGPH4, Institut National de la Statistique et de l'Analyse Economique, Direction des Etudes Démographique, Ministère du Développement, de l'Analyse Economique et de la Prospective, available at: http://www.insae-bj.org/statistiques/statistiques-demographiques/40-statistiques-demographiques (last access: 10 January 2019), 2015. a, b
Janicot, S., Thorncroft, C. D., Ali, A., Asencio, N., Berry, G., Bock, O., Bourles, B., Caniaux, G., Chauvin, F., Deme, A., Kergoat, L., Lafore, J.-P., Lavaysse, C., Lebel, T., Marticorena, B., Mounier, F., Nedelec, P., Redelsperger, J.-L., Ravegnani, F., Reeves, C. E., Roca, R., de Rosnay, P., Schlager, H., Sultan, B., Tomasini, M., Ulanovsky, A., and ACMAD forecasters team: Large-scale overview of the summer monsoon over West Africa during the AMMA field experiment in 2006, Ann. Geophys., 26, 2569–2595, https://doi.org/10.5194/angeo-26-2569-2008, 2008. a, b
Kalthoff, N., Lohou, F., Brooks, B., Jegede, G., Adler, B., Babic, K., Dione, C., Ajao, A., Amekudzi, L. K., Aryee, J. N. A., Ayoola, M., Bessardon, G., Danuor, S. K., Handwerker, J., Kohler, M., Lothon, M., Pedruzo-Bagazgoitia, X., Smith, V., Sunmonu, L., Wieser, A., Fink, A. H., and Knippertz, P.: An overview of the diurnal cycle of the atmospheric boundary layer during the West African monsoon season: results from the 2016 observational campaign, Atmos. Chem. Phys., 18, 2913–2928, https://doi.org/10.5194/acp-18-2913-2018, 2018. a, b, c
Keita, S., Liousse, C., Yoboué, V., Dominutti, P., Guinot, B., Assamoi, E.-M., Borbon, A., Haslett, S. L., Bouvier, L., Colomb, A., Coe, H., Akpo, A., Adon, J., Bahino, J., Doumbia, M., Djossou, J., Galy-Lacaux, C., Gardrat, E., Gnamien, S., Léon, J. F., Ossohou, M., N'Datchoh, E. T., and Roblou, L.: Particle and VOC emission factor measurements for anthropogenic sources in West Africa, Atmos. Chem. Phys., 18, 7691–7708, https://doi.org/10.5194/acp-18-7691-2018, 2018. a
Knippertz, P., Coe, H., Chiu, J. C., Evans, M. J., Fink, A. H., Kalthoff, N., Liousse, C., Mari, C., Allan, R. P., Brooks, B., Danour, S., Flamant, C., Jegede, O. O., Lohou, F., and Marsham, J. H.: The DACCIWA project: Dynamics-aerosol-chemistry-cloud interactions in West Africa, B. Am. Meteorol. Soc., 96, 1451–1460, https://doi.org/10.1175/BAMS-D-14-00108.1, 2015a. a, b, c
Knippertz, P., Evans, M. J., Field, P. R., Fink, A. H., Liousse, C., and Marsham, J. H.: The possible role of local air pollution in climate change in West Africa, Nat. Clim. Change, 5, 815–822, https://doi.org/10.1038/nclimate2727, 2015b. a
Harrison, R. M., Dall'Osto, M., Beddows, D. C. S., Thorpe, A. J., Bloss, W. J., Allan, J. D., Coe, H., Dorsey, J. R., Gallagher, M., Martin, C., Whitehead, J., Williams, P. I., Jones, R. L., Langridge, J. M., Benton, A. K., Ball, S. M., Langford, B., Hewitt, C. N., Davison, B., Martin, D., Petersson, K. F., Henshaw, S. J., White, I. R., Shallcross, D. E., Barlow, J. F., Dunbar, T., Davies, F., Nemitz, E., Phillips, G. J., Helfter, C., Di Marco, C. F., and Smith, S.: Atmospheric chemistry and physics in the atmosphere of a developed megacity (London): an overview of the REPARTEE experiment and its conclusions, Atmos. Chem. Phys., 12, 3065–3114, https://doi.org/10.5194/acp-12-3065-2012, 2012. a, b, c, d, e, f, g
Kulkarni, S., Sobhani, N., Miller-Schulze, J. P., Shafer, M. M., Schauer, J. J., Solomon, P. A., Saide, P. E., Spak, S. N., Cheng, Y. F., Denier van der Gon, H. A. C., Lu, Z., Streets, D. G., Janssens-Maenhout, G., Wiedinmyer, C., Lantz, J., Artamonova, M., Chen, B., Imashev, S., Sverdlik, L., Deminter, J. T., Adhikary, B., D'Allura, A., Wei, C., and Carmichael, G. R.: Source sector and region contributions to BC and PM2.5 in Central Asia, Atmos. Chem. Phys., 15, 1683–1705, https://doi.org/10.5194/acp-15-1683-2015, 2015. a
Lafore, J.-P., Flamant, C., Guichard, F., Parker, D. J., Bouniol, D., Fink, A. H., Giraud, V., Gosset, M., Hall, N., Höller, H., Jones, S. C., Protat, a., Roca, R., Roux, F., Saïd, F., and Thorncroft, C.: Progress in understanding of weather systems in West Africa, Atmos. Sci. Lett., 12, 7–12, https://doi.org/10.1002/asl.335, 2011. a
Lelieveld, J., Evans, J. S., Fnais, M., Giannadaki, D., and Pozzer, A.: The contribution of outdoor air pollution sources to premature mortality on a global scale, Nature, 525, 367–371, https://doi.org/10.1038/nature15371, 2015. a
Liousse, C., Keita, S., N'Datchoch Touré, E., Doumbia, T., Yoboué, V., Assamoi, E., Haslett, S., Roblou, L., Léon, J.-F., Galy-Lacaux, C., Akpo, A., and Coe, H.: African Anthropogenic Emissions Inventories for gases and particles from 1990 to 2016, Geophys. Res. Abstr., EGU2017-19601, EGU General Assembly 2017, Vienna, Austria, 2017. a
Lothon, M., Saïd, F., Lohou, F., and Campistron, B.: Observation of the Diurnal Cycle in the Low Troposphere of West Africa, Mon. Weather Rev., 136, 3477–3500, https://doi.org/10.1175/2008MWR2427.1, 2008. a, b
Mailler, S., Menut, L., Khvorostyanov, D., Valari, M., Couvidat, F., Siour, G., Turquety, S., Briant, R., Tuccella, P., Bessagnet, B., Colette, A., Létinois, L., Markakis, K., and Meleux, F.: CHIMERE-2017: from urban to hemispheric chemistry-transport modeling, Geosci. Model Dev., 10, 2397–2423, https://doi.org/10.5194/gmd-10-2397-2017, 2017 (data available at: http://www.lmd.polytechnique.fr/chimere/, last access: 11 January 2019). a, b
Marais, E., Jacob, D., Wecht, K., Lerot, C., Zhang, L., Yu, K., Kurosu, T., Chance, K., and Sauvage, B.: Anthropogenic emissions in Nigeria and implications for atmospheric ozone pollution: A view from space, Atmos. Environ., 99, 32–40, https://doi.org/10.1016/j.atmosenv.2014.09.055, 2014. a
Marais, E. A. and Wiedinmyer, C.: Air Quality Impact of Diffuse and Inefficient Combustion Emissions in Africa (DICE-Africa), Environ. Sci. Technol., 50, 10739–10745, https://doi.org/10.1021/acs.est.6b02602, 2016. a
Maranan, M., Fink, A. H., and Knippertz, P.: Rainfall types over southern West Africa: Objective identification, climatology and synoptic environment, Q. J. Roy. Meteor. Soc., 144, 1628–1648, https://doi.org/10.1002/qj.3345, 2018. a
Menut, L., Bessagnet, B., Khvorostyanov, D., Beekmann, M., Blond, N., Colette, A., Coll, I., Curci, G., Foret, G., Hodzic, A., Mailler, S., Meleux, F., Monge, J.-L., Pison, I., Siour, G., Turquety, S., Valari, M., Vautard, R., and Vivanco, M. G.: CHIMERE 2013: a model for regional atmospheric composition modelling, Geosci. Model Dev., 6, 981–1028, https://doi.org/10.5194/gmd-6-981-2013, 2013. a
Menut, L., Flamant, C., Turquety, S., Deroubaix, A., Chazette, P., and Meynadier, R.: Impact of biomass burning on pollutant surface concentrations in megacities of the Gulf of Guinea, Atmos. Chem. Phys., 18, 2687–2707, https://doi.org/10.5194/acp-18-2687-2018, 2018. a, b, c, d
Mlawer, E. J., Taubman, S. J., Brown, P. D., Iacono, M. J., and Clough, S. A.: Radiative transfer for inhomogeneous atmospheres: RRTM, a validated correlated-k model for the longwave, J. Geophys. Res., 102, 16663, https://doi.org/10.1029/97JD00237, 1997. a
MODIS Atmosphere Science Team: MYD08-D3-6 dataset, AOD (Aerosol Optical Depth) at 550 nm measured by MODIS (MODerate-resolution Imaging Spectroradiometer) on the Aqua platform, https://doi.org/10.5067/MODIS/MYD08_D3.061, 2017a a
MODIS Atmosphere Science Team: MOD08-D3-6 dataset, AOD (Aerosol Optical Depth) at 550 nm measured by MODIS (MODerate-resolution Imaging Spectroradiometer) on the Terra platform, https://doi.org/10.5067/MODIS/MOD08_D3.061, 2017b. a
Monks, P. S., Granier, C., Fuzzi, S., Stohl, A., Williams, M. L., Akimoto, H., Amann, M., Baklanov, A., Baltensperger, U., Bey, I., Blake, N., Blake, R. S., Carslaw, K., Cooper, O. R., Dentener, F., Fowler, D., Fragkou, E., Frost, G. J., Generoso, S., Ginoux, P., Grewe, V., Guenther, A., Hansson, H. C., Henne, S., Hjorth, J., Hofzumahaus, A., Huntrieser, H., Isaksen, I. S. A., Jenkin, M. E., Kaiser, J., Kanakidou, M., Klimont, Z., Kulmala, M., Laj, P., Lawrence, M. G., Lee, J. D., Liousse, C., Maione, M., McFiggans, G., Metzger, A., Mieville, A., Moussiopoulos, N., Orlando, J. J., O'Dowd, C. D., Palmer, P. I., Parrish, D. D., Petzold, A., Platt, U., Pöschl, U., Prévôt, A. S. H., Reeves, C. E., Reimann, S., Rudich, Y., Sellegri, K., Steinbrecher, R., Simpson, D., ten Brink, H., Theloke, J., van der Werf, G. R., Vautard, R., Vestreng, V., Vlachokostas, C., and von Glasow, R.: Atmospheric composition change – global and regional air quality, Atmos. Environ., 43, 5268–5350, https://doi.org/10.1016/j.atmosenv.2009.08.021, 2009. a
National Centers for Environmental Prediction/National Weather Service/NOAA/U.S. Department of Commerce: NCEP GDAS/FNL 0.25 Degree Global Tropospheric Analyses and Forecast Grids, Research Data Archive at the National Center for Atmospheric Research, Computational and Information Systems Laboratory, Boulder, CO, https://doi.org/10.5065/D65Q4T4Z, 2015. a
Pacifico, F., Delon, C., Jambert, C., Durand, P., Morris, E., Evans, M. J., Lohou, F., Derrien, S., Donnou, V. H. E., Houeto, A. V., Reinares Martinez, I., and Brilouet, P.-E.: Measurements of nitric oxide and ammonia soil fluxes from a wet savanna ecosystem site in West Africa during the DACCIWA field campaign, Atmos. Chem. Phys. Discuss., https://doi.org/10.5194/acp-2017-1198, in review, 2018. a
Parker, D. J., Burton, R. R., Diongue-Niang, A., Ellis, R. J., Felton, M., Taylor, C. M., Thorncroft, C. D., Bessemoulin, P., and Tompkins, A. M.: The diurnal cycle of the West African monsoon circulation, Q. J. Roy. Meteor. Soc., 131, 2839–2860, https://doi.org/10.1256/qj.04.52, 2005. a, b
Parker, D. J., Fink, A., Janicot, S., Ngamini, J.-B., Douglas, M., Afiesimama, E., Agusti-Panareda, A., Beljaars, A., Dide, F., Diedhiou, A., Lebel, T., Polcher, J., Redelsperger, J.-L., Thorncroft, C., and Wilson, G. A.: The Amma Radiosonde Program and its Implications for the Future of Atmospheric Monitoring Over Africa, B. Am. Meteorol. Soc., 89, 1015–1028, https://doi.org/10.1175/2008BAMS2436.1, 2008. a
Redelsperger, J. L., Thorncroft, C. D., Diedhiou, A., Lebel, T., Parker, D. J., and Polcher, J.: The African Monsoon Multidisciplinary Analysis: An International Research Project and Field Campaign, B. Am. Meteorol. Soc., 87, 1739–1746, 2006. a
Reeves, C. E., Formenti, P., Afif, C., Ancellet, G., Attié, J.-L., Bechara, J., Borbon, A., Cairo, F., Coe, H., Crumeyrolle, S., Fierli, F., Flamant, C., Gomes, L., Hamburger, T., Jambert, C., Law, K. S., Mari, C., Jones, R. L., Matsuki, A., Mead, M. I., Methven, J., Mills, G. P., Minikin, A., Murphy, J. G., Nielsen, J. K., Oram, D. E., Parker, D. J., Richter, A., Schlager, H., Schwarzenboeck, A., and Thouret, V.: Chemical and aerosol characterisation of the troposphere over West Africa during the monsoon period as part of AMMA, Atmos. Chem. Phys., 10, 7575–7601, https://doi.org/10.5194/acp-10-7575-2010, 2010. a, b, c, d
Sauvage, B., Thouret, V., Cammas, J.-P., Gheusi, F., Athier, G., and Nédélec, P.: Tropospheric ozone over Equatorial Africa: regional aspects from the MOZAIC data, Atmos. Chem. Phys., 5, 311–335, https://doi.org/10.5194/acp-5-311-2005, 2005. a
Sayer, A. M., Hsu, N. C., Bettenhausen, C., and Jeong, M. J.: Validation and uncertainty estimates for MODIS Collection 6 “deep Blue” aerosol data, J. Geophys. Res.-Atmos., 118, 7864–7872, https://doi.org/10.1002/jgrd.50600, 2013. a
Sayer, A. M., Munchak, L. A., Hsu, N. C., Levy, R. C., Bettenhausen, C., and Jeong, M. J.: MODIS Collection 6 aerosol products: Comparison between Aqua's e-Deep Blue, Dark Target, and “merged” data sets, and usage recommendations, J. Geophys. Res.-Atmos., 119, 13965–13989, https://doi.org/10.1002/2014JD022453, 2014. a
Schrage, J. M. and Fink, A. H.: Nocturnal Continental Low-Level Stratus over Tropical West Africa: Observations and Possible Mechanisms Controlling Its Onset, Mon. Weather Rev., 140, 1794–1809, https://doi.org/10.1175/MWR-D-11-00172.1, 2012. a
Schuster, R., Fink, A. H., and Knippertz, P.: Formation and Maintenance of Nocturnal Low-Level Stratus over the Southern West African Monsoon Region during AMMA 2006, J. Atmos. Sci., 70, 2337–2355, https://doi.org/10.1175/JAS-D-12-0241.1, 2013. a, b, c, d, e
Skamarock, W. C. and Klemp, J. B.: A time-split nonhydrostatic atmospheric model for weather research and forecasting applications, J. Comput. Phys., 227, 3465–3485, https://doi.org/10.1016/j.jcp.2007.01.037, 2008. a
Sobhani, N., Kulkarni, S., and Carmichael, G. R.: Source sector and region contributions to black carbon and PM2.5 in the Arctic, Atmos. Chem. Phys., 18, 18123–18148, https://doi.org/10.5194/acp-18-18123-2018, 2018. a
United Nations report: World urbanization prospects: the 2011 revision, Population Division, Department of Economic and Social Affairs, United Nations Secretariat, available at: http://www.un.org/en/development/desa/population/publications/pdf/urbanization/WUP2011_Report.pdf (last access: 11 June 2018), 2011. a, b, c, d
van Leer, B.: Towards the ultimate conservative difference scheme. V. A second-order sequel to Godunov's method, J. Comput. Phys., 32, 101–136, https://doi.org/10.1016/0021-9991(79)90145-1, 1979. a
von Storch, H., Langenberg, H., and Feser, F.: A Spectral Nudging Technique for Dynamical Downscaling Purposes, Mon. Weather Rev., 128, 3664–3673, https://doi.org/10.1175/1520-0493(2000)128<3664:ASNTFD>2.0.CO;2, 2000. a
Winker, D. M., Vaughan, M. A., Omar, A., Hu, Y., Powell, K. A., Liu, Z., Hunt, W. H., and Young, S. A.: Overview of the CALIPSO Mission and CALIOP Data Processing Algorithms, J. Atmos. Ocean. Tech., 26, 2310–2323, https://doi.org/10.1175/2009JTECHA1281.1, 2009. a
Winker, D. M., Tackett, J. L., Getzewich, B. J., Liu, Z., Vaughan, M. A., and Rogers, R. R.: The global 3-D distribution of tropospheric aerosols as characterized by CALIOP, Atmos. Chem. Phys., 13, 3345–3361, https://doi.org/10.5194/acp-13-3345-2013, 2013. a
Yang, Y., Wang, H., Smith, S. J., Ma, P.-L., and Rasch, P. J.: Source attribution of black carbon and its direct radiative forcing in China, Atmos. Chem. Phys., 17, 4319–4336, https://doi.org/10.5194/acp-17-4319-2017, 2017. a
Zuidema, P., Redemann, J., Haywood, J., Wood, R., Piketh, S., Hipondoka, M., and Formenti, P.: Smoke and Clouds above the Southeast Atlantic: Upcoming Field Campaigns Probe Absorbing Aerosol's Impact on Climate, B. Am. Meteorol. Soc., 97, 1131–1135, https://doi.org/10.1175/BAMS-D-15-00082.1, 2016. a
- Abstract
- Introduction
- DACCIWA project: observations and modeling
- Large-scale atmospheric patterns over the Gulf of Guinea
- Inland pollution transport from the coast
- Conclusions
- Code and data availability
- Video supplement
- Appendix A
- Author contributions
- Competing interests
- Special issue statement
- Acknowledgements
- References


