the Creative Commons Attribution 4.0 License.
the Creative Commons Attribution 4.0 License.
 | 14 Jan 2019
Estimation of atmospheric total organic carbon (TOC) – paving the path towards carbon budget closure
Zoë L. Fleming
The atmosphere contains a rich variety of reactive organic compounds, including gaseous volatile organic carbon (VOCs), carbonaceous aerosols, and other organic compounds at varying volatility. Here we present a novel and simple approach to measure atmospheric non-methane total organic carbon (TOC) based on catalytic oxidation of organics in bulk air to carbon dioxide. This method shows little sensitivity towards humidity and near 100 % oxidation efficiencies for all VOCs tested. We estimate a best-case hourly precision of 8 ppb C during times of low ambient variability in carbon dioxide, methane, and carbon monoxide (CO). As proof of concept of this approach, we show measurements of TOC+CO during August–September 2016 from a coastal city in the southwest United Kingdom. TOC+CO was substantially elevated during the day on weekdays (occasionally over 2 ppm C) as a result of local anthropogenic activity. On weekends and holidays, with a mean (standard error) of 102 (8) ppb C, TOC+CO was lower and showed much less diurnal variability. TOC+CO was significantly lower when winds were coming off the Atlantic Ocean than when winds were coming off land if we exclude the weekday daytime. By subtracting the estimated CO from TOC+CO, we constrain the mean (uncertainty) TOC in Atlantic-dominated air masses to be around 23 () ppb C during this period. A proton-transfer-reaction mass spectrometer (PTR-MS) was deployed at the same time, detecting a large range of organic compounds (oxygenated VOCs, biogenic VOCs, aromatics, dimethyl sulfide). The total speciated VOCs from the PTR-MS, denoted here as Sum(VOC), amounted to a mean (uncertainty) of 12 () ppb C in marine air. Possible contributions from a number of known organic compounds present in marine air that were not detected by the PTR-MS are assessed within the context of the TOC budget. Finally, we note that the use of a short, heated sample tube can improve the transmission of organics to the analyzer, while operating our system alternately with and without a particle filter should enable a better separation of semi-volatile and particulate organics from the VOCs within the TOC budget. Future concurrent measurements of TOC, CO, and a more comprehensive range of speciated VOCs would enable a better characterization and understanding of the atmospheric organic carbon budget.
- Article
(5151 KB) - Full-text XML
-
Supplement
(451 KB) - BibTeX
- EndNote


The works published in this journal are distributed under
the Creative Commons Attribution 4.0 License. This license does not affect
the Crown copyright work, which is re-usable under the Open Government
Licence (OGL). The Creative Commons Attribution 4.0 License and the OGL are
interoperable and do not conflict with, reduce or limit each
other.
© Crown copyright
2019
The atmosphere hosts a rich variety of organic carbon, including volatile organic compounds (VOCs) such as hydrocarbons, alcohols, carbonyls, aromatics, and ethers, as well as lower-volatility compounds and aerosols. Some organic species contain other functional groups, such as organosulfurs, organonitrogens, and organohalogens. Many VOCs are reactive and affect the atmospheric oxidative capacity, while organic aerosols are important for air quality, human respiratory health, and potentially cloud formation. The total number of measured organic carbon species in the atmosphere is estimated to be on the order of 104–105 (Goldstein and Galbally, 2007). Both the abundance and cycling of total non-methane organic carbon (here abbreviated as TOC) are not well known. The total reservoir of TOC in the atmosphere is recently modeled to be about 16 Tg C (Safieddine et al., 2017), with large variability in both space and time. Emissions of the initially reduced biogenic VOCs (including isoprene and terpenes), estimated to be on the order of 1000 Tg yr−1, are by far the largest terrestrial source of TOC to the atmosphere (Guenther et al., 2012). Anthropogenic emissions of mostly hydrocarbons and biomass burning are also important sources of TOC (Andreae and Merlet, 2001). The large emissions of non-methane organic carbon relative to their relatively modest atmospheric burden imply rapid turnover of these compounds.
Once emitted into the atmosphere, organic compounds undergo chemical reactions (gas phase and heterogeneous oxidations, fragmentation and oligomerization, hydration and dehydration, etc.) as well as physical transformations (e.g., condensation into the aerosol phase). Atmospheric organics are terminally removed by conversion to carbon monoxide (CO) and carbon dioxide (CO2), or wet and dry deposition to the surface as aerosols or gases (Goldstein and Galbally, 2007). In the gas phase, organic compounds can be photolyzed or react with oxidants such as the hydroxyl radical (OH), nitrate radical (NO3), halogen radicals, and ozone (O3) at vastly different reaction rates and through distinct mechanisms. Over periods of hours to weeks, these compounds become progressively more oxidized in the atmosphere, yielding a wide variety of more oxygenated compounds (Kroll et al., 2011). Lewis et al. (2005) found that under maritime conditions at Mace Head (a coastal site in the North Atlantic), oxygenated volatile organic compounds (OVOCs) including methanol, acetaldehyde, and acetone together contributed up to 85 % of the observed non-methane organic carbon and explained 80 % of the estimated organic OH radical sink. Read et al. (2012) found that compared to the no-OVOC case, the inclusion of these OVOCs led to a ∼40 % reduction in the modeled OH radical concentration in the eastern tropical Atlantic. Depending on levels of nitrogen oxides (e.g., NO and NO2), VOCs may be responsible for either the production or consumption of O3, a harmful pollutant at high concentrations (Seinfeld and Pandis, 2006). Through affecting the cycling of the OH radical (the principal sink of the greenhouse gas methane), O3, and aerosols, organic compounds are important for climate.
The relative importance of oxidation vs. deposition as terminal sinks of atmospheric organics is poorly quantified. Jurado et al. (2008) estimated the global dry and wet depositions of organic aerosols to be 11 and 47 Tg C yr−1 and wet deposition of organic gases to be 187 Tg C yr−1. The ocean is found to be a source of organic gases such as dimethyl sulfide (DMS; e.g., Lana et al., 2011), OVOCs (e.g., Yang et al., 2014; Schlundt et al., 2017), isoprene (e.g., Hackenberg et al., 2017), methane (CH4, e.g., Forster et al., 2009), and halocarbons (Yokouchi et al., 2013), with annual fluxes of tens of Tg C yr−1 or less. Thus far, the few estimates on atmosphere–ocean diffusive total organic gas transport (Dachs et al., 2005; Ruiz-Halpern et al., 2010, 2014; Hauser et al., 2013) have yielded net deposition and emission fluxes that are more than an order of magnitude greater than the fluxes above, illustrating the substantial uncertainty in the role of the ocean on the atmospheric TOC budget.
Simultaneous quantification of all atmospheric organic species individually is essentially impossible (or not always desirable), hence the need to measure TOC as a single parameter (Heald et al., 2008). Several commercially available methods have been developed to measure total gaseous non-methane hydrocarbon concentrations in relatively polluted environments. However, these methods have large uncertainties and/or poor precision. Direct gas chromatography–flame ionization detection (GC–FID), photoacoustic infrared (PA-IR), and photoionization detector (PID) techniques all suffer from variable instrumental response towards different organic compounds. Thus, without prior knowledge of the atmospheric composition, accurate quantification of the TOC with these methods is impossible.
To achieve equal instrument response regardless of the compound type, organic carbon may be oxidized and detected as CO2 (analogous to measurement of dissolved organic carbon in water). Roberts et al. (1998) developed a technique based on cryogenic trapping of TOC, pre-separation of the major background gases (CO2, CH4, and CO) from TOC by a GC column, thermal desorption and catalytic conversion of TOC first to CO2 and then to CH4, and finally detection by FID. The GC-based system had a cycle time of 10 min or more. As cryogenic trapping retains moisture, sensitivity towards changing ambient humidity and variability in pre-separation and desorption contributes to uncertainties in their system (on the order of 10 ppb C). A similar method was developed by the group of Paulson et al. (2002), Maris et al. (2003), and Chung et al. (2003), with a detection limit of 35 ppb C.
Efforts trying to close the atmospheric organic carbon budget have often yielded significant fractions of “missing” or unidentified carbon. Roberts et al. (1998) reported TOC concentrations from a remote site in Nova Scotia, Canada, that were typically ∼30 % higher than the sum of the speciated compounds. In air quality studies in California, Chung et al. (2003) found that measurements of total non-methane organic carbon and speciated VOCs by standard GC–FID agreed well near primary pollution sources. However, in aged air masses the total non-methane organic carbon was in excess by up to 45 %. Similarly, observations of total OH reactivity when evaluated with speciated organic concentrations often suggest that a large fraction of OH reactivity is unexplained, e.g., a portion of the TOC is not detected by speciated measurements (e.g., Nolscher et al., 2016).
Hunter et al. (2017) attempted to close the atmospheric organic carbon budget at a forested site by simultaneously deploying five mass spectrometers, a Herculean undertaking. They found that previously unmeasured species such as semivolatile and intermediate-volatility organics accounted for a third of the sum of observed organic carbon. Isaacman-VanWertz et al. (2018) used the same set of techniques to track the oxidation chemistry of a monoterpene over multiple generations in the laboratory. They found that after a day of atmospheric ageing, most of the organic carbon ends up as either VOCs or organic aerosols. Safieddine et al. (2017) modeled the global atmospheric TOC budget and found it to be dominated by ketones, alkanes, alkenes, and aromatics. Both comprehensive speciated measurements as well as modeling studies of atmospheric organic carbon budget can benefit from in situ measurements of TOC, which are to date extremely scarce. In this paper, we describe a simple and robust method of quantifying TOC and show how TOC observations from a coastal site varied with concurrent speciated VOC measurements and other environmental variables.
Observations of total and speciated organic carbon were made from the rooftop of Plymouth Marine Laboratory (PML, ∼45 m above mean sea level, ∼300 m from water's edge) during August–September 2016. Similar to the setup used by Yang et al. (2013), ambient, unfiltered air was pulled from an inlet on the rooftop via 25 m of unheated perfluoroalkoxy (Teflon PFA) tubing (6.4 mm inner diameter, ID) at a flow rate of ∼30 L min−1. The TOC system and the proton-transfer-reaction mass spectrometer (PTR-MS) subsampled from this main flow at a flow rate of ca. 140 and 120 mL min−1, respectively. The TOC system was operated continuously during this 5-week campaign. The PTR-MS measurements were made primarily after working hours and on weekends, as the instrument was needed by other projects during the working hours.
2.1 The TOC system
TOC was quantified in a simple fashion – via catalytic oxidation of organics in bulk air to CO2. Ambient air was directed through a platinum catalyst periodically (typically 2 min of ambient air followed by 1 min of catalyst air) via a three-way polyterafluoroethylene (PTFE) solenoid valve (Takasago Electric, Inc.). Platinum on glass wool (Shimadzu) was packed in a 13 mm diameter stainless steel tube and heated to 450 ∘C. Dry CO2 and CH4 mixing ratios were continuously monitored at a frequency of ∼2 Hz by a Picarro G2311f analyzer (in high-precision mode). The Picarro instrument was calibrated against NOAA CO2 and CH4 standards.
From each pair of ambient and catalyst measurements, the sum of TOC and CO is derived semicontinuously in the mixing ratio of carbon (ppb C):
Here CO2 and CH4 represent the dry mixing ratios in ambient air (averaged from the last 5 s before switching to measuring catalyst air). The asterisks of and indicate dry mixing ratios when air is directed through the catalyst (averaged from the last 25 s of the catalyst phase). Any errors in the “zeros” of the CO2 and CH4 measurements should be canceled out in Eq. (1). The monitoring of CH4 enables the continuous assessment of the efficiency of the catalytic conversion (computed as ). At the flow and temperature used, oxidation of CH4 was highly efficient (98.7 %–98.9 %) and largely insensitive towards humidity during this campaign (Fig. 1). CH4 is thermodynamically one of the most reduced and stable compounds. Thus its rapid and near complete removal by the catalyst suggests ∼100 % oxidation of other VOCs as well as CO to CO2, which is confirmed by laboratory tests as discussed below. We note that based on previous work using platinum catalytic converters (Veres et al., 2010; Stockwell et al., 2018), it is likely that the oxidation efficiency of this system will be lower at a much higher flow rate.
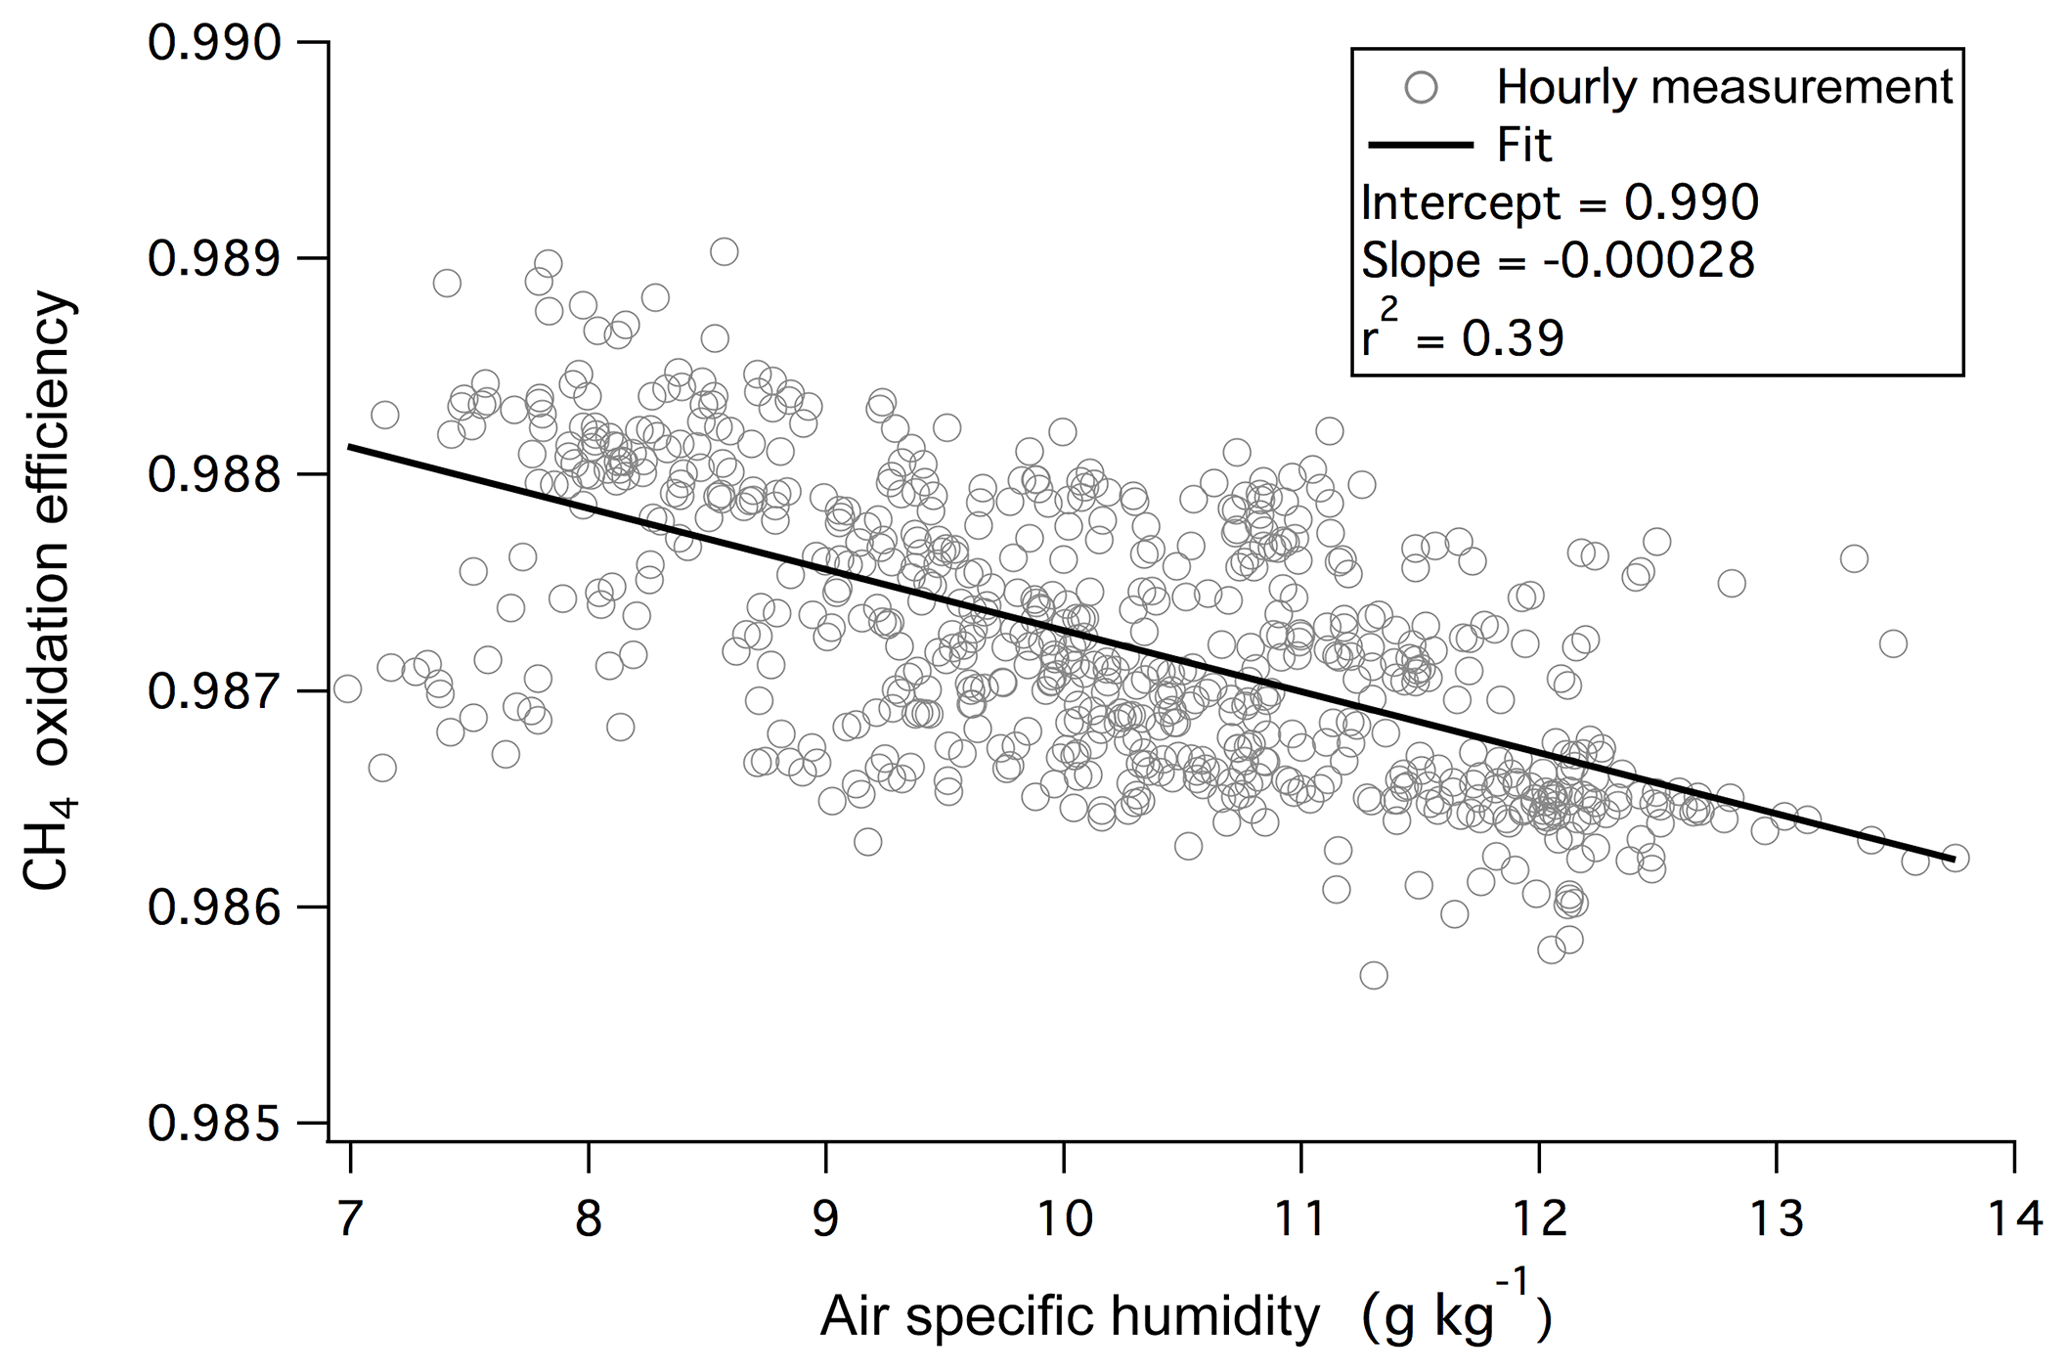
Figure 1Oxidation efficiency of CH4 by the platinum catalyst was nearly 99 % and demonstrated only a weak dependence on ambient humidity during the 1.5-month measurement campaign from the rooftop of Plymouth Marine Laboratory.
To verify the TOC system, we measured a diluted VOC gas mix. A multi-species gas standard consisting of methanol, acetaldehyde, acetone, DMS, benzene, and toluene (nominal mixing ratio of 500 ppb for each VOC balanced in nitrogen; Apel Riemer Environmental, Inc., USA) was diluted by a factor of 10 with zero air. The zero air was generated by pre-scrubbing a low-VOC synthetic air (BOC BTCA 178, containing 20 % oxygen) with a second 450 ∘C platinum catalyst.
The expected total parts per billion of carbon in this diluted standard ( ppb C) is computed as follows:
Here Nc is the number of carbon atoms in each speciated VOC. The total uncertainty in this Sum(VOC) is propagated from the accuracies of the VOC standard concentrations and from the uncertainties in the dilution. We measured a difference in TOC+CO between the diluted VOC standard and zero air alone of 1232 (±1 standard error of 21) ppb C. Assuming negligible CO in the zero air as well as in the VOC standard, TOC+CO here can simply be equated to TOC. In this case TOC and Sum(VOC) agree well within the experimental uncertainties. Here we have purposely chosen a high VOC standard concentration because if all the VOCs are fully oxidized at concentrations 1 to 2 orders of magnitude higher than in ambient air, we would expect these VOCs at ambient levels to fully oxidize as well.
Because the catalyst (made up of platinum, glass wool, and stainless steel) does not contain any carbonaceous components, we expected the instrument background in TOC+CO (i.e., when measuring air that is free of organics and CO) to be zero. However, post-campaign measurements of zero air (see above) yielded a TOC+CO background of 39 (±1 standard error of 3) ppb C. The reason for this small but significantly positive background is unclear. It could be that some particulate organic carbon either preexisting in the atmosphere or formed via charring to 450 ∘C is captured by the glass wool and then slowly oxidized to CO2 over time. We note that the Sunset Laboratory's OCEC (organic carbon and elemental carbon) analyzer heats to 850 ∘C (over manganese dioxide) for complete desorption and conversion of refractory organics (e.g., soot) to CO2. We subtracted the background value of 39 ppb C from the TOC+CO measurements during the 2016 campaign. However, the fact that the background measurement was not made at the time of the campaign is a source of potential bias in this dataset.
Measurement of TOC+CO by our approach is made possible thanks to the very high precision of the Picarro G2311f instrument (∼100 and 0.4 ppb for CO2 and CH4 at 2 Hz, respectively). Scatter in TOC+CO depends on random noise as well as ambient variability in the mixing ratios, with CO2 being the most critical. The measurement precision is significantly improved through averaging, as random noise scales with N1∕2 (N being the number of measurement). In the limit of no ambient variability in , each pair of and CO2∕CH4 measurements has a propagated precision of 35 ppb C () in our setup. Since there are nominally 20 measurements per hour, this implies a best-case hourly precision of 8 ppb C () for TOC+CO. While not substantially more precise than earlier methods, the technique described here is robust in that it avoids many of the uncertainties and complexities associated with trapping and desorption (e.g., Roberts et al., 1998). The precision estimate above may be appropriate for parts of the remote marine atmosphere (i.e., very low variability in ). Closer to emission sources, the greater variability in these major gases is expected to significantly increase the scatter in TOC+CO. At our polluted coastal environment where the major gases were generally not very constant, the standard deviation in the hourly mean TOC+CO was about 30 ppb C during periods of fairly low ambient CO2 variability (1 standard deviation of ∼0.2 ppm).
In addition to gases, ambient TOC measured with this method likely includes some aerosols and low- to moderate-volatility compounds, which can reversibly partition onto the inlet tube surface and lengthen the measurement response time. The contribution of these particulate and semi-volatile organics towards TOC depends on their transmission through the inlet tube as well as on their oxidation efficiency in the catalyst. We did not explicitly test these aspects as organic aerosol mass is already quantifiable using aerosol mass spectrometry as well as thermal methods (e.g., Sunset Laboratory's OCEC analyzer).
2.2 Speciated VOC measurements
Speciated organic gases were quantified using a PTR-MS, which was freshly serviced and calibrated by Ionicon. The PTR-MS settings were essentially the same as those used by Yang et al. (2013, 2014), except for a lower drift tube pressure (2.25 mbar). The monitored masses (m∕z) with a H3O+ source were attributed to the following compounds: m∕z 33 (methanol), 42 (acetonitrile), 43 (fragmented propanol or acetic acid ), 45 (acetaldehyde), 47 (ethanol), 59 (acetone), 61 (propanol or acetic acid ), 63 (DMS), 69 (isoprene), 79 (benzene), 91 (toluene), 107 (xylene), and 137 (monoterpenes). The total speciated VOCs from the PTR-MS are computed following Eq. (2). The same VOC gas standard as above (containing methanol, acetaldehyde, acetone, DMS, benzene, and toluene) diluted in synthetic air (BOC BTCA 178) was used for (1) calibration of the PTR-MS and (2) further demonstration of the oxidation efficiency of the platinum catalyst. For detected VOCs that were not directly calibrated, recommended kinetic reaction rates from Zhao and Zhang (2004) were used to compute the mixing ratios from the PTR-MS raw counts.
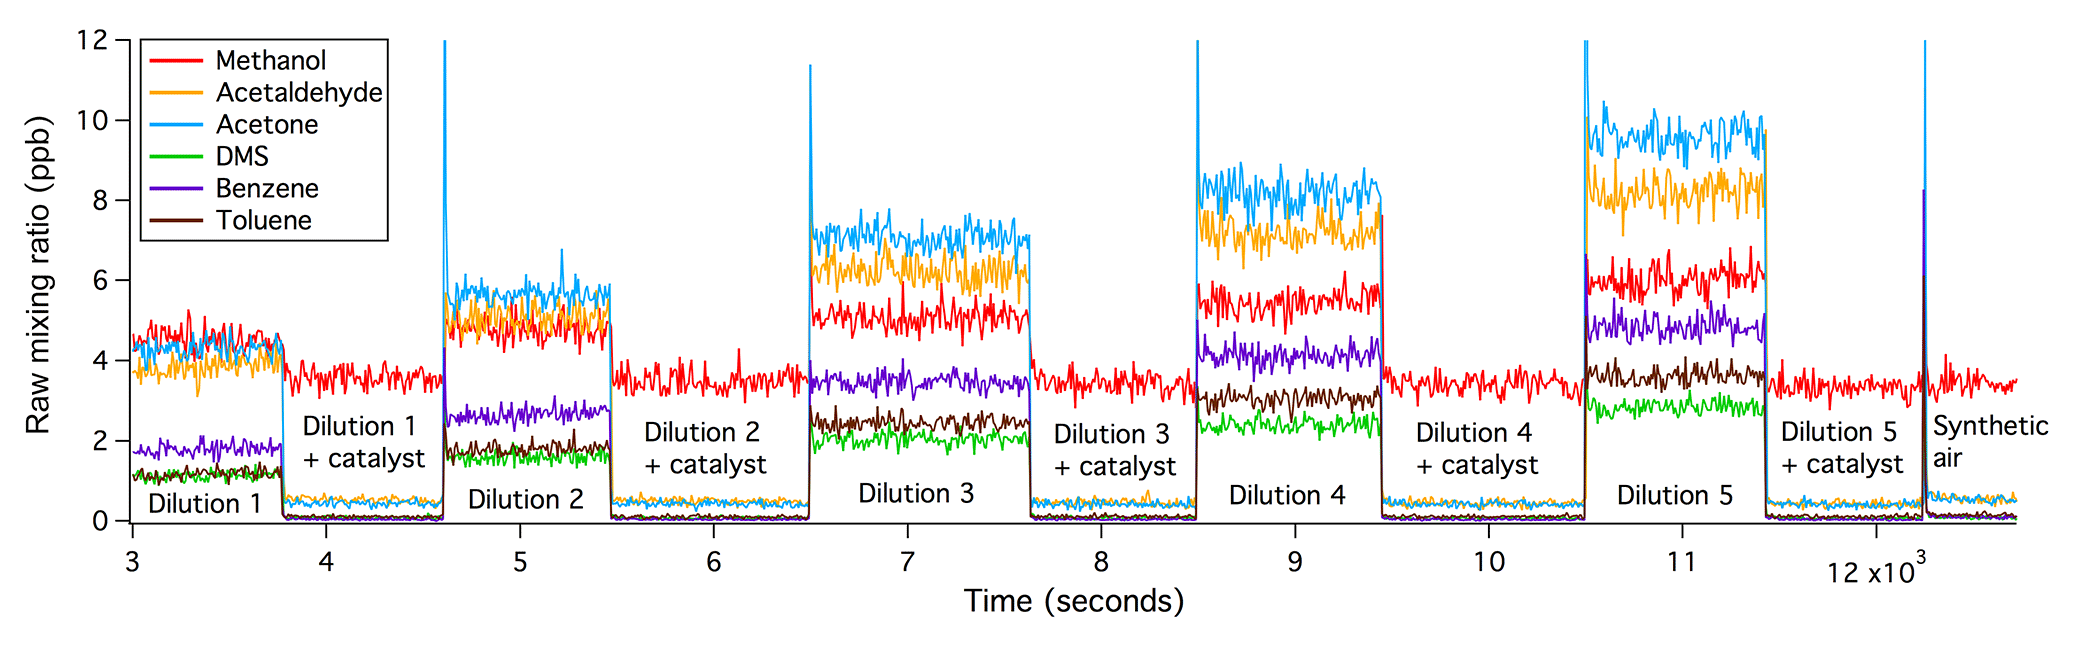
Figure 2Catalytic oxidations of VOCs were complete, immediate, and independent of the VOC input within the range tested.
The oxidation of all VOCs in the platinum catalyst tested here appears to be immediate, complete, and independent of the amount of VOCs present as well as the humidity (within the test range). Figure 2 shows a time series of raw VOC mixing ratios from such a laboratory experiment. The flow of the VOC gas standard was increased stage-wise, resulting in greater measured VOCs from about 3000 to 11 500 s. The differences in the amplitudes of the different raw VOC mixing ratios are primarily due to their different kinetic reaction rates and transmission efficiencies within the PTR-MS, which are corrected for in the final dataset. For the second half of each stage of dilution, the VOC-containing air was directed through the platinum catalyst. With increasing amounts of VOCs added, VOC measurements during the catalyst section remained constant and equal to (or slightly less than) measurements of synthetic air alone (after ∼12 200 s), demonstrating 100 % oxidation efficiency. In a separate experiment, synthetic air was moistened to an absolute humidity of 12.8 g kg−1 before the addition of the VOC standard. The higher humidity in the sample air did not affect the oxidation efficiency of these VOCs.
Within the range of ambient humidity during this campaign and under the PTR-MS setting used, the only VOC measurements with noticeable humidity sensitivity were isoprene and monoterpenes. Calibrations and air scans show that these two VOCs were partially fragmented into m∕z of 41 and 81, respectively, consistent with previous findings (e.g., Schwarz et al., 2009; Tani et al., 2004). The fragmentation tended to be more severe at a lower ambient humidity and these daughter fragments are accounted for in the budgets of biogenic VOCs and Sum(VOC). We show in Sect. 5 that Sum(VOC) was dominated by OVOCs during this campaign and these gases were well calibrated. Biogenic VOCs accounted for only a small fraction of Sum(VOC), such that any uncertainty from the humidity dependence in these fragmentations likely contributed little to Sum(VOC). In total we expect the accuracy in Sum(VOC) during our campaign to be at worst 25 %.
The period of 4 August to 22 September 2017 was mostly sunny (noontime shortwave irradiance of 600–700 W m−2) and calm (mean wind speed of ∼4 m s−1). Figure 3a shows the time series of hourly averaged TOC+CO from the entire measurement period. Large variability was observed in TOC+CO on weekdays, with values occasionally exceeding 2 ppm C. In contrast, TOC+CO was significantly lower and less variable on weekends and holidays. Stronger winds over 10 m s−1 from the southwest came through between 19 and 22 August and on 3 and 9 September, carrying along rainfall (Fig. 3b). Relative low and consistent TOC+CO was observed during these periods.
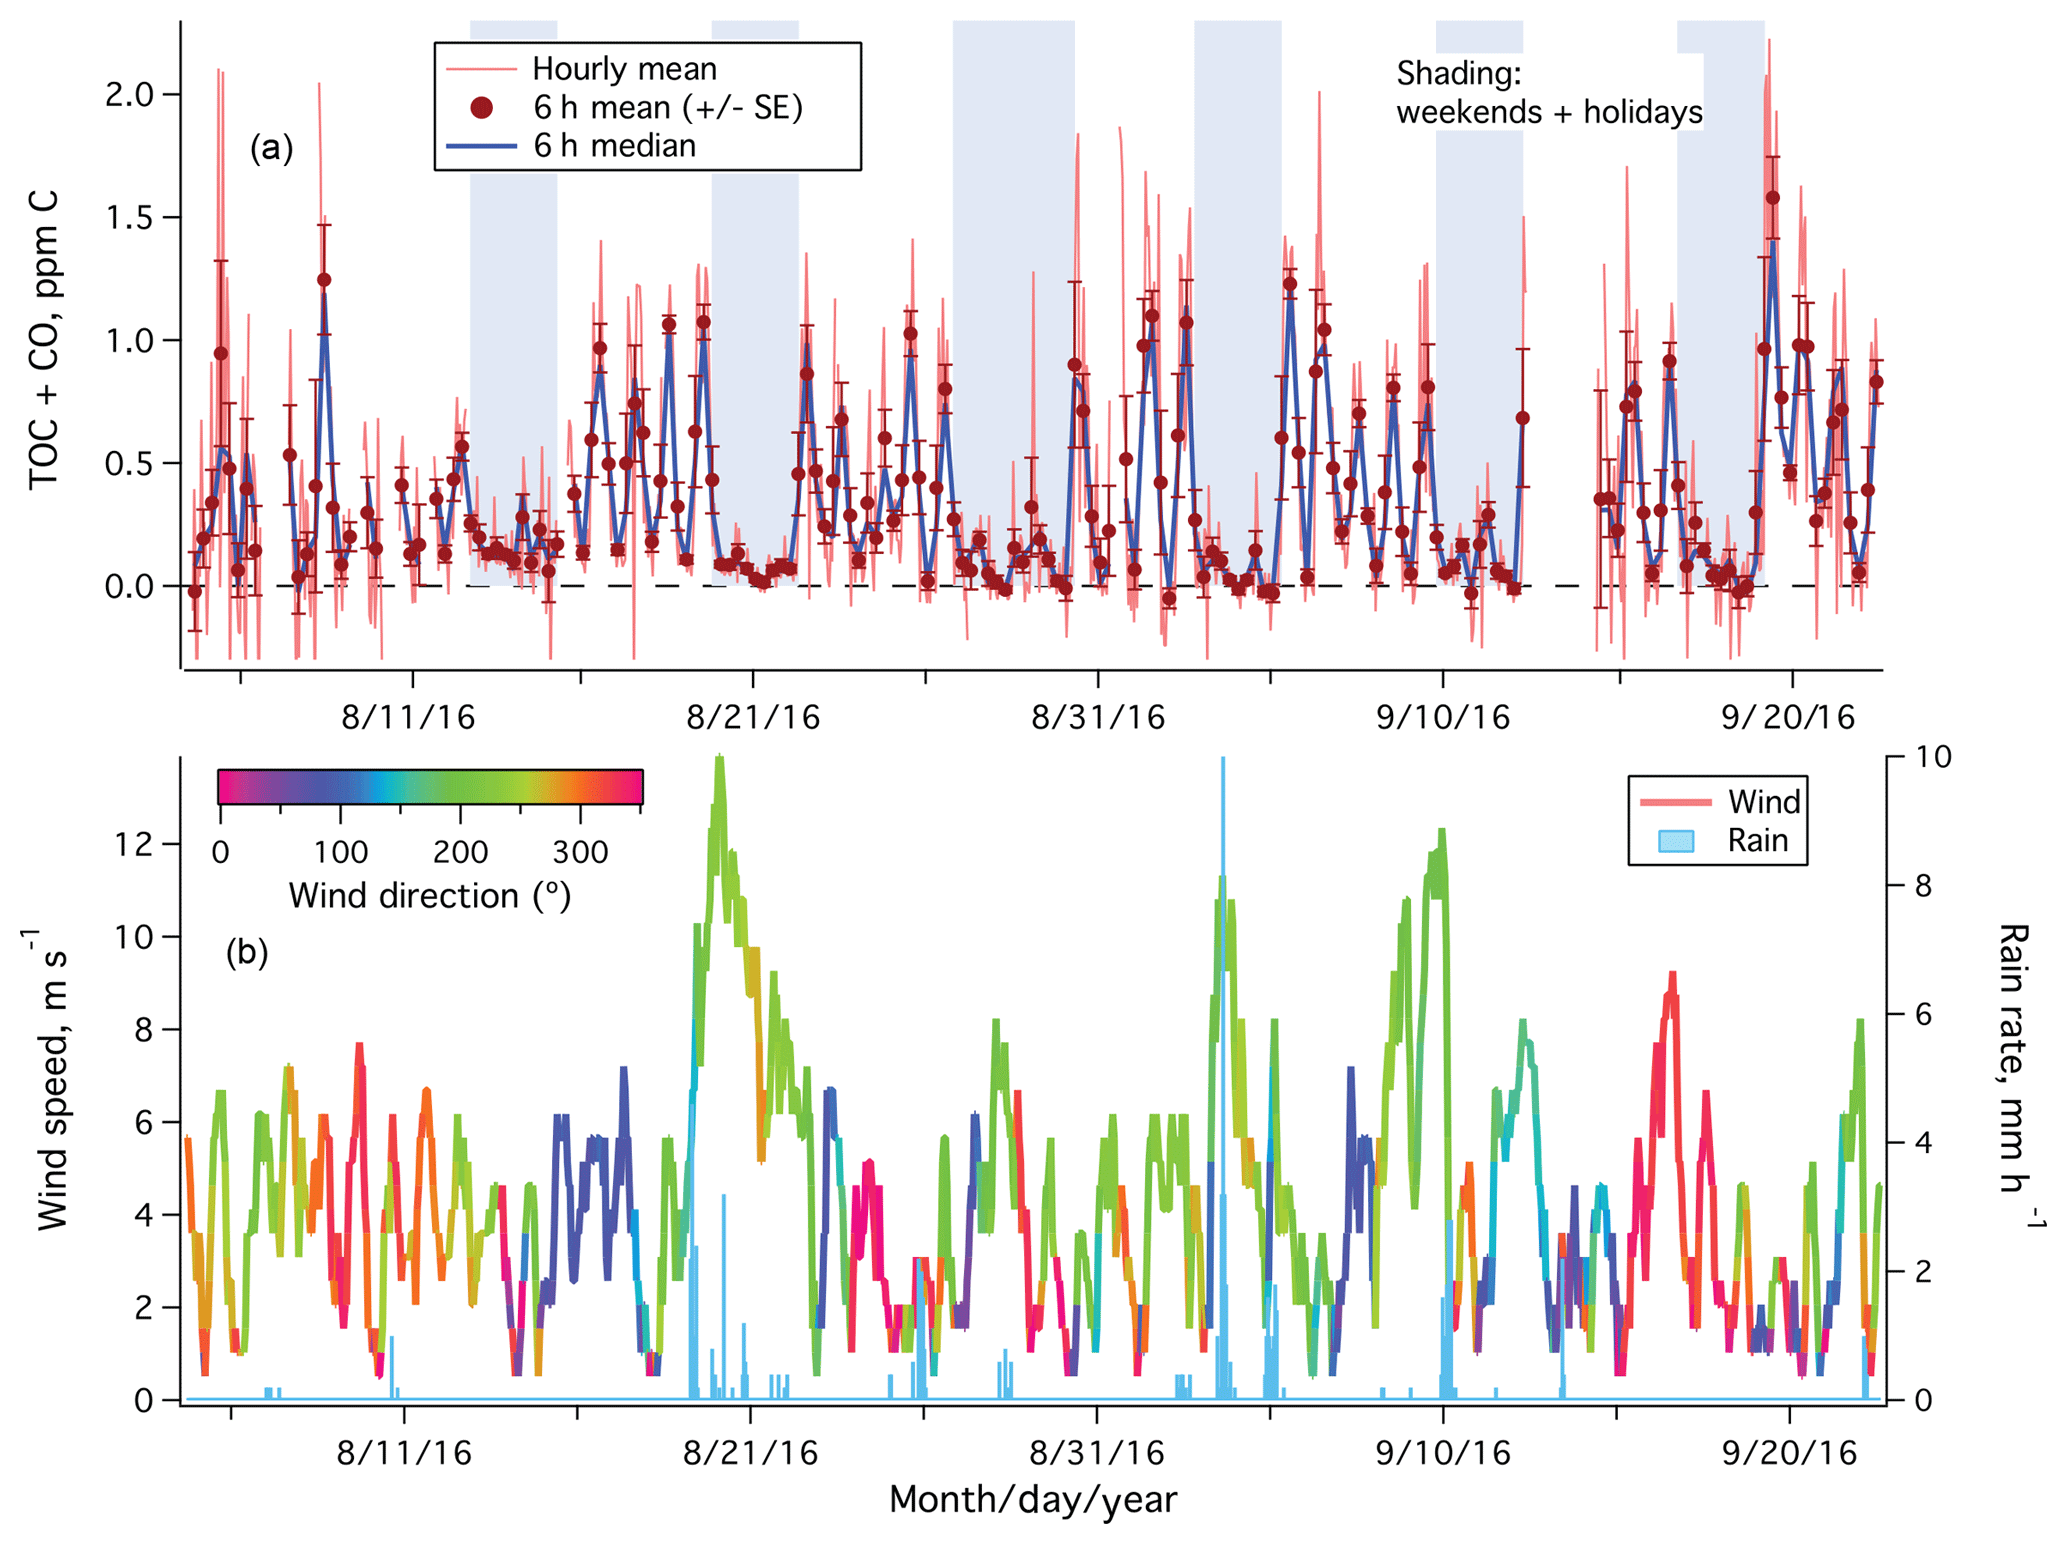
Figure 3(a) Time series of TOC+CO in units of parts per million of carbon from the rooftop of Plymouth Marine Laboratory. Error bars on 6 h means indicate standard errors; (b) wind speed (color-coded by wind direction) and rain rate.
The hourly TOC+CO data were clearly noisier in the first week, when the measurement frequency was lower (5 min of ambient air followed by 2 min of catalyst air). Increasing the measurement frequency subsequently (2 min of ambient air followed by 1 min of catalyst air) reduced the noise in the hourly averaged TOC+CO by about 50 %. Scatter in the hourly TOC+CO (and some of the negative values), largely a result of highly variable ambient CO2 mixing ratios, is greatly reduced in the 6 h mean and median. This further confirms that our TOC+CO measurement is precision limited.
Averaged over the entire campaign, TOC+CO was much higher (exceeding 1 ppm C) during the day than at night (∼0.15 ppm C) on weekdays (Fig. 4a). Typical of urban air pollutants, two peaks were observed in the weekday data, one around the morning rush hour traffic, and the second one around the late afternoon rush hour traffic. Less diurnal variability was apparent on weekends and holidays, with mean (standard error) TOC+CO of 102 (8) ppb C. A higher ambient CO2 mixing ratio was also generally observed on weekdays than on weekends and holidays during the daytime (Fig. 4b). This suggests that the elevated TOC+CO levels during the weekday daytime were largely due to local anthropogenic activities. In particular, demolition of a large building with heavy machinery took place south of the PML building during the working hours of this period.
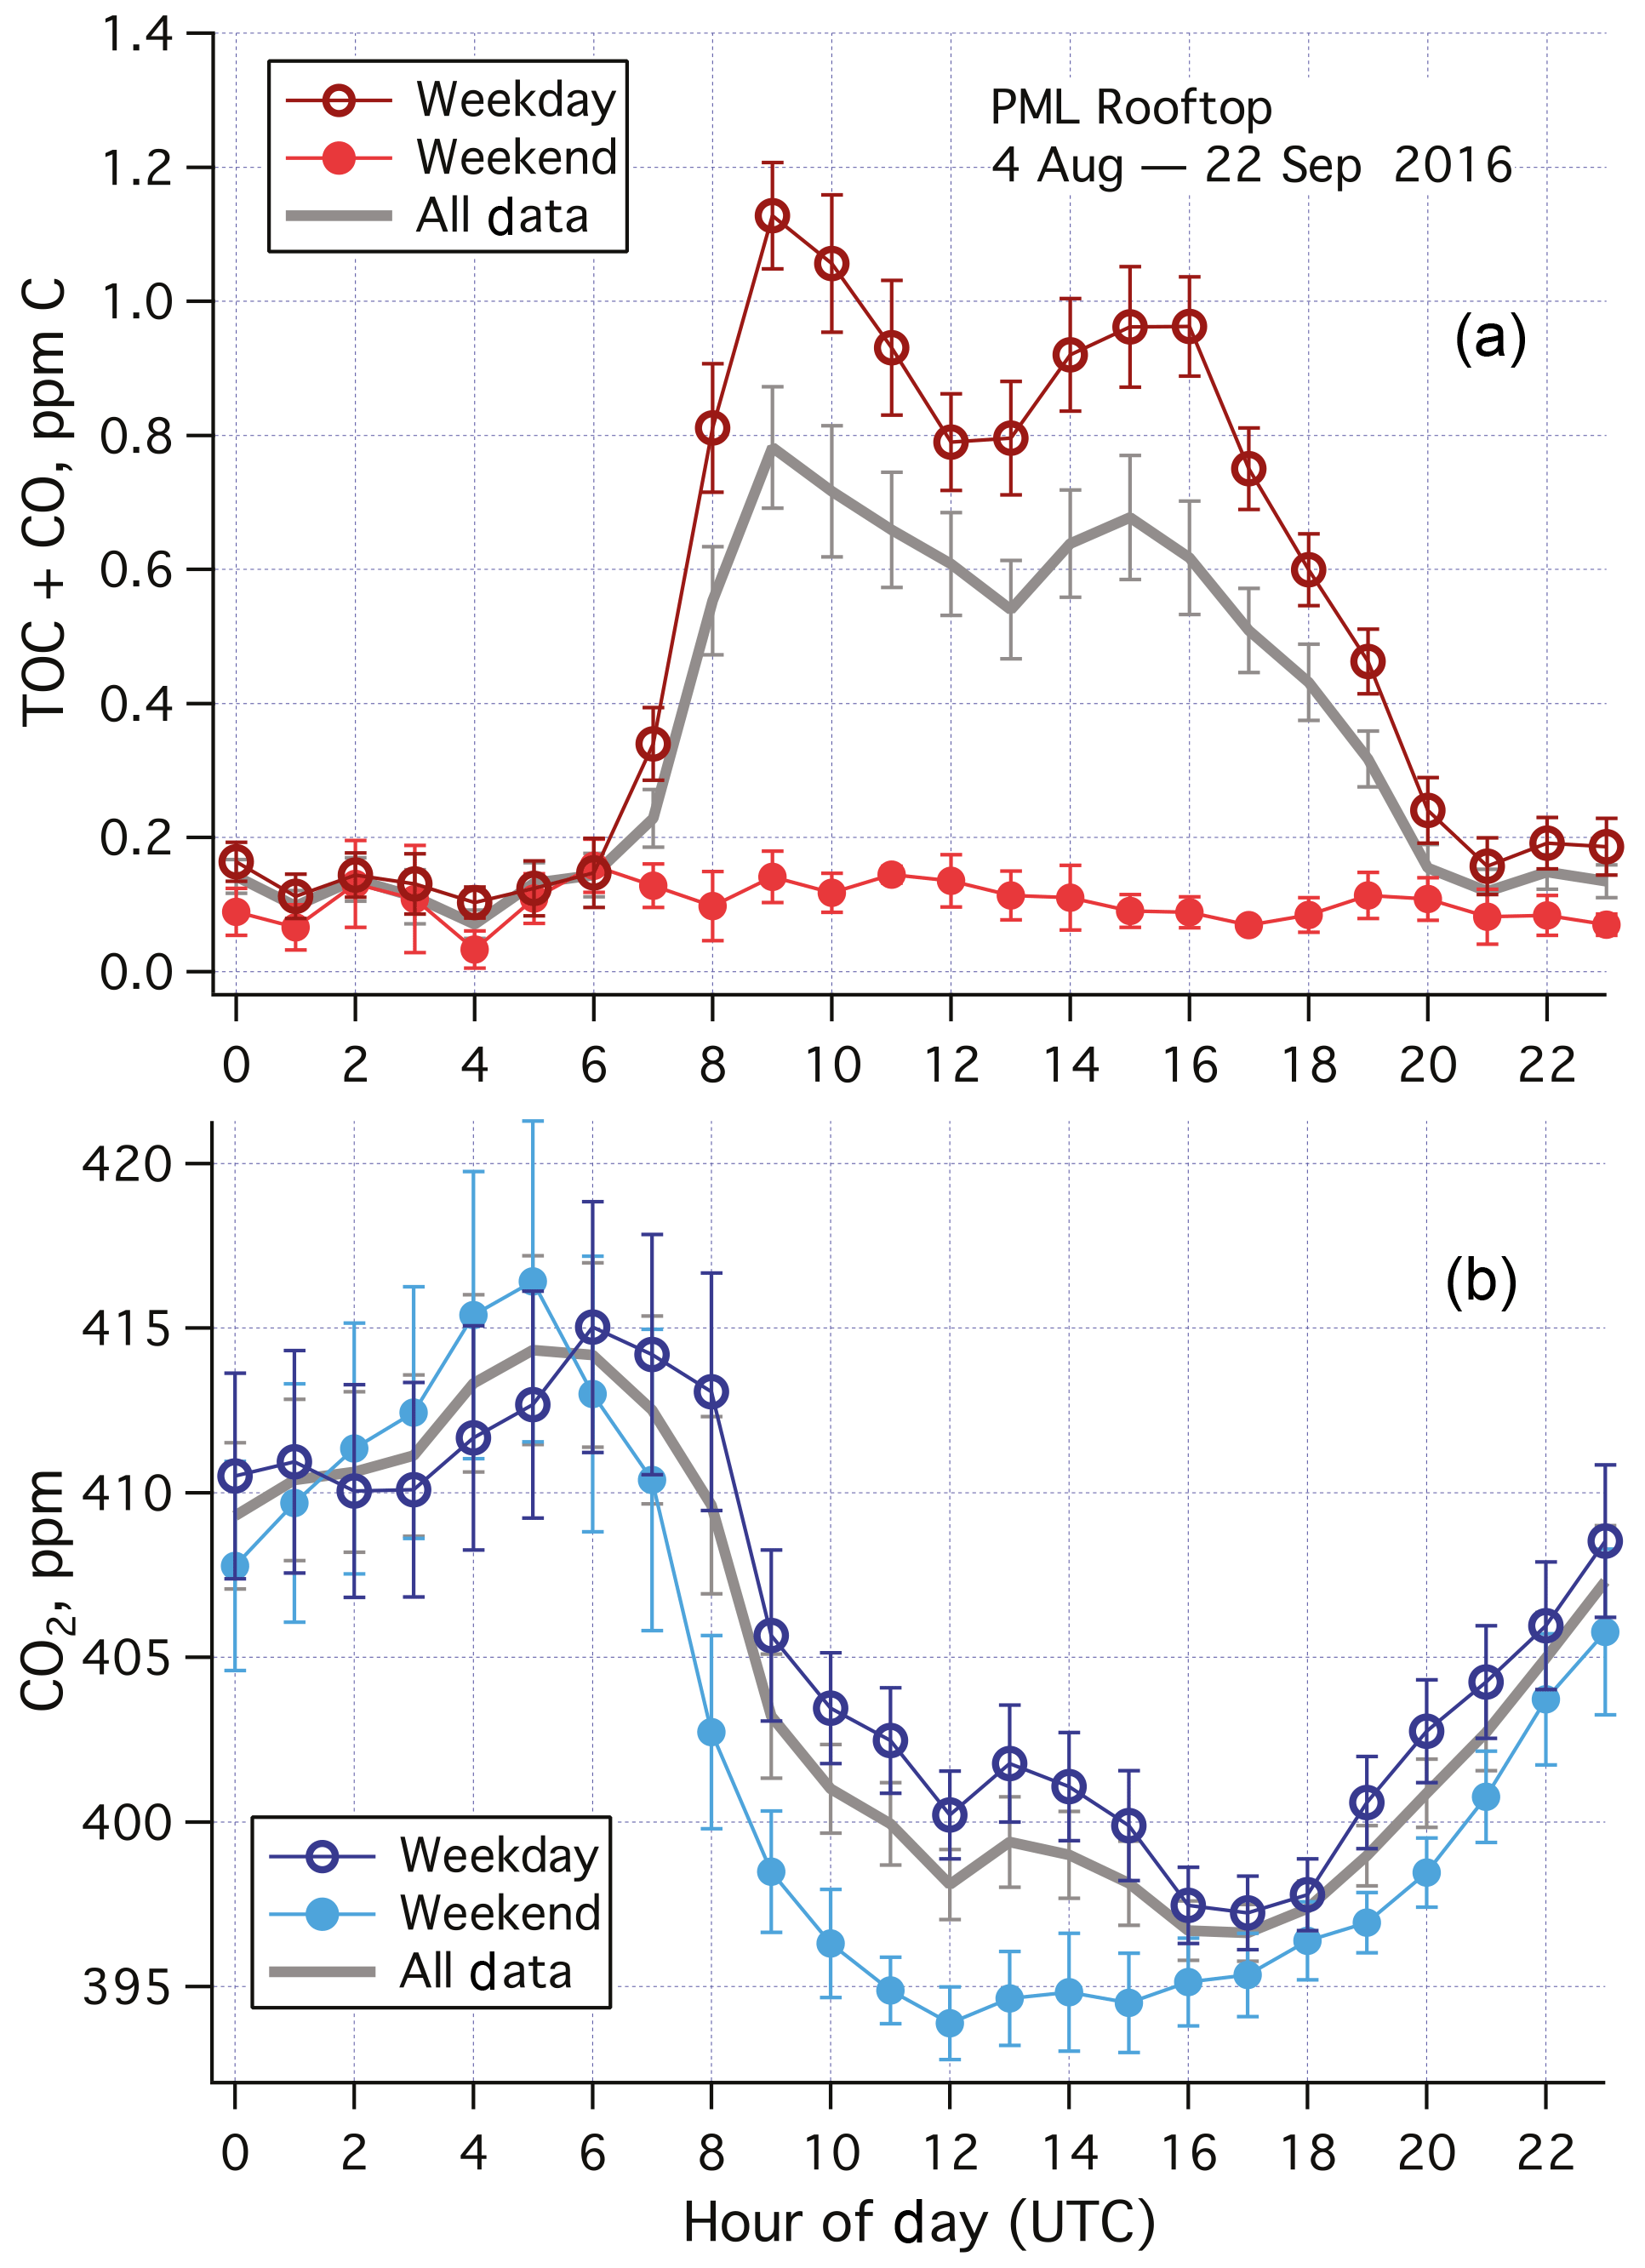
Figure 4(a) Averaged diurnal cycle in TOC+CO and (b) CO2 for weekdays, weekends–holidays, and all data during the 1.5-month measurement campaign from the rooftop of Plymouth Marine Laboratory. Error bars indicate standard errors. TOC+CO was much higher during weekdays than weekends, especially in the daytime. Limited diel variability in TOC+CO was observed in the weekend data. CO2 was also higher in the daytime during weekdays than weekends. UTC here is 1 h behind local time.
We estimate the emission factor of TOC+CO from local anthropogenic sources. The difference in TOC+CO between weekdays and weekends–holidays is plotted against that of CO2 in Fig. 5. A positive correlation is evident, with a dimensionless ratio of roughly 0.1 (largely between 0.05 and 0.2). This is on the higher end of previously reported CO:CO2 emission ratios from urban environments (e.g., Wang et al., 2010; Ammoura et al., 2014), probably in part due to the inclusion of VOCs.
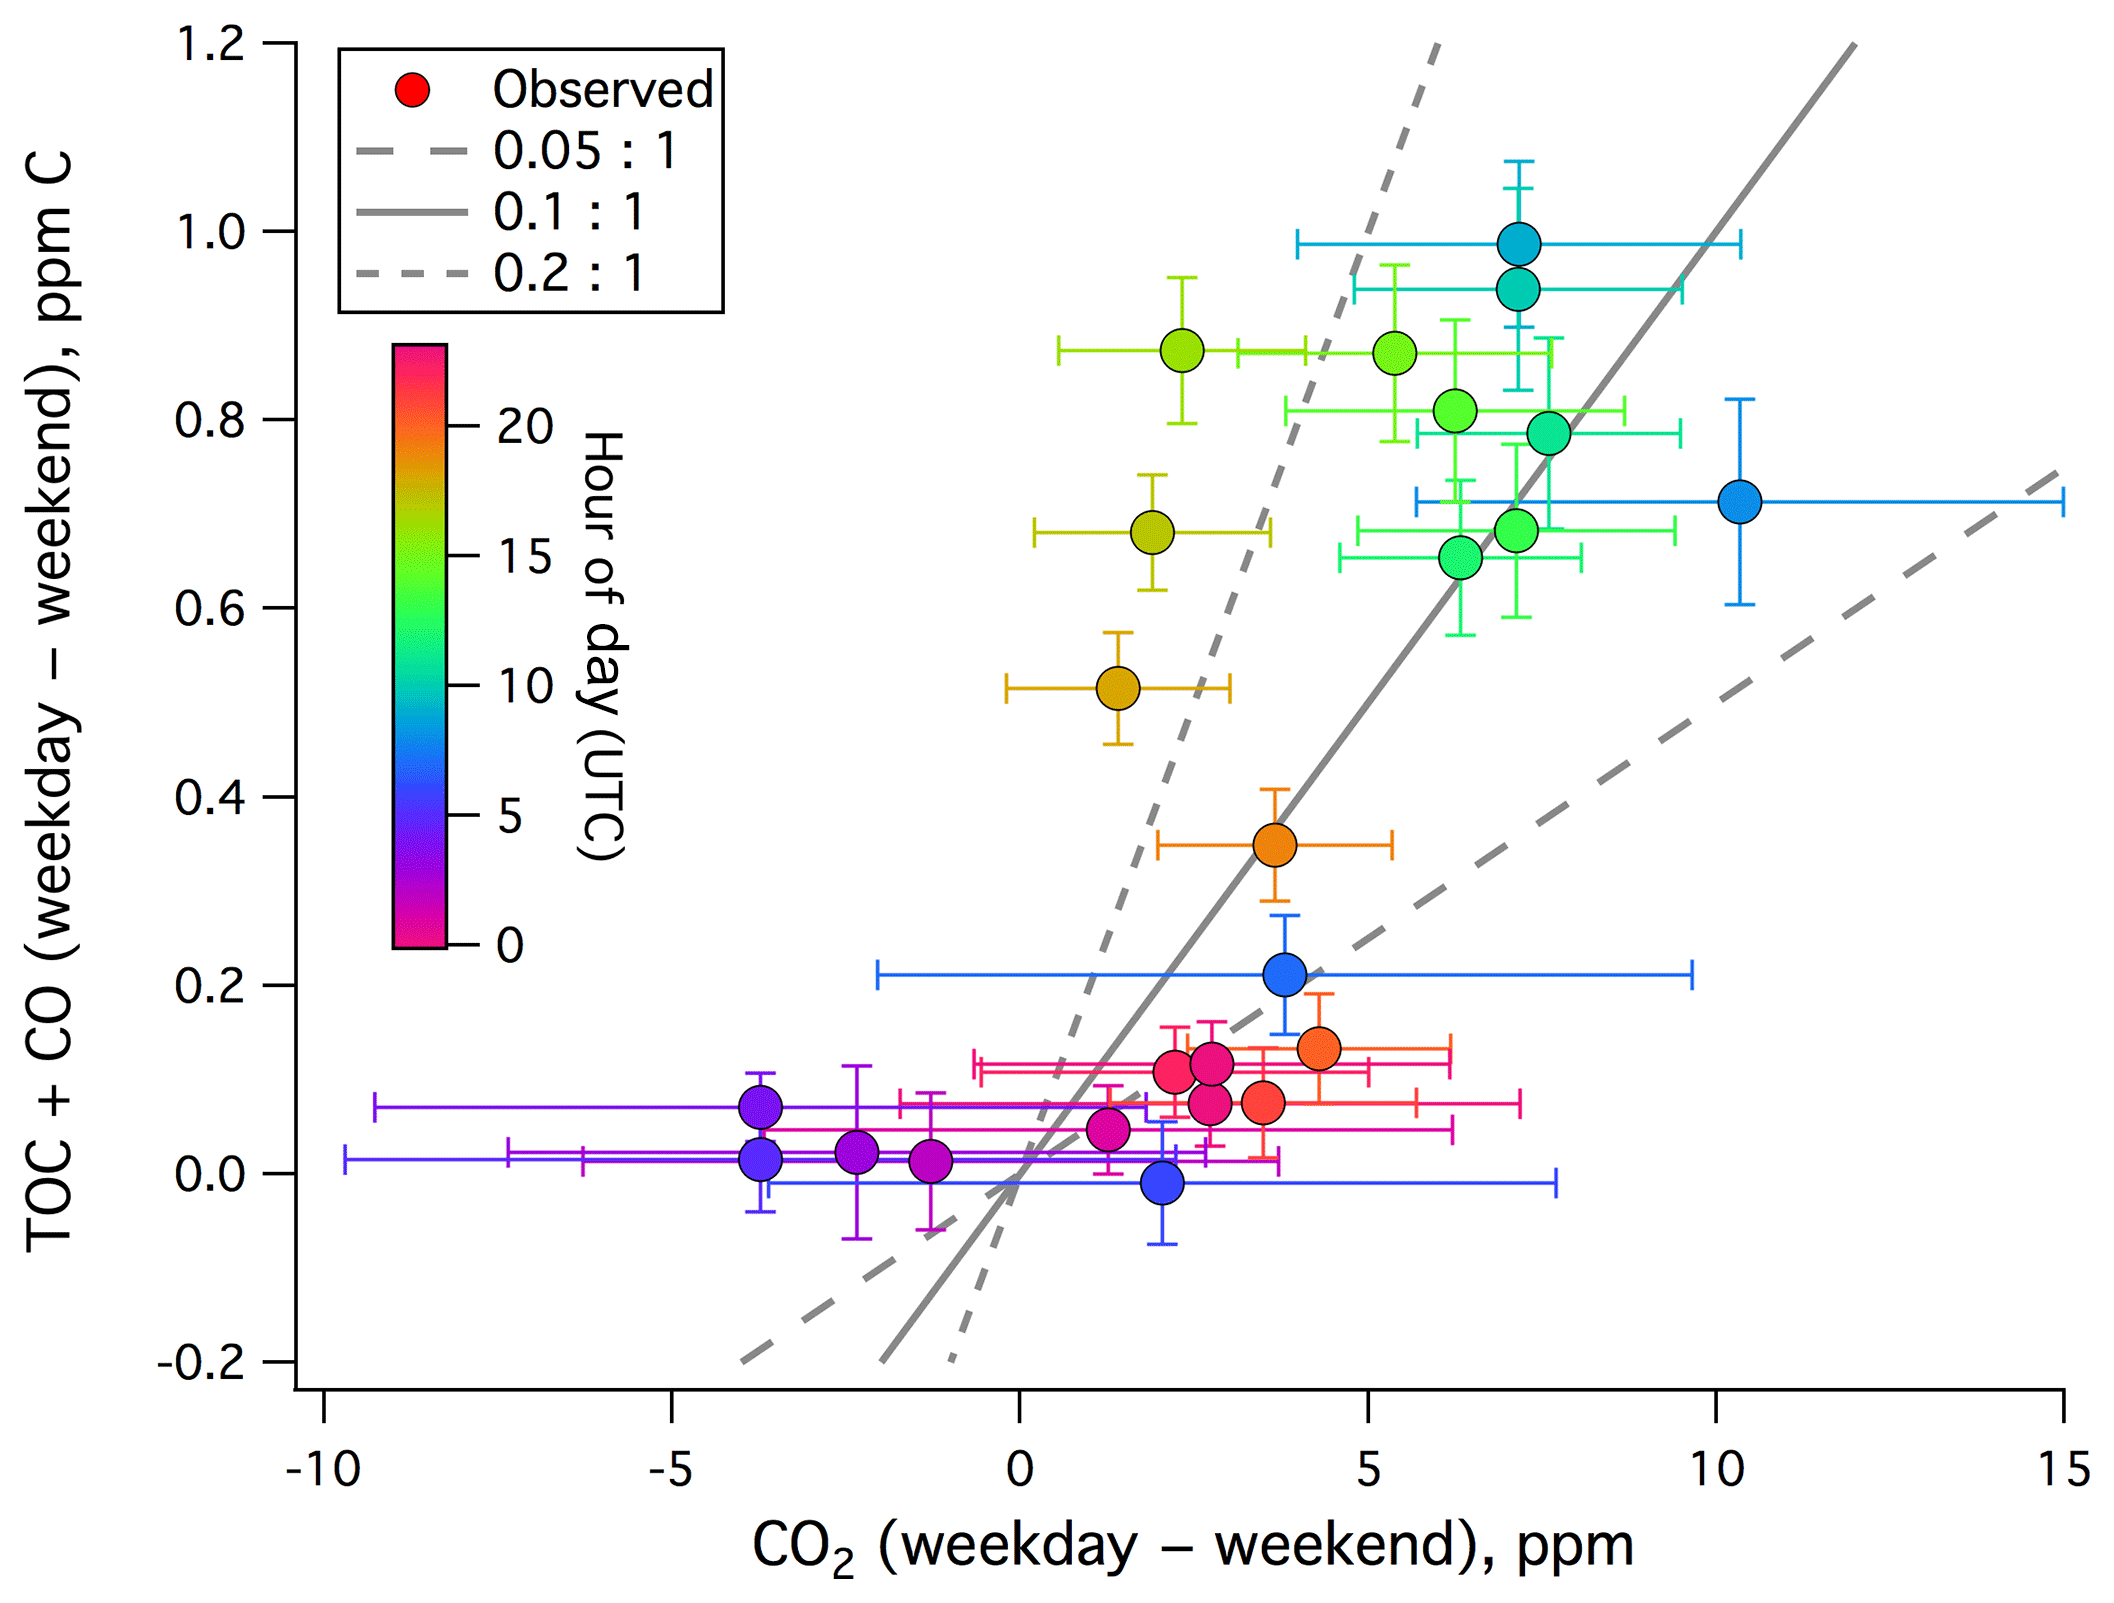
Figure 5Weekday–weekend difference in TOC+CO (ppm C) vs. weekday–weekend difference in CO2 from the rooftop of Plymouth Marine Laboratory. A positive correlation is observed, with a dimensionless ratio ranging from mostly less than 0.05:1 to over 0.2:1.
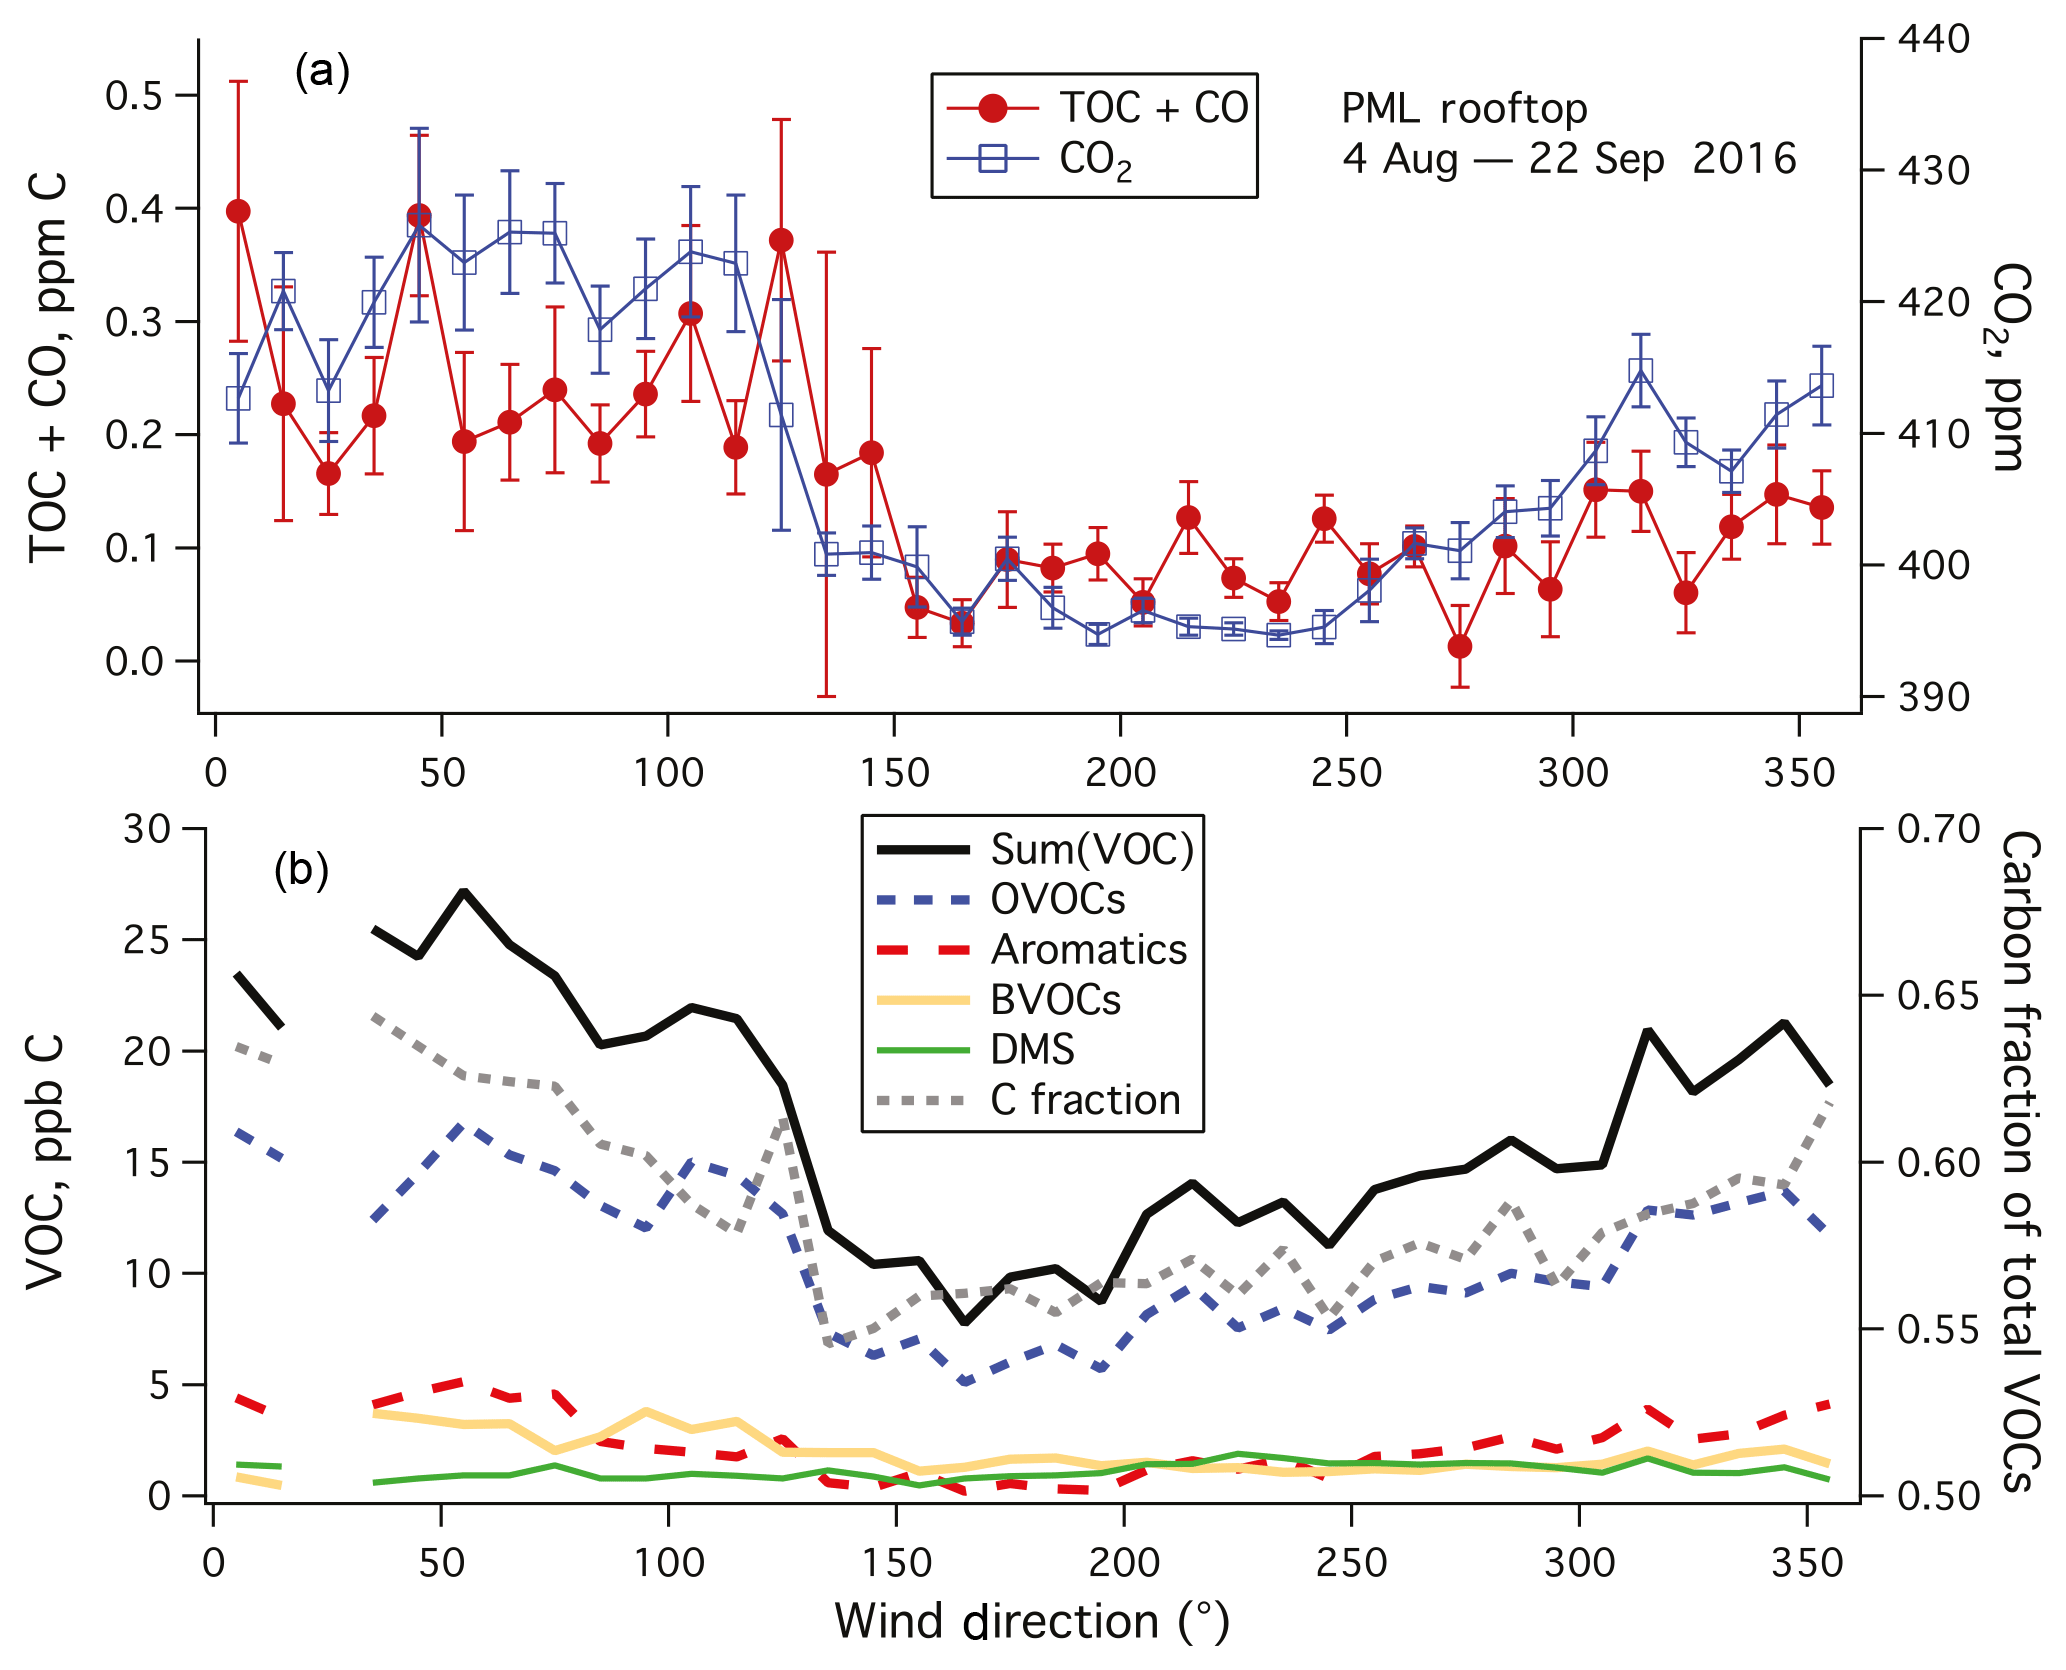
Figure 6(a) TOC+CO and CO2 and (b) Sum(VOC) and speciated VOC averaged to 10∘ wind direction bins. Error bars indicate standard errors. TOC+CO, CO2, and Sum(VOC) showed higher values when winds were from land (north to southeast) than when winds were from the ocean (southwest). Most VOCs had a lower mixing ratio in marine air than in air from land except for DMS. Amongst speciated VOCs measured by the PTR-MS, OVOCs dominated in terms of carbon mass. The fraction of carbon in the total speciated VOC mass was also lower in marine air.
For the rest of this paper, we focus only on data from weekends–holidays and weekday nighttime in order to minimize the effects of local pollution. TOC+CO and CO2 are averaged in wind direction bins in Fig. 6a. Both variables show qualitatively similar patterns, with lower values when winds were from the sea (southwest, here 180–270∘) than when winds were from land (north to southeast, here 330–120∘). Comparing the difference between land air and marine air in TOC+CO (0.247–0.079 ppm C) vs. that in CO2 (421.0–396.4 ppm), we obtain a dimensionless ratio of approximately 0.0068. This ratio is roughly an order of magnitude lower than the slope derived from local pollution (Fig. 5) for probably multiple reasons. Unlike local pollution, TOC+CO in marine air is likely less coupled to CO2 emissions. Due to the shorter lifetimes of organics, we also expect a far more rapid degradation of TOC further away from the emission sources than CO2.

Figure 7Relationship between TOC+CO and (a) CO2 and (b) O3. (c) Percentage of time that the air mass was over the Atlantic Ocean over the last 5 days. (d) Percentage of time that the air mass was over mainland Europe and the English Channel over the last 5 days. Hourly data limited to weekends and weekday nights only.
A fraction of TOC measured at PML appeared to be highly soluble and readily removed by wet deposition. The mean (standard error, SE) TOC+CO during non-raining periods was 0.136 (0.008) ppm C, while that during rain events (65 h total over the campaign) was 0.071 (0.002) ppb C. Though part of this difference could be due to the greater occurrence of rain when winds were from the southwest (off the Atlantic Ocean). TOC+CO correlated in the mean with CO2 (Fig. 7a) and also with O3 (Fig. 7b) from the Penlee Point Atmospheric Observatory (PPAO) 6 km to the south of PML (Yang et al., 2016), similar to observations from Roberts et al. (1998). For reference, mean CO2 and O3 were about 395 ppm and 18 ppb when winds came from the southwest during this campaign. In the following sections, we constrain the magnitude of TOC in marine air and compare it against speciated organic carbon measurements from the PTR-MS as well as against previous observations.
Accurately determining TOC requires the concurrent measurement of CO, which was unfortunately not available during this period. CO was measured at PML during May–July 2017 using a combination of gas chromatography and chemical sensors by the University of York. Averaged to daily bins, these measurements agreed within ∼10 % in the mean with CO measured from the Defra air quality monitoring station in Cardiff during the same period when winds were from the southwest (Katie Read, personal communications, 2018). Furthermore, the Copernicus Atmospheric Monitoring Service (CAMS) analysis of CO (Inness et al., 2015), constrained by satellite columns as well as in situ CO measurements, generally does not show a large difference in surface CO mixing ratio between Plymouth and Cardiff. This is not surprising because these two maritime cities both face the Atlantic to the southwest and are only about 150 km apart.
We subtract CO measured at Cardiff during August–September 2016 from TOC+CO to yield TOC. Doing so is likely only reasonable during southwesterly conditions. TOC+CO from this ocean sector had a mean (SE) of 79 (7) ppb in our measurements, while CO at Cardiff during these conditions averaged 60 (SE of 2) ppb. This implies a mean TOC mixing ratio of about 19 ppb C in marine air (with a minimum uncertainty of 8 ppb). Our estimate is within the range of previous observations. Roberts et al. (1998) reported a median TOC mixing ratio of 55 ppb C from the city of Boulder, Colorado, and 11 ppb C from the remote Chebogue Point, Nova Scotia. Chung et al. (2003) measured TOC mixing ratios of several hundred parts per billion of carbon from polluted areas of California.
To minimize local land influence, we focus on air masses coming off the Atlantic Ocean. The UK Met Office's NAME dispersion model (Jones et al., 2007) was used to produce a footprint of the air arriving at the station every 3 h. The residence time over the 5-day journey of air masses over a series of geographical regions was calculated and then converted into percentage relative residence times out of the whole domain. As shown in Fig. 7c, TOC+CO decreased with increasing Atlantic influence in the mean. In Atlantic-dominated (>80 % relative residence time) air masses, TOC+CO had a mean (median, SE) of 81 (65, 8) ppb C, while CO had a mean (median, SE) of 58 (51, 2) ppb. This implies that TOC in Atlantic-dominated air masses averaged 23 ppb C, similar to the statistics selected by the southwest wind sector. In contrast, in air masses dominated by mainland Europe and the English Channel (>50 % relative residence time), TOC+CO had a mean (median) of 198 (191) ppb C (Fig. 7d). Examples of these two types of air masses as well as the regional map used for the air mass classification are shown in Figs. S1–S3 in the Supplement.
During the 1.5-month study, the PTR-MS was used to measure a large range of organic gases over 22 days. The total mixing ratio of speciated organic carbon, Sum(VOC), is shown in Fig. 8, which averaged 15 ppb C. Sum(VOC) was higher during weekdays (mean ± standard error of 16.0±0.4 ppb C) than on weekends (mean ± standard error of 14.3±0.4 ppb C), but this difference is much less drastic than in the case of TOC+CO. This suggests that the significantly elevated TOC+CO during the weekday daytime was largely due to compounds that were not measured by the PTR-MS (e.g., CO, small alkanes, or alkenes).
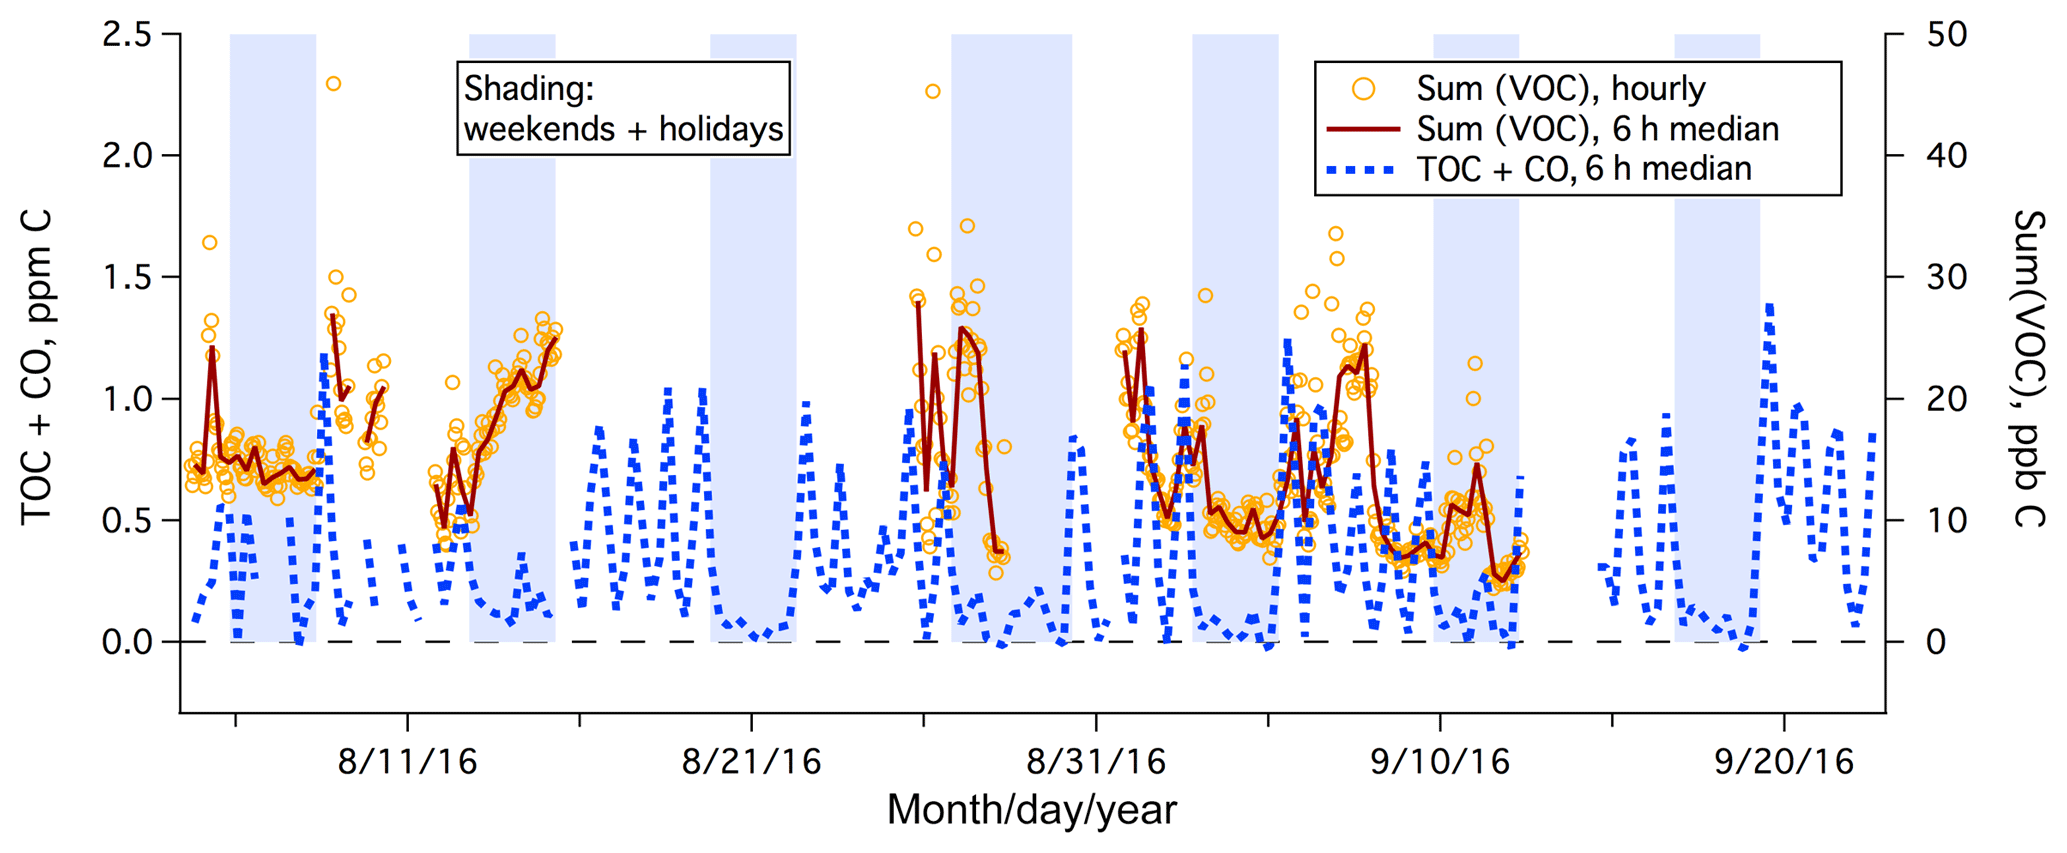
Figure 8Time series of TOC+CO and Sum(VOC) from the rooftop of Plymouth Marine Laboratory. Sum(VOC) is shown as hourly mean and 6 h median, while for clarity TOC+CO is shown as the 6 h median only.
Sum(VOC) was dominated by OVOCs (here methanol, acetone, acetaldehyde, ethanol, propanol/acetic acid), consistent with Lewis et al. (2005) and Heald et al. (2008) (Fig. 6b). Aromatic compounds (benzene, toluene, xylenes) were more abundant when winds were from land (northwest to northeast), as expected from anthropogenic emissions. Similarly, mixing ratios of biogenic VOCs (isoprene and monoterpenes) were higher when winds were from the northwest to northeast in comparison to from the south and southwest. Among detected VOCs, only DMS mixing ratio was higher in marine air than in continental air. Similar to TOC+CO, Sum(VOC) showed the lowest value when winds were from the sea (∼12 ppb C during southwesterly conditions). In comparison, in the synthesis by Heald et al. (2008) the sum of speciated organic compounds was about 8, 14, and 18 ppb C at Trinidad Head (California), Azores, and Chebogue Point (2004 measurements), respectively. Our mean Sum(VOC) is within the range of those coastal observations, which were generally more comprehensive than just the PTR-MS measurements here. Interestingly, the approximate carbon fraction of total VOCs (i.e., carbon mass : total mass) was also the lowest when winds were from the sea. This indicates that VOCs in marine air on average contain more non-carbon functional groups (e.g., nitrogen, sulfur).
Sum(VOC) correlated positively with TOC+CO in the mean (Fig. 9) when limiting data to weekends and weekday nights only. Similar to Fig. 7, the degree of correlation here is heavily influenced by the random noise in the TOC+CO measurement. The r2 value between TOC+CO and Sum(VOC) is 0.12 for the hourly average (N=299), 0.20 for the 6 h average (N=61), and 0.91 for the bin average as shown in Fig. 9 (N=6). All of these correlations are highly significant at the 95 % confidence level according to a t test. Bin averaging helps to remove most of the random noise in order to more clearly demonstrate the mean relationship.
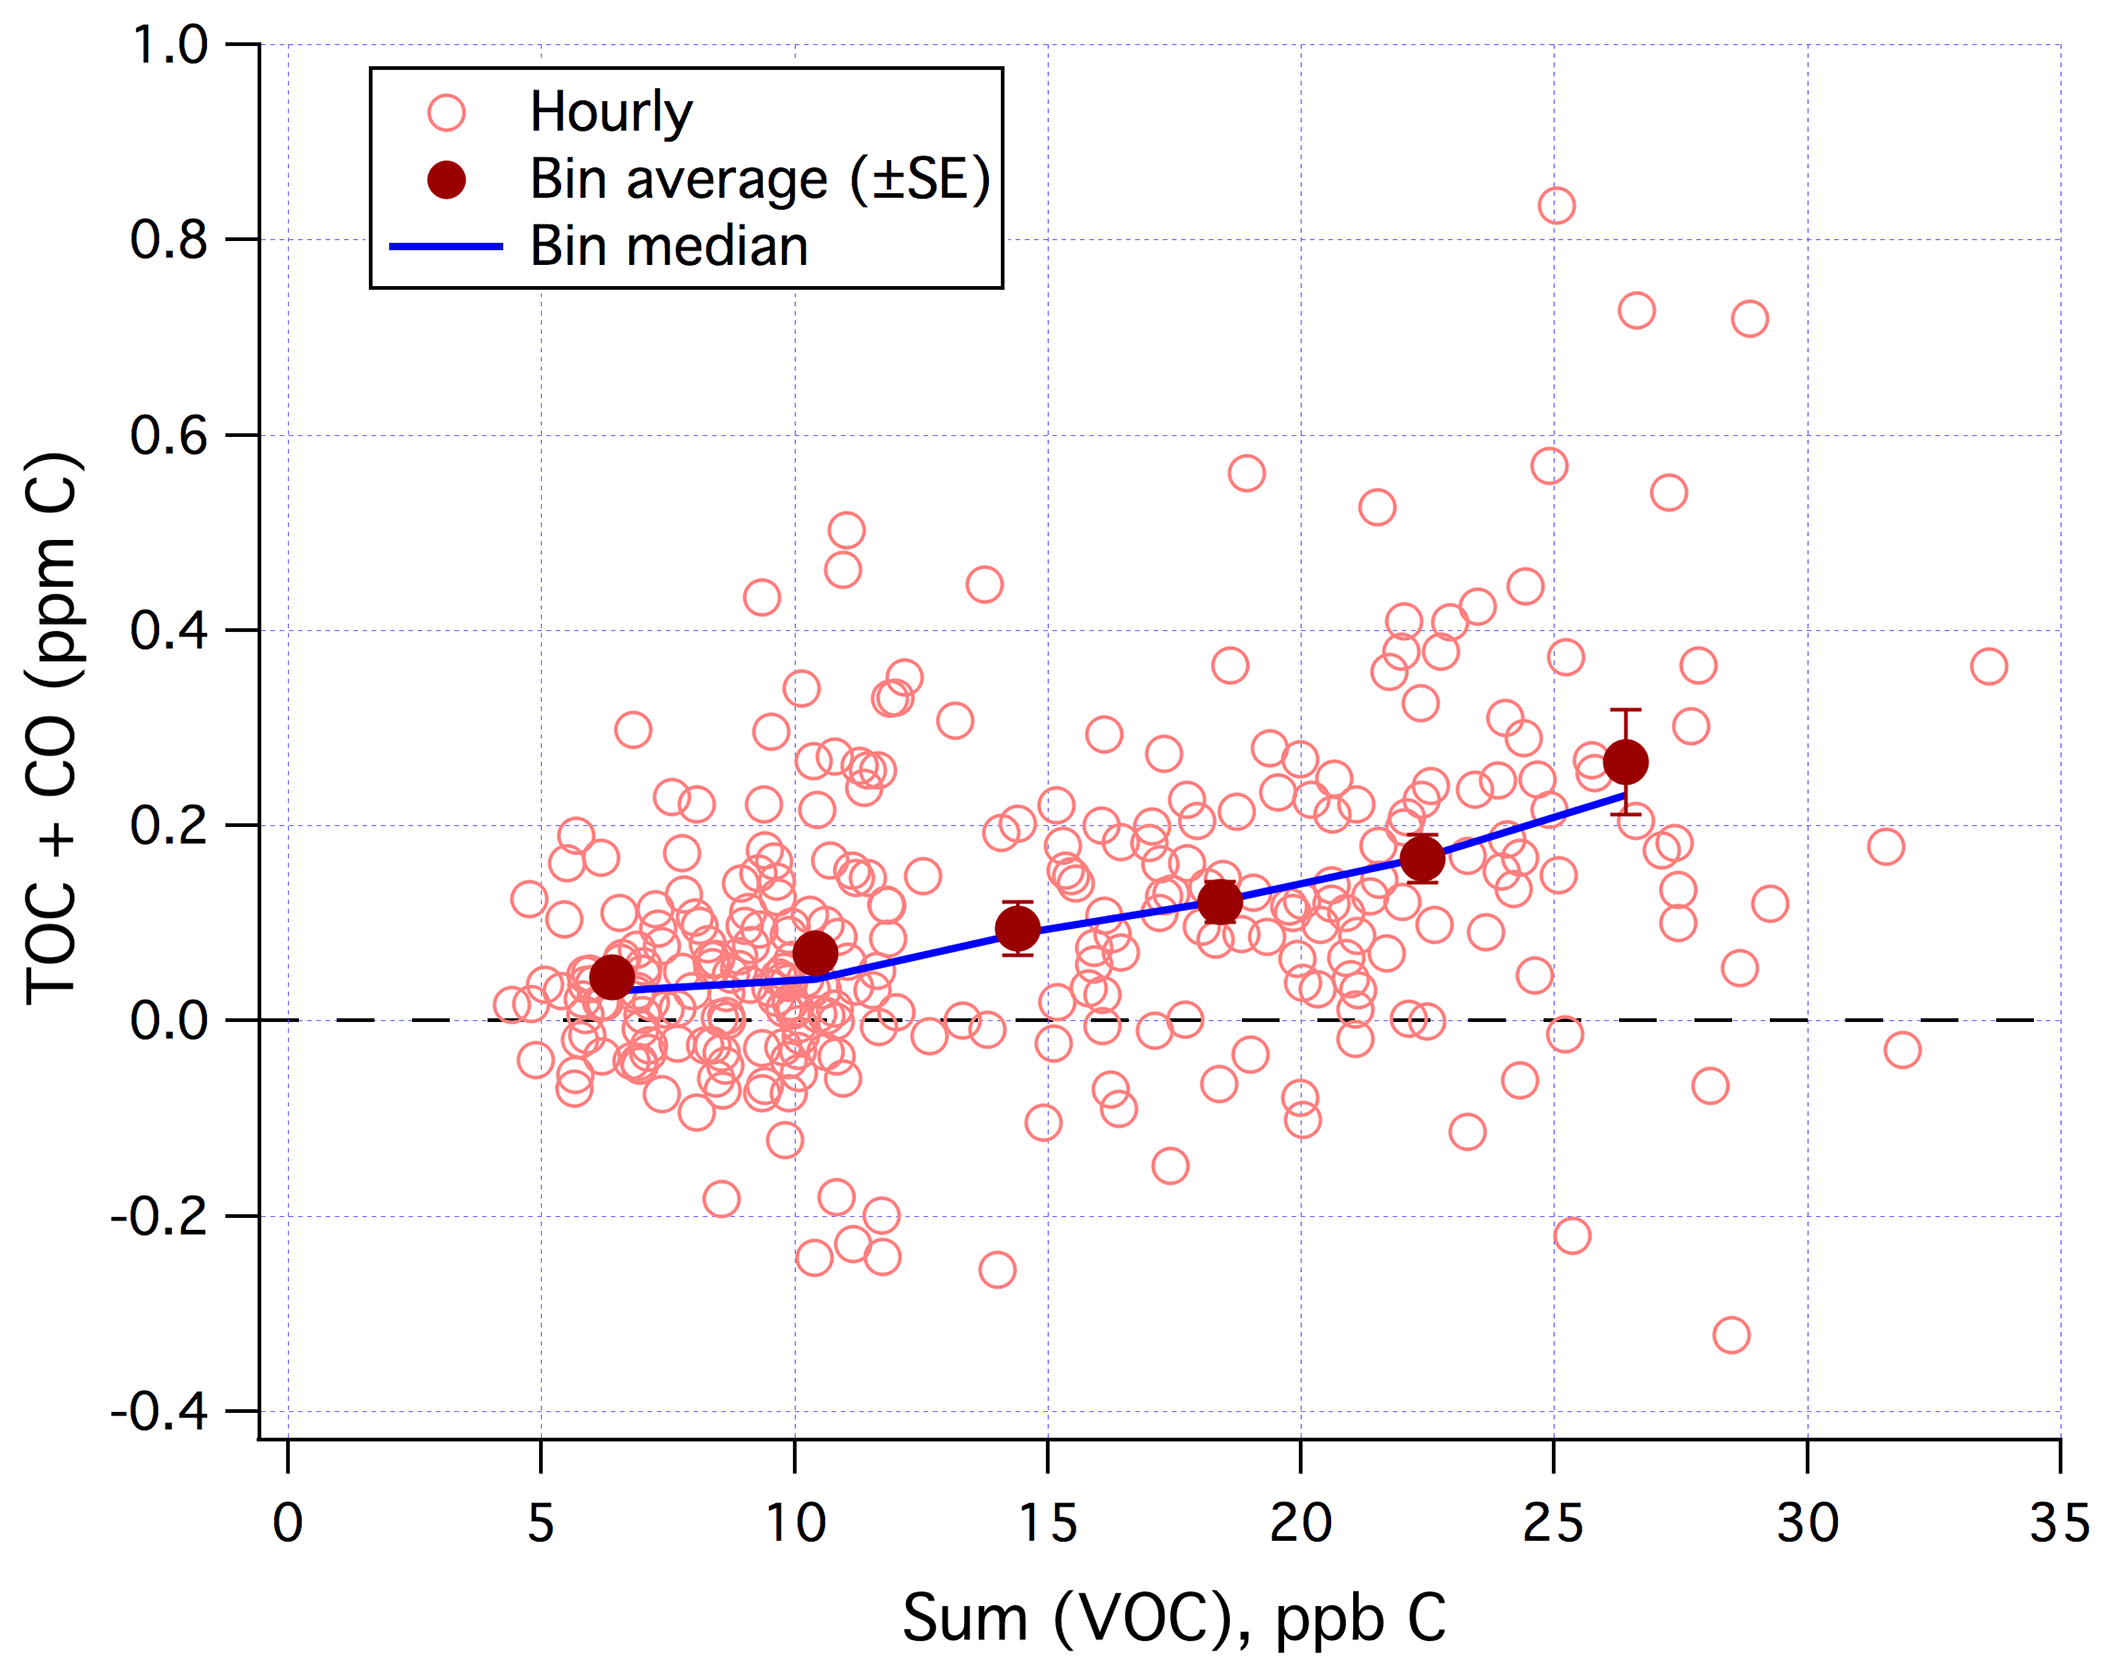
Figure 9TOC+CO correlated positively with Sum(VOC). Hourly data limited to weekends and weekday nights only.
The mean diurnal cycles of the estimated TOC and Sum(VOC) in Atlantic-dominated air masses and during weekends–holidays are shown in Fig. 10. In this subset of data (131 h total), Sum(VOC) shows essentially no diurnal variability. The TOC estimate is much noisier, with a suggestion of higher mixing ratios in the early afternoon. The minima in TOC at around 09:00 and 17:00 UTC are possibly artifacts – due to residual traffic signals in the Cardiff CO data despite the Atlantic air mass selection. While the average TOC is nearly twice the Sum(VOC) for Atlantic-dominated air masses and during weekends–holidays, TOC and Sum(VOC) differ by less than 2 times the SE of the TOC signal, implying that the two measurements are not significantly different. Comparing TOC with Sum(VOC) in the clean background marine air, partly necessitated here by our lack of in situ CO observations, challenges the signal-to-noise ratio of the TOC measurement. We expect such a comparison to be more insightful in environments with a higher TOC burden. Nevertheless, we know that the PTR-MS with a hydronium ion source is not suitable for detecting many VOCs, such as low-molecular-weight hydrocarbons that are expected to make up most of the primary anthropogenic organic emissions. Below we examine the magnitudes of some nominally abundant VOCs in marine air that were not measured by the PTR-MS.
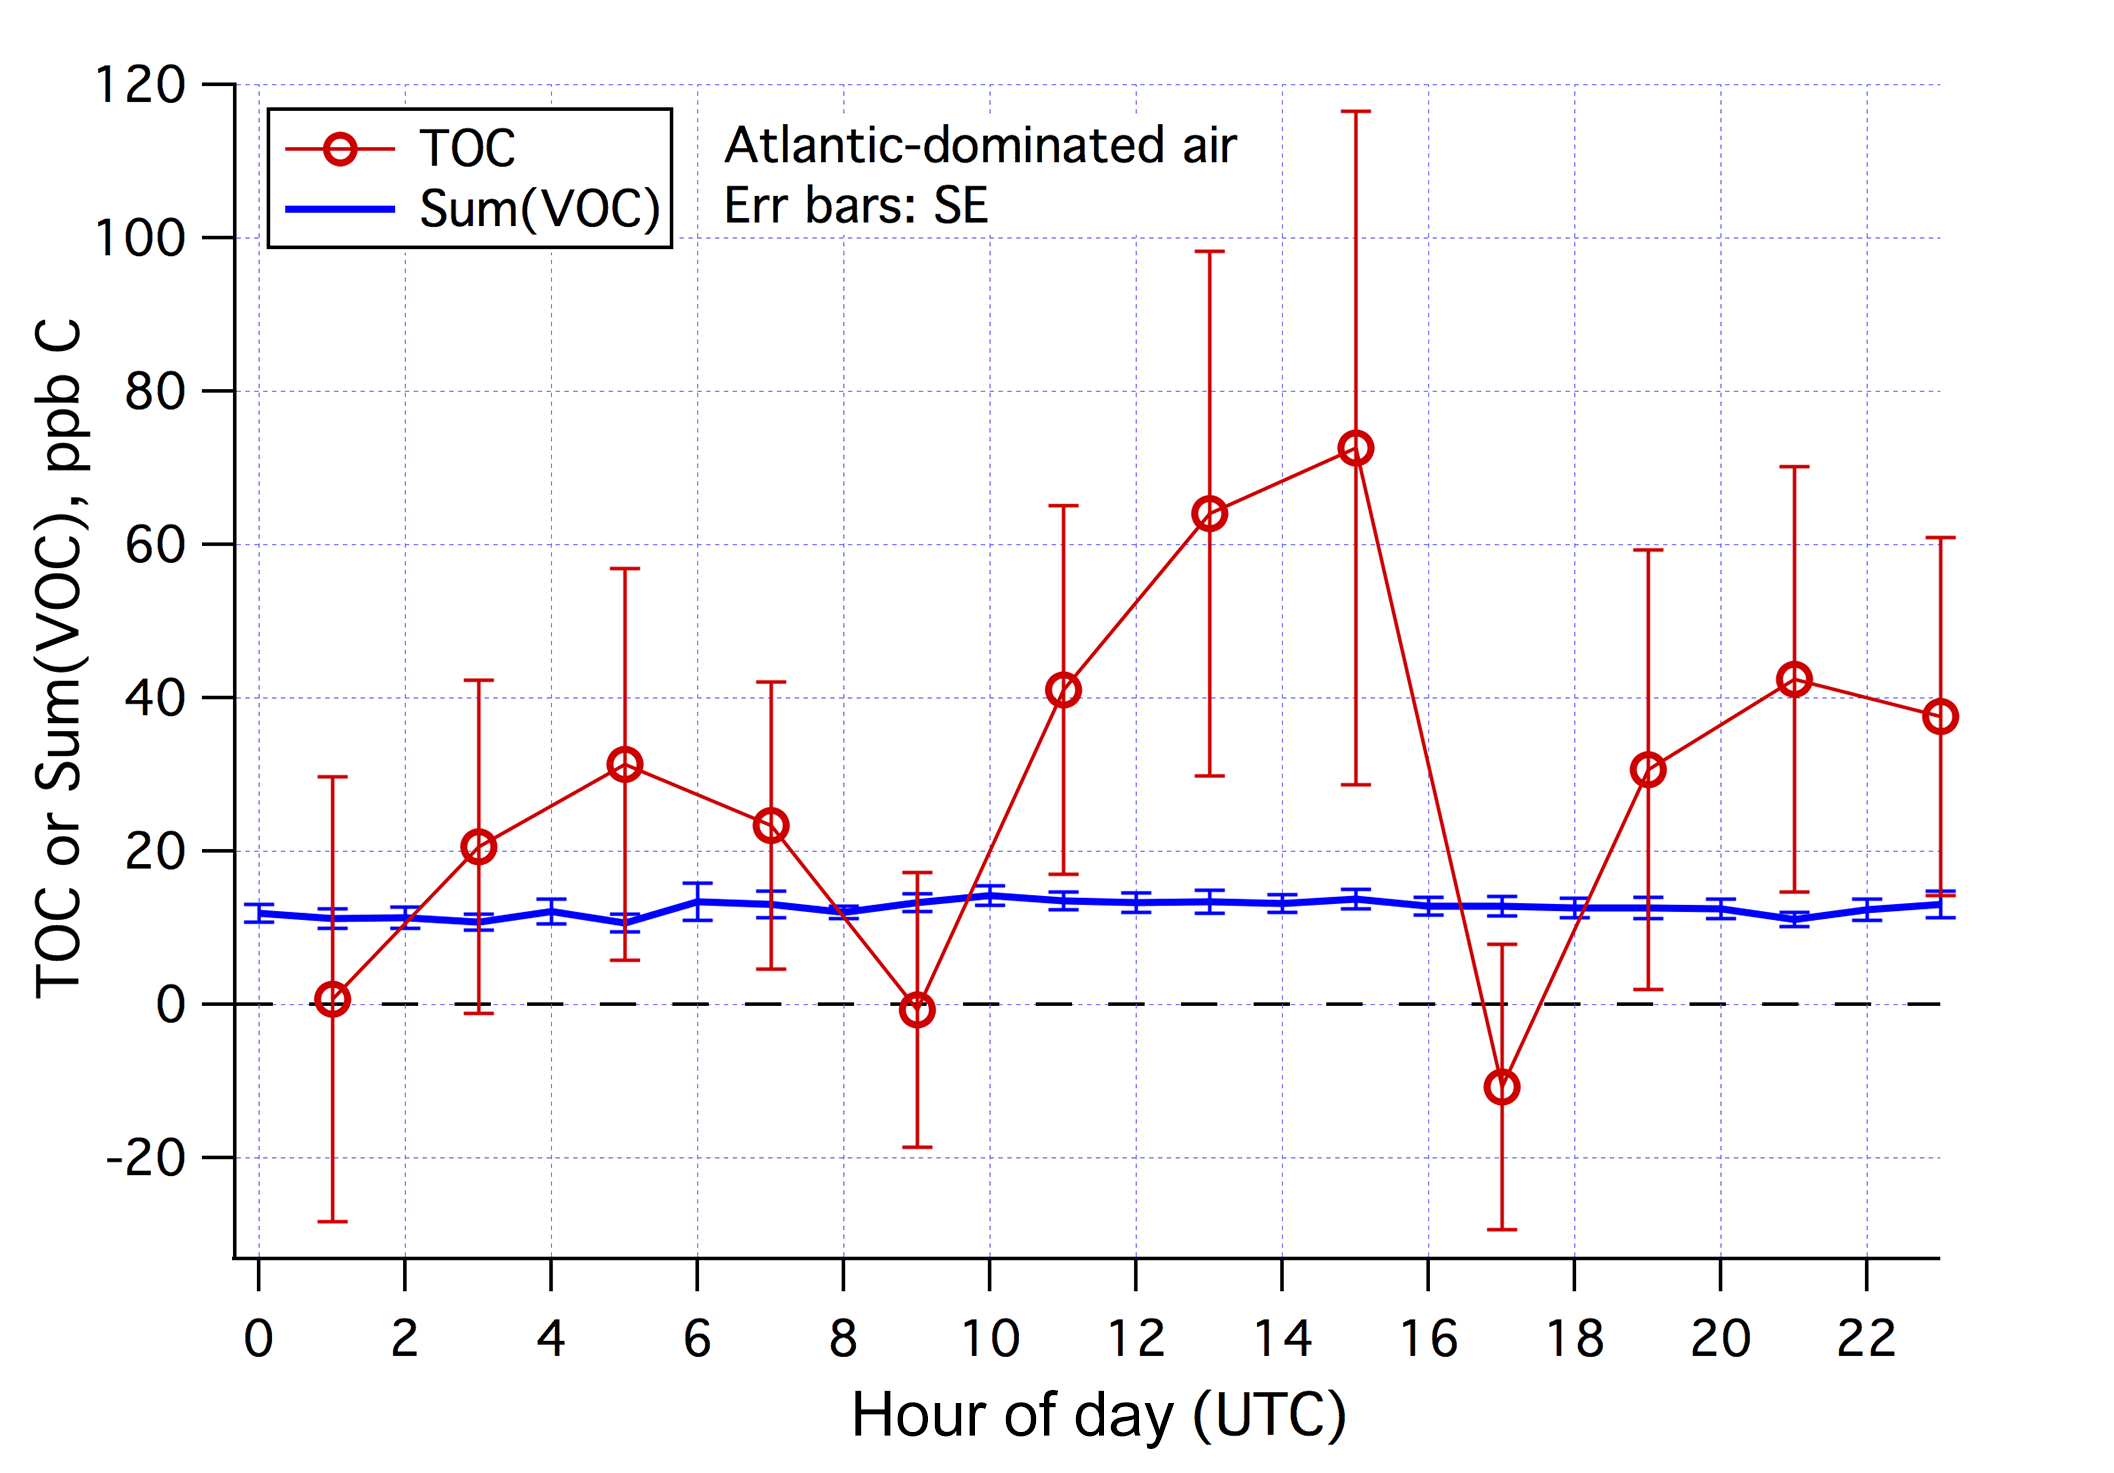
Figure 10Averaged diurnal cycles in Sum(VOC) and estimated TOC in Atlantic-dominated air masses and during weekends–holidays. Error bars indicate standard error.
Formaldehyde (HCHO), the most abundant aldehyde in the atmosphere, was measured at PML's PPAO from the spring of 2015 to the beginning of 2016 using multiaxis differential optical absorption spectroscopy (MAX-DOAS). During southwesterly conditions the surface mixing ratio of HCHO was about 0.5 ppb C (Johannes Lampel, personal communication, 2016). Non-methane hydrocarbons, such as alkanes, have large seasonal variability in temperate regions, with significantly lower abundance in the summertime due to greater OH destruction. Grant et al. (2011) reported long-term time series measurements of hydrocarbons from Mace Head. For the months of August and September from 2005 to 2009, the mean mixing ratios of ethane and propane were about 2 and <0.3 ppb C during maritime conditions, respectively. Grant et al. (2011) also measured (i- and n-) butane and (i- and n-) pentane, which were of even lower abundance. Salisbury et al. (2001) reported the mixing ratios of a large range of alkenes from Mace Head. The most abundant alkenes, ethene and propene, had mean mixing ratios of about 0.05 and 0.06 ppb C, respectively. Acetylene, the simplest alkyne, has a mixing ratio of ∼0.5 ppb C over the Atlantic (Xiao et al., 2007). The ocean is a source of a host of halocarbons. Among these, chloromethane (CH3Cl) is the most abundant, with a mixing ratio of the order of 0.5 ppb C in the marine boundary layer (Yokouchi et al., 2013). Together these organic gases make up approximately 5 ppb C.
Because of the high temperature and oxidative conditions in the catalyst, we expect some organic aerosols and semi-volatile species to be oxidized and detected as CO2. Particulate matter less than 2.5 µm (PM2.5) in the city center of Plymouth, also from the Defra Air Quality Monitoring station, was about 6 µg m−3 during this period when winds were from the southwest. If we assume that half of the PM2.5 was made up of carbon by mass (most likely an overestimate for this region; e.g., Morgan et al., 2010), the aerosol contribution to TOC could be up to 6 ppb C (or a third of TOC). Heald et al. (2008) reported that organic aerosols only accounted for 4 %–16 % of total speciated organics (gases plus aerosols) in the marine atmosphere. Overall, considering the aforementioned VOCs and organic aerosols that were not detected by the PTR-MS, there does not appear to be a substantial missing term in the TOC mass budget.
In this paper we report a relatively novel and simple method to measure the mixing ratios of total organic carbon (TOC) and carbon monoxide in the atmosphere at a high frequency. Based on essentially complete oxidation of organics in bulk air to CO2 in a platinum catalyst, our method shows very low sensitivity towards ambient humidity, avoids the complexities associated with trapping and desorption, and has an hourly precision of as low as 8 ppb C. Due to the use of a long, unheated Teflon inlet tube, the semi-volatile and particulate organics were likely not well represented in the measurements presented here. A simple improvement to this measurement system would be to minimize the length of the inlet tube before the catalyst. Future measurements with and without an aerosol filter and a heated inlet should enable the semi-volatile and particulate fractions of TOC to be better separated from the VOCs.
The estimated TOC from a polluted marine environment is compared to the sum of speciated VOCs here. Accounting for literature values of unmeasured VOCs and organic aerosols, there does not appear to be a significant undetected fraction of organics in marine air. A more rigorous examination of the atmospheric organic carbon closure requires concurrent measurements of TOC, CO, and a comprehensive range of speciated organic compounds. Additional measurements of total OH reactivity would bridge the gap between organic burden and composition with oxidative capacity. With recent advances in mass spectrometry that are able to resolve ever more organic species (Hunter et al., 2017) as well as in chemical transport modeling (Safieddine et al., 2017), the stage seems set for closing the atmospheric organic budget.
Ozone observation from the Penlee Point Observatory was mostly funded by the NERC project (NE/N018044/1). These data are archived at the Centre for Environmental Data Analysis (CEDA): http://catalogue.ceda.ac.uk/uuid/8f1ff8ea77534e08b03983685990a9b0 (last access: 4 January 2019; Yang, 2017). DEFRA air quality monitoring data can be found at https://uk-air.defra.gov.uk/ (last access: 4 January 2019). The TOC and PTR-MS measurements were based on unfunded work. Interested readers can contact the corresponding author directly for the dataset.
The supplement related to this article is available online at: https://doi.org/10.5194/acp-19-459-2019-supplement.
MY designed the TOC measurement system, carried out the field observations, and performed the data analysis. ZLF led the air mass trajectory and dispersion modeling as well as the interpretation of those modeling results.
The authors declare that they have no conflict of interest.
This work is a contribution to the NERC project ACSIS (The North Atlantic
Climate System Integrated Study; NE/N018044/1). We thank Katie Read
(University of York) for CO measurements at PML; Marios Panagi (University of
Leicester) for creating the regional map used for air mass classification;
Charel Wohl and Daniel Phillips (PML) for calibration of the PTR-MS;
Frances Hopkins, Thomas Bell, Philip Nightingale, and Tim Smyth (PML) for
operational support; Andrew Rees and Ian Brown (PML) for the use of NOAA gas
standards; Margaret Yelland and Robin Pascal (National Oceanography Centre)
for letting us use the Picarro instrument; and Tim Bertram (U. Wisconsin) for
helpful discussions. Finally, we thank the anonymous reviewers for their
comments on the first iteration of this paper. Thanks to the Met Office for
use of the NAME model and the STFC JASMIN computer for hosting the
model.
Edited by: Andreas
Hofzumahaus
Reviewed by: two anonymous referees
Ammoura, L., Xueref-Remy, I., Gros, V., Baudic, A., Bonsang, B., Petit, J.-E., Perrussel, O., Bonnaire, N., Sciare, J., and Chevallier, F.: Atmospheric measurements of ratios between CO2 and co-emitted species from traffic: a tunnel study in the Paris megacity, Atmos. Chem. Phys., 14, 12871–12882, https://doi.org/10.5194/acp-14-12871-2014, 2014.
Andreae, M. O. and Merlet, P.: Emission of trace gases and aerosols from biomass burning, Global Biogeochem. Cy., 15, 955–966, https://doi.org/10.1029/2000GB001382, 2001.
Chung, M. Y., Maris, C., Krischke, U., Ho, A. W., and Paulson, S. E.: An investigation of the relationship between total non-methane organic carbon and the sum of speciated hydrocarbons and carbonyls measured by standard GC/FID: measurements in the Los Angeles air basin, Atmos. Environ., 37, 159–170, https://doi.org/10.1016/S1352-2310(03)00388-1, 2003.
Dachs, J., Calleja, M. L., Duarte, C. M., Del Vento, S., Turpin, B., Polidori, A., Herndl, G. J., and Agustí, S.: High atmosphere-ocean exchange of organic carbon in the NE subtropical Atlantic, Geophys. Res. Lett., 32, L21807, https://doi.org/10.1029/2005GL023799, 2005.
Forster, G. L., Upstill-Goddard, R. C., Gist, N., Robinson, R., Uher, G., and Woodward, E. M. S.: Nitrous oxide and methane in the Atlantic Ocean between 501N and 521S: Latitudinal distribution and sea-to-air flux, Deep-Sea Res. Pt. II, 56, 964–976, https://doi.org/10.1016/j.dsr2.2008.12.002, 2009.
Goldstein, A. and Galbally, I.: Known and unexplored organic constituents in the Earth's atmosphere, Environ. Sci. Technol., 40, 1514–1521, 2007.
Grant, A., Yates, E. L., Simmonds, P. G., Derwent, R. G., Manning, A. J., Young, D., Shallcross, D. E., and O'Doherty, S.: A five year record of high-frequency in situ measurements of non-methane hydrocarbons at Mace Head, Ireland, Atmos. Meas. Tech., 4, 955–964, https://doi.org/10.5194/amt-4-955-2011, 2011.
Guenther, A. B., Jiang, X., Heald, C. L., Sakulyanontvittaya, T., Duhl, T., Emmons, L. K., and Wang, X.: The Model of Emissions of Gases and Aerosols from Nature version 2.1 (MEGAN2.1): an extended and updated framework for modeling biogenic emissions, Geosci. Model Dev., 5, 1471–1492, https://doi.org/10.5194/gmd-5-1471-2012, 2012.
Hackenberg, S. C., Andrews, S. J., Airs, R., Arnold, S. R., Bouman, H. A., Brewin, R. J. W., Chance, R. J., Cummings, D., Dall'Olmo, G., Lewis, A. C., Minaeian, J. K., Reifel, K. M., Small, A., Tarran, G. A., Tilstone, G. H., and Carpenter, L. J.: Potential controls of isoprene in the surface ocean, Global Biogeochem. Cy., 31, 644–662, https://doi.org/10.1002/2016GB005531, 2017.
Hauser, E. J., Dickhut, R. M., Falconer, R., and Wosniak, A. S.: Improved method for quantifying the air-sea flux of volatile and semi-volatile organic carbon, Limnol. Oceanogr.-Meth., 11, 287–297, https://doi.org/10.4319/lom.2013.11.287, 2013.
Heald, C. L., Goldstein, A. H., Allan, J. D., Aiken, A. C., Apel, E., Atlas, E. L., Baker, A. K., Bates, T. S., Beyersdorf, A. J., Blake, D. R., Campos, T., Coe, H., Crounse, J. D., DeCarlo, P. F., de Gouw, J. A., Dunlea, E. J., Flocke, F. M., Fried, A., Goldan, P., Griffin, R. J., Herndon, S. C., Holloway, J. S., Holzinger, R., Jimenez, J. L., Junkermann, W., Kuster, W. C., Lewis, A. C., Meinardi, S., Millet, D. B., Onasch, T., Polidori, A., Quinn, P. K., Riemer, D. D., Roberts, J. M., Salcedo, D., Sive, B., Swanson, A. L., Talbot, R., Warneke, C., Weber, R. J., Weibring, P., Wennberg, P. O., Worsnop, D. R., Wittig, A. E., Zhang, R., Zheng, J., and Zheng, W.: Total observed organic carbon (TOOC) in the atmosphere: a synthesis of North American observations, Atmos. Chem. Phys., 8, 2007–2025, https://doi.org/10.5194/acp-8-2007-2008, 2008.
Hunter, J. F., Day, D. A., Palm, B. B., Yatavelli, R. L. N., Chan, A. W. H., Kaser, L., Cappellin, L., Hayes, P. L., Cross, E. S., Carrasquillo, A. J., Campuzano-Jost, P., Stark, H., Zhao, Y., Hohaus, T., Smith, J. N., Hansel, A.., Karl, T., Goldstein, A. H., Guenther, A., Worsnop, D. R., Thornton, J. A., Heald, C. L., Jimenez, J. L., and Kroll, J. H.: Comprehensive characterization of atmospheric organic carbon at a forested site, Nat. Geosci., 10, 748–753, https://doi.org/10.1038/ngeo3018, 2017.
Inness, A., Blechschmidt, A.-M., Bouarar, I., Chabrillat, S., Crepulja, M., Engelen, R. J., Eskes, H., Flemming, J., Gaudel, A., Hendrick, F., Huijnen, V., Jones, L., Kapsomenakis, J., Katragkou, E., Keppens, A., Langerock, B., de Mazière, M., Melas, D., Parrington, M., Peuch, V. H., Razinger, M., Richter, A., Schultz, M. G., Suttie, M., Thouret, V., Vrekoussis, M., Wagner, A., and Zerefos, C.: Data assimilation of satellite-retrieved ozone, carbon monoxide and nitrogen dioxide with ECMWF's Composition-IFS, Atmos. Chem. Phys., 15, 5275–5303, https://doi.org/10.5194/acp-15-5275-2015, 2015.
Isaacman-VanWertz, G., Massoli, P., O'Brien, R., Lim, C., Franklin, J. P., Moss, J. A., Hunter, J. F., Nowak, J. B., Canagaratna, M. R., Misztal, P. K., Arata, C., Roscioli, J. R., Herndon, S. T., Onasch, T. B., Lambe, A. T., Jayne, J. T., Su, L., Knopf, D. A., Goldstein, A. H., Worsnop, D. R., and Kroll, J. H.: Chemical evolution of atmospheric organic carbon over multiple generations of oxidation, Nat. Chem., 10, 462–468, https://doi.org/10.1038/s41557-018-0002-2, 2018.
Jones, A. R., Thomson, D. J., Hort, M., and Devenish, B.: The UK Met Office's next-generation atmospheric dispersion model, in: NAME III. Air Pollution Modeling and Its Application XVII, edited by: Borrego, C. and Norman, A.-L., 580–589, Springer, New York, 2007.
Jurado, E., Dachs, J., Carlos, C. M., and Simo, R.: Atmospheric deposition of organic and black carbon to the global oceans, Atmos. Environ., 42, 7931–7939, https://doi.org/10.1016/j.atmosenv.2008.07.029, 2008.
Kroll, J. H., Donahue, N. M., Jimenez, J. L., Kessler, S. H., Canagaratna, M. R., Wilson, K. R., Altieri, K. E., Mazzoleni, L. R., Wozniak, A. S., Bluhm, H., Mysak, E. R., Smith, J. D., Kolb, C. E., and Worsnop, D. R.: Carbon oxidation state as a metric for describing the chemistry of atmospheric organic aerosol, Nat. Chem., 3, 133–139, https://doi.org/10.1038/nchem.948, 2011.
Lana, A., Bell, T. G., Simó, R., Vallina, S. M., Ballabrera-Poy, J., Kettle, A. J., Dachs, J., Bopp, L., Saltzman, E. S., Stefels, J., Johnson, J. E., and Liss, P. S.: An updated climatology of surface dimethylsulfide concentrations and emission fluxes in the global ocean, Global Biogeochem. Cy., 25, GB1004, https://doi.org/10.1029/2010GB003850, 2011.
Lewis, A. C., Hopkins, J. R., Carpenter, L. J., Stanton, J., Read, K. A., and Pilling, M. J.: Sources and sinks of acetone, methanol, and acetaldehyde in North Atlantic marine air, Atmos. Chem. Phys., 5, 1963–1974, https://doi.org/10.5194/acp-5-1963-2005, 2005.
Maris, C., Chung, M. Y., Lueb, R., Krischke, U., Meller, R., Fox, M. J., and Paulson, S. E.: Development of instrumentation for simultaneous analysis of total non-methane organic carbon and volatile organic compounds in ambient air, Atmos. Environ., 37, S149–S158, 2003.
Morgan, W. T., Allan, J. D., Bower, K. N., Highwood, E. J., Liu, D., McMeeking, G. R., Northway, M. J., Williams, P. I., Krejci, R., and Coe, H.: Airborne measurements of the spatial distribution of aerosol chemical composition across Europe and evolution of the organic fraction, Atmos. Chem. Phys., 10, 4065–4083, https://doi.org/10.5194/acp-10-4065-2010, 2010.
Nolscher, A. C., Yanez-Serrano, A. M., Wolff, S., de Araujo, A. C., Lavric, J. V., Kesselmeier, J., and Williams J.: Unexpected seasonality in quantity and composition of Amazon rainforest air reactivity, Nat. Commun., 7, 10383–10394, 2016.
Paulson, S. E., Maris, C., Krischke, U., and Chung, M. Y.: An investigation of the relationship between total non-methane organic carbon and the sum of speciated hydrocarbons and carbonyls measured by standard GC/FID: validation and refinement of a new instrument, and measurements in the South Coast Air Basin, California Air Resources Board, Agreement No. 98–323, 2002.
Read, K., Carpenter, L., Arnold, S., Beale, R., Nightingale, P., Hopkins, J., Lewis, A., Lee, J., Mendes, L., and Pickering, S.: Multiannual Observations of Acetone, Methanol, and Acetaldehyde in Remote Tropical Atlantic Air: Implications for Atmospheric OVOC Budgets and Oxidative Capacity, Environ. Sci. Technol., 46, 11028–11039, 2012.
Roberts, J. M., Bertman, S. B., Jobson, T., Niki, H., and Tanner R.: Measurement of total nonmethane organic carbon (Cy): Development and application at Chebogue Point, Nova Scotia, during the 1993 North Atlantic Regional Experiment campaign, J. Geophys. Res., 103, 13581–13592, https://doi.org/10.1029/97JD02240, 1998.
Ruiz-Halpern, S., Sejr, M. K., Duarte, C. M., Krause-Jensen, D., Dalsgaard, T., Dachs, J., and Rysgaardd, S.: Air–water exchange and vertical profiles of organic carbon in a subarctic fjord, Limnol. Oceanogr., 55, 1733–1740, 2010.
Ruiz-Halpern, S., Calleja, M. Ll., Dachs, J., Del Vento, S., Pastor, M., Palmer, M., Agustí, S., and Duarte, C. M.: Ocean–atmosphere exchange of organic carbon and CO2 surrounding the Antarctic Peninsula, Biogeosciences, 11, 2755–2770, https://doi.org/10.5194/bg-11-2755-2014, 2014.
Salisbury, G., Rickard, A. R., Monks, P. S., Allan, B. J., Bauguitte, S., Penkett, S. A., Carslaw, N., Lewis, A. C., Creasey, D. J., Heard, D. E., Jacobs, P. J., and Lee, J. D.: Production of peroxy radicals at night via reactions of ozone and the nitrate radical in the marine boundary layer, J. Geophys. Res., 106, 12669–12687, https://doi.org/10.1029/2000JD900754, 2001.
Safieddine, S. A., Heald, C. L., and Henderson, B. H.: The global nonmethane reactive organic carbon budget: A modeling perspective, Geophys. Res. Lett., 44, 3897–3906, https://doi.org/10.1002/2017GL072602, 2017.
Schlundt, C., Tegtmeier, S., Lennartz, S. T., Bracher, A., Cheah, W., Krüger, K., Quack, B., and Marandino, C. A.: Oxygenated volatile organic carbon in the western Pacific convective center: ocean cycling, air–sea gas exchange and atmospheric transport, Atmos. Chem. Phys., 17, 10837–10854, https://doi.org/10.5194/acp-17-10837-2017, 2017.
Schwarz, K., Filipiak, W., and Amann, A.: Determining concentration patterns of volatile compounds in exhaled breath by PTR-MS, J. Breath Res., 3, 1–15, 2009.
Seinfeld, J. H. and Pandis, S. N.: Atmospheric chemistry and physics: from air pollution to climate change, 2nd Edn., Wiley-Interscience, Hoboken, New Jersey, USA, 2006.
Stockwell, C. E., Kupc, A., Witkowski, B., Talukdar, R. K., Liu, Y., Selimovic, V., Zarzana, K. J., Sekimoto, K., Warneke, C., Washenfelder, R. A., Yokelson, R. J., Middlebrook, A. M., and Roberts, J. M.: Characterization of a catalyst-based conversion technique to measure total particulate nitrogen and organic carbon and comparison to a particle mass measurement instrument, Atmos. Meas. Tech., 11, 2749–2768, https://doi.org/10.5194/amt-11-2749-2018, 2018.
Tani, A., Hayward, S., Hansel, A., and Hewitt, C. N.: Effect of water vapour pressure on monoterpene measurements using proton transfer reaction-mass spectrometry (PTR-MS), Int. J. Mass Spectrom., 239, 161–169, 2004.
Veres, P., Gilman, J. B., Roberts, J. M., Kuster, W. C., Warneke, C., Burling, I. R., and de Gouw, J.: Development and validation of a portable gas phase standard generation and calibration system for volatile organic compounds, Atmos. Meas. Tech., 3, 683–691, https://doi.org/10.5194/amt-3-683-2010, 2010.
Wang, Y., Munger, J. W., Xu, S., McElroy, M. B., Hao, J., Nielsen, C. P., and Ma, H.: CO2 and its correlation with CO at a rural site near Beijing: implications for combustion efficiency in China, Atmos. Chem. Phys., 10, 8881–8897, https://doi.org/10.5194/acp-10-8881-2010, 2010.
Xiao, Y., Jacob, D. J., and Turquety, S.: Atmospheric acetylene and its relationship with CO as an indicator of airmass age, J. Geophys. Res., 112, D12305, https://doi.org/10.1029/2006JD008268, 2007.
Yang, M.: 2017 Penlee Point Atmospheric Observatory: Meteorological and chemical observations 2014–present, Centre for Environmental Data Analysis, Plymouth Marine Laboratory, available at: http://catalogue.ceda.ac.uk/uuid/8f1ff8ea77534e08b03983685990a9b0 (last access: 4 January 2019), 2017.
Yang, M., Beale, R., Smyth, T., and Blomquist, B.: Measurements of OVOC fluxes by eddy covariance using a proton-transfer-reaction mass spectrometer – method development at a coastal site, Atmos. Chem. Phys., 13, 6165–6184, https://doi.org/10.5194/acp-13-6165-2013, 2013.
Yang, M., Beale, R., Liss, P., Johnson, M., Blomquist, B., and Nightingale, P.: Air–sea fluxes of oxygenated volatile organic compounds across the Atlantic Ocean, Atmos. Chem. Phys., 14, 7499–7517, https://doi.org/10.5194/acp-14-7499-2014, 2014.
Yang, M., Bell, T. G., Hopkins, F. E., and Smyth, T. J.: Attribution of atmospheric sulfur dioxide over the English Channel to dimethyl sulfide and changing ship emissions, Atmos. Chem. Phys., 16, 4771–4783, https://doi.org/10.5194/acp-16-4771-2016, 2016.
Yokouchi, Y., Inoue, J., and Toom-Sauntry, D.: Distribution of natural halocarbons in marine boundary air over the Arctic Ocean, Geophys. Res. Lett., 40, 4086–4091, https://doi.org/10.1002/grl.50734, 2013.
Zhao, J. and Zhang, R. Y.: Proton transfer reaction rate constants between hydronium ion (H3O(+)) and volatile organic compounds, Atmos. Environ., 38, 2177–2185, 2004.