the Creative Commons Attribution 4.0 License.
the Creative Commons Attribution 4.0 License.
Characteristics of ozone and particles in the near-surface atmosphere in the urban area of the Yangtze River Delta, China
Huimin Chen
Jane Liu
Tijian Wang
Shu Li
Mengmeng Li
Pulong Chen
Ming Zhao
Aerosols and ozone have significant influences on air qualities, human health, and climate changes. To further understand the characteristics and interactions among different urban air pollutants in the west Yangtze River Delta (YRD) region, continuous measurements of low-layer atmospheric particles and trace gases have been performed at an urban site in Nanjing from September 2016 to February 2017 in this study. In the urban area of the west YRD, the mean PM10 and O3 concentrations are 86.3 µg m−3 and 37.7 ppb, respectively, with significant seasonal and diurnal variations. Particles, which are dominated by fine aerosols, are relatively scattering. And most of their optical properties have similar variations to the aerosol concentrations. Results also show that the west YRD could still suffer severe air pollution, although the seasonal mean aerosol concentrations have decreased in recent years. Even in cold seasons, O3 could exceed the National Ambient Air Quality Standards for about 40 days during the sampling period. Most of polluted episodes are caused by local and subregional emissions. A case study for a typical O3 and PM2.5 episode in December 2016 demonstrates that the episode was generally associated with regional transport and a stable weather system. Air pollutants were mostly transported from the western areas with high emissions, as well as with an anticyclone and high-pressure system in this region. Correlation analysis reveals that the interactions between O3 and PM are complex, with a combination of inhibition and promotion under different conditions. The inhibition effect might result from the reduction of photolysis frequency near the surface due to aerosols in addition to their positive correlations with precursors, while the promotion effect is from the formation of secondary aerosols under high concentrations of oxidants and solar radiation. However, the interaction between O3 and BC shows an inhibiting effect due to its chemical stability. This also indicated a VOC-sensitive regime for photochemical production of O3 in this region. This study further improves insight into the characteristics and interactions of main pollutants and may contribute to the improvement of the simulation and prediction of aerosols and gases in the urban area of the YRD.
- Article
(11227 KB) - Full-text XML
- BibTeX
- EndNote
Particles, including black carbon (BC), PM2.5, and PM10; trace gases, such as carbon monoxide (CO), ozone (O3), nitric oxide, and nitrogen dioxide (NOx); and total reactive nitrogen (NOy, which includes NOx, aerosol nitrates (), nitric acid (HNO3), N2O5, peroxyacetyl nitrate (PAN), and various nitrogen-containing organic compounds.), are important components in the troposphere because of their impacts on human health, the biosphere, and climate changes (e.g., Chameides et al., 1999a, b; Jerrett et al., 2009; Allen et al., 2012). Through long-range particle cycles, particles could interact with atmospheric trace gases from complex sources, especially ozone and its precursors, disturbing the earth's radiation budget (Sassen, 2002) or providing reactive surfaces for heterogeneous reactions (Kumar et al., 2014), which leads to a difficult problem for regional air quality (Zhang et al., 2008; van Donkelaar et al., 2010).
Over the decades, China has always been one of the major source regions of particles, with BC and dust emission accounting for up to 25 % of the global anthropogenic sources (Streets et al., 2001; Tegen and Schepanski, 2009). Relatively high levels of particle concentrations are mainly distributed in the Beijing–Tianjin–Hebei area (BTH), Yangtze River Delta (YRD), and Pearl River Delta (PRD) regions (e.g., Zhang et al., 2008, 2012; Zhang et al., 2015), along with the rapid economic development. These regions consistently have the highest emissions of anthropogenic precursors (e.g., Wang et al., 2015, 2009; Ding et al., 2013b; Zheng et al., 2010), which have led to severe region-wide air pollution. Earlier studies on particles mostly focused on concentration estimation, the chemical characteristics, potential sources, and climate effects based on numerical simulations (e.g., Wu et al., 2012; Song et al., 2014; Xiao et al., 2012; Yu et al., 2015; Kristjánsson, 2002; Liao and Seinfeld, 2005; Zhuang et al., 2010, 2013a, b, 2018). However, a better understanding of spatial and temporal variations of particles can contribute to the adoption of effective measures to reduce air pollution, and real-time monitoring data are essential to better obtain the detailed variations (seasonal, monthly, and diurnal) on the city scale. In China, the research based on PM observations, especially in the polluted regions above, has gradually expanded since 2012 due to the establishment of China's PM2.5 air quality standards and gradual developments of nationwide PM observation. The research is mainly related to the temporal and spatial distribution characteristics (e.g., Wang et al., 2015; Chen et al., 2016; Wu et al., 2012), as well as the effects of meteorological variables on aerosols (e.g., Zhang et al., 2015; Yan et al., 2016; Huang et al., 2015). In addition, many observations of BC have been made in the recent years, most of which concentrated on the analysis of the concentration level and the temporal and spatial variations (e.g., Verma et al., 2010; Y. Wang et al., 2011; Zhang et al., 2012). Some also revealed the correlations of carbonaceous aerosols (Pan et al., 2011; Zhuang et al., 2014b). Besides particles, because of the lack of nationwide O3 monitoring data in earlier years, O3 and its precursors' (NOx, NOy, CO, and VOCs) pollution situations can only be discerned from limited campaign-type measurements in certain developed regions: for instance, Beijing in the BTH area (Shao et al., 2006; Lin et al., 2008; Meng et al., 2009), Guangzhou in the PRD region (Zhang et al., 1998; Wang et al., 2003), and Lin'an in the YRD region (Luo et al., 2000; Cheung and Wang, 2001; Wang et al., 2001, 2002, 2004; Guo et al., 2004). Since 2005, the number of photochemical studies through observation data has increased in the PRD region in the south (Xue et al., 2014), the BTH area in the north (Han, 2011), and the YRD region in the east (Shi et al., 2015). However, large gaps and uncertainties remain in the knowledge of characteristics of regional particles and O3 pollution and its mitigation strategies due to the complexity of main sources, interaction between different aerosols, and changing meteorology field.
The YRD is located in the eastern part of the Yangtze River Plain, adjacent to the most polluted North China Plain, including large cities of Shanghai, southern Jiangsu, and northern Zhejiang. Taking up only 2 % of the land area in China, this region produces over 20 % of China's gross domestic product (GDP). Nanjing, as the capital of Jiangsu Province, lies in the middle to the west YRD. It covers an area over 6000 km2, with more than 7.3 million residents (http://tjj.nanjing.gov.cn/ last access: 27 March 2019). Being the second largest commercial center after Shanghai in the YRD, even in East China, Nanjing is highly urbanized and industrialized, especially the urban area. In addition, the complex monsoon and synoptic weather may play an important role in air pollution transport and formation in Nanjing. Therefore, the urban atmosphere in Nanjing is also heavily polluted by local emissions and long-distance transport of pollutants, which affects regional climate and air quality (Huang et al., 2013; Yi et al., 2015). Thus, the issue of air pollution in Nanjing deserves attention. Previous studies using observation data in Nanjing often concentrated on the characteristics of one of the particles (Deng et al., 2011; Shen et al., 2014; Zhuang et al., 2014b) or ozone and its precursors (Tu et al., 2007; Wang et al., 2008; An et al., 2015), describing the temporal and spatial distributions, as well as the influence of meteorological effects, but place less emphasis on the inter-species correlations and the combined effects of pollutants during severe pollution episodes. Ding et al. (2013) described the characteristics of O3 and PM2.5 with near-surface observation data in rural Nanjing, but the detailed characteristics in urban Nanjing are not clear enough so far.
To fill the knowledge gap, continuous online measurements of particles, trace gases, and other relevant parameters were carried out at the Gulou site in urban Nanjing about 80 m above the ground, which is an integrated measurement platform for the study of the atmospheric environment and climate change.
In this study, 6-month measurement of particles, trace gases, and other related variables at this site during September 2016–February 2017 when air pollution occurred frequently is analyzed. Our work gives a synthetic analysis about their characteristics. The emphasis of our objective is to improve insight into the characteristics, interactions of main pollutants, and the influence of integrated meteorology variables based on the observation data at an urban site above ground, as well as further investigate the possible underlying reasons and mechanisms. Firstly, an in-depth discussion on particle variations is performed, not limited to the concentrations but taking optical properties into consideration as well, to quantify the polluted level in detail. Secondly, a detailed description of O3 variations can also be found in our study, including the analysis of the main precursors as trace gases (NOx, NOy, and CO), to have general and quantitative insight into O3 pollution situations. Both of the pollutants are analyzed considering the effects of meteorology variables including but not limited to precipitation and temperature. Thirdly, analysis of inter-species correlations gives a relatively thorough overview of the interactions among various species, and deduction of the underlying chemical mechanisms based on the results of our study and previous studies is also presented in our study. Moreover, backward trajectory analysis is conducted for improving the knowledge of regional/subregional transport process in urban Nanjing. Finally, a case study for high particles and the O3 episode is the implementation to emphasize the integrated influence of the meteorological field on regional air pollution.
In the following, we describe the methodology in Sect. 2, which includes the measurement site and instruments. Results and discussions are presented in Sect. 3, consisting of overall temporal variation, correlation analysis, backward trajectory analysis, and case studies. A summary is given in Sect. 4.
2.1 Brief introduction to the Urban Atmospheric Environment Observational Station
The Urban Atmospheric Environment Observational Station is a regional atmospheric urban site located on the Gulou campus of Nanjing University in the downtown area of Nanjing (32.05∘ N, 118.78∘ E) and run by the School of Atmospheric Sciences of Nanjing University. It is built on the roof of a 79.3 m tall building, without any industrial pollution sources within a 30 km radius around but with several main roads with evident traffic pollution, especially during rush hours. The sketch map of the site (not shown) and the corresponding climatology have been described in Zhu et al. (2012).
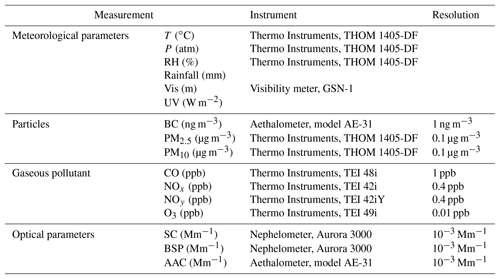
The particles, O3, NOx, NOy (including most oxides of nitrogen mentioned above with the exception of NH3 and N2O), CO, and wavelength-dependent aerosol optical parameters including aerosol scattering (σts), back-scattering (σbs), and absorption (σa) coefficients have been routinely measured at the site during the time period from September 2016 to February 2017. The σa and concentrations of BC were derived from the measurements using a seven-channel aethalometer (model AE-31, Magee Scientific, USA). The detailed calculation will be discussed below. The AE-31 model measures light attenuation (ATN) at seven wavelengths, including 370, 470, 520, 590, 660, 880, and 950 nm. The sample air is taken through a stainless-steel tube into the instruments, with a desired flow rate of 5.0 L min−1 and a sampling interval of 5 min during the whole period. The aerosol σts and σbs were measured with a three-wavelength-integrating nephelometer (Aurora 3000, Australia). Aurora 3000 measures aerosol light scattering, including σts and σbs at 450, 525, and 635 nm, with a sampling interval of 1 min (Zhuang et al., 2017). The sample air was taken through a 2 m stainless-steel tube with a sampling interval of 1 min, the top of which is 1.5 m above the roof. The inlet has a rain cap and an external as well as an internal heater to prevent condensation. In cold seasons when RH in the tube was relatively low, the maximum of which was lower than 75 % and 80 % of which was lower than 50 % during sunny hours, the internal heater was turned off. PM2.5 and PM10 mass concentrations were measured using a mass analyzer (Thermo Instruments, THOM 1405-DF), which has been used to measure the mass concentration of PM2.5, PM2.5–10, and PM10 simultaneously. The hourly and daily mean mass concentrations are updated every 6 min, as well as the hourly base and reference mass concentrations. The sample air is taken through a stainless-steel tube into the instruments. Trace gases (CO, NOx, NOy, and O3) were measured every minute using online analyzers (Thermo Instruments, TEI 48i, 42i, 42iY, and 49i, respectively). Sample air was drawn from the 1.5 m above the rooftop of the laboratory through a manifold connected to O3, NOx, and CO analyzers with PFA Teflon tubes, while a separate sample line with an original molybdenum converter was used for the NOy analyzer (Wang et al., 2002; Ding et al., 2013) to convert other reactive nitrogen species including PAN, , and HNO3. Thus the measured quantity approximates total reactive nitrogen. The precision and instrument of all the measurements in this study are listed in Table 1.
Since aerosols are quite hygroscopic in China (e.g., Eichler et al., 2008; Liu et al., 2011; Ding et al., 2013), all the instruments are installed in a laboratory with a constant temperature (24 ∘C) and a low RH located on the building roof. Routine calibrations and maintenance were carried out for all these instruments during the sampling periods.
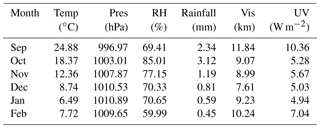
Monthly averaged meteorological parameters during the study period at the site are shown in Table 2. The air temperature at the site ranged from 6.64 ∘C in February to 24.88 ∘C in September. Both higher relative humidity (RH) and more precipitation occurred in fall than winter, especially in October. Visibility (Vis) varied in different months. The peak of the ultraviolet (UV) radiation occurred in September, after which the radiation became weak till the end of January, and rose a little afterwards.
2.2 Calculation of the aerosol optical properties
The wavelength-dependent σa, which is associated with the intensities of the incoming light and remaining light after passing through a medium, can be calculated directly using the measured light attenuations (ATN) through a quartz filter matrix, a percentage to represent the filter attenuation, and BC mass concentrations (Petzold et al., 1997; Weingartner et al., 2003; Arnott et al., 2005; Schmid et al., 2006).
where A (in m2) is the area of the aerosol-laden filter spot, V is the volumetric sampling flow rate (in L min−1), and Δt is the time interval (=5 min) between t and t−1. σaATN, known as σa without any correction, is larger than the actual aerosol absorption coefficient σaabs in general because of the multiple-scattering of light at the filter fibers (Eq. 1; multiple-scattering effect) and the instrumental response with increased particle loading on the filter (Eq. 2; shadowing effect). The former results in the overestimation of the σa, while the later causes underestimation of the σa. Thus, the correction is needed and the calibration factors C and R (shown in Eq. 2) are introduced against the scattering effect and shadowing effect, respectively:
Previous investigation suggested that wavelength-dependent σa corrected by Schmid (Schmid et al., 2006, SC2006 for short hereinafter) might be the closest to the real ones in Nanjing (Collaud Coen et al., 2010; Zhuang et al., 2015). Therefore, the SC2006 correction is adopted in this study. In this study, the parameters in the correction procedure are derived from local optical properties (ω0 and αts were set to 0.922 and 1.51, respectively). The values of correction factors C and R are as follows: R=1 when ATN ≤10 and f=1.2; and C in Nanjing is 2.95, 3.37, 3.56, 3.79, 3.99, 4.51, and 4.64 at 370, 470, 520, 590, 660, 880, and 950 nm (Zhuang et al., 2015).
The measurement of Aurora 3000, a nephelometer with newly designed light sources based on light-emitting diodes, needs correction using Mie theory for measurement artifacts. In this study, the correction was performed according to Müller et al. (2011). The raw total scattering coefficients were corrected first by calculating the Ångström exponents from the non-corrected scattering coefficients and then following the formulas presented by Müller et al. (2011) where the tabulated factors for no cutoff at the inlet were used. And based on corrected wavelength-dependent σa and σts, αts and αa at 550 nm are estimated by the following:
Meanwhile, the aerosol asymmetry parameter (g), single-scattering albedo (ω0), and extinction coefficient (σe) are further estimated:
2.3 HYSPLIT model
In order to understand the general transport characteristics of air masses recorded at this site, we conducted 4-day (96 h) backward trajectory simulations during the cold seasons in 2016 using the Lagrangian dispersion model Hybrid Single-Particle Lagrangian Integrated Trajectory (HYSPLIT) (version 4.9) provided by the Air Resources Laboratory (ARL) of the USA National Oceanic and Atmospheric Administration (NOAA) (Draxler and Hess, 1998). The HYSPLIT-4 model is capable of processing multiple gas input fields, multiple physical processes, and different types of pollutant emission sources and has been widely used in the study of transport and diffusion of various pollutants in various regions (Mcgowan and Clark, 2008; Y. Q. Wang et al., 2011; Wang et al., 2015). It is one of the most extensively used atmospheric transport and dispersion models for the study of air parcel trajectories (Draxler and Rolph, 2013; Stein et al., 2016). In this study, backward trajectories were calculated and clustered using a stand-alone version of the GDAS (Ground Data Acquisition System) meteorological field (ftp://arlftp.arlhq.noaa.gov/pub/archives/gdas1, last access: 27 March 2019). The GDAS data contain 6-hourly basic meteorological fields on pressure surfaces, with the spatial resolution of 1.0∘, corresponding to 00:00, 06:00, 12:00, and 18:00 UTC, respectively. In this study, the data are also converted to hemispheric 144 by 73 polar stereographic grids, which is the same grid configuration as the dataset applied in synoptic weather classification. For each synoptic weather pattern, the backward trajectories were started at the Gulou site in Nanjing (32∘ N, 118.8∘ E).
3.1 Characteristics of particulate matter in Nanjing
The hourly-mean concentrations and optical properties of particles at the Gulou site during the cold seasons in 2016 are shown in Fig. 1. Gaps in the time series are missing values. Observations show that peaks and valleys of BC, PM2.5, and PM10 occur simultaneously in general (Fig. 1a), probably because the three particles originate mostly from the same sources, i.e., fossil fuel burning and traffic activities. This has also been addressed in previous work (e.g., Wang et al., 2008; Chow et al., 2011; Schleicher et al., 2013; Zhuang et al., 2014b; Gong et al., 2015).
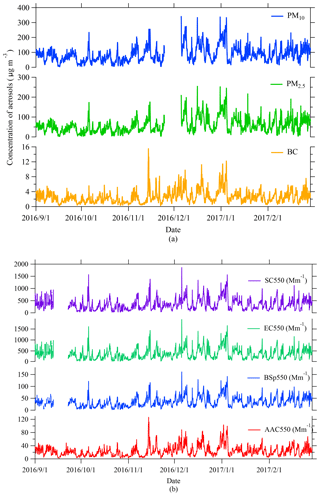
Figure 1Time series of (a) concentrations and (b) optical properties of PM10, PM2.5, and BC at the Gulou site from September 2016 to February 2017.

Figure 2Seasonal variations of (a) BC, (b) PM2.5, and (c) PM10. The 10th, 25th, 50th, 75th, and 90th percentile values of each are shown in black, and red markers represent the monthly averages.
BC concentration ranged from 0.064 to 15.609 µg m−3. The seasonal mean of BC concentration was 2.126 µg m−3 in SON and 3.083 µg m−3 in DJF, with a standard deviation of 1.457 and 1.827 µg m−3, respectively. It was low in September and October, usually below 6 µg m−3, but higher in other months. Although BC concentration was relatively low, it was extremely high in particular periods, such as in mid-November, early and late December, early January, and mid-to-late February, suggesting occurrences of substantial BC pollution events. PM2.5 and PM10 concentration ranged from 0.8 to 256.4 and from 1.1 to 343.4 µg m−3, respectively. The seasonal mean of PM2.5 concentration was 43.1 µg m−3 in SON and 73.2 µg m−3 in DJF, with a standard deviation of 25.4 and 40.0 µg m−3, respectively. PM10 averaged 67.6 µg m−3 in SON and 105.0 µg m−3 in DJF, with a standard deviation of 39.1 and 54.0 µg m−3, respectively. PM2.5 and PM10 concentrations were generally below 120 and 200 µg m−3, respectively. Remarkable increases existed especially when BC concentration was high. Additionally, the high concentrations of PM in early October possibly resulted from the increase in scattering aerosols, since the absorption coefficient and BC, one of the typical absorbing aerosols, did not show such a peak, while the scatter coefficient experienced a sharp increase during that period. It is found that both BC and PM levels in Nanjing decreased compared to those in earlier years, which is possibly due to the strengthening energy conservation and reduction of pollution emissions from 2014. For instance, seasonal averages of 4339 and 4189 ng m−3 in SON and DJF were reported in urban Nanjing during 2012 in Zhuang et al. (2014b), and Ding et al. (2013) stated a 1-year average of about 75 µg m−3 of PM2.5 in rural areas of Nanjing from August 2011 to July 2012, while Y. Wang et al. (2014) suggested that the annual averages of PM2.5 and PM10 were 75 and 135 µg m−3 in Nanjing during 2013, respectively.
Monthly variations of particles in the cold seasons in 2016 were distinguished (Fig. 2). The concentrations increased from October to December and decreased a little afterwards but remained relatively high in January and February. The lowest monthly concentrations of BC, PM2.5, and PM10 occurred in October, being 1.8, 39.2, and 59.8 µg m−3, respectively, while the highest monthly concentrations occurred in December, being 3.7, 85.0, and 123.1 µg m−3, respectively, which were about twice those in October. Monthly variations of BC were different from those in previous studies in the YRD. For instance, Pan et al. (2011) pointed out an extremely high concentration in October in Mt. Huang, which was attributed to combustion of biomasses as well as the dynamic transport and stable planetary boundary layer (PBL) stratification in the transitional periods of the winter monsoon (October). For PM, monthly behavior was basically similar to what has been reported in previous studies in the YRD, increasing from September to December in general (Chen et al., 2016), except for the decrease in October. Generally, two key factors could impact particle concentrations: meteorology and emissions. Heavy precipitation in October when average rainfall was 3.1 mm and the frequency of daily rainfall exceeding 50 mm was over 30 % (Table 2) had a strong scavenging effect, which might directly lead to low levels of particles despite the influence of biomass burning addressed in Pan et al. (2011). Anthropogenic particle emissions from fossil fuel over China increased after summer and showed a sharp increase from November to January (Zhang et al., 2009), and emission rates in southwest (Sichuan basin), central to north, and northeast China, as well as in the YRD and PRD, were higher in winter (Zhuang et al., 2018), especially in residential, industry, and power emissions (Li et al., 2017). And during the autumn harvest (September–November) the crop burning emissions still make contributions to pollutants, though as much as in summer (Yang et al., 2008). Yin et al. (2016) discussed the spatial distribution of crop residue burning from September to December in 2015, suggesting autumn crop residue burning in surrounding regions like the Shandong, Anhui, and Henan provinces; thus, particles in Nanjing might also be subject to this large-scale burning of crop residues (Qian et al., 2014). According to Huang et al. (2012) and Li et al. (2016), the spatiotemporal distribution of agricultural fire occurrences in China during 2003–2010 as well as 2012 has been presented along with the spatial distribution of CO emission from residue open burning. Both of them suggested the crop residue burning in autumn is noteworthy, and Jiangsu as well as the surrounding provinces are the regions with highest emissions. Besides, subregional transport also plays an important role; for example, in winter, air masses coming from the North China Plain, which account for 31 % of the total air masses transported to urban Nanjing, have high particle concentrations (Sect. 3.4).
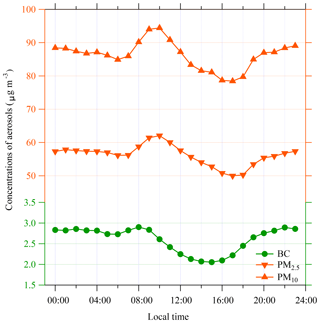
Substantial diurnal cycles of the particles are also observed (Fig. 3). Particle levels were high during 07:00–09:00 and 22:00–00:00 LT but low in afternoon (13:00–15:00 LT). High concentrations during 07:00–09:00 might be caused by the vehicle emissions (as mentioned in Sect. 2, several main roads with apparent traffic pollution surround the site). A higher vehicle volume showed during 17:00–20:00 LT in Nanjing, while the high concentrations occurred during 22:00–00:00 LT. A lower temperature and a more stable atmosphere stratification after sunset (17:00–18:00 LT) often lead to frequent temperature inversion and a low height of the planetary boundary layer (Jiang et al., 2014), which is not conducive to the diffusion of pollutants, and the concentrations of particles accumulate and remain high from the evening to early morning. For low levels in the afternoon, it is mainly induced by the well-developed boundary layer. Because the atmosphere becomes less stable with the increasing temperature, and strong turbulent exchange as well as vertical diffusion are favorable to the diffusion of pollutants, particle concentrations decrease to a minimum in the afternoon. A similar phenomenon of PM has been observed in previous studies in Nanjing (Chen et al., 2016; Ding et al., 2013), while a different pattern is discussed in Pan et al. (2011) in Mt. Huang, a rural site in the YRD, due to different emission sources (less vehicle emission) and meteorology effects (effect of valley breezing). Figure 3 also shows that the peak values of fine particle concentrations often occur 1 or 2 h later than those of BC concentrations, with high values at around 10:00 and low values at around 17:00. According to Roberts and Friedlander (1976) and Khoder (2002), atmospheric photochemical reactions are extremely active under conditions of strong radiation and high temperature, especially during daytime; thus, more secondary aerosol particles (like sulfate particles) are likely to generate, and the concentrations of fine particles in the atmosphere will increase.
3.2 Characteristics of trace gases in Nanjing
Figure 4 shows hourly-mean concentrations of trace gases at the Gulou site during the cold seasons in 2016. In general, as main precursors of O3, NOx, NOy, and CO generally show a different pattern with O3, such as when the precursor levels remained high from November to January, O3 levels were relatively low (Xie et al., 2016; Wang et al., 2017). Also, the precursor concentrations varied greatly, especially in DJF (with several peaks), possibly because of the frequent shifting of air masses from the clean interior of the continent and heavily polluted urban plumes in the heating period (normally from November to March in northern China) (Pan et al., 2011).
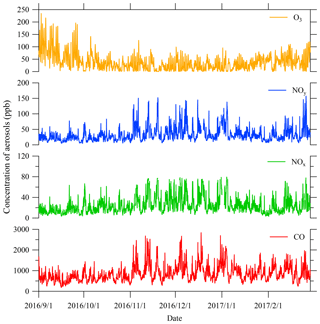
Figure 4Time series of O3, NOy, NOx, and CO concentrations at the Gulou site from September 2016 to February 2017.
Concentrations of trace gases, including CO (176–2852 ppb), NOx (2.7–80.0 ppb), NOy (3.6∼158.4 ppb), and O3 (0.2–235.7 ppb), varied a lot in the study period. The seasonal mean of O3 was 42.3 ppb in SON and 33.1 ppb in DJF, with a standard deviation of 40.1 and 24.4 ppb, respectively. As shown in Fig. 4, O3 concentration was extremely high during all of September in 2016, with a maximum over 200 ppb, and decreased sharply after mid-October, basically keeping a low level below 100 ppb, until early February when it began to increase. Seasonal averages of NOx and NOy were 21.4 and 28.6 ppb in SON, with a deviation of 20.5 and 40.1 ppb, respectively. In DJF, mean concentrations of NOx and NOy were 27.6 and 37.0 ppb, with a deviation of 15.5 and 23.1 ppb. And seasonal averages of CO were 753 ppb in SON and 950 ppb in DJF, with a deviation of 353 and 388 ppb, respectively. The precursor concentrations were high from November to mid-January and low in September. Moreover, it is suggested that the O3 concentration is higher compared to the results in previous studies based on the measurement at ground sites in Nanjing (Xie et al., 2016; An et al., 2015; Ding et al., 2013), implying the more pressing environmental issue of the near-surface O3 problem in the urban area.
Monthly variations of trace gases are shown in Fig. 5. It is noticeable that the different patterns occur in O3 and its precursors. Observations show that O3 concentration decreased after the lasting extremely high level in September until November and increased a little afterwards. The highest concentration of O3 was found in September and the lowest in November, being 74.8 and 23.4 ppb, respectively. This pattern might be attributed to the solar radiation and emissions. For instance, in September when solar radiation was strong (maximum UV over 55 W m−2) it would contribute greatly to O3 formation, and precursors were at relatively high levels (CO, NOx, and NOy were about 600, 15, and 20 ppb, respectively), though not as high as those in cold days. CO, NOx, and NOy peaked in December correspondingly at 1064, 31.8, and 41.7 ppb. The precursors reached the lowest level in September, being 620, 14.5, and 20.8 ppb, respectively. In addition, the pattern of precursors is analogous to those in previous studies (Xie et al., 2016; Ding et al., 2013) but with a relatively lower concentration, especially NOx and NOy, which might also result from the large-scale reduction of pollution emissions.
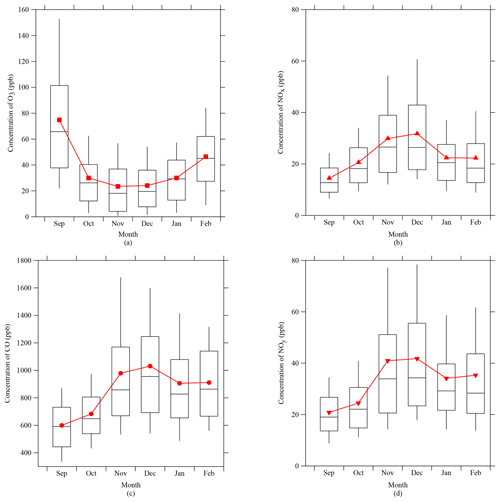
Figure 5Seasonal variations of (a) O3, (b) NOx, (c) CO, and (d) NOy. The 10th, 25th, 50th, 75th, and 90th percentile values of each are shown in black, and red markers represent the monthly averages.
Figure 6a shows the diurnal variations of the trace gases (O3, NOx, NOy, and CO). The concentration of O3 is the lowest around 07:00 LT and rises rapidly until reaching the peak in the middle of the day at 15:00 LT. It keeps decreasing sharply after the afternoon peak till sunset. During the nighttime, the concentration of O3 decreases slowly and remains low. With respect to NOx and NOy, the peak appears at around 09:00 LT, with another high value occurring at night (21:00–00:00 LT), both of which coincide with the rush hours in the city, when large amounts of vehicle emissions are released. The morning peak is slightly higher than the night one in general. Besides emissions, these diurnal variation patterns of O3 and NOx (NOy) mainly result from the photochemical processes and the meteorological conditions. Simultaneous measurement of O3 and UV shows that the O3 concentration is highly correlated to UV (R=0.47). The ultraviolet radiation at Gulou started to increase at about 07:00 LT (Fig. 6b), which could induce a series of photochemical reactions including the formation of peroxy radicals (HO2 and RO2) and the photolysis of NO2. From 08:00 to 15:00 LT, the increase in UV enhances the O3 formation by promoting the production of NO2 and OH from NO and peroxy radicals. The diurnal range of O3 concentration (the difference between the maximum at 15:00 LT and the minimum at 07:00 LT) is relatively high (45.1 ppb), suggesting the active chemical reactions as well. It is also noticeable that the O3 peaks 2 h after the UV maximum, suggesting the time taken for the photochemical production of O3. The slightly reduction of O3 and NOx in the early morning (03:00–07:00 LT) is likely due to NOx titration. The development of the planetary boundary layer can also modulate pollutant concentrations. The concentration of a pollutant is diluted when PBL rises during the daytime and is enhanced in the low nocturnal PBL that favors pollutant accumulation, after comparing Fig. 6a with the reported diurnal variation in PBL height in Nanjing (Jiang et al., 2014; Xie et al., 2016). And that is also the reason for the difference in the peak time between the emission rate and NOx (NOy) concentration, which is similar to particles to some degree. The abovementioned diurnal cycles in O3 and NOx (NOy) concentration follow the typical patterns at other sites in Nanjing (Tu et al., 2007; Ding et al., 2013; Xie et al, 2016). The daily variation in CO concentration is found to be similar to that of BC, such as the morning peak during rush hours, afternoon dip at around 15:00 LT, and accumulation at night. A remarkable correlation has been found in a number of previous studies (e.g., Jennings et al., 1996; Derwent et al., 2001; Badarinath et al., 2007; Spackman et al., 2008; Pan et al., 2011; Zhuang et al., 2014b). Besides, BC is mostly produced by the incomplete combustion of carbonaceous material, and so is carbon monoxide (CO) (Pan et al., 2011); thus, both BC and CO might come from the same sources, mostly from combustions of domestic biofuel, industry coal, and vehicle gasoline (Zhuang et al., 2014b). The effect of meteorology, i.e., the development of the PBL, influences the diurnal pattern as mentioned in Sect. 3.1, especially the afternoon dip and night accumulation. Moreover, as one of the main precursors of O3, increase in O3 levels in the afternoon might also contribute to the lowest concentration at 15:00 LT.
Table 5Statistics of the maximum and number of exceedances (N.o.E) of O3 and PM2.5 compared with the National Ambient Air Quality Standards in China.
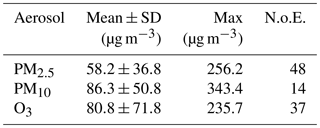
N.o.E. of PM2.5 accounts for days with 24 h average over 75 µg m−3. N.o.E. of PM10 accounts for days with 24 h average over 150 µg m−3. N.o.E of O3 accounts for days with maximum 8 h average exceeding 160 µg m−3.
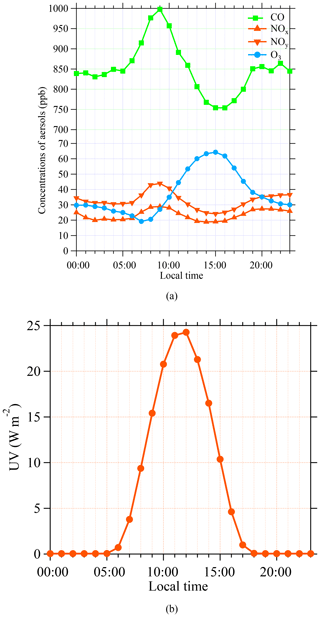
Figure 6The 6-month mean diurnal variations of (a) trace gases and (b) UV at the Gulou site from September 2016 to February 2017.
Table 5 further provides the statistics of O3, PM2.5, and PM10 mass concentrations with a comparison to the National Ambient Air Quality Standards in China (NAAQS-CN) released in 2012 by the China State Council which will be implemented nationwide in 2016 (MEP, 2012). According to NAAQS-CN for PM2.5 and PM10 (75 µg m−3 of PM2.5 and 150 µg m−3 of PM10 for 24 h average concentration), there were 48 days of PM2.5 exceedances, accounting for about 30 % during the study period, and 14 days of PM10 exceedances, lower than the PM2.5 exceedances. Days of PM exceedances mainly occurred during DJF. The days of exceedances decreased. Ding et al. (2013) reported 99 days of PM2.5 exceedances in total from September 2011 to February 2012, and Y. Wang et al. (2014) suggested that non-attainment rates in Nanjing from September 2013 to February 2014 were over 40 % and 70 % in SON and DJF, respectively. These results suggest that particle control policies are well-implemented in Nanjing although particles remain a severe pollution problem in the YRD region. According to NAAQS-CN for O3 (160 µg m−3 for 8 h average and 200 µg m−3 for 1 h average), 37 days of exceedances occurred (Table 5), covering 20 % of the period and mostly in September and February when the air temperature was relatively high. In contrast to particulate matter, the number of days of O3 exceedances increases greatly. Y. Wang et al. (2014) reported a 11.4 % contribution of O3 as the major pollutant on non-attainment days in cold seasons in 2013 in southeast China, and Tu et al. (2007) reported that the frequency of days with O3 exceedance for cold seasons in 2000–2002 in urban Nanjing was 6.3 %. O3 levels in the rural areas are generally higher than those in the city centers (Zhang et al., 2008; Geng et al., 2008; Xie et al., 2016). Thus, high O3 concentration and severe air pollution at Gulou, an urban site, probably imply a more severe O3 pollution problem in the entire YRD region. Moreover, note that this study only discusses the O3 concentration in the cold seasons when it is relatively low, and it might suggest a more severe problem in warm seasons.
3.3 Inter-species correlations
Correlations between different species have been analyzed to help interpret the data and gain insight into the underlying mechanisms/processes. Because precipitation could impact wet scavenging processes for particles and other aerosols (Table 6), the data in rainy condition have been eliminated.
The scatter plot of O3 and NOx measured at the site color-coded with air temperature is given in Fig. 7a. As discussed in previous studies (Xie et al., 2016; Ding et al., 2013), measured O3 presents an overall negative correlation with NOx. The negative correlation mainly exists for data of relatively low air temperature, suggesting a titration effect of freshly emitted NOx with O3, especially at nighttime. However, the slope gets less rigid when air temperature rises and tends to be positive with a high temperature (over 25 ∘C) and low level of NOx (below 30 ppb). These results possibly suggest a strong photochemical production of O3 in this region under high temperature with strong radiation like in September, leading to the seasonal cycle pattern of O3 shown in Fig. 5a.
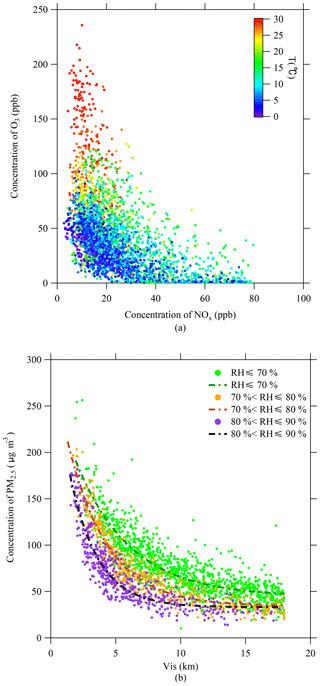
Figure 7Scatter plots of (a) O3–NOx color-coded with air temperature (T) and (b) PM2.5–Vis color-coded with relative humidity (RH).
Figure 7b provides a scatter plot of PM2.5 and visibility (Vis) color-coded with relative humidity. For a better understanding of the relationship between the variables, we have performed a linear fit of the visibility with the PM2.5 concentration when RH ≤70 %, 70 % < RH ≤80 %, and 80 % < RH ≤90 % to find the relationship among these factors, and the fitting curves are [PM2.5] = 366.72 (Vis)−0.745 (R2=0.7196), [PM2.5] = 337.16 (Vis)−0.855 (R2=0.8692), and [PM2.5] = 248.6 (Vis)−0.852 (R2=0.8279), respectively. It is found that visibility decreases with the concentration of PM2.5 in a power function with a negative exponent, and the inverse relationship between visibility and aerosol concentrations as well as relative humidity has also been discussed in previous studies based on the observations in the YRD (e.g., Deng et al., 2011; Xiao et al., 2011; Jiang et al., 2018). The correlation is stronger than that in Lin'an, a rural site not far from Nanjing (Jiang et al., 2018). The concentrations of particles would increase the extinction coefficient, while the visibility (Vis) is related to the coefficients through
where Vis is the visibility and σe is the extinction coefficient (Larson et al., 1989). As for the effect of relative humidity on the visibility, according to Mie theory, with the increase in the relative humidity, the radius of the wet particle also increases, and so does the extinction coefficient, which leads to the decrease in visibility.
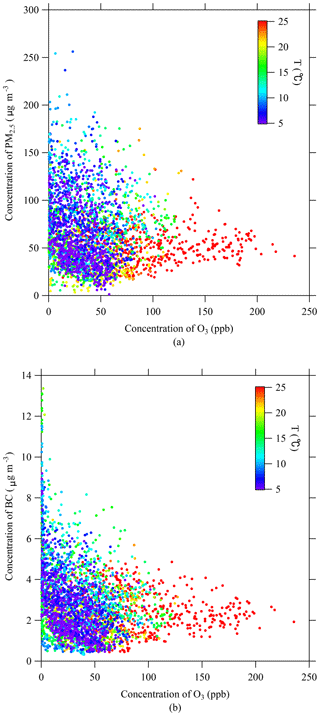
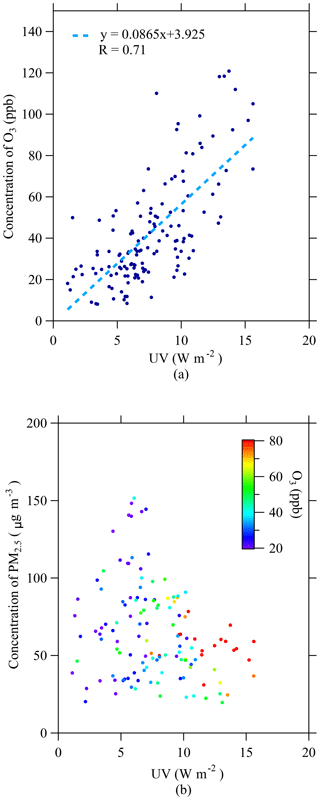
According to the scatter plots of PM2.5–O3 and BC–O3 color-coded with air temperature (Fig. 8), PM2.5 and BC are negatively correlated with O3 in general. It is also noticeable that a negative correlation between PM2.5 and O3 could be found for low air temperature samples while a positive correlation exists for those under a high temperature. Similar results were also found at a rural site in Nanjing (Ding et al., 2013). Besides, BC is in a negative correlation with O3 under low air temperature but tends to be less correlated with O3 when the temperature rises. PM2.5 is well-correlated with O3 precursors, such as NOx (Fig. 10b) and CO. Therefore, the anti-correlation in Fig. 8a for cold air is likely due to the titration effect of high NO concentrations associated with high primary PM2.5 levels. Additionally, the increasing slope under high air temperature might be related to the formation of secondary fine particles, especially the high conversion rate of SO2 to sulfate under the effect of the high concentration of oxidants (O3) and solar radiation (Roberts and Friedlander, 1976; Khoder, 2002). Previous studies of PM2.5 chemical compositions in Shanghai (Wang et al., 2006) and Nanjing (Ding et al., 2013) suggested that sulfate was the most dominant ion in PM2.5. Ding et al. (2013) also suggested formation of secondary organic aerosols with high O3 concentration could lead to the positive correlation because biogenic emission of VOCs is high under a condition of high air temperature and solar radiation in summer. However, the study is performed during cold seasons when air temperature is relatively lower and the biogenic emissions of VOCs are likely lower, so the positive correlation is less pronounced. As for BC, it also shows a good correlation with NOx (Fig. 10c) and CO, which contributes to the inverse correlation for cold air. Since BC is insoluble in polar and non-polar solvents and still remains stable when air or oxygen is heated to 350–400 ∘C, it is difficult to generate or clear through chemical reactions. And that is probably the reason why the correlation between BC and O3 is more obscure compared to the one between PM2.5 and O3 when air temperature rises. Moreover, as shown in Fig. 9, O3 is well-correlated with UV (daily mean values are used due to the remarkable diurnal variation), suggesting the significant role UV plays in O3 production, while PM2.5 is generally negatively correlated with UV. Previous findings based on various numerical models also suggest that particles can affect the actinic flux of UV radiation and inhibit the photolysis reactions near the surface by reducing the photolysis frequencies in the atmosphere, like the frequency of O3→O(1D) (e.g., Li et al., 2005, 2011, 2018; Deng et al., 2010). In central Nanjing, as implied in Li et al. (2017), high concentrations of aerosols could result in a 0.1–5.0 ppb (12.0 %) reduction of near-surface ozone. Thus, they might result in the decrease in O3 concentration near the ground to some degree. However, the detailed mechanisms still need to be further investigated by long-term measurement of aerosol chemical composition combined with numerical models.
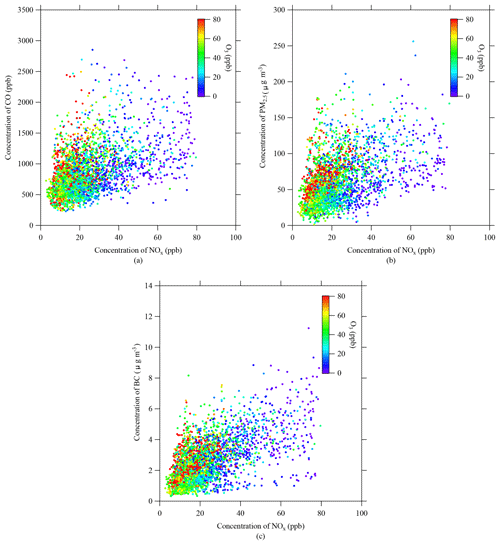
Scatter plots of CO–NOx, PM2.5–NOx, and BC–NOx are given in Fig. 10a–c, with data points color-coded with the concentration of O3. Figure 10b and c show a good positive correlation between PM2.5 and NOx, as well as BC and NOx as mentioned above, suggesting that the particles at the site are mainly associated with similar sources like combustion and traffic activities (Wang et al., 2006; Ding et al., 2013; Zhuang et al., 2014b). It is found that high O3 levels are generally related to air masses of high CO∕NOx or particles∕NOx ratio. An increase in CO, as well as PM2.5 and BC, always results in higher O3 concentration for NOx lower than 40 ppb, while NOx reverses. To be specific, when NOx reduces for CO lower than 1500 ppb, O3 has a sharp increase, and an increase in the CO level would lead to an increase in the O3 concentration, especially when NOx is lower than 40 ppb. The concentration of O3 is sensitive to the level of its precursors, and the O3 formation regime often includes the NOx-sensitive O3 formation regime and VOC-sensitive O3 formation regime. If O3 formation is under the VOC-sensitive regime, a reduction in the NOx concentration will lead to an increase in the O3 concentration, which is used to determine whether the O3 photochemical production in the region is VOC-limited or NOx-limited based on observation data (Geng et al., 2008; Ding et al., 2013). In our study, we have no VOC measurements; thus CO is chosen as the reference tracer, because mixing ratios of CO showed significant correlations with the measured levels of most anthropogenic VOCs, which has been verified in many previous studies (e.g., Baker et al., 2008; von Schneidemesser et al., 2010; M. Wang et al., 2014). In addition, as a significant precursor of O3, CO also plays a similar role to VOCs. HO2 produced from the oxidation reaction of CO with OH radicals could initiate photochemical reactions which result in the net formation of O3 (Novelli et al., 1998; Atkinson et al., 2000; Gao et al., 2005). Thus, the CO–O3–NOx relationship may reflect the correlation of VOCs, NOx, and O3 in this region to some degree. Therefore, we suggest that the region is VOC-sensitive. Geng et al. (2008) reported a VOC-sensitive regime in urban Shanghai combining the measured and modeling results, and Ding et al. (2013) also reported a VOC-sensitive regime in rural areas in Nanjing using the observation data. And the PM2.5–O3–NOx and BC–O3–NOx relationships show the similar pattern, possibly because they are well-correlated with CO.
3.4 Backward trajectory analysis
The cluster means of the backward trajectory at 100 m from Gulou, Nanjing, in the fall (Fig. 11) and winter (Fig. 13) of 2016 suggest different air flows transported to Nanjing from long distances. In general, the aerosol kinds and optical properties are characterized differently with different air masses in the two seasons, which are further analyzed by their origins in SON and DJF (Figs. 12 and 14). Figures 12 and 14 show the main concentrations of particles and trace gases, the ratio of PM2.5 to PM10, and the values of the aerosol optical properties of different clusters during SON and DJF, respectively. Because PM10 varies similarly to PM2.5, while NOx varies analogously to NOy, we only present the variations of PM2.5 and NOy with the cluster here. Also, because σa, σts, and σbs have good correlations with particle concentrations (Zhuang et al., 2014a) and g is greatly affected by relative humidity, we discuss the variation of αts and ω0 with the cluster here.
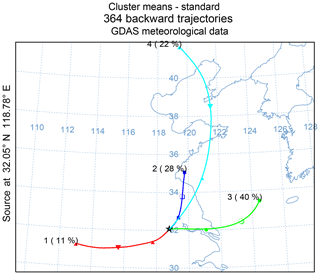
Figure 11Clusters of 96 h back trajectories arriving at the Gulou site at 100 m in the fall of 2016.
In SON, the dominant air masses are from the East China Sea passing through urban agglomeration regions (cluster 3), less-developed regions (cluster 2) of the YRD, and from the northern part of the continent away from Nanjing passing through oceans and urban agglomeration regions (cluster 4). It is found that although air masses in cluster 3, cluster 4, and cluster 2 all pass through the oceans and have the same level of RH, differences still exist among the clusters. The air masses have to cross the urban agglomeration (from Shanghai to Nanjing) of the YRD when they arrive in Nanjing in cluster 3 but pass less-developed regions (north Jiangsu Province) in cluster 4 and cluster 2. In the YRD, emissions of aerosols and trace gases are much stronger in urban agglomeration regions (Zhang et al., 2009; Zhuang et al., 2013b). It is also noticeable that concentrations of aerosols in cluster 4 are mostly lower, which may result from its avoidance of BTH regions, as well as megacities and urban agglomeration. In addition, air masses from the west of cluster 1 contain the highest concentrations of PM and precursors. Air masses pass central China with high emissions of particles and trace gases according to MERRA data (https://disc.gsfc.nasa.gov/datasets?page=1&keywords=merra, last access: 27 March 2019) and Zhuang et al. (2015). Also, high concentrations of these aerosols are also reflected in a high aerosol optical depth (AOD) according to the MISR data (https://giovanni.gsfc.nasa.gov/giovanni, last access: 27 March 2019). The ratio of PM2.5 to PM10 represents the number of particles deriving from secondary pollution progress compared to those from primary pollution progress to some extent. In SON, ratios of clusters 1–3 are relatively close (all over 60 %) with a maximum of cluster 3, which means particles generating from secondary pollution progress in the three clusters have a similar rate. O3 concentrations among the four clusters are different. Despite negative correlations of O3 with its precursors and particles, the concentration of O3 in cluster 3 is higher than that in cluster 4, possibly because radiation in cluster 3 is stronger. The sizes of the aerosols in cluster 1 are the finest (αts is the largest in Fig. 12g), because the other three clusters all pass through oceans before arriving at Nanjing with higher relative humidity. Therefore, it is likely to enhance particles hygroscopicity. ω0 is also the largest in cluster 1, and it suggests that aerosols in cluster 1 are the most scattering, corresponding with the highest concentration of PM2.5.
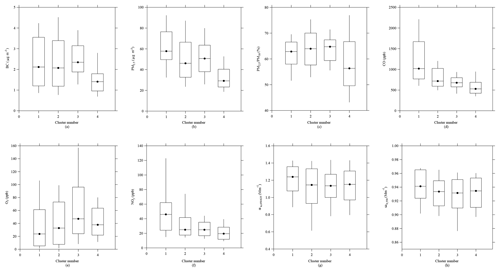
Figure 12The 10th, 25th, 50th, 75th, and 90th percentile values in each cluster of back trajectories in the fall of 2016 of (a) BC, (b) PM2.5, (c) PM2.5 ∕ PM10, (d) CO, (e) O3, (f) NOy, (g) αts, and (h) ω0. Black markers represent the averages.
In DJF, air masses come from the local region (cluster 2), northwest areas (cluster 1), and northern regions far from Nanjing (cluster 4). Air masses from cluster 1 and cluster 2 both account for over 30 % of the total aerosol characteristics and are more polluted with relatively high levels of particles, CO, and NOx. Air masses in cluster 1 come from Shandong Province while those in cluster 2 come from local areas. Particles and trace gases concentrations of cluster 2 are higher than those of cluster 1 to some extent, implying the more severe air pollution problem in the YRD region. The concentration of O3, similar to that in SON, is affected by radiation in addition to precursor levels. Thus, O3 concentration in cluster 2 is a little higher than that in cluster 1. The ratios of PM2.5 to PM10 of cluster 1 and cluster 2 are approximately equal, over 70 %. The sizes of aerosols in cluster 1 and 2 are coarser, however, probably due to the higher RH (over 65 %). Aerosols in cluster 1 are more scattering compared to those in cluster 2. The trajectories of cluster 3 and cluster 4 are analogous to those in SON, respectively, but more polluted, probably due to more emissions in DJF especially in north China and weaker flow from ocean in DJF.
3.5 Case study
For further understanding of the causes for high pollutant episodes, especially high particles and O3 episodes, detailed analysis of a typical episode from 3 to 6 December 2016 is presented in this section.
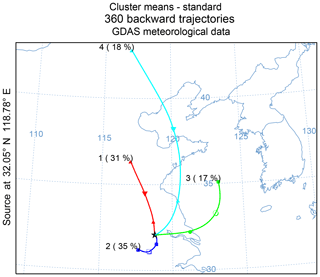
Figure 13Clusters of 96 h back trajectories arriving at the Gulou site at 100 m in the winter of 2016.
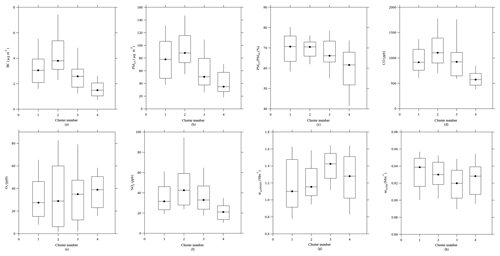
Figure 14The 10th, 25th, 50th, 75th, and 90th percentile values in each cluster of back trajectories in the winter of 2016 of (a) BC, (b) PM2.5, (c) PM2.5 ∕ PM10, (d) CO, (e) O3, (f) NOy, (g) αts, and (h) ω0. Black markers represent the averages.
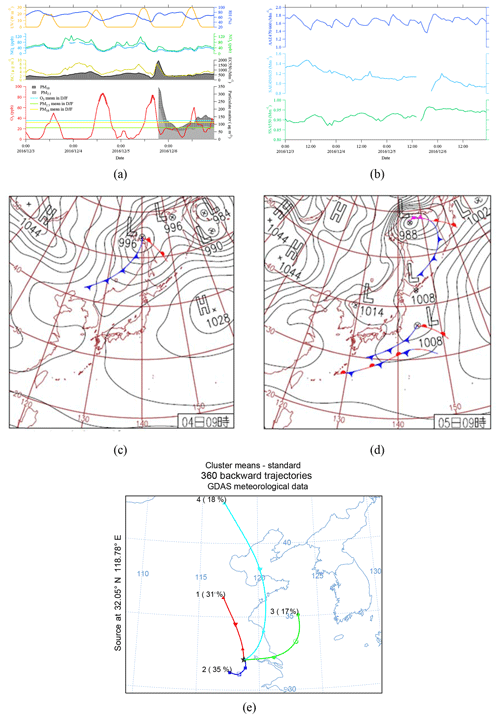
Figure 15Time series during 3–6 December 2016 for (a) PM2.5, BC, and O3 with associated metrological parameters, trace gases, and (b) optical parameters. Red markers represent O3 over daily maximum average during winter. Weather charts on (c) 4 and (d) 5 December. (e) The 96 h backward trajectory analysis ending at 12:00 UTC on 5 December.
Figure 15a and b show that high O3 concentration (over 80 ppb) occurred on 4 December with broad O3 peaks (over 60 ppb) in the following days, while the average O3 during the cold seasons was 37.7 ppb. Though there is a lack of PM concentrations because of the instrument breakdown, the relatively high σe (over 500 Mm−1) and BC concentration (over 6 µg m−3) on 4 December could reflect high PM concentrations. Both PM reach a maximum on 5 December (PM2.5 over 200 µg m−3 and PM10 over 300 µg m−3), over 3 times the averages. Besides, NOx and NOy have reached high levels since 4 December (NOx over 70 ppb and NOy over 100 ppb). It is also noticeable that ω0 has a relatively sharp decrease from 4 December, especially on 5 December when particle concentrations were extremely high, probably suggesting that the ratio of PM10 increased. Meanwhile, a relatively sharp increase occurred in αts, without any obvious variation in αa, implying that scattering aerosols could take the leading role during this episode. It is also found that this case occurred under calm conditions before the passage of a cold front, which was at the front of a continental high-pressure system originating from Mongolia and sweeping over Nanjing (Fig. 15c), and the decrease in temperature with the high-pressure system dominating eastern China was also detected on 6 December. Backward trajectory analyses for the past 96 h (Fig. 15d) were conducted from 5 December at 20:00, including the maximum of O3 on 4 December and PM on 5 December. It is suggested that predominant wind was just in time from the NW directions. Therefore, air masses with high particles and O3 concentrations would be transported to Nanjing. This was also clearly detected in Nanjing during these days, such as the relatively high O3 during nighttime on 5 and 6 December. The highest O3 on 4 December together with high particles and primary pollutants NOx and NOy suggests a strong in situ photochemical production in mixed regional plumes under the influence of the high-pressure system. Previous studies (Luo et al., 2000; Wang et al., 2006; Ding et al., 2013) reported that the anticyclonic conditions, e.g., sunny weather and low wind velocities, are favorable for pollution accumulation and O3 production. Results in this case clearly demonstrate subregional transport of primary and secondary air pollutants within the YRD region under such a weather system.
In this study, particles (BC and PM) and trace gases (O3 and related precursors) in polluted seasons are investigated based on continuous measurements of concentrations and optical properties in the urban area of Nanjing. The characteristics and underlying reasons are comprehensively discussed from perspectives of temporal variations, inter-species correlations, trajectories analysis, and case studies associated with weather data and Lagrangian dispersion modeling.
Measurements show that the average concentration of PM10 was 86.3 µg m−3, with BC and PM2.5 accounting for 3 % and 67 %, respectively. A total of 48 and 14 days of PM2.5 and PM10 exceeded NAAQS-CN, respectively. The results suggested that both BC and PM levels in Nanjing have decreased because of energy conservation since 2014. The average concentration of O3 was 37.7 ppb with 40 days of exceedance. Precursor concentrations, including CO, NOx, and NOy, averaged 753, 28.4, and 28.6 ppb, respectively. In contrast to particles, O3 concentration has increased in urban Nanjing, implying more severe pollution in rural areas and the entire YRD region. All the aerosols have substantial monthly and diurnal variations. Both particles and precursors reached maximum values in December and minimum values in October due to higher emission and less precipitation. O3 showed a peak in September because of stronger radiation. Diurnal variations of BC and PM were similar with peaks around 07:00–09:00 and 22:00–00:00 LT. Both of the peaks were influenced by traffic emissions in rush hours and accumulation of air pollution especially at nighttime. The peaks of PM often occurred 1–2 h later than those of BC, possibly due to the production of secondary particles. Precursors and particles varied similarly in time, and the diurnal variation of O3 was analogous to that of radiation with a peak around 15:00 LT.
PM2.5 has a quasi-power-law distribution with Vis under RH of different ranges. The correlation is stronger than that in a rural region in the YRD, implying greater effects of air pollution on visibility in urban Nanjing. O3 shows an anti-correlation with NOx generally, but it tends to be positive with a relatively high temperature and low level of NOx. PM2.5 and BC are overall negatively correlated with O3. A positive correlation between PM2.5 and O3 exists under high temperatures, while it is not found in BC–O3 correlation. The negative correlation is related to the titration effect of high NO concentration, which is highly correlated with particles due to similar emission sources. And the negative correlation between PM2.5 and UV suggests particles could decrease the actinic flux of radiation and thus inhibit the photolysis reactions near the surface to some degree. The positive correlation implies the formation of secondary aerosols under the effects of the high concentrations of oxidants and solar radiation. BC is hard to be generated through chemical reactions, which might explain why the correlation between BC and O3 is more obscure when temperature rises. An increase in CO, as well as PM2.5 and BC, always results in higher O3 concentration, while NOx reverses, which indicates a VOC-sensitive regime for photochemical production of O3 in urban Nanjing.
Backward trajectories indicate that Nanjing could be affected by local air flow (35 % in DJF) and long-distance air flows mostly from western (11 % in SON), northwestern (31 % in DJF), northern (up to 50 % in SON and DJF), and eastern China (40 % in SON and 17 % in DJF). Considerable air pollution in the urban area of Nanjing is due to local and subregional emissions. Basically, air masses from the oceans and remote or less-developed areas are relatively clean with low aerosol concentrations. αts at the site is usually low when the relative humidity of air masses is high, possibly suggesting the increased hygroscopicity and more secondary aerosol production under higher RH.
A case study for a typical high-O3 and PM2.5 episode in December 2016 illustrates the important influences of subregional transport of pollutants from strong source regions and local synoptic weather on the episode. Stable conditions such as an anticyclonic system make it easy for pollutants to accumulate in urban Nanjing. Results from this case reveal the mechanisms of subregional transport of primary and secondary air pollutants within the YRD region.
Overall, this work highlights the interactions and mechanisms of various aerosols and metrological fields in addition to the important environmental impact from human activities and meteorological conditions in the urban area in the YRD region. Considering both results in this study and previous work, it is suggested that collaborative control measures among different administrative regions are urgently needed, including but not limited to energy conservation and reduction of pollution emissions, to improve air quality in the western part of the YRD region.
The GDP data are from http://tjj.nanjing.gov.cn/. Satellite CO data are available at https://disc.gsfc.nasa.gov/datasets?keywords=merra (last access: 27 March 2019). The aerosols AOD data are available at https://giovanni.gsfc.nasa.gov/giovanni/ (last access: 27 March 2019). The Lagrangian dispersion model Hybrid Single-Particle Lagrangian Integrated Trajectory (HYSPLIT) was supplied by NOAA: http://ready.arl.noaa.gov/HYSPLIT_traj.php (last access: 27 March, 2019). The meteorological data for HYSPLIT are accessible from ftp://arlftp.arlhq.noaa.gov/pub/archives/gdas1 (last access: 27 March, 2019).
HC, BZ, and TW designed research; HC, BZ, JL, and SL performed research; HC, BZ, MX, ML, PC, and MZ analyzed data; and HC, BZ, and JL wrote the paper.
The authors declare that they have no conflict of interest.
This article is part of the special issue “Regional transport and transformation of air pollution in eastern China”. It is not associated with a conference.
This work was supported by the National Key R&D Program of China and the National Natural Science Foundation of China (2017YFC0209803, 41621005, 41675143, 2014CB441203, 2016YFC0203303, 91544230). The authors would like to thank all members in the AERC of Nanjing University for maintaining instruments and also thank the anonymous reviewers for their constructive and valuable comments on this paper.
This paper was edited by Jianmin Chen and reviewed by three anonymous referees.
Allen, R. J., Sherwood, S. C., Norris, J. R., and Zender, C. S.: Recent Northern Hemisphere tropical expansion primarily driven by black carbon and tropospheric ozone, Nature, 485, 350–353, https://doi.org/10.1038/nature11097, 2012.
An, J., Zou, J., Wang, J., Lin, X., Zhu, B.: Differences in ozone photochemical characteristics between the megacity Nanjing and its suburban surroundings, Yangtze River Delta, China, Environ. Sci. Pollut. R., 22, 19607–19617, 2015.
Arnott, W. P., Hamasha, K., Moosmuller, H., Sheridan, P. J., and Ogren, J. A.: Towards aerosol light-absorption measurements with a 7-wavelength aethalometer: evaluation with a photoacoustic instrument and 3-wavelength nephelometer, Aerosol Sci. Tech., 39, 17–29, https://doi.org/10.1080/027868290901972, 2005.
Atkinson, R.: Atmospheric chemistry of VOCs and NOx, Atmos. Environ., 34, 2063–2101, https://doi.org/10.1016/S1352-2310(99)00460-4, 2000.
Badarinath, K. V. S., Kharol, S. K., Chand, T. R. K., Parvathi, Y. G., Anasuya, T., and Jyothsna, A. N.: Variations in black carbon aerosol, carbon monoxide and ozone over an urban area of Hyderabad, India, during the forest fire season, Atmos. Res., 85, 18–26, 2007.
Baker, A. K., Beyersdorf, A. J., Doezema, L. A., Katzenstein, A., Meinardi, S., Simpson, I. J., Blake, D. R., and Rowland, F. S.: Measurements of nonmethane hydrocarbons in 28 United States cities, Atmos. Environ., 42, 170–182, 2008.
Chameides, W. L., Yu, H., Liu, S. C., Bergin, M., Zhou, X., Mearns, L., Wang., G., Kiang, C. S., Saylor, R. D., Luo, C., Huang, Y., Steiner, A., and Giorgi, F.: Case study of the effects of atmospheric aerosols and regional haze on agriculture: An opportunity to enhance crop yields in China through emission controls?, P. Natl. Acad. Sci. USA, 96, 13626–13633, 1999a.
Chameides, W. L., Li, X., Tang, X., Zhou, X., Luo, C., Kiang, C. S., John, J. St., Saylor, R. D., Liu, S. C., Lam, K. S., Wang, T., and Giorgi, F.: Is ozone pollution affecting crop yields in China, Geophys. Res. Lett., 26, 867–870, 1999b.
Chen, T., He, J., Lu, X. W., She, J. F., and Guan, Z. Q.: Spatial and Temporal Variations of PM2.5 and Its Relation to Meteorological Factors in the Urban Area of Nanjing, China, Int. J. Environ. Res. Pu., 13, 921, https://doi.org/10.3390/ijerph13090921, 2016.
Cheung, V. T. F. and Wang, T.: Observational study of ozone pollution at a rural site in the Yangtze Delta of China, Atmos. Environ., 35, 4947–4958, 2001.
Chow, J. C., Watson, J. G., Lowenthal, D. H., Chen, L.-W. A., and Motallebi, N.: PM2.5 source profiles for black and organic carbon emission inventories, Atmos. Environ., 45, 5407–5414, 2011.
Collaud Coen, M., Weingartner, E., Apituley, A., Ceburnis, D., Fierz-Schmidhauser, R., Flentje, H., Henzing, J. S., Jennings, S. G., Moerman, M., Petzold, A., Schmid, O., and Baltensperger, U.: Minimizing light absorption measurement artifacts of the Aethalometer: evaluation of five correction algorithms, Atmos. Meas. Tech., 3, 457–474, https://doi.org/10.5194/amt-3-457-2010, 2010.
Deng, J., Wang, T., Jiang, Z., Xie, M., Zhang, R., Huang, X., and Zhu, J.: Characterization of visibility and its affecting factors over Nanjing, China, Atmos. Res., 101, 681–691, 2011.
Deng, J. J., Wang, T. J., Liu, L., and Jiang, F.: Modeling heterogeneous chemical processes on aerosol surface, Particuology, 8, 308–318, 2010.
Derwent, R. G., Ryall, D. B., Jennings, S. G., Spain, T. G., and Simmonds, P. G.: Black carbon aerosol and carbon monoxide in European regionally polluted air masses at Mace Head, Ireland during 1995–1998, Atmos. Environ., 35, 6371–6378, 2001.
Ding, A. J., Fu, C. B., Yang, X. Q., Sun, J. N., Zheng, L. F., Xie, Y. N., Herrmann, E., Nie, W., Petäjä, T., Kerminen, V.-M., and Kulmala, M.: Ozone and fine particle in the western Yangtze River Delta: an overview of 1 yr data at the SORPES station, Atmos. Chem. Phys., 13, 5813–5830, https://doi.org/10.5194/acp-13-5813-2013, 2013.
Draxler, R. R. and Hess, G. D.: An overview of the HYSPLIT 4 modeling system for trajectories dispersion and deposition, Aust. Meteorol. Mag., 47, 295–308, 1998.
Draxler, R. R. and Rolph, G. D.: HYSPLIT (HYbrid Single-Particle Lagrangian Integrated Trajectory) Model Access Via NOAA ARL READY Website, NOAA Air Resources Laboratory, Silver Spring, MD, 2013.
Eichler, H., Cheng, Y. F., Birmili, W., Nowak, A., Wiedensohler, A., Brüggemann, E., Gnauk, T., Herrmann, H., Althausen, D., Ansmann, A., Engelmann, R., Tesche, M., Wendisch, M., Zhang, Y. H., Hu, M., Liu, S., and Zeng, L. M.: Hygroscopic properties and extinction of aerosol particles at ambient relative humidity in South-Eastern China, Atmos. Environ., 42, 6321–6334, https://doi.org/10.1016/j.atmosenv.2008.05.007, 2008.
Gao, J., Wang, T., Ding, A., and Liu, C.: Observational study of ozone and carbon monoxide at the summit of mount Tai (1534 m a.s.l.) in central-eastern China, Atmos. Environ., 39, 4779–4791, 2005.
Geng, F. H., Tie, X. X., Xu, J. M., Zhou, G. Q., Peng, L., Gao, W., Tang, X., and Zhao, C. S.: Characterizations of ozone, NOx, and VOCs measured in Shanghai, China, Atmos. Environ., 42, 6873–6883, 2008.
Gong, W., Zhang, T. H., Zhu, Z. M., Ma, Y. Y., Ma, X., and Wang, W.: Characteristics of PM1.0, PM2.5 and PM10 and their relation to black carbon in Wuhan, central China, Atmosphere, 6, 1377–1387, 2015.
Guo, H., Wang, T., Simpson, I., Blake, D., Yu, X., Kwok, Y., and Li, Y. S.: Source contributions to ambient VOCs and CO at a rural site in eastern China, Atmos. Environ., 38, 4551–4560, 2004.
Han, S. Q., Bian, H., Feng, Y. C., Liu, A. X., Li, X. J., Zeng, F., and Zhang, X.: Analysis of the relationship between O3, NO and NO2 in Tianjin, China, Aerosol Air Qual. Res., 11, 128–139, https://doi.org/10.4209/aaqr.2010.07.0055, 2011.
Huang, F., Li, X., Wang, C., Xu, Q., Wang, W., Luo, Y., Tao, L., Gao, Q., Guo, J., and Chen, S.: PM2.5 spatiotemporal variations and the relationship with meteorological factors during 2013–2014 in Beijing, China, PLoS ONE, 10, e0141642, https://doi.org/10.1371/journal.pone.0141642, 2015.
Huang, X., Li, M., Li, J., and Song, Y.: A high-resolution emission inventory of crop burning in fields in China based on MODIS Thermal Anomalies/Fire products, Atmos. Environ., 50, 9–15, 2012.
Huang, X. X., Wang, T. J., Jiang, F., Liao, J. B., Cai, Y. F., Yin, C. Q., Zhu, J. L., and Han, Y.: Studies on a severe dust storm in East Asia and its impact on the air quality of Nanjing, China, Aerosol Air Qual. Res., 13, 179–193, https://doi.org/10.4209/aaqr.2012.05.0108, 2013.
Jennings, S. G., Spain, T. G., Doddridge, B. G., Maring, H., Kelly, B. P., and Hansen, A. D. A.: Concurrent measurements of black carbon aerosol and carbon monoxide at Mace Head, J. Geophys. Res.-Atmos., 101, 19447–19454, 1996.
Jerrett, M., Finkelstein, M. M., Brook, J. R., Arain, M. A., Kanaroglou, P., Stieb, D. M., Gilbert, N. L., Verma, D., Finkelstein, N., Chapman, K. R., and Sears, M. R.: A Cohort Study of Traffic-Related Air Pollution and Mortality in Toronto, Ontario, Canada, Environ. Health Persp., 117, 772–777, 2009.
Jiang, J., Zheng, Y. F., Liu, J. J., and Fan, J. J.: Observational research on planetary boundary layer by lidar over Nanjing city, Environ. Sci. Technol., 37, 22–27, 2014 (in Chinese).
Jiang, L., Zhang, Z. F., Zhu, B., Shen, Y., Wang, H. L., Shi, S. S., and Sha, D. D.: Comparison of parameterizations for the atmospheric extinction coefficient in Lin'an, China, Sci. Total Environ., 621, 507–515, https://doi.org/10.1016/j.scitotenv.2017.11.182, 2018.
Khoder, M. I.: Atmospheric conversion of sulfur dioxide to particulate sulfate and nitrogen dioxide to particulate nitrate and gaseous nitric acid in an urban area, Chemosphere, 49, 675–684, 2002.
Kristjánsson, J. E.: Studies of the aerosol indirect effect from sulfate and black carbon aerosols, J. Geophys. Res., 107, 4246, https://doi.org/10.1029/2001JD000887, 2002.
Kumar, R., Barth, M. C., Madronich, S., Naja, M., Carmichael, G. R., Pfister, G. G., Knote, C., Brasseur, G. P., Ojha, N., and Sarangi, T.: Effects of dust aerosols on tropospheric chemistry during a typical pre-monsoon season dust storm in northern India, Atmos. Chem. Phys., 14, 6813–6834, https://doi.org/10.5194/acp-14-6813-2014, 2014.
Larson, S. M. and Cass, G. R.: Characteristics of summer midday low-visibility events in the Los Angeles area, Environ. Sci. Technol., 23, 281–289, https://doi.org/10.1021/es00180a003, 1989.
Li, G. H., Zhang, R. Y., and Fan, J. W.: Impacts of black carbon aerosol on photolysis and ozone, J. Geophys. Res., 110, D23206, https://doi.org/10.1029/2005JD005898, 2005.
Li, J., Bo, Y., and Xie, S.: Estimating emissions from crop residue open burning in China based on statistics and MODIS fire products, J. Environ. Sci., 44, 158–167, 2016.
Li, J., Wang, Z., Wang, X., Yamaji, K., Takigawa, M., Kanaya, Y., Pochanart, P., Liu, Y., Irie, H., Hu, B., Tanimoto, H., and Akimoto, H.: Impacts of aerosols on summertime tropospheric photolysis frequencies and photochemistry over Central Eastern China, Atmos. Environ., 45, 1817–1829, https://doi.org/10.1016/j.atmosenv.2011.01.016, 2011.
Li, M., Wang, T., Xie, M., Li, S., Zhuang, B., and Chen, P.: Impacts of aerosol-radiation feedback on local air quality during a severe haze episode in Nanjing megacity, eastern China, Tellus B, 69, 1339548, https://doi.org/10.1080/16000889.2017.1339548, 2017a.
Li, M., Zhang, Q., Kurokawa, J.-I., Woo, J.-H., He, K., Lu, Z., Ohara, T., Song, Y., Streets, D. G., Carmichael, G. R., Cheng, Y., Hong, C., Huo, H., Jiang, X., Kang, S., Liu, F., Su, H., and Zheng, B.: MIX: a mosaic Asian anthropogenic emission inventory under the international collaboration framework of the MICS-Asia and HTAP, Atmos. Chem. Phys., 17, 935–963, https://doi.org/10.5194/acp-17-935-2017, 2017b.
Li, M., Wang, T., Xie, M., Li, S., Zhuang, B., and Chen, P.: Agricultural fire impacts on ozone photochemistry over the Yangtze River Delta region, East China, J. Geophys. Res.-Atmos., 123, 6605–6623, https://doi.org/10.1029/2018JD028582, 2018.
Liao, H. and Seinfeld, J. H.: Global impacts of gas-phase chemistry aerosol interactions on direct radiative forcing by anthropogenic aerosols and ozone, J. Geophys. Res., 110, D18208, https://doi.org/10.1029/2005jd005907, 2005.
Lin, W., Xu, X., Zhang, X., and Tang, J.: Contributions of pollutants from North China Plain to surface ozone at the Shangdianzi GAW Station, Atmos. Chem. Phys., 8, 5889–5898, https://doi.org/10.5194/acp-8-5889-2008, 2008.
Liu, P. F., Zhao, C. S., Göbel, T., Hallbauer, E., Nowak, A., Ran, L., Xu, W. Y., Deng, Z. Z., Ma, N., Mildenberger, K., Henning, S., Stratmann, F., and Wiedensohler, A.: Hygroscopic properties of aerosol particles at high relative humidity and their diurnal variations in the North China Plain, Atmos. Chem. Phys., 11, 3479–3494, https://doi.org/10.5194/acp-11-3479-2011, 2011.
Luo, C., St. John, J. C., Zhou, X. J., Lam, K. S., Wang, T., and Chameides, W. L.: A nonurban ozone air pollution episode over eastern China: Observation and model simulation, J. Geophys. Res., 105, 1889–1908, 2000.
Mcgowan, H. and Clark, A.: Identification of dust transport pathways from Lake Eyre, Australia using Hysplit, Atmos. Environ., 42, 6915–6925, 2008.
Meng, Z. Y., Xu, X. B., Yan, P., Ding, G. A., Tang, J., Lin, W. L., Xu, X. D., and Wang, S. F.: Characteristics of trace gaseous pollutants at a regional background station in Northern China, Atmos. Chem. Phys., 9, 927–936, https://doi.org/10.5194/acp-9-927-2009, 2009.
Ministry of Environmental Protection of China (MEP): Ambient air quality standards (GB 3095–2012), China Environmental Science Press, Beijing, 12 pp., 2012.
Müller, T., Laborde, M., Kassell, G., and Wiedensohler, A.: Design and performance of a three-wavelength LED-based total scatter and backscatter integrating nephelometer, Atmos. Meas. Tech., 4, 1291–1303, https://doi.org/10.5194/amt-4-1291-2011, 2011.
Novelli, P. C., Masarilea, K. A., and Lang, P. M.: Distributions and recent changes of carbon monoxide in the lower troposphere, J. Geophys. Res.-Atmos., 103, 19015–19033, https://doi.org/10.1029/98JD01366, 1998.
Pan, X. L., Kanaya, Y., Wang, Z. F., Liu, Y., Pochanart, P., Akimoto, H., Sun, Y. L., Dong, H. B., Li, J., Irie, H., and Takigawa, M.: Correlation of black carbon aerosol and carbon monoxide in the high-altitude environment of Mt. Huang in Eastern China, Atmos. Chem. Phys., 11, 9735–9747, https://doi.org/10.5194/acp-11-9735-2011, 2011.
Petzold, A., Kopp, C., and Niessner, R.: The dependence of the specific attenuation cross-section on black carbon mass fraction and particle size, Atmos. Environ., 31, 661–672, 1997.
Qian, L., Yan, Y., and Qian, J. M.: An Observational Study on Physical and Optical Properties of Atmospheric Aerosol in Autumn in Nanjing, Meteorological and Environmental Research, 5, 24–30, 2014.
Roberts, P. T. and Friedlander, S. K.: Analysis of sulfur in deposited aerosol particles by vaporization and flame photometric detection, Atmos. Environ., 10, 403–408, 1976.
Sassen, K.: Indirect climate forcing over the western US from Asian dust storms, Geophys. Res. Lett., 29, 1465, https://doi.org/10.1029/2001GL014051, 2002.
Schleicher, N., Cen, K., and Norra, S.: Daily variations of black carbon and element concentrations of atmospheric particles in the Beijing megacity – Part 1: General temporal course and source identification, Chem. Erde-Geochem., 73, 51–60, 2013.
Schmid, O., Artaxo, P., Arnott, W. P., Chand, D., Gatti, L. V., Frank, G. P., Hoffer, A., Schnaiter, M., and Andreae, M. O.: Spectral light absorption by ambient aerosols influenced by biomass burning in the Amazon Basin. I: Comparison and field calibration of absorption measurement techniques, Atmos. Chem. Phys., 6, 3443–3462, https://doi.org/10.5194/acp-6-3443-2006, 2006.
Shao, M., Tang, X., Zhang, Y., and Li, W.: City clusters in China: air and surface water pollution, Front. Ecol. Environ., 4, 353–361, 2006.
Shen, G. F., Yuan, S. Y., Xie, Y. N., Xia, S. J., Li, L., Yao, Y. K., Qiao, Y. Z., Zhang, J., Zhao, Q. Y., and Ding, A. J.: Ambient levels and temporal variations of PM2.5 and PM10 at a residential site in the mega-city, Nanjing, in the western Yangtze River Delta, China, J. Environ. Sci. Heal. A, 49, 171–178, 2014.
Shi, C., Wang, S., Liu, R., Zhou, R., Li, D., Wang, W., Li, Z., Cheng, T., and Zhou, B.: A study of aerosol optical properties during ozone pollution episodes in 2013 over Shanghai, China, Atmos. Res., 153, 235–249, 2015.
Song, W., Jia, H., Huang, J., and Zhang, Y.: A satellite-based geographically weighted regression model for regional PM2.5 estimation over the Pearl River Delta region in China, Remote Sens. Environ., 154, 1–7, 2014.
Spackman, J. R., Schwarz, J. P., Gao, R. S., Watts, L. A., Thomson, D. S., Fahey, D. W., Holloway, J. S., de Gouw, J. A., Trainer, M., and Ryerson, T. B.: Empirical correlations between black carbon aerosol and carbon monoxide in the lower and middle troposphere, Geophys. Res. Lett., 35, L19816, https://doi.org/10.1029/2008GL035237, 2008.
Stein, A. F., Draxler, R. R., Rolph, G. D., Stunder, B. J. B., Cohen, M. D., and Ngan, F.: NOAA'S Hysplit Atmospheric Transport and Dispersion Modeling System, B. Am. Meteorol. Soc., 96, 2059–2077, https://doi.org/10.1175/BAMS-D-14-00110.1, 2016.
Streets, D. G., Gupta, S., Waldhoff, S. T., Wang, M. Q., Bond, T. C., and Bo, Y. Y.: Black carbon emissions in China, Atmos. Environ., 35, 4281–4296, 2001.
Tegen, I. and Schepanski, K.: The global distribution of mineral dust, IOP C. Ser. Earth Env., 7, 012001, https://doi.org/10.1088/1755-1307/7/1/012001, 2009.
Tu, J., Xia, Z. G., Wang, H. S., and Li, W. Q.: Temporal variations in surface ozone and its precursors and meteorological effects at an urban site in China, Atmos. Res., 85, 310–337, 2007.
van Donkelaar, A., Martin, R. V., Brauer, M., Kahn, R., Levy, R., Verduzco, C., and Villeneuve, P. J.: Global estimates of ambient fine particulate matter concentrations from satellite-based aerosol optical depth: development and application, Environ. Health Persp., 118, 847–855, 2010.
Verma, R. L., Sahu, L. K., Kondo, Y., Takegawa, N., Han, S., Jung, J. S., Kim, Y. J., Fan, S., Sugimoto, N., Shammaa, M. H., Zhang, Y. H., and Zhao, Y.: Temporal variations of black carbon in Guangzhou, China, in summer 2006, Atmos. Chem. Phys., 10, 6471–6485, https://doi.org/10.5194/acp-10-6471-2010, 2010.
von Schneidemesser, E., Monks, P. S., and Plass-Duelmer, C.: Global comparison of VOC and CO observations in urban areas, Atmos. Environ., 44, 5053–5064, 2010.
Wang, G. H., Huang, L. M., Gao, S. X., Gao, S. T., and Wang, L. S.: Characterization of watersoluble species of PM10 and PM2.5aerosols in urban area in Nanjing, China, Atmos. Environ., 36, 1299–1307, 2002.
Wang, H. L., Zhuang, Y. H., Wang, Y., Sun, Y. L., Yuan, H., Zhuang, G. S., and Hao, Z. P.: Long-term monitoring and source apportionment of PM2.5/PM10 in Beijing, China, J. Environ. Sci., 20, 1323–1327, 2008.
Wang, M., Shao, M., Chen, W., Yuan, B., Lu, S., Zhang, Q., Zeng, L., and Wang, Q.: A temporally and spatially resolved validation of emission inventories by measurements of ambient volatile organic compounds in Beijing, China, Atmos. Chem. Phys., 14, 5871–5891, https://doi.org/10.5194/acp-14-5871-2014, 2014.
Wang, M. Y., Cao, C. X., Li, G. S., and Singh, R. P.: Analysis of a severe prolonged regional haze episode in the Yangtze River Delta, China, Atmos. Environ., 102, 112–121, 2015.
Wang, P. and Zhao, W.: Assessment of ambient volatile organic compounds (VOCs) near major roads in urban Nanjing, China, Atmos. Res., 89, 289–297, https://doi.org/10.1016/j.atmosres.2008.03.013, 2008.
Wang, T., Cheung, V. T. F., Anson, M., and Li, Y. S.: Ozone and related gaseous pollutants in the boundary layer of eastern China: overview of the recent measurements at a rural site, Geophys. Res. Lett., 28, 2373–2376, 2001.
Wang, T., Cheung, T., Li, Y., Yu, X., and Blake, D.: Emission characteristics of CO, NOx, SO2 and indications of biomass burning observed at a rural site in eastern China, J. Geophys. Res.-Atmos., 107, D12, https://doi.org/10.1029/2001JD000724, 2002.
Wang, T., Poon, C. N., Kwok, Y. H., and Li, Y. S.: Characterizing the temporal variability and emission patterns of pollution plumes in the Pearl River Delta of China, Atmos. Environ., 37, 3539–3550, 2003.
Wang, T., Wong, C., Cheung, T., Blake, D., Arimoto, R., Baumann, K., Tang, J., Ding, G., Yu, X., Li, Y., Streets, D., and Simpson, I.: Relationships of trace gases and aerosols and the emission characteristics at Lin'an, a rural site in eastern China, during spring 2001, J. Geophys. Res.-Atmos., 109, D19S05, https://doi.org/10.1029/2003JD004119, 2004.
Wang, T., Xue, L. K., Brimblecombe, P., Lam, Y. F., Li, L., and Zhang, L.: Ozone pollution in China: A review of concentrations, meteorological influences, chemical precursors, and effects, Sci. Total Environ., 575, 1582–1596, 2017.
Wang, T. J., Zhuang, B. L., Li, S., Liu, J., Xie, M., Yin, C. Q., Zhang, Y., Yuan, C., Zhu, J. L., Ji, L. Q., and Han, Y.: The interactions between anthropogenic aerosols and the East Asian summer monsoon using RegCCMS, J. Geophys. Res.-Atmos., 120, 5602–5621, https://doi.org/10.1002/2014JD022877, 2015.
Wang, X., Li, J., Zhang, Y., Xie, S., and Tang, X.: Ozone source attribution during a severe photochemical smog episode in Beijing, China, Sci. China Ser. B, 52, 1270–1280, 2009.
Wang, Y., Ying, Q., Hu, J., and Zhang, H.: Spatial and temporal variations of six criteria air pollutants in 31 provincial capital cities in China during 2013–2014, Environ. Int., 73, 413–422, 2014.
Wang, Y., Wang, X., Kondo, Y., Kajino, M., Munger, J. W., and Hao, J.: Black carbon and its correlation with trace gases at a rural site in Beijing: top-down constraints from ambient measurements on bottom-up emissions, J. Geophys. Res., 116, D24304, https://doi.org/10.1029/2011jd016575, 2011.
Wang, Y., Zhuang, G. S., Zhang, X. Y., Huang, K., Xu, C., Tang, A. H., Chen, J. M., and An, Z. S.: The ion chemistry, seasonal cycle, and sources of PM2.5 and TSP aerosol in Shanghai, Atmos. Environ., 40, 2935–2952, 2006.
Wang, Y. Q., Stein, A. F., Draxler, R. R., de la Rosa, J. D., and Zhang, X. Y.: Global sand and dust storms in 2008: Observation and HYSPLIT model verification, Atmos. Environ., 45, 6368–6381, 2011.
Wang, Z., Li, J., Wang, X., Pochanart, P., and Akimoto, H.: Modeling of Regional High Ozone Episode Observed at Two Mountain Sites (Mt. Tai and Huang) in East China, J. Atmos. Chem., 55, 253–272, 2006.
Wang, Z., Li, Y., Chen, T., Zhang, D., Sun, F., and Pan, L.: Spatial-temporal characteristics of PM2.5 in Beijing in 2013, Acta Geogr. Sin., 70, 110–120, 2015.
Weingartner, E., Saathoff, H., Schnaiter, M., Streit, N., Bitnar, B., and Baltensperger, U.: Absorption of light by soot particles: determination of the absorption coefficient by means of aethalometers, J. Aerosol Sci., 34, 1445–1463, https://doi.org/10.1016/S0021-8502(03)00359-8, 2003.
Wu, D., Liu, Q., Lian, Y., Bi, X., Li, F., Tan, H., Liao, B., and Chen, H.: Hazy weather formation and visibility deterioration resulted from fine particulate (PM2.5) pollutions in Guangdong and Hong Kong, J. Environ. Sci. Circumst., 32, 2660–2669, 2012.
Wu, Y., Guo, J., Zhang, X., Tian, X., Zhang, J., Wang, Y., Duan, J., and Li, X.: Synergy of satellite and ground based observations in estimation of particulate matter in eastern China, Sci. Total Environ., 433, 20–30, 2012.
Xiao, Z., Bi, X., Feng, Y., Wang, Y., Zhou, J., Fu, X., and Weng, Y.: Source apportionment of ambient PM10 and PM2.5 in urban area of Ningbo City, Res. Environ. Sci., 5, 549–555, 2012.
Xiao, Z. M., Zhang, Y. F., Hong, S. M., Bi, X. H., Jiao, L., Feng, Y. C., and Wang, Y. Q.: Estimation of the Main Factors Influencing Haze, Based on a Long-term Monitoring Campaign in Hangzhou, China, Aerosol Air Qual. Res., 11, 873–882, 2011.
Xie, M., Zhu, K. G., Wang, T. J., Chen, P. L., Han, Y., Li, S., Zhuang, B. L., and Shu, L.: Temporal characterization and regional contribution to O3 and NOx at an urban and a suburban site in Nanjing, China, Sci. Total Environ., 551–552, 533–545, 2016.
Xue, L., Wang, T., Louie, P. K. K., Luk, C. W. Y., Blake, D. R., and Xu, Z.: Increasing external effects negate local efforts to control ozone air pollution: a case study of Hong Kong and implications for other Chinese cities, Environ. Sci. Technol., 48, 10769–10775, 2014.
Yan, S., Cao, H., Chen, Y., Wu, C., Hong, T., and Fan, H.: Spatial and temporal characteristics of air quality and air pollutants in 2013 in Beijing, Environ. Sci. Pollut. R., 23, 1–12, 2016.
Yang, S. J., He, H. P., Lu, S. L., Chen, D., and Zhu, J. X.: Quantification of crop residue burning in the field and its influence on ambient air quality in Suqian, China, Atmos. Environ., 42, 1961–1969, 2008.
Yi, R., Wang, Y. L., Zhang, Y. J., Shi, Y., and Li, M. S.: Pollution characteristics and influence factors of ozone in Yangtze River Delta, Acta Sci. Circumst., 35, 2370–2377, 2015 (in Chinese).
Yin, S., Wang, X. F., Xiao, Y., Tani, H., Zhong, G. S., and Sun, Z. Y.: Study on spatial distribution of crop residue burning and PM2.5 change in China, Environ. Pollut., 220, 204–221, 2016.
Yu, J., Wang, W., Zhou, J., Xu, D., Zhao, Q., and He, L.: Analysis of pollution characteristics and sources of PM2.5 in winter of Ningbo City, Environ. Sci. Technol., 8, 150–155, 2015.
Zhang, Q., Streets, D. G., Carmichael, G. R., He, K. B., Huo, H., Kannari, A., Klimont, Z., Park, I. S., Reddy, S., Fu, J. S., Chen, D., Duan, L., Lei, Y., Wang, L. T., and Yao, Z. L.: Asian emissions in 2006 for the NASA INTEX-B mission, Atmos. Chem. Phys., 9, 5131–5153, https://doi.org/10.5194/acp-9-5131-2009, 2009.
Zhang, Y. H., Hu, M., Zhong, L. J., Wiedensohler, A., Liu, S. C., Andreae, M. O., Wang, W., and Fan, S. J.: Regional integrated experiments on air quality over Pearl River Delta 2004 (PRIDE-PRD2004): overview, Atmos. Environ., 42, 6157–6173, 2008.
Zhang, X. Y., Wang, Y. Q., Zhang, X. C., Guo, W., and Gong, S. L.: Carbonaceous aerosol composition over various regions of China during 2006, J. Geophys. Res., 113, D14111, https://doi.org/10.1029/2007JD009525, 2008.
Zhang, X. Y., Wang, Y. Q., Niu, T., Zhang, X. C., Gong, S. L., Zhang, Y. M., and Sun, J. Y.: Atmospheric aerosol compositions in China: spatial/temporal variability, chemical signature, regional haze distribution and comparisons with global aerosols, Atmos. Chem. Phys., 12, 779–799, https://doi.org/10.5194/acp-12-779-2012, 2012.
Zhang, Y., Shao, K., and Tang, X.: The study of urban photochemical smog pollution in China, Acta Scientiarum Naturalium-Universitatis Pekinensis, 34, 392–400, 1998.
Zhang, Y. L. and Cao, F.: Fine particulate matter (PM2.5) in China at a city level, Sci. Rep.-UK, 5, 14884, 2015.
Zheng, J., Zhong, L., Wang, T., Louie, P. K. K., and Li, Z.: Ground-level ozone in the Pearl River Delta region: analysis of data from a recently established regional air quality monitoring network, Atmos. Environ., 44, 814–823, 2010.
Zhu, J., Wang, T., Talbot, R., Mao, H., Hall, C. B., Yang, X., Fu, C., Zhuang, B., Li, S., Han, Y., and Huang, X.: Characteristics of atmospheric Total Gaseous Mercury (TGM) observed in urban Nanjing, China, Atmos. Chem. Phys., 12, 12103–12118, https://doi.org/10.5194/acp-12-12103-2012, 2012.
Zhuang, B., Wang, T., Liu, J., Li, S., Xie, M., Han, Y., Chen, P., Hu, Q., Yang, X.-Q., Fu, C., and Zhu, J.: The surface aerosol optical properties in the urban area of Nanjing, west Yangtze River Delta, China, Atmos. Chem. Phys., 17, 1143–1160, https://doi.org/10.5194/acp-17-1143-2017, 2017.
Zhuang, B. L., Liu, L., Shen, F. H., Wang, T. J., and Han, Y.: Semidirect radiative forcing of internal mixed black carbon cloud droplet and its regional climatic effect over China, J. Geophys. Res., 115, D00K19, https://doi.org/10.1029/2009JD013165, 2010.
Zhuang, B. L., Liu, Q., Wang, T. J., Yin, C. Q., Li, S., Xie, M., Jiang, F., and Mao, H. T.: Investigation on semi-direct and indirect climate effects of fossil fuel black carbon aerosol over China, Theor. Appl. Climatol., 114, 651–672, 2013a.
Zhuang, B. L., Li, S., Wang, T. J., Deng, J. J., Xie, M., Yin, C. Q., and Zhu, J. L.: Direct radiative forcing and climate effects of anthropogenic aerosols with different mixing states over China, Atmos. Environ., 79, 349–361, https://doi.org/10.1016/j.atmosenv.2013.07.004, 2013b.
Zhuang, B. L., Wang, T. J., Li, S., Liu, J., Talbot, R., Mao, H. T., Yang, X. Q., Fu, C. B., Yin, C. Q., Zhu, J. L., Che, H. Z., and Zhang, X. Y.: Optical properties and radiative forcing of urban aerosols in Nanjing, China, Atmos. Environ., 83, 43–52, 2014a.
Zhuang, B. L., Wang, T. J., Liu, J., Li, S., Xie, M., Yang, X. Q., Fu, C. B., Sun, J. N., Yin, C. Q., Liao, J. B., Zhu, J. L., and Zhang, Y.: Continuous measurement of black carbon aerosol in urban Nanjing of Yangtze River Delta, China, Atmos. Environ., 89, 415–424, 2014b.
Zhuang, B. L., Wang, T. J., Liu, J., Ma, Y., Yin, C. Q., Li, S., Xie, M., Han, Y., Zhu, J. L., Yang, X. Q., and Fu, C. B.: Absorption coefficient of urban aerosol in Nanjing, west Yangtze River Delta, China, Atmos. Chem. Phys., 15, 13633–13646, https://doi.org/10.5194/acp-15-13633-2015, 2015.
Zhuang, B. L., Li, S., Wang, T. J., Liu, J., Chen, H. M., Chen, P. L., Li, M. M., and Xie, M.: Interaction between the Black Carbon Aerosol Warming Effect and East Asian Monsoon Using RegCM4, J. Climate, 31, 9367–9388, 2018.


